Embed Size (px)
Citation preview

Federal Human Capital Survey:Federal Human Capital Survey:A Closer Look - FY 2008A Closer Look - FY 2008
The Department of the The Department of the Treasury Building our Treasury Building our
Workforce for the FutureWorkforce for the Future
April 2009
What is the survey?What is the survey?
The Federal Human Capital Survey (FHCS) is a tool that measures The Federal Human Capital Survey (FHCS) is a tool that measures employees' perceptions regarding critical areas of their work life - areas employees' perceptions regarding critical areas of their work life - areas that drive employee satisfaction, commitment and ultimately retention in that drive employee satisfaction, commitment and ultimately retention in the workforce. The FHCS is intended to:the workforce. The FHCS is intended to:
Guide agency efforts to support agency mission results with strong human capital strategies.
Serve as a tool for OPM to assess an individual agency’s progress toward success in three essential systems included in the Human Capital Assessment and Accountability Framework (HCAAF): Leadership and Knowledge Management, Results-Oriented Performance Culture, and Talent Management.
Give senior managers critical information to answer the question: What can I do to make my agency work better?
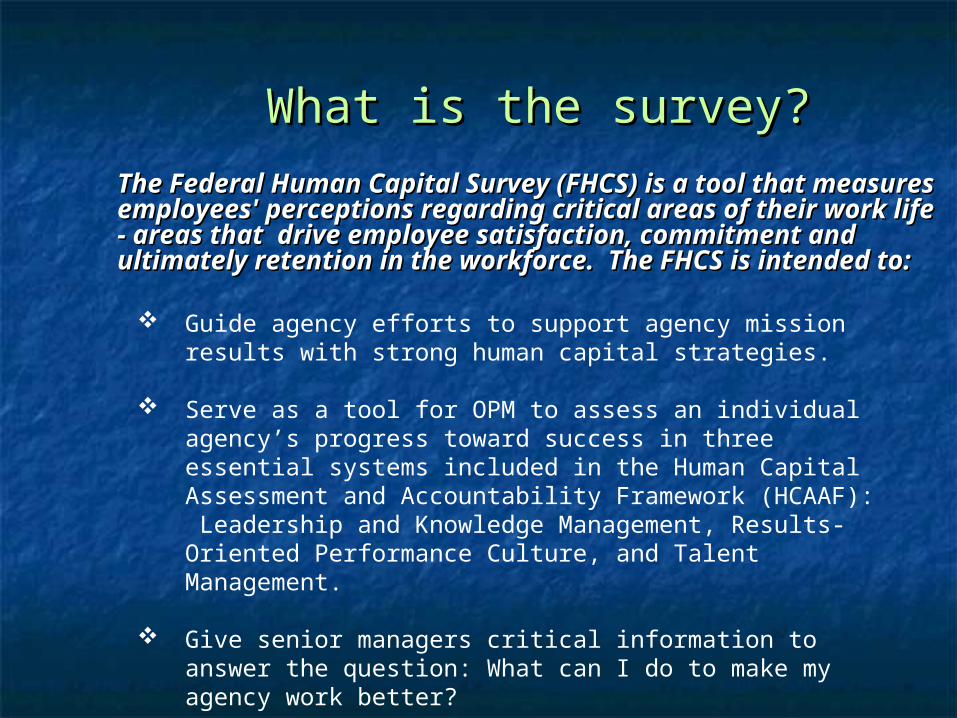
Sample ParticipantsSample Participants
The FHCS sample included employees from 29 majorThe FHCS sample included employees from 29 majorfederal agencies as well as selected small and independent federal agencies as well as selected small and independent agencies. agencies.
212,223 completed the survey (a 51% government-wide response rate)212,223 completed the survey (a 51% government-wide response rate)
12,910 Treasury employees were asked to complete the survey and 12,910 Treasury employees were asked to complete the survey and 8,656 Treasury employees participated (a 67% Treasury response8,656 Treasury employees participated (a 67% Treasury response rate) rate)
* Treasury results have a plus or minus 3% margin of error* Treasury results have a plus or minus 3% margin of error
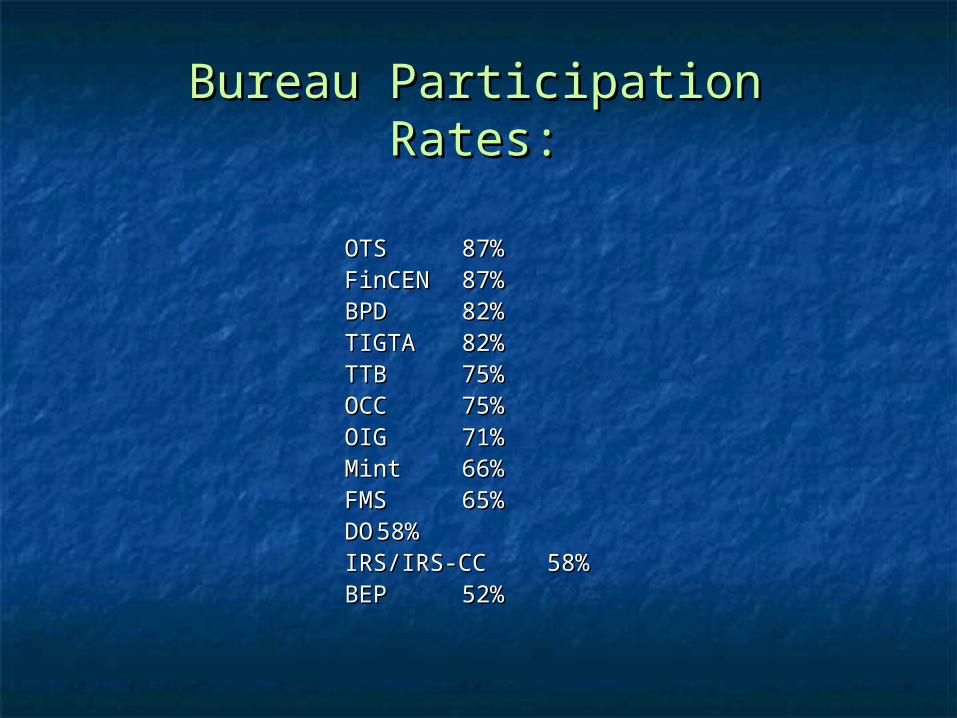
Bureau Participation Bureau Participation Rates:Rates:
OTSOTS 87%87%FinCENFinCEN 87%87%BPDBPD 82%82%TIGTATIGTA 82%82%TTBTTB 75%75%OCCOCC 75%75%OIGOIG 71%71%MintMint 66%66%FMSFMS 65%65%DODO 58%58%IRS/IRS-CCIRS/IRS-CC 58%58%BEPBEP 52%52%
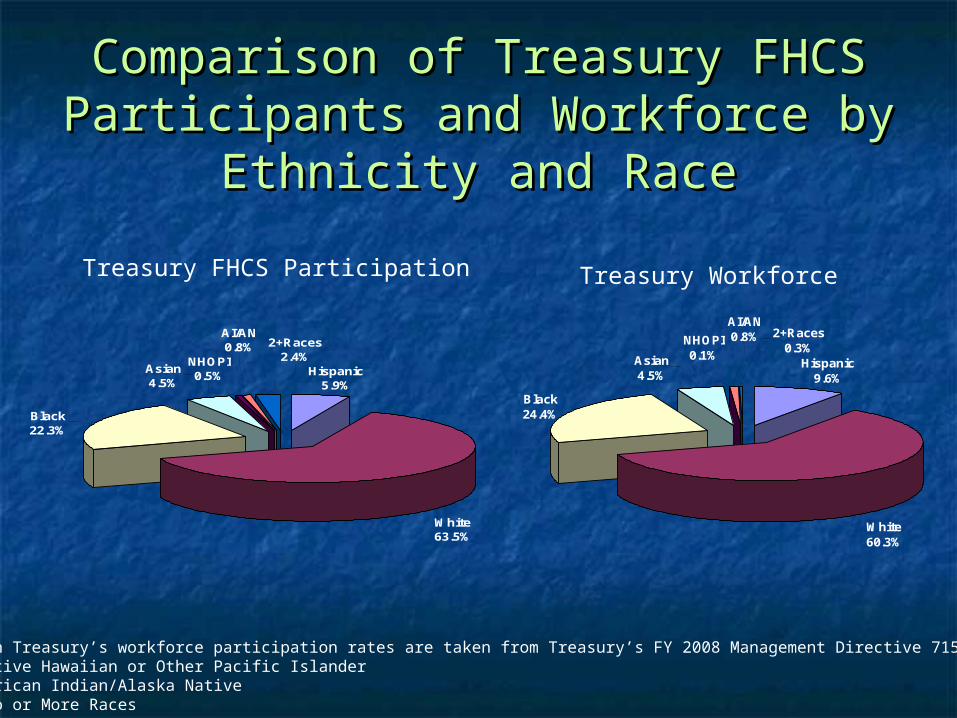
Comparison of Treasury FHCS Comparison of Treasury FHCS Participants and Workforce by Participants and Workforce by
Ethnicity and RaceEthnicity and Race
Note: Data on Treasury’s workforce participation rates are taken from Treasury’s FY 2008 Management Directive 715 Report.•NHOPI - Native Hawaiian or Other Pacific Islander •AI/AN - American Indian/Alaska Native•2+Races – Two or More Races
Treasury FHCS Participation Treasury Workforce
Hispanic5.9%
White63.5%
Black22.3%
Asian4.5%
2+Races2.4%
AI/AN0.8%
NHOPI0.5%
Hispanic9.6%
White60.3%
Black24.4%
Asian4.5%
NHOPI0.1%
AI/AN0.8% 2+Races
0.3%
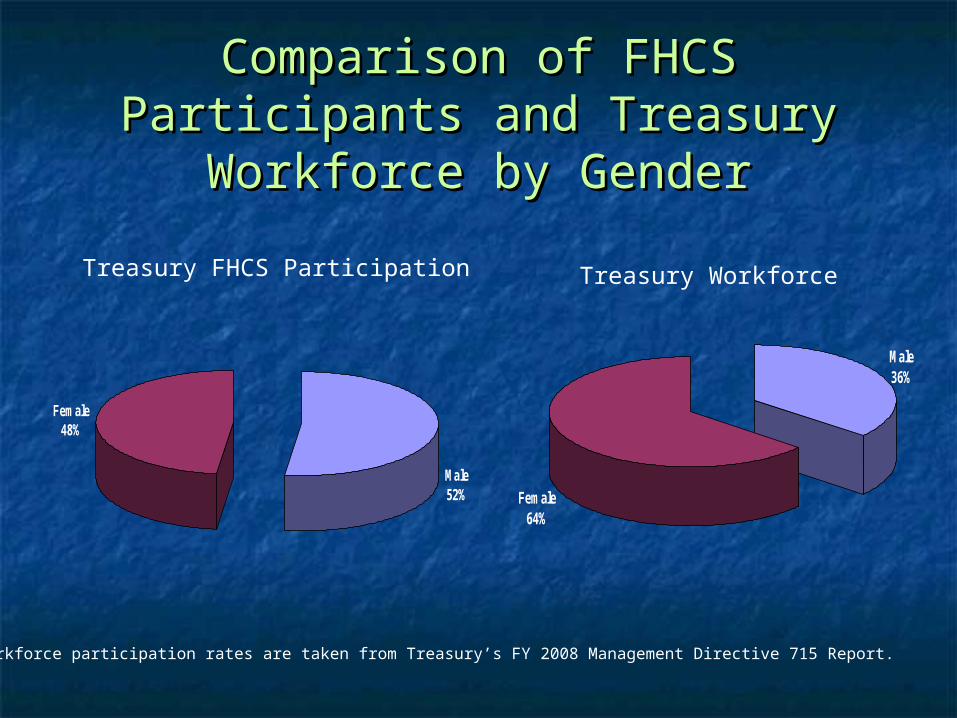
Comparison of FHCS Participants Comparison of FHCS Participants and Treasury Workforce by Genderand Treasury Workforce by Gender
Note: Workforce participation rates are taken from Treasury’s FY 2008 Management Directive 715 Report.
Treasury FHCS Participation Treasury Workforce
Male52%
Female48%
Male36%
Female64%
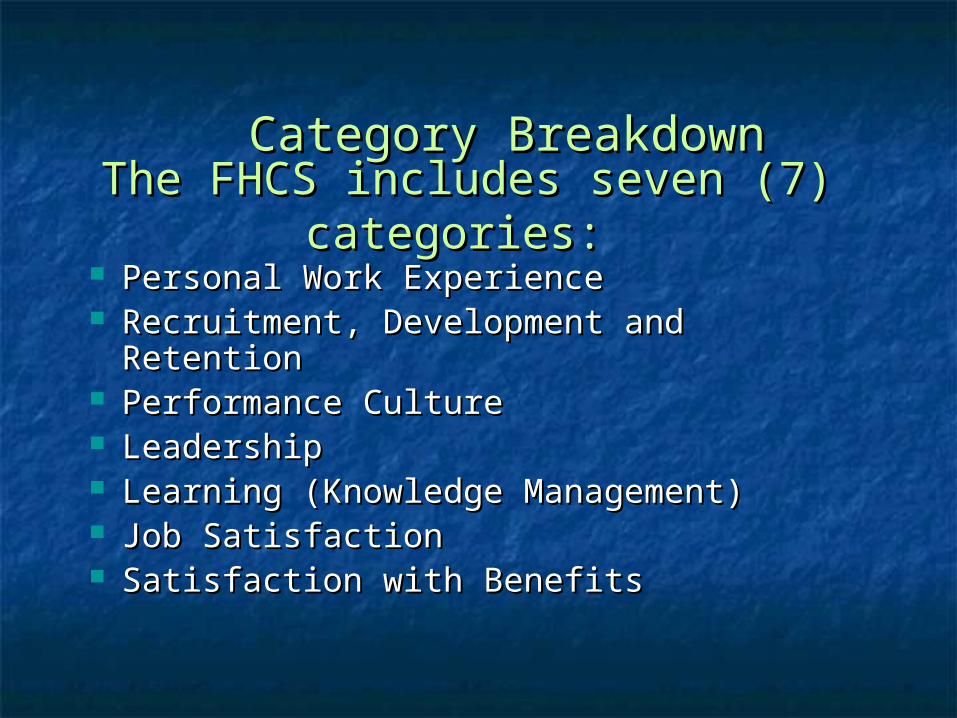
Category BreakdownCategory Breakdown
Personal Work ExperiencePersonal Work Experience Recruitment, Development and Recruitment, Development and
RetentionRetention Performance CulturePerformance Culture LeadershipLeadership Learning (Knowledge Management)Learning (Knowledge Management) Job SatisfactionJob Satisfaction Satisfaction with BenefitsSatisfaction with Benefits
The FHCS includes seven (7) The FHCS includes seven (7) categories:categories:
FHCS Summary FHCS Summary by Demographicsby Demographics
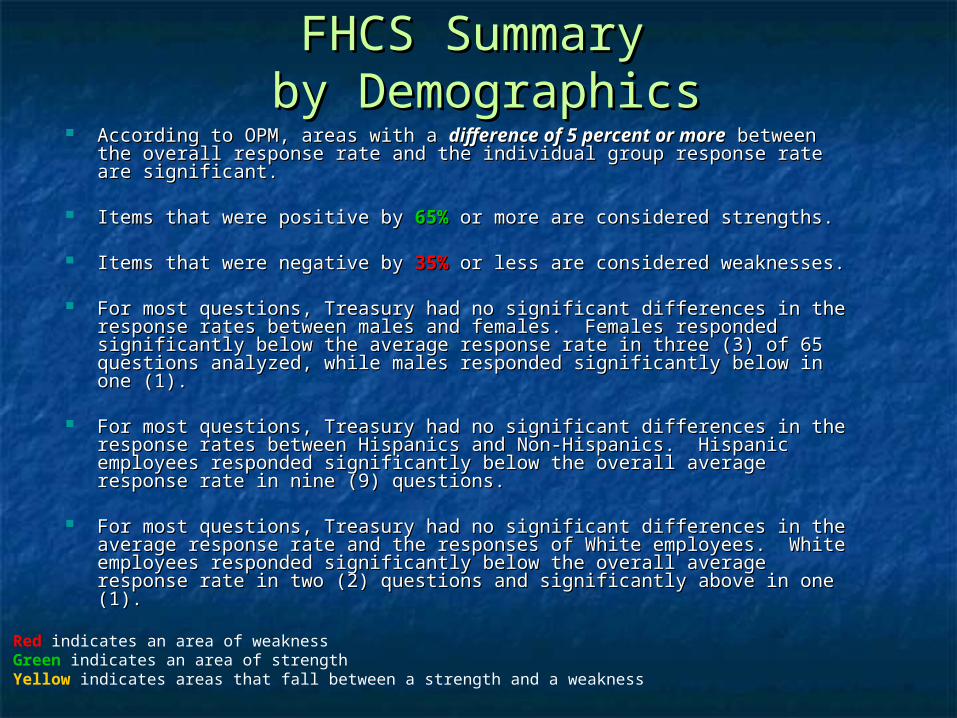
According to OPM, areas with a According to OPM, areas with a difference of 5 percent or moredifference of 5 percent or more between the overall response rate and the individual group response between the overall response rate and the individual group response rate are significant.rate are significant.
Items that were positive by Items that were positive by 65%65% or more are considered strengths. or more are considered strengths.
Items that were negative by Items that were negative by 35%35% or less are considered weaknesses. or less are considered weaknesses.
For most questions, Treasury had no significant differences in the For most questions, Treasury had no significant differences in the response rates between males and females. Females responded response rates between males and females. Females responded significantly below the average response rate in three (3) of 65 significantly below the average response rate in three (3) of 65 questions analyzed, while males responded significantly below in one questions analyzed, while males responded significantly below in one (1). (1).
For most questions, Treasury had no significant differences in the For most questions, Treasury had no significant differences in the response rates between Hispanics and Non-Hispanics. Hispanic response rates between Hispanics and Non-Hispanics. Hispanic employees responded significantly below the overall average response employees responded significantly below the overall average response rate in nine (9) questions.rate in nine (9) questions.
For most questions, Treasury had no significant differences in the For most questions, Treasury had no significant differences in the average response rate and the responses of White employees. White average response rate and the responses of White employees. White employees responded significantly below the overall average response employees responded significantly below the overall average response rate in two (2) questions and significantly above in one (1).rate in two (2) questions and significantly above in one (1).
Red indicates an area of weaknessGreen indicates an area of strengthYellow indicates areas that fall between a strength and a weakness
FHCS Summary FHCS Summary by Demographics Continuedby Demographics Continued
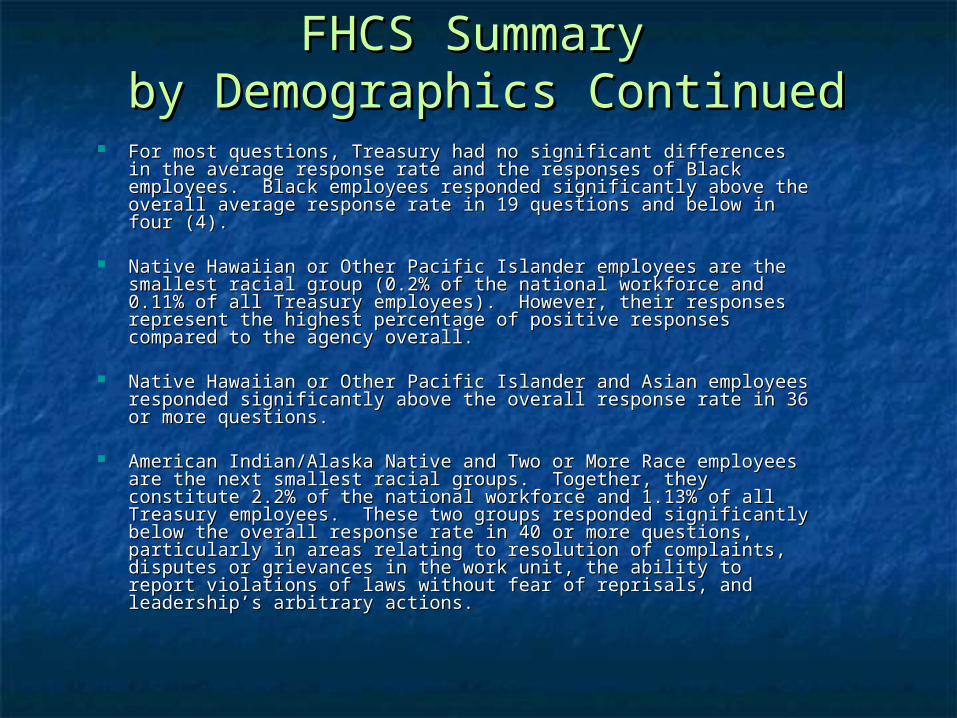
For most questions, Treasury had no significant differences in the For most questions, Treasury had no significant differences in the average response rate and the responses of Black employees. average response rate and the responses of Black employees. Black employees responded significantly above the overall average Black employees responded significantly above the overall average response rate in 19 questions and below in four (4).response rate in 19 questions and below in four (4).
Native Hawaiian or Other Pacific Islander employees are the Native Hawaiian or Other Pacific Islander employees are the smallest racial group (0.2% of the national workforce and 0.11% of smallest racial group (0.2% of the national workforce and 0.11% of all Treasury employees). However, their responses represent the all Treasury employees). However, their responses represent the highest percentage of positive responses compared to the agency highest percentage of positive responses compared to the agency overall. overall.
Native Hawaiian or Other Pacific Islander and Asian employees Native Hawaiian or Other Pacific Islander and Asian employees responded significantly above the overall response rate in 36 or responded significantly above the overall response rate in 36 or more questions.more questions.
American Indian/Alaska Native and Two or More Race employees American Indian/Alaska Native and Two or More Race employees are the next smallest racial groups. Together, they constitute 2.2% are the next smallest racial groups. Together, they constitute 2.2% of the national workforce and 1.13% of all Treasury employees. of the national workforce and 1.13% of all Treasury employees. These two groups responded significantly below the overall These two groups responded significantly below the overall response rate in 40 or more questions, particularly in areas relating response rate in 40 or more questions, particularly in areas relating to resolution of complaints, disputes or grievances in the work unit, to resolution of complaints, disputes or grievances in the work unit, the ability to report violations of laws without fear of reprisals, and the ability to report violations of laws without fear of reprisals, and leadership’s arbitrary actions. leadership’s arbitrary actions.
Key Areas of Concern for EEO Key Areas of Concern for EEO Practitioners Practitioners
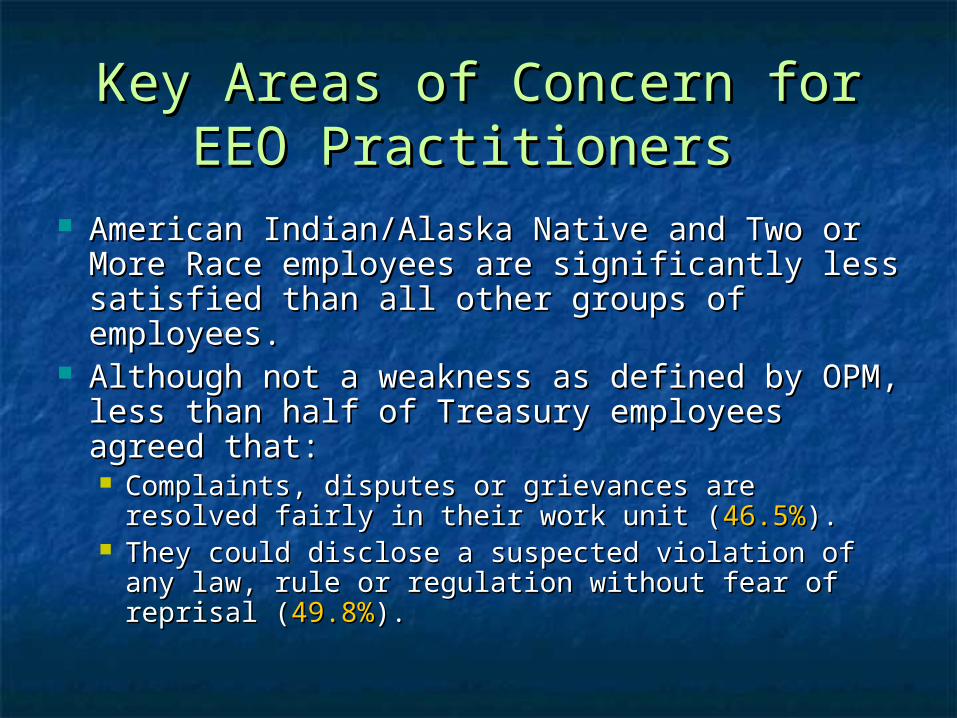
American Indian/Alaska Native and Two or American Indian/Alaska Native and Two or More Race employees are significantly less More Race employees are significantly less satisfied than all other groups of employees.satisfied than all other groups of employees.
Although not a weakness as defined by OPM, Although not a weakness as defined by OPM, less than half of Treasury employees agreed less than half of Treasury employees agreed that:that: Complaints, disputes or grievances are resolved Complaints, disputes or grievances are resolved
fairly in their work unit (fairly in their work unit (46.5%46.5%).). They could disclose a suspected violation of any They could disclose a suspected violation of any
law, rule or regulation without fear of reprisal law, rule or regulation without fear of reprisal ((49.8%49.8%).).
Treasury Areas of WeaknessTreasury Areas of Weakness
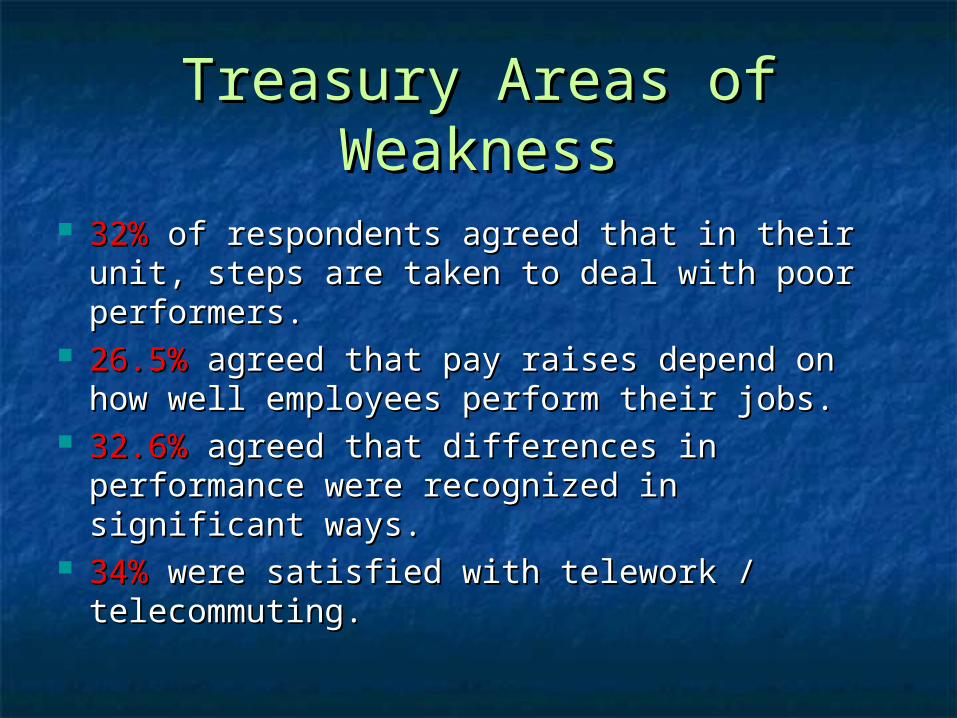
32%32% of respondents agreed that in their unit, of respondents agreed that in their unit, steps are taken to deal with poor performers.steps are taken to deal with poor performers.
26.5%26.5% agreed that pay raises depend on how agreed that pay raises depend on how well employees perform their jobs.well employees perform their jobs.
32.6%32.6% agreed that differences in agreed that differences in performance were recognized in significant performance were recognized in significant ways.ways.
34%34% were satisfied with telework / were satisfied with telework / telecommuting.telecommuting.
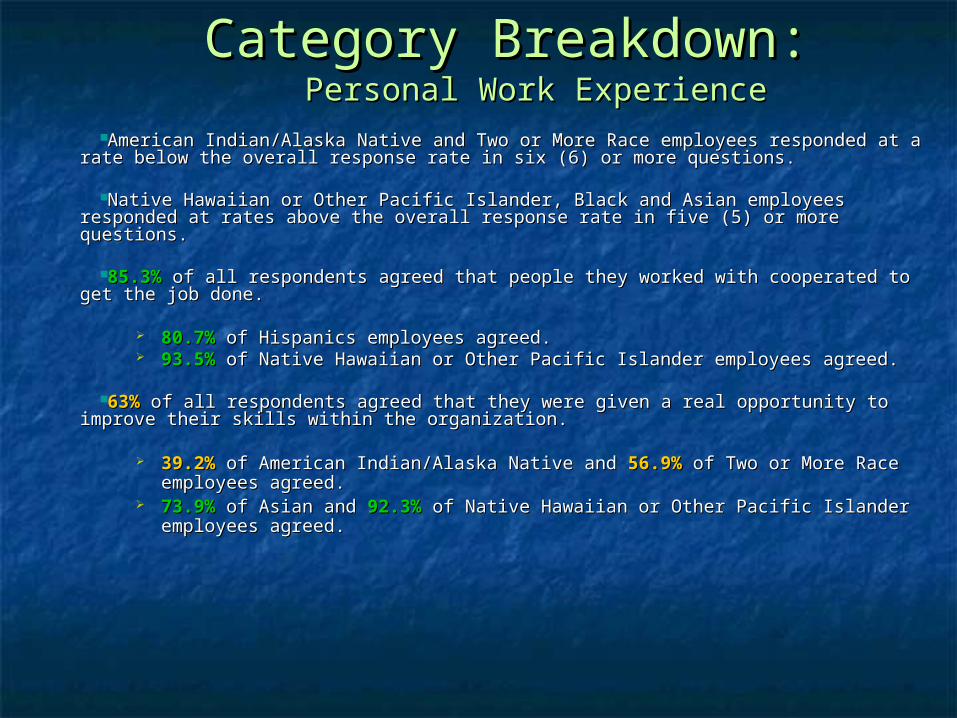
Category Breakdown:Category Breakdown:
American Indian/Alaska Native and Two or More Race employees responded at a rate American Indian/Alaska Native and Two or More Race employees responded at a rate below the overall response rate in six (6) or more questions. below the overall response rate in six (6) or more questions.
Native Hawaiian or Other Pacific Islander, Black and Asian employees responded at Native Hawaiian or Other Pacific Islander, Black and Asian employees responded at rates above the overall response rate in five (5) or more questions.rates above the overall response rate in five (5) or more questions.
85.3%85.3% of all respondents agreed that people they worked with cooperated to get the of all respondents agreed that people they worked with cooperated to get the job done. job done.
80.7%80.7% of Hispanics employees agreed. of Hispanics employees agreed. 93.5%93.5% of Native Hawaiian or Other Pacific Islander employees agreed. of Native Hawaiian or Other Pacific Islander employees agreed.
63%63% of all respondents agreed that they were given a real opportunity to improve of all respondents agreed that they were given a real opportunity to improve their skills within the organization. their skills within the organization.
39.2%39.2% of American Indian/Alaska Native and of American Indian/Alaska Native and 56.9%56.9% of Two or More Race of Two or More Race employees agreed. employees agreed.
73.9%73.9% of Asian and of Asian and 92.3%92.3% of Native Hawaiian or Other Pacific Islander of Native Hawaiian or Other Pacific Islander employees agreed.employees agreed.
Personal Work ExperiencePersonal Work Experience
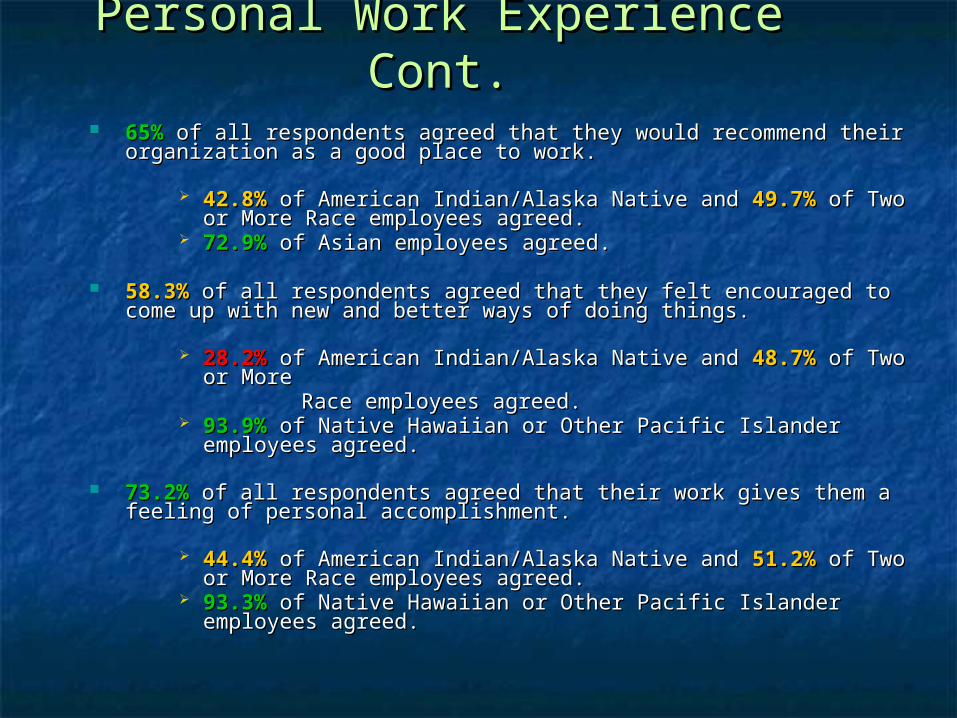
Personal Work Experience Cont.Personal Work Experience Cont.
65%65% of all respondents agreed that they would recommend their of all respondents agreed that they would recommend their organization as a good place to work. organization as a good place to work.
42.8%42.8% of American Indian/Alaska Native and of American Indian/Alaska Native and 49.7%49.7% of Two or of Two or More Race employees agreed. More Race employees agreed.
72.9%72.9% of Asian employees agreed. of Asian employees agreed.
58.3%58.3% of all respondents agreed that they felt encouraged to come up of all respondents agreed that they felt encouraged to come up with new and better ways of doing things.with new and better ways of doing things.
28.2%28.2% of American Indian/Alaska Native and of American Indian/Alaska Native and 48.7%48.7% of Two or of Two or More More
Race employees agreed.Race employees agreed. 93.9%93.9% of Native Hawaiian or Other Pacific Islander employees of Native Hawaiian or Other Pacific Islander employees
agreed.agreed.
73.2%73.2% of all respondents agreed that their work gives them a feeling of of all respondents agreed that their work gives them a feeling of personal accomplishment.personal accomplishment.
44.4%44.4% of American Indian/Alaska Native and of American Indian/Alaska Native and 51.2%51.2% of Two or of Two or More Race employees agreed.More Race employees agreed.
93.3%93.3% of Native Hawaiian or Other Pacific Islander employees of Native Hawaiian or Other Pacific Islander employees agreed.agreed.
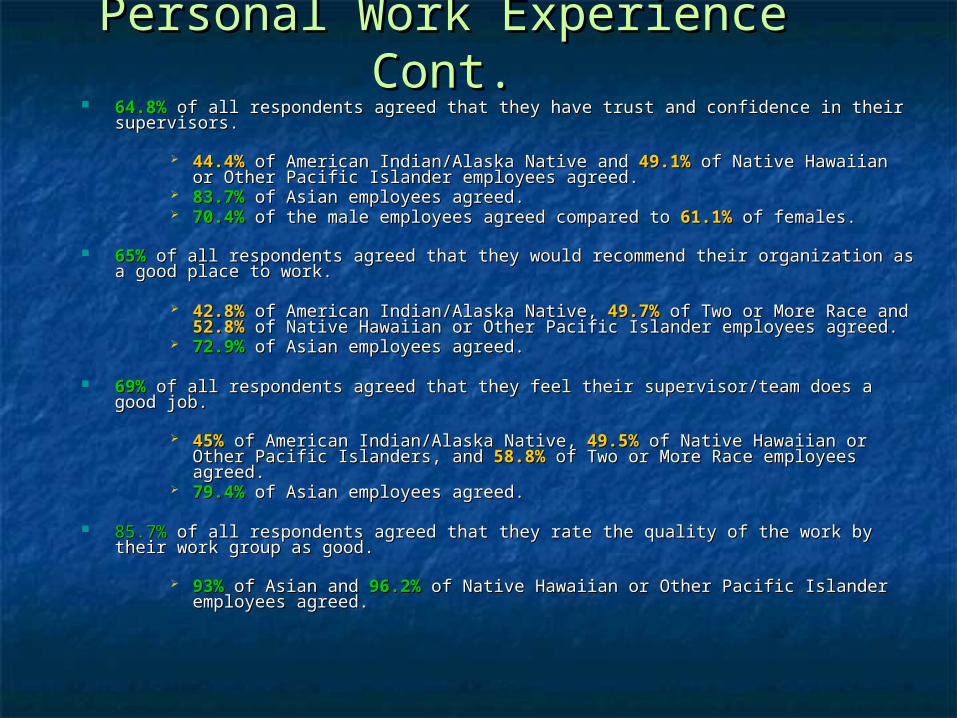
Personal Work Experience Cont.Personal Work Experience Cont. 64.8%64.8% of all respondents agreed that they have trust and confidence in their of all respondents agreed that they have trust and confidence in their
supervisors. supervisors.
44.4%44.4% of American Indian/Alaska Native and of American Indian/Alaska Native and 49.1%49.1% of Native Hawaiian or of Native Hawaiian or Other Pacific Islander employees agreed. Other Pacific Islander employees agreed.
83.7%83.7% of Asian employees agreed. of Asian employees agreed. 70.4%70.4% of the male employees agreed compared to of the male employees agreed compared to 61.1%61.1% of females. of females.
65%65% of all respondents agreed that they would recommend their organization as a of all respondents agreed that they would recommend their organization as a good place to work.good place to work.
42.8%42.8% of American Indian/Alaska Native, of American Indian/Alaska Native, 49.7%49.7% of Two or More Race and of Two or More Race and 52.8%52.8% of Native Hawaiian or Other Pacific Islander employees agreed. of Native Hawaiian or Other Pacific Islander employees agreed.
72.9%72.9% of Asian employees agreed. of Asian employees agreed.
69%69% of all respondents agreed that they feel their supervisor/team does a good job. of all respondents agreed that they feel their supervisor/team does a good job.
45%45% of American Indian/Alaska Native, of American Indian/Alaska Native, 49.5%49.5% of Native Hawaiian or Other of Native Hawaiian or Other Pacific Islanders, and Pacific Islanders, and 58.8%58.8% of Two or More Race employees agreed. of Two or More Race employees agreed.
79.4%79.4% of Asian employees agreed. of Asian employees agreed.
85.7%85.7% of all respondents agreed that they rate the quality of the work by their work of all respondents agreed that they rate the quality of the work by their work group as good. group as good.
93%93% of Asian and of Asian and 96.2%96.2% of Native Hawaiian or Other Pacific Islander of Native Hawaiian or Other Pacific Islander employees agreed.employees agreed.
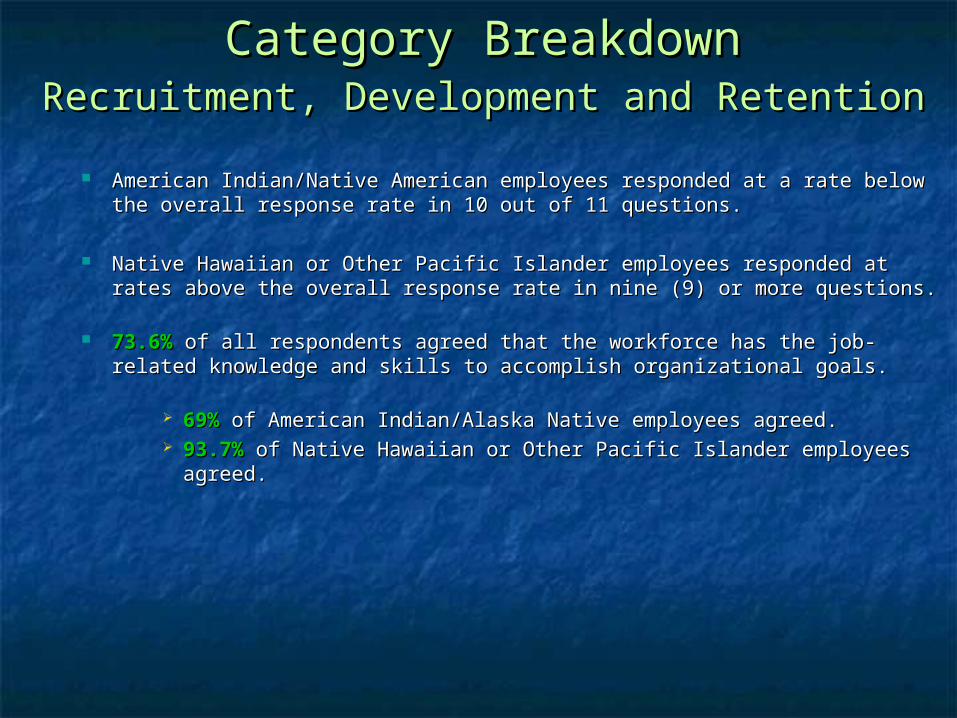
Category BreakdownCategory BreakdownRecruitment, Development and RetentionRecruitment, Development and Retention
American Indian/Native American employees responded at a rate below the American Indian/Native American employees responded at a rate below the overall response rate in 10 out of 11 questions. overall response rate in 10 out of 11 questions.
Native Hawaiian or Other Pacific Islander employees responded at rates Native Hawaiian or Other Pacific Islander employees responded at rates above the overall response rate in nine (9) or more questions.above the overall response rate in nine (9) or more questions.
73.6%73.6% of all respondents agreed that the workforce has the job-related of all respondents agreed that the workforce has the job-related knowledge and skills to accomplish organizational goals.knowledge and skills to accomplish organizational goals.
69%69% of American Indian/Alaska Native employees agreed. of American Indian/Alaska Native employees agreed. 93.7%93.7% of Native Hawaiian or Other Pacific Islander employees agreed. of Native Hawaiian or Other Pacific Islander employees agreed.
Recruitment, Development & Retention Recruitment, Development & Retention Cont.Cont.
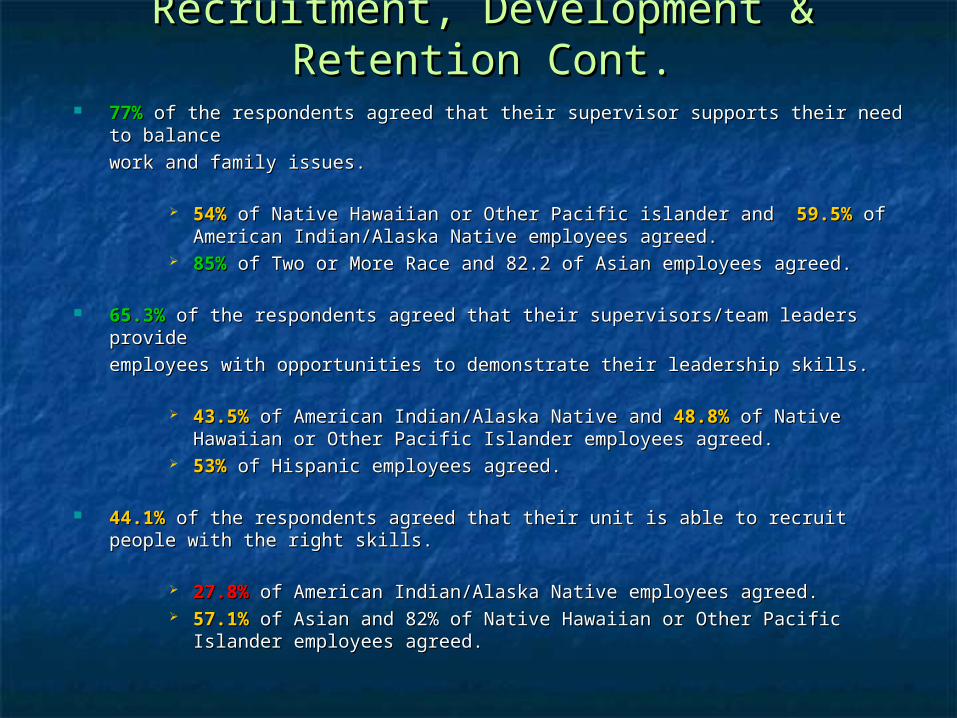
77%77% of the respondents agreed that their supervisor supports their need to balance of the respondents agreed that their supervisor supports their need to balance
work and family issues.work and family issues.
54%54% of Native Hawaiian or Other Pacific islander and of Native Hawaiian or Other Pacific islander and 59.5%59.5% of American of American Indian/Alaska Native employees agreed. Indian/Alaska Native employees agreed.
85%85% of Two or More Race and 82.2 of Asian employees agreed. of Two or More Race and 82.2 of Asian employees agreed.
65.3%65.3% of the respondents agreed that their supervisors/team leaders provide of the respondents agreed that their supervisors/team leaders provide
employees with opportunities to demonstrate their leadership skills. employees with opportunities to demonstrate their leadership skills.
43.5%43.5% of American Indian/Alaska Native and of American Indian/Alaska Native and 48.8%48.8% of Native Hawaiian or of Native Hawaiian or Other Pacific Islander employees agreed.Other Pacific Islander employees agreed.
53%53% of Hispanic employees agreed. of Hispanic employees agreed.
44.1%44.1% of the respondents agreed that their unit is able to recruit people with the of the respondents agreed that their unit is able to recruit people with the right skills. right skills.
27.8%27.8% of American Indian/Alaska Native employees agreed. of American Indian/Alaska Native employees agreed. 57.1%57.1% of Asian and 82% of Native Hawaiian or Other Pacific Islander of Asian and 82% of Native Hawaiian or Other Pacific Islander
employees agreed.employees agreed.
Recruitment, Development & Retention Recruitment, Development & Retention Cont.Cont.
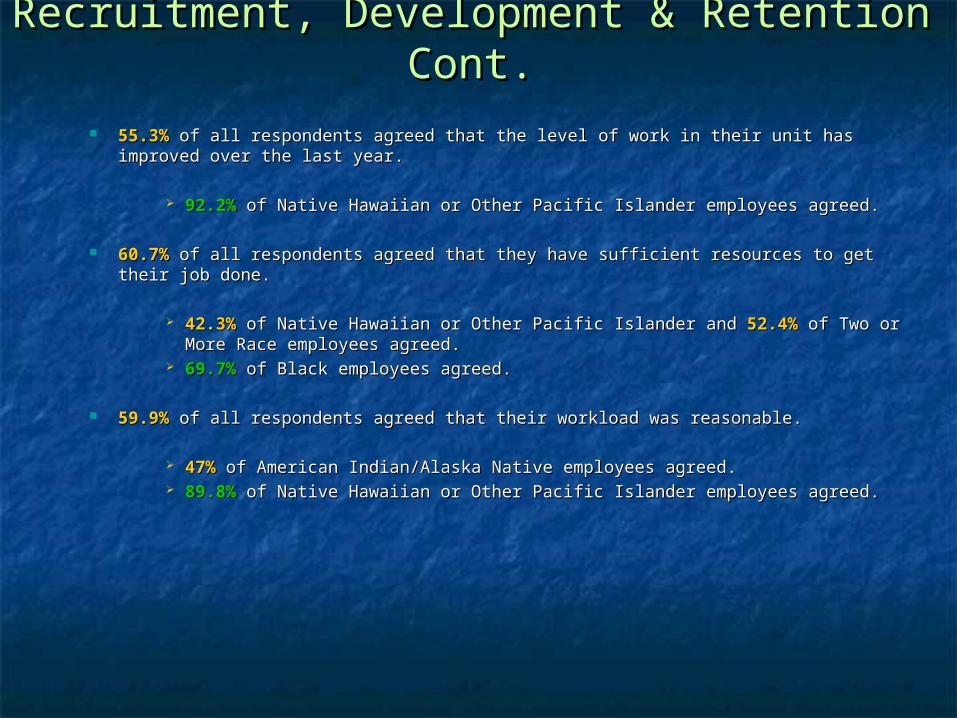
55.3%55.3% of all respondents agreed that the level of work in their unit has improved over of all respondents agreed that the level of work in their unit has improved over the last year. the last year.
92.2%92.2% of Native Hawaiian or Other Pacific Islander employees agreed. of Native Hawaiian or Other Pacific Islander employees agreed.
60.7%60.7% of all respondents agreed that they have sufficient resources to get their job done. of all respondents agreed that they have sufficient resources to get their job done.
42.3%42.3% of Native Hawaiian or Other Pacific Islander and of Native Hawaiian or Other Pacific Islander and 52.4%52.4% of Two or More of Two or More Race employees agreed. Race employees agreed.
69.7%69.7% of Black employees agreed. of Black employees agreed.
59.9%59.9% of all respondents agreed that their workload was reasonable. of all respondents agreed that their workload was reasonable.
47%47% of American Indian/Alaska Native employees agreed. of American Indian/Alaska Native employees agreed. 89.8%89.8% of Native Hawaiian or Other Pacific Islander employees agreed. of Native Hawaiian or Other Pacific Islander employees agreed.
Recruitment, Development & Retention Recruitment, Development & Retention Cont.Cont.
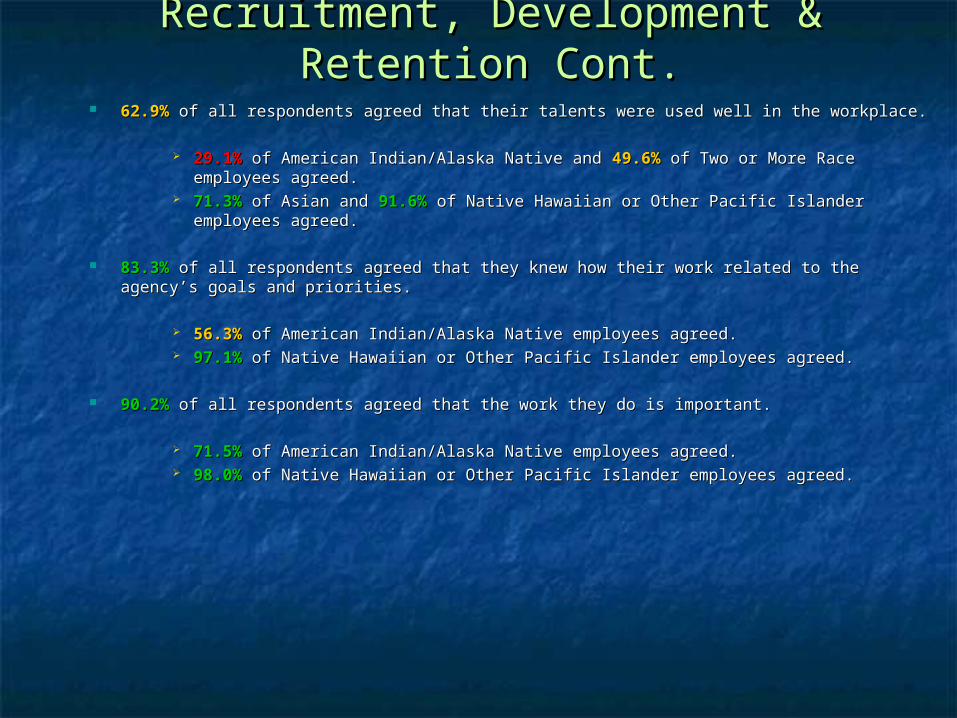
62.9%62.9% of all respondents agreed that their talents were used well in the workplace. of all respondents agreed that their talents were used well in the workplace.
29.1%29.1% of American Indian/Alaska Native and of American Indian/Alaska Native and 49.6%49.6% of Two or More Race of Two or More Race employees agreed.employees agreed.
71.3%71.3% of Asian and of Asian and 91.6%91.6% of Native Hawaiian or Other Pacific Islander of Native Hawaiian or Other Pacific Islander employees agreed. employees agreed.
83.3%83.3% of all respondents agreed that they knew how their work related to the agency’s of all respondents agreed that they knew how their work related to the agency’s goals and priorities. goals and priorities.
56.3%56.3% of American Indian/Alaska Native employees agreed. of American Indian/Alaska Native employees agreed. 97.1%97.1% of Native Hawaiian or Other Pacific Islander employees agreed. of Native Hawaiian or Other Pacific Islander employees agreed.
90.2%90.2% of all respondents agreed that the work they do is important. of all respondents agreed that the work they do is important.
71.5%71.5% of American Indian/Alaska Native employees agreed. of American Indian/Alaska Native employees agreed. 98.0%98.0% of Native Hawaiian or Other Pacific Islander employees agreed. of Native Hawaiian or Other Pacific Islander employees agreed.
Category BreakdownCategory BreakdownPerformance CulturePerformance Culture
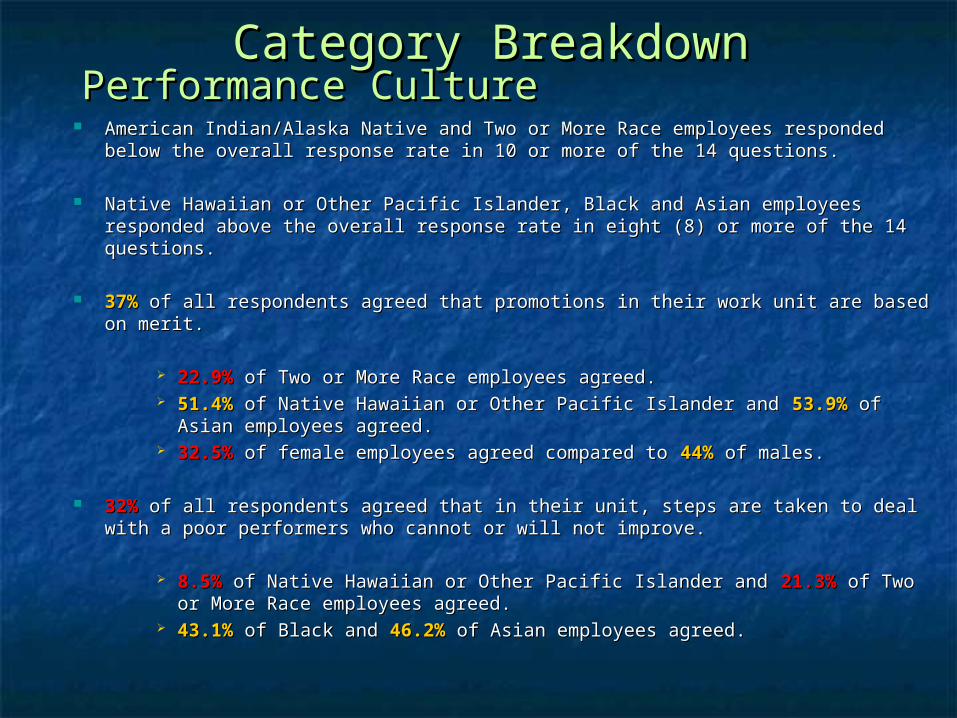
American Indian/Alaska Native and Two or More Race employees responded below American Indian/Alaska Native and Two or More Race employees responded below the overall response rate in 10 or more of the 14 questions. the overall response rate in 10 or more of the 14 questions.
Native Hawaiian or Other Pacific Islander, Black and Asian employees responded Native Hawaiian or Other Pacific Islander, Black and Asian employees responded above the overall response rate in eight (8) or more of the 14 questions.above the overall response rate in eight (8) or more of the 14 questions.
37%37% of all respondents agreed that promotions in their work unit are based on of all respondents agreed that promotions in their work unit are based on merit.merit.
22.9%22.9% of Two or More Race employees agreed. of Two or More Race employees agreed. 51.4%51.4% of Native Hawaiian or Other Pacific Islander and of Native Hawaiian or Other Pacific Islander and 53.9%53.9% of Asian of Asian
employees agreed. employees agreed. 32.5%32.5% of female employees agreed compared to of female employees agreed compared to 44%44% of males. of males.
32%32% of all respondents agreed that in their unit, steps are taken to deal with a of all respondents agreed that in their unit, steps are taken to deal with a poor performers who cannot or will not improve.poor performers who cannot or will not improve.
8.5%8.5% of Native Hawaiian or Other Pacific Islander and of Native Hawaiian or Other Pacific Islander and 21.3%21.3% of Two or of Two or More Race employees agreed.More Race employees agreed.
43.1%43.1% of Black and of Black and 46.2%46.2% of Asian employees agreed. of Asian employees agreed.
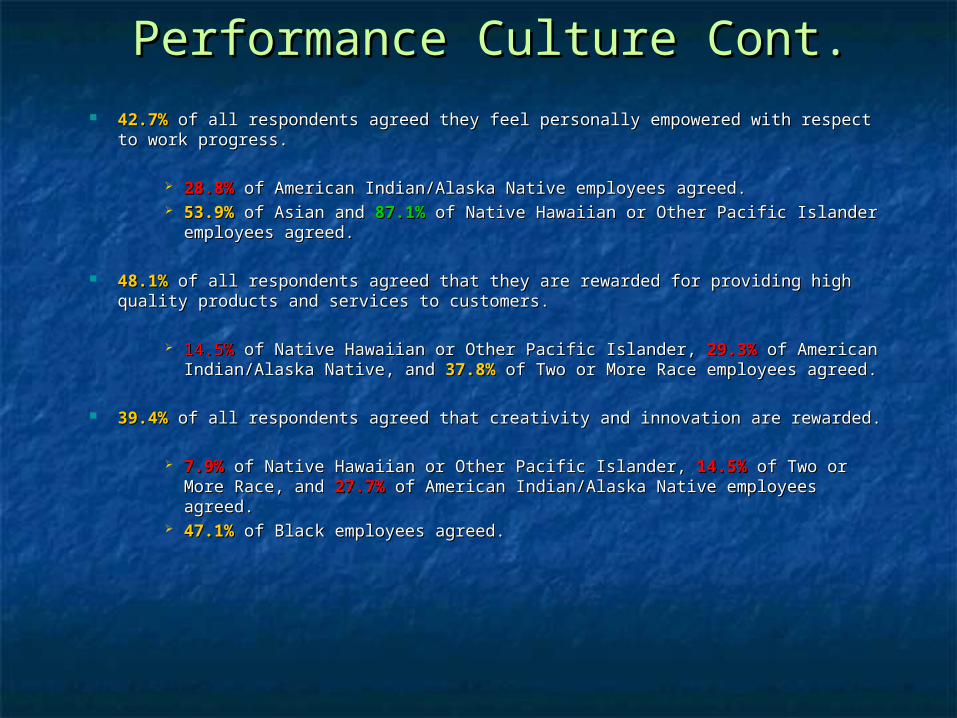
Performance Culture Cont.Performance Culture Cont. 42.7%42.7% of all respondents agreed they feel personally empowered with respect to of all respondents agreed they feel personally empowered with respect to
work progress.work progress.
28.8%28.8% of American Indian/Alaska Native employees agreed. of American Indian/Alaska Native employees agreed. 53.9%53.9% of Asian and of Asian and 87.1%87.1% of Native Hawaiian or Other Pacific Islander of Native Hawaiian or Other Pacific Islander
employees agreed. employees agreed.
48.1%48.1% of all respondents agreed that they are rewarded for providing high of all respondents agreed that they are rewarded for providing high quality products and services to customers.quality products and services to customers.
14.5%14.5% of Native Hawaiian or Other Pacific Islander, of Native Hawaiian or Other Pacific Islander, 29.3%29.3% of American of American Indian/Alaska Native, and Indian/Alaska Native, and 37.8%37.8% of Two or More Race employees agreed. of Two or More Race employees agreed.
39.4%39.4% of all respondents agreed that creativity and innovation are rewarded. of all respondents agreed that creativity and innovation are rewarded.
7.9%7.9% of Native Hawaiian or Other Pacific Islander, of Native Hawaiian or Other Pacific Islander, 14.5%14.5% of Two or More of Two or More Race, and Race, and 27.7%27.7% of American Indian/Alaska Native employees agreed. of American Indian/Alaska Native employees agreed.
47.1%47.1% of Black employees agreed. of Black employees agreed.
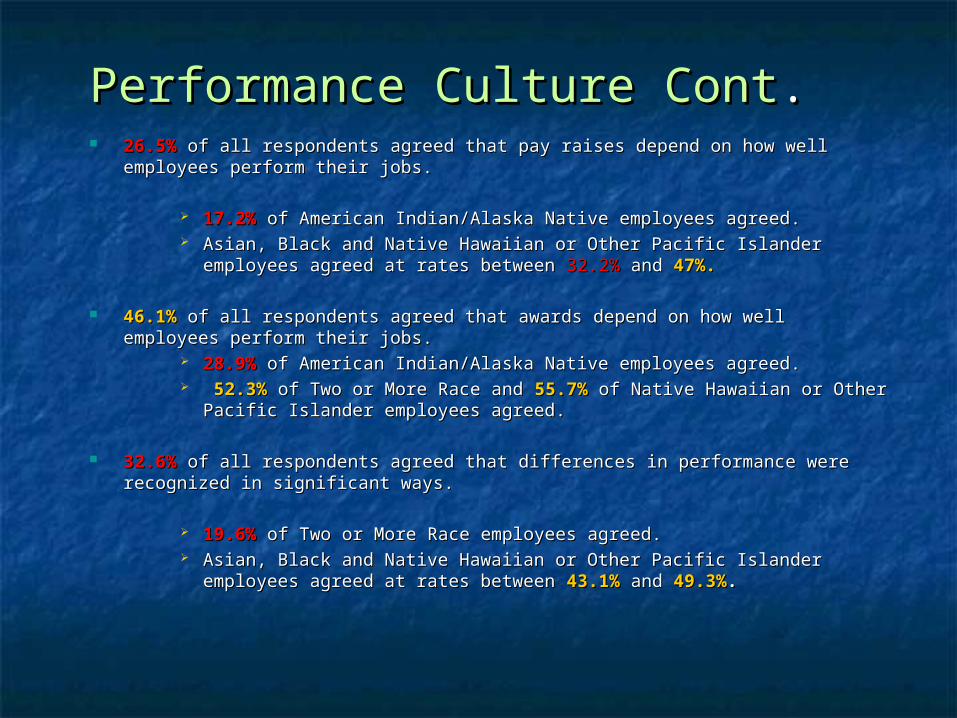
Performance Culture ContPerformance Culture Cont.. 26.5%26.5% of all respondents agreed that pay raises depend on how well employees of all respondents agreed that pay raises depend on how well employees
perform their jobs.perform their jobs.
17.2%17.2% of American Indian/Alaska Native employees agreed. of American Indian/Alaska Native employees agreed. Asian, Black and Native Hawaiian or Other Pacific Islander employees Asian, Black and Native Hawaiian or Other Pacific Islander employees
agreed at rates between agreed at rates between 32.2%32.2% and and 47%.47%.
46.1%46.1% of all respondents agreed that awards depend on how well employees of all respondents agreed that awards depend on how well employees perform their jobs.perform their jobs.
28.9%28.9% of American Indian/Alaska Native employees agreed. of American Indian/Alaska Native employees agreed. 52.3%52.3% of Two or More Race and of Two or More Race and 55.7%55.7% of Native Hawaiian or Other of Native Hawaiian or Other
Pacific Islander employees agreed.Pacific Islander employees agreed.
32.6%32.6% of all respondents agreed that differences in performance were recognized of all respondents agreed that differences in performance were recognized in significant ways.in significant ways.
19.6%19.6% of Two or More Race employees agreed. of Two or More Race employees agreed. Asian, Black and Native Hawaiian or Other Pacific Islander employees Asian, Black and Native Hawaiian or Other Pacific Islander employees
agreed at rates between agreed at rates between 43.1%43.1% and and 49.3%49.3%..
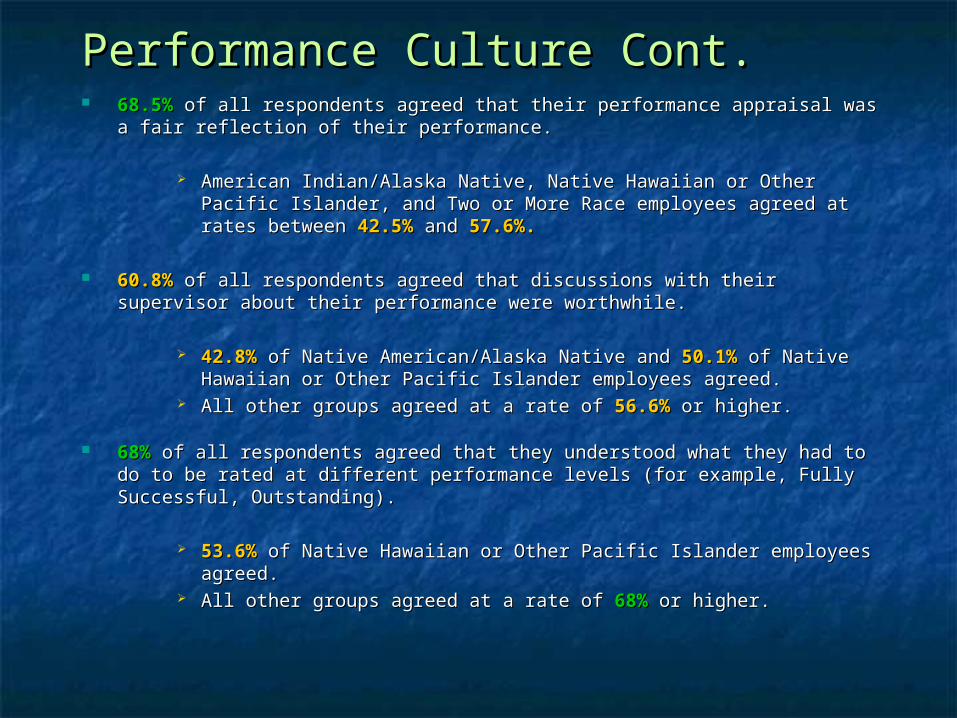
Performance Culture Cont.Performance Culture Cont. 68.5%68.5% of all respondents agreed that their performance appraisal was a fair of all respondents agreed that their performance appraisal was a fair
reflection of their performance.reflection of their performance.
American Indian/Alaska Native, Native Hawaiian or Other Pacific American Indian/Alaska Native, Native Hawaiian or Other Pacific Islander, and Two or More Race employees agreed at rates between Islander, and Two or More Race employees agreed at rates between 42.5%42.5% and and 57.6%.57.6%.
60.8%60.8% of all respondents agreed that discussions with their supervisor about of all respondents agreed that discussions with their supervisor about their performance were worthwhile.their performance were worthwhile.
42.8%42.8% of Native American/Alaska Native and of Native American/Alaska Native and 50.1%50.1% of Native Hawaiian of Native Hawaiian or Other Pacific Islander employees agreed. or Other Pacific Islander employees agreed.
All other groups agreed at a rate of All other groups agreed at a rate of 56.6%56.6% or higher. or higher.
68%68% of all respondents agreed that they understood what they had to do to be of all respondents agreed that they understood what they had to do to be rated at different performance levels (for example, Fully Successful, rated at different performance levels (for example, Fully Successful, Outstanding). Outstanding).
53.6%53.6% of Native Hawaiian or Other Pacific Islander employees agreed. of Native Hawaiian or Other Pacific Islander employees agreed. All other groups agreed at a rate of All other groups agreed at a rate of 68%68% or higher. or higher.
Performance Culture Cont.Performance Culture Cont.
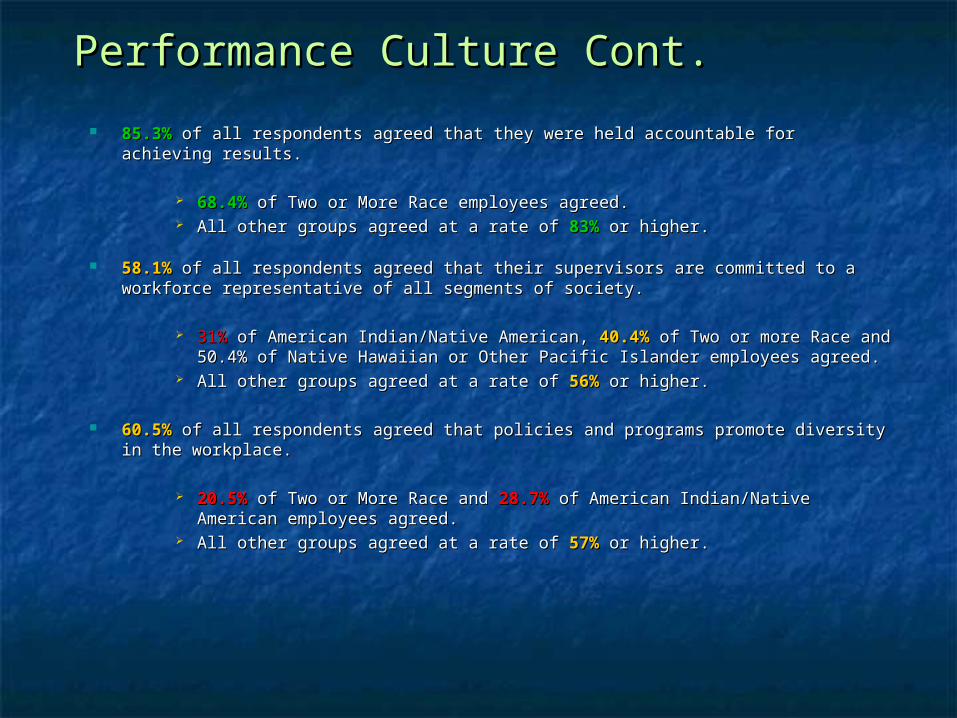
85.3%85.3% of all respondents agreed that they were held accountable for achieving of all respondents agreed that they were held accountable for achieving results.results.
68.4%68.4% of Two or More Race employees agreed. of Two or More Race employees agreed. All other groups agreed at a rate of All other groups agreed at a rate of 83%83% or higher. or higher.
58.1%58.1% of all respondents agreed that their supervisors are committed to a workforce of all respondents agreed that their supervisors are committed to a workforce representative of all segments of society. representative of all segments of society.
31%31% of American Indian/Native American, of American Indian/Native American, 40.4%40.4% of Two or more Race and of Two or more Race and 50.4% of Native Hawaiian or Other Pacific Islander employees agreed.50.4% of Native Hawaiian or Other Pacific Islander employees agreed.
All other groups agreed at a rate of All other groups agreed at a rate of 56%56% or higher. or higher.
60.5%60.5% of all respondents agreed that policies and programs promote diversity in the of all respondents agreed that policies and programs promote diversity in the workplace.workplace.
20.5%20.5% of Two or More Race and of Two or More Race and 28.7%28.7% of American Indian/Native American of American Indian/Native American employees agreed. employees agreed.
All other groups agreed at a rate of All other groups agreed at a rate of 57%57% or higher. or higher.
Performance Culture Cont.Performance Culture Cont.
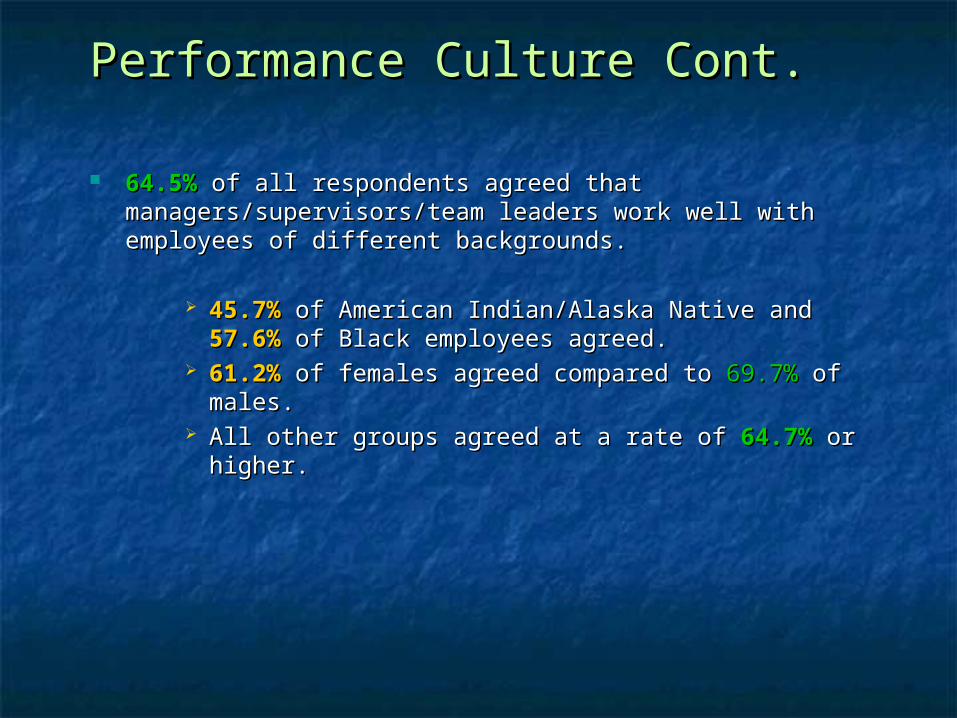
64.5%64.5% of all respondents agreed that of all respondents agreed that managers/supervisors/team leaders work well with employees managers/supervisors/team leaders work well with employees of different backgrounds. of different backgrounds.
45.7%45.7% of American Indian/Alaska Native and of American Indian/Alaska Native and 57.6%57.6% of of Black employees agreed. Black employees agreed.
61.2%61.2% of females agreed compared to of females agreed compared to 69.7%69.7% of males. of males. All other groups agreed at a rate of All other groups agreed at a rate of 64.7%64.7% or higher. or higher.
Category BreakdownCategory Breakdown
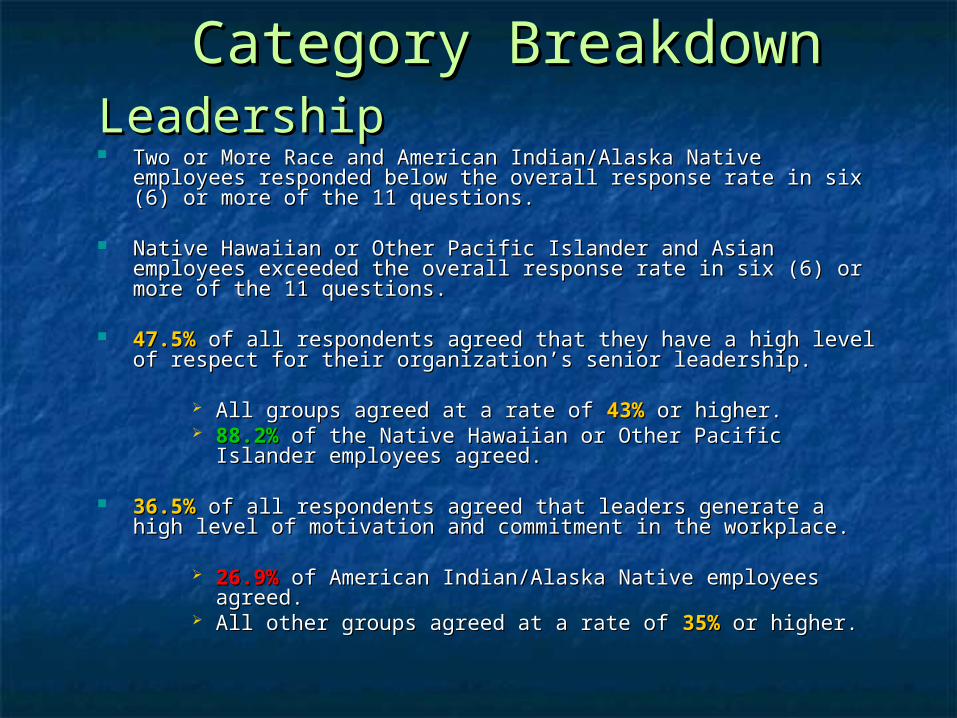
Two or More Race and American Indian/Alaska Native employees Two or More Race and American Indian/Alaska Native employees responded below the overall response rate in six (6) or more of the 11 responded below the overall response rate in six (6) or more of the 11 questions. questions.
Native Hawaiian or Other Pacific Islander and Asian employees Native Hawaiian or Other Pacific Islander and Asian employees exceeded the overall response rate in six (6) or more of the 11 exceeded the overall response rate in six (6) or more of the 11 questions.questions.
47.5%47.5% of all respondents agreed that they have a high level of of all respondents agreed that they have a high level of respect for their organization’s senior leadership.respect for their organization’s senior leadership.
All groups agreed at a rate of All groups agreed at a rate of 43%43% or higher. or higher. 88.2%88.2% of the Native Hawaiian or Other Pacific Islander of the Native Hawaiian or Other Pacific Islander
employees agreed.employees agreed.
36.5%36.5% of all respondents agreed that leaders generate a high level of of all respondents agreed that leaders generate a high level of motivation and commitment in the workplace.motivation and commitment in the workplace.
26.9%26.9% of American Indian/Alaska Native employees agreed. of American Indian/Alaska Native employees agreed. All other groups agreed at a rate of All other groups agreed at a rate of 35%35% or higher. or higher.
LeadershipLeadership
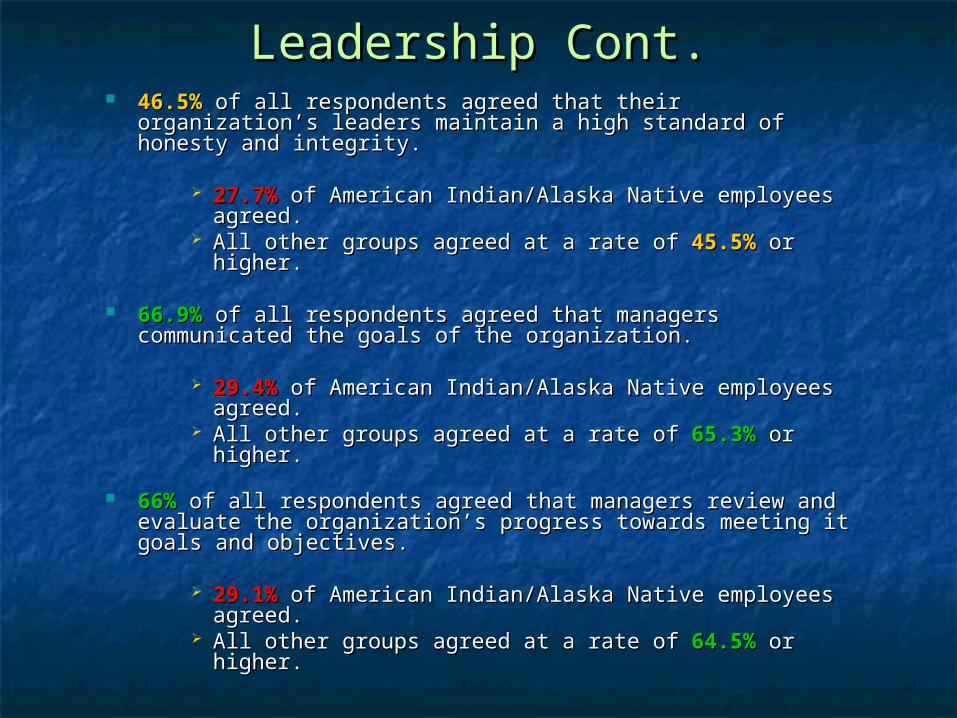
Leadership Cont.Leadership Cont. 46.5%46.5% of all respondents agreed that their organization’s of all respondents agreed that their organization’s
leaders maintain a high standard of honesty and integrity. leaders maintain a high standard of honesty and integrity.
27.7%27.7% of American Indian/Alaska Native employees of American Indian/Alaska Native employees agreed. agreed.
All other groups agreed at a rate of All other groups agreed at a rate of 45.5%45.5% or higher. or higher.
66.9%66.9% of all respondents agreed that managers of all respondents agreed that managers communicated the goals of the organization. communicated the goals of the organization.
29.4%29.4% of American Indian/Alaska Native employees of American Indian/Alaska Native employees agreed. agreed.
All other groups agreed at a rate of All other groups agreed at a rate of 65.3%65.3% or higher. or higher.
66%66% of all respondents agreed that managers review and of all respondents agreed that managers review and evaluate the organization’s progress towards meeting it evaluate the organization’s progress towards meeting it goals and objectives. goals and objectives.
29.1%29.1% of American Indian/Alaska Native employees of American Indian/Alaska Native employees agreed. agreed.
All other groups agreed at a rate of All other groups agreed at a rate of 64.5%64.5% or higher. or higher.
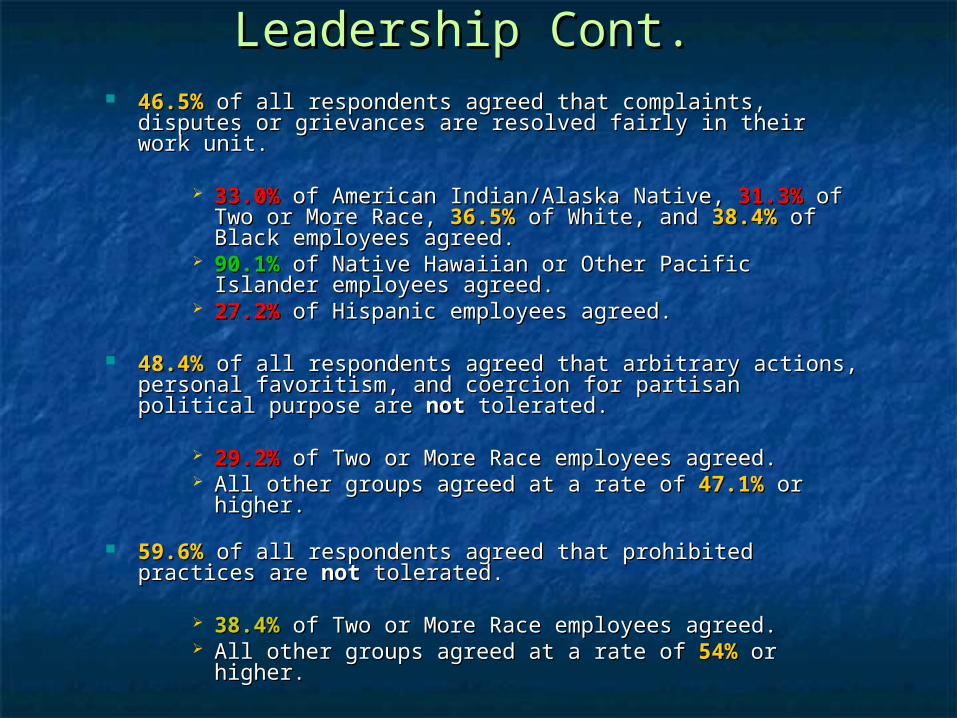
Leadership Cont.Leadership Cont. 46.5%46.5% of all respondents agreed that complaints, disputes of all respondents agreed that complaints, disputes
or grievances are resolved fairly in their work unit. or grievances are resolved fairly in their work unit.
33.0%33.0% of American Indian/Alaska Native, of American Indian/Alaska Native, 31.3%31.3% of of Two or More Race, Two or More Race, 36.5%36.5% of White, and of White, and 38.4%38.4% of of Black employees agreed.Black employees agreed.
90.1%90.1% of Native Hawaiian or Other Pacific Islander of Native Hawaiian or Other Pacific Islander employees agreed.employees agreed.
27.2%27.2% of Hispanic employees agreed. of Hispanic employees agreed.
48.4%48.4% of all respondents agreed that arbitrary actions, of all respondents agreed that arbitrary actions, personal favoritism, and coercion for partisan political personal favoritism, and coercion for partisan political purpose are purpose are notnot tolerated. tolerated.
29.2%29.2% of Two or More Race employees agreed. of Two or More Race employees agreed. All other groups agreed at a rate of All other groups agreed at a rate of 47.1%47.1% or higher. or higher.
59.6%59.6% of all respondents agreed that prohibited practices of all respondents agreed that prohibited practices are are notnot tolerated. tolerated.
38.4%38.4% of Two or More Race employees agreed. of Two or More Race employees agreed. All other groups agreed at a rate of All other groups agreed at a rate of 54%54% or higher. or higher.
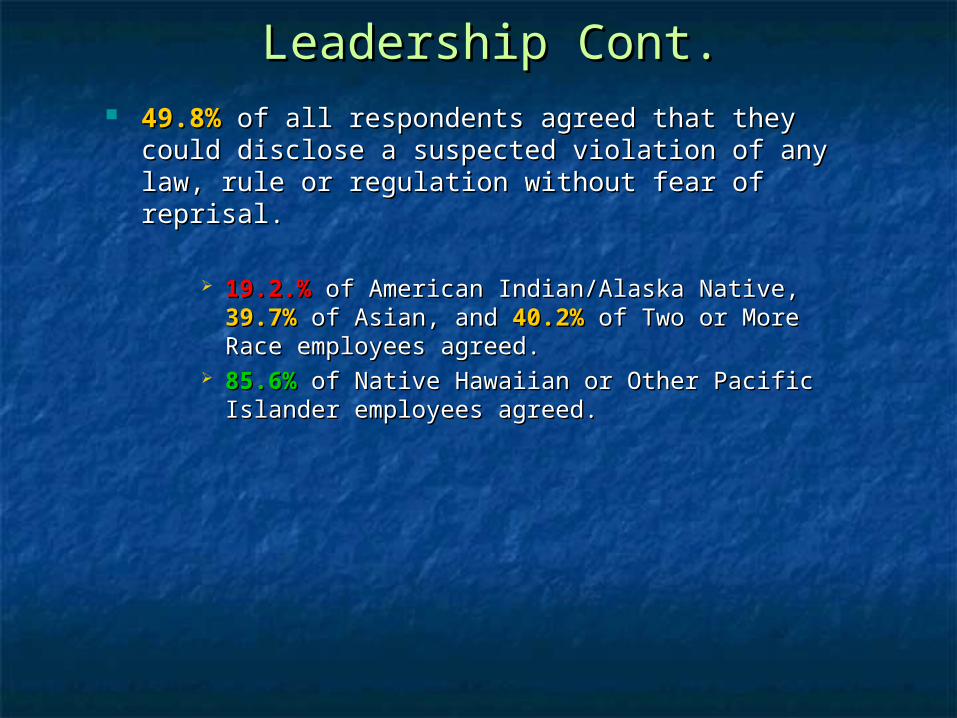
Leadership Cont.Leadership Cont. 49.8%49.8% of all respondents agreed that they could of all respondents agreed that they could
disclose a suspected violation of any law, rule or disclose a suspected violation of any law, rule or regulation without fear of reprisal. regulation without fear of reprisal.
19.2.%19.2.% of American Indian/Alaska Native, of American Indian/Alaska Native, 39.7%39.7% of of Asian, and Asian, and 40.2%40.2% of Two or More Race employees of Two or More Race employees agreed.agreed.
85.6%85.6% of Native Hawaiian or Other Pacific Islander of Native Hawaiian or Other Pacific Islander employees agreed.employees agreed.
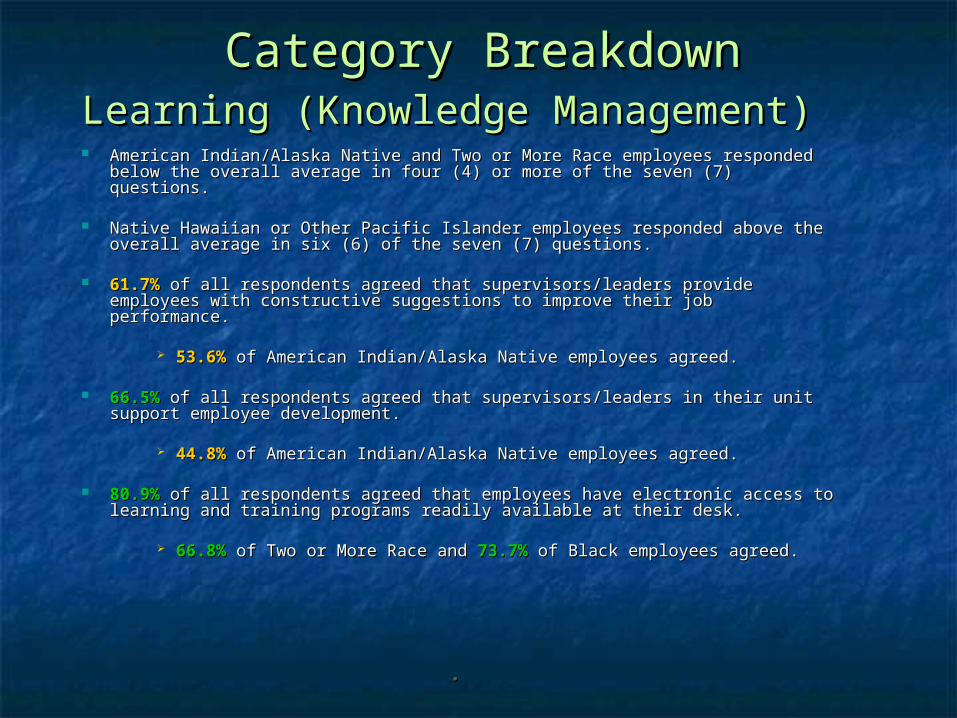
Category BreakdownCategory Breakdown
American Indian/Alaska Native and Two or More Race employees responded American Indian/Alaska Native and Two or More Race employees responded below the overall average in four (4) or more of the seven (7) questions. below the overall average in four (4) or more of the seven (7) questions.
Native Hawaiian or Other Pacific Islander employees responded above the Native Hawaiian or Other Pacific Islander employees responded above the overall average in six (6) of the seven (7) questions.overall average in six (6) of the seven (7) questions.
61.7%61.7% of all respondents agreed that supervisors/leaders provide employees of all respondents agreed that supervisors/leaders provide employees with constructive suggestions to improve their job performance.with constructive suggestions to improve their job performance.
53.6%53.6% of American Indian/Alaska Native employees agreed. of American Indian/Alaska Native employees agreed.
66.5%66.5% of all respondents agreed that supervisors/leaders in their unit support of all respondents agreed that supervisors/leaders in their unit support employee development.employee development.
44.8%44.8% of American Indian/Alaska Native employees agreed. of American Indian/Alaska Native employees agreed.
80.9%80.9% of all respondents agreed that employees have electronic access to of all respondents agreed that employees have electronic access to learning and training programs readily available at their desk. learning and training programs readily available at their desk.
66.8%66.8% of Two or More Race and of Two or More Race and 73.7%73.7% of Black employees agreed. of Black employees agreed.
. .
Learning (Knowledge Management)Learning (Knowledge Management)
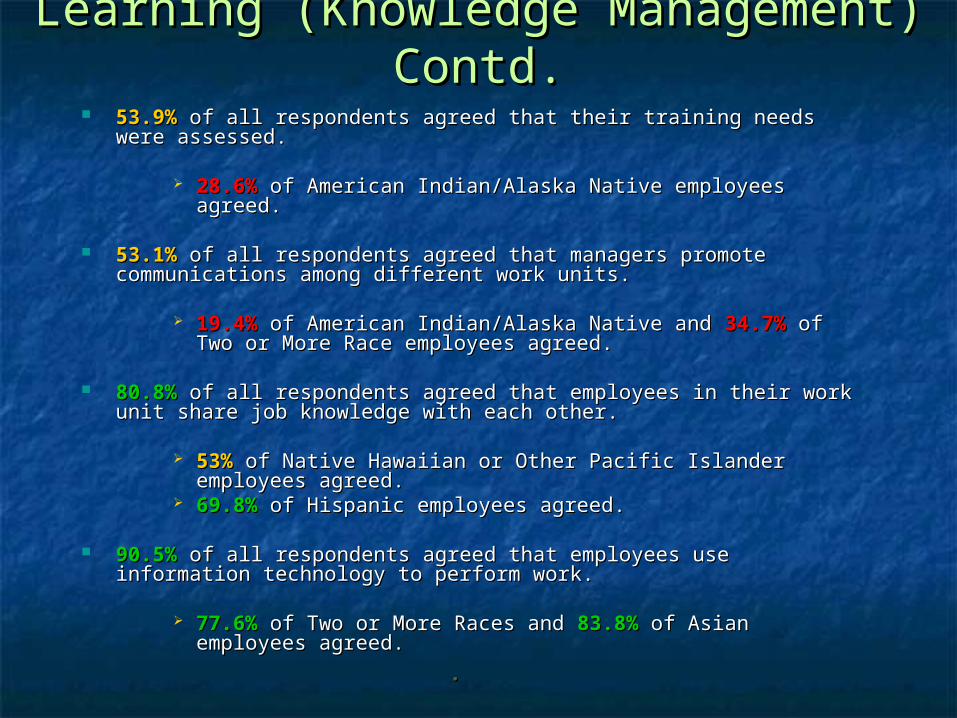
Learning (Knowledge Management) Learning (Knowledge Management) Contd.Contd.
53.9%53.9% of all respondents agreed that their training needs were of all respondents agreed that their training needs were assessed.assessed.
28.6%28.6% of American Indian/Alaska Native employees agreed. of American Indian/Alaska Native employees agreed.
53.1%53.1% of all respondents agreed that managers promote of all respondents agreed that managers promote communications among different work units. communications among different work units.
19.4%19.4% of American Indian/Alaska Native and of American Indian/Alaska Native and 34.7%34.7% of Two of Two or More Race employees agreed.or More Race employees agreed.
80.8%80.8% of all respondents agreed that employees in their work unit of all respondents agreed that employees in their work unit share job knowledge with each other.share job knowledge with each other.
53%53% of Native Hawaiian or Other Pacific Islander employees of Native Hawaiian or Other Pacific Islander employees agreed.agreed.
69.8%69.8% of Hispanic employees agreed. of Hispanic employees agreed.
90.5%90.5% of all respondents agreed that employees use information of all respondents agreed that employees use information technology to perform work.technology to perform work.
77.6%77.6% of Two or More Races and of Two or More Races and 83.8%83.8% of Asian employees of Asian employees agreed.agreed.
. .
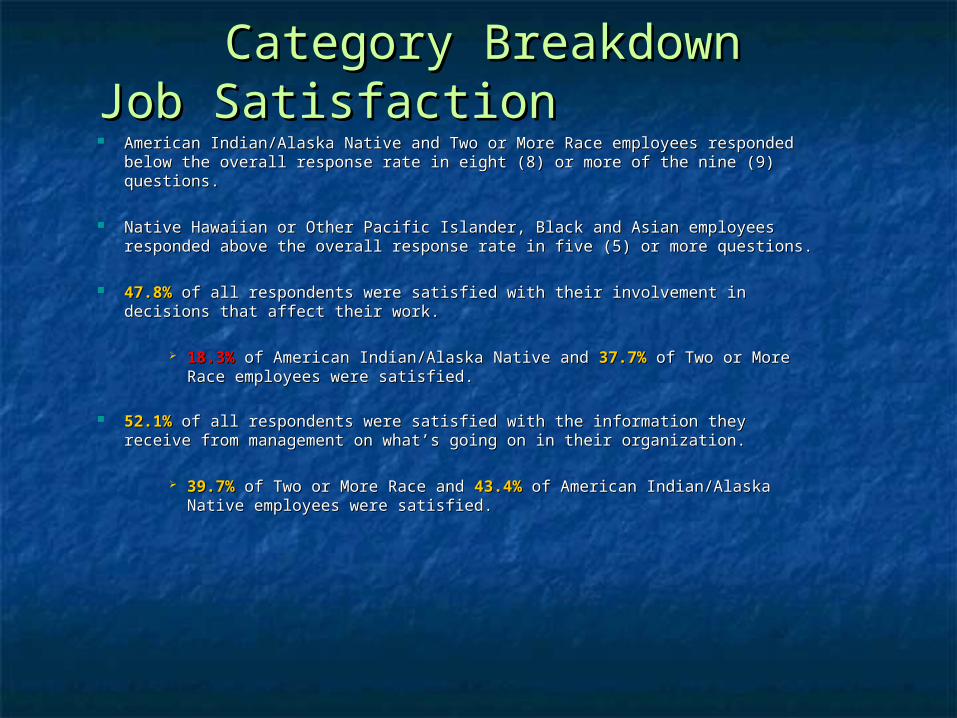
Category BreakdownCategory BreakdownJob SatisfactionJob Satisfaction American Indian/Alaska Native and Two or More Race employees responded American Indian/Alaska Native and Two or More Race employees responded
below the overall response rate in eight (8) or more of the nine (9) questions. below the overall response rate in eight (8) or more of the nine (9) questions.
Native Hawaiian or Other Pacific Islander, Black and Asian employees Native Hawaiian or Other Pacific Islander, Black and Asian employees responded above the overall response rate in five (5) or more questions. responded above the overall response rate in five (5) or more questions.
47.8%47.8% of all respondents were satisfied with their involvement in decisions of all respondents were satisfied with their involvement in decisions that affect their work. that affect their work.
18.3%18.3% of American Indian/Alaska Native and of American Indian/Alaska Native and 37.7%37.7% of Two or More of Two or More Race employees were satisfied. Race employees were satisfied.
52.1%52.1% of all respondents were satisfied with the information they receive of all respondents were satisfied with the information they receive from management on what’s going on in their organization.from management on what’s going on in their organization.
39.7%39.7% of Two or More Race and of Two or More Race and 43.4%43.4% of American Indian/Alaska of American Indian/Alaska Native employees were satisfied.Native employees were satisfied.
Job Satisfaction Contd.Job Satisfaction Contd.
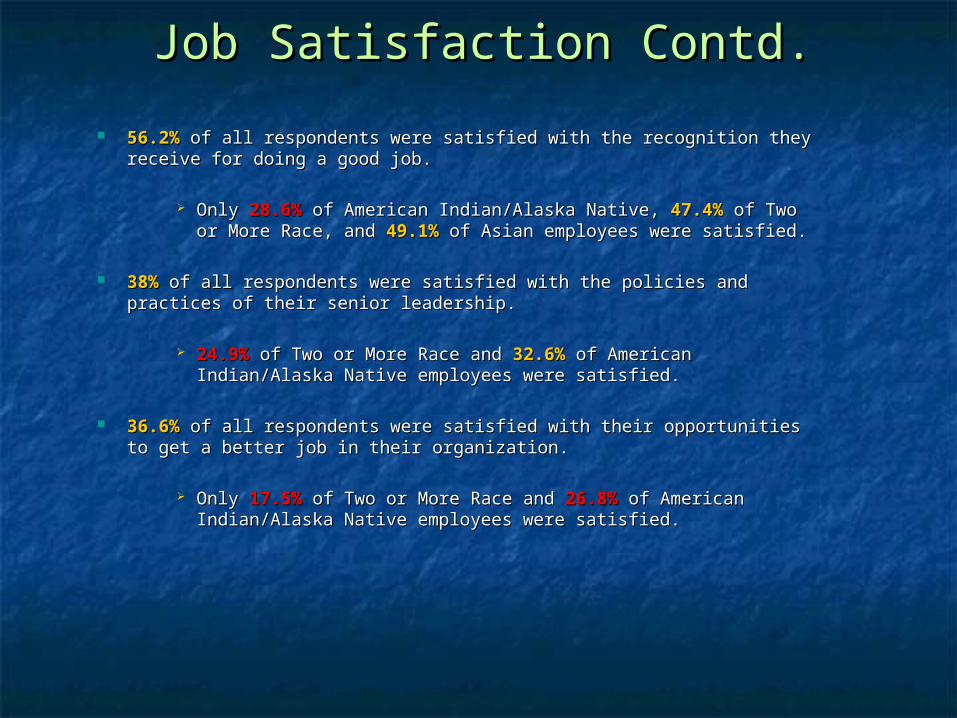
56.2%56.2% of all respondents were satisfied with the recognition they receive of all respondents were satisfied with the recognition they receive for doing a good job. for doing a good job.
Only Only 28.6%28.6% of American Indian/Alaska Native, of American Indian/Alaska Native, 47.4%47.4% of Two or of Two or More Race, and More Race, and 49.1%49.1% of Asian employees were satisfied. of Asian employees were satisfied.
38%38% of all respondents were satisfied with the policies and practices of of all respondents were satisfied with the policies and practices of their senior leadership. their senior leadership.
24.9%24.9% of Two or More Race and of Two or More Race and 32.6%32.6% of American of American Indian/Alaska Native employees were satisfied. Indian/Alaska Native employees were satisfied.
36.6%36.6% of all respondents were satisfied with their opportunities to get a of all respondents were satisfied with their opportunities to get a better job in their organization.better job in their organization.
Only Only 17.5%17.5% of Two or More Race and of Two or More Race and 26.8%26.8% of American of American Indian/Alaska Native employees were satisfied.Indian/Alaska Native employees were satisfied.
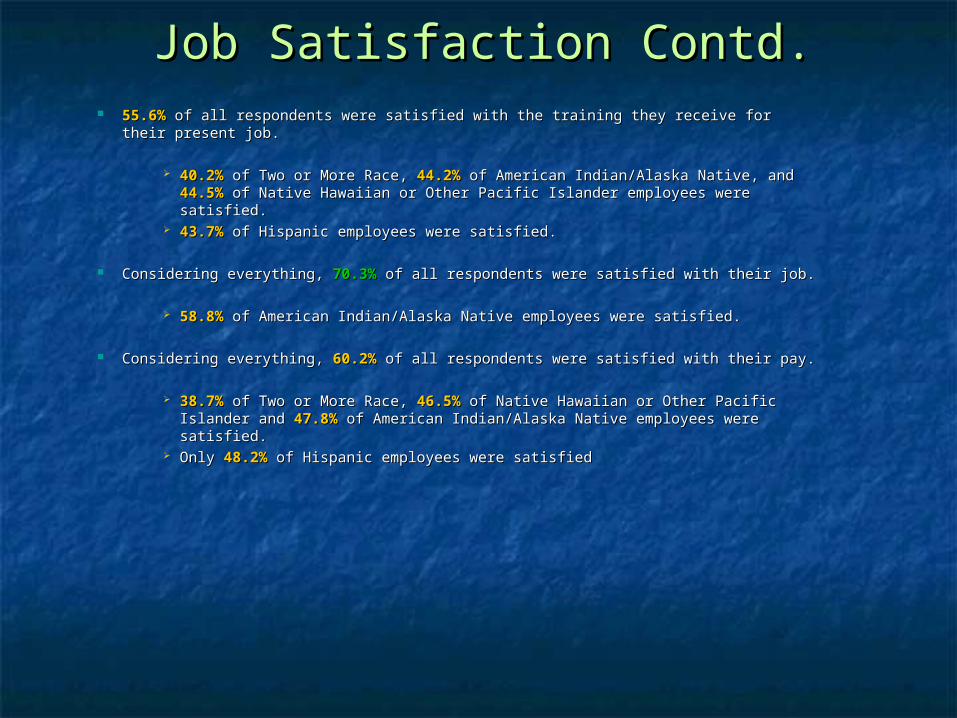
Job Satisfaction Contd.Job Satisfaction Contd. 55.6%55.6% of all respondents were satisfied with the training they receive for their of all respondents were satisfied with the training they receive for their
present job. present job.
40.2%40.2% of Two or More Race, of Two or More Race, 44.2%44.2% of American Indian/Alaska Native, and of American Indian/Alaska Native, and 44.5%44.5% of Native Hawaiian or Other Pacific Islander employees were satisfied. of Native Hawaiian or Other Pacific Islander employees were satisfied.
43.7%43.7% of Hispanic employees were satisfied. of Hispanic employees were satisfied.
Considering everything, Considering everything, 70.3%70.3% of all respondents were satisfied with their job. of all respondents were satisfied with their job.
58.8%58.8% of American Indian/Alaska Native employees were satisfied. of American Indian/Alaska Native employees were satisfied.
Considering everything, Considering everything, 60.2%60.2% of all respondents were satisfied with their pay. of all respondents were satisfied with their pay.
38.7%38.7% of Two or More Race, of Two or More Race, 46.5%46.5% of Native Hawaiian or Other Pacific of Native Hawaiian or Other Pacific Islander and Islander and 47.8%47.8% of American Indian/Alaska Native employees were of American Indian/Alaska Native employees were satisfied.satisfied.
Only Only 48.2%48.2% of Hispanic employees were satisfied of Hispanic employees were satisfied
Job Satisfaction Contd.Job Satisfaction Contd.
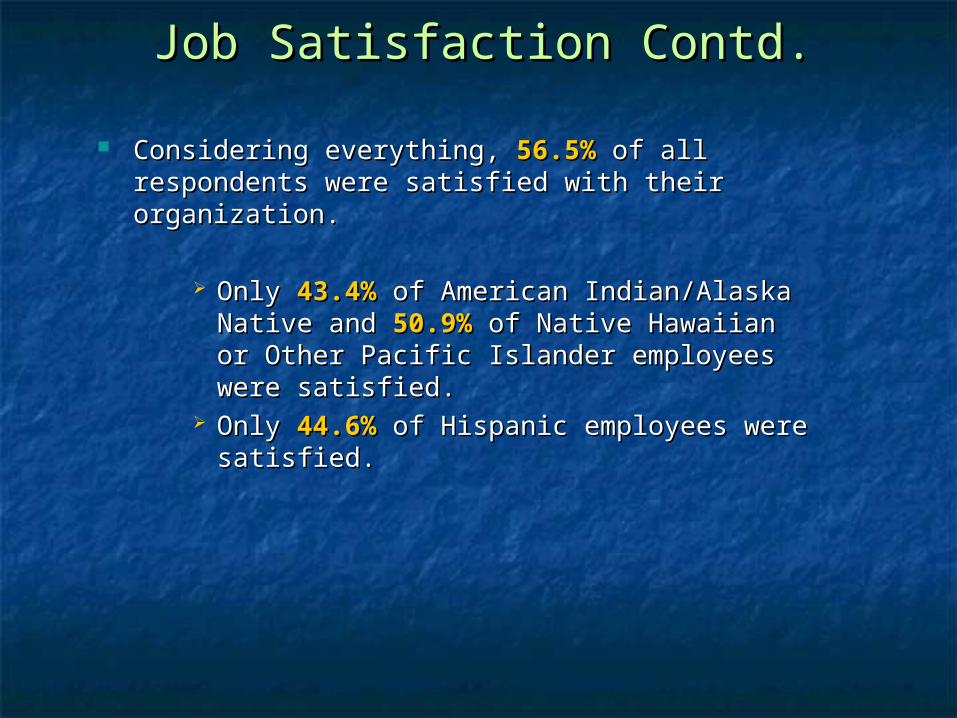
Considering everything, Considering everything, 56.5%56.5% of all respondents of all respondents were satisfied with their organization. were satisfied with their organization.
Only Only 43.4%43.4% of American Indian/Alaska of American Indian/Alaska Native and Native and 50.9%50.9% of Native Hawaiian or of Native Hawaiian or Other Pacific Islander employees were Other Pacific Islander employees were satisfied. satisfied.
Only Only 44.6%44.6% of Hispanic employees were of Hispanic employees were satisfied.satisfied.
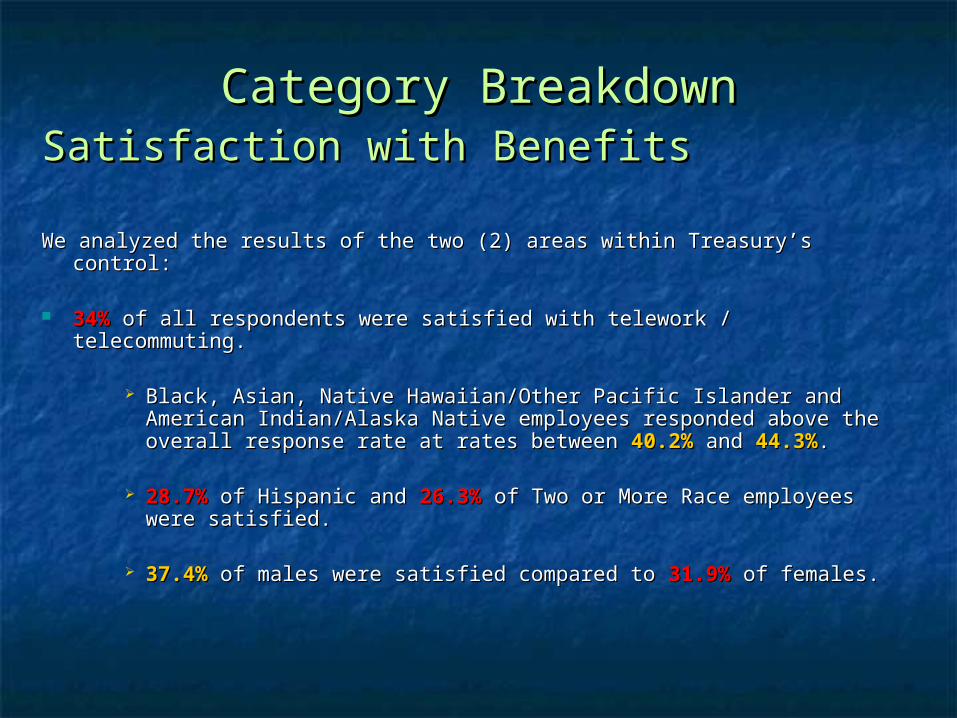
Category BreakdownCategory BreakdownSatisfaction with BenefitsSatisfaction with Benefits
We analyzed the results of the two (2) areas within Treasury’s control:We analyzed the results of the two (2) areas within Treasury’s control:
34%34% of all respondents were satisfied with telework / telecommuting. of all respondents were satisfied with telework / telecommuting.
Black, Asian, Native Hawaiian/Other Pacific Islander and Black, Asian, Native Hawaiian/Other Pacific Islander and American Indian/Alaska Native employees responded above the American Indian/Alaska Native employees responded above the overall response rate at rates between overall response rate at rates between 40.2%40.2% and and 44.3%44.3%. .
28.7%28.7% of Hispanic and of Hispanic and 26.3%26.3% of Two or More Race employees of Two or More Race employees were satisfied. were satisfied.
37.4%37.4% of males were satisfied compared to of males were satisfied compared to 31.9%31.9% of females. of females.
Satisfaction with Benefits Contd.Satisfaction with Benefits Contd.
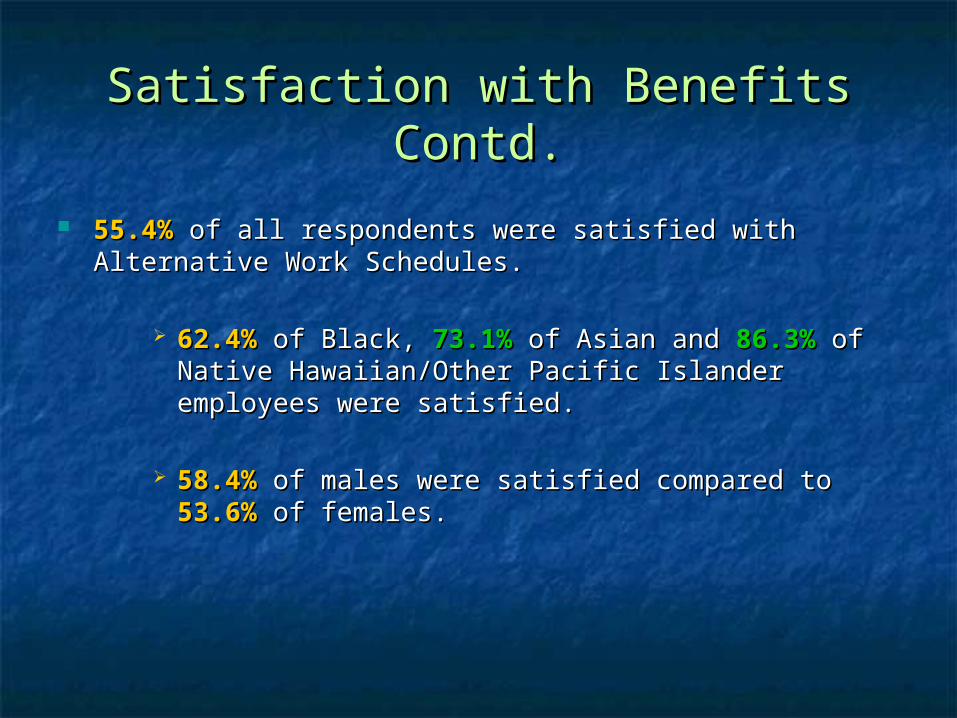
55.4%55.4% of all respondents were satisfied with Alternative of all respondents were satisfied with Alternative Work Schedules.Work Schedules.
62.4%62.4% of Black, of Black, 73.1%73.1% of Asian and of Asian and 86.3%86.3% of Native of Native Hawaiian/Other Pacific Islander employees were Hawaiian/Other Pacific Islander employees were satisfied. satisfied.
58.4%58.4% of males were satisfied compared to of males were satisfied compared to 53.6%53.6% of of females.females.