Embed Size (px)
Citation preview
Vol.4 No. 2
FEDERAL
HOME LOAN BANK
REVIEW
NOVEMBER 1937
ISSUED BY FEDERAL HOME LOAN BANK BOARD
WASHINGTON D.C. Digitized for FRASER http://fraser.stlouisfed.org/ Federal Reserve Bank of St. Louis
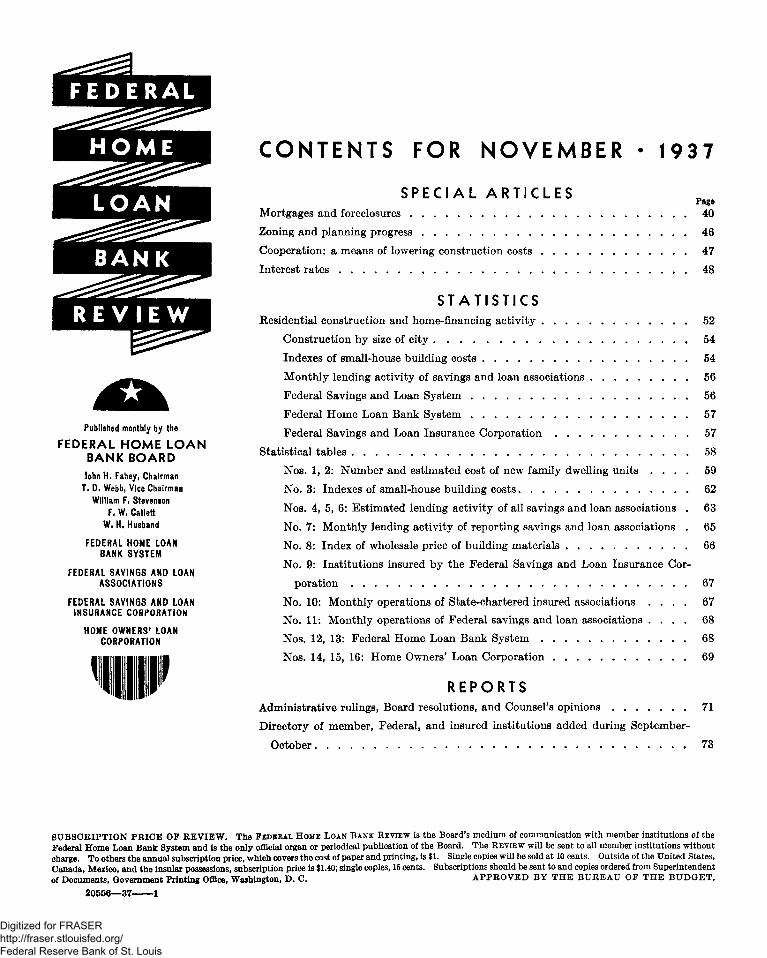
• U S J u u H CONTENTS FOR NOVEMBER • 1937
• M m i H SPECIAL ARTICLES H H H I I H ^ M M B I H I H Mortgages and foreclosures 40
^ ^ ^ ^ t f ^ j ^ ^ ^ ^ ^ " * ^ Zoning and planning progress 46
^ ^ ^ ^ ^ ^ ^ ^ ^ ^ ^ ^ r ^ ^ ^ ^ H Cooperation: a means of lowering construction costs 47
• H H U U M B l p i ^ H ^ H Interest rates 48
^ n N V f l f f f M STATISTICS ^ ^ ^ ^ ^ ^ ^ ^ ^ ^ ^ L ^ ^ ^ ^ ^ H Residential construction and home-financing activity 52
^ ^ ^ ^ ^ ^ ^ Construction by size of city 54
Indexes of small-house building costs 54
^ ^ - ^ ^ Monthly lending activity of savings and loan associations 56
^^M^^^^ Federal Savings and Loan System 56
Federal Home Loan Bank System 57 Published monthly by the Federal Savings and Loan Insurance Corporation 57
FEDERAL HOME LOAN G. . . . . . . BANK B O A R D Statistical tables 58
J hn H Fahev Ch i an ^ o s * *' ^ : Number a n c * est imated cost of new family dwelling units . . . . 59
T. D. Webb, Vice Chairman No. 3 : Indexes of small-house building costs 62 William F. Stevenson _T , » „ T, ,. , , , ,. ,. .-. <• •,-, . ,-. . . .
F. W. Catlett o s # » **» ®: Estimated lending activity of all savings and loan associations . 63 W. H. Husband No. 7: Monthly lending activity of reporting savings and loan associations . 65
FEDERAL HOME LOAN No. 8: Index of wholesale price of building materials 66 BANK SYSTEM
No. 9: Inst i tut ions insured by the Federal Savings and Loan Insurance Cor-FEDERAL SAVINGS AND LOAN
ASSOCIATIONS porat ion 67
FEDERAL SAVINGS AND LOAN No. 10: Monthly operations of State-chartered insured associations . . . . 67 INSURANCE CORPORATION ™- „« w x, , x- * T, „ , •
No. 11: Monthly operations of Federal savings and loan associations . . . . 68 HOME OWNERS' LOAN
CORPORATION Nos. 12, 13: Federal Home Loan Bank System 68
W Nos. 14, 15, 16: Home Owners' Loan Corporation 69
R E P O R T S
Administrat ive rulings, Board resolutions, and Counsel's opinions 71
Directory of member, Federal, and insured insti tutions added during September-
October 73
SUBSCRIPTION PRICE OF REVIEW. The FEDERAL HOME LOAN BANK REVIEW is the Board's medium of communication with member institutions of the Federal Home Loan Bank System and is the only official organ or periodical publication of the Board. The REVIEW will be sent to all member institutions without charge. To others the annual subscription price, which covers the cost of paper and printing, is $1. Single copies will be sold at 10 cents. Outside of the United States, Canada, Mexico, and the insular possessions, subscription price is $1.40; single copies, 15 cents. Subscriptions should be sent to and copies ordered from Superintendent of Documents, Government Printing Office, Washington, D. C. APPROVED BY THE BUREAU OF THE BUDGET.
20556—37 1
Digitized for FRASER http://fraser.stlouisfed.org/ Federal Reserve Bank of St. Louis
MORTGAGES AND FORECLOSURES Many State mortgage and foreclosure laws are cumbersome, time-con
suming and costly. As a remedy, a uniform real estate mortgage and
foreclosure law has been developed.
• NO phases of the law more directly affect the operation of savings and loan associations than
those dealing with mortgage and foreclosure, and yet no part of our statutes are more cumbersome and obsolete than these. The costly, time-consuming, and often unnecessary procedures required in many States have hampered savings and loan activity and have increased operating expenses. At the same time they have imposed an actual burden on the borrower by forcing the lender to charge higher interest rates and lend a smaller amount on the security of properties than had he been operating under more equitable statutes.
Complicated mortgage and foreclosure laws benefit neither the mortgagee nor the mortgagor and cannot be justified as necessary; the procedures followed by a few States disprove them.
The Nation-wide participation of the Federal Government in the field of mortgage credit during the past five years has brought these diversities into focus. Consequently, one of the first tasks assigned to the Sub-Committee on Laws and Legislation of the Central Housing Committee was the drafting of a uniform real-estate mortgage and foreclosure law.
This Sub-Committee, which is composed of the General Counsels of the various Federal agencies dealing in housing construction and finance, and which is under the chairmanship of the General Counsel of the Federal Home Loan Bank Board, has spent two years studying the problem. It has sought the advice and assistance of many experts in the field and has drafted and redrafted the proposed act many times. The latest draft was formally completed on August 31 of this year and has been submitted to the Central Housing Committee, the United States Building and Loan League, the National Conference of Commissioners on Uniform State Laws, and the American Bar Association.
This draft of a proposed uniform mortgage and fore
closure act has been drawn so as to provide adequate protection for both the mortgagor and the mortgagee and at the same time to eliminate excessive expense and time-consuming procedure. It is so drafted as to be easily adaptable to the customary legal procedure of any State in the Union.
The Sub-Committee was fortunate in having as a basis for its study the earlier pioneering work done by the National Conference of Commissioners on Uniform State Laws. This group, after studying the problem for 15 years, adopted a uniform real-estate mortgage and foreclosure act in 1927 which was approved in general by the American Bar Association and by many other interested bodies. But many detailed objections were raised to it and it has not as yet been adopted in any State.
This earlier work formed an excellent foundation for the studies of the Sub-Committee of the Central Housing Committee, but the experiences of the depression made it obvious that it was not adequate to present conditions. Consequently, a complete redrafting was necessary.
The precedent for the adoption of a uniform law by each of the States is, fortunately, a good one. Only a few years ago the negotiable instruments laws of the various States were hopelessly confused and inequitable in their operation. Commercial bankers dealing with bills and notes and commercial paper generally were constantly in danger in spite of the exercise of reasonable care, and the public welfare was seriously jeopardized because the banking business of the country was obstructed by archaic and unworkable laws. Through the cooperation of the American Bar Association, the American Bankers Association, and others, the National Conference of Commissioners on Uniform State Laws drafted a good uniform negotiable instruments law. That law, with only very slight variations, has been adopted by every State in the country.
40 Federal Home Loan Bank Review
Digitized for FRASER http://fraser.stlouisfed.org/ Federal Reserve Bank of St. Louis
Backed by vigorous cooperative action there is no reason why a uniform real-estate mortgage act cannot also be adopted. Those institutions dealing in real-estate mortgages should demand the same freedom from archaic legal procedures as has already been given in the field of negotiable instruments. A proper mortgage and foreclosure law will not only be fair to the borrower and lender alike but will also actually encourage home ownership by simplifying the interstate lending of funds.
EXISTING DIVERSITIES OF STATE LAWS
Perhaps the most striking example of existing variations in State mortgage and foreclosure laws is found in a metropolitan area which is half in one State and half in another, forming the two cities of Kansas City, Missouri, and Kansas City, Kansas.
In the former, foreclosure is accomplished by an exercise of the power of sale contained in the mortgage after three weeks' notice by publication in a newspaper. A deed to the property is immediately given to the purchaser at the sale as there is no redemption period unless the mortgagor gives to the mortgagee a bond to hold it harmless in which case the mortgagor has a 1-year redemption period. The total cost of foreclosure under this procedure averages about $40.
In Kansas City, Kansas, however, there are no provisions for power of sale. The action must take place in court, and the mortgagor is allowed from 6 to 18 months to redeem the property after its sale. This action costs about $90.
But a comparison of these two cities is striking only because they are so close together. The variations in cost and elapsed time between other States are much greater than these, reflecting the complex procedures wliich in many cases have been added to existing laws by conscientious legislators in an attempt to correct an existing evil. Unfortunately, many of these additions have done nothing but create an unnecessary burden on home ownership. If a simplified alternative had been presented to the conscientious legislators the cumbersome procedures might never have been adopted.
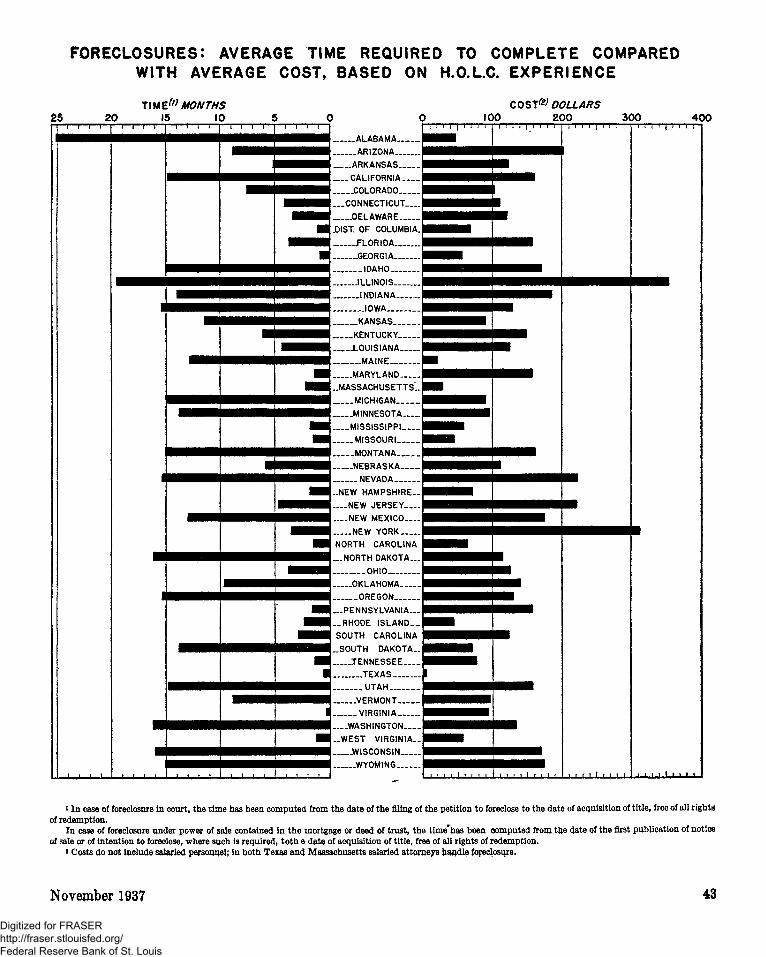
The accompanying chart shows better than any explanation the effect of these various State laws. This chart is based on the experience of the Home Owners' Loan Corporation. A sample of as near 100 foreclosures as possible was taken in every State and the average time necessary to foreclose and the average cost computed. Because the H. O. L. C. chose, whenever possible, the least
expensive and the shortest method of foreclosure, and because costs do not include salaried personnel, the time and cost are, if anything, less than if they represented privately instituted foreclosures.
The chart analyzed in connection with the two accompanying tables shows why the time fluctuates between States and why there are such great variations in cost.
Thus, in Alabama, it takes 25 months to complete foreclosure but costs only $48. At first glance this seems inconsistent when compared with the long time required and the high cost in such States as New York and Illinois, but the cost is low in Alabama because foreclosure is accomplished by a simple power of sale. This procedure takes only one month—three weeks of which are devoted to publication of notice of foreclosure. After sale the title is transferred to the purchaser but the original owner is allowed two years in which to redeem the property.
A majority of the States make some provision for a period during which the owner may redeem his property. But as may be seen in Table 2, there is little consistency. The most common procedure is to provide a period of redemption after the foreclosure proceedings have been completed; in other words, after the costs of foreclosure have accrued— costs which add to the burden of redemption. Only four States, Indiana, Oklahoma, Nebraska, and Wisconsin, provide a redemption period before sale although many of those States which have no redemption period require that the mortgagor be notified several months before sale takes place.
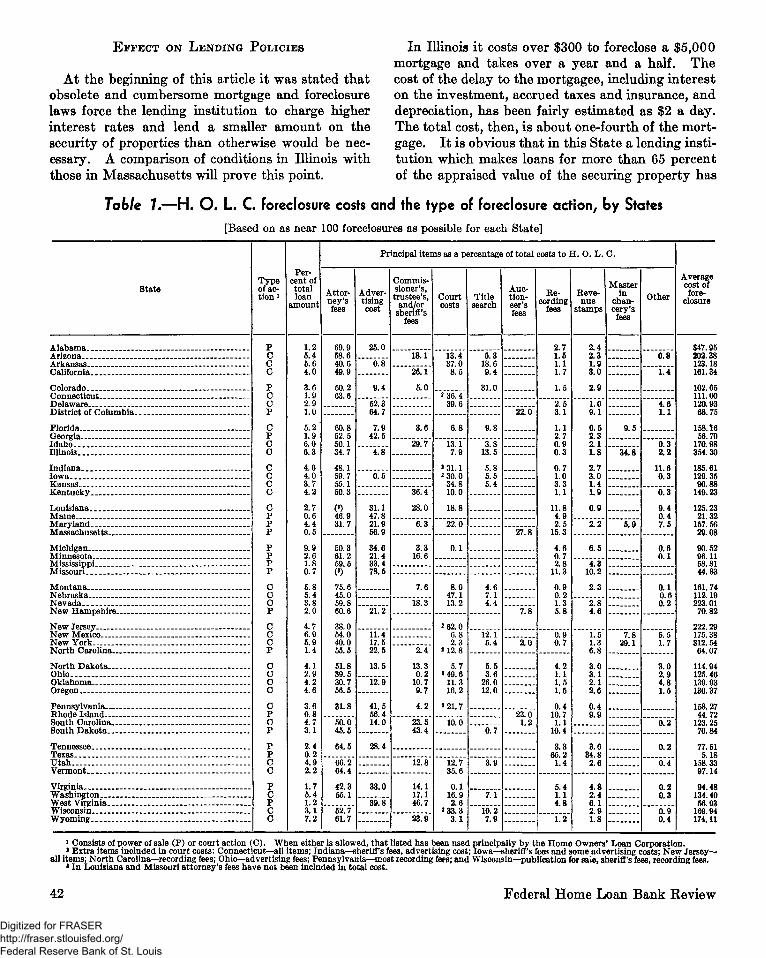
In Texas, the State of shortest time and lowest cost, 21 days of advertisement are required before sale, the total average time being 22 days and the total cost $5.18. Table 1 shows that this cost consists of recording fees and revenue stamps but does not include attorney's fees as foreclosures are handled by H. O. L. C. salaried personnel. To advertise, the only requirement is that notice of foreclosure be posted in three public places.
In Table 1 the principal items involved in foreclosure costs are shown as percentages of the total cost of all foreclosures to the Corporation rather than as percentages of the average cost. I t was impossible to show percentages of the average cost because all the foreclosures within a State did not always include the same items. Thus, in New York only 23 percent of the total sample included costs for auctioneer's fees or trustee's fees because in the upstate districts no such fees are charged.
November 1937 41
Digitized for FRASER http://fraser.stlouisfed.org/ Federal Reserve Bank of St. Louis
EFFECT ON LENDING POLICIES
At the beginning of this article it was stated that obsolete and cumbersome mortgage and foreclosure laws force the lending institution to charge higher interest rates and lend a smaller amount on the security of properties than otherwise would be necessary. A comparison of conditions in Illinois with those in Massachusetts will prove this point.
In Illinois it costs over $300 to foreclose a $5,000 mortgage and takes over a year and a half. The cost of the delay to the mortgagee, including interest on the investment, accrued taxes and insurance, and depreciation, has been fairly estimated as $2 a day. The total cost, then, is about one-fourth of the mortgage. It is obvious that in this State a lending institution which makes loans for more than 65 percent of the appraised value of the securing property has
Table 1.—H. O. L. C. foreclosure costs and the type of foreclosure action, by States
[Based on as near 100 foreclosures as possible for each State]
State
Alabama. Arizona -Arkansas California _ _ -
Colorado Connecticut . Delaware. District of Columbia.
Florida Georgia Idaho Illinois _ _ _
Indiana.. Iowa. Kansas _. . . Kentucky
Louisiana Maine Maryland Massachusetts
Michigan Minnesota Mississippi Missouri.
Montana Nebraska Nevada . New Hampshire
New Jersey
New York— North Carolina
North Dakota Ohio Oklahoma Oregon
Pennsylvania Rhode Island South Carolina South Dakota
Tennessee Texas Utah Vermont
Virginia Washington West Virginia Wisconsin Wyoming
Type of act ion1
P C C C
P C C P
C P c c c c c c c p p p
p p p p
c c c p
c c c p
c c c 0 c p c p
p p c 0
1 p c p c 0
Percent of total loan
amount
1.2 5.4 5.6 4.0
3.6 1.9 2.9 1.0
5.2" 1.9 6.0 6.3
4.6 4.0 3.7 4.2
2.7 0.6 4.4 0.5
9.9 2.6 1.8 0.7
5.8 5.4 3.8 2.0
4.7 6.9 5.9 1.4
4.1 2.9 4.2 4.6
3.6 0.8 4.7 3.1
2.4 0.2 4.9 2.2
1.7 5.4 1.2 3.1 7.2
Principal items as a percentage of total costs to H. 0 . L. O.
Attorney's fees
69.9 58.6 40.6 49.9
50.2 63.6
60.8 52.5 50.1 34.7
48.1 59.7 55.1 50.3
(3) 46.9 31.7
50.3 61.2 59.5 (3) 75.6 45.0 59.8
| 60.6
38.0 54.0 40.0 55.5
51.8 39.5 30.7 56.5
31.8
50.0 45.5
64.5
66.2 64.4
42.3 55.1
52.7 61.7
Advertising cost
25.0
0.8
9.4
52.3 64.7
7.9 42.5
4.8
0.5
31.1 47.8 21.9 56.9
34.6 21.4 33.4 78.5
21.2
11.4 17.5 22.5
13.5
12.9
41.5 56.4 14.0
28.4
33.0
39.8
Commissioner's, trustee's,
and/or sheriff's
fees
18.1
26.1
5.0
3.6
29.7
36.4
28.0
6.3
3.3 16.6
7.6
18.3
2.4
13.3 0.2
10.7 9.7
4.2
23.5 43.4
12.8
14.1 17.1 46.7
23.9
Court costs
13.4 37.0 8.5
2 36.4 39.6
6.8
13.1 7.9
2 31.1 2 30.0
34.8 10.0
18.8
22.0
0.1
8.9 47.1 13.2
2 62.0 6.8 2.3
2 12.8
5.7 2 49.6
11.3 16.2
2 21.7
10.0
12.7 35.6
! o.i 16.9 2.6
> 33.3 3.1
Title search
5.3 18.6 9.4
31.0
9.8
3.8 13.5
5.8 5.5 5.4
4.6 7.1 4.4
12.1 5.4
5.5 3.6
26.0 12.0
0.7
3.9
7.1
10.2 7.9
Auction- ! eer's fees
22.0
27.8
7.8
2.0
1 23.0 1.2
Recording
fees
2.7 1.5 1.1 1.7
1.5
2.5 3.1
1.1 2.7 0.9 0.3
0.7 1.0 3.3 1.1
11.8 4.9 2.5
15.3
4.6 0.7 2.8
11.3
0.9 0.2 1.3 5.8
0.9 0.7
4.2 1.1 1.5 1.5
0.4 10.7 1.1
10.4
3.3 65.2 1.4
5.4 1.1 4.8
1.2
Revenue
stamps
2.4 2.3 1.9 3.0
2.9
| 1.0 9.1
0.5 2.3 2.1 1.8
2.7 3.0 1.4 1.9
0.9
2.2
6.5
4.3 10.2
2.3
| 2.8 4.6
1.5 1.3 6.8
3.0 3.1 2.1 2.6
0.4 9.9
1 3.6 ! 34.8
2.6
4.8 2.4 6.1 2.9 1.8
Master in
chancery's
fees
9.5
34.8
5.9
7.8 ; 29.1
Other
0.8
1.4
4.6 1.1
0.3 2.2
11.6 0.3
0.3
9.4 0.4 7.5
0.6 0.1
0.1 0.6 0.2
5.5 1.7
3.0 2.9 4.8 1.5
0.2
0.2
0.4
0.2 0.3
0.9 0.4
Average cost of fore
closure
$47.95 202.38 123.18 161.34
102.65 111.00 120.93 68.75
158.16 56.70
170.98 354.30
185.61 129.35 90.88
149.23
125.23 21.32
157.56 29.08
90.52 96.11 58.81 44.83
161.74 112.19 223.01 70.82
222.29 175.38 312.54 64.07
114.94 125.46 139.93 130.37
158.27 44.72
123.25 70.84
77.51 5.18
158.33 97.14
94.48 134.40 56.93
169 94 174.11
1 Consists of power of sale (P) or court action (C). When either is allowed, that listed has been used principally by the Home Owners' Loan Corporation. 2 Extra items included in court costs: Connecticut—all items; Indiana—sheriff's fees, advertising cost; Iowa—sheriff's fees and some advertising costs; New Jersey-
all items; North Carolina—recording fees; Ohio—advertising fees; Pennsylvania—most recording fees; and Wisconsin—publication for sale, sheriff's fees, recording fees. * In Louisiana and Missouri attorney's fees have not been included in total cost.
42 Federal Home Loan Bank Keview
Digitized for FRASER http://fraser.stlouisfed.org/ Federal Reserve Bank of St. Louis
FORECLOSURES: AVERAGE TIME REQUIRED TO COMPLETE COMPARED WITH AVERAGE COST, BASED ON H.O.L.C. EXPERIENCE
25 20 imZ(,) MONTHS
15 10 COST® DOLLARS
100 200 300 400
ALABAMA
ARIZONA I
ARKANSAS j
CALIFORNIA
.COLORADO
....CONNECTICUT j
.DELAWARE
.DIST. OF COLUMBIA.
.FLORIDA |
JGEORGIA.
IDAHO j
.ILLINOIS
INDIANA
IOWA
KANSAS
KENTUCKY
. .LOUISIANA I
.MAINE j
MARYLAND
..MASSACHUSETTS'..!
MICHIGAN
MINNESOTA j
. MISSISSIPPI
MISSOURI
MONTANA
NEBRASKA
NEVADA
..NEW HAMPSHIRE-
. . . -NEW JERSEY—.
NEW MEXICO-
NEW YORK
NORTH CAROLINA
„.NORTH DAKOTA...
OHIO- _ .
OKLAHOMA
OREGON
...PENNSYLVANIA.—
-RHODE I S L A N D - .
SOUTH CAROLINA
-SOUTH DAKOTA..
. T E N N E S S E E ™
.TEXAS
UTAH
-VERMONT
VIRGINIA
—WASHINGTON
- W E S T VIRGINIA-
.WISCONSIN
.WYOMING
i In case of foreclosure in court, the time has been computed from the date of the filing of the petition to foreclose to the date of acquisition of title, free of all rights of redemption.
In case of foreclosure under power of sale contained in the mortgage or deed of trust, the time'has been computed from the date of the first publication of notice of sale or of intention to foreclose, where such is required, toth e date of acquisition of title, free of all rights of redemption.
3 Costs do not include salaried personnel; in both Texas and Massachusetts salaried attorneys handle foreclosure.
November 1937 43
Digitized for FRASER http://fraser.stlouisfed.org/ Federal Reserve Bank of St. Louis
inadequate protection. It is also obvious that a delinquent borrower cannot be carried when his accumulated taxes, interest, insurance, and other carrying charges have increased the total debt to over three-fourths of value of the security.
Compare these conditions with those in Massachusetts where it costs about $30 to foreclose a $5,000 mortgage and takes only two months. The total cost, including cost of delay, amounts to only 3 percent of the mortgage.
Considering this cost, it is not surprising that mortgage-lending institutions in Massachusetts have for many years been making loans up to 80 percent of value. Quite simply, they can afford to.
Such samples taken from the 48 different State laws emphasize the importance of the work of the Sub-Committee on Laws and Legislation of the Central Housing Committee in drafting a uniform mortgage and foreclosure law. It has been their job to provide a form which would eliminate the evils and inconsistencies now affecting lending activity.
THE UNIFOBM STATUTOEY MORTGAGE
The proposed uniform law provides for the use of a statutory short mortgage form of about 160 words in length. A longer form has been avoided by the simple expedient of mentioning the various covenants in the mortgage form by word only and then defining these covenants at length in the act itself. In this way the rights of both the mortgagor and the mortgagee are protected without incurring high recording costs. Covenants and conditions other than those contained in this statutory mortgage form may be inserted in it by simply marking them "nonstatutory".
This short form compares very favorably with the average mortgage or deed of trust forms now in use in the various States which contain from 1,000 to 4,000 words. The recording fees for such lengthy documents run from $4 to $10. Since these instruments are required to be recorded in order that they may be valid against purchasers, subsequent lienors, and judgment creditors, and since the fee for recording varies according to the number of words in the instrument, the mortgagor who bears the cost of recording is unduly penalized.
The enactment of the uniform mortgage and foreclosure act by a State, and the use by mortgage-lending institutions of this statutory short form of mortgage would, therefore, reduce the recording costs
borne by mortgagors, cut down legal costs of drafting such instruments, facilitate the placing and handling of mortgage loans by mortgage-lending institutions, and reduce the cost to the public in providing fireproof space for records.
UNIFORM FORECLOSURE
The uniform act further provides for a simple, inexpensive method of foreclosure by power of sale, with provision for court confirmation, if the mortgagee so desires, or for court action following a mortgagor's petition for injunction to restrain the foreclosure by power of sale. Provision is also made for a court action to rescind the sale upon a showing of fraud or of failure to comply with the foreclosure procedure outlined in the act.
It has been estimated that $4 out of every $5 spent for foreclosure in New York is a kind of "legalized waste", and that mortagees in that State, in order to comply with the established foreclosure procedure, have been forced to waste at least $40,000,000 in useless foreclosure costs during the past four years.
It is believed that the adoption of the Sub-Committee's uniform act, with its simple, inexpensive foreclosure procedure, would reduce such costs by at least half in most of the States.
REDEMPTION PERIOD
A redemption period of only 30 days, after the sale of the property, has been provided. But in addition a statutory notice of foreclosure must be recorded at least 90 days prior to the date of sale. I t is thought that the four months' period, which will usually be required for foreclosure under the act, will, therefore, be sufficient to afford ample protection to the mortgagor and to enable him to redeem if he desires and is able to do so.
Present statutes which impose a long period of redemption before title and possession can be obtained have a tendency to lower the maximum loanable value of property throughout the jurisdiction since during that period foreclosed property is rendered practically unmarketable; may suffer serious damage or depreciation; and presents in a high degree a type of frozen asset. Prospective lenders naturally take into account the procedure available for realizing the debt out of the security when determining the terms upon which they are willing to lend.
44 Federal Home Loan Bank Review
Digitized for FRASER http://fraser.stlouisfed.org/ Federal Reserve Bank of St. Louis
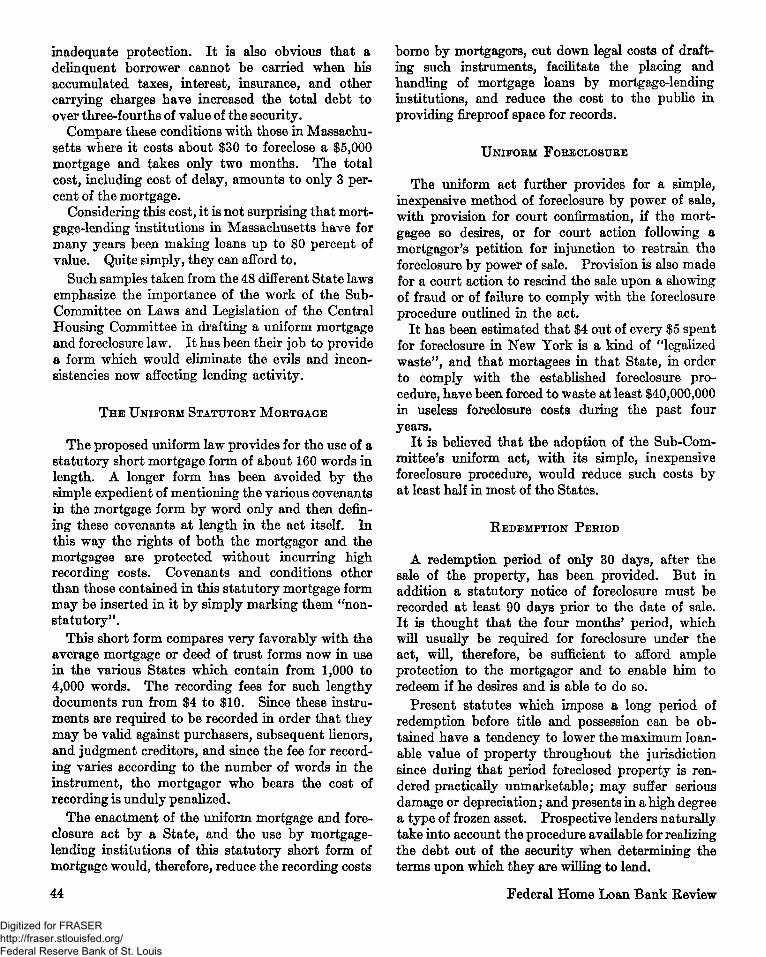
DEFICIENCY JUDGMENTS
To obtain a deficiency judgment under the uniform act, the mortgagee must seek his deficiency judgment in court either in connection with a petition for the confirmation of the sale, as a cross bill in an action to rescind the sale, or by a proceeding on the obligation held by the mortgagee; and prove that, at the time of sale, the property was sold for its fair market value, and at that time, the sale price was not sufficient to satisfy the debt. The court is left to determine the fair value of the mortgaged premises at the time of sale and allow as a deficiency judgment the difference between such value and the amount of the debt, or, if at the sale the premises brought an amount larger than that determined by the Judge to be the fair market value, then the difference between the amount so obtained at the foreclosure sale and the amount of the debt. Such a procedure will not only protect mortgagors against unconscionable deficiency judgments but also fully protectJJbe interest of the mortgagee.
In addition to those listed, many other new features have been included in the act which will reduce the cost and facilitate mortgage lending. For instance, provision is made for future advances by the mortgagee to the mortgagor without the necessity of the execution of a new mortgage, eliminating at once the costly and unnecessary procedure involved in rewriting a mortgage every time the total debt as written on the face of the mortgage is changed. Now that lending institutions are making loans for increasingly long periods, such a provision is imperative. It permits the mortgagor to borrow small sums for repairs and maintenance without unduly penalizing either him or the mortgagee.
Savings and loan associations which are operating under the more unjust of the real-estate and foreclosure laws will recognize the value of this new instrument which has been fashioned for their benefit. Its adoption by all States will assist in making home ownership available to a great many more citizens, and will permit more equitable relations between the mortgage-lending institution and the borrower.
Table 2.—Average time required to complete H. O. L C foreclosures * [Based on as near 100 foreclosures as possible for each State]
State
Alabama Arizona
Arkansas
California Colorado Connecticut Delaware District of Colum
bia Florida Georgia Idaho -
Indiana Iowa
Kansas
Kentucky
Louisiana Maine Maryland
Massachusetts
Michigan
Total time
Months
25 8
5
14 7 4 3
1 3 0
15 19 14 15
11
6
4 12 1
2
15
Days
3 27
4
26 18 4
12
3 22 27 1
16 0
14
14
3
11 25 11
6
1
Period of re
demption*
Months
24 6
12 6
0
o o 0 1
12 15 12 12
12 0
Explanation
(Redemption period of 12 months •j permitted but waived in H. 0 . 1 L. 0 . mortgages.
/Debtor has 12 month* for redemp-\ tion; creditors, additional 3 months.
(Redemption period may be 6 or 18 < months depending on type and [ status of mortgage. (If sale does not bring H of appraised < value, mortgagor may have 12 I months redemption.
[Total time refers from date of dispatch to State Counsel. No re-
1 demption after foreclosure by sale; j a 3-year redemption after foreclo
sure by entry. Latter rarely used I b y H . 0 . L. 0 . (6 months redemption if foreclosure { by court action; 12 months if by ( advertisement.
State
Minnesota Mississippi
Missouri
Montana Nebraska Nevada New Hampshire
New Mexico New York North Carolina.. . North Dakota Ohio
Oregon Pennsylvania Rhode Island South Carolina South Dakota
Tennessee
Texas Utah
Vermont
Virginia
West Virginia Wisconsin
Wyoming
Total time
Months
13 1
1
15 5
15 1 4
13 3 1
16 3 9
15 1 2 2
13
1
0 14
8
0 16 1
16
15
Days
25 24
16
2 26 12 27 21 0
17 16 4
24 20 10 19 10 28 25
11
22 23
27
8 6 6 0
1
Period of re
demption*
Months
12 0
12 0)
12 0 0 9 0 0
12 0 6
12 0 0 0
12
0 6
0 12 0
12
9
Explanation
(Written notice by mortgagor at sale < or 10 days before, gives him 12 I months redemption following sale.
(Redemption period of 12 months per-•j mitted but waived in H. 0 . L. 0 . I deeds of trust.
(Redemption period is 12 months but \ Chancellor may shorten if security i is insufficient.
/Debtor has 6 months for redemption; \ creditors 9 months.
* See footnote 1 of chart. • "Redemption period" is generally defined as the period from date of foreclosure sale until final acquisiton of title during which the mortgagor may redeem the
property. In four States the statutory time allowed the mortgagor is not strictly a redemption period but is often described as such. The provisions in these States are: In Indiana 12 months from date of filing foreclosure petition until date of sale. In Wisconsin one year from date of judgment to date of sale. In Oklahoma 6 months from date of judgment to date of sale. In Nebraska 9 months (at request of mortgagor) from date of judgment to date of sale.
November 1937 45
Digitized for FRASER http://fraser.stlouisfed.org/ Federal Reserve Bank of St. Louis

ZONING
AND
PLANNING
PROGRESS
• THE home owner in an exclusive residential neighborhood is often protected against fluctua
tions in property values by restrictions which the private developers who planned the subdivision imposed on him and his neighbors. This kind of restriction gives the institution which finances his home added security, which it especially needs if it makes long-term loans. To extend a similar kind of security to other than the more expensive developments, and thereby to stabilize home financing for a greater number of families, is one of the aims of community planning and zoning.
Although private restrictions give a type of protection which zoning cannot give, they sometimes fail to be as effective. For example, a Pacific Coast city neglected to adopt zoning ordinances because much of its residential property was protected by comprehensive private restrictions. But during the depression the State took many houses for tax delinquency, and re-sold them without restrictions. A zoning ordinance, adopted in accordance with a State enabling act, would have remained in force in spite of this procedure and the protection to neighborhood home owners would have remained in effect.
Kecent data collected by the National Resources Committee indicate that city planning has made considerable progress during the past three years. The total number of zoning ordinances increased from 1,244 at the beginning of 1934 to 1,322 on January 1, 1937. The total number of cities with comprehensive ordinances was 954, and those with less extensive ordinances numbered 368. Zoning progress during the past three years has thus been effected by improvement and consolidation of regulations rather than the drafting of new ordinances.
It is especially desirable that zoning ordinances
46
be drafted to suit the needs of each particular city, and enforced and revised by a competent bpdy. For this reason, it is encouraging to learn that the number of planning and zoning commissions is growing. At the beginning of 1937 there were 933 official city planning commissions or boards, 140 unofficial or other planning boards, and 128 boards with powers restricted to zoning. Early in 1934 there were 717 official planning bodies, 22 unofficial boards, and 30 boards with powers restricted to zoning. A number of these commissions, unfortunately, have only a nominal existence and very few have adequate budgets. Their proper function of adapting their communities' plans to changing population trends and economic conditions is considerably handicapped by this lack of funds and many zoning ordinances need revision to bring them in line with modern conditions.
In spite of handicaps resulting from lack of local support, the number of planning commissions with control over subdivision development has grown steadily. In addition to the 198 commissions with advisory powers, there are now 275 which exercise mandatory control over subdivision development, usually by their power to keep developments of which they disapprove from being recorded on the plats. Such control in most cases is extended to the area within three to six miles of the city limits.
The development of planning bodies including in their jurisdiction counties or whole metropolitan areas has been especially striking during the past three years. In 1934 only 85 such agencies, including unofficial boards, existed. At the beginning of 1937 there were 316 official and 171 unofficial boards of this kind, in addition to 13 zoning boards operating in entire districts or metropolitan areas. This type of commission, operating in an area broader than that of a city corporation, is particularly useful in those metropolitan areas where single urban economic units extend over several municipalities.
The number of communities with comprehensive city plans has grown during the past three years. There are now 136 which have officially adopted comprehensive plans and 141 in which such plans have been approved by the planning boards.
The arguments for more effective planning and zoning were summarized in a statement published this year by the Construction and Civic Development Department Committee of the Chamber of Commerce of the United States. In a statement on "The Balanced Rebuilding of Cities", the Committee cited the lack of a constructive land policy, including
Federal Home horn Bmk Review
Digitized for FRASER http://fraser.stlouisfed.org/ Federal Reserve Bank of St. Louis
zoning and housing regulations, as one of the major causes of five trends which damage residential areas: the withdrawal of population to the suburbs, the emergence of large blighted districts, the depreciation of property values, the impairment of the city's tax structure, and the increased costs for police, fire, and welfare services in* the worst of the run-down areas. The security of mortgage investments and of the savings of millions of citizens depends to a great extent, the statement argues, on the protection of the city's economic structure from these trends.
To provide such protection and to maintain a proper control of the development of a city, the statement recommends a well-rounded civic program. This program includes a study of the city and its future land use needs, the revision of its plan and its zoning ordinances, and the gradual elimination of all inappropriate uses of land, with particular reference to improvement of residential areas. Strict control of all new land subdivision, on the basis of determination of the most desirable distribution and density of population and of the total housing needs for all income groups of the population, is advocated. In addition to these planning recommendations, the statement proposes revision of the building and housing codes and of the tax structure, the enactment of a minimum bousing standards ordinance, and the building or rebuilding of neighborhood units as completely planned communities.
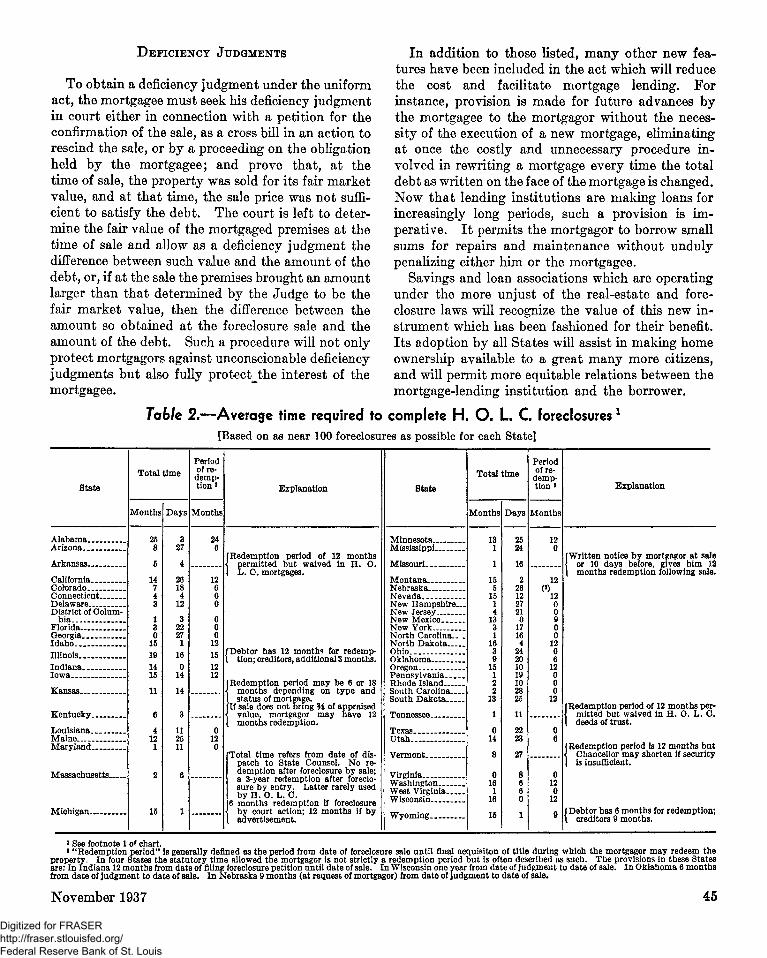
Cooperation:
A Means of Lowering
Construction Costs
• NEARLY everyone is aware of the unfavorable comparison the cost of house construction
makes with the cost of manufacture of most other high-priced consumer goods. The automobile is a favorite example. I t is a complicated machine that depends for its efficiency on a most careful adjustment of its parts and yet its cost is reasonable. The cost of the average house cannot compare with it.
I t is easily argued that such a comparison is invalid and yet one does not have far to look for evidences of waste and inefficiencies in construction. But it is significant that they are found not so much
in the size of contractual units as in the lack of coordination between those units. Thus, the agencies for designing, financing, manufacturing materials, and for actual construction have no common technique for cooperation. England, through the Building Industries National Council, is far ahead of us in this respect. Among other things, this Council provides for the training of craftsmen by cooperation with labor groups, and the standardization of materials, equipment, and building codes.
One of the most important technological advances in manufacturing was the standardization of parts. Mass production would be impossible without it, and yet it is necessary only to look over a large material dealer's list of stock or to compare lumber sizes in one area with those in another to see that this earliest of improvements in technics has not found its way into construction.
To eliminate the least used shapes and sizes and to standardize the remainder, it is necessary to have the full cooperation of the design element in the construction industry. Such standardization would reduce the material dealer's overhead and risk, and the contractor would benefit by an assurance of prompt delivery as the material dealer could afford to carry a complete stock. Also, many of the mechanical difficulties of manufacture of materials would be eliminated.
But so long as any designers demand the odd sizes they will be carried. I t is only by the cooperation of all the agencies concerned with residential construction that costs can be lowered and the quality of construction maintained. If these two ends were achieved the market for houses would be measurably increased with obvious benefits to all.
The Federal Home Loan Bank Board early recognized the necessity for advance in this direction. I t was evident that one factor retarding maximum lending terms by financing institutions was the lack of standards of construction and lack of enduring design in the small house. As a corrective, the cooperation of the architects, financing agencies, and builders has been enlisted under the Federal Home Building Service Plan.
I t was also evident that the services such cooperation would make possible could best be provided through local groups. Residential construction is fundamentally a local operation; the proper function of a national organization therefore would be to assist in creating a widespread adoption of cooperative effort and to set a national standard of construction for the certification of local work.
November 1937 20556—37 2
47
Digitized for FRASER http://fraser.stlouisfed.org/ Federal Reserve Bank of St. Louis
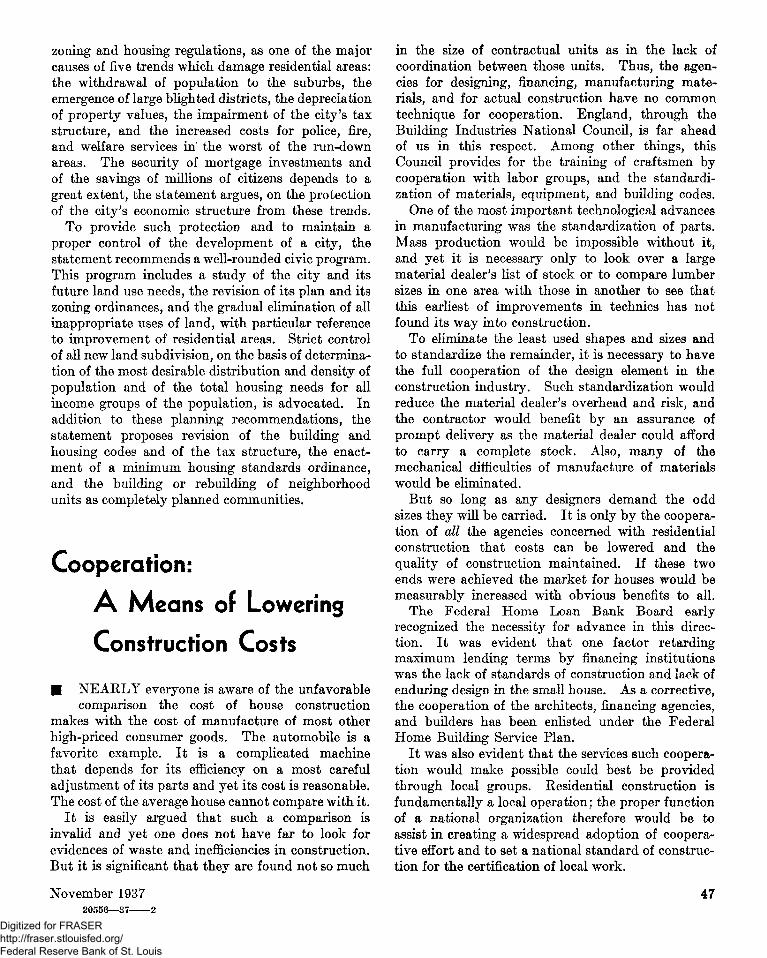
INTEREST RATES Variations in interest rates are reflected in the rates reported by
Federal savings and loan associations. These variations have a defi~
nite effect on the lending policy of the individual institution.
• ONE of the most striking characteristics of interest rates on long-term urban mortgage
loans is their lack of uniformity. Not only does the rate vary between institutions within a particular locality, but the predominating rate in one State may be quite different from that in another. Also, there are variations between whole areas; the East, for example, has generally lower rates than the South or West. And last, the vague level of rates for the whole country may vary from decade to decade.
The very complexity of the factors which cause these variations justifies them to some extent. The effective interest rate on a long-term mortgage loan involves more than simple interest. The mortgage-lending institution must charge for the services it provides; it must also charge for the risk it assumes. If it is a savings and loan association, it is mainly dependent on the savings of individuals within its community which tends in some localities to limit the available supply of money.
Thus, in the West, funds for permanent investment are scarce because there has always been a heavier demand for financing than the savings of local people have been able to meet. Such a condition usually accompanies the early expansion of a country. In contrast, communities in the East have available the accumulated savings of several generations of settled people without a proportionate demand for their use. Consequently, these savings cost the mortgage-lending institution less in the East than in the West. Also, service charges may well be lower in the East because the properties to be appraised and then financed are more centrally located.
Another situation may arise where one association charges a much lower rate than another providing similar services because it is located in a community where population trends, local ordinances, neighborhood character, and many other factors all contribute to a greater stability.
Also, the wide variations in State laws tend to affect mortgage interest rates. High foreclosure costs and unnecessarily complicated statutory mortgages increase the cost of lending operations.
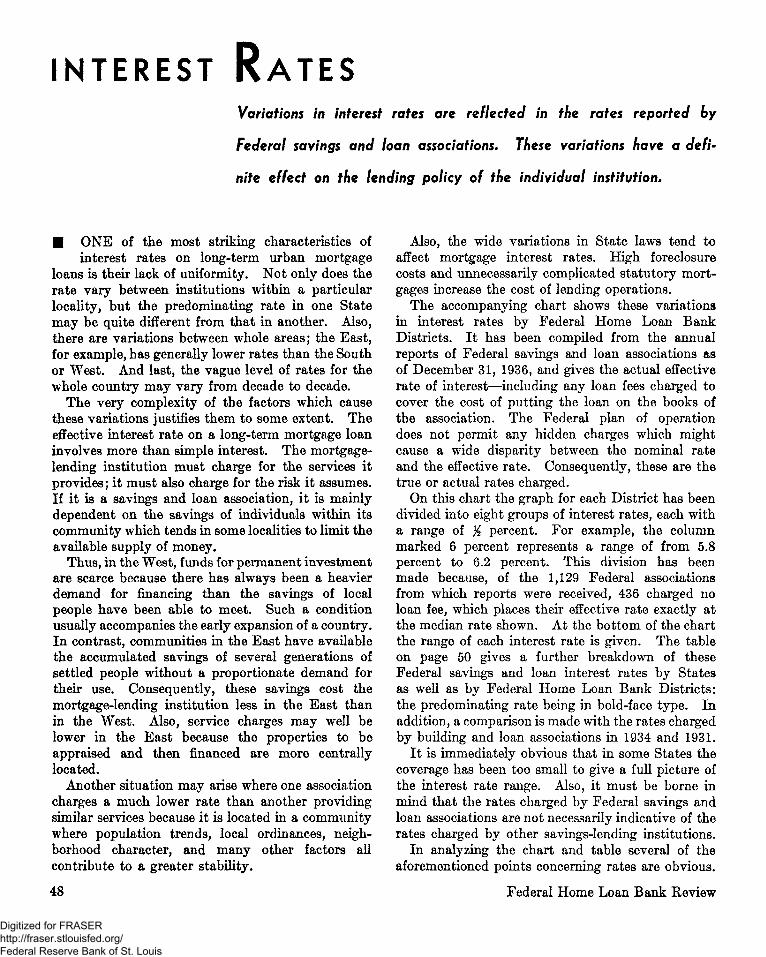
The accompanying chart shows these variations in interest rates by Federal Home Loan Bank Districts. It has been compiled from the annual reports of Federal savings and loan associations as of December 31, 1936, and gives the actual effective rate of interest—including any loan fees charged to cover the cost of putting the loan on the books of the association. The Federal plan of operation does not permit any hidden charges which might cause a wide disparity between the nominal rate and the effective rate. Consequently, these are the true or actual rates charged.
On this chart the graph for each District has been divided into eight groups of interest rates, each with a range of y2 percent. For example, the column marked 6 percent represents a range of from 5.8 percent to 6.2 percent. This division has been made because, of the 1,129 Federal associations from which reports were received, 436 charged no loan fee, which places their effective rate exactly at the median rate shown. At the bottom of the chart the range of each interest rate is given. The table on page 50 gives a further breakdown of these Federal savings and loan interest rates by States as well as by Federal Home Loan Bank Districts: the predominating rate being in bold-face type. In addition, a comparison is made with the rates charged by building and loan associations in 1934 and 1931.
It is immediately obvious that in some States the coverage has been too small to give a full picture of the interest rate range. Also, it must be borne in mind that the rates charged by Federal savings and loan associations are not necessarily indicative of the rates charged by other savings-lending institutions.
In analyzing the chart and table several of the aforementioned points concerning rates are obvious.
48 Federal Home Loan Bank Review
Digitized for FRASER http://fraser.stlouisfed.org/ Federal Reserve Bank of St. Louis
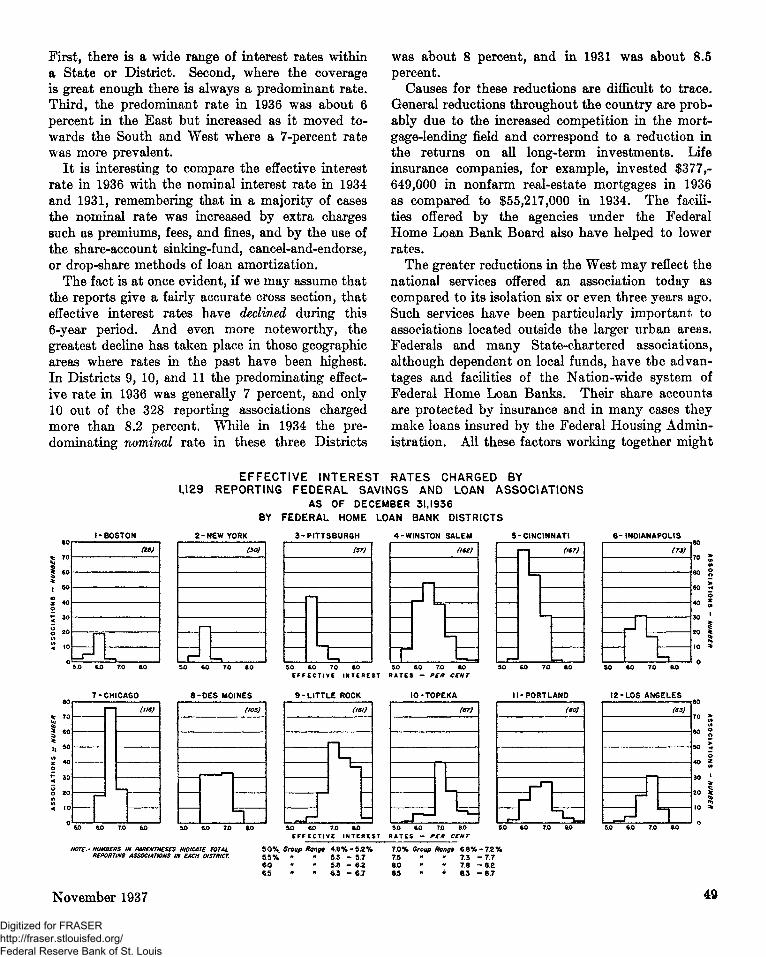
First, there is a wide range of interest rates within a State or District. Second, where the coverage is great enough there is always a predominant rate. Third, the predominant rate in 1936 was about 6 percent in the East but increased as it moved towards the South and West where a 7-percent rate was more prevalent.
It is interesting to compare the effective interest rate in 1936 with the nominal interest rate in 1934 and 1931, remembering that in a majority of cases the nominal rate was increased by extra charges such as premiums, fees, and fines, and by the use of the share-account sinking-fund, cancel-and-endorse, or drop-share methods of loan amortization.
The fact is at once evident, if we may assume that the reports give a fairly accurate cross section, that effective interest rates have declined during this 6-year period. And even more noteworthy, the greatest decline has taken place in those geographic areas where rates in the past have been highest. In Districts 9, 10, and 11 the predominating effective rate in 1936 was generally 7 percent, and only 10 out of the 328 reporting associations charged more than 8.2 percent. While in 1934 the predominating nominal rate in these three Districts
was about 8 percent, and in 1931 was about 8.5 percent.
Causes for these reductions are difficult to trace. General reductions throughout the country are probably due to the increased competition in the mortgage-lending field and correspond to a reduction in the returns on all long-term investments. Life insurance companies, for example, invested $377,-649,000 in nonfarm real-estate mortgages in 1936 as compared to $55,217,000 in 1934. The facilities offered by the agencies under the Federal Home Loan Bank Board also have helped to lower rates.
The greater reductions in the West may reflect the national services offered an association today as compared to its isolation six or even three years ago. Such services have been particularly important to associations located outside the larger urban areas. Federals and many State-chartered associations, although dependent on local funds, have tbe advantages and facilities of the Nation-wide system of Federal Home Loan Banks. Their share accounts are protected by insurance and in many cases they make loans insured by the Federal Housing Administration. All these factors working together might
EFFECTIVE INTEREST RATES CHARGED BY 1,129 REPORTING FEDERAL SAVINGS AND LOAN ASSOCIATIONS
AS OF DECEMBER 31,1936 BY FEDERAL HOME LOAN BANK DISTRICTS
1-BOSTON 2-NEW YORK
»») (30)
3 - PITTSBURGH
(57)
xzJ
4-WINSTON SALEM 5-CINCINNATI 6 - INDIANAPOLIS
062)
trt L r—'
067) (73)
zn
80
50 ? o
50 *
20 $
5.0 6 0 70 aO SO 6.0 7.0 00 EFFECTIVE INTEREST RATES - PER CENT
so co 7JO ao
7-CHICAGO S-OES MOINES 9-LITTLE ROCK 10-TOPEKA II-PORTLAND 12-LOS ANGELES
(116) |
50 6© 70 60 n
060
N "»d ! <97> (80)
50 60 7.0 60 5.0 60 7J0 60 EFFECTIVE INTEREST RATES - PER CENT
5.0 60 7.0 60
NOTE.- NUMBERS IN PARENTHESES INDICATE TOTAL REPORTING ASSOCIATIONS IN EACH DISTRICT.
5.0% Group Rang* 4.8% - 5.2% 55% - «• 5.3 - 5.7 6J0 5 8 - 6.2 65 6 3 - 6 7
7.0% Group Rang* 6 8%-7.2% 7.5 - • 7.3 - 7 . 7 8.0 - - 7.8 - 8 . 2 85 « • 8.3 - 8 . 7
November 1937 49
Digitized for FRASER http://fraser.stlouisfed.org/ Federal Reserve Bank of St. Louis
be expected to reduce both the risk and the cost of servicing.
I t is, however, too short a period and one too much influenced by what we hope are extraordinary economic conditions to draw final conclusions as to the full value of these national institutions in effecting more equitable interest rates. Neither is it reasonable to assume that the mere reduction in rates is in itself a valuable change. Mortgage-lending institutions must preserve a rate which will allow for the cost of operations, reserves, and a sufficient dividend rate to attract funds. If they do not, they will be treading on dangerous ground which may lead to trouble in a future period of economic difficulties.
T H E INDIVIDUAL INSTITUTION
If we could take the Federal rate chart on page 49 and extend the range of interest rates both downward and upward to include other types of mortgage lenders such as insurance companies, banks, investment companies, and individuals, we would have the
complete picture of long-term mortgage interest rates. Then, where does the individual savings and loan association with its single interest charge find itself in this maze of different rates and different services?
The answer, if the institution is actively participating in the business of its community, will probably be that it is "spotted" somewhere between the two extremes, presumably near the predominant rate for the locality.
This "spot" position of the institution has definite consequences. I t means that the association is offering only one class of goods (a set interest rate) in competition with a wide variety of goods, some worse and some probably better. If purchasers were all of one class this position might very well be the best one, but in the mortgage-lending field they are obviously not. Of course, the predominant rate will apply to the large middle class of borrowers but this puts the institution in a position with two unfortunate consequences. First, it loses the very
{Continued on 'page 70)
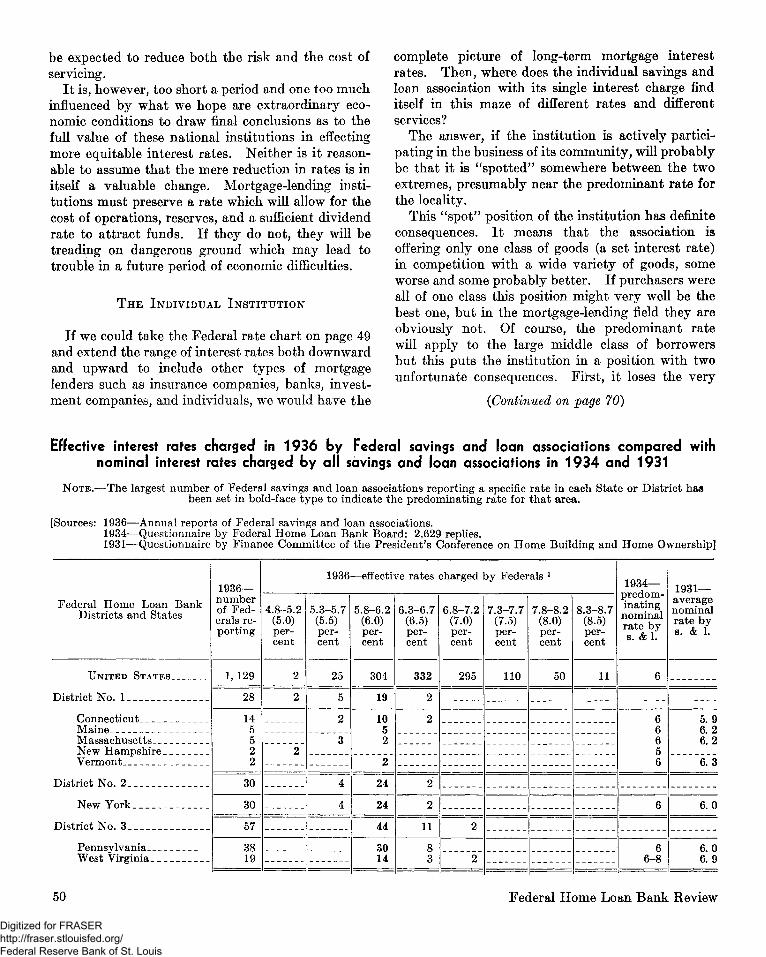
Effective interest rates charged in 1936 by Federal savings and loan associations compared with nominal interest rates charged by all savings and loan associations in 1934 and 1931
NOTE.—The largest number of Federal savings and loan associations reporting a specific rate in each State or District has been set in bold-face type to indicate the predominating rate for that area.
[Sources: 1936—Annual reports of Federal savings and loan associations. 1934—Questionnaire by Federal Home Loan Bank Board: 2,629 replies. 1931—Questionnaire by Finance Committee of the President's Conference on Home Building and Home Ownership]
Federal Home Loan Bank Districts and States
UNITED STATES _ __
District No. 1 _ _ _ _
Connecticut Maine _ __ Massachusetts __ New Hampshire _ Vermont _
District No. 2
New York
District No. 3
Pennsylvania __ West Virginia
1936— number of Federals reporting
1, 129
28
14 5 5 2 2
30
30
57
38 19
1936—effective rates charged by Federals l
4.8-5.2 (5.0) percent
2
2
2
5.3-5.7 (5.5) percent
25
5
2
3
4
4
5.8-6.2 (6.0) percent
304
19
10 5 2
2
24
24
44
30 14
6.3-6.7 (6.5) percent
332
2
2
2
2
11
8 3
6.8-7.2 (7.0) percent
295
2
2
7.3-7.7 (7.5) percent
110
7.8-8.2 (8.0) percent
50
8.3-8.7 (8.5) percent
11
1934— predominating nominal rate by s. &1.
6
6 6 6 5 6
6
6 6-8
1931— average nominal rate by s. & 1.
5. 9 6. 2 6.2
6. 3
6.0
6. 0 6. 9
50 Federal Home Loan Bank Eeview
Digitized for FRASER http://fraser.stlouisfed.org/ Federal Reserve Bank of St. Louis
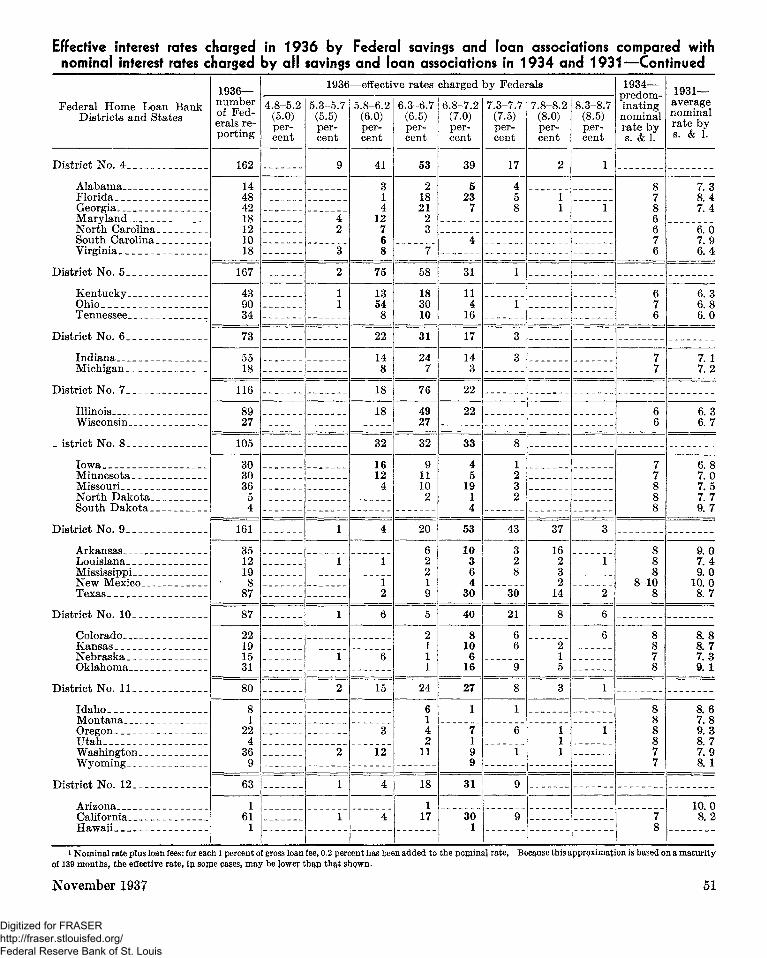
Effective interest rates charged in 1936 by Federal savings and loan associations compared with nominal interest rates charged by all savings and loan associations in 1934 and 1931—Continued
Federal Home Loan Bank Districts and States
District No. 4__
Alabama Florida _ Georgia. Maryland _ Nor th Carolina South Carolina Virginia
District No. 5__ _
Kentucky _ __ Ohio _> __ _ Tennessee _ _
District No. 6__
Indiana __ __ _ Michigan . _
District No. 7__ _
Illinois . Wisconsin _ _
- istrict No. 8
Iowa Minnesota Missouri._ __ _ Nor th Dako ta _ __ South D a k o t a . _ __
District No. 9___ _ __ ___
Arkansas , . __ Louisiana. _ __ Mississippi _ _ New Mexico __ Texas
District No. 10 _
Colorado Kansas Nebraska ._ _ _ __ Oklahoma
Distr ict No. 11 _ .
Idaho _» _ Montana Oregon. _ Utah __ Washington. . . . _ _ Wyoming _ _ _ _
District No. 12
Arizona _ . California Hawaii
1936— number of Federals report ing
162
14 48 42 18 12 10 18
167
43 90 34
73
55 18
116
89 27
105
30 30 36
5 4
161
35 12 19
8 87
87
22 19 15 31
80
8 1
22 4
36 9
63
1 61
1
1936—effective rates charged by Federals
4.8-5.2 (5.0) percent
5.3-5.7 (5.5) percent
9
4 2
3
2
1 1
1
1
1
1
2
2
1
1
5.8-6.2 (6.0) percent
41
3 1 4
12 7 6 8
75
13 54
8
22
14 8
18
18
32
16 12
4
4
1
1 2
6
6
15
3
12
4
4
6.3-6.7 (6.5) percent
53
2 18 21
2 3
7
58
18 30 10
31
24 7
76
49 27
32
9 11 10 2
20
6 2 2 1 9
5
2 1 1 1
24
6 1 4 2
11
18
1 17
6.8-7.2 (7.0) percent
39
5 23
7
4
31
11 4
16
17
14 3
22
22
33
4 5
19 1 4
53
10 3 6 4
30
40
8 10
6 16
27
1
7 1 9 9
31
30 1
7.3-7.7 (7.5) percent
17
4 5 8
1
1
3
3
8
1 2 3 2
43
3 2 8
30
21
6 6
9
8
1
6
1
9
9
7.8-8.2 (8.0) percent
2
1 1
37
16 2 3 2
14
8
2 1 5
3
1 1 1
8.3-8.7 (8.5) percent
1
1
3
1
2
6
6
1
1
1934— predominat ing nominal ra te by s. & 1 .
8 7 8 6 6 7 6
6 7 6
7 7
6 6
7 7 8 8 8
8 8 8
8-10 8
8 8 7 8
8 8 8 8 7 7
7 8
1931— average nominal ra te by s. & 1.
7. 3 8. 4 7. 4
6. 0 7. 9 6. 4
6. 3 6. 8 6. 0
7. 1 7. 2
6. 3 6. 7
6. 8 7. 0 7. 5 7. 7 9. 7
9. 0 7. 4 9. 0
10 .0 8. 7
8. 8 8. 7 7 . 3 9. 1
8. 6 7. 8 9 . 3 8. 7 7 .9 8. 1
10.0 8. 2
i Nominal rate plus loan fees: for each 1 percent of gross loan fee, 0.2 percent has been added to the nominal rate, Because this approximation is based on a maturity of 139 months, the effective rate, in sonie cases, may be lower th$p that shQwn.
November 1937 51
Digitized for FRASER http://fraser.stlouisfed.org/ Federal Reserve Bank of St. Louis
RESIDENTIAL CONSTRUCTION and HOME-FINANCING ACTIVITY
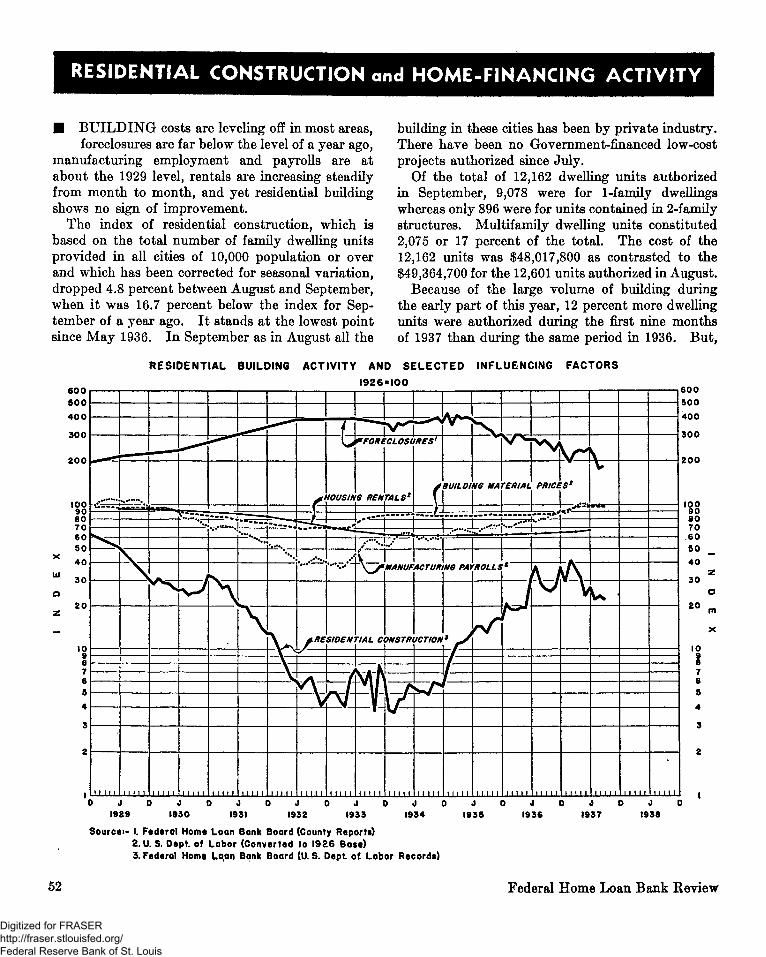
• BUILDING costs are leveling off in most areas, foreclosures are far below the level of a year ago,
manufacturing employment and payrolls are at about the 1929 level, rentals are increasing steadily from month to month, and yet residential building shows no sign of improvement.
The index of residential construction, which is based on the total number of family dwelling units provided in all cities of 10,000 population or over and which has been corrected for seasonal variation, dropped 4.8 percent between August and September, when it was 16.7 percent below the index for September of a year ago. It stands at the lowest point since May 1936. In September as in August all the
building in these cities has been by private industry. There have been no Government-financed low-cost projects authorized since July.
Of the total of 12,162 dwelling units authorized in September, 9,078 were for 1-family dwellings whereas only 896 were for units contained in 2-family structures. Multifamily dwelling units constituted 2,075 or 17 percent of the total. The cost of the 12,162 units was $48,017,800 as contrasted to the $49,364,700 for the 12,601 units authorized in August.
Because of the large volume of building during the early part of this year, 12 percent more dwelling units were authorized during the first nine months of 1937 than during the same period in 1936. But,
6 0 0
5 0 0
4 0 0
3 0 0
2 0 0
too 9 0 8 0 7 0 6 0 5 0 4 0
3 0
2 0
to 9 8 7 6 5 4
3
2
l
- C - , . ^ - - J*i
H i l l n n i
RESIDENTIAL
M W " \u - . , j
M i l l
BUILDING
"••.! ....... f " •—
M i l l
!*••••. 1
i n n
**?•.•••.
1 I I IX
*••-.
ACTIVITY
-A
*••
MRE
1 1I I L
\/\
T L
yousiN
• ^ 4
AND SELECTED
1926
" ^ ^ *FORL
«I00
V ^ CLOSL
6 RENTALS1
i j J—.—J
'' 1 1 — 4 — *
^ ^ IRES'
f
INFLUENCING
BUILD INS MATERIAL
FACTORS
PRICES2
-VI - U ~ W^tJ J J j - y ^
| 1 /•*"••.!./ j •" "i
XV I ••-%>-
SIDEN
±1X11. L I L ! 1
rIAL C
MANUF
7NSTR
U..LJL.I, 1 1 1 It.
ACTURi
ICTION
WS PA)
9 J
1.1. I l l 1 I I J L
•v » «...•'•
T
'ROLLi
1.1.1.11
'*
M i l l
1
v /
M i l l
\
1 1 M 1 1
mts
I I I I I I f i t t i t nml
600
500
400
300
200
100 90 80 70 60 50 40
30
20
0 J 0 J 0 J 0 J D J 0 J 0 J D J 0 J 0 J 0 1929 1930 1931 1932 1933 1934 1935 1936 1937 1938
Source:- I. Federal Home Loan Bank Board (County Reports) 2. U. S. Dept. of Labor (Converted to 1926 Base) 3. Federal Home Loan Bank Board (U. S. Dept. ot Labor Records)
52 Federal Home Loan Bank Review
Digitized for FRASER http://fraser.stlouisfed.org/ Federal Reserve Bank of St. Louis
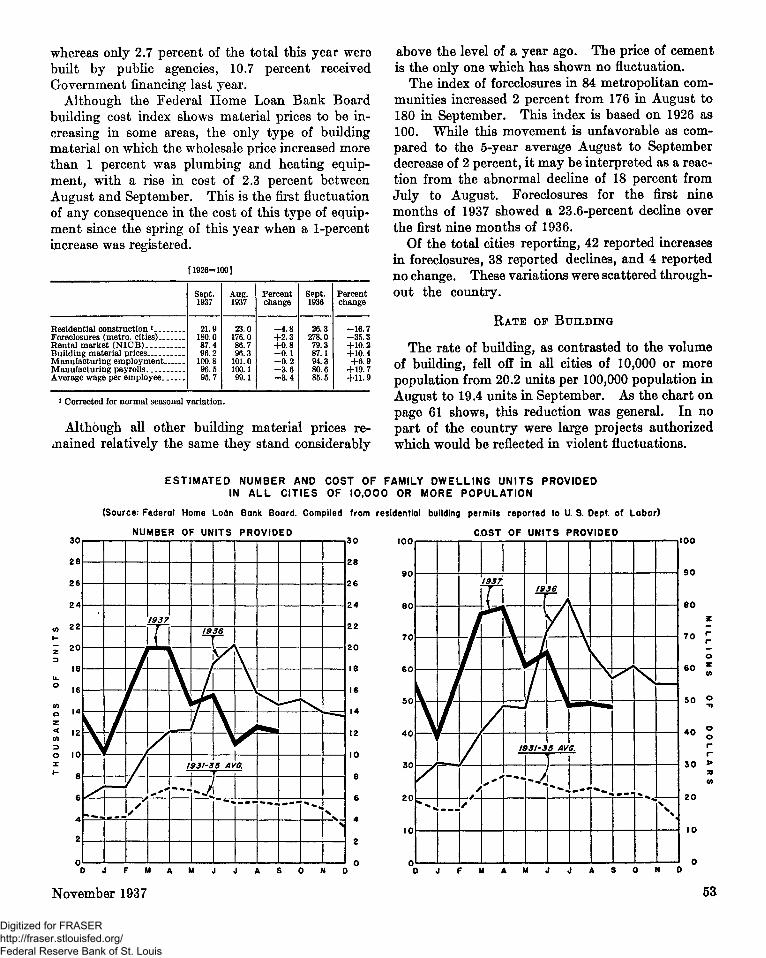
whereas only 2.7 percent of the total this year were built by public agencies, 10.7 percent received Government financing last year.
Although the Federal Home Loan Bank Board building cost index shows material prices to be increasing in some areas, the only type of building material on which the wholesale price increased more than 1 percent was plumbing and heating equipment, with a rise in cost of 2.3 percent between August and September. This is the first fluctuation of any consequence in the cost of this type of equipment since the spring of this year when a 1-percent increase was registered.
[1926=100]
Residential construction * Foreclosures (metro, cities) Rental market (NICB) Building material prices Manufacturing employment Manufacturing payrolls Average wage per employee
Sept. 1937
21.9 180.0 87.4 96.2
100.8 96.5 95.7
Aug. 1937
23.0 176.0 86.7 96.3
101.0 100.1 99.1
Percent change
- 4 . 8 +2.3 +0.8 - 0 . 1 - 0 . 2 - 3 . 6 -3 .4
Sept. 1936
26.3 278.0 79.3 87.1 94.3 80.6 85.5
Percent change
-16.7 -35.3 +10.2 +10.4 +6.9
+19.7 +11.9
* Corrected for normal seasonal variation.
Although all other building material prices regained relatively the same they stand considerably
above the level of a year ago. The price of cement is the only one which has shown no fluctuation.
The index of foreclosures in 84 metropolitan communities increased 2 percent from 176 in August to 180 in September. This index is based on 1926 as 100. While this movement is unfavorable as compared to the 5-year average August to September decrease of 2 percent, it may be interpreted as a reaction from the abnormal decline of 18 percent from July to August. Foreclosures for the first nine months of 1937 showed a 23.6-percent decline over the first nine months of 1936.
Of the total cities reporting, 42 reported increases in foreclosures, 38 reported declines, and 4 reported no change. These variations were scattered throughout the country.
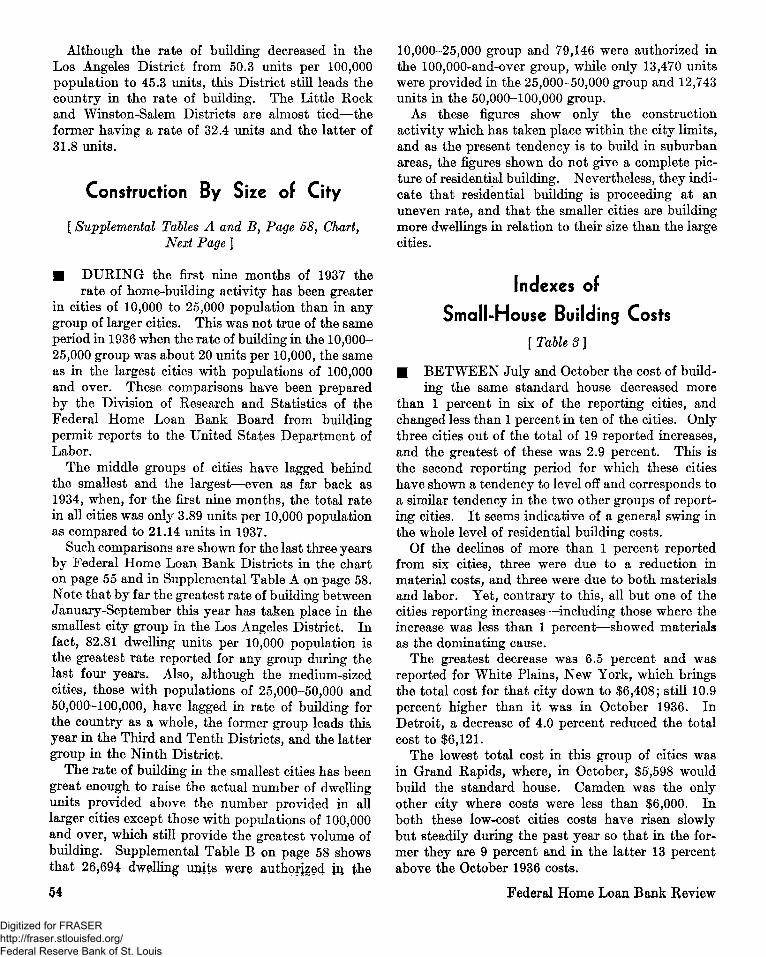
RATE OF BUILDING
The rate of building, as contrasted to the volume of building, fell off in all cities of 10,000 or more population from 20.2 units per 100,000 population in August to 19.4 units in September. As the chart on page 61 shows, this reduction was general. In no part of the country were large projects authorized which would be reflected in violent fluctuations.
30
28
26
24 |
22
20
18
16
14
12
10
8
6
4|
ESTIMATED NUMBER AND COST OF FAMILY DWELLING UNITS PROVIDED IN ALL CITIES OF 10.000 OR MORE POPULATION
(Source: Federal Home Loan Bank Board. Compiled from residential building permits reported to U. S. Oept. of Labor)
NUMBER OF UNITS PROVIDED
yy
'
s *
1937
T
1
1936
y
i 93/~3
y^
i
1 5 AVG.
•A
30
28
26
24
22
20
18
16
14
12
IO
8
6
4
2
O
100
90
80
70
50
40
30
20
IO
COST OF UNITS PROVIDED
Y \ *
> •
1937 x
'-'
n
19 f£
1
93Z-3 5 AV • •
u 1
£
> * * " **. ^ * s
100
90
80
70
60 o z
50
40
30
o o r r >
20
IO
November 1937 sa
Digitized for FRASER http://fraser.stlouisfed.org/ Federal Reserve Bank of St. Louis
Although the rate of building decreased in the Los Angeles District from 50.3 units per 100,000 population to 45.3 units, this District still leads the country in the rate of building. The Little Rock and Winston-Salem Districts are almost tied—the former having a rate of 32.4 units and the latter of 31.8 units.
Construction By Size of City
[ Supplemental Tables A and B, Page 58, Chart, Next Page ]
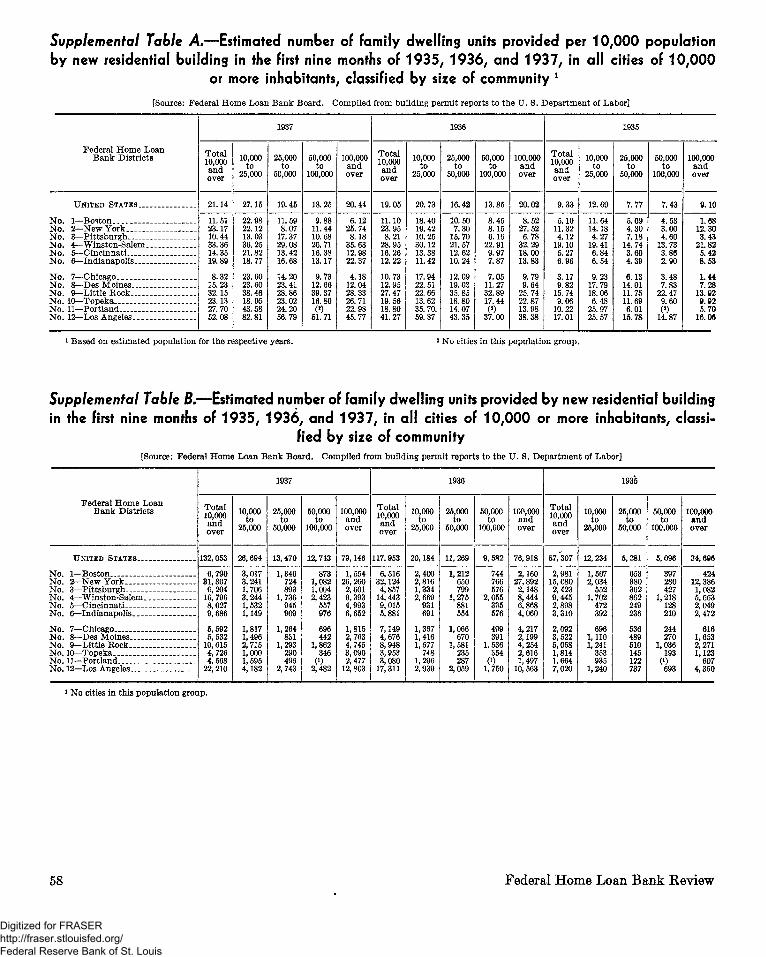
• DURING the first nine months of 1937 the rate of home-building activity has been greater
in cities of 10,000 to 25,000 population than in any group of larger cities. This was not true of the same period in 1936 when the rate of building in the 10,000-25,000 group was about 20 units per 10,000, the same as in the largest cities with populations of 100,000 and over. These comparisons have been prepared by the Division of Research and Statistics of the Federal Home Loan Bank Board from building permit reports to the United States Department of Labor.
The middle groups of cities have lagged behind the smallest and the largest—even as far back as 1934, when, for the first nine months, the total rate in all cities was only 3.89 units per 10,000 population as compared to 21.14 units in 1937.
Such comparisons are shown for the last three years by Federal Home Loan Bank Districts in the chart on page 55 and in Supplemental Table A on page 58. Note that by far the greatest rate of building between January-September this year has taken place in the smallest city group in the Los Angeles District. In fact, 82.81 dwelling units per 10,000 population is the greatest rate reported for any group during the last four years. Also, although the medium-sized cities, those with populations of 25,000-50,000 and 50,000-100,000, have lagged in rate of building for the country as a whole, the former group leads this year in the Third and Tenth Districts, and the latter group in the Ninth District.
The rate of building in the smallest cities has been great enough to raise the actual number of dwelling units provided above the number provided in all larger cities except those with populations of 100,000 and over, which still provide the greatest volume of building. Supplemental Table B on page 58 shows that 26,694 dwelling units were authorised m the
10,000-25,000 group and 79,146 were authorized in the 100,000-and-over group, while only 13,470 units were provided in the 25,000-50,000 group and 12,743 units in the 50,000-100,000 group.
As these figures show only the construction activity which has taken place within the city limits, and as the present tendency is to build in suburban areas, the figures shown do not give a complete picture of residential building. Nevertheless, they indicate that residential building is proceeding at an uneven rate, and that the smaller cities are building more dwellings in relation to their size than the large cities.
Indexes of
Small-House Building Costs
[TableS]
• BETWEEN July and October the cost of building the same standard house decreased more
than 1 percent in six of the reporting cities, and changed less than 1 percent in ten of the cities. Only three cities out of the total of 19 reported increases, and the greatest of these was 2.9 percent. This is the second reporting period for which these cities have shown a tendency to level off and corresponds to a similar tendency in the two other groups of reporting cities. It seems indicative of a general swing in the whole level of residential building costs.
Of the declines of more than 1 percent reported from six cities, three were due to a reduction in material costs, and three were due to both materials and labor. Yet, contrary to this, all but one of the cities reporting increases—including those where the increase was less than 1 percent—showed materials as the dominating cause.
The greatest decrease was 6.5 percent and was reported for White Plains, New York, which brings the total cost for that city down to $6,408; still 10.9 percent higher than it was in October 1936. In Detroit, a decrease of 4.0 percent reduced the total cost to $6,121.
The lowest total cost in this group of cities was in Grand Rapids, where, in October, $5,598 would build the standard house. Camden was the only other city where costs were less than $6,000. In both these low-cost cities costs have risen slowly but steadily during the past year so that in the former they are 9 percent and in the latter 13 percent above the October 1936 costs.
54 Federal Home Loan Bank Review
Digitized for FRASER http://fraser.stlouisfed.org/ Federal Reserve Bank of St. Louis
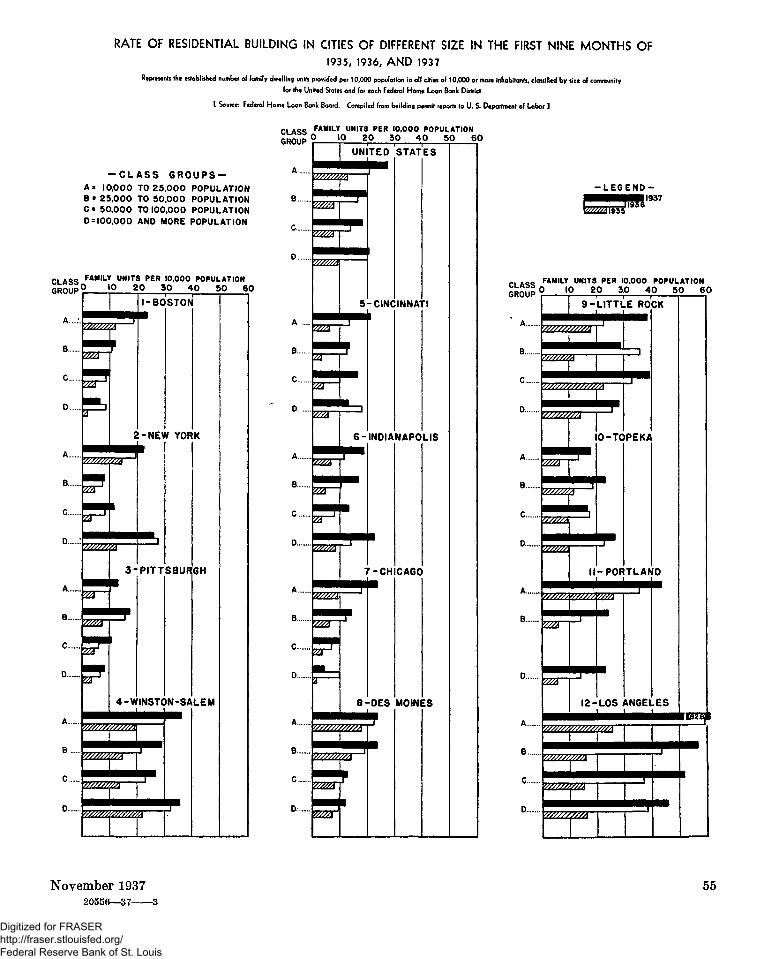
RATE OF RESIDENTIAL BUILDING IN CITIES OF DIFFERENT SIZE IN THE FIRST NINE MONTHS OF 1935, 1936, AND 1937
Represents the established number of family dwellins units provided per 10,000 population in all cities of 10,000 or more inhabitants, classified by size of community
for the United States and for each Federal Home Loan Bank District
t Source: Federal Home Loan Bank Board. Compiled from building permit reports to U. S. Department of Labor ]
CLASS F A M , L Y UNITS PER 1 0 , 0 0 0 POPULATION
10 20 30 40 50 60
- C L A S S GROUPS-A* 10,000 TO 25.000 POPULATION B = 25,000 TO 50,000 POPULATION C» 50,000 TO 100,000 POPULATION D-100,000 AND MORE POPULATION
CLASS F A M , L Y U N , T S P E R , 0 « 0 0 0 POPULATION
GROUP 10 20 30 40 50 60
A
R
C
D
A
B
C
D
R
C
D
A
B
C
D
A
R
C........
D.
UNITED
• • •——^ VSWMA
m&
><xm
V///SM
5
^ ^ ^ • — j — V//A
U
£4
'&&
57 m
j f l T
V//S/A
v//;//\
V//A
^
d
-CIN(
STATES
INNA' 1
6-INDIANAPOLIS
I™
^
8-
V//////////A
V///////SA
-CH
-OES
CA6G
MOINI •s
- L E G E N D -1937
CLASS GROUP
FAMILY UNITS PER 10 .000 POPULATION 10 20 3J0 40 50 60
November 1937 20556—37 3
55
Digitized for FRASER http://fraser.stlouisfed.org/ Federal Reserve Bank of St. Louis
At the other extreme, the highest cost was $7,174 in Great Falls, Montana. But the increase in costs during the past year in Great Falls has proceeded at no greater a rate than in many cities of a lower total cost.
Monthly Lending Activity of
Savings and Loan Associations
[Tables 4,5,6 and 7]
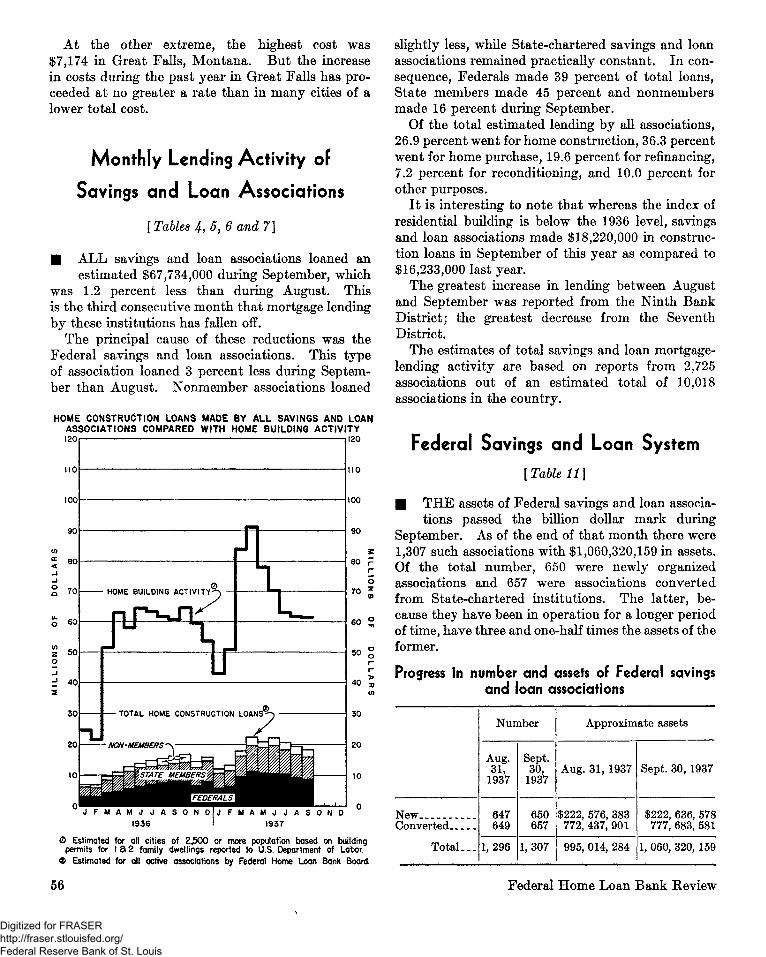
• ALL savings and loan associations loaned an estimated $67,734,000 during September, which
was 1.2 percent less than during August. This is the third consecutive month that mortgage lending by these institutions has fallen off.
The principal cause of these reductions was the Federal savings and loan associations. This type of association loaned 3 percent less during September than August. Nonmember associations loaned
HOME CONSTRUCTION LOANS MADE BY ALL SAVINGS AND LOAN ASSOCIATIONS COMPARED WITH HOME BUILDING ACTIVITY 1201 1120
100
slightly less, while State-chartered savings and loan associations remained practically constant. In consequence, Federals made 39 percent of total loans, State members made 45 percent and nonmembers made 16 percent during September.
Of the total estimated lending by all associations, 26.9 percent went for home construction, 36.3 percent went for home purchase, 19.6 percent for refinancing, 7.2 percent for reconditioning, and 10.0 percent for other purposes.
I t is interesting to note that whereas the index of residential building is below the 1936 level, savings and loan associations made $18,220,000 in construction loans in September of this year as compared to $16,233,000 last year.
The greatest increase in lending between August and September was reported from the Ninth Bank District; the greatest decrease from the Seventh District.
The estimates of total savings and loan mortgage-lending activity are based on reports from 2,725 associations out of an estimated total of 10,018 associations in the country.
Federal Savings and Loan System
[Table 11]
• THE assets of Federal savings and loan associations passed the billion dollar mark during
September. As of the end of that month there were 1,307 such associations with $1,060,320,159 in assets. Of the total number, 650 were newly organized associations and 657 were associations converted from State-chartered institutions. The latter, because they have been in operation for a longer period of time, have three and one-half times the assets of the former.
Progress in number and assets of Federal savings and loan associations
<Z> Estimated for all cities of 2,500 or more population based on building permits for I S 2 family dwellings reported to U.S. Department of Labor.
<2> Estimated for all active associations by Federal Home Loan Bank Board.
New Converted
Total. _.
Number
Aug. 31,
1937
647 649
1,296
Sept. 30,
1937
650 657
1,307
Approximate assets
Aug. 31, 1937
$222, 576, 383 772, 437, 901
995, 014, 284
Sept. 30, 1937
$222, 636, 578 777, 683, 581
1, 060, 320, 159
56 Federal Home Loan Bank Review
Digitized for FRASER http://fraser.stlouisfed.org/ Federal Reserve Bank of St. Louis
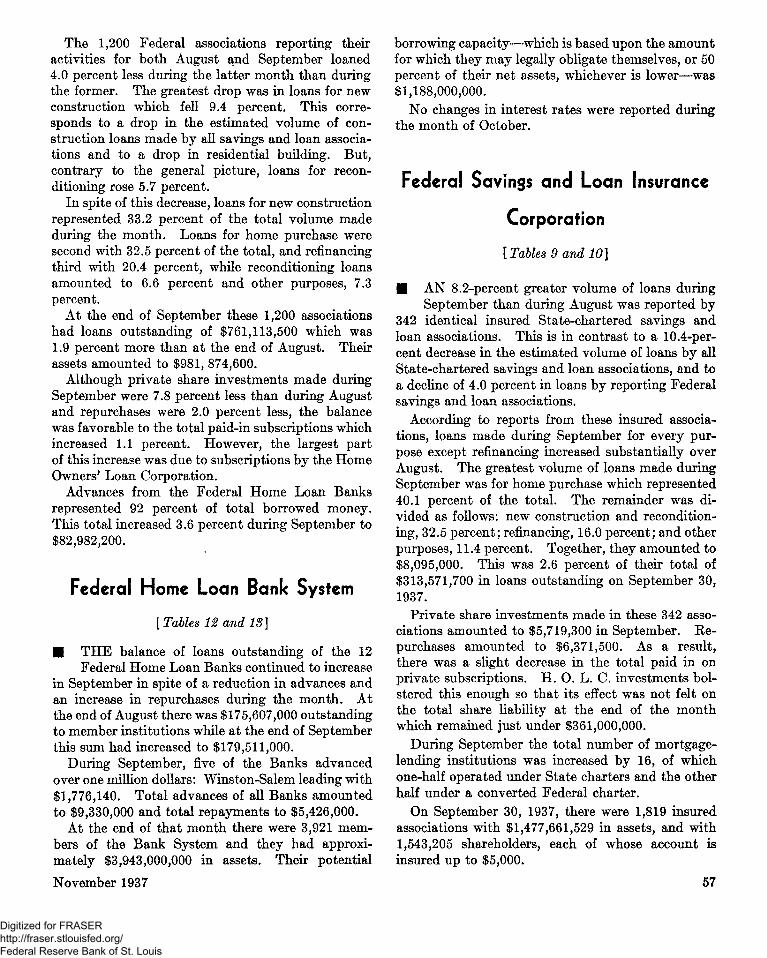
The 1,200 Federal associations reporting their activities for both August and September loaned 4.0 percent less during the latter month than during the former. The greatest drop was in loans for new construction which fell 9.4 percent. This corresponds to a drop in the estimated volume of construction loans made by all savings and loan associations and to a drop in residential building. But, contrary to the general picture, loans for reconditioning rose 5.7 percent.
In spite of this decrease, loans for new construction represented 33.2 percent of the total volume made during the month. Loans for home purchase were second with 32.5 percent of the total, and refinancing third with 20.4 percent, while reconditioning loans amounted to 6.6 percent and other purposes, 7.3 percent.
At the end of September these 1,200 associations had loans outstanding of $761,113,500 which was 1.9 percent more than at the end of August. Their assets amounted to $981, 874,600.
Although private share investments made during September were 7.8 percent less than during August and repurchases were 2.0 percent less, the balance was favorable to the total paid-in subscriptions which increased 1.1 percent. However, the largest part of this increase was due to subscriptions by the Home Owners' Loan Corporation.
Advances from the Federal Home Loan Banks represented 92 percent of total borrowed money. This total increased 3.6 percent during September to $82,982,200.
Federal Home Loan Bank System
[Tables 12 and IS]
• THE balance of loans outstanding of the 12 Federal Home Loan Banks continued to increase
in September in spite of a reduction in advances and an increase in repurchases during the month. At the end of August there was $175,607,000 outstanding to member institutions while at the end of September this sum had increased to $179,511,000.
During September, five of the Banks advanced over one million dollars: Winston-Salem leading with $1,776,140. Total advances of all Banks amounted to $9,330,000 and total repayments to $5,426,000.
At the end of that month there were 3,921 members of the Bank System and they had approximately $3,943,000,000 in assets. Their potential
November 1937
borrowing capacity—which is based upon the amount for which they may legally obligate themselves, or 50 percent of their net assets, whichever is lower—was $1,188,000,000.
No changes in interest rates were reported during the month of October.
Federal Savings and Loan Insurance
Corporation
[Tables 9 and 10]
• AN 8.2-percent greater volume of loans during September than during August was reported by
342 identical insured State-chartered savings and loan associations. This is in contrast to a 10.4-percent decrease in the estimated volume of loans by all State-chartered savings and loan associations, and to a decline of 4.0 percent in loans by reporting Federal savings and loan associations.
According to reports from these insured associations, loans made during September for every purpose except refinancing increased substantially over August. The greatest volume of loans made during September was for home purchase which represented 40.1 percent of the total. The remainder was divided as follows: new construction and reconditioning, 32.5 percent; refinancing, 16.0 percent; and other purposes, 11.4 percent. Together, they amounted to $8,095,000. This was 2.6 percent of their total of $313,571,700 in loans outstanding on September 30, 1937.
Private share investments made in these 342 associations amounted to $5,719,300 in September. Ke-purchases amounted to $6,371,500. As a result, there was a slight decrease in the total paid in on private subscriptions. H. O. L. C. investments bolstered this enough so that its effect was not felt on the total share liability at the end of the month which remained just under $361,000,000.
During September the total number of mortgage-lending institutions was increased by 16, of which one-half operated under State charters and the other half under a converted Federal charter.
On September 30, 1937, there were 1,819 insured associations with $1,477,661,529 in assets, and with 1,543,205 shareholders, each of whose account is insured up to $5,000.
57
Digitized for FRASER http://fraser.stlouisfed.org/ Federal Reserve Bank of St. Louis
Supplemental Table A—Estimated number of family dwelling units provided per 10,000 population by new residential building in the first nine months of 1935, 1936, and 1937, in all cities of 10,000
or more inhabitants, classified by size of community l
[Source: Federal Home Loan Bank Board. Compiled from building permit reports to the U. S. Department of Labor]
Federal Home Loan Bank Districts
UNITED STATES _ . .
No. 1—Boston No. 2—New York _ No. 3—Pittsburgh _ No. 4—Winston-Salem No. 5—Cincinnati No. 6—Indianapolis
No. 7—Chicago _ No. 8—Des Moines No. 9—Little Rock No. 10—Topeka No. 11—Portland No. 12—Los Angeles
1937
Total 10,000 and over
21.14
11.51 23.17 10.44 33.36 14.35 19.89
8.32 15.23 32.15 23.13 27.70 52.08
10,000 to
25,000
27.15
22.98 22.12 13.03 36.25 21.82 18.77
23.60 23.60 38.46 18.05 43.58 82.81
25,000 to
50,000
19.45
11.59 8.07
17.37 29.08 13.42 16.68
14.20 23.41 28.86 23.02 24.20 56.79
50,000 to
100,000
18.25
9.88 11.44 10.68 26.71 16.38 13.17
9.73 12.66 39.37 16.80 (*>
51.71
100,000 and over
20.44
6.12 25.74 8.18
35.63 12.98 22.37
4.18 12.04 28.33 26.71 22.98 45.77
1936
Total 10,000 and over
19.05
11.10 23.95 8.21
28.95 16.26 12.22
10.73 12.95 27.47 19.56 18.80 41.27
10,000 to
25,000
20.73
18.40 19.42 10.25 30.12 13.38 11.42
17.94 22.51 22.66 13.62 35. 70. 59.37
25,000 to
50,000
16.42
10.50 7.30
15.70 21.57 12.62 10.24
12.09 19. 03 35. 85 18.80 14.07 43.35
50,000 to
100,000
13.85
8.45 8.15 6.16
22.91 9.97 7.87
7.05 11.27 32.89 17.44 (')
37.00
100,000 and over
20.02
8.52 27.52 6.78
32.29 18.00 13.83
9.79 9.64
25.74 22.87 13.98 38.38
1935
Total 10,000 and over
9.33
5.10 11.32 4.12
19.10 5.27 6.96
3.17 9.82
15.74 9.06
10.22 17.01
10,000 to
25,000
12.69
11.64 14.18 4.27
19.41 6.84 6.54
9.23 17.79 18.06 6.48
25.97 25.57
26,000 to
50,000
7.77
5.69 4.30 7.18
14.74 3.60 4.39
6.13 14.01 11.75 11.69 6.01
15.78
60,000 to
100,000
7.43
4.53 3.00 4.60
13.73 3.86 2.90
3.48 7.83
22.47 9.60 (2)
14.87
100,000 and over
9.10
1.68 12.30 3.43
21.82 5.42 8.53
1.44 7.28
13.92 9.92 5.70
16.06
i Based on estimated population for the respective years. * No cities in this population group.
Supplemental Table 8.—Estimated number of family dwelling units provided by new residential building in the first nine months of 1935, 1936, and 1937, in all cities of 10,000 or more inhabitants, classi
fied by size of community [Source: Federal Home Loan Bank Board. Compiled from building permit reports to the U. S. Department of Labor]
Federal Home Loan Bank Districts
1937
Total 10,000 and over
10,000 to
25,000
25,000 to
50,000
50,000 to
100,000
100,000 and over
1936
Total 10,000 and over
10,000 to
25,000
25,000 to
50,000
50,000 to
100,000
100,000 and
1935
Total 10,000 and over
10,000 to
25,000
25,000 to
50,000
50,000 to
100,000
100,000 and over
UNITED STATES..
No. 1—Boston No. 2—New York No. 3—Pittsburgh No. 4—Winston-Salem No. 5—Cincinnati No. 6—Indianapolis. _.
No. 7—Chicago No. 8—Des Moines No. 9—Little Rock No. 10—Topeka No. 11—Portland _. No. 12—Los Angeles
132,053 26,694 12,743 79,146 117.953 20,184 11,269 9,582 76,918 57,307 12,234 5,281 5,096 34,696
6,790 31,307 6,204
16,796 8,027
5,592 5, 532
10,615 4,726 4,568
22,210
3,017 3,241 1,706 3,244 1,532 1,149
1,817 1,496 2,715 1,000 1,595 4,182
1,346 724
1,736 945
1,264 831
1,293 290 496
2,743
873 1,082 1.004 2,423 557 976
442 1,862 346 0) 2,482
1,554 26,260 2,601 9,393 4,993 6,652
1,815 2,763 4,745 3,090 2,477 12,803
6,516 32,124 4,857 14,443 9,015 5,881
7,149 4,676 8,948 3,953 3,080 17,311
2,400 2,816 1,334 2,669 931 691
1,367 1,416 1,577 748
1,296 2,939
1,212 650 799
1,275 881 554
1,066 670
1,581 235 287
2,059
744 766 576
2,055 335 576
499 391
1,536 354 0) 1,750
2,160 27,892 2,148 8,444 6,868 4,060
4,217 2,199 4,254 2,616 1,497
10,563
2,981 15,080 2,423 9,445 2,898 3,310
2,092 3,522 5,058 1,814 1,664 7,020
1,507 2,034 552
1.702 472
1,110 1,241 353 935
1,240
653 380 362 862 249 236
536 489 510 145 122 737
427 1,218 128 210
244 270
1,036 193 0) 693
424 12,386 1,082 5,663 2,049 2,472
616 1,653 2,271 1,123 607
4,350
1 No cities in this population group.
58 Federal Home Loan Bank Review
Digitized for FRASER http://fraser.stlouisfed.org/ Federal Reserve Bank of St. Louis
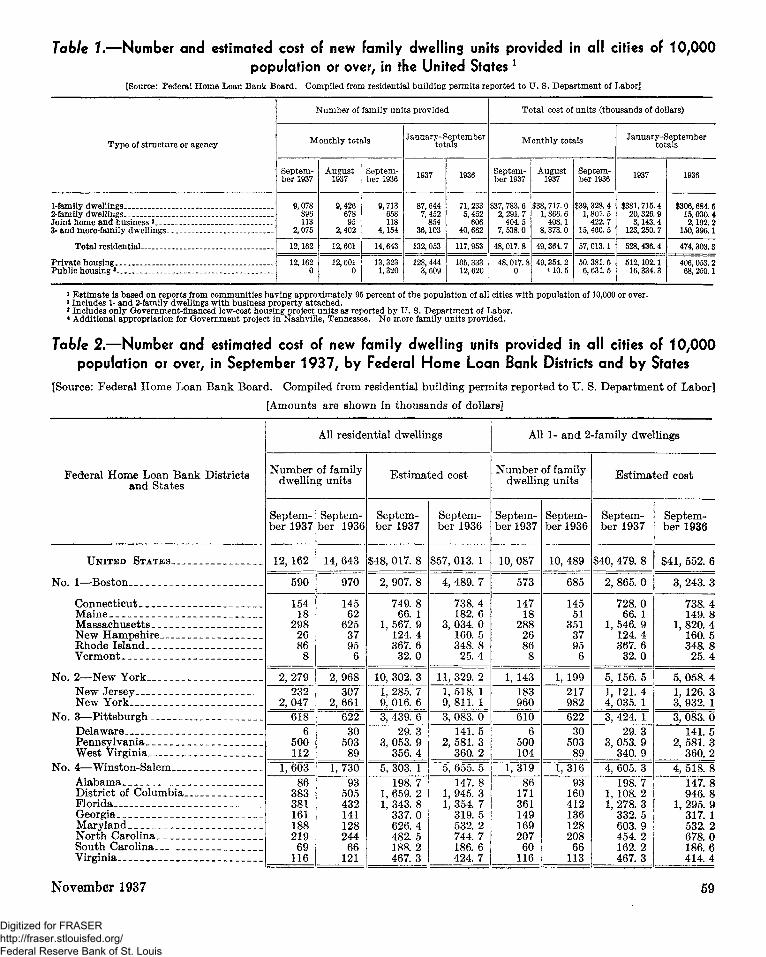
Table 1.—Number and estimated cost of new family dwelling units provided in all cities of 10,000 population or over, in the United States l
[Source: Federal Home Loan Bank Board. Compiled from residential building permits reported to U. S. Department of Labor]
Type of structure or agency
1-familydwellings . . . . »...* ^, 2-family dwellings -Joint home and business 2
3-and more-family dwellings
Total residential .
Private housing Public housing'
Number of family units provided
Monthly totals
September 1937
9,078 896 113
2,075
12,162
12,162 0
August 1937
9,426 678 95
2,402
12,601
12~60T 0
September 1936
9,713 658 118
4,154
14,643
13,323 1,320
January-September totals
1937
87,644 7,452
854 36,103
132,053
128, 444 3,609
1936
71, 233 5,452
606 40, 662
117, 953
105,333 12, 620
Total cost of units (thousands of dollars)
Monthly totals
September 1937
$37,783.6 2,291. 7
404.5 7,538.0
48,017.8
48, 017.8 0
August 1937
$38, 717.0 1,866. 6
408.1 8,373.0
49,364. 7
49, 354. 2 <10.5
September 1936
$39,328.4 1,801.5
422.7 15,460. 5
57, 013.1
50, 381. 6 6,631. 5
January-September totals
1937
$381,715. 4 20,326. 9 3,143. 4
123,250. 7
528,436.4
512,102.1 16,334.3
1936
$306,684. 6 15, 030. 4 2,192. 2
150,396.1
474,303.3
406, 053.2 68, 250.1
* Estimate is based on reports from communities having approximately 95 percent of the population of all cities with population of 10,000 or over. »Includes 1- and 2-family dwellings with business property attached. * Includes only Government-financed low-cost housing project units as reported by U. S. Department of Labor. « Additional appropriation for Government project in Nashville, Tennessee. No more family units provided.
Table 2.—Number and estimated cost of new family dwelling units provided in all cities of 10,000 population or over, in September 1937, by Federal Home Loan Bank Districts and by States
[Source: Federal Home Loan Bank Board. Compiled from residential building permits reported to U. S. Department of Labor]
[Amounts are shown in thousands of dollars]
Federal Home Loan Bank Districts and States
U N I T E D S T A T E S -
No. 1—Boston -_
Connecticut Maine- -Massachusetts New Hampshire Rhode Island Vermont -
No. 2—New York New Jersey New York
No. 3—Pit tsburgh _ ___ __ Delaware Pennsylvania West Virginia.--
No. 4—Winston-Salem __ Alabama.. District of Columbia Florida Georgia Maryland Nor th Carol ina . _ South Carolina Virginia
All residential dwellings
Number of family dwelling units
September 1937
12, 162
590
154 18
298 26 86
8
2,279 232
2,047 618
6 500 112
1,603
86 383 381 161 188 219
69 116
September 1936
14, 643
970
145 62
625 37 95
6
2 ,968 307
2,661 622~
30 503
89 1,730
93 505 432 141 128 244
66 121
Es t imated cost
September 1937
$48, 017. 8
2, 907. 8
749 .8 66. 1
1, 567. 9 124. 4 367.6
32 .0
10, 302. 3 1, 285. 7 9, 016. 6 3, 439. 6
29 .3 3, 053. 9
356.4 5, 303. 1
198.7 1, 659. 2 1, 343. 8
337.0 626.4 482. 5 188.2 467. 3
September 1936
$57, 013. 1
4, 489. 7
738.4 182. 6
3, 034. 0 160. 5 348 .8
25 .4
11, 329. 2 1, 518. 1 9, 811. 1 3, 083. 0
141. 5 2, 581. 3
360. 2 5, 655. 5
147. 8 1, 945. 3 1, 354. 7
319. 5 532.2 744.7 186.6 424. 7
All 1- and 2-family dwellings
Number of family dwelling units
September 1937
10, 087
573
147 18
288 26 86
8
1, 143 183 960 610
6 500 104
1,319 86
171 361 149 169 207
60 116
September 1936
10, 489
685
145 51
351 37 95
6
1, 199 217 982 622"
30 503
89 1,316
93 160 412 136 128 208
66 113
Es t imated cost
September 1937
$40, 479. 8
2, 865. 0
728.0 66. 1
1, 546. 9 124. 4 367. 6
32 .0
5, 156. 5 1, 121. 4 4, 035. 1 3, 424. 1
29 .3 3, 053. 9
340.9 ~ 4, 605. 3
198. 7 1, 108. 2 1, 278. 3
332 .5 603.9 454. 2 162. 2 467. 3
September 1936
$41, 552. 6
3, 243. 3
738. 4 149. 8
1, 820. 4 160. 5 348. 8
25. 4
5, 058. 4 1, 126. 3 3, 932. 1
3, 083. 0 141 5
2, 581. 3 360.2
4, 518 8 147 8 946 8
1 295 9 317 1 532 2 678 0 186 6 414.4
November 1937 59
Digitized for FRASER http://fraser.stlouisfed.org/ Federal Reserve Bank of St. Louis
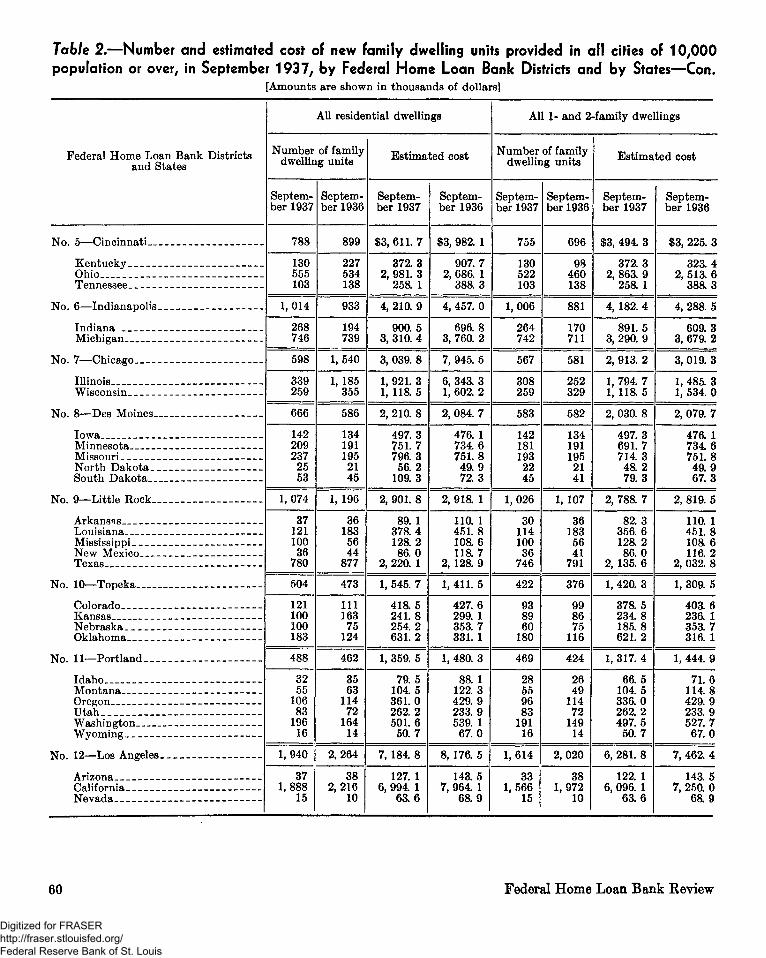
Table 2.—Number and estimated cost of new family dwelling units provided in all cities of 10,000 population or over, in September 1937, by Federal Home Loan Bank Districts and by States—Con.
[Amounts are shown in thousands of dollars]
Federal Home Loan Bank Districts and States
No. 5—Cincinnati
Kentucky Ohio - - -Tennessee
No. 6—Indianapolis
Indiana Michigan
No. 7—Chicago
Illinois Wisconsin
No. 8—Des Moines
Iowa Minnesota Missouri North Dakota South Dakota
No. 9—Little Rock
Arkansas Louisiana Mississippi New Mexico Texas
No. 10—Topeka
Colorado Kansas Nebraska -Oklahoma
No. 11—Portland
Idaho -Montana __ Oregon Utah _ Washington
No 12—Los Angeles
Arizona Cal ifornia _
All residential dwellings
Number of family dwelling units
September 1937
788
130 555 103
1,014
268 746
598
339 259
666
142 209 237 25 53
1,074
37 121 100 36
780
504
121 100 100 183
488~
32 55
106 83
196 16
1, 940
37 1, 888
15
September 1936
899
227 534 138
933
194 739
1,540
1,185 355
586
134 191 195 21 45
1,196
36 183 56 44
877
473
111 163 75
124
462
35 63
114 72
164 14
2, 264
38 2, 216
10
Estimated cost
September 1937
$3,611.7
372. 3 2, 981. 3
258. 1
4,210.9
900. 5 j 3, 310. 4
3, 039. 8
1, 921. 3 1, 118. 5
2, 210. 8
497.3 751.7 796.3
56.2 109.3
2, 901. 8
89. 1 378.4 128.2 86.0
2, 220. 1
1, 545. 7
418.5 241. 8 254.2 631.2
1, 359. 5
79.5 104. 5 361. 0 262. 2 501. 6
50.7
7, 184. 8
127. 1 6, 994. 1
63.6
September 1936
$3, 982. 1
907. 7 2, 686. 1
388. 3
4,457.0
696.8 3, 760. 2
7, 945. 5
6, 343. 3 1, 602. 2
2, 084. 7
476. 1 734.6 751.8 49.9 72.3
2, 918. 1
110. 1 451.8 108.6 118.7
2, 128. 9
1,411.5
427.6 299. 1 353.7 331. 1
1, 480. 3
88. 1 122. 3 429. 9 233. 9 539. 1 67.0
8, 176. 5
143. 5 7, 964. 1
68.9
All 1- and 2-family dwellings
Number of family dwelling units
September 1937
755
130 522 103
1, 006
264 742
567
308 259
583
142 181 193 22 45
1,026
30 114 100 36
746
422
93 i 89 60
180
469
28 55 96 83
191 16
1, 614
33 1, 566
15
September 1936
| 696
98 460 138
881
170 711
581
252 329
582
134 1 191 195 21 41
1, 107
36 183 56 41
791 1
376
99 86 75
116
424
26 49
114 72
149 14 1
2, 020
38 1, 972
10
Estimated cost
September 1937
$3, 494. 3
372.3 2, 863. 9
258. 1
4, 182. 4
891.5 3, 290. 9
2, 913. 2
1, 794. 7 1, 118. 5
2, 030. 8
497.3 691.7 714.3 48.2 79.3
2, 788. 7
82.3 356.6 128.2 86.0
2, 135. 6
1, 420. 3
378.5 234. 8 | 185. 8 621. 2
1, 317. 4
66.5 1 104. 5 336. 0 262. 2 497. 5
50. 7
6, 281. 8
122. 1 6, 096. 1
63.6
September 1936
$3,225.3
32a 4 i 2, 513. 6 ! 38a 3
4, 288. 5
609. 3 3, 679. 2
3, 019. 3
1, 485. 3 1, 534. 0
2, 079. 7
476. 1 734. 6 751. 8 49. 9 67. 3
2, 819. 5
110. 1 451. 8 108. 6 116. 2
2, 032. 8
1, 309. 5
403. 6 236. 1 353. 7 316. 1
1, 444. 9
71. 6 114. 8 429. 9 233. 9 527. 7
67. 0
7, 462. 4
143. 5 7, 250. 0
68. 9
60 Federal Home Loan Bank Review
Digitized for FRASER http://fraser.stlouisfed.org/ Federal Reserve Bank of St. Louis
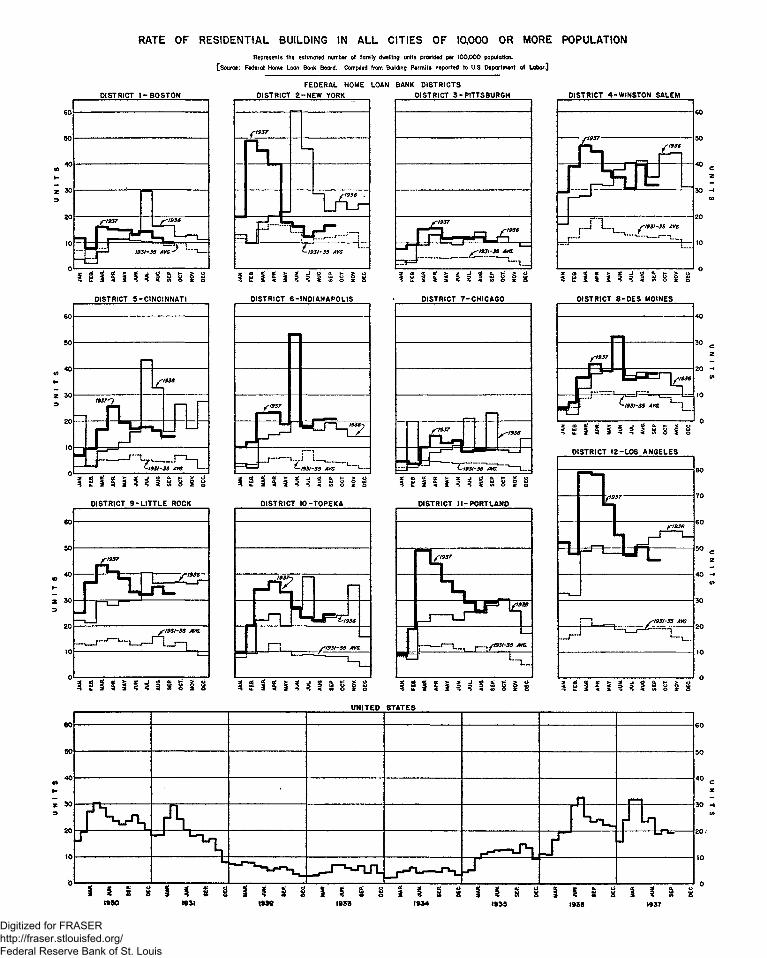
RATE OF RESIDENTIAL BUILDING IN ALL CITIES OF 10,000 OR MORE POPULATION
PI STRICT I - BOSTON
Represents the estimated number of family dwelling units provided per 100,000 poputotioa
[Source; Federal Home Loon Bank Board. Compiled from Building Permits reported to U.S. Department of Labor.]
FEDERAL HOME LOAN BANK DISTRICTS DISTRICT 2-NEW YORK DISTRICT 3-PITTSBURGH
DISTRICT 5-CINCINNATI
% 111 i a i s s i i DISTRICT 9 - L I T T L E ROCK
I f1937
I H U H 1 I H
[ {-1937 j
N LJ . f—'
L-i
' J SI936 ,
L F !Jtk£^n 1 (-Miss AVG
? e i i 11 i i s § i i DISTRICT 6-INDIANAPOLIS
ft" I I
•n i L. *-/93/-33
DISTRICT 10-TOPEKA
>937y P—I
L-i MJ=4
n..., <g
h ^ J f 1931-35 W8.
DISTRICT 4-WINSTON SALEM
DISTRICT 7-CHICAGO OISTRICT 8-DES MOINES
3 £ i S l i 3 3 g g § g
DISTRICT 12-LOS ANGELES
OISTRICT II-PORTLAND
%*%%\%i%%%li I § I i i %i % § S § ii
UNITED STATES
S ? ? 3 S J S S S !
Digitized for FRASER http://fraser.stlouisfed.org/ Federal Reserve Bank of St. Louis
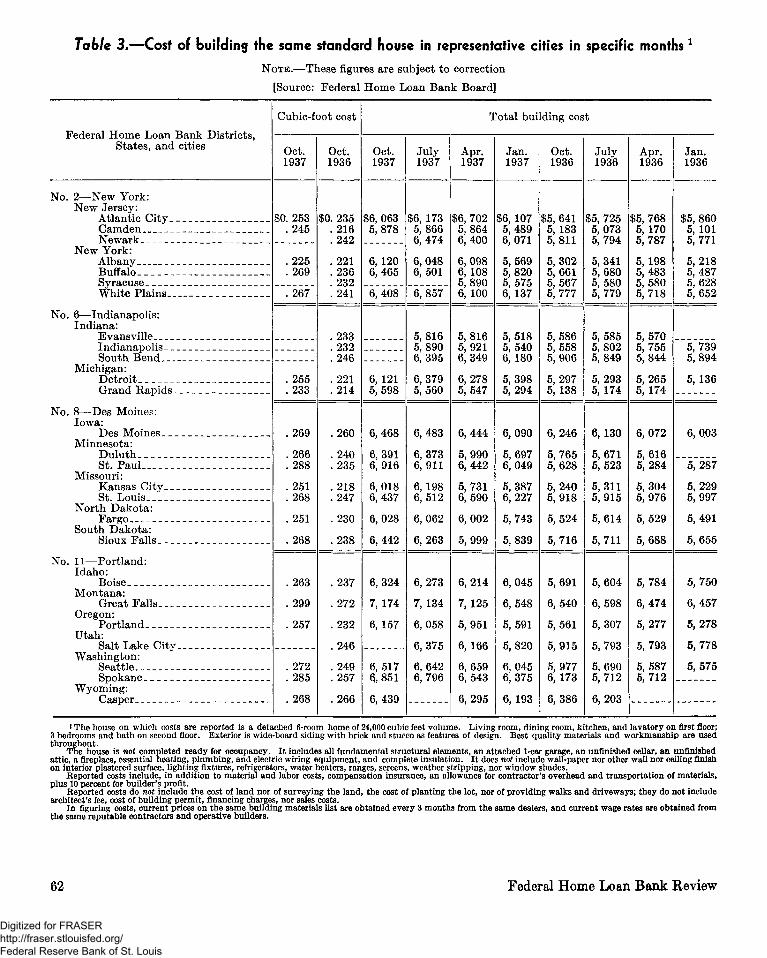
Table 3.—Cost of building the same standard house in representative cities in specific months *
NOTE.—These figures are subject to correction
[Source: Federal Home Loan Bank Board]
Federal Home Loan Bank Districts, States, and cities
Cubic-foot cost
Oct. 1937
Oct. 1936
Total building cost
Oct. 1937
July 1937
Apr. 1937
Jan. 1937
Oct. 1936
July 1936
Apr. 1936
No. 2—New York: New Jersey:
Atlantic City. Camden Newark
New York: Albany Buffalo Syracuse White Plains-
No. 6—Indianapolis: Indiana:
Evansville Indianapolis. _. South Bend__.
Michigan: Detroit Grand Rapids _
No. 8—Des Moines: Iowa:
Des Moines _ Minnesota:
Duluth St. Paul
Missouri: Kansas City. St. Louis
North Dakota: Fargo
South Dakota: Sioux Falls. _
No. 11—Portland: Idaho:
Boise Montana:
Great Falls Oregon:
Portland Utah:
Salt Lake City. Washington:
Seattle Spokane
Wyoming: Casper
$0. 253 .245
225 269
267
$0. 235 .216 .242
.221
.236
. 232
.241
$6, 063 5,878
6,120 6,465
$6, 173 5,866 6,474
6,048 6,501
6,408 6,857
$6, 702 5,864 6,400
6,098 6,108 5,890 6, 100
$6, 107 5,489 6,071
5,569 5,820 5,575 6,137
$5, 641 5,183 5,811
5,302 5,661 5,567 5,777
$5, 725 5, 073 5,794
5,341 5,680 5,580 5,779
$5, 768 5,170 5,787
5,198 5,483 5,580 5,718
.255
.233
233 232 246
221 214
6,121 5,598
5,816 5,890 6,395
6,379 5,560
5,816 5,921 6,349
6,278 5,547
5,518 5,540 6, 180
5,398 5,294
5,586 5,558 5,906
5,297 5, 138
5,585 5,802 5,849
5,293 5,174
5,570 5,755 5,844
5,265 5,174
.269
.266
.288
.251
.268
.251
.268
,260
,240 ,235
,218 ,247
,230
,238
6,468
6,391 6,916
6,018 6,437
6,028
6,442
6,483
6,373 6,911
6,198 6,512
6,062
6,263
6,444
5,990 6,442
5,731 6,590
6,002
5,999
6,090
5,697 6,049
5,387 6,227
5,743
5,839
6,246
5,765 5,628
5,240 5,918
5,524
5,716
6,130
5,671 5,523
5,311 5,915
5,614
5,711
6,072
5,616 5,284
5,304 5,976
5,529
5,688
263
299
257
272 285
268
.237
.272
.232
.246
. 249
.257
.266
6,324
7,174
6,157
6,517 Q,851
6,439
6,273
7,134
6,058
6,375
6,642 6,796
6,214
7,125
5,951
6,166
6,659 6,543
6,295
6,045
6,548
5,591
5,820
6,045 6,375
6, 193
5,691
6,540
5,561
5,915
5,977 6,173
6,386
5,604
6,598
5,307
5,793
5,690 5,712
6,203
5,784
6,474
5,277
5,793
5,587 5,712
i The house on which costs are reported is a detached 6-room home of 24,000 cubic feet volume. Living room, dining room, kitchen, and lavatory on first floor; 3 bedrooms and bath on second floor. Exterior is wide-board siding with brick and stucco as features of design. Best quality materials and workmanship are used throughout.
The house is not completed ready for occupancy. It includes all fundamental structural elements, an attached 1-car garage, an unfinished cellar, an unfinished attic, a fireplace, essential heating, plumbing, and electric wiring equipment, and complete insulation. It does not include wall-paper nor other wall nor ceiling finish on interior plastered surface, lighting fixtures, refrigerators, water heaters, ranges, screens, weather stripping, nor window shades.
Reported costs include, in addition to material and labor costs, compensation insurance, an allowance for contractor's overhead and transportation of materials, plus 10 percent for builder's profit.
Reported costs do not include the cost of land nor of surveying the land, the cost of planting the lot, nor of providing walks and driveways; they do not include architect's fee, cost of building permit, financing charges, nor sales costs.
In figuring costs, current prices on the same building materials list are obtained every 3 months from the same dealers, and current wage rates are obtained from the same reputable contractors and operative builders.
62 Federal Home Loan Bank Review
Digitized for FRASER http://fraser.stlouisfed.org/ Federal Reserve Bank of St. Louis
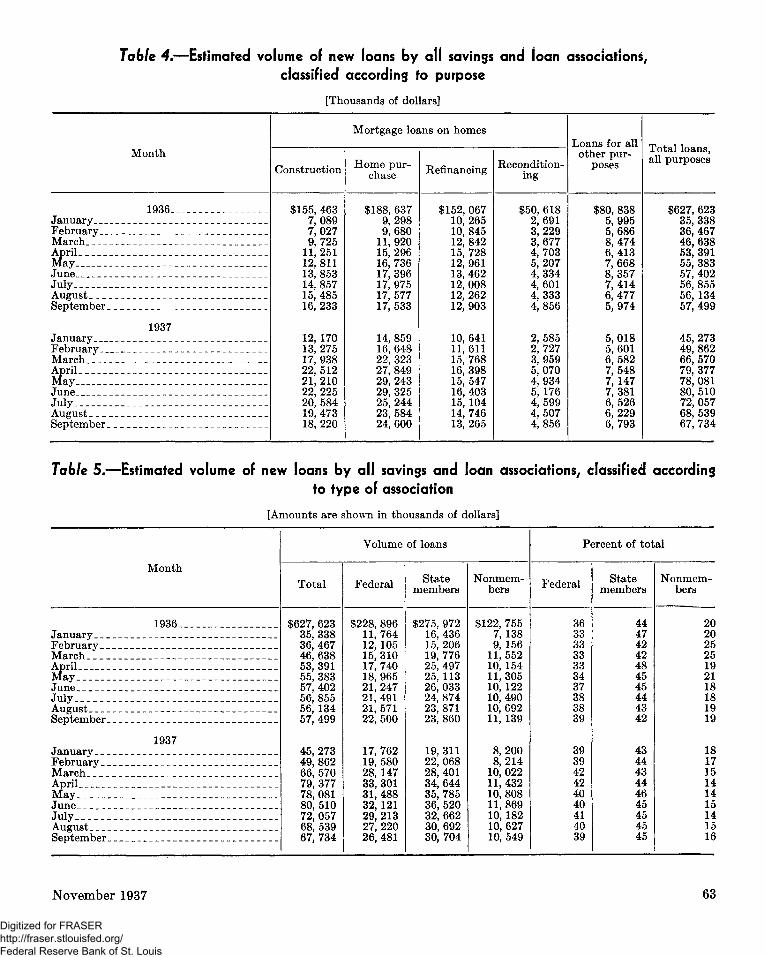
Table 4.—Estimated volume of new loans by all savings and loan associations,
classified according to purpose
[Thousands of dollars]
Month
Mortgage loans on homes
Construction Home purchase Refinancing Recondition
ing
Loans for all other pur
poses Total loans, all purposes
1936. January February March April May June July August September
1937 January February March April May June July August September
$155, 463 7,089 7,027 9,725
11,251 12,811 13, 853 14, 857 15, 485 16, 233
12, 170 13, 275 17,938 22, 512 21, 210 22, 225 20, 584 19, 473 18, 220
$188, 637 9,298 9,680
11, 920 15, 296 16, 736 17, 396 17, 975 17, 577 17, 533
14, 859 16, 648 22, 323 27, 849 29, 243 29, 325 25, 244 23, 584 24, 600
$152, 067 10, 265 10, 845 12, 842 15, 728 12, 961 13, 462 12, 008 12, 262 12, 903
10, 641 11,611 15, 768 16, 398 15, 547 16, 403 15, 104 14, 746 13, 265
$50, 618 2,691 3,229 3,677 4,703 5,207 4,334 4,601 4,333 4,856
2,585 2,727 3,959 5,070 4,934 5,176 4,599 4, 507 4,856
$80, 838 5,995 5,686 8,474 6,413 7,668 8,357 7,414 6,477 5,974
5,018 5,601 6,582 7,548 7,147 7,381 6,526 6,229 6,793
$627, 623 35, 338 36, 467 46, 638 53, 391 55, 383 57, 402 56, 855 56, 134 57, 499
45, 273 49, 862 66, 570 79, 377 78, 081 80, 510 72, 057 68, 539 67, 734
Table 5.—Estimated volume of new loans by all savings and loan associations, classified according
to type of association
[Amounts are i
Month
1936 January February March __ _ April May June __ July August »_ September
1937 January February March April May__ __ June July August September
shown in thousands of dollars]
Volume of loans
Total
$627, 623 35, 338 36, 467 46, 638 53, 391 55, 383 57, 402 56, 855 56, 134 57, 499
45, 273 49, 862 66, 570 79, 377 78, 081 80, 510 72, 057 68, 539 67, 734
Federal
$228, 896 11, 764 12, 105 15, 310 17, 740 18, 965 21, 247 21, 491 21, 571 22, 500
17, 762 19, 580 28, 147 33, 301 31, 488 32, 121 29, 213 27, 220 26, 481
State members
$275, 972 16, 436 15, 206 19, 776 25, 497 25, 113 26, 033 24, 874 23, 871 23, 860
19,311 22, 068 28, 401 34, 644 35, 785 36, 520 32, 662 30, 692 30, 704
Nonmem-bers
$122, 755 7,138 9, 156
11,552 10, 154 11,305 10, 122 10, 490 10, 692 11, 139
8,200 8,214
10, 022 11, 432 10, 808 11, 869 10, 182 10, 627 10, 549
Percent of total
Federal
36 33 33 33 33 34 37 38 38 39
39 39 42 42 40 40 41 40 39
State members
44 47 42 42 48 45 45 44 43 42
43 44 43 44 46 45 45 45 45
Nonmem-bers
20 20 25 25 19 21 18 18 19 19
18 17 15 14 14 15 14 15 16
November 1937 63
Digitized for FRASER http://fraser.stlouisfed.org/ Federal Reserve Bank of St. Louis
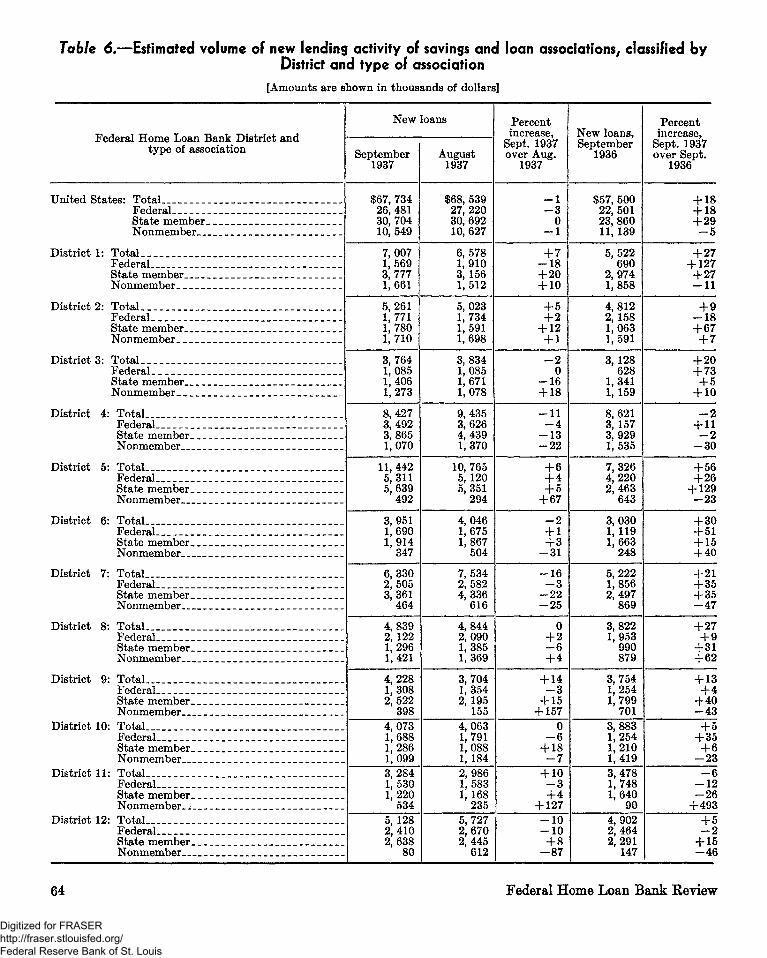
Table 6.—Estimated volume of new lending activity of savings and loan associations, classified by District and type of association
[Amounts are shown in thousands of dollars]
Federal Home Loan Bank District and type of association
United States: Total _ Federal State member Nonmember
District 1: Total _ Federal State member Nonmember
District 2: TotaL. Federal State member Nonmember
District 3: Total Federal State member Nonmember l
District 4: Total Federal _ State member Nonmember
District 5: Total __ __ Federal State member Nonmember
District 6: Total Federal State member Nonmember
District 7: Total Federal State member Nonmember
District 8: Total Federal State member Nonmember
District 9: Total _ Federal State member Nonmember
District 10: Total Federal State member Nonmember
District 11: Total Federal State member Nonmember. a
District 12: Total . . . Federal State member Nonmember
New loans
September 1937
$67, 734 26,481 30, 704 10, 549
7, 007 1, 569 3, 777 1,661
5,261 1, 771 1, 780 1, 710
3, 764 1, 085 1, 406 1,273
8,427 3,492 3,865 1,070
11, 442 5,311 5,639
492
3,951 1,690 1,914
347
6,330 2,505 3,361
464
4,839 2, 122 1,296 1,421
4, 228 1, 308 2, 522
398 4, 073
1 1,688 1, 286 1, 099 3,284 1, 530
1 1,220 i 534
5, 128 I 2,410
2, 638 80
August 1937
$68, 539 27, 220 30, 692 10, 627
6, 578 1, 910 3, 156 1,512
5, 023 1, 734 1,591 1, 698
3, 834 1, 085 1,671 1, 078
9,435 3,626 4,439 1,370
10, 765 5,120 5,351
294
4,046 1,675 1,867
504
7,534 2,582 4,336
616
4,844 2, 090 1,385 1, 369
! 3,704 1 1,354 j 2, 195
155 4,063 1, 791 1, 088 1, 184 2,986 1, 583 1, 168
235 5, 727 2, 670 2, 445
612
Percent j increase, j
Sept. 1937 over Aug.
1937
- 1 - 3 j
o - 1 + 7
- 1 8 +20 + 10 j
+ 5 1 + 2
+ 12 + 1 1 - 2
0 - 1 6 + 18
- 1 1 - 4
- 1 3 - 2 2
+ 6 + 4 + 5
+67
- 2 + 1 + 3
- 3 1
- 1 6 - 3
- 2 2 - 2 5
0 + 2 - 6 + 4
+ 14 - 3
+ 15 + 157
~ " o 1 - 6 | +18
- 7 + 10
- 3 + 4
+ 127 - i o - 1 0
+ 8 - 8 7
New loans, September j
1936
$57, 500 22,501 23, 860 11, 139
5, 522 690
2, 974 1, 858
4, 812 2, 158 I 1, 063 1,591
3, 128 j 628
1,341 ! 1,159
8,621 3, 157 3,929 1,535
7,326 4,220 2,463
643
3,030 1,119 1,663
248
5,222 1,856 2,497
869
3,822 1,953
990 879
3, 754 1, 254
! 1,799 701
3,883 1, 254 1, 210 1, 419
""3,478 1, 748 1, 640
90 4, 902 2, 464 2, 291
1 14L
Percent increase,
Sept. 1937 over Sept.
1936
+ 18 + 18 +29
- 5
+27 + 127
+27 - 1 1
+ 9 - 1 8 +67 + 7
+20 + 73 + 5
+ 10
- 2 + 11
- 2 - 3 0
+56 +26
+ 129 - 2 3
+ 30 + 51 + 15 + 40
+ 21 +35 + 35 - 4 7
+ 27 + 9
+31 +62
+ 13 + 4
+ 40 - 4 3
1 + 5 I +35
+ 6 - 2 3
- 6 - 1 2 - 2 6
+ 493 " " "~+5
- 2 + 15 - 4 6
64 Federal Home Loan Bank Review
Digitized for FRASER http://fraser.stlouisfed.org/ Federal Reserve Bank of St. Louis
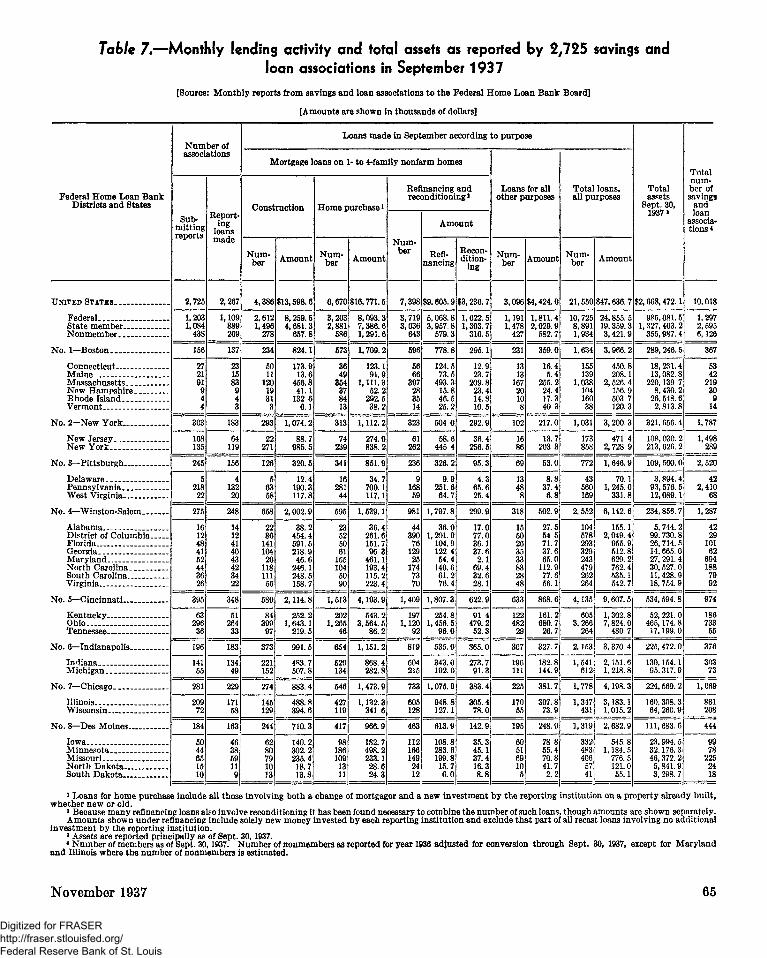
Table 7.—Monthly lending activity and total assets as reported by 2,725 savings and loan associations in September 1937
[Source: Monthly reports from savings and loan associations to the Federal Home Loan Bank Board]
[Amounts are shown in thousands of dollars]
Federal Home Loan Bank Districts and States
UNITED STATES
Federal State member Nonmember
No. 1—Boston
Connecticut Maine Massachusetts New Hampshire Rhode Island Vermont
No. 2—New York
New Jersey. New York
No. 3—Pittsburgh
Delaware Pennsylvania West Virginia
No. 4—Winston-Salem
Alabama District of Columbia . Florida Georgia Maryland North Carolina. _ South Carolina Virginia
No. 5—Cincinnati
Kentucky Ohio Tennessee
No. 6—Indianapolis
Indiana Michigan
No. 7—Chicago
Illinois Wisconsin
No. 8—Des Moines
Iowa Minnesota. __ _ Missouri North Dakota South Dakota
Number of associations
Submitting reports
2,725
1,203 1,084
438
166
27 21 91 9 4 4
303
168 136
245
5 218 22
275
16 12 48 41 52 44 36 26
395
63 296 36
196
141 55
281
209 72
184
50 44 65 15 10
Reporting
loans made
2,267
1,109 889 269
137
23 15 83 9 4 3
183
64 119
156
4 132 20
248
14 12 41 40 43 42 34 22
348
51 264 33
183
134 49
229
171 58
163
46 38 69 11 9
= —
Loans made in September according to purpose
Mortgage loans on 1
Construction
Number
4,386
2,612 1,496
278
234
50 11
120 19 31 3
293
22 271
126
5 63 58
658
22 86
141 104 20
118 111 56
580
84 399 97
373
221 152
274
145 129
244
62 80 79 10 13
Amount
$13,598.6
8,259.5 4,681.3
657.8
824.1
173.9 13.6
456.8 41.1
132 6 6.1
1,074.2
88.7 985.5
320.5
12.4 190.3 117.8
2,002.9
38.2 454.4 591.5 218.9 46.6
246.1 248.5 158.7
2,114.8
252.2 1,643.1
219.5
991.5
483.7 507.8
883.4
488.8 394.6
710.3
140.2 302.2 235.4 18.7 13.8
L- to 4-family nonfarm homes
Home purchase*
Number
6,670
3,203 2,881
586
573
36 49
354 37 84 13
313
74 239
341
16 281 44
595
23 52 50 61
165 104 50 90
1,513
202 1,265
46
654
520 134
546
427 119
417
98 186 109 13 11
Amount
$16,771.5
8,093.3 7,386.6 1,291.6
1,709.2
123.1 91.9
1,111.3 52.2
292.5 38.2
1,112.2
274.0 838.2
851.9
34.7 700.1 117.1
1,539.1
36.4 261.6 151.7 96 3
461.1 193.4 115.2 223.4
4,193.9
543.2 3,564. 5
86.2
1,151. 2
868.4 282.8
1,473.9
1,132.3 341 6
966.9
182.7 498.2 233.1 28.6 24.3
Refinancing and reconditioning1
Number
7,398
3,719 3,036
643
596
56 66
397 28 35 14
323
61 262
236
9 168 59
981
44 390 76
129 25
174 73 70
1,409
197 1,120
92
819
604 215
733
605 128
463
112 166 149 24 12
Amount
Refinancing
$9,605.9
5,068.8 3,957.8
579.3
778.8
124.5 73.5
493.3 15.8 46.5 25.2
504 0
58.6 445 4
326.2
9.9 251.6 64.7
1,797.8
36.0 1,201.9
104.9 122 4 54.4
140.6 61.2 76.4
1,807.3
254.8 1,456.5
96.0
535.0
343.0 192.0
1,075.9
948.8 127.1
613.9
108.8 283.6 199.8 15.7 6.0
Recondition
ing
$3,236.7
1,622.5 1,303.7
310.5
295.1
12.9 23.7
209.8 23.4 14.8 10.5
292.9
36.4 256.5
95.3
4.3 65.6 25.4
299.9
17.0 77.0 36.1 37.6 2.1
69.4 32.6 28.1
622.9
91 4 479.2 52.3
365.0
273.7 91.3
383.4
305.4 78.0
142.9
35.3 45.1 37.4 16.3 8.8
Loans for all other purposes
Number
3,096
1,191 1,478
427
231
13 13
167 20 10 8
102
16 86
69
13 48 8
318
15 60 26 35 33 83 28 48
633
122 482 29
307
196 111
225
170 55
195
60 51 69 10 5
Amount
$4,424.0
1,811.4 2,029.9
582.7
359.0
16.4 5.4
255.2 24.4 17.3 40 3
217.0
13.7 203 3
53.0
8.8 37.4 6.8
502.9
27.5 64 5 71.7 37.6 65.0
112.9 77.6 56.1
868.6
161.2 680.7 26.7
327.7
182.8 144.9
381.7
307.8 73.9
248.9
78 8 55.4 70.8 41.7 2.2
Total loans, all purposes
Number
21,550
10,725 8,891 1,934
1,634
155 139
1,038 104 160 38
1,031
173 858
772
43 560 169
2,552
104 578 293 329 243 479 262 264
4,135
605 3,266
264
2.153
1,541 612
1,778
1,347 431
1,319
332 483 406 57 41
Amount
$47,636.7
24,855.5 19,359.3 3,421.9
3,966.2
450.8 208.1
2,526. 4 156. 9 503 7 120.3
3,200.3
471 4 2,728.9
1,646.9
70.1 1,245.0
331.8
6,142. 6
155.1 2,049.4
955.9 612.8 629.2 762.4 535.1 542.7
9,607. 5
1,302.8 7,824.0
480.7
3,370 4
2,151.6 1, 218.8
4,198.3
3,183.1 1,015.2
2,682.9
545. 8 1,184.5
776.5 121.0 55.1
Total assets
Sept. 30, 1937»
$2,668,472.1
985,081.5 1,327,403.2
355,987.4
289, 246.5
18,231. 4 13,082.8
220,139 7 8,430.2
26.548. 6 2,813.8
321, 656.4
108,030.2 213,626. 2
109,560.0
3,894. 4 93,576. 5 12,089.1
234,856.7
5,744. 2 99.730.8 26, 714. 5 14.665. 0 27,291.4 30,527.0 11.428.9 18,754. 9
534,594. 8
52, 221.0 465,174.8 17.199.0
225,472.0
130.154.1 95.317.9
224,569. 2
160,308.3 64, 260. 9
111,683.6
23.994. 5 32.176. 3 46,372. 2 5,841.9 3,298.7
Total number of savings
and loan
associations*
10,018
1.297 2,595 6,126
367
53 42
219 30 9
14
1,787
1,498 289
2,520
42 2,410
68
1,287
42 29
101 62
694 188 79 92
974
186 733 55
376
303 73
1,069
861 208
444
99 78
225 24 18
1 Loans for home purchase include all those involving both a change of mortgagor and a new investment by the reporting institution on a property already built, whether new or old.
2 Because many refinancing loans also involve reconditioning it has been found necessary to combine the number of such loans, though amounts are shown separately. Amounts shown under refinancing include solely new money invested by each reporting institution and exclude that part of all recast loans involving no additional
investment by the reporting institution. 3 Assets are reported principally as of Sept. 30,1937. * Number of members as of Sept. 30,1937. Number of nonmembers as reported for year 1936 adjusted for conversion through Sept. 30, 1937, except for Maryland
and Illinois where the number of nonmembers is estimated.
November 1937 65
Digitized for FRASER http://fraser.stlouisfed.org/ Federal Reserve Bank of St. Louis
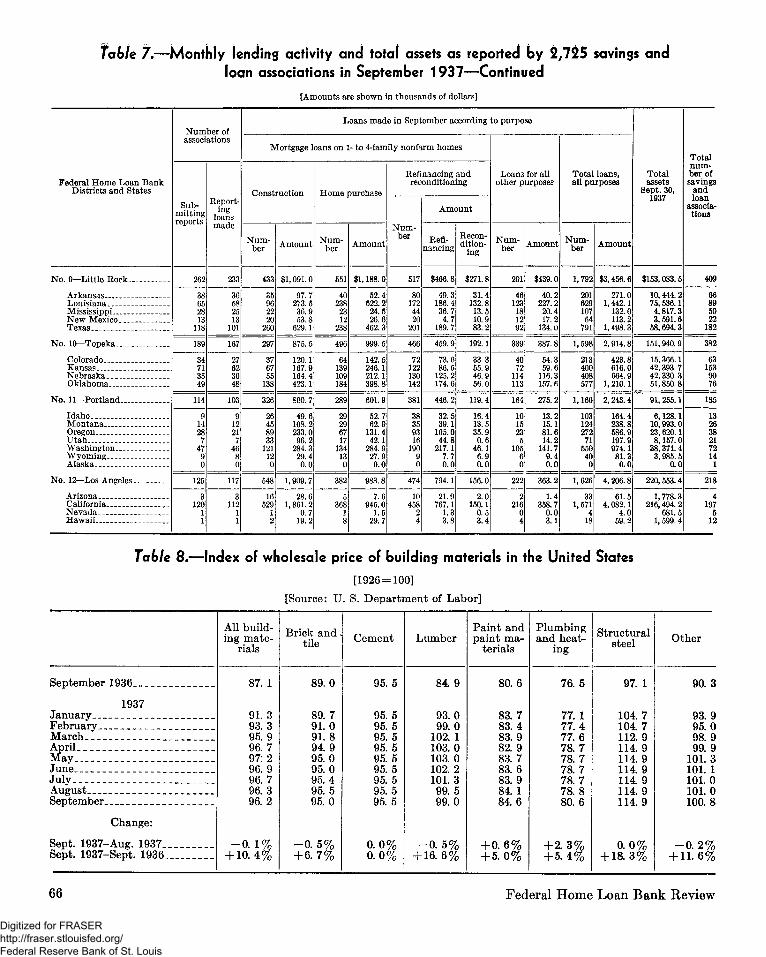
table ?.—Monthly lending activity and total assets as reported by 2,725 savings and loan associations in September 1937—Continued
[Amounts are shown in thousands of dollars]
Federa l H o m e Loan B a n k Dis t r ic t s and Sta tes
N o . 9—Little Rock
Arkansas Louis iana Mississ ippi N e w Mexico Texas _
N o . 10—Topeka _
Colorado Kansas N e b r a s k a Ok lahoma
N o . 11—Port land. _.
I daho __ M o n t a n a Oregon U t a h Wash ing ton W y o m i n g Alaska
N o . 12—Los Anneles
Arizona California N e v a d a H a w a i i
N u m b e r of associations
Submi t t ing reports
262
38 65 28 13
118
189
34 71 35 49
114
9 14 28
7 47 9 0
125
3 120
1 1
Repor t ing
loans m a d e
233
36 58 25 13
101
167
27 62 30 48
103
9 12 21 7
46 8 0
117
3 112
1 1
Loans m a d e in September according to purpose
Mor tgage loans on 1- to 4-family nonfarm homes
Const ruc t ion
N u m ber
433
35 96 22 20
260
297
37 67 55
138
326
26 45 89 33
121 12 0
548
16 529
1 2
A m o u n t
$1,091.0
97.7 273.5 36.9 53.8
629.1
875.5
120.1 167.9 164.4 423.1
800.7
49.6 108.2 233.0
96.2 284.3
29.4 0.0
1,909.7
28.6 1,861.2
0.7 19.2
H o m e purchase
N u m ber
551
40 238 23 12
238
496
64 139 109 184
289
29 29 67 17
134 13 0
382
5 368
1 8
A m o u n t
$1,188.0
52.4 622.2
24.5 26.6
462.3
999.5
142.5 246.1 212.1 398.8
601.9
52.7 62.9
131.4 42.1
284.9 27.9 0.0
983.8
7.6 945.0
1.5 29.7
Refinancing a n d recondit ioning
N u m ber
517
80 172 44 20
201
466
72 122 130 142
381
38 35 93 16
190 9 0
474
10 458
2 4
A m o u n t
Refinanc ing
$466.8
49.3 186.4 36.7
4.7 189.7
459.9
73.6 86.5
125.2 174.6
446.2
32.5 39.1
105.0 44.8
217.1 7.7 0.0
794.1
21.9 767.1
1.3 3.8
Recondit ion
ing
$271.8
31.4 132.8
13.5 10.9 83.2
192.1
33 3 55.9 46.9 56.0
119.4
16.4 13.5 35.9
0.6 46.1
6.9 0.0
156.0
2.0 150.1
0.5 3.4
Loans for all other purposes
N u m ber
291
46 123 18 12 92
339
40 72
114 113
164
10 15 23
5 105
6 0
222
2 216
0 4
Amoun t
$439.0
40.2 227.2
20.4 17.2
134.0
387.8
54.3 59.6
116.3 157. 6
275.2
13.2 15.1 81.6 14.2
141.7 9.4 0.0
363.2
1.4 358.7
0.0 3.1
T o t a l loans, all purposes
N u m ber
1,792
201 629 107 64
791
1,598
213 400 408 577
1,160
103 124 272 71
550 40
0
1,626
33 1,571
4 18
A m o u n t
$3,456.6
271.0 1,442.1
132.0 113.2
1,498.3
2,914.8
423.8 616.0 664.9
1,210.1
2,243. 4
164.4 238.8 586.9 197.9 974.1
81.3 0.0
4,206.8
61.5 4,082.1
4.0 59.2
T o t a l assets
Sept . 30, 1937
$153,083.5
10,444.2 75,536.1 4,817.3 3,591.6
58,694.3
151,940.9
15,366.1 42.393.7 42,330.3 51.850.8
91,255.1
6,128.1 10,993.0 23,620.1 8,157.0
38,371.4 3,985.5
0.0
220,553.4
1,778.3 216,494. 2
681.5 1, 599. 4
T o t a l n u m ber of savings
a n d loan
associat ions
409
66 89 50 22
182
382
63 153 90 76
185
13 26 38 21 72 14
1
218
4 197
5 12
Table 8.—Index of wholesale price of building materials in the United States
[1926=100]
[Source: U. S. Department of Labor]
September 1936
1937 January February March April May June July August September
Change:
Sept. 1937-Aug. 1937_ Sept. 1937-Sept. 1936.
All building mate
rials
87. 1
91.3 93.3 95.9 96.7 97:2 96.9 96.7 96.3 96.2
- 0 . 1 % + 10.4%
Brick and tile
89.0
89.7 91.0 91.8 94.9 95.0 95.0 95.4 95.5 95.0
- 0 . 5 % + 6.7%
Cement
95.5
95.5 95.5 95.5 95.5 95.5 95.5 95.5 95.5 95.5
0.0% 0.0%
Lumber
84.9
93.0 99.0
102. 1 103.0 103.0 102.2 101.3 99.5 99.0
- 0 . 5% + 16.6%
Paint and paint ma
terials
80.6
83.7 83.4 83.9 82.9 83.7 83.6 83.9 84. 1 84.6
+ 0. 6% + 5. 0%
Plumbing and heat
ing
76.5
77. 77. 77.6 78.7 78.7 78.7 78.7 78.8 80.6
+ 2 . 3 % + 5. 4%
Structural steel
97. 1
104.7 104.7 112.9 114.9 114.9 114.9 114.9 114.9 114.9
0 .0% + 18.3%
Other
90.3
93.9 95.0 98.9 99.9
101.3 101. 1 101.0 101.0 100.8
- 0 . 2% + 11.6%
66 Federal Home Loan Bank Review
Digitized for FRASER http://fraser.stlouisfed.org/ Federal Reserve Bank of St. Louis
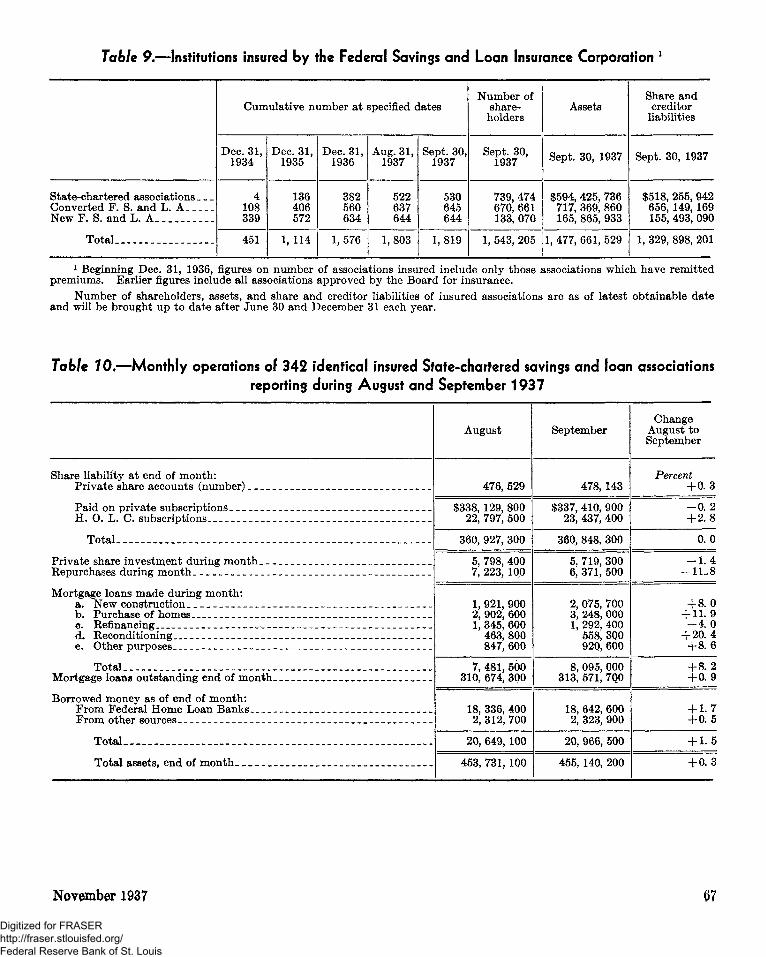
Table 9.—Institutions insured by the Federal Savings and Loan Insurance Corporation l
State-chartered associations Converted F. S. and L. A New F. S. and L. A
Total
Cumulative number at specified dates
Dec. 31, 1934
4 108 339
451
Dec. 31, 1935
136 406 572
1,114
Dec. 31, 1936
382 560 634
1,576
Aug. 31, 1937
522 637 644
1,803
Sept. 30, 1937
530 645 644
1,819
Number of share
holders
Sept. 30, 1937
739, 474 670, 661 133, 070
1, 543, 205
Assets
Sept. 30, 1937
$594, 425, 736 717, 369, 860 165, 865, 933
1, 477, 661, 529
Share and creditor
liabilities
Sept. 30, 1937
$518, 255, 942 656, 149, 169 155, 493, 090
1, 329, 898, 201
1 Beginning Dec. 31, 1936, figures on number of associations insured include only those associations which have remitted premiums. Earlier figures include all associations approved by the Board for insurance.
Number of shareholders, assets, and share and creditor liabilities of insured associations are as of latest obtainable date and will be brought up to date after June 30 and December 31 each year.
Table 10.—Monthly operations of 342 identical insured State-chartered savings and loan associations reporting during August and September 1937
Share liability at end of month: Private share accounts (number) , .__
Paid on private subscriptions H. O. L. C. subscriptions
Total
Private share investment during month Repurchases during month
Mortgage loans made during month: a. New construction , b. Purchase of homes , , c. Refinancing d. Reconditioning e. Other purposes
Total ^ — „ -Mortgage loans outstanding end of month
Borrowed money as of end of month: From Federal Home Loan Banks ,. From other sources
Total
Total assets, end of month ,.
August
476, 529
$338, 129, 800 22, 797, 500
360, 927, 300
5, 798, 400 7, 223, 100
1, 921, 900 2, 902, 600 1, 345, 600
463, 800 847, 600
7, 481, 500 310, 674, 300
18, 336, 400 2, 312, 700
1 20, 649, 100
! 453, 731, 1Q0
September
478, 143
$337, 410, 900 23, 437, 400
36Q, 848, 300
5, 719, 300 6, 371, 500
2, 075, 700 3, 248, 000 1, 292, 400
558, 3Q0 92Q, 600
8, 095, 000 313, 571, 7Q0
18, 642, 600 2, 323, 900
1 20, 966, 500
1 455, 140, 200
Change August to September
Percent + 0.3 - 0 . 2 + 2.8
0.0
- 1 . 4 -11..8
+8.0 + 11.9 - 4 . 0
+ 20.4 + 8.6
+ 8.2 + 0.9
+ 1.7 + 0.5
+ 1.5
+ 0.3
November 1937 i>7
Digitized for FRASER http://fraser.stlouisfed.org/ Federal Reserve Bank of St. Louis
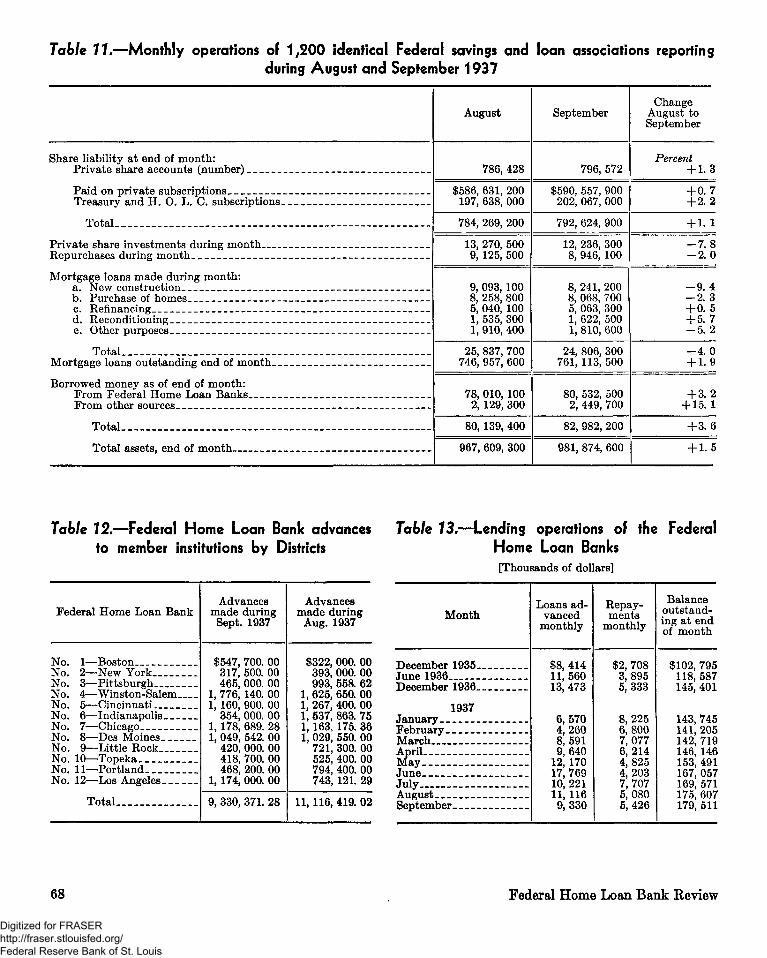
Table 11*—Monthly operations of 1,200 identical Federal savings and loan associations reporting during August and September 1937
Share liability at end of month: Private share accounts (number)
Paid on private subscriptions Treasury and H. 0 . L. C. subscriptions
Total
Private share investments during month Repurchases during month
Mortgage loans made during month: a. New construction b. Purchase of homes
d. Reconditioning e. Other purposes
TotaL__ Mortgage loans outstanding end of month
Borrowed money as of end of month: From Federal Home Loan Banks From other sources-_
Total _-_
Total assets, end of month
August
786, 428
$586, 631, 200 197, 638, 000
784, 269, 200
13, 270, 500 9, 125, 500
9, 093, 100 8, 258, 800 5, 040, 100 1, 535, 300 1, 910, 400
25, 837, 700 746, 957, 600
78, 010, 100 2, 129, 300
80, 139, 400
967, 609, 300
September
796, 572
$590, 557, 900 202, 067, 000
792, 624, 900
12, 236, 300 8, 946, 100
8, 241, 200 8, 068, 700 5, 063, 300 1, 622, 500 1, 810, 600
24, 806, 300 761, 113, 500
80, 532, 500 2, 449, 700
82, 982, 200
981, 874, 600
Change August to September
Percent + 1.3
+ 0. 7 + 2.2
+ 1. 1
- 7 . 8 - 2 . 0
- 9 . 4 - 2 . 3 + 0. 5 + 5. 7 - 5 . 2
- 4 . 0 + 1.9
+ 3.2 + 15. 1
+ 3.6
+ 1.5
Table 12.—Federal Home Loan Bank advances to member institutions by Districts
Federal Home Loan Bank
No No. No. No. No. No. No No. No. No, No, No.
1—Boston 2—New York 3—Pittsburgh 4—Winston-Salem 5—Cincinnati 6—Indianapolis 7—Chicago 8—Des Moines 9—Little Rock
10—Topeka 11—Portland. __ 12—Los Angeles
Total
Advances made during
Sept. 1937
$547, 700. 00 317, 500. 00 465, 000. 00
1, 776, 140. 00 1, 160, 900. 00
354, 000. 00 1, 178, 689, 28 1, 049, 542. 00
420, 000. 00 418, 700. 00 468, 200. 00
1, 174, 000. 00
9, 330, 371. 28
Advances made during
Aug. 1937
$322, 000. 00 393, 000. 00 993, 558. 62
1, 625, 650. 00 1, 267, 400. 00 1, 537, 863. 75 1, 163, 175. 36 1, 029, 550. 00
721, 300. 00 525, 400. 00 794, 400. 00 743, 121. 29
11, 116, 419. 02
Table 73.—Lending operations of the Federal Home Loan Banks [Thousands of dollars]
Month
December 1935 June 1936 December 1936
1937 January February March April May June July August September
Loans advanced
monthly
$8, 414 11,560 13, 473
6,570 4,260 8,591 9,640
12, 170 17, 769 10, 221 11,116 9,330
Repayments
monthly
$2, 708 3,895 5,333
8,225 6,800 7,077 6,214 4,825 4,203 7,707 5,080 5,426
Balance outstanding at end of month
$102, 795 118,587 145, 401
143, 745 141, 205 142, 719 146, 146 153, 491 167, 057 169, 571 175, 607 179, 511
68 Federal Home Loan Bank Review
Digitized for FRASER http://fraser.stlouisfed.org/ Federal Reserve Bank of St. Louis
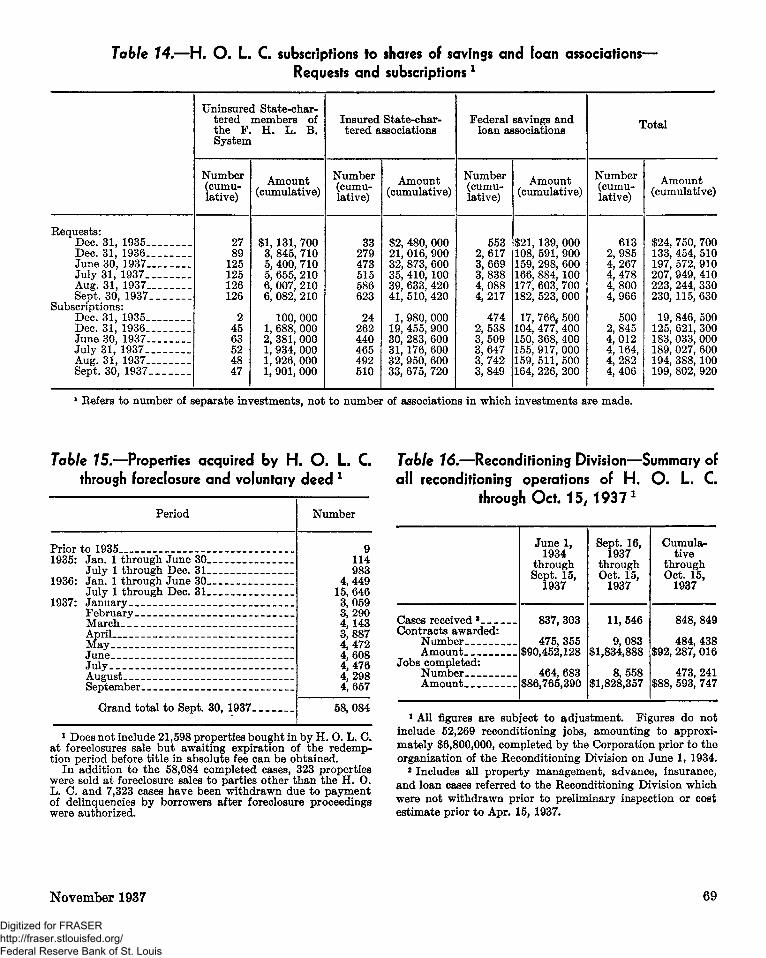
Table 14,—H. O. L. C. subscriptions to shares of savings and loan associations— Requests and subscriptions l
Requests: Dec. 31, 1935 Dec. 31, 1936 June 30, 1937 July 31, 1937 Aug. 31, 1937 Sept. 30, 1937- _
Subscriptions: Dec. 31, 1935 Dec. 31, 1936 June 30, 1937 July 31, 1937 Aug. 31, 1937 Sept. 30, 1937
Uninsured State-chartered members of the F. H. L. B. System
Number (cumulative)
27 89
125 125 126 126
2 45 63 52 48 47
Amount (cumulative)
$1,131, 700 3, 845, 710 5, 400, 710 5, 655, 210 6, 007, 210 6, 082, 210
100, 000 1, 688, 000 2, 381, 000 1, 934, 000 1, 926, 000 1, 901, 000
Insured State-chartered associations
Number (cumulative)
33 279 473 515 586 623
24 262 440 465 492 510
Amount (cumulative)
$2, 480, 000 21, 016, 900 32, 873, 600 35, 410, 100 39, 633, 420 41, 510, 420
1, 980, 000 19, 455, 900 30, 283, 600 31, 176, 600 32, 950, 600 33, 675, 720
Federal savings and loan associations
Number (cumulative)
553 2,617 3,669 3,838 4,088 4,217
474 2,538 3,509 3,647 3,742 3,849
Amount (cumulative)
$21, 139, 000 108, 591, 900 159, 298, 600 166, 884, 100 177, 603, 700 182, 523, 000
17, 766, 500 104, 477, 400 150, 368, 400 155, 917, 000 159, 511, 500 164, 226, 200
Total
Number (cumulative)
613 2,985 4,267 4,478 4,800 4,966
500 2,845 4,012 4, 164, 4,282 4,406
Amount (cumulative)
$24, 750, 700 133, 454, 510 197, 572, 910 207, 949, 410 223, 244, 330 230, 115, 630
19, 846, 500 125, 621, 300 183, 033, 000 189, 027, 600 194, 388, 100 199, 802, 920
1 Refers to number of separate investments, not to number of associations in which investments are made.
Table 15,—Properties acquired by H. O. L C through foreclosure and voluntary deed x
Period
Prior to 1935 1935: Jan. 1 through June 30__
July 1 through Dec. 31 1936: Jan. 1 through June 30 __
July 1 through Dec. 31 1937: January
February March April May June July August September
Grand total to Sept. 30, 1937
Number
9 114 983
4,449 15, 646 3,059 3,290 4,143 3,887 4,472 4,608 4,476 4,298 4,657
58, 084
1 Does not include 21,598 properties bought in by H. O. L. C. at foreclosures sale but awaiting expiration of the redemption period before title in absolute fee can be obtained.
In addition to the 58,084 completed cases, 323 properties were sold at foreclosure sales to parties other than the H. O. L. C. and 7,323 cases have been withdrawn due to payment of delinquencies by borrowers after foreclosure proceedings were authorized.
Table 16,—Reconditioning Division—Summary of all reconditioning operations of H. O. L. C.
through Oct. 15,1937*
Cases received * Contracts awarded:
Number Amount
Jobs completed: Number Amount.-.
June 1, 1934
through Sept. 15,
1937
837, 303
475, 355 $90,452,128
464, 683 $86,765,390
Sept. 16, 1937
through Oct. 15,
1937
11, 546
9,083 $1,834,888
8,558 $1,828,357
Cumulative
through Oct. 15,
1937
848, 849
484, 438 $92, 287, 016
473, 241 $88, 593, 747
1 All figures are subject to adjustment. Figures do not include 52,269 reconditioning jobs, amounting to approximately $6,800,000, completed by the Corporation prior to the organization of the Reconditioning Division on June 1, 1934.
2 Includes all property management, advance, insurance, and loan cases referred to the Reconditioning Division which were not withdrawn prior to preliminary inspection or cost estimate prior to Apr. 15, 1937.
November 1937 69
Digitized for FRASER http://fraser.stlouisfed.org/ Federal Reserve Bank of St. Louis
Interest Rates
(Continued from page 50)
best risks to other types of institutions. Second, it loses the best loans in its portfolio when, through repayment of principal, those loans have graduated into the "low risk" class and have been refinanced at lower rates by competitors.
I t must be noted, however, that exceptions to this position of the savings and loan association do occur, particularly in small or isolated communities where such variations have a tendency to level off. Competition is less, income ranges are smaller, and neighborhood characteristics show less variation. But the figures emphasize that in the majority of communities variations in competitive rates and borrowers do exist.
To get out of the "spot" class many schemes have been evolved, all of which necessarily employ the obvious: a variation of the terms offered potential borrowers. The most directly effective method is to vary the interest rate, but if the association is to preserve the good-will of its borrowers and also to insure itself that risks are accurately appraised, it cannot leave the rating of those borrowers to the judgment of its officers no matter how competent they may be. An objective test is needed to supplement the experience of the mortgage lender. This this is found in what are commonly called loan-classification sheets or rating sheets.
The first such loan-classification sheet was developed during 1934 by an association in the Southwest. I t consisted of a list of the elements of risk involved in lending and a method of classifying those risks to determine the interest rate to be charged. Points, known as deficiency points, were assigned to each item on the sheet so the best risk would receive the least number of points and the poorest acceptable risk would receive the most. Thus, a borrower who received 0 to 6 points would be charged the minimum interest rate while one who received from 15 to 18 points would be charged a rate 2 percent higher. Three other gradings in between the extremes were provided, the interest rate increasing one-half of 1 percent with each grade. The development of the sheet and an analysis of the possible rating points which might be included were published in earlier issues of the E E V I E W .
I t is not possible to set up a standard sheet which will be successful in all communities or in all associa
tions. Some managers may find a simplified method of rating best suited to their needs while others may prefer a detailed and carefully weighted sheet. Other possible variations present themselves such as credit rating in contrast to deficiency rating. But no matter what plan is used it should serve to supplement the judgment of the responsible savings and loan official: not to replace that judgment.
EXPERIENCE OF ASSOCIATIONS
Now that three years have passed since the first loan-classification sheet was developed it is possible to report the current effects of the program on the associations which have been using it, even though the real value of this method depends on the long-range effect on the association's loan portfolio.
The officials of several associations in different parts of the country have replied to requests for information concerning the type of loan-classification sheet used and its specific effects on operations. Most of these operators expressed satisfaction with their own methods of varying interest rates. At the same time, there is little similarity between the rating sheets or the substitute plans used. These various methods of risk classification will be discussed in a later issue of the KEVIEW.
The association in which the variable interest rate plan was originated and first used has loaned over $3,000,000 under the rating schedule with highly satisfactory results. The correspondent from the association says:
" I don't believe that , under the present conditions the building and loan industry, at least in this section of the country, can compete with banks, life insurance companies, and other mortgage lenders without some type of variable rate setup unless they do a volume of business in the less desirable loans. For after all, the 1-rate plan is usually the maximum-rate plan. The borrower with the prime loan is absolutely not going to pay the freight of the borrower in the higher rate bracket, and this is what happens on the 1-rate system."
As this subject is of such general interest it will be discussed from time to time in the R E V I E W . Associations which have had experience with any variable plan of risk rating are urged to send in a report of its effectiveness if they have not already done so in order that others in the business may benefit from their experience. Future articles will discuss more specifically the forms and variations of loan-classification sheets.
70 Federal Home Loan Bank Review
Digitized for FRASER http://fraser.stlouisfed.org/ Federal Reserve Bank of St. Louis
Administrative Rulings, Board Resolutions, and
Counsel's Opinions
Digest of A-B-C Book Opinion
ANY member may obtain from a Federal Home Loan Bank a copy of any administrative ruling, Board resolution, or the complete text of any opinion of the Legal Department of the Board, the digest of which is printed in the REVIEW. "A" indicates Administrative rulings by the Governor; " B " indicates resolutions of the Board; and "C" indicates Counsers opinions. In requesting any such copy, its A-B-C Book reference number and date, as given in parentheses at the end of each of the following digests, should be cited. Copies of the A-B-C Book itself are not available for distribution.
UNCLAIMED ACCOUNTS—Fed. Charter K, Sec. 9. Inactive and unclaimed accounts which are on the books of
an association at the time of conversion, become Federal share accounts upon conversion and, as such, must be carried as share liabilities. Charter K, Section 9 provides that the association shall not be required to credit dividends on inactive share accounts of $5.00 or less but except for this provision, all accounts in Federal associations, whether dormant or otherwise, are entitled to pro rata participation in the earnings of the association. Except for this $5.00 provision in Charter K, the same rule is applicable whether the association is operating under Charter K or Charter E. State statutes providing for a report of dormant accounts or for escheat to the State after the expiration of a fixed number of years, are inapplicable to accounts in Federal associations.
(A-B-C Book, C-001, July 16, 1937)
MORTGAGE LOANS—Prepayment of, penalty on. Fed. Charter E, Sec. 12; Fed. Charter K, Sec. 14; Fed. Reg., Sec. 40.
1. Under Section 12 of Charter E, a borrower is given a right to pay off his loan before maturity in whole, but not in part, in which event the association is privileged to charge interest on the unpaid balance before such prepayment, not exceeding 90 days beyond the date of such prepayment. Such an association may waive the collection of such penalty interest. Neither the charter nor the rules and regulations require that the loan contract make provision for charging such penalty interest. Charter E is silent with respect to the right of a borrower to make a partial prepayment of a loan. Such subject is, therefore, controlled solely by the principles of contract law, i. e., any such association may accept from borrowers partial prepayments on account of their loans upon such terms as it negotiates with such borrowers.
2. A borrower from an association operating under Charter K has a right under Section 14 thereof to make prepayments on account of his loan which prepayments prepay the loan in whole or in part. Such prepayments may be made only on the regular payment dates as provided in the loan contract. Such prepayments may be made without penalty except that when any such prepayment of all or any part of a loan equals or exceeds 20 percent of the original principal amount of the loan, such association is privileged under said Section 14 to charge interest in an amount equal to not more than 90 days' interest on the amount of such prepayment; provided,
however, such loan contract makes provision for charging such penalty interest. However, such association may waive the collection of such penalty interest.
3. If an association operating under either Charter E or Charter K incorporates into a loan contract a provision whereby the stipulated rate of interest may be increased 3 years or more after date of the loan on at least 4 months' written notice to the borrower, the loan contract shall also contain a provision that in the event of such an increase in the stipulated rate of interest, the borrower may prepay the loan within such notice period without the payment of any additional interest or any other penalty.
(A-B-C Book Opinion, C-149, February 17, 1937, revised July 17, 1937)
LOANS—Keal estate. Fed. Charter E, Sees. 11, 12; Fed. Charter K, Sees. 13, 14.
A Federal association has legal power to waive any lien held by it when in the bona fide judgment of the board of directors the benefit to the association lesulting from such waiver is at least equal to the value of the lien to it.
(A-B-C Book, C-047, July 23, 1937)
SHARE ACCOUNTS—Use of term "savings" as descriptive of, and in advertising. H. O. L. Act, Sees. 5 (a), 5 (b); Fed. Charter E, Sec. 6; Fed. Charter K, Sec. 6.
Section 5 (a) of Home Owners* Loan Act of 1933 authorizes the Board to incorporate Federal savings and loan asociations, giving consideration to the best practices of local mutual thrift and home-financing institutions in the United States, in order to serve two purposes which, in the judgment of Congress, will promote the general welfare: To provide local mutual thrift institutions in which people may invest their savings, and to provide for the financing of homes. I t is evident that the Federal savings and loan associations which the Board is authorized to charter, examine, and regulate are intended by Congress to be safe places for the savings of the people and are also intended to provide for the financing of homes by using such savings in making loans upon homes. Section 6 of the same statute appropriated funds to enable the Board to encourage the same two objects, which, in the judgment of Congress, would promote the general welfare: To encourage local thrift and to provide for local home financing. The sums so appropriated are required by Sec-
November 1937 71
Digitized for FRASER http://fraser.stlouisfed.org/ Federal Reserve Bank of St. Louis
tion 6 to be used impartially in the promotion and development of local thrift and home-financing institutions whether State or federally chartered. I t is, therefore, evident that Congress intended the Board to encourage savings in, and home financing by, all such thrift and home-financing institutions. Section 5 (b) of the same statute requires such Federal savings and loan associations to raise their capital only in the form of payments on shares authorized by their charter. The share accounts of members, therefore, are the evidence of the savings of the people in such Federal associations. Four types of share accounts were provided in the earliest charter for Federal associations promulgated by the Board (Exhibit E to Federal Regulations). Installment thrift shares and optional savings shares were both types of shares by which members could gradually accumulate their savings in Federal associations having such charter. Under the more recent charter (Exhibit K of Federal Regulations) members accumulate their savings gradually by payments on savings share accounts. However, prepaid and full-paid income share accounts under Charter E and investment share accounts under Charter K represent also the accumulated savings of members in Federal associations. The term "savings" is an accurate description of the investments of members in Federal savings and loan associations and in thrift and home-financing institutions chartered under the laws of the various States. The laws of many of the States provide that the word "savings" may or must be included as part of the name of thrift and home-financing institutions organized under the laws of such States, and such statutes commonly provide that the accumulation of savings is one of the objects of such institutions.
(A-B-C Book, C-037, August 10, 1937)
DIRECTORS—Kemoval of, by board of directors. Fed. Bylaws ('36), Sec. 6 (g); ('34 and '35), Sec. 8 (f); ('33), Sec. 5.
The board of directors of a Federal association has power to remove a director for cause, all the powers of a Federal association not expressly reserved by the charter to the members having been delegated to the board of directors.
Bylaws ('36), Section 6 (g), provides: "The board of directors shall have power . . . to exercise any and all of the powers of the association not expressly reserved by the charter to the members." Charter K does not reserve to the members the right to remove directors for cause. Bylaws ('34 and '35), Section 8 (f), empower the board of directors to exercise in the transaction of business any and all of the powers of the corporation. Bylaws ('33) provide that the board of directors "shall have complete responsibility for the management of the association."
When cause for removal of any director appears to exist, the board of directors may proceed to remove a director after preferring charges against such director and hearing any defense such director desires to make in person or by counsel. Such action by the board of directors should be formally taken and the charges should be properly recorded in the minutes of the association. The director charged with cause for removal has a right to know the charges and to a reasonable opportunity after reasonable notice to refute such charges. Proper protection of the asociation requires that the charges be delivered to such director in writing with a written notice
of a date set for the hearing by the board of directors of evidence tending to establish or refute the charges. Such action by the board of directors should be taken only upon advice of counsel that the charges, if substantiated, constitute legal cause for removal. If the board of directors, after hearing, votes to remove the director, such action should be recorded in the minutes of the association and a copy of such resolution or resolutions delivered to the director removed, whereupon his office shall become vacant and the board of directors may proceed to fill such vacancy as provided by the charter.
(A-B-C Book, C-123, September 23, 1937)
COMMISSIONS—On sale of accounts, right of insured institutions to pay. Ins. Reg., Sec. 7; Fed. Charter E, Sees. 10, 13; Fed. Charter K, Sec. 7.
Insurance Regulation 7 (b) provides that sales commissions shaU conform to the laws under which the insured institution operates. A State-chartered insured institution would, therefore, be governed by the laws of the State in which it is incorporated. Federal associations would be governed by Section 5 of Home Owners' Loan Act of 1933, Federal Regulations and their charter and bylaws. The same regulation prohibits sales commissions from exceeding, in any event, 2 percent of the par or maturity value of the securities sold. This limitation applies to both State and federally chartered insured institutions. The charter and bylaws and State law frequently permit State-chartered insured institutions to charge such commissions to their members as a membership, admission, withdrawal or repurchase fee. The same regulation provides that in no case shall sales commissions be charged to any shareholder or investor in excess of $25 except in connection with the sale of full-paid shares or certificates of deposit or investment.
Charter E Federal associations may charge a repurchase fee to members provided the association by vote of its shareholders has determined to charge a repurchase fee and provided any repurchase, withdrawal, membership or like fee is allowed by the law of the State in which such Federal association is located to be charged by State-chartered institutions, but in such case the fee allowed to be charged by a Charter E association shall not be in excess of that allowed to be charged by similar institutions under State law, and in no case a sum in excess of 2 percent of the par value of the shares subscribed, and in no case shall such fee or fees be charged to any one shareholder in excess of $25, except in connection with full-paid income shares (Charter E, Sec. 10). Section 13 of Charter E does not permit the association to incur any expense, in respect to the sale of shares, by way of salary, commission or otherwise, in excess of the repurchase fee of the association, if any repurchase fee is charged under the foregoing provisions. Therefore, unless a particular Charter E association has in the manner above stated determined to charge a repurchase fee, it is not permitted by its charter to incur any sales commission expense. The same section also requires Charter E associations who, under the foregoing provisions, may incur sales commission expense, to obtain the prior approval of the Federal Home Loan Bank Board before entering into any sales contract. Neither Charter K nor Federal Regulations prohibit Charter K Federal associations from incurring sales commission expenses; nor do they
72 Federal Home Loan Bank Keview
Digitized for FRASER http://fraser.stlouisfed.org/ Federal Reserve Bank of St. Louis
require Federal Home Loan Bank Board approval of commission contracts for the sale of share accounts, but such sales practices, as all other financial practices, are subject to supervision by the Board. Insurance Regulation 7(b), however, limits the amount of commissions which a Charter K Federal association may pay. The limitation of such section applied to Charter K Federal associations means a limitation of 2 percent per hundred dollars of participation value of share accounts of Charter K Federal associations sold, i. e., a maximum sales commission of 2 percent of the amount actually paid upon the purchase of share accounts through sales agents. Section 7 of Charter K, however^ forbids the charging, directly or indirectly, of any membership, admission, repurchase, withdrawal, or any other fee or sum of money, to members or investors for the privilege of becoming, remaining, or ceasing to be a member of the association. Sales commissions which a Charter K association may pay are, therefore, an expense of the association. Insurance Regulation 7(a) does not apply to Federal associal tions because they are subject to supervision by the Federal Home Loan Bank Board.
(A-B-C Book, C-074, September 30, 1937)
Resolutions of the Board AMENDMENT TO THE RULES AND REGULATIONS FOR
FEDERAL SAVINGS AND LOAN ASSOCIATIONS REGARD
ING TREASURY SHARE SUBSCRIPTIONS: Adopted October 21, 1937; effective 30 days from November 1, 1937.
The Board amended subsection (d) of Section 37 of the Kules and Regulations for Federal Savings and Loan Associations by adding at the end thereof the following:
No request for the privilege of retiring preferred shares and full-paid income shares held by the Secretary of the Treasury will be approved by the Board unless such request is submitted on a form approved by the Board and unless such request is received by the Board at its office in Washington, D. C , within 30 days subsequent to the last preceding dividend date, accompanied by a check, postal money order, or bank draft in the amount of the investment sought to be retired, together with any dividends declared but unpaid, on such investment to the last preceding dividend date.
A M E N D M E N T TO T H E R U L E S AND R E G U L A T I O N S FOR
INVESTMENT BY THE HOME OWNERS' LOAN CORPORA
TION IN SECURITIES OF SAVINGS AND LOAN ASSOCIATIONS! Adopted October 21, 1937,
The Board amended these Kules and Regulations by adding at the end thereof the following:
Be it further resolved, That requests for the privilege of retiring investments held by the Home Owners* Loan Corporation in securities of savings and loan associations shall be governed by the following provisions:
1. No request for the privilege of retiring any such investment held by the Home Owners' Loan Corporation will be approved by this Board unless such request is submitted on
a form approved by this Board and unless such request is received by this Board at its office in Washington, D. C , within 30 days subsequent to the last preceding dividend or interest date, accompanied by a check, postal money order or bank draft in the amount of the investment sought to be retired, together with any dividends or interest accrued, but unpaid, on such investment to the last preceding dividend or interest date.
2. No request by an institution for the privilege of retiring any such investment held by the Home Owners' Loan Corporation will be approved by this Board if such institution has any outstanding investment held by the Secretary of the Treasury until such institution shall have retired or made provision satisfactory to this Board for the retirement of all investments held by the Secretary of the Treasury in such institution.
3. No request by an institution for the privilege of retiring any investment held by the Home Owners' Loan Corporation in such institution will be approved by this Board unless such institution shall have retired or made provision satisfactory to this Board for the retirement of all investments made by said Corporation in such institution prior to the investment sought to be retired.
Directory of Member, Federal, and Insured Institutions
Added during September-October
I. INSTITUTIONS ADMITTED TO MEMBERSHIP IN THE FEDERAL HOME LOAN BANK SYSTEM BETWEEN SEPTEMBER 16, 1937, AND OCTOBER 15, 1937 *
[Listed by Federal Home Loan Bank Districts, States, and cities]
DISTRICT NO. 3 PENNSYLVANIA:
Philadelphia: Burton Building Association, Corner Twentieth Street & Passyunk Avenue. Home Fund Building & Loan Association, Northwest Corner Twentieth
Street & Passyunk Avenue. Protected Future Building & Loan Association, 3701 North Broad Street.
Wyomissing: Wyomissing Building & Savings Association, 801 Penn Avenue.
DISTRICT NO. 4 MARYLAND:
Baltimore: Capital Building & Loan Association of Baltimore City, 812 Light Street. Patterson Park Permanent Loan & Building Association of Baltimore City,
2000 Lombard Street. DISTRICT NO. 5
OHIO: Defiance:
Security Building & Loan Company, Corner Third & Clinton Streets.
DISTRICT NO. 6 MICHIGAN:
Grand Rapids: West Side Building & Loan Association of Grand Rapids, Michigan, 410
Bridge Street. DISTRICT NO. 7
ILLINOIS: Chicago:
George Washington Building & Loan Association, 4308 West Twenty-sixth Street.
DISTRICT NO. 8 MISSOURI:
St. Joseph: Peoples Home & Savings Association, 509 Francis Street.
DISTRICT NO. 10 KANSAS:
Overland Park: Overland Park Savings & Loan Association.
1 During this period 2 Federal savings and loan associations were admitted to membership in the System.
November 1937 73
Digitized for FRASER http://fraser.stlouisfed.org/ Federal Reserve Bank of St. Louis
DISTRICT NO. 11 MONTANA:
Havre: Havre Building & Loan Association.
WASHINGTON: Spokane:
Great Northwest Life Insurance Company, Columbia Building.
DISTRICT NO. 12 CALIFORNIA:
Pasadena: Investors Mutual Building-Loan Association, 315 East Colorado Street.
HAWAII: Honolulu:
Home Building & Loan Association, Limited, 227 South King Street.
WITHDRAWALS PROM THE FEDERAL HOME LOAN BANK SYSTEM BETWEEN SEPTEMBER 16, 1937, AND OCTOBER 15, 1937
ALABAMA: Birmingham:
Jefferson County Building & Loan Association, 213 North Twenty-first Street (assets transferred to Jefferson Federal Savings & Loan Association, Birmingham, Alabama).
ARIZONA: Phoenix:
State Building & Loan Association, 116 North First Avenue (assets transferred to First Federal Savings & Loan Association of Phoenix, Phoenix, Arizona).
CALIFORNIA: Pasadena:
California Security-Loan Corporation, 315 East Colorado Street (assets transferred to Investors Mutual Building-Loan Association, Pasadena, California).
ILLINOIS: Chicago:
Zelena Hora Building, Loan & Homestead Association, 1857 West Fifty-first Street (voluntary liquidation).
KANSAS: Salina:
Safety Savings & Loan Association (voluntary withdrawal). KENTUCKY:
Shively: Ohio Valley Building & Loan Association, 610 Louisville Trust Building
(voluntary withdrawal). OHIO:
Athens: Athens County Savings & Loan Company, 3 West Union Street (voluntary
withdrawal). Cincinnati:
Centennial Savings & Loan Company, 1610 Freeman Avenue (voluntary withdrawal).
Ringgold Building & Loan Company, 550 Ringgold Street (voluntary withdrawal) .
Marietta Savings & Loan Company, 219 Putnam Street (voluntary withdrawal).
II. FEDERAL SAVINGS AND LOAN ASSOCIATIONS CHARTERED BETWEEN SEPTEMBER 16, 1937, AND OCTOBER 15, 1937
DISTRICT NO. 2 N E W YORK:
Geneva: Geneva Federal Savings & Loan Association, 87-89 Seneca Street (converted
from Geneva Permanent Loan & Savings Association). Port Richmond (Staten Island):
North Shore Federal Savings & Loan Association, 298 Richmond Avenue (converted from North Shore Building-Loan & Savings Association).
DISTRICT NO. 4 MARYLAND:
Baltimore: Fairview Federal Savings & Loan Association, 3335 Frederick Avenue (con
verted from Fairview Building & Loan Association of Baltimore City). Wyman Park Federal Savings & Loan Association of Baltimore City, 2800
Guilford Avenue (converted from Wyman Park Building Association of Baltimore City, Incorporated).
DISTRICT NO. 5 KENTUCKY:
Russell: Russell Federal Savings & Loan Association, 323 Ferry Street (converted
from Russell Building & Loan Association). OHIO:
Dover: First Federal Savings & Loan Association of Dover, 212 West Third Street
(converted from Dover Building & Loan Company). Geneva:
Geneva Federal Savings & Loan Association, 22 East Main Street (converted from Geneva-Madison Savings & Loan Association).
DISTRICT NO. 6 INDIANA:
Jeffersonville: First Federal Savings & Loan Association of Jeffersonville.
74
DISTRICT NO. 7 ILLINOIS:
Chicago: North Avenue Federal Savings & Loan Association, 755 West North Avenue
(converted from North Avenue Building & Loan Association).
DISTRICT NO. 8 MINNESOTA:
Pipestone: Pipestone Federal Savings & Loan Association (converted from Pipestone
Building <fc Loan Association).
DISTRICT NO. 10 COLORADO:
Denver: Midland Federal Savings & Loan Association, 444 Seventeenth Street (con
verted from Midland Savings & Loan Company).
CANCELATIONS OF FEDERAL SAVINGS AND LOAN ASSOCIATION CHARTERS BETWEEN SEPTEMBER 16, 1937, AND OCTOBER 15, 1937
ALABAMA: Anniston:
First Federal Savings & Loan Association of Anniston, 16 East Eleventh Street (charter canceled on account of dissolution by liquidation).
III. INSTITUTIONS INSURED BY THE FEDERAL SAVINGS AND LOAN INSURANCE CORPORATION BETWEEN SEPTEMBER 16, 1937, AND OCTOBER 15, 1937 i
DISTRICT NO. 2 N E W JERSEY:
Bogota: Bogota Building & Loan Association, 8 East Fort Lee Road.
Red Bank: Red Bank Building & Loan Association, 12 Broad Street.
DISTRICT NO. 3 PENNSYLVANIA:
New Brighton: Home Protective Savings & Loan Association, 303 Eighth Street.
Philadelphia: Aramingo Building & Loan Association, 982 East Godfrey Avenue. Protected Future Building & Loan Association, 3701 North Broad Street.
DISTRICT NO. 4 MARYLAND:
Baltimore: Vermont Building & Loan Association, Incorporated, 2830 Edmondson
Avenue.
DISTRICT NO. 5 OHIO:
Cincinnati: Atlas Loan & Building Company, Southwest Corner Fifteenth <fc Elm
Streets. Toledo:
Corn City Savings Association, 802 South St. Clair Street.
DISTRICT NO. 7 ILLINOIS:
Chillicothe: Peoples Building & Loan Association of Chillicothe, 203 North Second
Street. WISCONSIN:
Milwaukee: Kinnickinnic Mutual Loan & Building Association, 2252 Soiith Kinnickinnic
Avenue. Metropolitan Building & Loan Association, 622 North Water Street.
DISTRICT NO. 9 LOUISIANA:
New Orleans: Provident Building & Loan Association, 320 Camp Street.
DISTRICT NO. 12 CALIFORNIA:
Los Anseles* Hollywood Building & Loan Association, 7877 Santa Monica Boulevard.
Pasadena: Investors Mutual Building-Loan Association, 315 East Colorado Street.
Pico: Pico-Rivera Building-Loan Association, 355 East Whittier Boulevard.
HAWAII: Honolulu:
Home Building & Loan Association, Limited, 227 South King Street.
i During this period 9 Federal savings and loan associations were insured.
Federal Home Loan Bank Keview U.S . GOVERNMENT PRINTING OFFICE: 1937
Digitized for FRASER http://fraser.stlouisfed.org/ Federal Reserve Bank of St. Louis
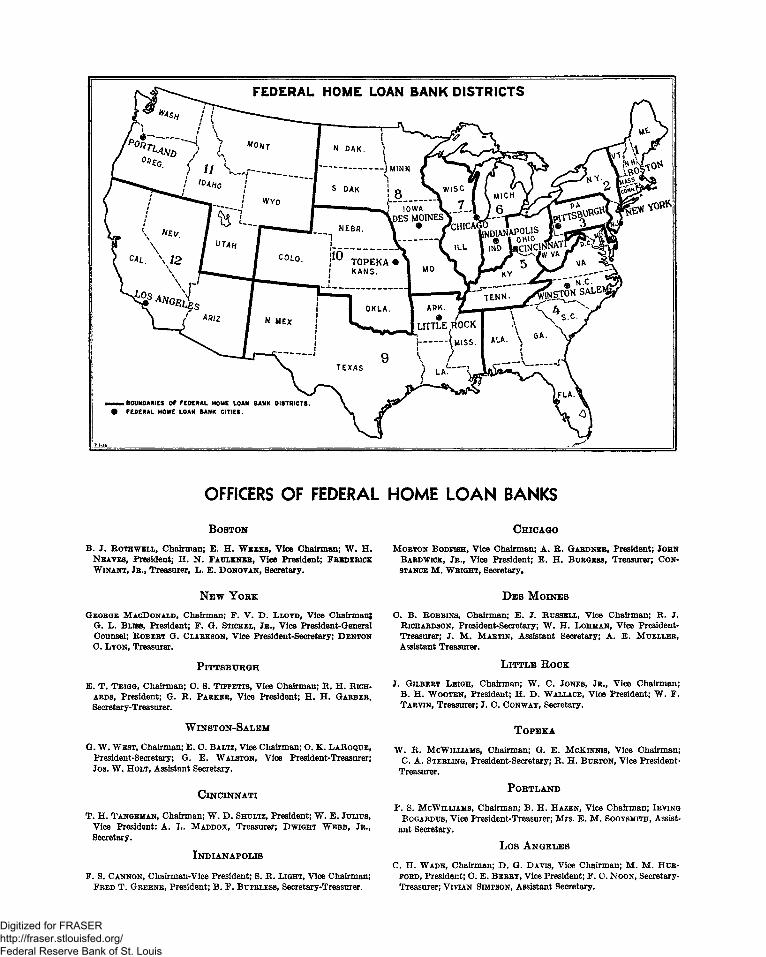
FEDERAL HOME LOAN BANK DISTRICTS
_ BOUNDARIES OF FEDERAL HOME LOAN BANK DISTRICTS • FEDERAL HOME LOAN BANK CITIES.
OFFICERS OF FEDERAL HOME LOAN BANKS
BOSTON
B. J. ROTHWELL, Chairman; E. H. WEEKS, Vice Chairman; W. H. NEAVES, President; H. N. FAULKNER, Vice President; FREDERICK WINANT, JR., Treasurer, L. E. DONOVAN, Secretary.
CHICAGO
MORTON BODFISH, Vice Chairman; A. B. GARDNER, President; JOHN BARD WICK, JR., Vice President; E. H. BURGESS, Treasurer; CONSTANCE M. WRIGHT, Secretary.
NEW YORK
OEOBGE MACDONALD, Chairman; F. V. D. LLOYD, Vice Chairman; G. L. Buss, President; F. G. STICKEL, JR., Vice President-General Counsel; ROBERT G. CLARKSON, Vice President-Secretary; DENTON O. LYON, Treasurer.
PITTSBURGH
E. T. TRIGG, Chairman; C. S. TIPPETTS, Vice Chairman; R. H. RICH-ARDS, President; G. R. PARKER, Vice President; H. H. GARBER, Secretary-Treasurer.
WINSTON-SALEM
G. W. WEST, Chairman; E. C. BALTZ, Vice Chairman; O. K. LAROQUE, President-Secretary; G. E. WALSTON, Vice President-Treasurer; Jos. W. HOLT, Assistant Secretary.
CINCINNATI
T. H. TANGEMAN, Chairman; W. D. SHULTZ, President; W. E. JULIUS,
Vice President: A. L. MADDOX, Treasurer; DWIGHT WEBB, JR., Secretary.
INDIANAPOLIS
F. S. CANNON, Chairman-Vice President; S. R. LIGHT, Vice Chairman; FRED T. GREENE, President; B. F. BUTRLESS, Secretary-Treasurer.
DES MOINES
C. B. BOBBINS, Chairman; E. J. RUSSELL, Vice Chairman; B. J. RICHARDSON, President-Secretary; W. H. LOHMAN, Vice President-Treasurer; J. M. MARTIN, Assistant Secretary; A. E. MUELLER, Assistant Treasurer.
LITTLE ROCK
J. GILBERT LEIGH, Chairman; W. C. JONES, JR., Vice Chairman; B. H. WOOTEN, President; H. D. WALLACE, Vice President; W. F. TARVIN, Treasurer; J. C. CONWAY, Secretary.
TOPEKA
W. R. MCWIIXIAMS, Chairman; G. E. MCKINNIS, Vice Chairman; C. A. STERLING, President-Secretary; R. H. BURTON, Vice President-
Treasurer.
PORTLAND
F. S. MCWILLIAMS, Chairman; B. H. HAZEN, Vice Chairman; IRVING BOGARDUS, Vice President-Treasurer; Mrs. E. M. SOOYSMITH, Assist
ant Secretary.
Los ANGELES
C. H. WADE, Chairman; D. G. DAVIS, Vice Chairman; M. M. HUR-FORD, President; C. E. BERRY, Vice President; F. C. NOON, Secretary-Treasurer; VIVIAN SIMPSON, Assistant Secretary.
Digitized for FRASER http://fraser.stlouisfed.org/ Federal Reserve Bank of St. Louis

![Monthly Monetary Trends [St. Louis Fed]](https://img.pdfslide.us/doc/110x75/577d21cc1a28ab4e1e95e8c6/monthly-monetary-trends-st-louis-fed.jpg)