Embed Size (px)
Citation preview

Federal Grants and the Academic Pipeline:
White Paper Figures
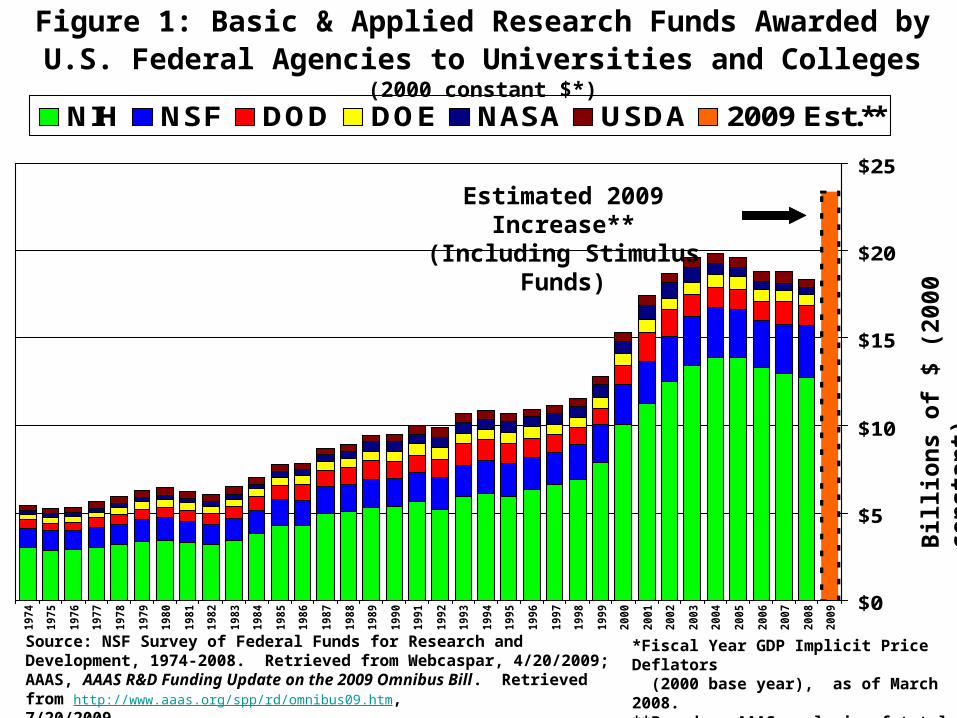
Figure 1: Basic & Applied Research Funds Awarded by U.S. Federal Agencies to Universities and Colleges (2000 constant $*)
$0
$5
$10
$15
$20
$25
1974
1975
1976
1977
1978
1979
1980
1981
1982
1983
1984
1985
1986
1987
1988
1989
1990
1991
1992
1993
1994
1995
1996
1997
1998
1999
2000
2001
2002
2003
2004
2005
2006
2007
2008
2009
NIH NSF DOD DOE NASA USDA 2009 Est.**
*Fiscal Year GDP Implicit Price Deflators (2000 base year), as of March 2008.**Based on AAAS analysis of total R&D funds and 2% GDP inflation.
Bil
lio
ns
of
$ (2
000
con
stan
t)
Source: NSF Survey of Federal Funds for Research and Development, 1974-2008. Retrieved from Webcaspar, 4/20/2009; AAAS, AAAS R&D Funding Update on the 2009 Omnibus Bill. Retrieved from http://www.aaas.org/spp/rd/omnibus09.htm,7/20/2009.
Estimated 2009 Increase**(Including Stimulus Funds)
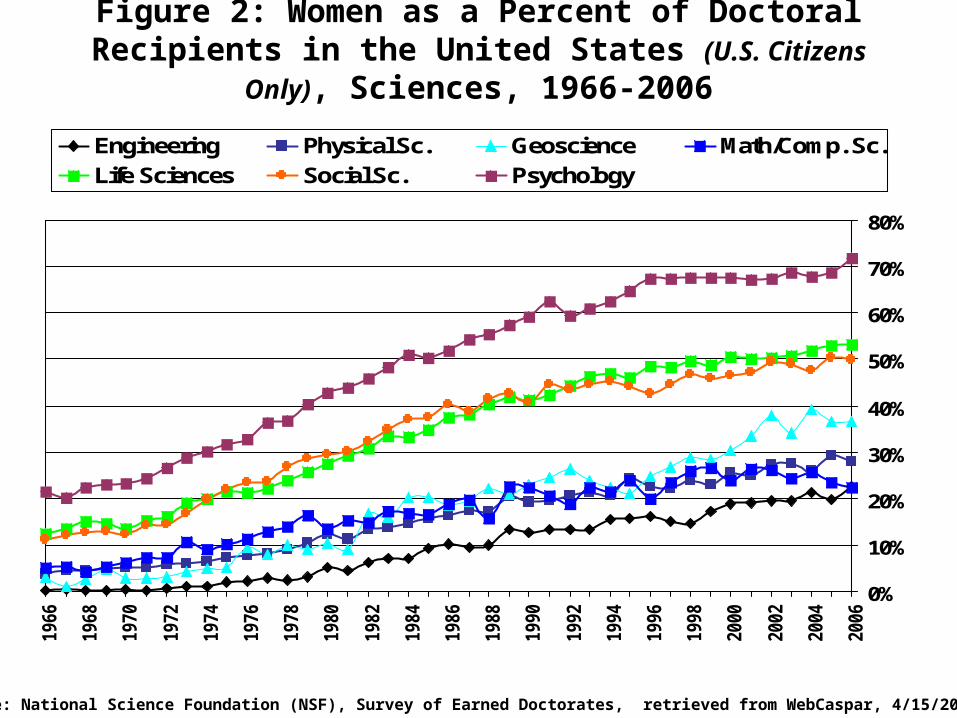
Figure 2: Women as a Percent of Doctoral Recipients in the United States (U.S. Citizens Only), Sciences, 1966-2006
0%
10%
20%
30%
40%
50%
60%
70%
80%
1966
1968
1970
1972
1974
1976
1978
1980
1982
1984
1986
1988
1990
1992
1994
1996
1998
2000
2002
2004
2006
Engineering Physical Sc. Geoscience Math/Comp. Sc.Life Sciences Social Sc. Psychology
Source: National Science Foundation (NSF), Survey of Earned Doctorates, retrieved from WebCaspar, 4/15/2009.
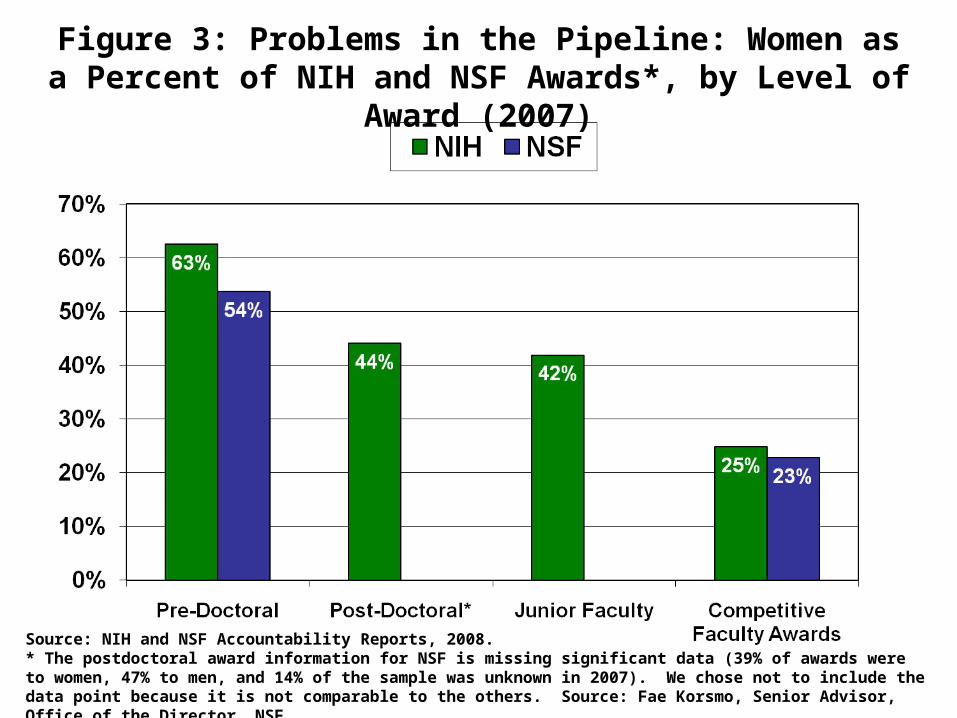
Figure 3: Problems in the Pipeline: Women as a Percent of NIH and NSF Awards*, by Level of Award (2007)
Source: NIH and NSF Accountability Reports, 2008.* The postdoctoral award information for NSF is missing significant data (39% of awards were to women, 47% to men, and 14% of the sample was unknown in 2007). We chose not to include the data point because it is not comparable to the others. Source: Fae Korsmo, Senior Advisor, Office of the Director, NSF.
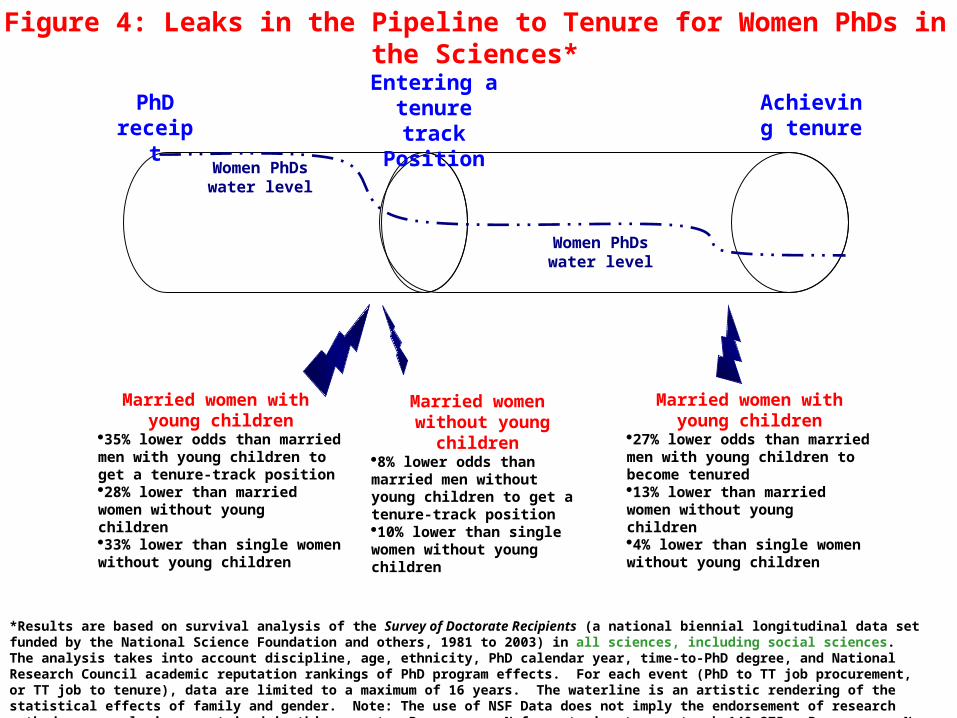
Married women with young children
35% lower odds than married men with young children to get a tenure-track position28% lower than married women without young children33% lower than single women without young children
Married women without young children
8% lower odds than married men without young children to get a tenure-track position10% lower than single women without young children
Married women with young children
27% lower odds than married men with young children to become tenured13% lower than married women without young children4% lower than single women without young children
PhDreceipt
Entering a tenure track
Position
Achieving tenure
Figure 4: Leaks in the Pipeline to Tenure for Women PhDs in the Sciences*
Women PhDswater level
Women PhDswater level
*Results are based on survival analysis of the Survey of Doctorate Recipients (a national biennial longitudinal data set funded by the National Science Foundation and others, 1981 to 2003) in all sciences, including social sciences. The analysis takes into account discipline, age, ethnicity, PhD calendar year, time-to-PhD degree, and National Research Council academic reputation rankings of PhD program effects. For each event (PhD to TT job procurement, or TT job to tenure), data are limited to a maximum of 16 years. The waterline is an artistic rendering of the statistical effects of family and gender. Note: The use of NSF Data does not imply the endorsement of research methods or conclusions contained in this report. Person-year N for entering tenure track=140,275. Person-year N for achieving tenure=46,883.
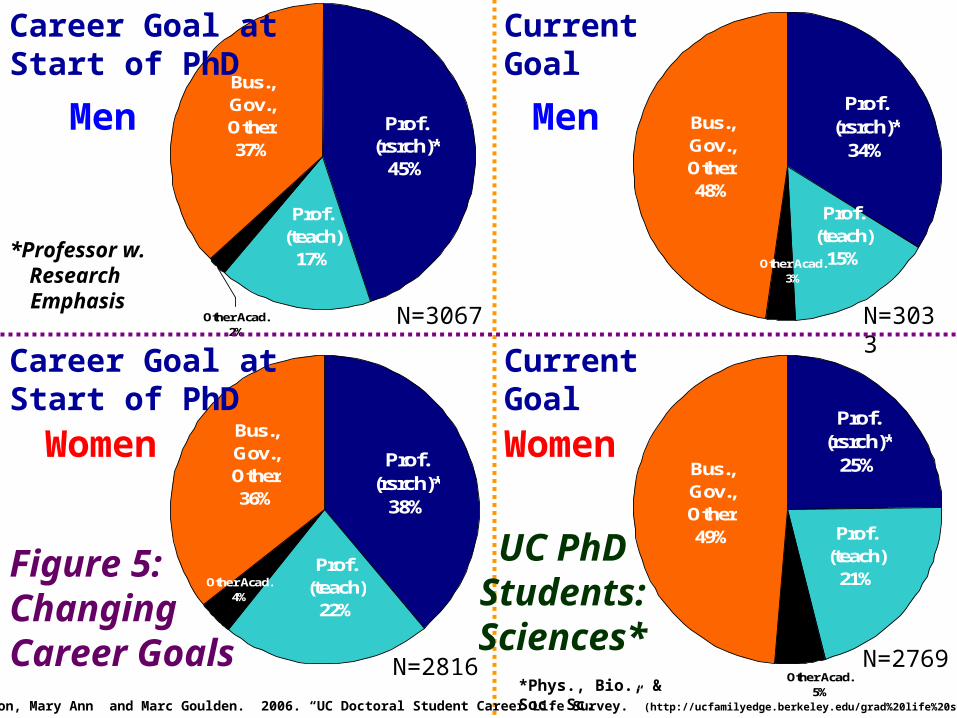
Prof. (rsrch)*
45%
Prof. (teach)
17%
Other Acad.2%
Bus., Gov., Other37%
Career Goal at Start of PhD
N=3067
N=2816 N=2769
Current Goal
Men
Women
N=3033
Bus., Gov., Other48%
Other Acad.3%
Prof. (teach)
15%
Prof. (rsrch)*
34%
Prof. (rsrch)*
38%
Prof. (teach)
22%
Other Acad.4%
Bus., Gov., Other36%
Bus., Gov., Other49%
Other Acad.5%
Prof. (teach)
21%
Prof. (rsrch)*
25%
Current Goal
Men
Women
Career Goal at Start of PhD
Figure 5: ChangingCareer GoalsSource: Mason, Mary Ann and Marc Goulden. 2006. “UC Doctoral Student Career Life Survey.” (http://ucfamilyedge.berkeley.edu/grad%20life%20survey.html).
*Professor w.Research Emphasis
UC PhDStudents:Sciences*
*Phys., Bio., & Soc. Sc.
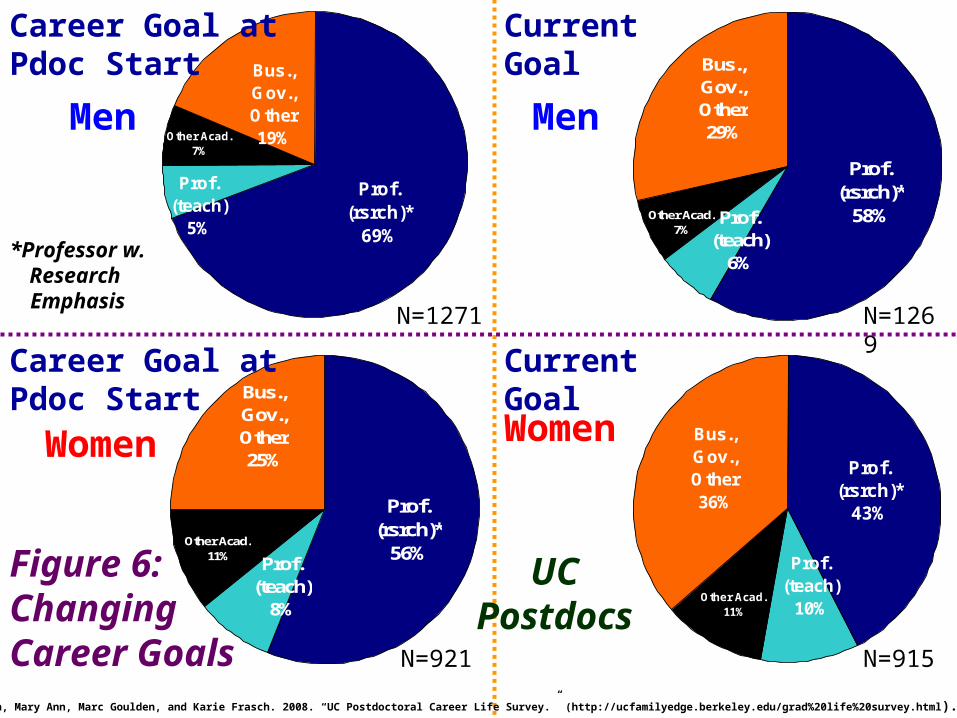
Prof. (rsrch)*
69%
Prof. (teach)
5%
Other Acad.7%
Bus., Gov., Other19%
Career Goal at Pdoc Start
N=1271
N=921 N=915
Current Goal
Men
Women
N=1269
Bus., Gov., Other29%
Other Acad.7%
Prof. (teach)
6%
Prof. (rsrch)*
58%
Prof. (rsrch)*
56%Prof.
(teach)8%
Other Acad.11%
Bus., Gov., Other25% Prof.
(rsrch)*43%
Prof. (teach)
10%Other Acad.
11%
Bus., Gov., Other36%
Current Goal
Men
Women
Career Goal at Pdoc Start
Figure 6: ChangingCareer GoalsSource: Mason, Mary Ann, Marc Goulden, and Karie Frasch. 2008. “UC Postdoctoral Career Life Survey.” (http://ucfamilyedge.berkeley.edu/grad%20life%20survey.html).
*Professor w.Research Emphasis
UCPostdocs
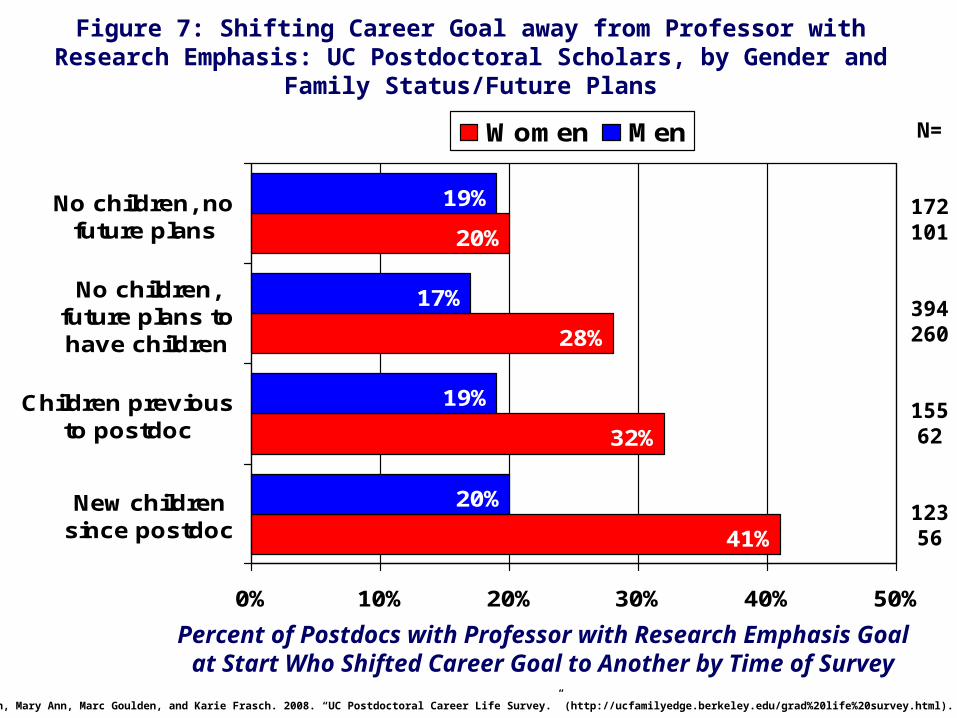
Figure 7: Shifting Career Goal away from Professor with Research Emphasis: UC Postdoctoral Scholars, by Gender and Family Status/Future Plans
41%
32%
28%
20%
20%
19%
17%
19%
0% 10% 20% 30% 40% 50%
New childrensince postdoc
Children previousto postdoc
No children,future plans tohave children
No children, nofuture plans
Women Men
Source: Mason, Mary Ann, Marc Goulden, and Karie Frasch. 2008. “UC Postdoctoral Career Life Survey.” (http://ucfamilyedge.berkeley.edu/grad%20life%20survey.html).
Percent of Postdocs with Professor with Research Emphasis Goal at Start Who Shifted Career Goal to Another by Time of Survey
N=
172101
394260
15562
12356
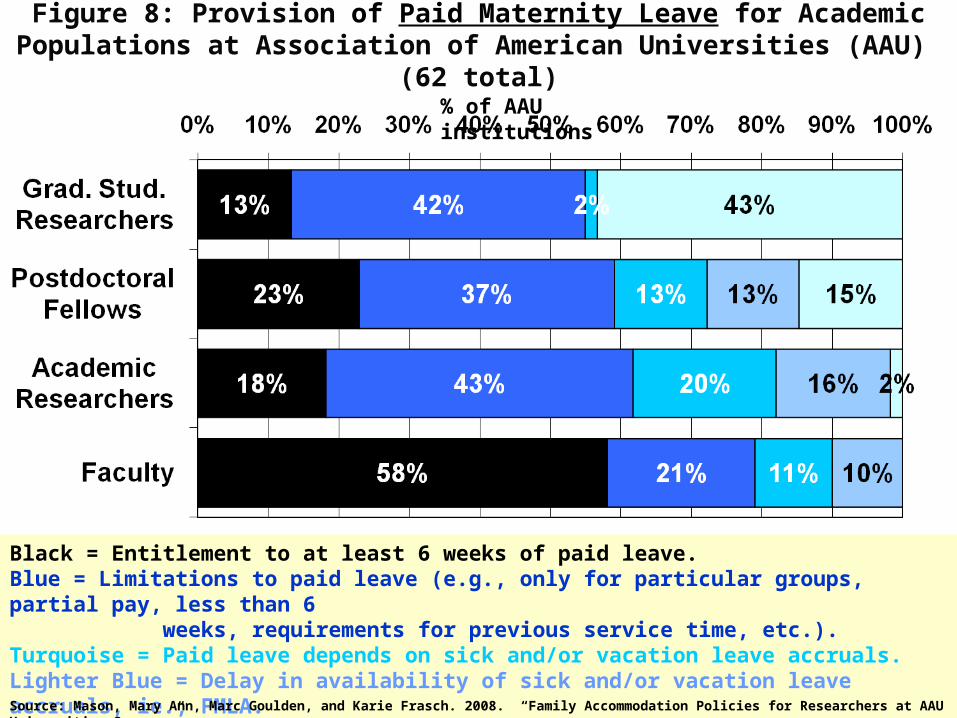
Figure 8: Provision of Paid Maternity Leave for Academic Populations at Association of American Universities (AAU) (62 total)
Black = Entitlement to at least 6 weeks of paid leave. Blue = Limitations to paid leave (e.g., only for particular groups, partial pay, less than 6 weeks, requirements for previous service time, etc.). Turquoise = Paid leave depends on sick and/or vacation leave accruals. Lighter Blue = Delay in availability of sick and/or vacation leave accruals, ie., FMLA. Lightest Blue = Less, ad hoc, or no paid leave available.Source: Mason, Mary Ann, Marc Goulden, and Karie Frasch. 2008. “Family Accommodation Policies for Researchers at AAU Universities Survey.”
% of AAU institutions
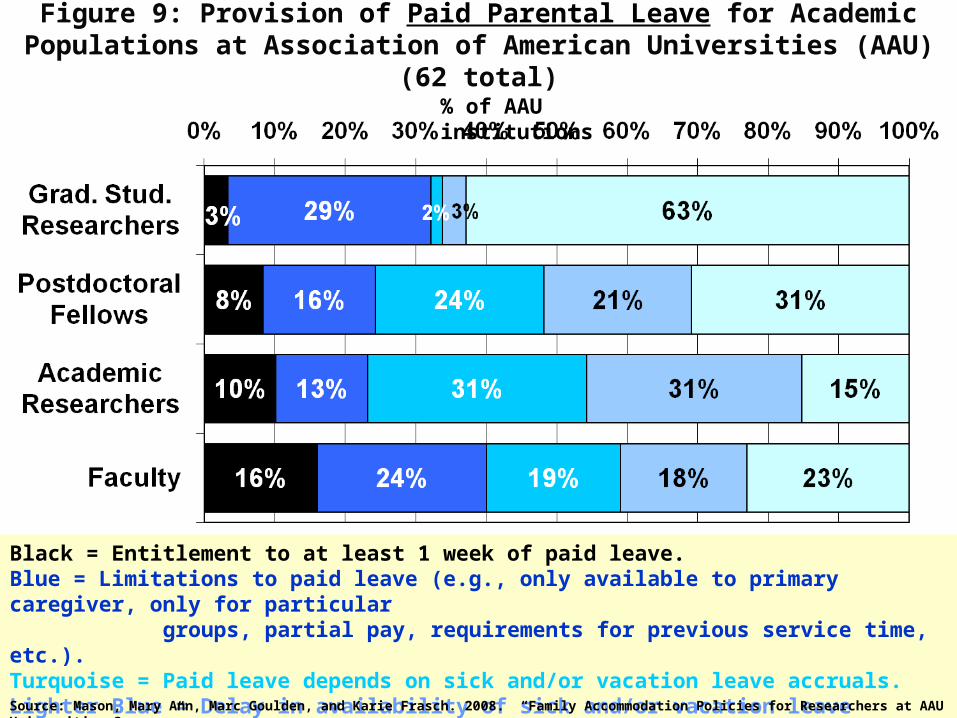
Figure 9: Provision of Paid Parental Leave for Academic Populations at Association of American Universities (AAU) (62 total)
Black = Entitlement to at least 1 week of paid leave. Blue = Limitations to paid leave (e.g., only available to primary caregiver, only for particular groups, partial pay, requirements for previous service time, etc.). Turquoise = Paid leave depends on sick and/or vacation leave accruals. Lighter Blue = Delay in availability of sick and/or vacation leave accruals, ie., FMLA. Lightest Blue = Less, ad hoc, or no paid leave available.Source: Mason, Mary Ann, Marc Goulden, and Karie Frasch. 2008. “Family Accommodation Policies for Researchers at AAU Universities Survey.”
% of AAU institutions
05
1015
2025
3035
4045
5055
0-31 32+ 34+ 36+ 38+ 40+ 42+ 44+ 46+ 48+ 50+ 52+ 54+ 56+ 58+ 60+ 62+ 64+ 66+ 68+
Age at Survey
Mea
n W
eekl
y H
ou
rs
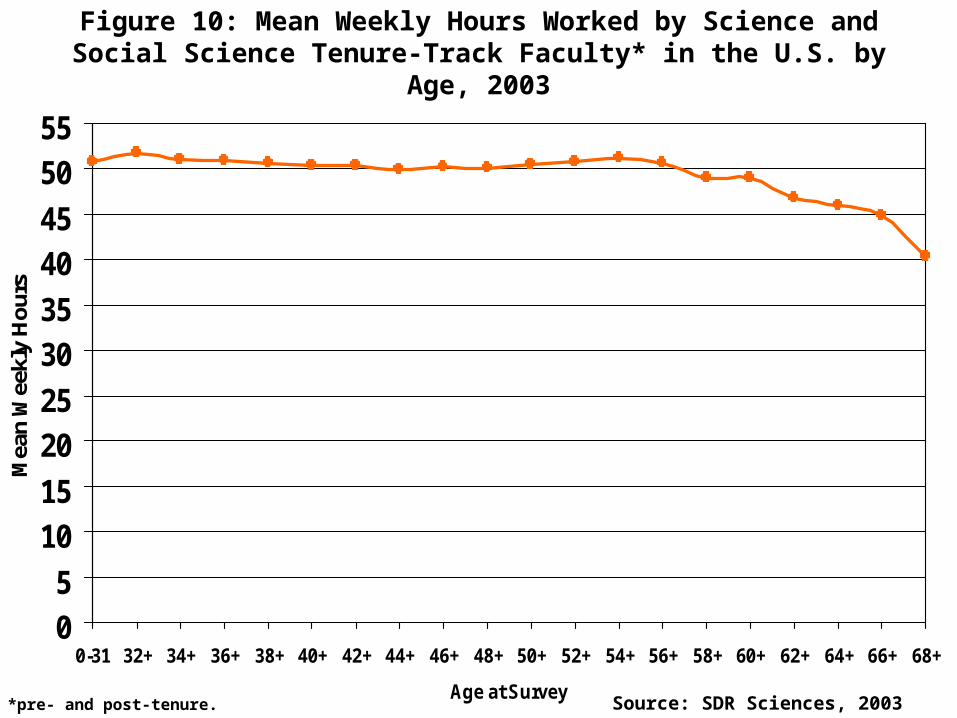
Source: SDR Sciences, 2003
Figure 10: Mean Weekly Hours Worked by Science and Social Science Tenure-Track Faculty* in the U.S. by Age, 2003
*pre- and post-tenure.
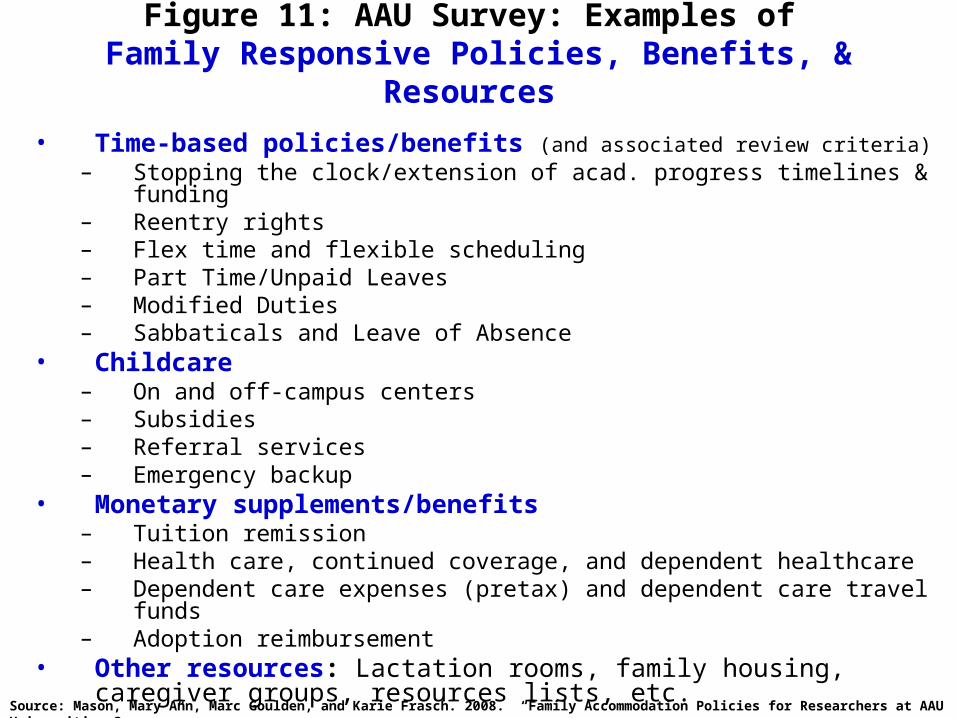
Figure 11: AAU Survey: Examples of Family Responsive Policies, Benefits, & Resources
• Time-based policies/benefits (and associated review criteria)– Stopping the clock/extension of acad. progress timelines & funding– Reentry rights– Flex time and flexible scheduling– Part Time/Unpaid Leaves– Modified Duties– Sabbaticals and Leave of Absence
• Childcare– On and off-campus centers– Subsidies– Referral services– Emergency backup
• Monetary supplements/benefits– Tuition remission– Health care, continued coverage, and dependent healthcare– Dependent care expenses (pretax) and dependent care travel funds– Adoption reimbursement
• Other resources: Lactation rooms, family housing, caregiver groups, resources lists, etc.
Source: Mason, Mary Ann, Marc Goulden, and Karie Frasch. 2008. “Family Accommodation Policies for Researchers at AAU Universities Survey.”
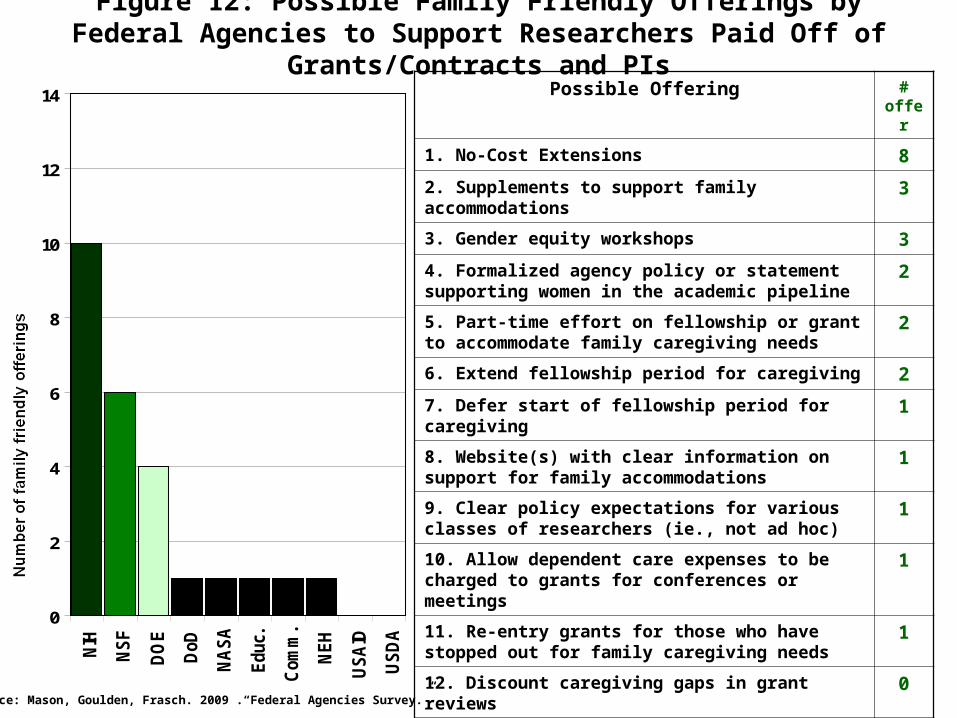
Figure 12: Possible Family Friendly Offerings by Federal Agencies to Support Researchers Paid Off of Grants/Contracts and PIs
0
2
4
6
8
10
12
14N
IH
NSF
DO
E
DoD
NA
SA
Educ.
Com
m.
NEH
USA
ID
USD
A
Possible Offering # offer
1. No-Cost Extensions 8
2. Supplements to support family accommodations 3
3. Gender equity workshops 3
4. Formalized agency policy or statement supporting women in the academic pipeline
2
5. Part-time effort on fellowship or grant to accommodate family caregiving needs
2
6. Extend fellowship period for caregiving 2
7. Defer start of fellowship period for caregiving 1
8. Website(s) with clear information on support for family accommodations
1
9. Clear policy expectations for various classes of researchers (ie., not ad hoc)
1
10. Allow dependent care expenses to be charged to grants for conferences or meetings
1
11. Re-entry grants for those who have stopped out for family caregiving needs
1
12. Discount caregiving gaps in grant reviews 0
13. Provide instructions to peer reviewers on family accommodations
0
14. Data collection on gender and family status 0Source: Mason, Goulden, Frasch. 2009 .“Federal Agencies Survey.”


![[Pipeline] Inspecting Pipeline Installation](https://img.pdfslide.us/doc/110x75/55cf8d045503462b1391543e/pipeline-inspecting-pipeline-installation.jpg)
