Embed Size (px)
Citation preview
U.S. Census Bureau, Statistical Abstract of the United States: 2000
Federal Government Finances and Employment 337
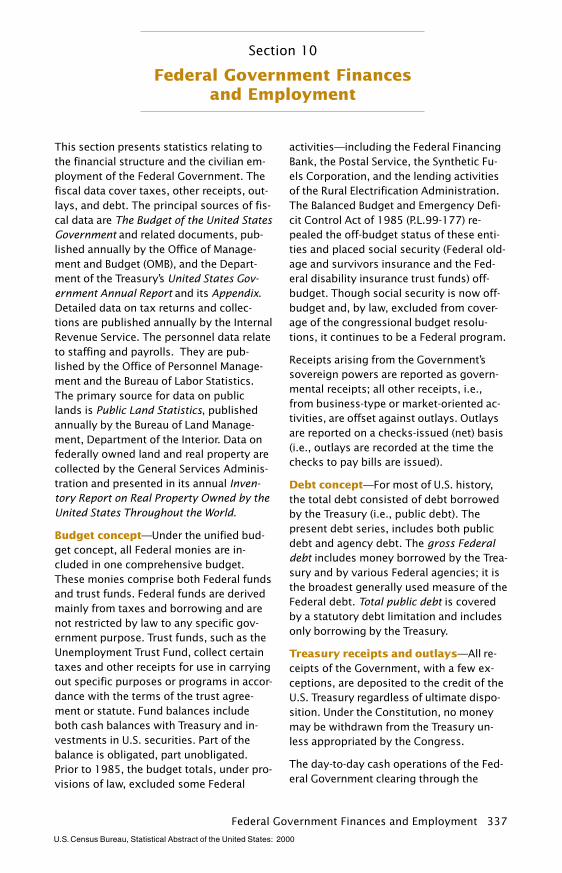
Section 10
Federal Government Financesand Employment
This section presents statistics relating tothe financial structure and the civilian em-ployment of the Federal Government. Thefiscal data cover taxes, other receipts, out-lays, and debt. The principal sources of fis-cal data are The Budget of the United StatesGovernment and related documents, pub-lished annually by the Office of Manage-ment and Budget (OMB), and the Depart-ment of the Treasury’s United States Gov-ernment Annual Report and its Appendix.Detailed data on tax returns and collec-tions are published annually by the InternalRevenue Service. The personnel data relateto staffing and payrolls. They are pub-lished by the Office of Personnel Manage-ment and the Bureau of Labor Statistics.The primary source for data on publiclands is Public Land Statistics, publishedannually by the Bureau of Land Manage-ment, Department of the Interior. Data onfederally owned land and real property arecollected by the General Services Adminis-tration and presented in its annual Inven-tory Report on Real Property Owned by theUnited States Throughout the World.
Budget concept—Under the unified bud-get concept, all Federal monies are in-cluded in one comprehensive budget.These monies comprise both Federal fundsand trust funds. Federal funds are derivedmainly from taxes and borrowing and arenot restricted by law to any specific gov-ernment purpose. Trust funds, such as theUnemployment Trust Fund, collect certaintaxes and other receipts for use in carryingout specific purposes or programs in accor-dance with the terms of the trust agree-ment or statute. Fund balances includeboth cash balances with Treasury and in-vestments in U.S. securities. Part of thebalance is obligated, part unobligated.Prior to 1985, the budget totals, under pro-visions of law, excluded some Federal
activities—including the Federal FinancingBank, the Postal Service, the Synthetic Fu-els Corporation, and the lending activitiesof the Rural Electrification Administration.The Balanced Budget and Emergency Defi-cit Control Act of 1985 (P.L.99-177) re-pealed the off-budget status of these enti-ties and placed social security (Federal old-age and survivors insurance and the Fed-eral disability insurance trust funds) off-budget. Though social security is now off-budget and, by law, excluded from cover-age of the congressional budget resolu-tions, it continues to be a Federal program.
Receipts arising from the Government’ssovereign powers are reported as govern-mental receipts; all other receipts, i.e.,from business-type or market-oriented ac-tivities, are offset against outlays. Outlaysare reported on a checks-issued (net) basis(i.e., outlays are recorded at the time thechecks to pay bills are issued).
Debt concept—For most of U.S. history,the total debt consisted of debt borrowedby the Treasury (i.e., public debt). Thepresent debt series, includes both publicdebt and agency debt. The gross Federaldebt includes money borrowed by the Trea-sury and by various Federal agencies; it isthe broadest generally used measure of theFederal debt. Total public debt is coveredby a statutory debt limitation and includesonly borrowing by the Treasury.
Treasury receipts and outlays—All re-ceipts of the Government, with a few ex-ceptions, are deposited to the credit of theU.S. Treasury regardless of ultimate dispo-sition. Under the Constitution, no moneymay be withdrawn from the Treasury un-less appropriated by the Congress.
The day-to-day cash operations of the Fed-eral Government clearing through the
U.S. Census Bureau, Statistical Abstract of the United States: 2000
338 Federal Government Finances and Employment
accounts of the U.S. Treasury are reportedin the Daily Treasury Statement. Extensivedetail on the public debt is published inthe Monthly Statement of the Public Debt ofthe United States.
Budget receipts such as taxes, customs du-ties, and miscellaneous receipts, which arecollected by Government agencies, andoutlays represented by checks issued andcash payments made by disbursing officersas well as government agencies are re-ported in the Daily Treasury Statement ofReceipts and Outlays of the United StatesGovernment and in the Treasury’s UnitedStates Government Annual Report and itsAppendix. These deposits in and paymentsfrom accounts maintained by Governmentagencies are on the same basis as the uni-fied budget.
The quarterly Treasury Bulletin containsdata on fiscal operations and related Trea-sury activities, including financial state-ments of Government corporations andother business-type activities.
Income tax returns and tax collec-tions—Tax data are compiled by the Inter-nal Revenue Service of the Treasury Depart-ment. The Annual Report of the Commis-sioner and Chief Counsel of the InternalRevenue Service gives a detailed account oftax collections by kind of tax and by re-gions, districts, and states. The agency’sannual Statistics of Income reports presentdetailed data from individual income taxreturns and corporation income tax re-turns. The quarterly Statistics of IncomeBulletin has, in general, replaced thesupplemental Statistics of Income publica-tions which presented data on such diversesubjects as tax-exempt organizations, unin-corporated businesses, fiduciary incometax and estate tax returns, sales of capitalassets by individuals, international incomeand taxes reported by corporations and in-dividuals, and estate tax wealth.
Employment and payrolls—The Officeof Personnel Management collects employ-ment and payroll data from all departmentsand agencies of the Federal Government,
except the Central Intelligence Agency, theNational Security Agency, and the DefenseIntelligence Agency. Employment figuresrepresent the number of persons who oc-cupied civilian positions at the end of thereport month shown and who are paid forpersonal services rendered for the FederalGovernment, regardless of the nature ofappointment or method of payment. Fed-eral payrolls include all payments for per-sonal services rendered during the reportmonth and payments for accumulated an-nual leave of employees who separatefrom the service. Since most Federal em-ployees are paid on a biweekly basis, thecalendar month earnings are partially esti-mated on the basis of the number of workdays in each month where payroll periodsoverlap.
Federal employment and payroll figuresare published by the Office of PersonnelManagement in its Federal CivilianWorkforce Statistics—Employment andTrends. It also publishes biennial employ-ment data for minority groups, data on oc-cupations of white- and blue-collar work-ers, and data on employment by geo-graphic area; reports on salary and wagedistribution of Federal employees are pub-lished annually. General schedule is prima-rily white-collar; wage system primarilyblue-collar. Data on Federal employmentare also issued by the Bureau of Labor Sta-tistics in its Monthly Labor Review and inEmployment and Earnings and by the U.S.Census Bureau in its annual Public Employ-ment.
Public lands—The data on applications,entries, selections, patents, and certifica-tions refer to transactions which involvethe disposal, under the public land laws(including the homestead laws), of Federalpublic lands to non-Federal owners. In gen-eral, original entries and selections are ap-plications to secure title to public landswhich have been accepted as properly filed(i.e., allowed). Some types of applications,however, are not reported until issuance ofthe final certificate, which passes equitabletitle to the land to the applicant.
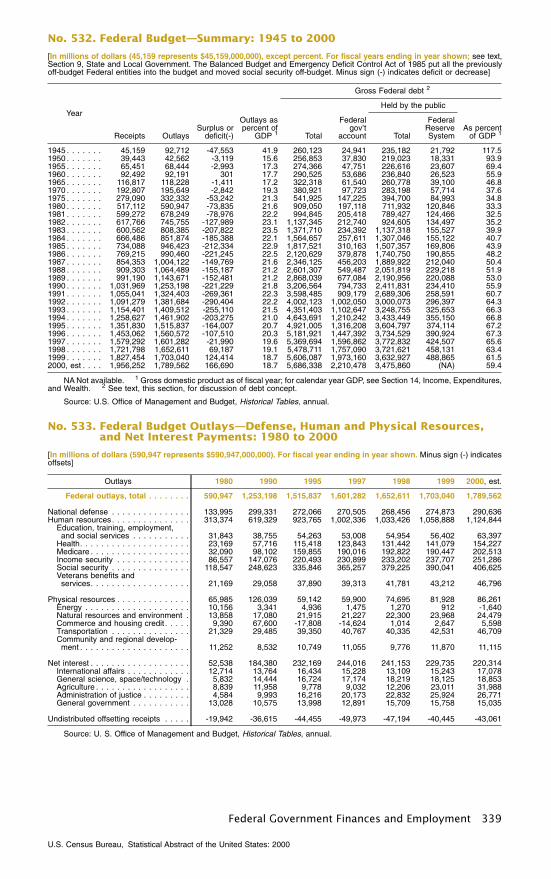
No. 532. Federal Budget—Summary: 1945 to 2000
[In millions of dollars (45,159 represents $45,159,000,000), except percent. For fiscal years ending in year shown; see text,Section 9, State and Local Government. The Balanced Budget and Emergency Deficit Control Act of 1985 put all the previouslyoff-budget Federal entities into the budget and moved social security off-budget. Minus sign (-) indicates deficit or decrease]
Year
Receipts OutlaysSurplus or
deficit(-)
Outlays aspercent of
GDP 1
Gross Federal debt 2
Total
Federalgov’t
account
Held by the public
As percentof GDP 1Total
FederalReserveSystem
1945 . . . . . . . 45,159 92,712 -47,553 41.9 260,123 24,941 235,182 21,792 117.51950 . . . . . . . 39,443 42,562 -3,119 15.6 256,853 37,830 219,023 18,331 93.91955 . . . . . . . 65,451 68,444 -2,993 17.3 274,366 47,751 226,616 23,607 69.41960 . . . . . . . 92,492 92,191 301 17.7 290,525 53,686 236,840 26,523 55.91965 . . . . . . . 116,817 118,228 -1,411 17.2 322,318 61,540 260,778 39,100 46.81970 . . . . . . . 192,807 195,649 -2,842 19.3 380,921 97,723 283,198 57,714 37.61975 . . . . . . . 279,090 332,332 -53,242 21.3 541,925 147,225 394,700 84,993 34.81980 . . . . . . . 517,112 590,947 -73,835 21.6 909,050 197,118 711,932 120,846 33.31981 . . . . . . . 599,272 678,249 -78,976 22.2 994,845 205,418 789,427 124,466 32.51982 . . . . . . . 617,766 745,755 -127,989 23.1 1,137,345 212,740 924,605 134,497 35.21983 . . . . . . . 600,562 808,385 -207,822 23.5 1,371,710 234,392 1,137,318 155,527 39.91984 . . . . . . . 666,486 851,874 -185,388 22.1 1,564,657 257,611 1,307,046 155,122 40.71985 . . . . . . . 734,088 946,423 -212,334 22.9 1,817,521 310,163 1,507,357 169,806 43.91986 . . . . . . . 769,215 990,460 -221,245 22.5 2,120,629 379,878 1,740,750 190,855 48.21987 . . . . . . . 854,353 1,004,122 -149,769 21.6 2,346,125 456,203 1,889,922 212,040 50.41988 . . . . . . . 909,303 1,064,489 -155,187 21.2 2,601,307 549,487 2,051,819 229,218 51.91989 . . . . . . . 991,190 1,143,671 -152,481 21.2 2,868,039 677,084 2,190,956 220,088 53.01990 . . . . . . . 1,031,969 1,253,198 -221,229 21.8 3,206,564 794,733 2,411,831 234,410 55.91991 . . . . . . . 1,055,041 1,324,403 -269,361 22.3 3,598,485 909,179 2,689,306 258,591 60.71992 . . . . . . . 1,091,279 1,381,684 -290,404 22.2 4,002,123 1,002,050 3,000,073 296,397 64.31993 . . . . . . . 1,154,401 1,409,512 -255,110 21.5 4,351,403 1,102,647 3,248,755 325,653 66.31994 . . . . . . . 1,258,627 1,461,902 -203,275 21.0 4,643,691 1,210,242 3,433,449 355,150 66.81995 . . . . . . . 1,351,830 1,515,837 -164,007 20.7 4,921,005 1,316,208 3,604,797 374,114 67.21996 . . . . . . . 1,453,062 1,560,572 -107,510 20.3 5,181,921 1,447,392 3,734,529 390,924 67.31997 . . . . . . . 1,579,292 1,601,282 -21,990 19.6 5,369,694 1,596,862 3,772,832 424,507 65.61998 . . . . . . . 1,721,798 1,652,611 69,187 19.1 5,478,711 1,757,090 3,721,621 458,131 63.41999 . . . . . . . 1,827,454 1,703,040 124,414 18.7 5,606,087 1,973,160 3,632,927 488,865 61.52000, est . . . . 1,956,252 1,789,562 166,690 18.7 5,686,338 2,210,478 3,475,860 (NA) 59.4
NA Not available. 1 Gross domestic product as of fiscal year; for calendar year GDP, see Section 14, Income, Expenditures,and Wealth. 2 See text, this section, for discussion of debt concept.
Source: U.S. Office of Management and Budget, Historical Tables, annual.
No. 533. Federal Budget Outlays—Defense, Human and Physical Resources,and Net Interest Payments: 1980 to 2000
[In millions of dollars (590,947 represents $590,947,000,000). For fiscal year ending in year shown. Minus sign (-) indicatesoffsets]
Outlays 1980 1990 1995 1997 1998 1999 2000, est.
Federal outlays, total . . . . . . . . 590,947 1,253,198 1,515,837 1,601,282 1,652,611 1,703,040 1,789,562
National defense . . . . . . . . . . . . . . . 133,995 299,331 272,066 270,505 268,456 274,873 290,636Human resources. . . . . . . . . . . . . . . 313,374 619,329 923,765 1,002,336 1,033,426 1,058,888 1,124,844
Education, training, employment,and social services . . . . . . . . . . . 31,843 38,755 54,263 53,008 54,954 56,402 63,397
Health. . . . . . . . . . . . . . . . . . . . . 23,169 57,716 115,418 123,843 131,442 141,079 154,227Medicare . . . . . . . . . . . . . . . . . . . 32,090 98,102 159,855 190,016 192,822 190,447 202,513Income security . . . . . . . . . . . . . . 86,557 147,076 220,493 230,899 233,202 237,707 251,286Social security . . . . . . . . . . . . . . . 118,547 248,623 335,846 365,257 379,225 390,041 406,625Veterans benefits andservices. . . . . . . . . . . . . . . . . . . 21,169 29,058 37,890 39,313 41,781 43,212 46,796
Physical resources . . . . . . . . . . . . . . 65,985 126,039 59,142 59,900 74,695 81,928 86,261Energy . . . . . . . . . . . . . . . . . . . . 10,156 3,341 4,936 1,475 1,270 912 -1,640Natural resources and environment . 13,858 17,080 21,915 21,227 22,300 23,968 24,479Commerce and housing credit . . . . . 9,390 67,600 -17,808 -14,624 1,014 2,647 5,598Transportation . . . . . . . . . . . . . . . 21,329 29,485 39,350 40,767 40,335 42,531 46,709Community and regional develop-ment . . . . . . . . . . . . . . . . . . . . . 11,252 8,532 10,749 11,055 9,776 11,870 11,115
Net interest . . . . . . . . . . . . . . . . . . . 52,538 184,380 232,169 244,016 241,153 229,735 220,314International affairs . . . . . . . . . . . . 12,714 13,764 16,434 15,228 13,109 15,243 17,078General science, space/technology . 5,832 14,444 16,724 17,174 18,219 18,125 18,853Agriculture . . . . . . . . . . . . . . . . . . 8,839 11,958 9,778 9,032 12,206 23,011 31,988Administration of justice . . . . . . . . . 4,584 9,993 16,216 20,173 22,832 25,924 26,771General government . . . . . . . . . . . 13,028 10,575 13,998 12,891 15,709 15,758 15,035
Undistributed offsetting receipts . . . . . -19,942 -36,615 -44,455 -49,973 -47,194 -40,445 -43,061
Source: U. S. Office of Management and Budget, Historical Tables, annual.
Federal Government Finances and Employment 339
U.S. Census Bureau, Statistical Abstract of the United States: 2000
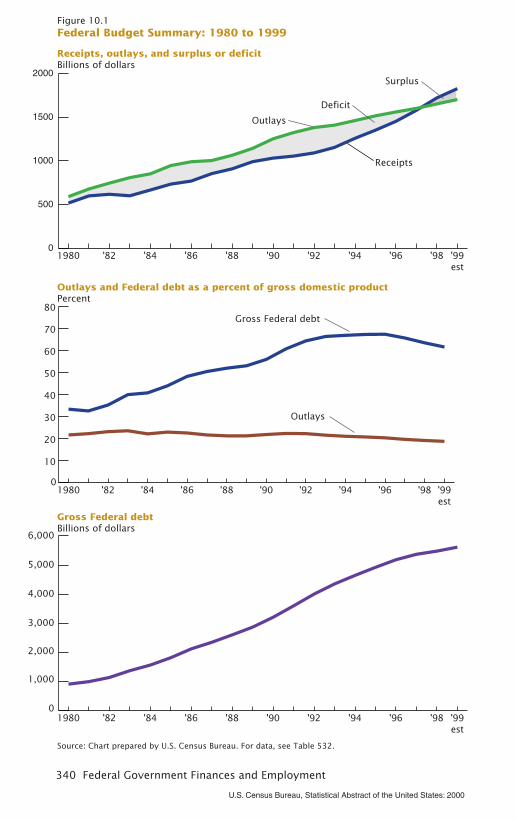
Figure 10.1Federal Budget Summary: 1980 to 1999
Source: Chart prepared by U.S. Census Bureau. For data, see Table 532.
340 Federal Government Finances and Employment
U.S. Census Bureau, Statistical Abstract of the United States: 2000
Receipts, outlays, and surplus or deficitBillions of dollars
Outlays and Federal debt as a percent of gross domestic productPercent
Gross Federal debtBillions of dollars
0
500
1000
1500
2000
'99est
'98'96'94'92'90'88'86'84'821980
0
10
20
30
40
50
60
70
80
'99est
'98'96'94'92'90'88'86'84'821980
0
1,000
2,000
3,000
4,000
5,000
6,000
'99est
'98'96'94'92'90'88'86'84'821980
Deficit
Outlays
Receipts
Surplus
Gross Federal debt
Outlays
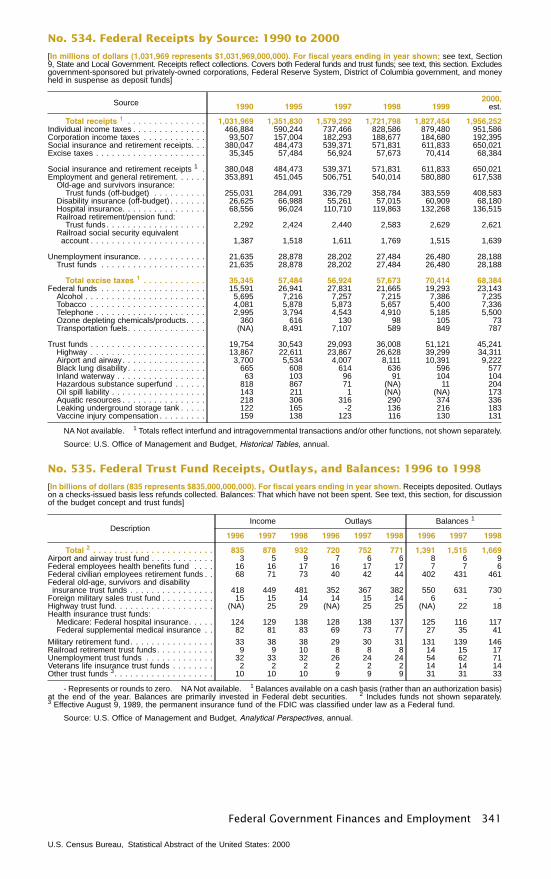
No. 534. Federal Receipts by Source: 1990 to 2000
[In millions of dollars (1,031,969 represents $1,031,969,000,000). For fiscal years ending in year shown; see text, Section9, State and Local Government. Receipts reflect collections. Covers both Federal funds and trust funds; see text, this section. Excludesgovernment-sponsored but privately-owned corporations, Federal Reserve System, District of Columbia government, and moneyheld in suspense as deposit funds]
Source 1990 1995 1997 1998 19992000,
est.
Total receipts 1 . . . . . . . . . . . . . . . 1,031,969 1,351,830 1,579,292 1,721,798 1,827,454 1,956,252Individual income taxes . . . . . . . . . . . . . . 466,884 590,244 737,466 828,586 879,480 951,586Corporation income taxes . . . . . . . . . . . . 93,507 157,004 182,293 188,677 184,680 192,395Social insurance and retirement receipts. . . 380,047 484,473 539,371 571,831 611,833 650,021Excise taxes . . . . . . . . . . . . . . . . . . . . . 35,345 57,484 56,924 57,673 70,414 68,384
Social insurance and retirement receipts 1 . 380,048 484,473 539,371 571,831 611,833 650,021Employment and general retirement. . . . . . 353,891 451,045 506,751 540,014 580,880 617,538
Old-age and survivors insurance:Trust funds (off-budget) . . . . . . . . . . 255,031 284,091 336,729 358,784 383,559 408,583
Disability insurance (off-budget) . . . . . . . 26,625 66,988 55,261 57,015 60,909 68,180Hospital insurance. . . . . . . . . . . . . . . . 68,556 96,024 110,710 119,863 132,268 136,515Railroad retirement/pension fund:
Trust funds . . . . . . . . . . . . . . . . . . . 2,292 2,424 2,440 2,583 2,629 2,621Railroad social security equivalentaccount . . . . . . . . . . . . . . . . . . . . . . 1,387 1,518 1,611 1,769 1,515 1,639
Unemployment insurance. . . . . . . . . . . . . 21,635 28,878 28,202 27,484 26,480 28,188Trust funds . . . . . . . . . . . . . . . . . . . . 21,635 28,878 28,202 27,484 26,480 28,188
Total excise taxes 1 . . . . . . . . . . . . 35,345 57,484 56,924 57,673 70,414 68,384Federal funds . . . . . . . . . . . . . . . . . . . . 15,591 26,941 27,831 21,665 19,293 23,143
Alcohol . . . . . . . . . . . . . . . . . . . . . . . 5,695 7,216 7,257 7,215 7,386 7,235Tobacco . . . . . . . . . . . . . . . . . . . . . . 4,081 5,878 5,873 5,657 5,400 7,336Telephone . . . . . . . . . . . . . . . . . . . . . 2,995 3,794 4,543 4,910 5,185 5,500Ozone depleting chemicals/products. . . . 360 616 130 98 105 73Transportation fuels. . . . . . . . . . . . . . . (NA) 8,491 7,107 589 849 787
Trust funds . . . . . . . . . . . . . . . . . . . . . . 19,754 30,543 29,093 36,008 51,121 45,241Highway . . . . . . . . . . . . . . . . . . . . . . 13,867 22,611 23,867 26,628 39,299 34,311Airport and airway. . . . . . . . . . . . . . . . 3,700 5,534 4,007 8,111 10,391 9,222Black lung disability . . . . . . . . . . . . . . . 665 608 614 636 596 577Inland waterway . . . . . . . . . . . . . . . . . 63 103 96 91 104 104Hazardous substance superfund . . . . . . 818 867 71 (NA) 11 204Oil spill liability . . . . . . . . . . . . . . . . . . 143 211 1 (NA) (NA) 173Aquatic resources . . . . . . . . . . . . . . . . 218 306 316 290 374 336Leaking underground storage tank . . . . . 122 165 -2 136 216 183Vaccine injury compensation . . . . . . . . . 159 138 123 116 130 131
NA Not available. 1 Totals reflect interfund and intragovernmental transactions and/or other functions, not shown separately.
Source: U.S. Office of Management and Budget, Historical Tables, annual.
No. 535. Federal Trust Fund Receipts, Outlays, and Balances: 1996 to 1998
[In billions of dollars (835 represents $835,000,000,000). For fiscal years ending in year shown. Receipts deposited. Outlayson a checks-issued basis less refunds collected. Balances: That which have not been spent. See text, this section, for discussionof the budget concept and trust funds]
DescriptionIncome Outlays Balances 1
1996 1997 1998 1996 1997 1998 1996 1997 1998
Total 2 . . . . . . . . . . . . . . . . . . . . . . . 835 878 932 720 752 771 1,391 1,515 1,669Airport and airway trust fund . . . . . . . . . . . . 3 5 9 7 6 6 8 6 9Federal employees health benefits fund . . . . 16 16 17 16 17 17 7 7 6Federal civilian employees retirement funds . . 68 71 73 40 42 44 402 431 461Federal old-age, survivors and disabilityinsurance trust funds . . . . . . . . . . . . . . . . 418 449 481 352 367 382 550 631 730
Foreign military sales trust fund . . . . . . . . . . 15 15 14 14 15 14 6 - -Highway trust fund. . . . . . . . . . . . . . . . . . . (NA) 25 29 (NA) 25 25 (NA) 22 18Health insurance trust funds:
Medicare: Federal hospital insurance. . . . . 124 129 138 128 138 137 125 116 117Federal supplemental medical insurance . . 82 81 83 69 73 77 27 35 41
Military retirement fund. . . . . . . . . . . . . . . . 33 38 38 29 30 31 131 139 146Railroad retirement trust funds. . . . . . . . . . . 9 9 10 8 8 8 14 15 17Unemployment trust funds . . . . . . . . . . . . . 32 33 32 26 24 24 54 62 71Veterans life insurance trust funds . . . . . . . . 2 2 2 2 2 2 14 14 14Other trust funds 3. . . . . . . . . . . . . . . . . . . 10 10 10 9 9 9 31 31 33
- Represents or rounds to zero. NA Not available. 1 Balances available on a cash basis (rather than an authorization basis)at the end of the year. Balances are primarily invested in Federal debt securities. 2 Includes funds not shown separately.3 Effective August 9, 1989, the permanent insurance fund of the FDIC was classified under law as a Federal fund.
Source: U.S. Office of Management and Budget, Analytical Perspectives, annual.
Federal Government Finances and Employment 341
U.S. Census Bureau, Statistical Abstract of the United States: 2000
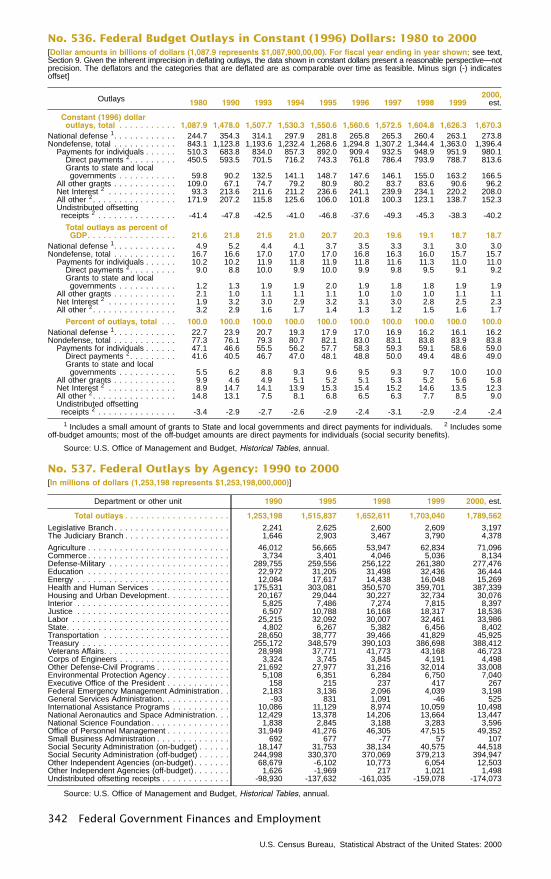
No. 536. Federal Budget Outlays in Constant (1996) Dollars: 1980 to 2000[Dollar amounts in billions of dollars (1,087.9 represents $1,087,900,00,00). For fiscal year ending in year shown; see text,Section 9. Given the inherent imprecision in deflating outlays, the data shown in constant dollars present a reasonable perspective—notprecision. The deflators and the categories that are deflated are as comparable over time as feasible. Minus sign (-) indicatesoffset]
Outlays 1980 1990 1993 1994 1995 1996 1997 1998 19992000,
est.
Constant (1996) dollaroutlays, total . . . . . . . . . . . 1,087.9 1,478.0 1,507.7 1,530.3 1,550.6 1,560.6 1,572.5 1,604.8 1,626.3 1,670.3
National defense 1. . . . . . . . . . . . 244.7 354.3 314.1 297.9 281.8 265.8 265.3 260.4 263.1 273.8Nondefense, total . . . . . . . . . . . . 843.1 1,123.8 1,193.6 1,232.4 1,268.6 1,294.8 1,307.2 1,344.4 1,363.0 1,396.4
Payments for individuals . . . . . . 510.3 683.8 834.0 857.3 892.0 909.4 932.5 948.9 951.9 980.1Direct payments 2. . . . . . . . . 450.5 593.5 701.5 716.2 743.3 761.8 786.4 793.9 788.7 813.6Grants to state and localgovernments . . . . . . . . . . . 59.8 90.2 132.5 141.1 148.7 147.6 146.1 155.0 163.2 166.5
All other grants . . . . . . . . . . . . 109.0 67.1 74.7 79.2 80.9 80.2 83.7 83.6 90.6 96.2Net Interest 2 . . . . . . . . . . . . . 93.3 213.6 211.6 211.2 236.6 241.1 239.9 234.1 220.2 208.0All other 2. . . . . . . . . . . . . . . . 171.9 207.2 115.8 125.6 106.0 101.8 100.3 123.1 138.7 152.3Undistributed offsettingreceipts 2 . . . . . . . . . . . . . . . -41.4 -47.8 -42.5 -41.0 -46.8 -37.6 -49.3 -45.3 -38.3 -40.2
Total outlays as percent ofGDP. . . . . . . . . . . . . . . . . 21.6 21.8 21.5 21.0 20.7 20.3 19.6 19.1 18.7 18.7
National defense 1. . . . . . . . . . . . 4.9 5.2 4.4 4.1 3.7 3.5 3.3 3.1 3.0 3.0Nondefense, total . . . . . . . . . . . . 16.7 16.6 17.0 17.0 17.0 16.8 16.3 16.0 15.7 15.7
Payments for individuals . . . . . . 10.2 10.2 11.9 11.8 11.9 11.8 11.6 11.3 11.0 11.0Direct payments 2. . . . . . . . . 9.0 8.8 10.0 9.9 10.0 9.9 9.8 9.5 9.1 9.2Grants to state and localgovernments . . . . . . . . . . . 1.2 1.3 1.9 1.9 2.0 1.9 1.8 1.8 1.9 1.9
All other grants . . . . . . . . . . . . 2.1 1.0 1.1 1.1 1.1 1.0 1.0 1.0 1.1 1.1Net Interest 2 . . . . . . . . . . . . . 1.9 3.2 3.0 2.9 3.2 3.1 3.0 2.8 2.5 2.3All other 2. . . . . . . . . . . . . . . . 3.2 2.9 1.6 1.7 1.4 1.3 1.2 1.5 1.6 1.7
Percent of outlays, total . . . 100.0 100.0 100.0 100.0 100.0 100.0 100.0 100.0 100.0 100.0National defense 1. . . . . . . . . . . . 22.7 23.9 20.7 19.3 17.9 17.0 16.9 16.2 16.1 16.2Nondefense, total . . . . . . . . . . . . 77.3 76.1 79.3 80.7 82.1 83.0 83.1 83.8 83.9 83.8
Payments for individuals . . . . . . 47.1 46.6 55.5 56.2 57.7 58.3 59.3 59.1 58.6 59.0Direct payments 2. . . . . . . . . 41.6 40.5 46.7 47.0 48.1 48.8 50.0 49.4 48.6 49.0Grants to state and localgovernments . . . . . . . . . . . 5.5 6.2 8.8 9.3 9.6 9.5 9.3 9.7 10.0 10.0
All other grants . . . . . . . . . . . . 9.9 4.6 4.9 5.1 5.2 5.1 5.3 5.2 5.6 5.8Net Interest 2 . . . . . . . . . . . . . 8.9 14.7 14.1 13.9 15.3 15.4 15.2 14.6 13.5 12.3All other 2. . . . . . . . . . . . . . . . 14.8 13.1 7.5 8.1 6.8 6.5 6.3 7.7 8.5 9.0Undistributed offsettingreceipts 2 . . . . . . . . . . . . . . . -3.4 -2.9 -2.7 -2.6 -2.9 -2.4 -3.1 -2.9 -2.4 -2.4
1 Includes a small amount of grants to State and local governments and direct payments for individuals. 2 Includes someoff-budget amounts; most of the off-budget amounts are direct payments for individuals (social security benefits).
Source: U.S. Office of Management and Budget, Historical Tables, annual.
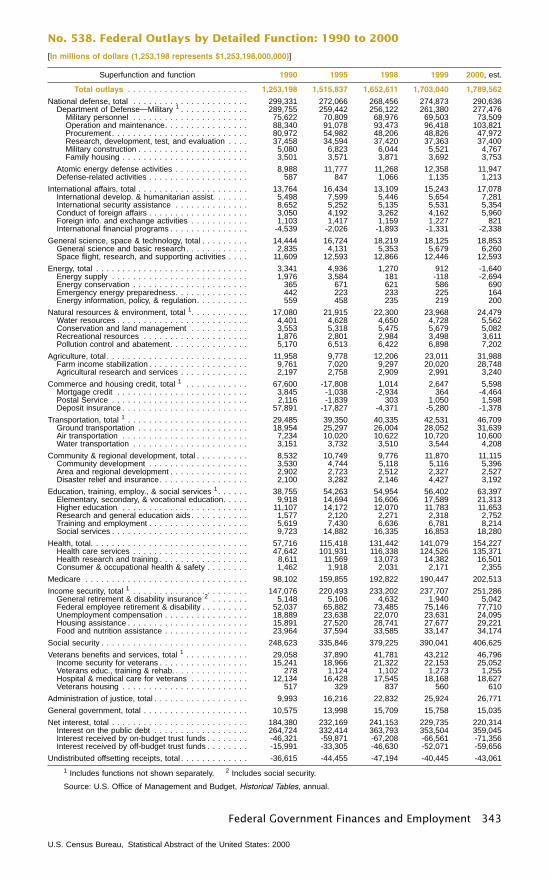
No. 537. Federal Outlays by Agency: 1990 to 2000[In millions of dollars (1,253,198 represents $1,253,198,000,000)]
Department or other unit 1990 1995 1998 1999 2000, est.
Total outlays . . . . . . . . . . . . . . . . . . . . 1,253,198 1,515,837 1,652,611 1,703,040 1,789,562
Legislative Branch . . . . . . . . . . . . . . . . . . . . . . 2,241 2,625 2,600 2,609 3,197The Judiciary Branch . . . . . . . . . . . . . . . . . . . . 1,646 2,903 3,467 3,790 4,378
Agriculture . . . . . . . . . . . . . . . . . . . . . . . . . . . 46,012 56,665 53,947 62,834 71,096Commerce . . . . . . . . . . . . . . . . . . . . . . . . . . . 3,734 3,401 4,046 5,036 8,134Defense-Military . . . . . . . . . . . . . . . . . . . . . . . 289,755 259,556 256,122 261,380 277,476Education . . . . . . . . . . . . . . . . . . . . . . . . . . . 22,972 31,205 31,498 32,436 36,444Energy . . . . . . . . . . . . . . . . . . . . . . . . . . . . . 12,084 17,617 14,438 16,048 15,269Health and Human Services . . . . . . . . . . . . . . . 175,531 303,081 350,570 359,701 387,339Housing and Urban Development . . . . . . . . . . . . 20,167 29,044 30,227 32,734 30,076Interior . . . . . . . . . . . . . . . . . . . . . . . . . . . . . 5,825 7,486 7,274 7,815 8,397Justice . . . . . . . . . . . . . . . . . . . . . . . . . . . . . 6,507 10,788 16,168 18,317 18,536Labor . . . . . . . . . . . . . . . . . . . . . . . . . . . . . . 25,215 32,092 30,007 32,461 33,986State. . . . . . . . . . . . . . . . . . . . . . . . . . . . . . . 4,802 6,267 5,382 6,456 8,402Transportation . . . . . . . . . . . . . . . . . . . . . . . . 28,650 38,777 39,466 41,829 45,925Treasury . . . . . . . . . . . . . . . . . . . . . . . . . . . . 255,172 348,579 390,103 386,698 388,412Veterans Affairs. . . . . . . . . . . . . . . . . . . . . . . . 28,998 37,771 41,773 43,168 46,723Corps of Engineers . . . . . . . . . . . . . . . . . . . . . 3,324 3,745 3,845 4,191 4,498Other Defense-Civil Programs . . . . . . . . . . . . . . 21,692 27,977 31,216 32,014 33,008Environmental Protection Agency . . . . . . . . . . . . 5,108 6,351 6,284 6,750 7,040Executive Office of the President . . . . . . . . . . . . 158 215 237 417 267Federal Emergency Management Administration . . 2,183 3,136 2,096 4,039 3,198General Services Administration. . . . . . . . . . . . . -93 831 1,091 -46 525International Assistance Programs . . . . . . . . . . . 10,086 11,129 8,974 10,059 10,498National Aeronautics and Space Administration. . . 12,429 13,378 14,206 13,664 13,447National Science Foundation . . . . . . . . . . . . . . . 1,838 2,845 3,188 3,283 3,596Office of Personnel Management . . . . . . . . . . . . 31,949 41,276 46,305 47,515 49,352Small Business Administration . . . . . . . . . . . . . . 692 677 -77 57 107Social Security Administration (on-budget) . . . . . . 18,147 31,753 38,134 40,575 44,518Social Security Administration (off-budget) . . . . . . 244,998 330,370 370,069 379,213 394,947Other Independent Agencies (on-budget) . . . . . . . 68,679 -6,102 10,773 6,054 12,503Other Independent Agencies (off-budget) . . . . . . . 1,626 -1,969 217 1,021 1,498Undistributed offsetting receipts . . . . . . . . . . . . . -98,930 -137,632 -161,035 -159,078 -174,073
Source: U.S. Office of Management and Budget, Historical Tables, annual.
342 Federal Government Finances and Employment
U.S. Census Bureau, Statistical Abstract of the United States: 2000
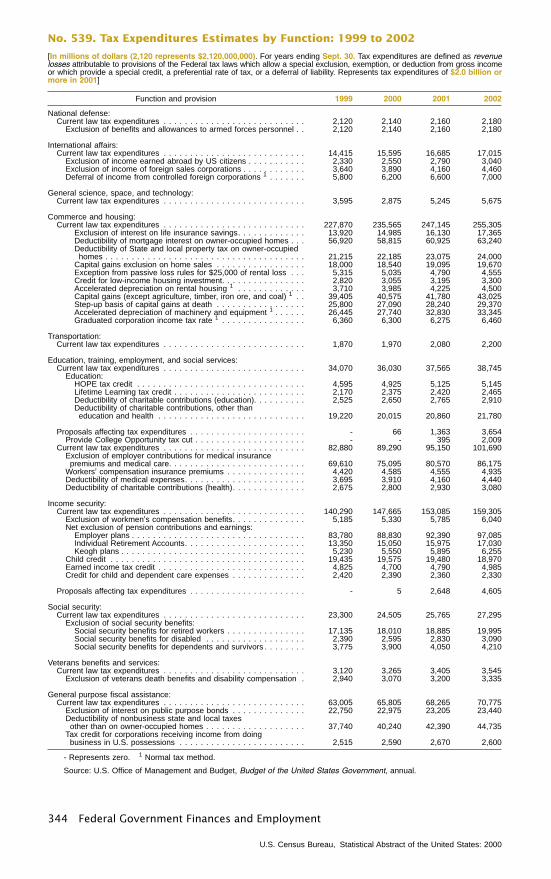
No. 538. Federal Outlays by Detailed Function: 1990 to 2000
[In millions of dollars (1,253,198 represents $1,253,198,000,000)]
Superfunction and function 1990 1995 1998 1999 2000, est.
Total outlays . . . . . . . . . . . . . . . . . . . . . . . 1,253,198 1,515,837 1,652,611 1,703,040 1,789,562
National defense, total . . . . . . . . . . . . . . . . . . . . . . 299,331 272,066 268,456 274,873 290,636Department of Defense—Military 1 . . . . . . . . . . . . . 289,755 259,442 256,122 261,380 277,476
Military personnel . . . . . . . . . . . . . . . . . . . . . . 75,622 70,809 68,976 69,503 73,509Operation and maintenance. . . . . . . . . . . . . . . . 88,340 91,078 93,473 96,418 103,821Procurement . . . . . . . . . . . . . . . . . . . . . . . . . . 80,972 54,982 48,206 48,826 47,972Research, development, test, and evaluation . . . . 37,458 34,594 37,420 37,363 37,400Military construction . . . . . . . . . . . . . . . . . . . . . 5,080 6,823 6,044 5,521 4,767Family housing . . . . . . . . . . . . . . . . . . . . . . . . 3,501 3,571 3,871 3,692 3,753
Atomic energy defense activities . . . . . . . . . . . . . . 8,988 11,777 11,268 12,358 11,947Defense-related activities . . . . . . . . . . . . . . . . . . . 587 847 1,066 1,135 1,213
International affairs, total . . . . . . . . . . . . . . . . . . . . . 13,764 16,434 13,109 15,243 17,078International develop. & humanitarian assist. . . . . . . 5,498 7,599 5,446 5,654 7,281International security assistance . . . . . . . . . . . . . . 8,652 5,252 5,135 5,531 5,354Conduct of foreign affairs . . . . . . . . . . . . . . . . . . . 3,050 4,192 3,262 4,162 5,960Foreign info. and exchange activities . . . . . . . . . . . 1,103 1,417 1,159 1,227 821International financial programs . . . . . . . . . . . . . . . -4,539 -2,026 -1,893 -1,331 -2,338
General science, space & technology, total . . . . . . . . . 14,444 16,724 18,219 18,125 18,853General science and basic research. . . . . . . . . . . . 2,835 4,131 5,353 5,679 6,260Space flight, research, and supporting activities . . . . 11,609 12,593 12,866 12,446 12,593
Energy, total . . . . . . . . . . . . . . . . . . . . . . . . . . . . . 3,341 4,936 1,270 912 -1,640Energy supply . . . . . . . . . . . . . . . . . . . . . . . . . . 1,976 3,584 181 -118 -2,694Energy conservation . . . . . . . . . . . . . . . . . . . . . . 365 671 621 586 690Emergency energy preparedness. . . . . . . . . . . . . . 442 223 233 225 164Energy information, policy, & regulation. . . . . . . . . . 559 458 235 219 200
Natural resources & environment, total 1. . . . . . . . . . . 17,080 21,915 22,300 23,968 24,479Water resources . . . . . . . . . . . . . . . . . . . . . . . . . 4,401 4,628 4,650 4,728 5,562Conservation and land management . . . . . . . . . . . 3,553 5,318 5,475 5,679 5,082Recreational resources . . . . . . . . . . . . . . . . . . . . 1,876 2,801 2,984 3,498 3,611Pollution control and abatement. . . . . . . . . . . . . . . 5,170 6,513 6,422 6,898 7,202
Agriculture, total . . . . . . . . . . . . . . . . . . . . . . . . . . . 11,958 9,778 12,206 23,011 31,988Farm income stabilization . . . . . . . . . . . . . . . . . . . 9,761 7,020 9,297 20,020 28,748Agricultural research and services . . . . . . . . . . . . . 2,197 2,758 2,909 2,991 3,240
Commerce and housing credit, total 1 . . . . . . . . . . . . 67,600 -17,808 1,014 2,647 5,598Mortgage credit . . . . . . . . . . . . . . . . . . . . . . . . . 3,845 -1,038 -2,934 364 -4,464Postal Service . . . . . . . . . . . . . . . . . . . . . . . . . . 2,116 -1,839 303 1,050 1,598Deposit insurance . . . . . . . . . . . . . . . . . . . . . . . . 57,891 -17,827 -4,371 -5,280 -1,378
Transportation, total 1 . . . . . . . . . . . . . . . . . . . . . . . 29,485 39,350 40,335 42,531 46,709Ground transportation . . . . . . . . . . . . . . . . . . . . . 18,954 25,297 26,004 28,052 31,639Air transportation . . . . . . . . . . . . . . . . . . . . . . . . 7,234 10,020 10,622 10,720 10,600Water transportation . . . . . . . . . . . . . . . . . . . . . . 3,151 3,732 3,510 3,544 4,208
Community & regional development, total . . . . . . . . . . 8,532 10,749 9,776 11,870 11,115Community development . . . . . . . . . . . . . . . . . . . 3,530 4,744 5,118 5,116 5,396Area and regional development . . . . . . . . . . . . . . . 2,902 2,723 2,512 2,327 2,527Disaster relief and insurance. . . . . . . . . . . . . . . . . 2,100 3,282 2,146 4,427 3,192
Education, training, employ., & social services 1. . . . . . 38,755 54,263 54,954 56,402 63,397Elementary, secondary, & vocational education. . . . . 9,918 14,694 16,606 17,589 21,313Higher education . . . . . . . . . . . . . . . . . . . . . . . . 11,107 14,172 12,070 11,783 11,653Research and general education aids . . . . . . . . . . . 1,577 2,120 2,271 2,318 2,752Training and employment . . . . . . . . . . . . . . . . . . . 5,619 7,430 6,636 6,781 8,214Social services . . . . . . . . . . . . . . . . . . . . . . . . . . 9,723 14,882 16,335 16,853 18,280
Health, total. . . . . . . . . . . . . . . . . . . . . . . . . . . . . . 57,716 115,418 131,442 141,079 154,227Health care services . . . . . . . . . . . . . . . . . . . . . . 47,642 101,931 116,338 124,526 135,371Health research and training . . . . . . . . . . . . . . . . . 8,611 11,569 13,073 14,382 16,501Consumer & occupational health & safety . . . . . . . . 1,462 1,918 2,031 2,171 2,355
Medicare . . . . . . . . . . . . . . . . . . . . . . . . . . . . . . . 98,102 159,855 192,822 190,447 202,513
Income security, total 1 . . . . . . . . . . . . . . . . . . . . . . 147,076 220,493 233,202 237,707 251,286General retirement & disability insurance 2 . . . . . . . 5,148 5,106 4,632 1,940 5,042Federal employee retirement & disability . . . . . . . . . 52,037 65,882 73,485 75,146 77,710Unemployment compensation . . . . . . . . . . . . . . . . 18,889 23,638 22,070 23,631 24,095Housing assistance . . . . . . . . . . . . . . . . . . . . . . . 15,891 27,520 28,741 27,677 29,221Food and nutrition assistance . . . . . . . . . . . . . . . . 23,964 37,594 33,585 33,147 34,174
Social security . . . . . . . . . . . . . . . . . . . . . . . . . . . . 248,623 335,846 379,225 390,041 406,625
Veterans benefits and services, total 1 . . . . . . . . . . . . 29,058 37,890 41,781 43,212 46,796Income security for veterans . . . . . . . . . . . . . . . . . 15,241 18,966 21,322 22,153 25,052Veterans educ., training & rehab. . . . . . . . . . . . . . . 278 1,124 1,102 1,273 1,255Hospital & medical care for veterans . . . . . . . . . . . 12,134 16,428 17,545 18,168 18,627Veterans housing . . . . . . . . . . . . . . . . . . . . . . . . 517 329 837 560 610
Administration of justice, total . . . . . . . . . . . . . . . . . . 9,993 16,216 22,832 25,924 26,771
General government, total . . . . . . . . . . . . . . . . . . . . 10,575 13,998 15,709 15,758 15,035
Net interest, total . . . . . . . . . . . . . . . . . . . . . . . . . . 184,380 232,169 241,153 229,735 220,314Interest on the public debt . . . . . . . . . . . . . . . . . . 264,724 332,414 363,793 353,504 359,045Interest received by on-budget trust funds . . . . . . . . -46,321 -59,871 -67,208 -66,561 -71,356Interest received by off-budget trust funds . . . . . . . . -15,991 -33,305 -46,630 -52,071 -59,656
Undistributed offsetting receipts, total . . . . . . . . . . . . . -36,615 -44,455 -47,194 -40,445 -43,061
1 Includes functions not shown separately. 2 Includes social security.
Source: U.S. Office of Management and Budget, Historical Tables, annual.
Federal Government Finances and Employment 343
U.S. Census Bureau, Statistical Abstract of the United States: 2000
No. 539. Tax Expenditures Estimates by Function: 1999 to 2002
[In millions of dollars (2,120 represents $2,120,000,000). For years ending Sept. 30. Tax expenditures are defined as revenuelosses attributable to provisions of the Federal tax laws which allow a special exclusion, exemption, or deduction from gross incomeor which provide a special credit, a preferential rate of tax, or a deferral of liability. Represents tax expenditures of $2.0 billion ormore in 2001]
Function and provision 1999 2000 2001 2002
National defense:Current law tax expenditures . . . . . . . . . . . . . . . . . . . . . . . . . . . 2,120 2,140 2,160 2,180
Exclusion of benefits and allowances to armed forces personnel . . 2,120 2,140 2,160 2,180
International affairs:Current law tax expenditures . . . . . . . . . . . . . . . . . . . . . . . . . . . 14,415 15,595 16,685 17,015
Exclusion of income earned abroad by US citizens . . . . . . . . . . . 2,330 2,550 2,790 3,040Exclusion of income of foreign sales corporations . . . . . . . . . . . . 3,640 3,890 4,160 4,460Deferral of income from controlled foreign corporations 1 . . . . . . . 5,800 6,200 6,600 7,000
General science, space, and technology:Current law tax expenditures . . . . . . . . . . . . . . . . . . . . . . . . . . . 3,595 2,875 5,245 5,675
Commerce and housing:Current law tax expenditures . . . . . . . . . . . . . . . . . . . . . . . . . . . 227,870 235,565 247,145 255,305
Exclusion of interest on life insurance savings. . . . . . . . . . . . . 13,920 14,985 16,130 17,365Deductibility of mortgage interest on owner-occupied homes . . . 56,920 58,815 60,925 63,240Deductibility of State and local property tax on owner-occupiedhomes . . . . . . . . . . . . . . . . . . . . . . . . . . . . . . . . . . . . . . 21,215 22,185 23,075 24,000
Capital gains exclusion on home sales . . . . . . . . . . . . . . . . . 18,000 18,540 19,095 19,670Exception from passive loss rules for $25,000 of rental loss . . . 5,315 5,035 4,790 4,555Credit for low-income housing investment. . . . . . . . . . . . . . . . 2,820 3,055 3,195 3,300Accelerated depreciation on rental housing 1 . . . . . . . . . . . . . 3,710 3,985 4,225 4,500Capital gains (except agriculture, timber, iron ore, and coal) 1 . . 39,405 40,575 41,780 43,025Step-up basis of capital gains at death . . . . . . . . . . . . . . . . . 25,800 27,090 28,240 29,370Accelerated depreciation of machinery and equipment 1 . . . . . . 26,445 27,740 32,830 33,345Graduated corporation income tax rate 1 . . . . . . . . . . . . . . . . 6,360 6,300 6,275 6,460
Transportation:Current law tax expenditures . . . . . . . . . . . . . . . . . . . . . . . . . . . 1,870 1,970 2,080 2,200
Education, training, employment, and social services:Current law tax expenditures . . . . . . . . . . . . . . . . . . . . . . . . . . . 34,070 36,030 37,565 38,745
Education:HOPE tax credit . . . . . . . . . . . . . . . . . . . . . . . . . . . . . . . . 4,595 4,925 5,125 5,145Lifetime Learning tax credit . . . . . . . . . . . . . . . . . . . . . . . . . 2,170 2,375 2,420 2,465Deductibility of charitable contributions (education). . . . . . . . . . 2,525 2,650 2,765 2,910Deductibility of charitable contributions, other thaneducation and health . . . . . . . . . . . . . . . . . . . . . . . . . . . . 19,220 20,015 20,860 21,780
Proposals affecting tax expenditures . . . . . . . . . . . . . . . . . . . . . . - 66 1,363 3,654Provide College Opportunity tax cut . . . . . . . . . . . . . . . . . . . . . - - 395 2,009
Current law tax expenditures . . . . . . . . . . . . . . . . . . . . . . . . . . . 82,880 89,290 95,150 101,690Exclusion of employer contributions for medical insurancepremiums and medical care. . . . . . . . . . . . . . . . . . . . . . . . . . 69,610 75,095 80,570 86,175
Workers’ compensation insurance premiums . . . . . . . . . . . . . . . 4,420 4,585 4,555 4,935Deductibility of medical expenses. . . . . . . . . . . . . . . . . . . . . . . 3,695 3,910 4,160 4,440Deductibility of charitable contributions (health). . . . . . . . . . . . . . 2,675 2,800 2,930 3,080
Income security:Current law tax expenditures . . . . . . . . . . . . . . . . . . . . . . . . . . . 140,290 147,665 153,085 159,305
Exclusion of workmen’s compensation benefits. . . . . . . . . . . . . . 5,185 5,330 5,785 6,040Net exclusion of pension contributions and earnings:
Employer plans . . . . . . . . . . . . . . . . . . . . . . . . . . . . . . . . . 83,780 88,830 92,390 97,085Individual Retirement Accounts. . . . . . . . . . . . . . . . . . . . . . . 13,350 15,050 15,975 17,030Keogh plans . . . . . . . . . . . . . . . . . . . . . . . . . . . . . . . . . . . 5,230 5,550 5,895 6,255
Child credit . . . . . . . . . . . . . . . . . . . . . . . . . . . . . . . . . . . . . 19,435 19,575 19,480 18,970Earned income tax credit . . . . . . . . . . . . . . . . . . . . . . . . . . . . 4,825 4,700 4,790 4,985Credit for child and dependent care expenses . . . . . . . . . . . . . . 2,420 2,390 2,360 2,330
Proposals affecting tax expenditures . . . . . . . . . . . . . . . . . . . . . . - 5 2,648 4,605
Social security:Current law tax expenditures . . . . . . . . . . . . . . . . . . . . . . . . . . . 23,300 24,505 25,765 27,295
Exclusion of social security benefits:Social security benefits for retired workers . . . . . . . . . . . . . . . 17,135 18,010 18,885 19,995Social security benefits for disabled . . . . . . . . . . . . . . . . . . . 2,390 2,595 2,830 3,090Social security benefits for dependents and survivors . . . . . . . . 3,775 3,900 4,050 4,210
Veterans benefits and services:Current law tax expenditures . . . . . . . . . . . . . . . . . . . . . . . . . . . 3,120 3,265 3,405 3,545
Exclusion of veterans death benefits and disability compensation . 2,940 3,070 3,200 3,335
General purpose fiscal assistance:Current law tax expenditures . . . . . . . . . . . . . . . . . . . . . . . . . . . 63,005 65,805 68,265 70,775
Exclusion of interest on public purpose bonds . . . . . . . . . . . . . . 22,750 22,975 23,205 23,440Deductibility of nonbusiness state and local taxesother than on owner-occupied homes . . . . . . . . . . . . . . . . . . . 37,740 40,240 42,390 44,735
Tax credit for corporations receiving income from doingbusiness in U.S. possessions . . . . . . . . . . . . . . . . . . . . . . . . 2,515 2,590 2,670 2,600
- Represents zero. 1 Normal tax method.
Source: U.S. Office of Management and Budget, Budget of the United States Government, annual.
344 Federal Government Finances and Employment
U.S. Census Bureau, Statistical Abstract of the United States: 2000
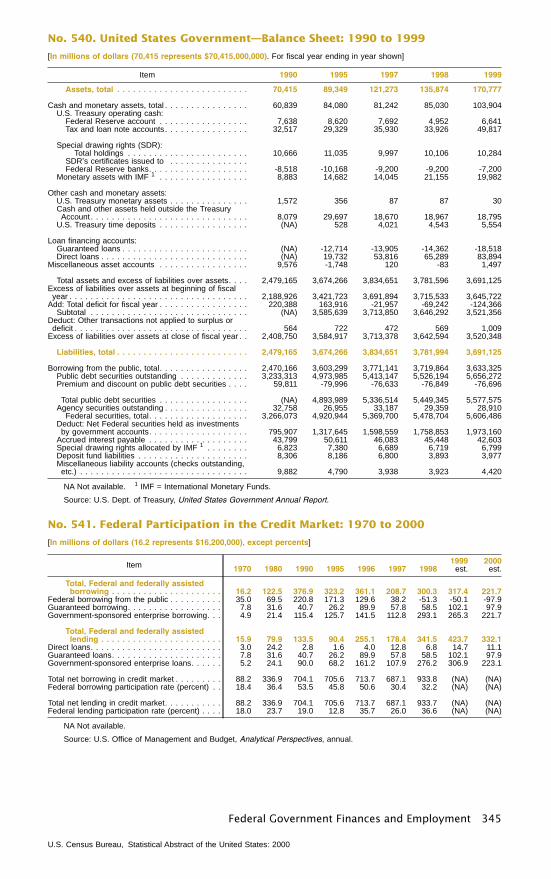
No. 540. United States Government—Balance Sheet: 1990 to 1999
[In millions of dollars (70,415 represents $70,415,000,000). For fiscal year ending in year shown]
Item 1990 1995 1997 1998 1999
Assets, total . . . . . . . . . . . . . . . . . . . . . . . . . 70,415 89,349 121,273 135,874 170,777
Cash and monetary assets, total . . . . . . . . . . . . . . . . 60,839 84,080 81,242 85,030 103,904U.S. Treasury operating cash:
Federal Reserve account . . . . . . . . . . . . . . . . . 7,638 8,620 7,692 4,952 6,641Tax and loan note accounts. . . . . . . . . . . . . . . . 32,517 29,329 35,930 33,926 49,817
Special drawing rights (SDR):Total holdings . . . . . . . . . . . . . . . . . . . . . . . 10,666 11,035 9,997 10,106 10,284
SDR’s certificates issued to . . . . . . . . . . . . . . .Federal Reserve banks. . . . . . . . . . . . . . . . . . . -8,518 -10,168 -9,200 -9,200 -7,200
Monetary assets with IMF 1 . . . . . . . . . . . . . . . . . 8,883 14,682 14,045 21,155 19,982
Other cash and monetary assets:U.S. Treasury monetary assets . . . . . . . . . . . . . . . 1,572 356 87 87 30Cash and other assets held outside the TreasuryAccount . . . . . . . . . . . . . . . . . . . . . . . . . . . . . . 8,079 29,697 18,670 18,967 18,795
U.S. Treasury time deposits . . . . . . . . . . . . . . . . . (NA) 528 4,021 4,543 5,554
Loan financing accounts:Guaranteed loans . . . . . . . . . . . . . . . . . . . . . . . . (NA) -12,714 -13,905 -14,362 -18,518Direct loans . . . . . . . . . . . . . . . . . . . . . . . . . . . . (NA) 19,732 53,816 65,289 83,894
Miscellaneous asset accounts . . . . . . . . . . . . . . . . . 9,576 -1,748 120 -83 1,497
Total assets and excess of liabilities over assets. . . . 2,479,165 3,674,266 3,834,651 3,781,596 3,691,125Excess of liabilities over assets at beginning of fiscalyear . . . . . . . . . . . . . . . . . . . . . . . . . . . . . . . . . . 2,188,926 3,421,723 3,691,894 3,715,533 3,645,722
Add: Total deficit for fiscal year . . . . . . . . . . . . . . . . . 220,388 163,916 -21,957 -69,242 -124,366Subtotal . . . . . . . . . . . . . . . . . . . . . . . . . . . . . . (NA) 3,585,639 3,713,850 3,646,292 3,521,356
Deduct: Other transactions not applied to surplus ordeficit . . . . . . . . . . . . . . . . . . . . . . . . . . . . . . . . . 564 722 472 569 1,009
Excess of liabilities over assets at close of fiscal year . . 2,408,750 3,584,917 3,713,378 3,642,594 3,520,348
Liabilities, total . . . . . . . . . . . . . . . . . . . . . . . . . 2,479,165 3,674,266 3,834,651 3,781,994 3,691,125
Borrowing from the public, total. . . . . . . . . . . . . . . . . 2,470,166 3,603,299 3,771,141 3,719,864 3,633,325Public debt securities outstanding . . . . . . . . . . . . . 3,233,313 4,973,985 5,413,147 5,526,194 5,656,272Premium and discount on public debt securities . . . . 59,811 -79,996 -76,633 -76,849 -76,696
Total public debt securities . . . . . . . . . . . . . . . . . (NA) 4,893,989 5,336,514 5,449,345 5,577,575Agency securities outstanding . . . . . . . . . . . . . . . . 32,758 26,955 33,187 29,359 28,910
Federal securities, total. . . . . . . . . . . . . . . . . . . 3,266,073 4,920,944 5,369,700 5,478,704 5,606,486Deduct: Net Federal securities held as investmentsby government accounts. . . . . . . . . . . . . . . . . . . 795,907 1,317,645 1,598,559 1,758,853 1,973,160
Accrued interest payable . . . . . . . . . . . . . . . . . . . 43,799 50,611 46,083 45,448 42,603Special drawing rights allocated by IMF 1 . . . . . . . . 6,823 7,380 6,689 6,719 6,799Deposit fund liabilities . . . . . . . . . . . . . . . . . . . . . 8,306 8,186 6,800 3,893 3,977Miscellaneous liability accounts (checks outstanding,etc.) . . . . . . . . . . . . . . . . . . . . . . . . . . . . . . . . 9,882 4,790 3,938 3,923 4,420
NA Not available. 1 IMF = International Monetary Funds.
Source: U.S. Dept. of Treasury, United States Government Annual Report.
No. 541. Federal Participation in the Credit Market: 1970 to 2000
[In millions of dollars (16.2 represents $16,200,000), except percents]
Item 1970 1980 1990 1995 1996 1997 19981999
est.2000
est.
Total, Federal and federally assistedborrowing . . . . . . . . . . . . . . . . . . . . . 16.2 122.5 376.9 323.2 361.1 208.7 300.3 317.4 221.7
Federal borrowing from the public . . . . . . . . . . 35.0 69.5 220.8 171.3 129.6 38.2 -51.3 -50.1 -97.9Guaranteed borrowing. . . . . . . . . . . . . . . . . . 7.8 31.6 40.7 26.2 89.9 57.8 58.5 102.1 97.9Government-sponsored enterprise borrowing. . . 4.9 21.4 115.4 125.7 141.5 112.8 293.1 265.3 221.7
Total, Federal and federally assistedlending . . . . . . . . . . . . . . . . . . . . . . . 15.9 79.9 133.5 90.4 255.1 178.4 341.5 423.7 332.1
Direct loans. . . . . . . . . . . . . . . . . . . . . . . . . 3.0 24.2 2.8 1.6 4.0 12.8 6.8 14.7 11.1Guaranteed loans. . . . . . . . . . . . . . . . . . . . . 7.8 31.6 40.7 26.2 89.9 57.8 58.5 102.1 97.9Government-sponsored enterprise loans. . . . . . 5.2 24.1 90.0 68.2 161.2 107.9 276.2 306.9 223.1
Total net borrowing in credit market . . . . . . . . . 88.2 336.9 704.1 705.6 713.7 687.1 933.8 (NA) (NA)Federal borrowing participation rate (percent) . . 18.4 36.4 53.5 45.8 50.6 30.4 32.2 (NA) (NA)
Total net lending in credit market. . . . . . . . . . . 88.2 336.9 704.1 705.6 713.7 687.1 933.7 (NA) (NA)Federal lending participation rate (percent) . . . . 18.0 23.7 19.0 12.8 35.7 26.0 36.6 (NA) (NA)
NA Not available.
Source: U.S. Office of Management and Budget, Analytical Perspectives, annual.
Federal Government Finances and Employment 345
U.S. Census Bureau, Statistical Abstract of the United States: 2000
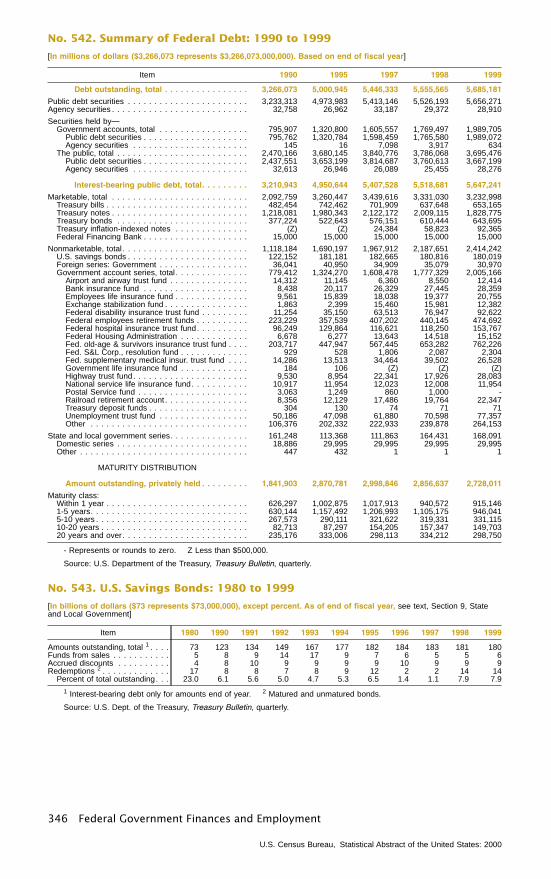
No. 542. Summary of Federal Debt: 1990 to 1999
[In millions of dollars ($3,266,073 represents $3,266,073,000,000). Based on end of fiscal year]
Item 1990 1995 1997 1998 1999
Debt outstanding, total . . . . . . . . . . . . . . . . 3,266,073 5,000,945 5,446,333 5,555,565 5,685,181
Public debt securities . . . . . . . . . . . . . . . . . . . . . . . 3,233,313 4,973,983 5,413,146 5,526,193 5,656,271Agency securities . . . . . . . . . . . . . . . . . . . . . . . . . . 32,758 26,962 33,187 29,372 28,910
Securities held by—Government accounts, total . . . . . . . . . . . . . . . . . 795,907 1,320,800 1,605,557 1,769,497 1,989,705
Public debt securities . . . . . . . . . . . . . . . . . . . . 795,762 1,320,784 1,598,459 1,765,580 1,989,072Agency securities . . . . . . . . . . . . . . . . . . . . . . 145 16 7,098 3,917 634
The public, total . . . . . . . . . . . . . . . . . . . . . . . . . 2,470,166 3,680,145 3,840,776 3,786,068 3,695,476Public debt securities . . . . . . . . . . . . . . . . . . . . 2,437,551 3,653,199 3,814,687 3,760,613 3,667,199Agency securities . . . . . . . . . . . . . . . . . . . . . . 32,613 26,946 26,089 25,455 28,276
Interest-bearing public debt, total. . . . . . . . . 3,210,943 4,950,644 5,407,528 5,518,681 5,647,241
Marketable, total . . . . . . . . . . . . . . . . . . . . . . . . . . 2,092,759 3,260,447 3,439,616 3,331,030 3,232,998Treasury bills . . . . . . . . . . . . . . . . . . . . . . . . . . . 482,454 742,462 701,909 637,648 653,165Treasury notes . . . . . . . . . . . . . . . . . . . . . . . . . . 1,218,081 1,980,343 2,122,172 2,009,115 1,828,775Treasury bonds . . . . . . . . . . . . . . . . . . . . . . . . . 377,224 522,643 576,151 610,444 643,695Treasury inflation-indexed notes . . . . . . . . . . . . . . (Z) (Z) 24,384 58,823 92,365Federal Financing Bank . . . . . . . . . . . . . . . . . . . . 15,000 15,000 15,000 15,000 15,000
Nonmarketable, total . . . . . . . . . . . . . . . . . . . . . . . . 1,118,184 1,690,197 1,967,912 2,187,651 2,414,242U.S. savings bonds . . . . . . . . . . . . . . . . . . . . . . . 122,152 181,181 182,665 180,816 180,019Foreign series: Government . . . . . . . . . . . . . . . . . 36,041 40,950 34,909 35,079 30,970Government account series, total . . . . . . . . . . . . . . 779,412 1,324,270 1,608,478 1,777,329 2,005,166
Airport and airway trust fund . . . . . . . . . . . . . . . 14,312 11,145 6,360 8,550 12,414Bank insurance fund . . . . . . . . . . . . . . . . . . . . 8,438 20,117 26,329 27,445 28,359Employees life insurance fund . . . . . . . . . . . . . . 9,561 15,839 18,038 19,377 20,755Exchange stabilization fund . . . . . . . . . . . . . . . . 1,863 2,399 15,460 15,981 12,382Federal disability insurance trust fund . . . . . . . . . 11,254 35,150 63,513 76,947 92,622Federal employees retirement funds . . . . . . . . . . 223,229 357,539 407,202 440,145 474,692Federal hospital insurance trust fund. . . . . . . . . . 96,249 129,864 116,621 118,250 153,767Federal Housing Administration . . . . . . . . . . . . . 6,678 6,277 13,643 14,518 15,152Fed. old-age & survivors insurance trust fund . . . . 203,717 447,947 567,445 653,282 762,226Fed. S&L Corp., resolution fund . . . . . . . . . . . . . 929 528 1,806 2,087 2,304Fed. supplementary medical insur. trust fund . . . . 14,286 13,513 34,464 39,502 26,528Government life insurance fund . . . . . . . . . . . . . 184 106 (Z) (Z) (Z)Highway trust fund. . . . . . . . . . . . . . . . . . . . . . 9,530 8,954 22,341 17,926 28,083National service life insurance fund. . . . . . . . . . . 10,917 11,954 12,023 12,008 11,954Postal Service fund . . . . . . . . . . . . . . . . . . . . . 3,063 1,249 860 1,000 -Railroad retirement account . . . . . . . . . . . . . . . . 8,356 12,129 17,486 19,764 22,347Treasury deposit funds . . . . . . . . . . . . . . . . . . . 304 130 74 71 71Unemployment trust fund . . . . . . . . . . . . . . . . . 50,186 47,098 61,880 70,598 77,357Other . . . . . . . . . . . . . . . . . . . . . . . . . . . . . . 106,376 202,332 222,933 239,878 264,153
State and local government series. . . . . . . . . . . . . . . 161,248 113,368 111,863 164,431 168,091Domestic series . . . . . . . . . . . . . . . . . . . . . . . . . 18,886 29,995 29,995 29,995 29,995Other . . . . . . . . . . . . . . . . . . . . . . . . . . . . . . . . 447 432 1 1 1
MATURITY DISTRIBUTION
Amount outstanding, privately held . . . . . . . . . 1,841,903 2,870,781 2,998,846 2,856,637 2,728,011
Maturity class:Within 1 year . . . . . . . . . . . . . . . . . . . . . . . . . . . 626,297 1,002,875 1,017,913 940,572 915,1461-5 years. . . . . . . . . . . . . . . . . . . . . . . . . . . . . . 630,144 1,157,492 1,206,993 1,105,175 946,0415-10 years . . . . . . . . . . . . . . . . . . . . . . . . . . . . . 267,573 290,111 321,622 319,331 331,11510-20 years . . . . . . . . . . . . . . . . . . . . . . . . . . . . 82,713 87,297 154,205 157,347 149,70320 years and over . . . . . . . . . . . . . . . . . . . . . . . . 235,176 333,006 298,113 334,212 298,750
- Represents or rounds to zero. Z Less than $500,000.
Source: U.S. Department of the Treasury, Treasury Bulletin, quarterly.
No. 543. U.S. Savings Bonds: 1980 to 1999
[In billions of dollars ($73 represents $73,000,000), except percent. As of end of fiscal year, see text, Section 9, Stateand Local Government]
Item 1980 1990 1991 1992 1993 1994 1995 1996 1997 1998 1999
Amounts outstanding, total 1 . . . . 73 123 134 149 167 177 182 184 183 181 180Funds from sales . . . . . . . . . . . 5 8 9 14 17 9 7 6 5 5 6Accrued discounts . . . . . . . . . . 4 8 10 9 9 9 9 10 9 9 9Redemptions 2 . . . . . . . . . . . . . 17 8 8 7 8 9 12 2 2 14 14
Percent of total outstanding. . . 23.0 6.1 5.6 5.0 4.7 5.3 6.5 1.4 1.1 7.9 7.9
1 Interest-bearing debt only for amounts end of year. 2 Matured and unmatured bonds.
Source: U.S. Dept. of the Treasury, Treasury Bulletin, quarterly.
346 Federal Government Finances and Employment
U.S. Census Bureau, Statistical Abstract of the United States: 2000
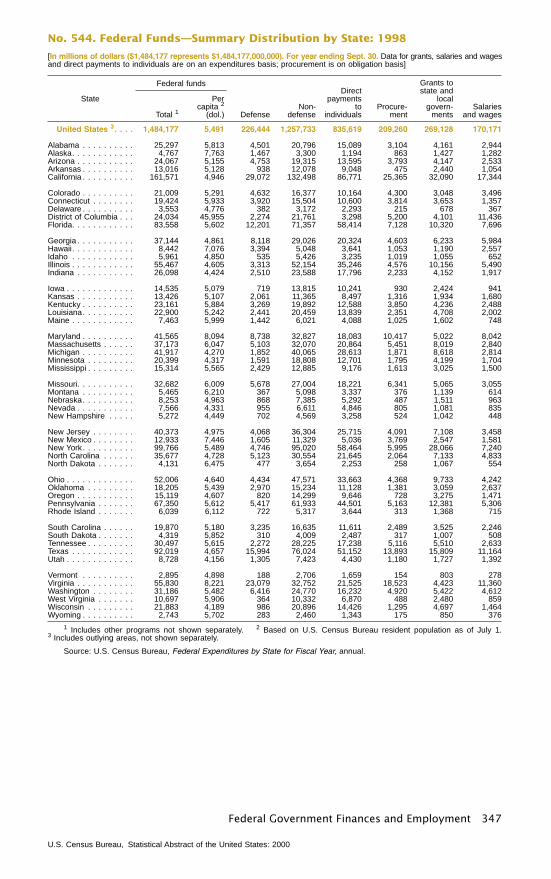
No. 544. Federal Funds—Summary Distribution by State: 1998
[In millions of dollars ($1,484,177 represents $1,484,177,000,000). For year ending Sept. 30. Data for grants, salaries and wagesand direct payments to individuals are on an expenditures basis; procurement is on obligation basis]
State
Federal funds
DefenseNon-
defense
Directpayments
toindividuals
Procure-ment
Grants tostate and
localgovern-
mentsSalaries
and wagesTotal 1
Percapita 2
(dol.)
United States 3. . . . 1,484,177 5,491 226,444 1,257,733 835,619 209,260 269,128 170,171
Alabama . . . . . . . . . . 25,297 5,813 4,501 20,796 15,089 3,104 4,161 2,944Alaska. . . . . . . . . . . . 4,767 7,763 1,467 3,300 1,194 863 1,427 1,282Arizona . . . . . . . . . . . 24,067 5,155 4,753 19,315 13,595 3,793 4,147 2,533Arkansas . . . . . . . . . . 13,016 5,128 938 12,078 9,048 475 2,440 1,054California . . . . . . . . . . 161,571 4,946 29,072 132,498 86,771 25,365 32,090 17,344
Colorado . . . . . . . . . . 21,009 5,291 4,632 16,377 10,164 4,300 3,048 3,496Connecticut . . . . . . . . 19,424 5,933 3,920 15,504 10,600 3,814 3,653 1,357Delaware . . . . . . . . . . 3,553 4,776 382 3,172 2,293 215 678 367District of Columbia . . . 24,034 45,955 2,274 21,761 3,298 5,200 4,101 11,436Florida. . . . . . . . . . . . 83,558 5,602 12,201 71,357 58,414 7,128 10,320 7,696
Georgia . . . . . . . . . . . 37,144 4,861 8,118 29,026 20,324 4,603 6,233 5,984Hawaii. . . . . . . . . . . . 8,442 7,076 3,394 5,048 3,641 1,053 1,190 2,557Idaho . . . . . . . . . . . . 5,961 4,850 535 5,426 3,235 1,019 1,055 652Illinois . . . . . . . . . . . . 55,467 4,605 3,313 52,154 35,246 4,576 10,156 5,490Indiana . . . . . . . . . . . 26,098 4,424 2,510 23,588 17,796 2,233 4,152 1,917
Iowa . . . . . . . . . . . . . 14,535 5,079 719 13,815 10,241 930 2,424 941Kansas . . . . . . . . . . . 13,426 5,107 2,061 11,365 8,497 1,316 1,934 1,680Kentucky . . . . . . . . . . 23,161 5,884 3,269 19,892 12,588 3,850 4,236 2,488Louisiana. . . . . . . . . . 22,900 5,242 2,441 20,459 13,839 2,351 4,708 2,002Maine . . . . . . . . . . . . 7,463 5,999 1,442 6,021 4,088 1,025 1,602 748
Maryland . . . . . . . . . . 41,565 8,094 8,738 32,827 18,083 10,417 5,022 8,042Massachusetts . . . . . . 37,173 6,047 5,103 32,070 20,864 5,451 8,019 2,840Michigan . . . . . . . . . . 41,917 4,270 1,852 40,065 28,613 1,871 8,618 2,814Minnesota . . . . . . . . . 20,399 4,317 1,591 18,808 12,701 1,795 4,199 1,704Mississippi . . . . . . . . . 15,314 5,565 2,429 12,885 9,176 1,613 3,025 1,500
Missouri. . . . . . . . . . . 32,682 6,009 5,678 27,004 18,221 6,341 5,065 3,055Montana . . . . . . . . . . 5,465 6,210 367 5,098 3,337 376 1,139 614Nebraska. . . . . . . . . . 8,253 4,963 868 7,385 5,292 487 1,511 963Nevada . . . . . . . . . . . 7,566 4,331 955 6,611 4,846 805 1,081 835New Hampshire . . . . . 5,272 4,449 702 4,569 3,258 524 1,042 448
New Jersey . . . . . . . . 40,373 4,975 4,068 36,304 25,715 4,091 7,108 3,458New Mexico . . . . . . . . 12,933 7,446 1,605 11,329 5,036 3,769 2,547 1,581New York. . . . . . . . . . 99,766 5,489 4,746 95,020 58,464 5,995 28,066 7,240North Carolina . . . . . . 35,677 4,728 5,123 30,554 21,645 2,064 7,133 4,833North Dakota . . . . . . . 4,131 6,475 477 3,654 2,253 258 1,067 554
Ohio . . . . . . . . . . . . . 52,006 4,640 4,434 47,571 33,663 4,368 9,733 4,242Oklahoma . . . . . . . . . 18,205 5,439 2,970 15,234 11,128 1,381 3,059 2,637Oregon . . . . . . . . . . . 15,119 4,607 820 14,299 9,646 728 3,275 1,471Pennsylvania . . . . . . . 67,350 5,612 5,417 61,933 44,501 5,163 12,381 5,306Rhode Island . . . . . . . 6,039 6,112 722 5,317 3,644 313 1,368 715
South Carolina . . . . . . 19,870 5,180 3,235 16,635 11,611 2,489 3,525 2,246South Dakota . . . . . . . 4,319 5,852 310 4,009 2,487 317 1,007 508Tennessee . . . . . . . . . 30,497 5,615 2,272 28,225 17,238 5,116 5,510 2,633Texas . . . . . . . . . . . . 92,019 4,657 15,994 76,024 51,152 13,893 15,809 11,164Utah . . . . . . . . . . . . . 8,728 4,156 1,305 7,423 4,430 1,180 1,727 1,392
Vermont . . . . . . . . . . 2,895 4,898 188 2,706 1,659 154 803 278Virginia . . . . . . . . . . . 55,830 8,221 23,079 32,752 21,525 18,523 4,423 11,360Washington . . . . . . . . 31,186 5,482 6,416 24,770 16,232 4,920 5,422 4,612West Virginia . . . . . . . 10,697 5,906 364 10,332 6,870 488 2,480 859Wisconsin . . . . . . . . . 21,883 4,189 986 20,896 14,426 1,295 4,697 1,464Wyoming . . . . . . . . . . 2,743 5,702 283 2,460 1,343 175 850 376
1 Includes other programs not shown separately. 2 Based on U.S. Census Bureau resident population as of July 1.3 Includes outlying areas, not shown separately.
Source: U.S. Census Bureau, Federal Expenditures by State for Fiscal Year, annual.
Federal Government Finances and Employment 347
U.S. Census Bureau, Statistical Abstract of the United States: 2000
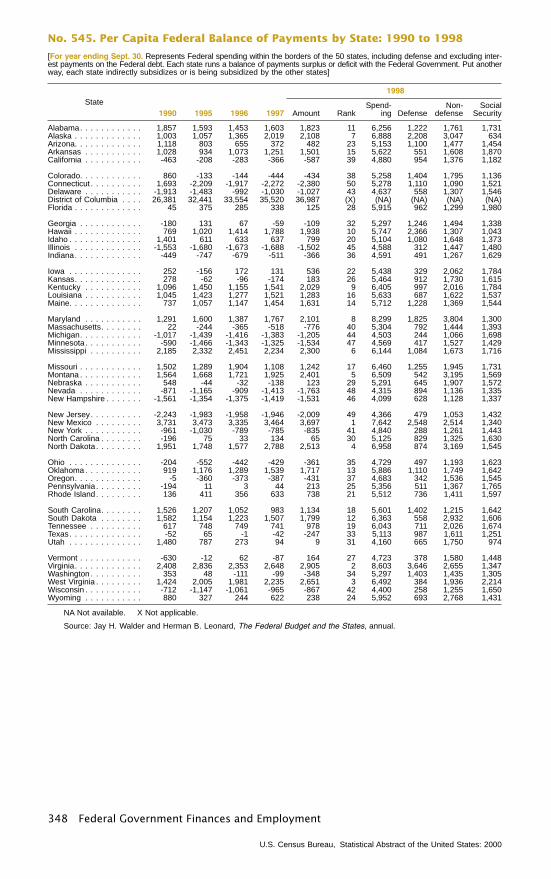
No. 545. Per Capita Federal Balance of Payments by State: 1990 to 1998
[For year ending Sept. 30. Represents Federal spending within the borders of the 50 states, including defense and excluding inter-est payments on the Federal debt. Each state runs a balance of payments surplus or deficit with the Federal Government. Put anotherway, each state indirectly subsidizes or is being subsidized by the other states]
State1990 1995 1996 1997
1998
Amount RankSpend-
ing DefenseNon-
defenseSocial
Security
Alabama. . . . . . . . . . . . 1,857 1,593 1,453 1,603 1,823 11 6,256 1,222 1,761 1,731Alaska . . . . . . . . . . . . . 1,003 1,057 1,365 2,019 2,108 7 6,888 2,208 3,047 634Arizona. . . . . . . . . . . . . 1,118 803 655 372 482 23 5,153 1,100 1,477 1,454Arkansas . . . . . . . . . . . 1,028 934 1,073 1,251 1,501 15 5,622 551 1,608 1,870California . . . . . . . . . . . -463 -208 -283 -366 -587 39 4,880 954 1,376 1,182
Colorado. . . . . . . . . . . . 860 -133 -144 -444 -434 38 5,258 1,404 1,795 1,136Connecticut . . . . . . . . . . 1,693 -2,209 -1,917 -2,272 -2,380 50 5,278 1,110 1,090 1,521Delaware . . . . . . . . . . . -1,913 -1,483 -992 -1,030 -1,027 43 4,637 558 1,307 1,546District of Columbia . . . . 26,381 32,441 33,554 35,520 36,987 (X) (NA) (NA) (NA) (NA)Florida . . . . . . . . . . . . . 45 375 285 338 125 28 5,915 962 1,299 1,980
Georgia . . . . . . . . . . . . -180 131 67 -59 -109 32 5,297 1,246 1,494 1,338Hawaii . . . . . . . . . . . . . 769 1,020 1,414 1,788 1,938 10 5,747 2,366 1,307 1,043Idaho . . . . . . . . . . . . . . 1,401 611 633 637 799 20 5,104 1,080 1,648 1,373Illinois . . . . . . . . . . . . . -1,553 -1,680 -1,673 -1,688 -1,502 45 4,588 312 1,447 1,480Indiana. . . . . . . . . . . . . -449 -747 -679 -511 -366 36 4,591 491 1,267 1,629
Iowa . . . . . . . . . . . . . . 252 -156 172 131 536 22 5,438 329 2,062 1,784Kansas. . . . . . . . . . . . . 278 -62 -96 -174 183 26 5,464 912 1,730 1,615Kentucky . . . . . . . . . . . 1,096 1,450 1,155 1,541 2,029 9 6,405 997 2,016 1,784Louisiana . . . . . . . . . . . 1,045 1,423 1,277 1,521 1,283 16 5,633 687 1,622 1,537Maine. . . . . . . . . . . . . . 737 1,057 1,147 1,454 1,631 14 5,712 1,228 1,369 1,544
Maryland . . . . . . . . . . . 1,291 1,600 1,387 1,767 2,101 8 8,299 1,825 3,804 1,300Massachusetts. . . . . . . . 22 -244 -365 -518 -776 40 5,304 792 1,444 1,393Michigan. . . . . . . . . . . . -1,017 -1,439 -1,416 -1,383 -1,205 44 4,503 244 1,066 1,698Minnesota. . . . . . . . . . . -590 -1,466 -1,343 -1,325 -1,534 47 4,569 417 1,527 1,429Mississippi . . . . . . . . . . 2,185 2,332 2,451 2,234 2,300 6 6,144 1,084 1,673 1,716
Missouri . . . . . . . . . . . . 1,502 1,289 1,904 1,108 1,242 17 6,460 1,255 1,945 1,731Montana . . . . . . . . . . . . 1,564 1,668 1,721 1,925 2,401 5 6,509 542 3,195 1,569Nebraska . . . . . . . . . . . 548 -44 -32 -138 123 29 5,291 645 1,907 1,572Nevada . . . . . . . . . . . . -871 -1,165 -909 -1,413 -1,763 48 4,315 894 1,136 1,335New Hampshire . . . . . . . -1,561 -1,354 -1,375 -1,419 -1,531 46 4,099 628 1,128 1,337
New Jersey. . . . . . . . . . -2,243 -1,983 -1,958 -1,946 -2,009 49 4,366 479 1,053 1,432New Mexico . . . . . . . . . 3,731 3,473 3,335 3,464 3,697 1 7,642 2,548 2,514 1,340New York . . . . . . . . . . . -961 -1,030 -789 -785 -835 41 4,840 288 1,261 1,443North Carolina . . . . . . . . -196 75 33 134 65 30 5,125 829 1,325 1,630North Dakota. . . . . . . . . 1,951 1,748 1,577 2,788 2,513 4 6,958 874 3,169 1,545
Ohio . . . . . . . . . . . . . . -204 -552 -442 -429 -361 35 4,729 497 1,193 1,623Oklahoma . . . . . . . . . . . 919 1,176 1,289 1,539 1,717 13 5,886 1,110 1,749 1,642Oregon. . . . . . . . . . . . . -5 -360 -373 -387 -431 37 4,683 342 1,536 1,545Pennsylvania. . . . . . . . . -194 11 3 44 213 25 5,356 511 1,367 1,765Rhode Island. . . . . . . . . 136 411 356 633 738 21 5,512 736 1,411 1,597
South Carolina. . . . . . . . 1,526 1,207 1,052 983 1,134 18 5,601 1,402 1,215 1,642South Dakota . . . . . . . . 1,582 1,154 1,223 1,507 1,799 12 6,363 558 2,932 1,606Tennessee . . . . . . . . . . 617 748 749 741 978 19 6,043 711 2,026 1,674Texas. . . . . . . . . . . . . . -52 65 -1 -42 -247 33 5,113 987 1,611 1,251Utah . . . . . . . . . . . . . . 1,480 787 273 94 9 31 4,160 665 1,750 974
Vermont . . . . . . . . . . . . -630 -12 62 -87 164 27 4,723 378 1,580 1,448Virginia. . . . . . . . . . . . . 2,408 2,836 2,353 2,648 2,905 2 8,603 3,646 2,655 1,347Washington . . . . . . . . . . 353 48 -111 -99 -348 34 5,297 1,403 1,435 1,305West Virginia . . . . . . . . . 1,424 2,005 1,981 2,235 2,651 3 6,492 384 1,936 2,214Wisconsin . . . . . . . . . . . -712 -1,147 -1,061 -965 -867 42 4,400 258 1,255 1,650Wyoming . . . . . . . . . . . 880 327 244 622 238 24 5,952 693 2,768 1,431
NA Not available. X Not applicable.
Source: Jay H. Walder and Herman B. Leonard, The Federal Budget and the States, annual.
348 Federal Government Finances and Employment
U.S. Census Bureau, Statistical Abstract of the United States: 2000
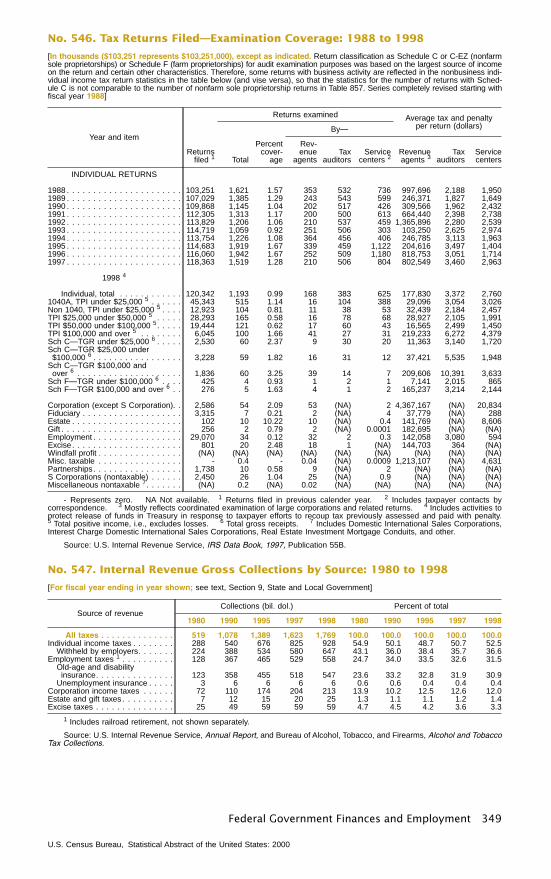
No. 546. Tax Returns Filed—Examination Coverage: 1988 to 1998
[In thousands ($103,251 represents $103,251,000), except as indicated. Return classification as Schedule C or C-EZ (nonfarmsole proprietorships) or Schedule F (farm proprietorships) for audit examination purposes was based on the largest source of incomeon the return and certain other characteristics. Therefore, some returns with business activity are reflected in the nonbusiness indi-vidual income tax return statistics in the table below (and vise versa), so that the statistics for the number of returns with Sched-ule C is not comparable to the number of nonfarm sole proprietorship returns in Table 857. Series completely revised starting withfiscal year 1988]
Year and item
Returnsfiled 1
Returns examined Average tax and penaltyper return (dollars)
Total
Percentcover-
age
By—
Rev-enue
agentsTax
auditorsService
centers 2Revenueagents 3
Taxauditors
Servicecenters
INDIVIDUAL RETURNS
1988 . . . . . . . . . . . . . . . . . . . . . . 103,251 1,621 1.57 353 532 736 997,696 2,188 1,9501989 . . . . . . . . . . . . . . . . . . . . . . 107,029 1,385 1.29 243 543 599 246,371 1,827 1,6491990 . . . . . . . . . . . . . . . . . . . . . . 109,868 1,145 1.04 202 517 426 309,566 1,962 2,4321991 . . . . . . . . . . . . . . . . . . . . . . 112,305 1,313 1.17 200 500 613 664,440 2,398 2,7381992 . . . . . . . . . . . . . . . . . . . . . . 113,829 1,206 1.06 210 537 459 1,365,896 2,280 2,5391993 . . . . . . . . . . . . . . . . . . . . . . 114,719 1,059 0.92 251 506 303 103,250 2,625 2,9741994 . . . . . . . . . . . . . . . . . . . . . . 113,754 1,226 1.08 364 456 406 246,785 3,113 1,9631995 . . . . . . . . . . . . . . . . . . . . . . 114,683 1,919 1.67 339 459 1,122 204,616 3,497 1,4041996 . . . . . . . . . . . . . . . . . . . . . . 116,060 1,942 1.67 252 509 1,180 818,753 3,051 1,7141997 . . . . . . . . . . . . . . . . . . . . . . 118,363 1,519 1.28 210 506 804 802,549 3,460 2,963
1998 4
Individual, total . . . . . . . . . . . . 120,342 1,193 0.99 168 383 625 177,830 3,372 2,7601040A, TPI under $25,000 5 . . . . . . 45,343 515 1.14 16 104 388 29,096 3,054 3,026Non 1040, TPI under $25,000 5 . . . . 12,923 104 0.81 11 38 53 32,439 2,184 2,457TPI $25,000 under $50,000 5 . . . . . 28,293 165 0.58 16 78 68 28,927 2,105 1,991TPI $50,000 under $100,000 5. . . . . 19,444 121 0.62 17 60 43 16,565 2,499 1,450TPI $100,000 and over 5 . . . . . . . . 6,045 100 1.66 41 27 31 219,233 6,272 4,379Sch C—TGR under $25,000 6 . . . . . 2,530 60 2.37 9 30 20 11,363 3,140 1,720Sch C—TGR $25,000 under$100,000 6 . . . . . . . . . . . . . . . . . 3,228 59 1.82 16 31 12 37,421 5,535 1,948
Sch C—TGR $100,000 andover 6 . . . . . . . . . . . . . . . . . . . . 1,836 60 3.25 39 14 7 209,606 10,391 3,633
Sch F—TGR under $100,000 6 . . . . 425 4 0.93 1 2 1 7,141 2,015 865Sch F—TGR $100,000 and over 6 . . 276 5 1.63 4 1 2 165,237 3,214 2,144
Corporation (except S Corporation). . 2,586 54 2.09 53 (NA) 2 4,367,167 (NA) 20,834Fiduciary . . . . . . . . . . . . . . . . . . . 3,315 7 0.21 2 (NA) 4 37,779 (NA) 288Estate . . . . . . . . . . . . . . . . . . . . . 102 10 10.22 10 (NA) 0.4 141,769 (NA) 8,606Gift . . . . . . . . . . . . . . . . . . . . . . . 256 2 0.79 2 (NA) 0.0001 182,695 (NA) (NA)Employment . . . . . . . . . . . . . . . . . 29,070 34 0.12 32 2 0.3 142,058 3,080 594Excise. . . . . . . . . . . . . . . . . . . . . 801 20 2.48 18 1 (NA) 144,703 364 (NA)Windfall profit . . . . . . . . . . . . . . . . (NA) (NA) (NA) (NA) (NA) (NA) (NA) (NA) (NA)Misc. taxable . . . . . . . . . . . . . . . . - 0.4 - 0.04 (NA) 0.0009 1,213,107 (NA) 4,631Partnerships. . . . . . . . . . . . . . . . . 1,738 10 0.58 9 (NA) 2 (NA) (NA) (NA)S Corporations (nontaxable) . . . . . . 2,450 26 1.04 25 (NA) 0.9 (NA) (NA) (NA)Miscellaneous nontaxable 7. . . . . . . (NA) 0.2 (NA) 0.02 (NA) (NA) (NA) (NA) (NA)
- Represents zero. NA Not available. 1 Returns filed in previous calender year. 2 Includes taxpayer contacts bycorrespondence. 3 Mostly reflects coordinated examination of large corporations and related returns. 4 Includes activities toprotect release of funds in Treasury in response to taxpayer efforts to recoup tax previously assessed and paid with penalty.5 Total positive income, i.e., excludes losses. 6 Total gross receipts. 7 Includes Domestic International Sales Corporations,Interest Charge Domestic International Sales Corporations, Real Estate Investment Mortgage Conduits, and other.
Source: U.S. Internal Revenue Service, IRS Data Book, 1997, Publication 55B.
No. 547. Internal Revenue Gross Collections by Source: 1980 to 1998
[For fiscal year ending in year shown; see text, Section 9, State and Local Government]
Source of revenueCollections (bil. dol.) Percent of total
1980 1990 1995 1997 1998 1980 1990 1995 1997 1998
All taxes . . . . . . . . . . . . . . 519 1,078 1,389 1,623 1,769 100.0 100.0 100.0 100.0 100.0Individual income taxes . . . . . . . . 288 540 676 825 928 54.9 50.1 48.7 50.7 52.5
Withheld by employers. . . . . . . 224 388 534 580 647 43.1 36.0 38.4 35.7 36.6Employment taxes 1 . . . . . . . . . . 128 367 465 529 558 24.7 34.0 33.5 32.6 31.5
Old-age and disabilityinsurance. . . . . . . . . . . . . . . 123 358 455 518 547 23.6 33.2 32.8 31.9 30.9
Unemployment insurance . . . . . 3 6 6 6 6 0.6 0.6 0.4 0.4 0.4Corporation income taxes . . . . . . 72 110 174 204 213 13.9 10.2 12.5 12.6 12.0Estate and gift taxes . . . . . . . . . . 7 12 15 20 25 1.3 1.1 1.1 1.2 1.4Excise taxes . . . . . . . . . . . . . . . 25 49 59 59 59 4.7 4.5 4.2 3.6 3.3
1 Includes railroad retirement, not shown separately.
Source: U.S. Internal Revenue Service, Annual Report, and Bureau of Alcohol, Tobacco, and Firearms, Alcohol and TobaccoTax Collections.
Federal Government Finances and Employment 349
U.S. Census Bureau, Statistical Abstract of the United States: 2000
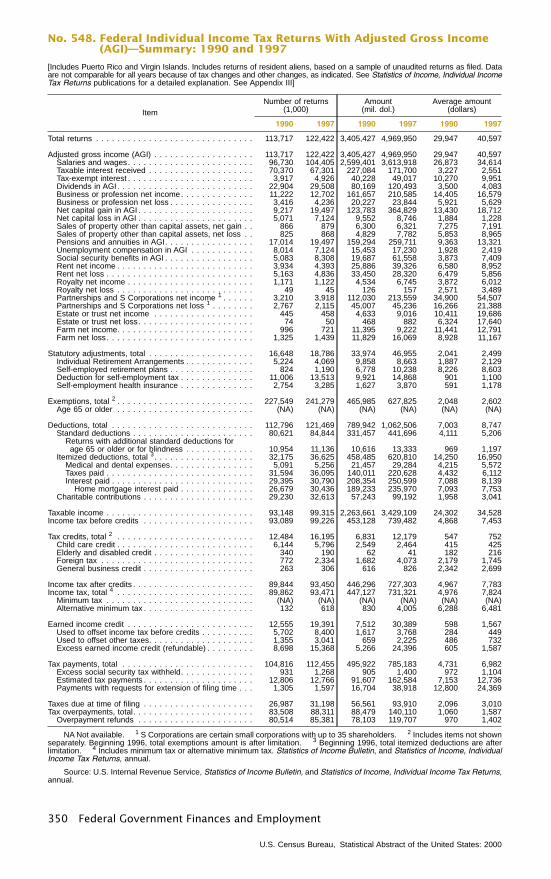
No. 548. Federal Individual Income Tax Returns With Adjusted Gross Income(AGI)—Summary: 1990 and 1997
[Includes Puerto Rico and Virgin Islands. Includes returns of resident aliens, based on a sample of unaudited returns as filed. Dataare not comparable for all years because of tax changes and other changes, as indicated. See Statistics of Income, Individual IncomeTax Returns publications for a detailed explanation. See Appendix III]
ItemNumber of returns
(1,000)Amount
(mil. dol.)Average amount
(dollars)
1990 1997 1990 1997 1990 1997
Total returns . . . . . . . . . . . . . . . . . . . . . . . . . . . . . . 113,717 122,422 3,405,427 4,969,950 29,947 40,597
Adjusted gross income (AGI) . . . . . . . . . . . . . . . . . . . 113,717 122,422 3,405,427 4,969,950 29,947 40,597Salaries and wages. . . . . . . . . . . . . . . . . . . . . . . . 96,730 104,405 2,599,401 3,613,918 26,873 34,614Taxable interest received . . . . . . . . . . . . . . . . . . . . 70,370 67,301 227,084 171,700 3,227 2,551Tax-exempt interest . . . . . . . . . . . . . . . . . . . . . . . . 3,917 4,926 40,228 49,017 10,270 9,951Dividends in AGI. . . . . . . . . . . . . . . . . . . . . . . . . . 22,904 29,508 80,169 120,493 3,500 4,083Business or profession net income. . . . . . . . . . . . . . 11,222 12,702 161,657 210,585 14,405 16,579Business or profession net loss . . . . . . . . . . . . . . . . 3,416 4,236 20,227 23,844 5,921 5,629Net capital gain in AGI . . . . . . . . . . . . . . . . . . . . . . 9,217 19,497 123,783 364,829 13,430 18,712Net capital loss in AGI . . . . . . . . . . . . . . . . . . . . . . 5,071 7,124 9,552 8,746 1,884 1,228Sales of property other than capital assets, net gain . . 866 879 6,300 6,321 7,275 7,191Sales of property other than capital assets, net loss . . 825 868 4,829 7,782 5,853 8,965Pensions and annuities in AGI. . . . . . . . . . . . . . . . . 17,014 19,497 159,294 259,711 9,363 13,321Unemployment compensation in AGI . . . . . . . . . . . . 8,014 7,124 15,453 17,230 1,928 2,419Social security benefits in AGI . . . . . . . . . . . . . . . . . 5,083 8,308 19,687 61,558 3,873 7,409Rent net income . . . . . . . . . . . . . . . . . . . . . . . . . . 3,934 4,393 25,886 39,326 6,580 8,952Rent net loss . . . . . . . . . . . . . . . . . . . . . . . . . . . . 5,163 4,836 33,450 28,320 6,479 5,856Royalty net income . . . . . . . . . . . . . . . . . . . . . . . . 1,171 1,122 4,534 6,745 3,872 6,012Royalty net loss . . . . . . . . . . . . . . . . . . . . . . . . . . 49 45 126 157 2,571 3,489Partnerships and S Corporations net income 1 . . . . . . 3,210 3,918 112,030 213,559 34,900 54,507Partnerships and S Corporations net loss 1 . . . . . . . . 2,767 2,115 45,007 45,236 16,266 21,388Estate or trust net income . . . . . . . . . . . . . . . . . . . 445 458 4,633 9,016 10,411 19,686Estate or trust net loss. . . . . . . . . . . . . . . . . . . . . . 74 50 468 882 6,324 17,640Farm net income. . . . . . . . . . . . . . . . . . . . . . . . . . 996 721 11,395 9,222 11,441 12,791Farm net loss. . . . . . . . . . . . . . . . . . . . . . . . . . . . 1,325 1,439 11,829 16,069 8,928 11,167
Statutory adjustments, total . . . . . . . . . . . . . . . . . . . . 16,648 18,786 33,974 46,955 2,041 2,499Individual Retirement Arrangements . . . . . . . . . . . . . 5,224 4,069 9,858 8,663 1,887 2,129Self-employed retirement plans . . . . . . . . . . . . . . . . 824 1,190 6,778 10,238 8,226 8,603Deduction for self-employment tax . . . . . . . . . . . . . . 11,006 13,513 9,921 14,868 901 1,100Self-employment health insurance . . . . . . . . . . . . . . 2,754 3,285 1,627 3,870 591 1,178
Exemptions, total 2 . . . . . . . . . . . . . . . . . . . . . . . . . . 227,549 241,279 465,985 627,825 2,048 2,602Age 65 or older . . . . . . . . . . . . . . . . . . . . . . . . . . (NA) (NA) (NA) (NA) (NA) (NA)
Deductions, total . . . . . . . . . . . . . . . . . . . . . . . . . . . 112,796 121,469 789,942 1,062,506 7,003 8,747Standard deductions . . . . . . . . . . . . . . . . . . . . . . . 80,621 84,844 331,457 441,696 4,111 5,206
Returns with additional standard deductions forage 65 or older or for blindness . . . . . . . . . . . . . 10,954 11,136 10,616 13,333 969 1,197
Itemized deductions, total 3. . . . . . . . . . . . . . . . . . . 32,175 36,625 458,485 620,810 14,250 16,950Medical and dental expenses. . . . . . . . . . . . . . . . 5,091 5,256 21,457 29,284 4,215 5,572Taxes paid . . . . . . . . . . . . . . . . . . . . . . . . . . . . 31,594 36,095 140,011 220,628 4,432 6,112Interest paid . . . . . . . . . . . . . . . . . . . . . . . . . . . 29,395 30,790 208,354 250,599 7,088 8,139
Home mortgage interest paid . . . . . . . . . . . . . . 26,679 30,436 189,233 235,970 7,093 7,753Charitable contributions . . . . . . . . . . . . . . . . . . . . . 29,230 32,613 57,243 99,192 1,958 3,041
Taxable income . . . . . . . . . . . . . . . . . . . . . . . . . . . . 93,148 99,315 2,263,661 3,429,109 24,302 34,528Income tax before credits . . . . . . . . . . . . . . . . . . . . . 93,089 99,226 453,128 739,482 4,868 7,453
Tax credits, total 2 . . . . . . . . . . . . . . . . . . . . . . . . . . 12,484 16,195 6,831 12,179 547 752Child care credit . . . . . . . . . . . . . . . . . . . . . . . . . . 6,144 5,796 2,549 2,464 415 425Elderly and disabled credit . . . . . . . . . . . . . . . . . . . 340 190 62 41 182 216Foreign tax . . . . . . . . . . . . . . . . . . . . . . . . . . . . . 772 2,334 1,682 4,073 2,179 1,745General business credit . . . . . . . . . . . . . . . . . . . . . 263 306 616 826 2,342 2,699
Income tax after credits . . . . . . . . . . . . . . . . . . . . . . . 89,844 93,450 446,296 727,303 4,967 7,783Income tax, total 4 . . . . . . . . . . . . . . . . . . . . . . . . . . 89,862 93,471 447,127 731,321 4,976 7,824
Minimum tax . . . . . . . . . . . . . . . . . . . . . . . . . . . . (NA) (NA) (NA) (NA) (NA) (NA)Alternative minimum tax . . . . . . . . . . . . . . . . . . . . . 132 618 830 4,005 6,288 6,481
Earned income credit . . . . . . . . . . . . . . . . . . . . . . . . 12,555 19,391 7,512 30,389 598 1,567Used to offset income tax before credits . . . . . . . . . . 5,702 8,400 1,617 3,768 284 449Used to offset other taxes. . . . . . . . . . . . . . . . . . . . 1,355 3,041 659 2,225 486 732Excess earned income credit (refundable) . . . . . . . . . 8,698 15,368 5,266 24,396 605 1,587
Tax payments, total . . . . . . . . . . . . . . . . . . . . . . . . . 104,816 112,455 495,922 785,183 4,731 6,982Excess social security tax withheld. . . . . . . . . . . . . . 931 1,268 905 1,400 972 1,104Estimated tax payments . . . . . . . . . . . . . . . . . . . . . 12,806 12,766 91,607 162,584 7,153 12,736Payments with requests for extension of filing time . . . 1,305 1,597 16,704 38,918 12,800 24,369
Taxes due at time of filing . . . . . . . . . . . . . . . . . . . . . 26,987 31,198 56,561 93,910 2,096 3,010Tax overpayments, total. . . . . . . . . . . . . . . . . . . . . . . 83,508 88,311 88,479 140,110 1,060 1,587
Overpayment refunds . . . . . . . . . . . . . . . . . . . . . . 80,514 85,381 78,103 119,707 970 1,402
NA Not available. 1 S Corporations are certain small corporations with up to 35 shareholders. 2 Includes items not shownseparately. Beginning 1996, total exemptions amount is after limitation. 3 Beginning 1996, total itemized deductions are afterlimitation. 4 Includes minimum tax or alternative minimum tax. Statistics of Income Bulletin, and Statistics of Income, IndividualIncome Tax Returns, annual.
Source: U.S. Internal Revenue Service, Statistics of Income Bulletin, and Statistics of Income, Individual Income Tax Returns,annual.
350 Federal Government Finances and Employment
U.S. Census Bureau, Statistical Abstract of the United States: 2000
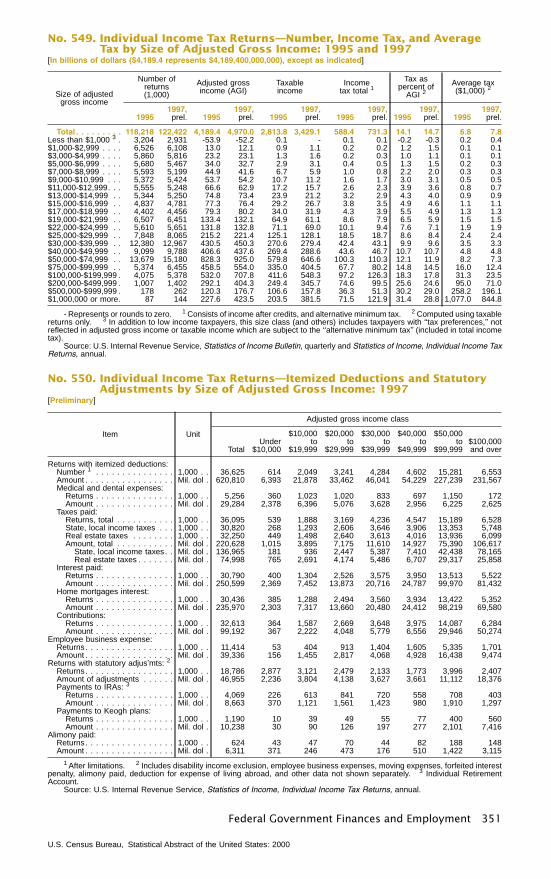
No. 549. Individual Income Tax Returns—Number, Income Tax, and AverageTax by Size of Adjusted Gross Income: 1995 and 1997
[In billions of dollars ($4,189.4 represents $4,189,400,000,000), except as indicated]
Size of adjustedgross income
Number ofreturns(1,000)
Adjusted grossincome (AGI)
Taxableincome
Incometax total 1
Tax aspercent of
AGI 2Average tax($1,000) 2
19951997,
prel. 19951997,
prel. 19951997,
prel. 19951997,
prel. 19951997,
prel. 19951997,
prel.
Total . . . . . . . . . 118,218 122,422 4,189.4 4,970.0 2,813.8 3,429.1 588.4 731.3 14.1 14.7 6.8 7.8Less than $1,000 3 . 3,204 2,931 -53.9 -52.2 0.1 - 0.1 0.1 -0.2 -0.3 0.2 0.4$1,000-$2,999 . . . . 6,526 6,108 13.0 12.1 0.9 1.1 0.2 0.2 1.2 1.5 0.1 0.1$3,000-$4,999 . . . . 5,860 5,816 23.2 23.1 1.3 1.6 0.2 0.3 1.0 1.1 0.1 0.1$5,000-$6,999 . . . . 5,680 5,467 34.0 32.7 2.9 3.1 0.4 0.5 1.3 1.5 0.2 0.3$7,000-$8,999 . . . . 5,593 5,199 44.9 41.6 6.7 5.9 1.0 0.8 2.2 2.0 0.3 0.3$9,000-$10,999 . . . 5,372 5,424 53.7 54.2 10.7 11.2 1.6 1.7 3.0 3.1 0.5 0.5$11,000-$12,999. . . 5,555 5,248 66.6 62.9 17.2 15.7 2.6 2.3 3.9 3.6 0.8 0.7$13,000-$14,999 . . 5,344 5,250 74.8 73.4 23.9 21.2 3.2 2.9 4.3 4.0 0.9 0.9$15,000-$16,999 . . 4,837 4,781 77.3 76.4 29.2 26.7 3.8 3.5 4.9 4.6 1.1 1.1$17,000-$18,999 . . 4,402 4,456 79.3 80.2 34.0 31.9 4.3 3.9 5.5 4.9 1.3 1.3$19,000-$21,999 . . 6,507 6,451 133.4 132.1 64.9 61.1 8.6 7.9 6.5 5.9 1.5 1.5$22,000-$24,999 . . 5,610 5,651 131.8 132.8 71.1 69.0 10.1 9.4 7.6 7.1 1.9 1.9$25,000-$29,999 . . 7,848 8,065 215.2 221.4 125.1 128.1 18.5 18.7 8.6 8.4 2.4 2.4$30,000-$39,999 . . 12,380 12,967 430.5 450.3 270.6 279.4 42.4 43.1 9.9 9.6 3.5 3.3$40,000-$49,999 . . 9,099 9,788 406.6 437.6 269.4 288.6 43.6 46.7 10.7 10.7 4.8 4.8$50,000-$74,999 . . 13,679 15,180 828.3 925.0 579.8 646.6 100.3 110.3 12.1 11.9 8.2 7.3$75,000-$99,999 . . 5,374 6,455 458.5 554.0 335.0 404.5 67.7 80.2 14.8 14.5 16.0 12.4$100,000-$199,999 . 4,075 5,378 532.0 707.8 411.6 548.3 97.2 126.3 18.3 17.8 31.3 23.5$200,000-$499,999 . 1,007 1,402 292.1 404.3 249.4 345.7 74.6 99.5 25.6 24.6 95.0 71.0$500,000-$999,999 . 178 262 120.3 176.7 106.6 157.8 36.3 51.3 30.2 29.0 258.2 196.1$1,000,000 or more. 87 144 227.6 423.5 203.5 381.5 71.5 121.9 31.4 28.8 1,077.0 844.8
- Represents or rounds to zero. 1 Consists of income after credits, and alternative minimum tax. 2 Computed using taxablereturns only. 3 In addition to low income taxpayers, this size class (and others) includes taxpayers with ‘‘tax preferences,’’ notreflected in adjusted gross income or taxable income which are subject to the ‘‘alternative minimum tax’’ (included in total incometax).
Source: U.S. Internal Revenue Service, Statistics of Income Bulletin, quarterly and Statistics of Income, Individual Income TaxReturns, annual.
No. 550. Individual Income Tax Returns—Itemized Deductions and StatutoryAdjustments by Size of Adjusted Gross Income: 1997
[Preliminary]
Item Unit
Adjusted gross income class
TotalUnder
$10,000
$10,000to
$19,999
$20,000to
$29,999
$30,000to
$39,999
$40,000to
$49,999
$50,000to
$99,999$100,000and over
Returns with itemized deductions:Number 1 . . . . . . . . . . . . . . . 1,000 . . 36,625 614 2,049 3,241 4,284 4,602 15,281 6,553Amount . . . . . . . . . . . . . . . . . Mil. dol . 620,810 6,393 21,878 33,462 46,041 54,229 227,239 231,567Medical and dental expenses:
Returns . . . . . . . . . . . . . . . 1,000 . . 5,256 360 1,023 1,020 833 697 1,150 172Amount . . . . . . . . . . . . . . . Mil. dol . 29,284 2,378 6,396 5,076 3,628 2,956 6,225 2,625
Taxes paid:Returns, total . . . . . . . . . . . 1,000 . . 36,095 539 1,888 3,169 4,236 4,547 15,189 6,528State, local income taxes . . . 1,000 . . 30,820 268 1,293 2,606 3,646 3,906 13,353 5,748Real estate taxes . . . . . . . . 1,000 . . 32,250 449 1,498 2,640 3,613 4,016 13,936 6,099Amount, total . . . . . . . . . . . Mil. dol . 220,628 1,015 3,895 7,175 11,610 14,927 75,390 106,617
State, local income taxes. . Mil. dol . 136,965 181 936 2,447 5,387 7,410 42,438 78,165Real estate taxes . . . . . . . Mil. dol . 74,998 765 2,691 4,174 5,486 6,707 29,317 25,858
Interest paid:Returns . . . . . . . . . . . . . . . 1,000 . . 30,790 400 1,304 2,526 3,575 3,950 13,513 5,522Amount . . . . . . . . . . . . . . . Mil. dol . 250,599 2,369 7,452 13,873 20,716 24,787 99,970 81,432
Home mortgages interest:Returns . . . . . . . . . . . . . . . 1,000 . . 30,436 385 1,288 2,494 3,560 3,934 13,422 5,352Amount . . . . . . . . . . . . . . . Mil. dol . 235,970 2,303 7,317 13,660 20,480 24,412 98,219 69,580
Contributions:Returns . . . . . . . . . . . . . . . 1,000 . . 32,613 364 1,587 2,669 3,648 3,975 14,087 6,284Amount . . . . . . . . . . . . . . . Mil. dol . 99,192 367 2,222 4,048 5,779 6,556 29,946 50,274
Employee business expense:Returns. . . . . . . . . . . . . . . . . 1,000 . . 11,414 53 404 913 1,404 1,605 5,335 1,701Amount . . . . . . . . . . . . . . . . . Mil. dol . 39,336 156 1,455 2,817 4,068 4,928 16,438 9,474
Returns with statutory adjus’mts: 2
Returns. . . . . . . . . . . . . . . . . 1,000 . . 18,786 2,877 3,121 2,479 2,133 1,773 3,996 2,407Amount of adjustments . . . . . . Mil. dol . 46,955 2,236 3,804 4,138 3,627 3,661 11,112 18,376Payments to IRAs: 3
Returns . . . . . . . . . . . . . . . 1,000 . . 4,069 226 613 841 720 558 708 403Amount . . . . . . . . . . . . . . . Mil. dol . 8,663 370 1,121 1,561 1,423 980 1,910 1,297
Payments to Keogh plans:Returns . . . . . . . . . . . . . . . 1,000 . . 1,190 10 39 49 55 77 400 560Amount . . . . . . . . . . . . . . . Mil. dol . 10,238 30 90 126 197 277 2,101 7,416
Alimony paid:Returns. . . . . . . . . . . . . . . . . 1,000 . . 624 43 47 70 44 82 188 148Amount . . . . . . . . . . . . . . . . . Mil. dol . 6,311 371 246 473 176 510 1,422 3,115
1 After limitations. 2 Includes disability income exclusion, employee business expenses, moving expenses, forfeited interestpenalty, alimony paid, deduction for expense of living abroad, and other data not shown separately. 3 Individual RetirementAccount.
Source: U.S. Internal Revenue Service, Statistics of Income, Individual Income Tax Returns, annual.
Federal Government Finances and Employment 351
U.S. Census Bureau, Statistical Abstract of the United States: 2000
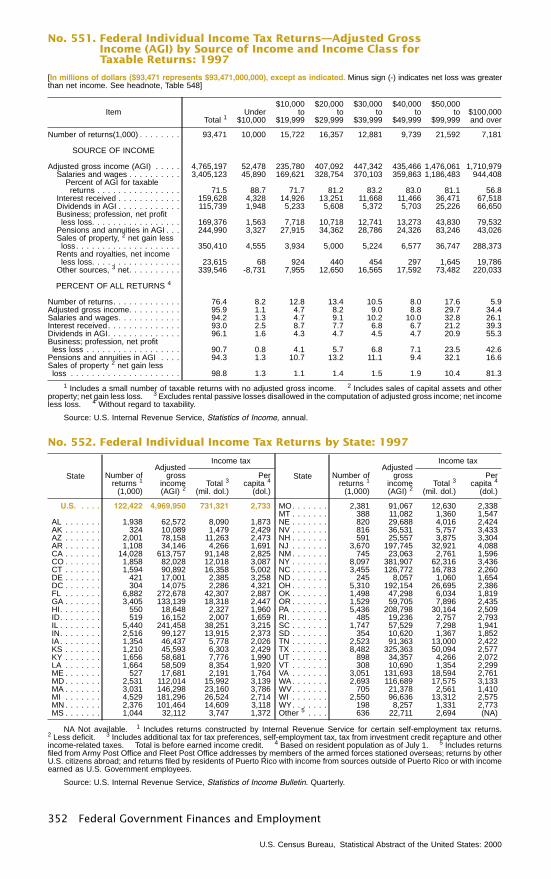
No. 551. Federal Individual Income Tax Returns—Adjusted GrossIncome (AGI) by Source of Income and Income Class forTaxable Returns: 1997
[In millions of dollars ($93,471 represents $93,471,000,000), except as indicated. Minus sign (-) indicates net loss was greaterthan net income. See headnote, Table 548]
ItemTotal 1
Under$10,000
$10,000to
$19,999
$20,000to
$29,999
$30,000to
$39,999
$40,000to
$49,999
$50,000to
$99,999$100,000and over
Number of returns(1,000) . . . . . . . . 93,471 10,000 15,722 16,357 12,881 9,739 21,592 7,181
SOURCE OF INCOME
Adjusted gross income (AGI) . . . . . 4,765,197 52,478 235,780 407,092 447,342 435,466 1,476,061 1,710,979Salaries and wages . . . . . . . . . . 3,405,123 45,890 169,621 328,754 370,103 359,863 1,186,483 944,408
Percent of AGI for taxablereturns . . . . . . . . . . . . . . . . 71.5 88.7 71.7 81.2 83.2 83.0 81.1 56.8
Interest received . . . . . . . . . . . . 159,628 4,328 14,926 13,251 11,668 11,466 36,471 67,518Dividends in AGI . . . . . . . . . . . . 115,739 1,948 5,233 5,608 5,372 5,703 25,226 66,650Business; profession, net profitless loss. . . . . . . . . . . . . . . . . 169,376 1,563 7,718 10,718 12,741 13,273 43,830 79,532
Pensions and annuities in AGI . . . 244,990 3,327 27,915 34,362 28,786 24,326 83,246 43,026Sales of property, 2 net gain lessloss. . . . . . . . . . . . . . . . . . . . 350,410 4,555 3,934 5,000 5,224 6,577 36,747 288,373
Rents and royalties, net incomeless loss. . . . . . . . . . . . . . . . . 23,615 68 924 440 454 297 1,645 19,786
Other sources, 3 net. . . . . . . . . . 339,546 -8,731 7,955 12,650 16,565 17,592 73,482 220,033
PERCENT OF ALL RETURNS 4
Number of returns. . . . . . . . . . . . . 76.4 8.2 12.8 13.4 10.5 8.0 17.6 5.9Adjusted gross income. . . . . . . . . . 95.9 1.1 4.7 8.2 9.0 8.8 29.7 34.4Salaries and wages. . . . . . . . . . . . 94.2 1.3 4.7 9.1 10.2 10.0 32.8 26.1Interest received. . . . . . . . . . . . . . 93.0 2.5 8.7 7.7 6.8 6.7 21.2 39.3Dividends in AGI. . . . . . . . . . . . . . 96.1 1.6 4.3 4.7 4.5 4.7 20.9 55.3Business; profession, net profitless loss . . . . . . . . . . . . . . . . . . 90.7 0.8 4.1 5.7 6.8 7.1 23.5 42.6
Pensions and annuities in AGI . . . . 94.3 1.3 10.7 13.2 11.1 9.4 32.1 16.6Sales of property 2 net gain lessloss . . . . . . . . . . . . . . . . . . . . . 98.8 1.3 1.1 1.4 1.5 1.9 10.4 81.3
1 Includes a small number of taxable returns with no adjusted gross income. 2 Includes sales of capital assets and otherproperty; net gain less loss. 3 Excludes rental passive losses disallowed in the computation of adjusted gross income; net incomeless loss. 4 Without regard to taxability.
Source: U.S. Internal Revenue Service, Statistics of Income, annual.
No. 552. Federal Individual Income Tax Returns by State: 1997
State Number ofreturns 1
(1,000)
Adjustedgross
income(AGI) 2
Income tax
Total 3
(mil. dol.)
Percapita 4
(dol.)
U.S. . . . . 122,422 4,969,950 731,321 2,733
AL . . . . . . . 1,938 62,572 8,090 1,873AK . . . . . . . 324 10,089 1,479 2,429AZ . . . . . . . 2,001 78,158 11,263 2,473AR . . . . . . . 1,108 34,146 4,266 1,691CA . . . . . . . 14,028 613,757 91,148 2,825CO . . . . . . . 1,858 82,028 12,018 3,087CT . . . . . . . 1,594 90,892 16,358 5,002DE . . . . . . . 421 17,001 2,385 3,258DC . . . . . . . 304 14,075 2,286 4,321FL . . . . . . . 6,882 272,678 42,307 2,887GA . . . . . . . 3,405 133,139 18,318 2,447HI. . . . . . . . 550 18,648 2,327 1,960ID. . . . . . . . 519 16,152 2,007 1,659IL . . . . . . . . 5,440 241,458 38,251 3,215IN. . . . . . . . 2,516 99,127 13,915 2,373IA. . . . . . . . 1,354 46,437 5,778 2,026KS . . . . . . . 1,210 45,593 6,303 2,429KY . . . . . . . 1,656 58,681 7,776 1,990LA . . . . . . . 1,664 58,509 8,354 1,920ME . . . . . . . 527 17,681 2,191 1,764MD . . . . . . . 2,531 112,014 15,992 3,139MA . . . . . . . 3,031 146,298 23,160 3,786MI . . . . . . . 4,529 181,296 26,524 2,714MN . . . . . . . 2,376 101,464 14,609 3,118MS . . . . . . . 1,044 32,112 3,747 1,372
State Number ofreturns 1
(1,000)
Adjustedgross
income(AGI) 2
Income tax
Total 3
(mil. dol.)
Percapita 4
(dol.)
MO. . . . . . . 2,381 91,067 12,630 2,338MT . . . . . . . 388 11,082 1,360 1,547NE . . . . . . . 820 29,688 4,016 2,424NV . . . . . . . 816 36,531 5,757 3,433NH . . . . . . . 591 25,557 3,875 3,304NJ . . . . . . . 3,670 197,745 32,921 4,088NM . . . . . . . 745 23,063 2,761 1,596NY . . . . . . . 8,097 381,907 62,316 3,436NC . . . . . . . 3,455 126,772 16,783 2,260ND . . . . . . . 245 8,057 1,060 1,654OH . . . . . . . 5,310 192,154 26,695 2,386OK . . . . . . . 1,498 47,298 6,034 1,819OR . . . . . . . 1,529 59,705 7,896 2,435PA . . . . . . . 5,436 208,798 30,164 2,509RI. . . . . . . . 485 19,236 2,757 2,793SC . . . . . . . 1,747 57,529 7,298 1,941SD . . . . . . . 354 10,620 1,367 1,852TN . . . . . . . 2,523 91,363 13,000 2,422TX . . . . . . . 8,482 325,363 50,094 2,577UT . . . . . . . 898 34,357 4,266 2,072VT . . . . . . . 308 10,690 1,354 2,299VA . . . . . . . 3,051 131,693 18,594 2,761WA . . . . . . . 2,693 116,689 17,575 3,133WV. . . . . . . 705 21,378 2,561 1,410WI . . . . . . . 2,550 96,636 13,312 2,575WY. . . . . . . 198 8,257 1,331 2,773Other 5 . . . . 636 22,711 2,694 (NA)
NA Not available. 1 Includes returns constructed by Internal Revenue Service for certain self-employment tax returns.2 Less deficit. 3 Includes additional tax for tax preferences, self-employment tax, tax from investment credit recapture and otherincome-related taxes. Total is before earned income credit. 4 Based on resident population as of July 1. 5 Includes returnsfiled from Army Post Office and Fleet Post Office addresses by members of the armed forces stationed overseas; returns by otherU.S. citizens abroad; and returns filed by residents of Puerto Rico with income from sources outside of Puerto Rico or with incomeearned as U.S. Government employees.
Source: U.S. Internal Revenue Service, Statistics of Income Bulletin. Quarterly.
352 Federal Government Finances and Employment
U.S. Census Bureau, Statistical Abstract of the United States: 2000
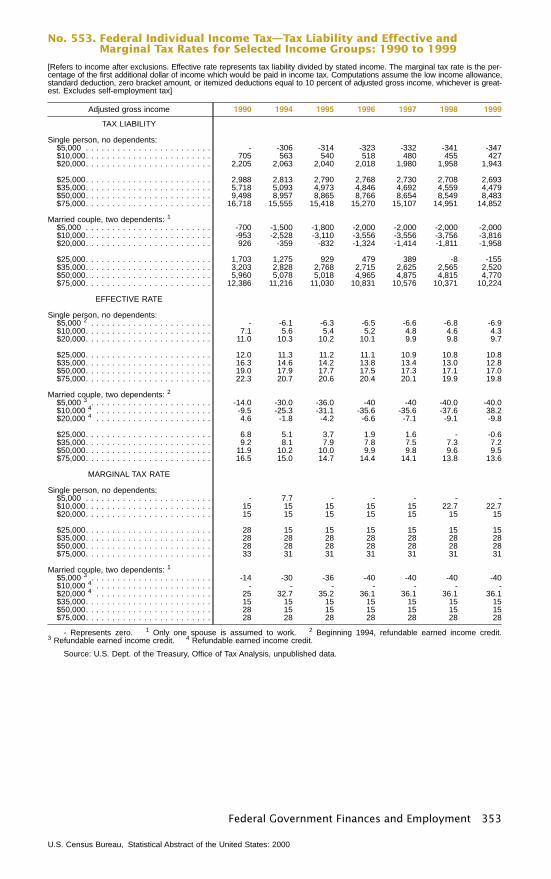
No. 553. Federal Individual Income Tax—Tax Liability and Effective andMarginal Tax Rates for Selected Income Groups: 1990 to 1999
[Refers to income after exclusions. Effective rate represents tax liability divided by stated income. The marginal tax rate is the per-centage of the first additional dollar of income which would be paid in income tax. Computations assume the low income allowance,standard deduction, zero bracket amount, or itemized deductions equal to 10 percent of adjusted gross income, whichever is great-est. Excludes self-employment tax]
Adjusted gross income 1990 1994 1995 1996 1997 1998 1999
TAX LIABILITY
Single person, no dependents:$5,000 . . . . . . . . . . . . . . . . . . . . . . . . - -306 -314 -323 -332 -341 -347$10,000. . . . . . . . . . . . . . . . . . . . . . . . 705 563 540 518 480 455 427$20,000. . . . . . . . . . . . . . . . . . . . . . . . 2,205 2,063 2,040 2,018 1,980 1,958 1,943
$25,000. . . . . . . . . . . . . . . . . . . . . . . . 2,988 2,813 2,790 2,768 2,730 2,708 2,693$35,000. . . . . . . . . . . . . . . . . . . . . . . . 5,718 5,093 4,973 4,846 4,692 4,559 4,479$50,000. . . . . . . . . . . . . . . . . . . . . . . . 9,498 8,957 8,865 8,766 8,654 8,549 8,483$75,000. . . . . . . . . . . . . . . . . . . . . . . . 16,718 15,555 15,418 15,270 15,107 14,951 14,852
Married couple, two dependents: 1
$5,000 . . . . . . . . . . . . . . . . . . . . . . . . -700 -1,500 -1,800 -2,000 -2,000 -2,000 -2,000$10,000. . . . . . . . . . . . . . . . . . . . . . . . -953 -2,528 -3,110 -3,556 -3,556 -3,756 -3,816$20,000. . . . . . . . . . . . . . . . . . . . . . . . 926 -359 -832 -1,324 -1,414 -1,811 -1,958
$25,000. . . . . . . . . . . . . . . . . . . . . . . . 1,703 1,275 929 479 389 -8 -155$35,000. . . . . . . . . . . . . . . . . . . . . . . . 3,203 2,828 2,768 2,715 2,625 2,565 2,520$50,000. . . . . . . . . . . . . . . . . . . . . . . . 5,960 5,078 5,018 4,965 4,875 4,815 4,770$75,000. . . . . . . . . . . . . . . . . . . . . . . . 12,386 11,216 11,030 10,831 10,576 10,371 10,224
EFFECTIVE RATE
Single person, no dependents:$5,000 2 . . . . . . . . . . . . . . . . . . . . . . . - -6.1 -6.3 -6.5 -6.6 -6.8 -6.9$10,000. . . . . . . . . . . . . . . . . . . . . . . . 7.1 5.6 5.4 5.2 4.8 4.6 4.3$20,000. . . . . . . . . . . . . . . . . . . . . . . . 11.0 10.3 10.2 10.1 9.9 9.8 9.7
$25,000. . . . . . . . . . . . . . . . . . . . . . . . 12.0 11.3 11.2 11.1 10.9 10.8 10.8$35,000. . . . . . . . . . . . . . . . . . . . . . . . 16.3 14.6 14.2 13.8 13.4 13.0 12.8$50,000. . . . . . . . . . . . . . . . . . . . . . . . 19.0 17.9 17.7 17.5 17.3 17.1 17.0$75,000. . . . . . . . . . . . . . . . . . . . . . . . 22.3 20.7 20.6 20.4 20.1 19.9 19.8
Married couple, two dependents: 2
$5,000 3 . . . . . . . . . . . . . . . . . . . . . . . -14.0 -30.0 -36.0 -40 -40 -40.0 -40.0$10,000 4 . . . . . . . . . . . . . . . . . . . . . . -9.5 -25.3 -31.1 -35.6 -35.6 -37.6 38.2$20,000 4 . . . . . . . . . . . . . . . . . . . . . . 4.6 -1.8 -4.2 -6.6 -7.1 -9.1 -9.8
$25,000. . . . . . . . . . . . . . . . . . . . . . . . 6.8 5.1 3.7 1.9 1.6 - -0.6$35,000. . . . . . . . . . . . . . . . . . . . . . . . 9.2 8.1 7.9 7.8 7.5 7.3 7.2$50,000. . . . . . . . . . . . . . . . . . . . . . . . 11.9 10.2 10.0 9.9 9.8 9.6 9.5$75,000. . . . . . . . . . . . . . . . . . . . . . . . 16.5 15.0 14.7 14.4 14.1 13.8 13.6
MARGINAL TAX RATE
Single person, no dependents:$5,000 . . . . . . . . . . . . . . . . . . . . . . . . - 7.7 - - - - -$10,000. . . . . . . . . . . . . . . . . . . . . . . . 15 15 15 15 15 22.7 22.7$20,000. . . . . . . . . . . . . . . . . . . . . . . . 15 15 15 15 15 15 15
$25,000. . . . . . . . . . . . . . . . . . . . . . . . 28 15 15 15 15 15 15$35,000. . . . . . . . . . . . . . . . . . . . . . . . 28 28 28 28 28 28 28$50,000. . . . . . . . . . . . . . . . . . . . . . . . 28 28 28 28 28 28 28$75,000. . . . . . . . . . . . . . . . . . . . . . . . 33 31 31 31 31 31 31
Married couple, two dependents: 1
$5,000 3 . . . . . . . . . . . . . . . . . . . . . . . -14 -30 -36 -40 -40 -40 -40$10,000 4 . . . . . . . . . . . . . . . . . . . . . . - - - - - - -$20,000 4 . . . . . . . . . . . . . . . . . . . . . . 25 32.7 35.2 36.1 36.1 36.1 36.1$35,000. . . . . . . . . . . . . . . . . . . . . . . . 15 15 15 15 15 15 15$50,000. . . . . . . . . . . . . . . . . . . . . . . . 28 15 15 15 15 15 15$75,000. . . . . . . . . . . . . . . . . . . . . . . . 28 28 28 28 28 28 28
- Represents zero. 1 Only one spouse is assumed to work. 2 Beginning 1994, refundable earned income credit.3 Refundable earned income credit. 4 Refundable earned income credit.
Source: U.S. Dept. of the Treasury, Office of Tax Analysis, unpublished data.
Federal Government Finances and Employment 353
U.S. Census Bureau, Statistical Abstract of the United States: 2000
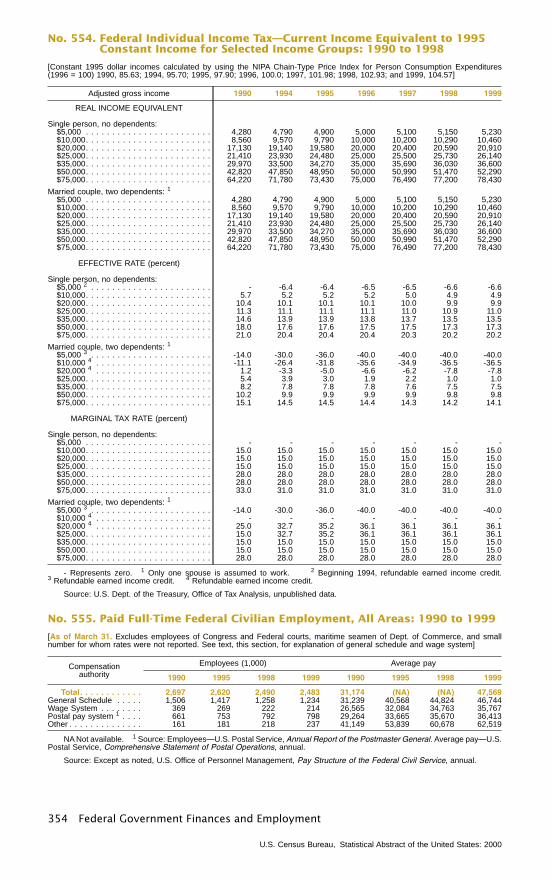
No. 554. Federal Individual Income Tax—Current Income Equivalent to 1995Constant Income for Selected Income Groups: 1990 to 1998
[Constant 1995 dollar incomes calculated by using the NIPA Chain-Type Price Index for Person Consumption Expenditures(1996 = 100) 1990, 85.63; 1994, 95.70; 1995, 97.90; 1996, 100.0; 1997, 101.98; 1998, 102.93; and 1999, 104.57]
Adjusted gross income 1990 1994 1995 1996 1997 1998 1999
REAL INCOME EQUIVALENT
Single person, no dependents:$5,000 . . . . . . . . . . . . . . . . . . . . . . . . 4,280 4,790 4,900 5,000 5,100 5,150 5,230$10,000. . . . . . . . . . . . . . . . . . . . . . . . 8,560 9,570 9,790 10,000 10,200 10,290 10,460$20,000. . . . . . . . . . . . . . . . . . . . . . . . 17,130 19,140 19,580 20,000 20,400 20,590 20,910$25,000. . . . . . . . . . . . . . . . . . . . . . . . 21,410 23,930 24,480 25,000 25,500 25,730 26,140$35,000. . . . . . . . . . . . . . . . . . . . . . . . 29,970 33,500 34,270 35,000 35,690 36,030 36,600$50,000. . . . . . . . . . . . . . . . . . . . . . . . 42,820 47,850 48,950 50,000 50,990 51,470 52,290$75,000. . . . . . . . . . . . . . . . . . . . . . . . 64,220 71,780 73,430 75,000 76,490 77,200 78,430
Married couple, two dependents: 1
$5,000 . . . . . . . . . . . . . . . . . . . . . . . . 4,280 4,790 4,900 5,000 5,100 5,150 5,230$10,000. . . . . . . . . . . . . . . . . . . . . . . . 8,560 9,570 9,790 10,000 10,200 10,290 10,460$20,000. . . . . . . . . . . . . . . . . . . . . . . . 17,130 19,140 19,580 20,000 20,400 20,590 20,910$25,000. . . . . . . . . . . . . . . . . . . . . . . . 21,410 23,930 24,480 25,000 25,500 25,730 26,140$35,000. . . . . . . . . . . . . . . . . . . . . . . . 29,970 33,500 34,270 35,000 35,690 36,030 36,600$50,000. . . . . . . . . . . . . . . . . . . . . . . . 42,820 47,850 48,950 50,000 50,990 51,470 52,290$75,000. . . . . . . . . . . . . . . . . . . . . . . . 64,220 71,780 73,430 75,000 76,490 77,200 78,430
EFFECTIVE RATE (percent)
Single person, no dependents:$5,000 2 . . . . . . . . . . . . . . . . . . . . . . . - -6.4 -6.4 -6.5 -6.5 -6.6 -6.6$10,000. . . . . . . . . . . . . . . . . . . . . . . . 5.7 5.2 5.2 5.2 5.0 4.9 4.9$20,000. . . . . . . . . . . . . . . . . . . . . . . . 10.4 10.1 10.1 10.1 10.0 9.9 9.9$25,000. . . . . . . . . . . . . . . . . . . . . . . . 11.3 11.1 11.1 11.1 11.0 10.9 11.0$35,000. . . . . . . . . . . . . . . . . . . . . . . . 14.6 13.9 13.9 13.8 13.7 13.5 13.5$50,000. . . . . . . . . . . . . . . . . . . . . . . . 18.0 17.6 17.6 17.5 17.5 17.3 17.3$75,000. . . . . . . . . . . . . . . . . . . . . . . . 21.0 20.4 20.4 20.4 20.3 20.2 20.2
Married couple, two dependents: 1
$5,000 3 . . . . . . . . . . . . . . . . . . . . . . . -14.0 -30.0 -36.0 -40.0 -40.0 -40.0 -40.0$10,000 4 . . . . . . . . . . . . . . . . . . . . . . -11.1 -26.4 -31.8 -35.6 -34.9 -36.5 -36.5$20,000 4 . . . . . . . . . . . . . . . . . . . . . . 1.2 -3.3 -5.0 -6.6 -6.2 -7.8 -7.8$25,000. . . . . . . . . . . . . . . . . . . . . . . . 5.4 3.9 3.0 1.9 2.2 1.0 1.0$35,000. . . . . . . . . . . . . . . . . . . . . . . . 8.2 7.8 7.8 7.8 7.6 7.5 7.5$50,000. . . . . . . . . . . . . . . . . . . . . . . . 10.2 9.9 9.9 9.9 9.9 9.8 9.8$75,000. . . . . . . . . . . . . . . . . . . . . . . . 15.1 14.5 14.5 14.4 14.3 14.2 14.1
MARGINAL TAX RATE (percent)
Single person, no dependents:$5,000 . . . . . . . . . . . . . . . . . . . . . . . . - - - - - - -$10,000. . . . . . . . . . . . . . . . . . . . . . . . 15.0 15.0 15.0 15.0 15.0 15.0 15.0$20,000. . . . . . . . . . . . . . . . . . . . . . . . 15.0 15.0 15.0 15.0 15.0 15.0 15.0$25,000. . . . . . . . . . . . . . . . . . . . . . . . 15.0 15.0 15.0 15.0 15.0 15.0 15.0$35,000. . . . . . . . . . . . . . . . . . . . . . . . 28.0 28.0 28.0 28.0 28.0 28.0 28.0$50,000. . . . . . . . . . . . . . . . . . . . . . . . 28.0 28.0 28.0 28.0 28.0 28.0 28.0$75,000. . . . . . . . . . . . . . . . . . . . . . . . 33.0 31.0 31.0 31.0 31.0 31.0 31.0
Married couple, two dependents: 1
$5,000 3 . . . . . . . . . . . . . . . . . . . . . . . -14.0 -30.0 -36.0 -40.0 -40.0 -40.0 -40.0$10,000 4 . . . . . . . . . . . . . . . . . . . . . . - - - - - - -$20,000 4 . . . . . . . . . . . . . . . . . . . . . . 25.0 32.7 35.2 36.1 36.1 36.1 36.1$25,000. . . . . . . . . . . . . . . . . . . . . . . . 15.0 32.7 35.2 36.1 36.1 36.1 36.1$35,000. . . . . . . . . . . . . . . . . . . . . . . . 15.0 15.0 15.0 15.0 15.0 15.0 15.0$50,000. . . . . . . . . . . . . . . . . . . . . . . . 15.0 15.0 15.0 15.0 15.0 15.0 15.0$75,000. . . . . . . . . . . . . . . . . . . . . . . . 28.0 28.0 28.0 28.0 28.0 28.0 28.0
- Represents zero. 1 Only one spouse is assumed to work. 2 Beginning 1994, refundable earned income credit.3 Refundable earned income credit. 4 Refundable earned income credit.
Source: U.S. Dept. of the Treasury, Office of Tax Analysis, unpublished data.
No. 555. Paid Full-Time Federal Civilian Employment, All Areas: 1990 to 1999
[As of March 31. Excludes employees of Congress and Federal courts, maritime seamen of Dept. of Commerce, and smallnumber for whom rates were not reported. See text, this section, for explanation of general schedule and wage system]
Compensationauthority
Employees (1,000) Average pay
1990 1995 1998 1999 1990 1995 1998 1999
Total. . . . . . . . . . . . 2,697 2,620 2,490 2,483 31,174 (NA) (NA) 47,569General Schedule . . . . . 1,506 1,417 1,258 1,234 31,239 40,568 44,824 46,744Wage System . . . . . . . . 369 269 222 214 26,565 32,084 34,763 35,767Postal pay system 1 . . . . 661 753 792 798 29,264 33,665 35,670 36,413Other . . . . . . . . . . . . . . 161 181 218 237 41,149 53,839 60,678 62,519
NA Not available. 1 Source: Employees—U.S. Postal Service, Annual Report of the Postmaster General. Average pay—U.S.Postal Service, Comprehensive Statement of Postal Operations, annual.
Source: Except as noted, U.S. Office of Personnel Management, Pay Structure of the Federal Civil Service, annual.
354 Federal Government Finances and Employment
U.S. Census Bureau, Statistical Abstract of the United States: 2000
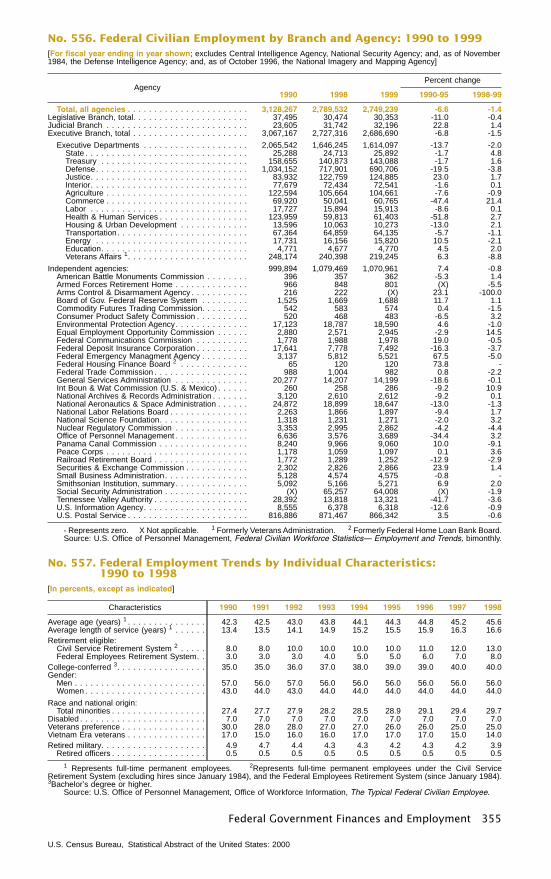
No. 556. Federal Civilian Employment by Branch and Agency: 1990 to 1999[For fiscal year ending in year shown; excludes Central Intelligence Agency, National Security Agency; and, as of November1984, the Defense Intelligence Agency; and, as of October 1996, the National Imagery and Mapping Agency]
Agency1990 1998 1999
Percent change
1990-95 1998-99
Total, all agencies . . . . . . . . . . . . . . . . . . . . . . . 3,128,267 2,789,532 2,749,239 -6.6 -1.4Legislative Branch, total. . . . . . . . . . . . . . . . . . . . . . 37,495 30,474 30,353 -11.0 -0.4Judicial Branch . . . . . . . . . . . . . . . . . . . . . . . . . . . 23,605 31,742 32,196 22.8 1.4Executive Branch, total . . . . . . . . . . . . . . . . . . . . . . 3,067,167 2,727,316 2,686,690 -6.8 -1.5
Executive Departments . . . . . . . . . . . . . . . . . . . . 2,065,542 1,646,245 1,614,097 -13.7 -2.0State . . . . . . . . . . . . . . . . . . . . . . . . . . . . . . . 25,288 24,713 25,892 -1.7 4.8Treasury . . . . . . . . . . . . . . . . . . . . . . . . . . . . 158,655 140,873 143,088 -1.7 1.6Defense. . . . . . . . . . . . . . . . . . . . . . . . . . . . . 1,034,152 717,901 690,706 -19.5 -3.8Justice. . . . . . . . . . . . . . . . . . . . . . . . . . . . . . 83,932 122,759 124,885 23.0 1.7Interior. . . . . . . . . . . . . . . . . . . . . . . . . . . . . . 77,679 72,434 72,541 -1.6 0.1Agriculture . . . . . . . . . . . . . . . . . . . . . . . . . . . 122,594 105,664 104,661 -7.6 -0.9Commerce . . . . . . . . . . . . . . . . . . . . . . . . . . . 69,920 50,041 60,765 -47.4 21.4Labor . . . . . . . . . . . . . . . . . . . . . . . . . . . . . . 17,727 15,894 15,913 -8.6 0.1Health & Human Services . . . . . . . . . . . . . . . . . 123,959 59,813 61,403 -51.8 2.7Housing & Urban Development . . . . . . . . . . . . . 13,596 10,063 10,273 -13.0 2.1Transportation. . . . . . . . . . . . . . . . . . . . . . . . . 67,364 64,859 64,135 -5.7 -1.1Energy . . . . . . . . . . . . . . . . . . . . . . . . . . . . . 17,731 16,156 15,820 10.5 -2.1Education. . . . . . . . . . . . . . . . . . . . . . . . . . . . 4,771 4,677 4,770 4.5 2.0Veterans Affairs 1. . . . . . . . . . . . . . . . . . . . . . . 248,174 240,398 219,245 6.3 -8.8
Independent agencies: 999,894 1,079,469 1,070,961 7.4 -0.8American Battle Monuments Commission . . . . . . . . 396 357 362 -5.3 1.4Armed Forces Retirement Home . . . . . . . . . . . . . . 966 848 801 (X) -5.5Arms Control & Disarmament Agency . . . . . . . . . . . 216 222 (X) 23.1 -100.0Board of Gov. Federal Reserve System . . . . . . . . . 1,525 1,669 1,688 11.7 1.1Commodity Futures Trading Commission. . . . . . . . . 542 583 574 0.4 -1.5Consumer Product Safety Commission . . . . . . . . . . 520 468 483 -6.5 3.2Environmental Protection Agency. . . . . . . . . . . . . . 17,123 18,787 18,590 4.6 -1.0Equal Employment Opportunity Commission . . . . . . 2,880 2,571 2,945 -2.9 14.5Federal Communications Commission . . . . . . . . . . 1,778 1,988 1,978 19.0 -0.5Federal Deposit Insurance Corporation . . . . . . . . . . 17,641 7,778 7,492 -16.3 -3.7Federal Emergency Managment Agency . . . . . . . . . 3,137 5,812 5,521 67.5 -5.0Federal Housing Finance Board 2 . . . . . . . . . . . . . 65 120 120 73.8 -Federal Trade Commission . . . . . . . . . . . . . . . . . . 988 1,004 982 0.8 -2.2General Services Administration . . . . . . . . . . . . . . 20,277 14,207 14,199 -18.6 -0.1Int Boun & Wat Commission (U.S. & Mexico) . . . . . . 260 258 286 -9.2 10.9National Archives & Records Administration . . . . . . . 3,120 2,610 2,612 -9.2 0.1National Aeronautics & Space Administration . . . . . . 24,872 18,899 18,647 -13.0 -1.3National Labor Relations Board . . . . . . . . . . . . . . . 2,263 1,866 1,897 -9.4 1.7National Science Foundation. . . . . . . . . . . . . . . . . 1,318 1,231 1,271 -2.0 3.2Nuclear Regulatory Commission . . . . . . . . . . . . . . 3,353 2,995 2,862 -4.2 -4.4Office of Personnel Management . . . . . . . . . . . . . . 6,636 3,576 3,689 -34.4 3.2Panama Canal Commission . . . . . . . . . . . . . . . . . 8,240 9,966 9,060 10.0 -9.1Peace Corps . . . . . . . . . . . . . . . . . . . . . . . . . . . 1,178 1,059 1,097 0.1 3.6Railroad Retirement Board . . . . . . . . . . . . . . . . . . 1,772 1,289 1,252 -12.9 -2.9Securities & Exchange Commission . . . . . . . . . . . . 2,302 2,826 2,866 23.9 1.4Small Business Administration. . . . . . . . . . . . . . . . 5,128 4,574 4,575 -0.8 -Smithsonian Institution, summary. . . . . . . . . . . . . . 5,092 5,166 5,271 6.9 2.0Social Security Administration . . . . . . . . . . . . . . . . (X) 65,257 64,008 (X) -1.9Tennessee Valley Authority . . . . . . . . . . . . . . . . . . 28,392 13,818 13,321 -41.7 -3.6U.S. Information Agency. . . . . . . . . . . . . . . . . . . . 8,555 6,378 6,318 -12.6 -0.9U.S. Postal Service . . . . . . . . . . . . . . . . . . . . . . . 816,886 871,467 866,342 3.5 -0.6
- Represents zero. X Not applicable. 1 Formerly Veterans Administration. 2 Formerly Federal Home Loan Bank Board.Source: U.S. Office of Personnel Management, Federal Civilian Workforce Statistics— Employment and Trends, bimonthly.
No. 557. Federal Employment Trends by Individual Characteristics:1990 to 1998
[In percents, except as indicated]
Characteristics 1990 1991 1992 1993 1994 1995 1996 1997 1998
Average age (years) 1 . . . . . . . . . . . . . . . 42.3 42.5 43.0 43.8 44.1 44.3 44.8 45.2 45.6Average length of service (years) 1 . . . . . . 13.4 13.5 14.1 14.9 15.2 15.5 15.9 16.3 16.6Retirement eligible:
Civil Service Retirement System 2 . . . . . 8.0 8.0 10.0 10.0 10.0 10.0 11.0 12.0 13.0Federal Employees Retirement System. . 3.0 3.0 3.0 4.0 5.0 5.0 6.0 7.0 8.0
College-conferred 3. . . . . . . . . . . . . . . . . 35.0 35.0 36.0 37.0 38.0 39.0 39.0 40.0 40.0Gender:
Men . . . . . . . . . . . . . . . . . . . . . . . . . 57.0 56.0 57.0 56.0 56.0 56.0 56.0 56.0 56.0Women . . . . . . . . . . . . . . . . . . . . . . . 43.0 44.0 43.0 44.0 44.0 44.0 44.0 44.0 44.0
Race and national origin:Total minorities . . . . . . . . . . . . . . . . . . 27.4 27.7 27.9 28.2 28.5 28.9 29.1 29.4 29.7
Disabled . . . . . . . . . . . . . . . . . . . . . . . . 7.0 7.0 7.0 7.0 7.0 7.0 7.0 7.0 7.0Veterans preference . . . . . . . . . . . . . . . . 30.0 28.0 28.0 27.0 27.0 26.0 26.0 25.0 25.0Vietnam Era veterans . . . . . . . . . . . . . . . 17.0 15.0 16.0 16.0 17.0 17.0 17.0 15.0 14.0Retired military. . . . . . . . . . . . . . . . . . . . 4.9 4.7 4.4 4.3 4.3 4.2 4.3 4.2 3.9
Retired officers . . . . . . . . . . . . . . . . . . 0.5 0.5 0.5 0.5 0.5 0.5 0.5 0.5 0.5
1 Represents full-time permanent employees. 2Represents full-time permanent employees under the Civil ServiceRetirement System (excluding hires since January 1984), and the Federal Employees Retirement System (since January 1984).3Bachelor’s degree or higher.
Source: U.S. Office of Personnel Management, Office of Workforce Information, The Typical Federal Civilian Employee.
Federal Government Finances and Employment 355
U.S. Census Bureau, Statistical Abstract of the United States: 2000
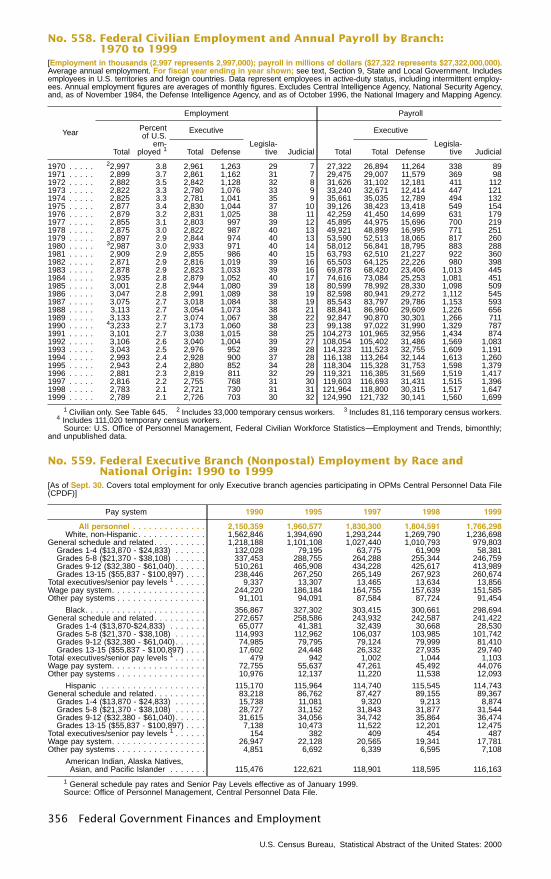
No. 558. Federal Civilian Employment and Annual Payroll by Branch:1970 to 1999
[Employment in thousands (2,997 represents 2,997,000); payroll in millions of dollars ($27,322 represents $27,322,000,000).Average annual employment. For fiscal year ending in year shown; see text, Section 9, State and Local Government. Includesemployees in U.S. territories and foreign countries. Data represent employees in active-duty status, including intermittent employ-ees. Annual employment figures are averages of monthly figures. Excludes Central Intelligence Agency, National Security Agency,and, as of November 1984, the Defense Intelligence Agency, and as of October 1996, the National Imagery and Mapping Agency.
Year
Employment Payroll
Total
Percentof U.S.
em-ployed 1
Executive
Legisla-tive Judicial Total
Executive
Legisla-tive JudicialTotal Defense Total Defense
1970 . . . . . 22,997 3.8 2,961 1,263 29 7 27,322 26,894 11,264 338 891971 . . . . . 2,899 3.7 2,861 1,162 31 7 29,475 29,007 11,579 369 981972 . . . . . 2,882 3.5 2,842 1,128 32 8 31,626 31,102 12,181 411 1121973 . . . . . 2,822 3.3 2,780 1,076 33 9 33,240 32,671 12,414 447 1211974 . . . . . 2,825 3.3 2,781 1,041 35 9 35,661 35,035 12,789 494 1321975 . . . . . 2,877 3.4 2,830 1,044 37 10 39,126 38,423 13,418 549 1541976 . . . . . 2,879 3.2 2,831 1,025 38 11 42,259 41,450 14,699 631 1791977 . . . . . 2,855 3.1 2,803 997 39 12 45,895 44,975 15,696 700 2191978 . . . . . 2,875 3.0 2,822 987 40 13 49,921 48,899 16,995 771 2511979 . . . . . 2,897 2.9 2,844 974 40 13 53,590 52,513 18,065 817 2601980 . . . . . 32,987 3.0 2,933 971 40 14 58,012 56,841 18,795 883 2881981 . . . . . 2,909 2.9 2,855 986 40 15 63,793 62,510 21,227 922 3601982 . . . . . 2,871 2.9 2,816 1,019 39 16 65,503 64,125 22,226 980 3981983 . . . . . 2,878 2.9 2,823 1,033 39 16 69,878 68,420 23,406 1,013 4451984 . . . . . 2,935 2.8 2,879 1,052 40 17 74,616 73,084 25,253 1,081 4511985 . . . . . 3,001 2.8 2,944 1,080 39 18 80,599 78,992 28,330 1,098 5091986 . . . . . 3,047 2.8 2,991 1,089 38 19 82,598 80,941 29,272 1,112 5451987 . . . . . 3,075 2.7 3,018 1,084 38 19 85,543 83,797 29,786 1,153 5931988 . . . . . 3,113 2.7 3,054 1,073 38 21 88,841 86,960 29,609 1,226 6561989 . . . . . 3,133 2.7 3,074 1,067 38 22 92,847 90,870 30,301 1,266 7111990 . . . . . 43,233 2.7 3,173 1,060 38 23 99,138 97,022 31,990 1,329 7871991 . . . . . 3,101 2.7 3,038 1,015 38 25 104,273 101,965 32,956 1,434 8741992 . . . . . 3,106 2.6 3,040 1,004 39 27 108,054 105,402 31,486 1,569 1,0831993 . . . . . 3,043 2.5 2,976 952 39 28 114,323 111,523 32,755 1,609 1,1911994 . . . . . 2,993 2.4 2,928 900 37 28 116,138 113,264 32,144 1,613 1,2601995 . . . . . 2,943 2.4 2,880 852 34 28 118,304 115,328 31,753 1,598 1,3791996 . . . . . 2,881 2.3 2,819 811 32 29 119,321 116,385 31,569 1,519 1,4171997 . . . . . 2,816 2.2 2,755 768 31 30 119,603 116,693 31,431 1,515 1,3961998 . . . . . 2,783 2.1 2,721 730 31 31 121,964 118,800 30,315 1,517 1,6471999 . . . . . 2,789 2.1 2,726 703 30 32 124,990 121,732 30,141 1,560 1,699
1 Civilian only. See Table 645. 2 Includes 33,000 temporary census workers. 3 Includes 81,116 temporary census workers.4 Includes 111,020 temporary census workers.
Source: U.S. Office of Personnel Management, Federal Civilian Workforce Statistics—Employment and Trends, bimonthly;and unpublished data.
No. 559. Federal Executive Branch (Nonpostal) Employment by Race andNational Origin: 1990 to 1999
[As of Sept. 30. Covers total employment for only Executive branch agencies participating in OPMs Central Personnel Data File(CPDF)]
Pay system 1990 1995 1997 1998 1999
All personnel . . . . . . . . . . . . . . 2,150,359 1,960,577 1,830,300 1,804,591 1,766,298White, non-Hispanic . . . . . . . . . . . . . 1,562,846 1,394,690 1,293,244 1,269,790 1,236,698
General schedule and related. . . . . . . . . . 1,218,188 1,101,108 1,027,440 1,010,793 979,803Grades 1-4 ($13,870 - $24,833) . . . . . . 132,028 79,195 63,775 61,909 58,381Grades 5-8 ($21,370 - $38,108) . . . . . . 337,453 288,755 264,288 255,344 246,759Grades 9-12 ($32,380 - $61,040) . . . . . . 510,261 465,908 434,228 425,617 413,989Grades 13-15 ($55,837 - $100,897) . . . . 238,446 267,250 265,149 267,923 260,674
Total executives/senior pay levels 1 . . . . . . 9,337 13,307 13,465 13,634 13,856Wage pay system. . . . . . . . . . . . . . . . . . 244,220 186,184 164,755 157,639 151,585Other pay systems . . . . . . . . . . . . . . . . . 91,101 94,091 87,584 87,724 91,454
Black. . . . . . . . . . . . . . . . . . . . . . . 356,867 327,302 303,415 300,661 298,694General schedule and related. . . . . . . . . . 272,657 258,586 243,932 242,587 241,422
Grades 1-4 ($13,870-$24,833) . . . . . . . 65,077 41,381 32,439 30,668 28,530Grades 5-8 ($21,370 - $38,108) . . . . . . 114,993 112,962 106,037 103,985 101,742Grades 9-12 ($32,380 - $61,040) . . . . . . 74,985 79,795 79,124 79,999 81,410Grades 13-15 ($55,837 - $100,897) . . . . 17,602 24,448 26,332 27,935 29,740
Total executives/senior pay levels 1 . . . . . . 479 942 1,002 1,044 1,103Wage pay system. . . . . . . . . . . . . . . . . . 72,755 55,637 47,261 45,492 44,076Other pay systems . . . . . . . . . . . . . . . . . 10,976 12,137 11,220 11,538 12,093
Hispanic . . . . . . . . . . . . . . . . . . . . 115,170 115,964 114,740 115,545 114,743General schedule and related. . . . . . . . . . 83,218 86,762 87,427 89,155 89,367
Grades 1-4 ($13,870 - $24,833) . . . . . . 15,738 11,081 9,320 9,213 8,874Grades 5-8 ($21,370 - $38,108) . . . . . . 28,727 31,152 31,843 31,877 31,544Grades 9-12 ($32,380 - $61,040) . . . . . . 31,615 34,056 34,742 35,864 36,474Grades 13-15 ($55,837 - $100,897) . . . . 7,138 10,473 11,522 12,201 12,475
Total executives/senior pay levels 1 . . . . . . 154 382 409 454 487Wage pay system. . . . . . . . . . . . . . . . . . 26,947 22,128 20,565 19,341 17,781Other pay systems . . . . . . . . . . . . . . . . . 4,851 6,692 6,339 6,595 7,108
American Indian, Alaska Natives,Asian, and Pacific Islander . . . . . . . 115,476 122,621 118,901 118,595 116,163
1 General schedule pay rates and Senior Pay Levels effective as of January 1999.Source: Office of Personnel Management, Central Personnel Data File.
356 Federal Government Finances and Employment
U.S. Census Bureau, Statistical Abstract of the United States: 2000
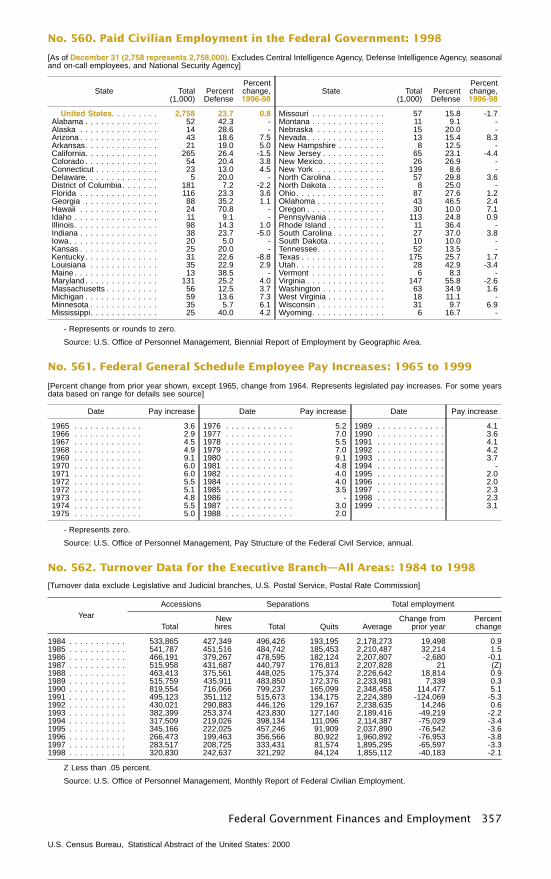
No. 560. Paid Civilian Employment in the Federal Government: 1998
[As of December 31 (2,758 represents 2,758,000). Excludes Central Intelligence Agency, Defense Intelligence Agency, seasonaland on-call employees, and National Security Agency]
State Total(1,000)
PercentDefense
Percentchange,1996-98
United States. . . . . . . . . 2,758 23.7 0.8Alabama . . . . . . . . . . . . . . 52 42.3 -Alaska . . . . . . . . . . . . . . . 14 28.6 -Arizona . . . . . . . . . . . . . . . 43 18.6 7.5Arkansas. . . . . . . . . . . . . . 21 19.0 5.0California. . . . . . . . . . . . . . 265 26.4 -1.5Colorado . . . . . . . . . . . . . . 54 20.4 3.8Connecticut . . . . . . . . . . . . 23 13.0 4.5Delaware. . . . . . . . . . . . . . 5 20.0 -District of Columbia. . . . . . . 181 7.2 -2.2Florida . . . . . . . . . . . . . . . 116 23.3 3.6Georgia . . . . . . . . . . . . . . 88 35.2 1.1Hawaii . . . . . . . . . . . . . . . 24 70.8 -Idaho . . . . . . . . . . . . . . . . 11 9.1 -Illinois . . . . . . . . . . . . . . . . 98 14.3 1.0Indiana . . . . . . . . . . . . . . . 38 23.7 -5.0Iowa. . . . . . . . . . . . . . . . . 20 5.0 -Kansas . . . . . . . . . . . . . . . 25 20.0 -Kentucky. . . . . . . . . . . . . . 31 22.6 -8.8Louisiana . . . . . . . . . . . . . 35 22.9 2.9Maine . . . . . . . . . . . . . . . . 13 38.5 -Maryland. . . . . . . . . . . . . . 131 25.2 4.0Massachusetts . . . . . . . . . . 56 12.5 3.7Michigan . . . . . . . . . . . . . . 59 13.6 7.3Minnesota . . . . . . . . . . . . . 35 5.7 6.1Mississippi. . . . . . . . . . . . . 25 40.0 4.2
State Total(1,000)
PercentDefense
Percentchange,1996-98
Missouri . . . . . . . . . . . . . . 57 15.8 -1.7Montana . . . . . . . . . . . . . . 11 9.1 -Nebraska . . . . . . . . . . . . . 15 20.0 -Nevada. . . . . . . . . . . . . . . 13 15.4 8.3New Hampshire . . . . . . . . . 8 12.5 -New Jersey . . . . . . . . . . . . 65 23.1 -4.4New Mexico. . . . . . . . . . . . 26 26.9 -New York . . . . . . . . . . . . . 139 8.6 -North Carolina . . . . . . . . . . 57 29.8 3.6North Dakota . . . . . . . . . . . 8 25.0 -Ohio. . . . . . . . . . . . . . . . . 87 27.6 1.2Oklahoma . . . . . . . . . . . . . 43 46.5 2.4Oregon . . . . . . . . . . . . . . . 30 10.0 7.1Pennsylvania . . . . . . . . . . . 113 24.8 0.9Rhode Island . . . . . . . . . . . 11 36.4 -South Carolina . . . . . . . . . . 27 37.0 3.8South Dakota. . . . . . . . . . . 10 10.0 -Tennessee. . . . . . . . . . . . . 52 13.5 -Texas . . . . . . . . . . . . . . . . 175 25.7 1.7Utah. . . . . . . . . . . . . . . . . 28 42.9 -3.4Vermont . . . . . . . . . . . . . . 6 8.3 -Virginia . . . . . . . . . . . . . . . 147 55.8 -2.6Washington . . . . . . . . . . . . 63 34.9 1.6West Virginia . . . . . . . . . . . 18 11.1 -Wisconsin . . . . . . . . . . . . . 31 9.7 6.9Wyoming. . . . . . . . . . . . . . 6 16.7 -
- Represents or rounds to zero.
Source: U.S. Office of Personnel Management, Biennial Report of Employment by Geographic Area.
No. 561. Federal General Schedule Employee Pay Increases: 1965 to 1999
[Percent change from prior year shown, except 1965, change from 1964. Represents legislated pay increases. For some yearsdata based on range for details see source]
Date Pay increase
1965 . . . . . . . . . . . . . 3.61966 . . . . . . . . . . . . . 2.91967 . . . . . . . . . . . . . 4.51968 . . . . . . . . . . . . . 4.91969 . . . . . . . . . . . . . 9.11970 . . . . . . . . . . . . . 6.01971 . . . . . . . . . . . . . 6.01972 . . . . . . . . . . . . . 5.51972 . . . . . . . . . . . . . 5.11973 . . . . . . . . . . . . . 4.81974 . . . . . . . . . . . . . 5.51975 . . . . . . . . . . . . . 5.0
Date Pay increase
1976 . . . . . . . . . . . . . 5.21977 . . . . . . . . . . . . . 7.01978 . . . . . . . . . . . . . 5.51979 . . . . . . . . . . . . . 7.01980 . . . . . . . . . . . . . 9.11981 . . . . . . . . . . . . . 4.81982 . . . . . . . . . . . . . 4.01984 . . . . . . . . . . . . . 4.01985 . . . . . . . . . . . . . 3.51986 . . . . . . . . . . . . . -1987 . . . . . . . . . . . . . 3.01988 . . . . . . . . . . . . . 2.0
Date Pay increase
1989 . . . . . . . . . . . . . 4.11990 . . . . . . . . . . . . . 3.61991 . . . . . . . . . . . . . 4.11992 . . . . . . . . . . . . . 4.21993 . . . . . . . . . . . . . 3.71994 . . . . . . . . . . . . . -1995 . . . . . . . . . . . . . 2.01996 . . . . . . . . . . . . . 2.01997 . . . . . . . . . . . . . 2.31998 . . . . . . . . . . . . . 2.31999 . . . . . . . . . . . . . 3.1
- Represents zero.
Source: U.S. Office of Personnel Management, Pay Structure of the Federal Civil Service, annual.
No. 562. Turnover Data for the Executive Branch—All Areas: 1984 to 1998
[Turnover data exclude Legislative and Judicial branches, U.S. Postal Service, Postal Rate Commission]
YearAccessions Separations Total employment
TotalNewhires Total Quits Average
Change fromprior year
Percentchange
1984 . . . . . . . . . . . 533,865 427,349 496,426 193,195 2,178,273 19,498 0.91985 . . . . . . . . . . . 541,787 451,516 484,742 185,453 2,210,487 32,214 1.51986 . . . . . . . . . . . 466,191 379,267 478,595 182,124 2,207,807 -2,680 -0.11987 . . . . . . . . . . . 515,958 431,687 440,797 176,813 2,207,828 21 (Z)1988 . . . . . . . . . . . 463,413 375,561 448,025 175,374 2,226,642 18,814 0.91989 . . . . . . . . . . . 515,759 435,911 483,850 172,376 2,233,981 7,339 0.31990 . . . . . . . . . . . 819,554 716,066 799,237 165,099 2,348,458 114,477 5.11991 . . . . . . . . . . . 495,123 351,112 515,673 134,175 2,224,389 -124,069 -5.31992 . . . . . . . . . . . 430,021 290,883 446,126 129,167 2,238,635 14,246 0.61993 . . . . . . . . . . . 382,399 253,374 423,830 127,140 2,189,416 -49,219 -2.21994 . . . . . . . . . . . 317,509 219,026 398,134 111,096 2,114,387 -75,029 -3.41995 . . . . . . . . . . . 345,166 222,025 457,246 91,909 2,037,890 -76,542 -3.61996 . . . . . . . . . . . 266,473 199,463 356,566 80,922 1,960,892 -76,953 -3.81997 . . . . . . . . . . . 283,517 208,725 333,431 81,574 1,895,295 -65,597 -3.31998 . . . . . . . . . . . 320,830 242,637 321,292 84,124 1,855,112 -40,183 -2.1
Z Less than .05 percent.
Source: U.S. Office of Personnel Management, Monthly Report of Federal Civilian Employment.
Federal Government Finances and Employment 357
U.S. Census Bureau, Statistical Abstract of the United States: 2000
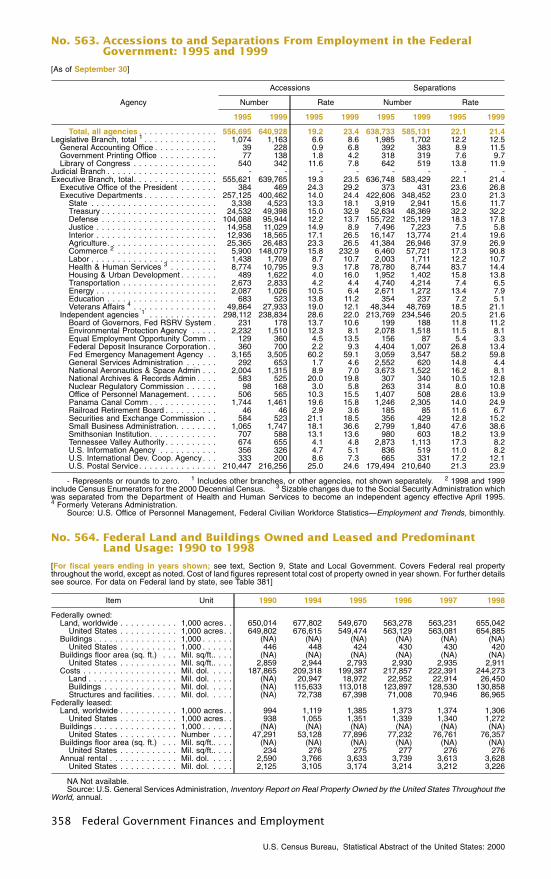
No. 563. Accessions to and Separations From Employment in the FederalGovernment: 1995 and 1999
[As of September 30]
Agency
Accessions Separations
Number Rate Number Rate
1995 1999 1995 1999 1995 1999 1995 1999
Total, all agencies . . . . . . . . . . . . . . . 556,695 640,928 19.2 23.4 638,733 585,131 22.1 21.4Legislative Branch, total 1 . . . . . . . . . . . . . . 1,074 1,163 6.6 8.6 1,985 1,702 12.2 12.5
General Accounting Office . . . . . . . . . . . . 39 228 0.9 6.8 392 383 8.9 11.5Government Printing Office . . . . . . . . . . . 77 138 1.8 4.2 318 319 7.6 9.7Library of Congress . . . . . . . . . . . . . . . . 540 342 11.6 7.8 642 519 13.8 11.9
Judicial Branch . . . . . . . . . . . . . . . . . . . . . - - - - - - - -Executive Branch, total. . . . . . . . . . . . . . . . 555,621 639,765 19.3 23.5 636,748 583,429 22.1 21.4
Executive Office of the President . . . . . . . 384 469 24.3 29.2 373 431 23.6 26.8Executive Departments . . . . . . . . . . . . . . 257,125 400,462 14.0 24.4 422,606 348,452 23.0 21.3
State . . . . . . . . . . . . . . . . . . . . . . . . 3,338 4,523 13.3 18.1 3,919 2,941 15.6 11.7Treasury . . . . . . . . . . . . . . . . . . . . . . 24,532 49,398 15.0 32.9 52,634 48,369 32.2 32.2Defense . . . . . . . . . . . . . . . . . . . . . . 104,088 95,944 12.2 13.7 155,722 125,129 18.3 17.8Justice . . . . . . . . . . . . . . . . . . . . . . . 14,958 11,029 14.9 8.9 7,496 7,223 7.5 5.8Interior . . . . . . . . . . . . . . . . . . . . . . . 12,936 18,565 17.1 26.5 16,147 13,774 21.4 19.6Agriculture. . . . . . . . . . . . . . . . . . . . . 25,365 26,483 23.3 26.5 41,384 26,946 37.9 26.9Commerce 2 . . . . . . . . . . . . . . . . . . . 5,900 148,079 15.8 232.9 6,460 57,721 17.3 90.8Labor . . . . . . . . . . . . . . . . . . . . . . . . 1,438 1,709 8.7 10.7 2,003 1,711 12.2 10.7Health & Human Services 3 . . . . . . . . . 8,774 10,795 9.3 17.8 78,780 8,744 83.7 14.4Housing & Urban Development . . . . . . . 489 1,622 4.0 16.0 1,952 1,402 15.8 13.8Transportation . . . . . . . . . . . . . . . . . . 2,673 2,833 4.2 4.4 4,740 4,214 7.4 6.5Energy . . . . . . . . . . . . . . . . . . . . . . . 2,087 1,026 10.5 6.4 2,671 1,272 13.4 7.9Education . . . . . . . . . . . . . . . . . . . . . 683 523 13.8 11.2 354 237 7.2 5.1Veterans Affairs 4 . . . . . . . . . . . . . . . . 49,864 27,933 19.0 12.1 48,344 48,769 18.5 21.1
Independent agencies 1 . . . . . . . . . . . . . 298,112 238,834 28.6 22.0 213,769 234,546 20.5 21.6Board of Governors, Fed RSRV System . 231 178 13.7 10.6 199 188 11.8 11.2Environmental Protection Agency . . . . . 2,232 1,510 12.3 8.1 2,078 1,518 11.5 8.1Equal Employment Opportunity Comm . . 129 360 4.5 13.5 156 87 5.4 3.3Federal Deposit Insurance Corporation. . 360 700 2.2 9.3 4,404 1,007 26.8 13.4Fed Emergency Management Agency . . 3,165 3,505 60.2 59.1 3,059 3,547 58.2 59.8General Services Administration . . . . . . 292 653 1.7 4.6 2,552 620 14.8 4.4National Aeronautics & Space Admin . . . 2,004 1,315 8.9 7.0 3,673 1,522 16.2 8.1National Archives & Records Admin . . . . 583 525 20.0 19.8 307 340 10.5 12.8Nuclear Regulatory Commission . . . . . . 98 168 3.0 5.8 263 314 8.0 10.8Office of Personnel Management. . . . . . 506 565 10.3 15.5 1,407 508 28.6 13.9Panama Canal Comm . . . . . . . . . . . . . 1,744 1,461 19.6 15.8 1,246 2,305 14.0 24.9Railroad Retirement Board . . . . . . . . . . 46 46 2.9 3.6 185 85 11.6 6.7Securities and Exchange Commission . . 584 523 21.1 18.5 356 429 12.8 15.2Small Business Administration. . . . . . . . 1,065 1,747 18.1 36.6 2,799 1,840 47.6 38.6Smithsonian Institution. . . . . . . . . . . . . 707 588 13.1 13.6 980 603 18.2 13.9Tennessee Valley Authority . . . . . . . . . . 674 655 4.1 4.8 2,873 1,113 17.3 8.2U.S. Information Agency . . . . . . . . . . . 356 326 4.7 5.1 836 519 11.0 8.2U.S. International Dev. Coop. Agency . . . 333 200 8.6 7.3 665 331 17.2 12.1U.S. Postal Service. . . . . . . . . . . . . . . 210,447 216,256 25.0 24.6 179,494 210,640 21.3 23.9
- Represents or rounds to zero. 1 Includes other branches, or other agencies, not shown separately. 2 1998 and 1999include Census Enumerators for the 2000 Decennial Census. 3 Sizable changes due to the Social Security Administration whichwas separated from the Department of Health and Human Services to become an independent agency effective April 1995.4 Formerly Veterans Administration.
Source: U.S. Office of Personnel Management, Federal Civilian Workforce Statistics—Employment and Trends, bimonthly.
No. 564. Federal Land and Buildings Owned and Leased and PredominantLand Usage: 1990 to 1998
[For fiscal years ending in years shown; see text, Section 9, State and Local Government. Covers Federal real propertythroughout the world, except as noted. Cost of land figures represent total cost of property owned in year shown. For further detailssee source. For data on Federal land by state, see Table 381]
Item Unit 1990 1994 1995 1996 1997 1998
Federally owned:Land, worldwide . . . . . . . . . . . 1,000 acres. . 650,014 677,802 549,670 563,278 563,231 655,042
United States . . . . . . . . . . . 1,000 acres. . 649,802 676,615 549,474 563,129 563,081 654,885Buildings . . . . . . . . . . . . . . . . 1,000 . . . . . . (NA) (NA) (NA) (NA) (NA) (NA)
United States . . . . . . . . . . . 1,000 . . . . . . 446 448 424 430 430 420Buildings floor area (sq. ft.) . . . Mil. sq/ft.. . . . (NA) (NA) (NA) (NA) (NA) (NA)
United States . . . . . . . . . . . Mil. sq/ft.. . . . 2,859 2,944 2,793 2,930 2,935 2,911Costs . . . . . . . . . . . . . . . . . . Mil. dol. . . . . 187,865 209,318 199,387 217,857 222,391 244,273
Land . . . . . . . . . . . . . . . . . Mil. dol. . . . . (NA) 20,947 18,972 22,952 22,914 26,450Buildings . . . . . . . . . . . . . . Mil. dol. . . . . (NA) 115,633 113,018 123,897 128,530 130,858Structures and facilities. . . . . Mil. dol. . . . . (NA) 72,738 67,398 71,008 70,946 86,965
Federally leased:Land, worldwide . . . . . . . . . . . 1,000 acres. . 994 1,119 1,385 1,373 1,374 1,306
United States . . . . . . . . . . . 1,000 acres. . 938 1,055 1,351 1,339 1,340 1,272Buildings . . . . . . . . . . . . . . . . 1,000 . . . . . . (NA) (NA) (NA) (NA) (NA) (NA)
United States . . . . . . . . . . . Number . . . . 47,291 53,128 77,896 77,232 76,761 76,357Buildings floor area (sq. ft.) . . . Mil. sq/ft.. . . . (NA) (NA) (NA) (NA) (NA) (NA)
United States . . . . . . . . . . . Mil. sq/ft.. . . . 234 276 275 277 276 276Annual rental . . . . . . . . . . . . . Mil. dol. . . . . 2,590 3,766 3,633 3,739 3,613 3,628
United States . . . . . . . . . . . Mil. dol. . . . . 2,125 3,105 3,174 3,214 3,212 3,226
NA Not available.Source: U.S. General Services Administration, Inventory Report on Real Property Owned by the United States Throughout the
World, annual.
358 Federal Government Finances and Employment
U.S. Census Bureau, Statistical Abstract of the United States: 2000