Embed Size (px)
Citation preview

AD-A234 251* ESL-TR-89-13
AIRCRAFT EMISSIONSN CHARACTERIZATION: F1l01
AND F110 ENGINES
C.W. SPICER, M.W. HOLDREN, D.L. SMITH,S.E. MILLER, R.N. SMITH, D.P. HUGHES
BATTELLE COLUMBUS DIVISION505 KING AVENUECOLUMBUS OH 43201-2693
MARCH 1990
FINAL REPORT
JUN 1987 - MARCH 1989
TAY11ON , APPROVED FOR PUBLIC RELEASE: DISTRIBUTION UNLIMITED
S-i
..... ...,iD , JM... ...-.-. ',. I
0* .- 0 -. tiot .__. . .. .
-0QN W4LA PCUU
ENVIRONICS DIVISIONAir Force Engineering & Services Center
ENGINEERING & SERVICES LABORATORYTyndall Air Force Base, Florida 32403
9)1 '• '

NOTICE
PLEASE DO NOT REQUEST COPIES OF THIS REPORT FROM
HQ AFESC/RD (ENGINEERING AND SERVICES LALORATORY).
ADDITIONAL COPIES MAY BE PURCHASED FROM:
NATIONAL TFCliN1CAL INFORM'fiOAN SERVICE
5285 PORT ROYAL ROAD
SPRINGFIELD, VIRGINIA 22161
FEDERAL GOVERNMENT AGENCIES AND THEIR CONTRACTORS
REGISTERED WITH DEFENSE TECHNICAL INFORMATION CENTER
SHOUILD DIRECT REQUESTS FOR COPIES OF THIS REPORT TO:
DEFENSE TECHNICAL INFORMATION CENTER
CAMERON STATION
ALEXANDRIA, VIRGINIA 22314

UNCLASS I F I ED5jCURIrY C :- .- '. :ACE
REPORT DOCUMENTATION PAGEa. REPORT S.Cý.,RiTY CLASSIFXCATON 1b RESTRICTIVE MARKINGS
Unclassi fied4.. SECURITY C,ýASSjFICATION AUTHORITY 3. DISTRIBUTION,'AVAILAI81LITY OF REPORT
Approved for oublic release."O DEC•ASSFBCATION /DOWNGRAOING SCHEDULE Distribution Unlirited
4 PERFORMING ORGANIZATION REPORT NUMBER(S) S. MONITORING ORGANIZATION REPORT NUMBER(S)
ESL-TR-89-13
6S NAME OF PERFORMING ORGANIZATION 6b OFFICE SYMBOL 7a. NAME OF MONITORING ORGANIZATION
Battelle Columbus Division p Air Force Engin-'.ring and Services Center
6C. ADDRESS (city, Sate,. and ZIPCode) 7b. ADDRESS (Cty. Stae.. and ZIP Code)505 King Avenue HQ AFESC/RDVSColumbus, OH 43201-2693 Tyndall AFB, FL 32403-6001
84 NAME OF FQNDNG,SPONSORING 8b. OFFiCE SYMBOL 9. PROCUREMENT INSTRUMENT IDENTIFICATION NUMBERORGANIZT".ON (if applicable) F08635-85-C-0122
Engineerinq & Services Center RDVSaC. ADORESS (City. State, and ZIP COO.) 10. SOURCE OF FIJNOING NUMBERS
Air Force Engineering and Services Center PROGRAM PROJECT TASK WORK UNIT
Tyndall AFB, FL 32403 ELEMENT NO. NO. NO ACCESSION NO.
6.A 3788 30 52"I TITLE (Include Security Claw uhcarion)
Aircraft Emissions Characterization: F101 and F110 Engines
"12 PERSONAL AUTHOR(S) CW Spicer, 11w Holdren, DL Smith, SE Miller, RN Smith, and DP Hughes
13& TYPE OF REPORT 13b TIME COVERED 14 UATE OF REPORT (Year, Month, Day) 1S PAGE COUNT
Final Rpnonr FROM 6/87 TO 3/8M 1arch 1990Q75"ý6 SUPPLE.NIENrARY NOTATION
Availability of this report is specified on the reverse of front cover17 COSATI CODES 18 SUBJECT TERMS (Continue on reverie if nece•sa'y and ilOenrify by block numnber)
FIEXD GROuP SUB-GROu'-F- Turbine Engine/ ,V-Particle Emissions,.A S •-- Organic Emissions, / Aircraft Exhaust
9 ABSTRACT, Continue on reverie if neceujry and 100`en1y by block nurmber)ssessment of the environmental impact of aircraft operations is required by Air Force
regulations. This program was undertaken to quantify gaseous and particulate emissionsassociated with two Air Force turbine engines (F101 and F110). The emissions tests werecarried out using a test cell at Tinker AFB, Oklahoma City, OK. All tests employed 2P-4as the fuel, and fuel samples were characterized by standarc tests and analyzed forcomposition. Emissions were measured at five power settings for each engine. DetailedCrganic composition, CO, C02, NO, N0x, smoke emissions, ;article conrcentration. and particlesize d.Stribution were measured. A 7iujtiport sampling raKe was used to sample the exhaust.and neated Teflorb tuning -as used t* transfer exnaust tc. tne '-orntoring instrumentation."easured and calculated fuel/air ratios were ccmpared to assure re.rese.native samphng,f t.ne exnaust.
ovr)
S ., • . .t ., ''- -'.: $ • " .- ; • • . .;:.,.- -.: .. C.J:. 2•.*
GD FOR;,1 1473,:..'-; :. '-..; '.;--. :e ,e - .:,- -'eU
•..',.,~ ~ L , .m. . ..

(Continued)
The results have been used to calculate emission indices and emission rates for CO, C02 ,total hydrocarbons, NO, WO2 , and NOx. The distribution of organic compounds in theexhaust from each engine and at various power settings has been compared, and the distri-bution by compound class and by carbon number are reported. Smoke numbers and particlesize distributions have been derived from the test data. The report also contatns areview of the emissions of selected toxic chemicals, and a comparison with other emissionsources.

p )
c,
PREFACE
This report was prepared by Battelle Columbus Division, Columbus, OH43201-2693 under Contract Number F08635-85-C-0122 for the Air ForceEngineering and Services Center, Engineering and Services Laboratory(AFESC/RDV), Tyndall Air Force Base, FL 32403.
This final report describes the experimental methods and presents theresults and interpretive analysis of the gas and particle composition ofexhaust from two turbine engines. This work was performed between June,1988 and March, 1989. The AFESC project officer was Capt. Mark Smith.
Principal research staff at Battelle included Messrs. M. W. Holdren,S. E. Miller, R. N. Smith, Ms. D. L. Smith, and Dr. C. W. Spicer.Assistance in conducting the program was provided by Dr. M. R. Kuhlman, Ms.J. C. Chuang, Dr. G. M. Sverdrup, Mr. M. K. Pence, Mr. G. D. Nichols, Mr. G.F. Ward, Mr. N. Russell, Ms. A. J. Osburn, and Ms. C. F. Dye. Enginetesting at Tinker AFB was conducted with the cooperation and assistance ofthe Production Engine Test Section; we are especially grateful for theassistance provided by Mr. David Hughes. We are indebted to Mr. C. Martelof Wright Patterson AFB for the use of an automated Smoke Meter, and to theNaval Air Propulsion Center for the use of a sampling rake.
This report has been reviewed by the Public Affairs Officer (PA) and isreleasable to the National Technical Information Service (NTIS). At NTIS,it will be available to the general public, including foreign nationals.
This report has been reviewed and is approved for publicatjon.
D. SIT/1, Capt, UJSAF, BSC F. I .(;/ I
Project Officer nTh -vn , -•r•,.- : v,-.on
t'A'/NE P. CHFPRE'N, Capt, USAF RICHARD M. HANES, Col, USAFChief, 1,nvironr.(nta1 Sciences Branch Director, Engineering and
Services Laboratory
(The reverse of this page is blank.)

TABLE OF CONTENTS
Section Title Page
INTRODUCTION .......... ...................... .I.... 1
A. OBJECTIVE .................................. 1 'B. BACKGROUND ........... .................... .I... 1C. SCOPE ............. ... ....................... 2
II EXPERIMENTAL METHODS ........... .................. 3
A. ENGINE TEST FACILITY .......... ............... 3B. EMISSIONS SAMPLING . . .. . .. . .. . . . . . . 3
1. Solid Adsorbent Sampling on XAD-2 Resin 122. Canister Sampling for Hydrocarbon
Determination ....... ................ .... 143. Liquid Impinger Sampling for Carbonyl
Compounds .............. .................. 15
C. PARTICLE-SAMPLING SYSTEM .... ............. .... 16
D. DATA REDUCTION METHODOLOGY .... ........... .... 18
III RESULTS ............ ........................ .... 21
A. ENGINE OPERATION ....... ................. .... 21B. FUEL ANALYSIS ............. ................... 21C. GASEOUS EMISSIONS ............. .............. 26D. POLYCYCLIC AROMATIC HYDROCARBON EMISSIONS .......... 26E. PARTICLE EMISSIONS ....... ................ .... 36
1. Smoke Emissions. . . . . . . . .. . . ...... 362. Gravimetric Analysis . . . . . . . . . .. .. .363. Particle Concentration and
Size Distribution .......... .............. 37
IV OBSERVATIONS ............... ...................... 40
A. CARBON BALANCE ................................... 40B. INDIVIDUAL ORGANIC SPECIES .... ............ ... 41C. DISTRIBUTION OF EMISSIONS BY COMPOUND CLASS .... 42D. DISTRIBUTION OF EMISSIONS BY CARBON NUMBER . 42E. EMISSION FACTORS .................. 42
iii

TABLE OF CONTENTS(CONCLUDED)
Section Title Page
1. Nitrogen Oxide Emissions .............. .... 422. Fuel/Air Ratios ................ 503. Emission Indices ..... ............... .... 52
F. RELATIVE EMISSIONS OF TOXIC CHEMICALS ......... ... 54
1. Benzene ......... ................... .... 552. Aldehydes ......... .................. ... 563. Polynuclear Aromatic Hydrocarbons (PAH) . 584. Carbon Monoxide ...... ............... .... 595. Nitrogen Dioxide ..... ............... .... 59
G. PARTICLE SiZE DISTRIBUTION ......... ............ 61
V CONCLUSIONS ....................... 66
REFERENCES ............ ....................... .... 68
iv
\
LIST OF FIGURES
Figure Title Page
1 Test Cell Cross Section ....... ..... ................ 4
2 Schematic Diagram of Test Cells 11 and 12 (Top View),With Sampling Apparatus Connected to Cell 11 ......... 5
3 Schematic Diagram of Exhaust Sampling System andMeasurement Apparatus ......... ... ................. 7
4 F110 Engine Operations With Augmented Power .... ...... 8
5 Mobile Laboratory Used for Engine EmissionsMeasurements At Tinker AFB ...... ... ............... 9
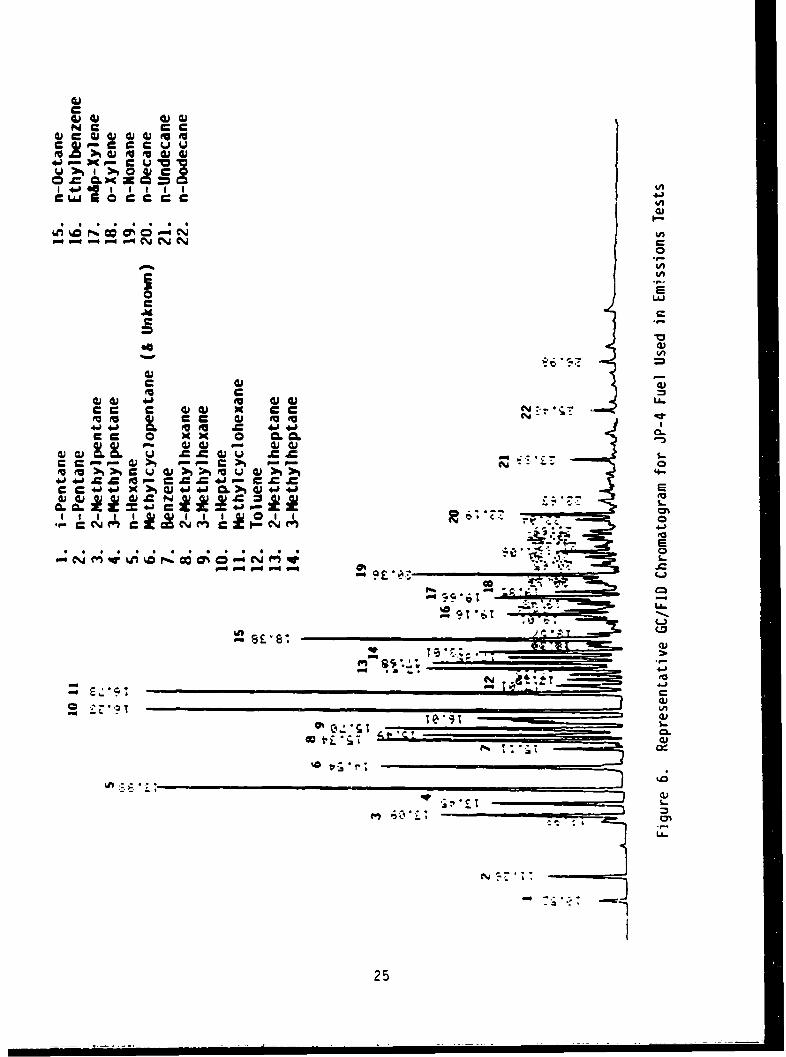
6 Representative GC/FID Chromatogram for JP-4 FuelUsed in Emissions Tests ....... ................ .... 25
7 Representative GC/FID Chromatogram for Exhaust froma Turbine Engine Operating With JP-4 Fuel ....... ... 30
8 Representative Chromatogram from Analysis of JetEngine Exhaust for Aldehydes .... .............. .... 31
9 Representative Chromatogram from Analysis of JetEngine Exhaust for Dialdehydes .... ............. .... 32
10 Exhaust Organic Compound Distribution by CompoundClass for FilO Engine for Idle ThroughIntermediate Power Settings ............... 43
11 Exhaust Organic Compound Distribution by CompoundClass for F101 Engine for Idle ThroughIntermediate Power Settings ..... .............. .... 44
12 Exhaust Organic Compound Distribution by CompoundClass for F101 and F110 Engine Operating WithStage 1 Augmented Power (Concentrations are forDilute Exhaust Measured at Roof of Test Cell) 45
13 Exhaust Organic Species Concentrations byCarbon Number at Idle ....... ................. .... 47
V

LIST OF FIGURES(CONCLUDED)
Figure Title Page
14 Exhaust Organic Species Concentrations byCarbon Number at Intermediate Power ... .......... ... 48
15 Exhaust Organic Species Concentrations byCarbon Number with Augmented Power (Concentrationsare for Dilute Exhaust Measured at Roofof Test Cell) ........... ..................... .... 49
16 Photomicrograph of Exhaust Particles From Fi01 EngineAt Idle (Filter Pores are 0.1 i•m Diameter) ......... ... 63
17 Photomicrograph of Exhaust Particles From F101 EngineAt Intermediate Power (Filter Pores are0.1 um Diameter) ........ .................... .... 64
18 Photomicrograph of Exhaust Particles From F110 EngineAt Intermediate Power (Filter Pores arep•m Diameter) .......... ...................... .... 65
vi
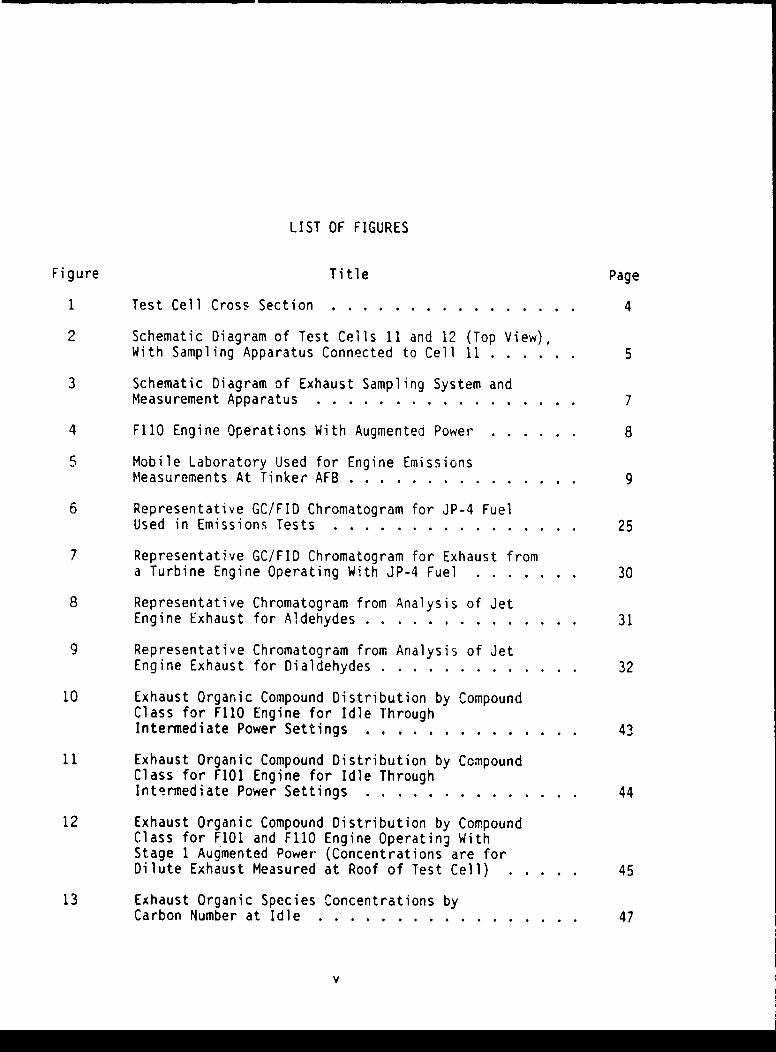
LIST OF TABLES
Table Title Page
1 SAMPLING PERIOD OF EACH METHOD DURING A TEST RUN 11
2 CONTINUOUS ANALYZERS FOR EXHAUST MEASUREMENTS 10
3 ENGINES USED IN EMISSIONS TESTS .... 21
4 ENGINE OPERATING CONDITIONS ENGINE F110(S/N 509153) .......... ...................... .... 22
5 ENGINE OPERATING CONDITIONS ENGINE F101(S/N 470135) ........ ... ..................... .... 23
6 PERCENT COMPOSITION OF MAJOR ORGANIC SPECIESIN JP-4 FUEL USED FOR EMISSIONS TESTS(WEIGHT PERCENT) .......... ..... .................... 24
7 ENGINE EMISSIONS DATA ....... ................. .... 27
8 ORGANIC EMISSIONS FROM F110 ENGINE WITHJP4 FUEL (CONCENTRATIONS IN ppmC) ... ........... ... 28
9 ORGANIC EMISSIONS FROM F101 ENGINE WITHJP4 FUEL (CONCENTRATIONS IN ppmC) ... ........... ... 29
10 POLYCYCLIC AROMATIC HYDROCARBON (PAH) RESULTS FORF110 ENGINE (CONCENTRATION IN ug/m 3 ) ... .......... ... 33
11 POLYCYCLIC AROMATIC HYDROCARBON (PAH) RESULTS FORFI01 ENGINE (CONCENTRATION IN ug/m 3 ) ............ .... 34
12 TOTAL EXTRACTABLE ORGANIC MATTER .... ............ .... 35
13 SMOKE VALUES AS.FUNCTION OF POWER SETTING .. ....... ... 36
14 PARTICLE MASS EMISSIONS ....... ............... .... 37
15 PARTICLE SIZE DISTRIBUTION AND TOTAL PARTICLECONCENTRATION IN TURBINE ENGINE EXHAUST(THOUSANDS OF PARTICLES/CC) ..... .............. .... 38
16 COMPARISON OF TOTAL ORGANICS BY SPECIATION
METHODS VERSUS CONTINUOUS FID (ppmC) .... .......... .... 41
vii

LIST OF TABLES(CONCLUDED)
Table Title Page
17 DISTRIBUTION OF ORGANIC EMISSIONS BY CARBON NUMBERFOR F10 AND F110 ENGINES AT VARIOUS POWER SETTINGS(CONCENTRATIONS IN ppmC) ............ ................ 46
18 NOX EMISSION DATA . . . ................. 51
19 FUEL/AIR RATIOS ........... .................... .... 51
20 EMISSION INDICES FOR FiIO AND F101 ENGINES .... ....... 53
21 EMISSION RATES FOR F110 AND F101 ENGINES .......... ... 54
22 COMPARISON OF BENZENE EMISSIONS FROM VARIOUSMOBILE SOURCES .......... ..................... .... 56
23 FORMALDEHYDE CONCENTRATIONS IN EXHAUST FROMMOBILE SOURCES .......... ..................... .... 57
24 COMPARISON OF BENZO(A)PYRENE EMISSIONSFROM SEVERAL EMISSIONS SOURCES .... ............. .... 58
25 CONCENTRATIONS OF CO IN UNDILUTED ENGINEEXHAUST AT IDLE POWER (JP-4 FUEL) ... ........... ... 60
26 CONCENTRATIONS OF N02 IN JET ENGINE EXHAUST ...... ... 60
viii

SECTION I
INTRODUCTION
A. OBJECTIVE
Assessment of the environmental impact of aircraft operations is
required by Air Force regulations, and by federal, state, and local
authorities. Information on the composition of exhaust emissions from
aircraft engines is needed for such an assessment. The objective of this
program is to quantify the gaseous and particulate emissions from two Air
Force turbine engines.
B. BACKGROUND
During the 1970s, the Air Force conducted emission measurements to
develop a data base of all known engine emission data. Emission data
collected included smoke plume opacity and gaseous emission levels. An
engine emission catalog was prepared and issued to en.ironmental planners
for use in determining environmental impacts of military aircraft
operations. Since the catalog was last updated in 1978, the military has
introduced new engines, and updated or modified existing ones to improve
operating efficiency of their aircraft. Exhaust emission data are not
available for all of these engines.
When the emission catalogs were compiled in the 1970s, federal, state,
and local governments were mainly interested in the control of engine
exhaust smoke and documentation of gaseous exhaust emission levels. Since
then, these regulatory agencies have come to require much more information
for environm-ntal assessments. A joint Air Force/Navy program has been
established to review all data currently available on military gas turbine
engines still in the sjstem, asso. the validity of these data for current
engine models, identify deficiencies in the data, and develop an updated
engine emission data base. The purpose of this project is to conduct engine
exhaust measurements to provide missing data and update the emissions
catalogs. We have previously reported emissions measurements for the TF39
and CFM56 engines (Reference 1), the TF41-A2, TF30-PI03, and TF30-P109
I

engines (Reference 2), and the TF33-P3, TF33-P7, and J79 (smokeless) engines
(Reference 3).
C. SCOPE
This study was initiated to determine the gas and particle composition
of exhaust from two turbine engines. These engines are FIOI and F110.
Tests were conducted using JP-4 fuel at five engine power settings. The
nominal power settings used for the F101 engine were idle, 44 percent, 75
percent, intermediate (108 percent at high mach), and stage I augmentation.
The FIlO tests were run at nominal settings of idle, 30 percent, 63 percent,
intermediate (105 percent at high mach), and Stage I augmentation. The
exhaust sampling was carried out in an indoor engine test facility at Tinker
AFR, Oklahoma City, OK. The sampling and analysis methods employed during
this study were developed and validated previously (Reference 4), and used
to determine the emissions from a TF39 and a CFM56 engine (Reference 1),
TF41-42, TF30-P103, and TF30-PI09 engines (Reference 2), and TF-P3, TF33-P7,
and J79 engines (Reference 3).
2

SECTION II
EXPERIMENTAL METHODS
A. ENGINE TEST FACILITY
Engine emissions sampling was performed in two indoor test cells at
Tinker Air Force Base, Oklahoma City, OK. The F110 engine was tested in
Cell 11, while Cell 12 was used for the F101 tests. A diagram of a generic
test cell is shown in Figure 1. The engine exhaust flows into a 15-foot 11-
inch diameter cone and through an 84-foot long steel augmentor tube, the
last 30 feet of which are perforated with numerous 1-1/4-inch holes. The
perforated portion of the tube is contained in a separate "blast room" which
is vented to the outside. The hot exhaust passes through the perforations
and out of the blast room through fifty-six 3-foot diameter vent tubes in
the ceiling of the blast room. The test cell is instrumented to record
numerous engine performance parameters included in this report.
Figure 1 shows the position of the sampling probe at the inlet to the
augmentor tube. This position was used for emission sampling at power
settings from idle through intermediate. Measurements at the Stage I
augmentation (afterburner) power level were done with a sampling probe
mounted on one of the exhaust vents on the roof of the test cell, as shown
in Figure 1.
B. EMISSIONS SAMPLING
For nonafterburner power modes, a 12-port sampling rake provided by the
Naval Air Propulsion Center was used for exhaust emissions sampling. The
rake is of cruciform design, with three 1/16-inch orifices spaced along each
of the four 12.5-inch arms of the rake. The rake was bolted to adjustable
steel arms clamped to the inlet cone of the augmentor tube. A schematic
diagram of a test cell, including sampling apparatus, is shown in Figure 2.
The rake mounting was adjustable, to allow the rake to be centered 1-2 feet
behind the exhaust nozzle of each engine. The rake and associated sampling
systems were moved from Cell 11 to Cell 12 between the F110 and F101 tests.
3

I.E
*~' I
,,u
"E .
,E •
I-
00
40JrU
CL 02
0 W
z£
6.)
or•
•-- ,

Test Cell 12 Blast RoomSamplingRake
~Aegmentor
SPerforated
with 1.1/4"Wall I Holes
HeatedPump
Control Room He-e
Filter -- *SmokeMeter
Test Cell 11 Blast Room Laboratory-- Sampling ContainingRake Sampling
Engine Augmentor uAnalysisTubeEqimn
Peratedwith 1-1/4"Wall •Holes
Figure 2. Schematic Diagram of Test Cells 11 and 12(Top View), With Sampling ApparatusConnected to Cell 11
5
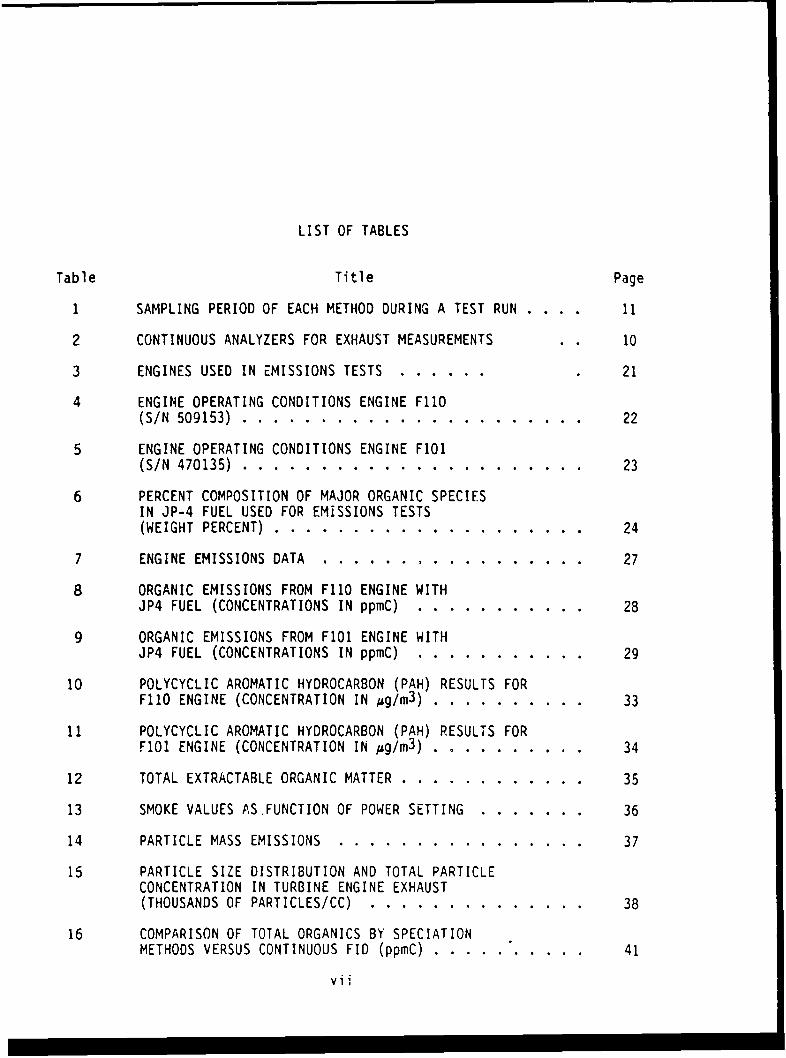
The sampling ports on the rake are internally connected to a common
manifold. The sample lines in the rake head are stainless steel, and a
common sample line passes down the support strut where it joins an
electrically heated, flexible Teflon' line. At this point, the sample line
was connected via a tee to a clean-air purge line and pumping station. A
diagram of the sampling apparatus is included in Figure 3.
For augmented power (afterburner) measurements, exhaust samples were
collected from one of the test cell exhaust vents located on the roof of the
cell (see Figure 1). The sample probe used for afterburner measurements was
a single stainless steel tube, facing into the exhaust vent and anchored to
the test cell roof. This probe was connected to the heated pump and exhaust
sampling system with 3/8-inch heated Teflon* tubing.
All afterburner emission measurements were made with Stage 1 augmented
power. Higher afterburner power settings require augmentor tube cooling by
water spray, and emission measurements were not practical under these
conditions. A photograph showing the F110 engine operating under augmented
power is shown in Figure 4. The exhaust plume is directed into the
augmentor tube noted in Figure 1.
In addition to augmented power emission measurements, one rooftop
sampling test was run with the F110 engine at intermediate power. This test
was conducted to permit a comparison between data collected at the same
power setting at the exhaust exit plane (by the rake) and the test cell
vents (by the single probe).
The heated pumping station shown in Figure 3 contained a 6-inch
diameter stainless steel filter holder coupled to a stainless steel metal
bellows pump (Metal Bellows Corp. Model MB-6O1HT). A 75-foot length of
heated 3/8-inch Teflon0 tubing transferred the exhaust sample from the rake
to the filter and pump. The pump directed the exit flow through 25 feet of
heated 3/8-inch Teflon0 tubing to a sampling manifold located in a mobile
laboratory next to the test cell. The mobile lab is shown on-site next to
Test Cell 11 in Figure 5. A tee in the sample line before the filter
allowed a stream of hot, unfiltered exhaust to be transported directly to a
diluter vessel in the mobile lab. The entire sampling system was maintained
at 150 0 C. Each component of the system was interconnected via heated
TeflonO lines. The stainless steel ball valves, tees, and manifolds were
6

Sampling Rake
Engine
I1 Back Purge Air
F ixhaus r Vea t D rSmokeMeasurementrt
+ System
Analyzelr
NO Saml:•t~er Pm
Organic3 SchmtcDarmo xas ampling SseL-Ean Syeaureent Diltinaratus-r

Figure 4. F110 Engine Operations With Augmented Power
S

Figure 5. Mobile Laboratory Used for Engine Emissions
Measurements At Tinker AFB
9
wrapped with heating tape. Thermocouples were positioned throughout the
system to check actual temperatures.
A variety of techniques were used to sample and analyze the engine
emissions. Some instruments operated in a continuous mode, while other
techniques employed integrated sample collection. Both gaseous species and
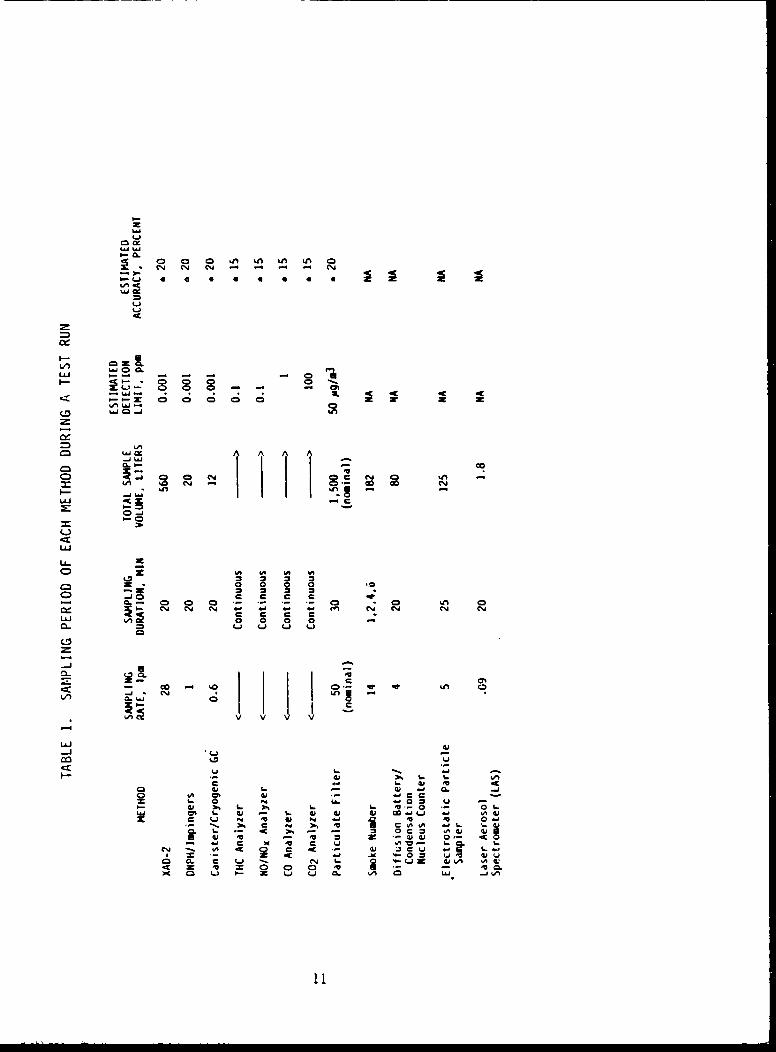
particulate matter were collected. Table I lists the sampling methodsemployed during this study, along with the rate, duration, volume, estimated
detection limit, and estimated accuracy for each technique. The gas-sampling techniques are described in the remainder of this section.
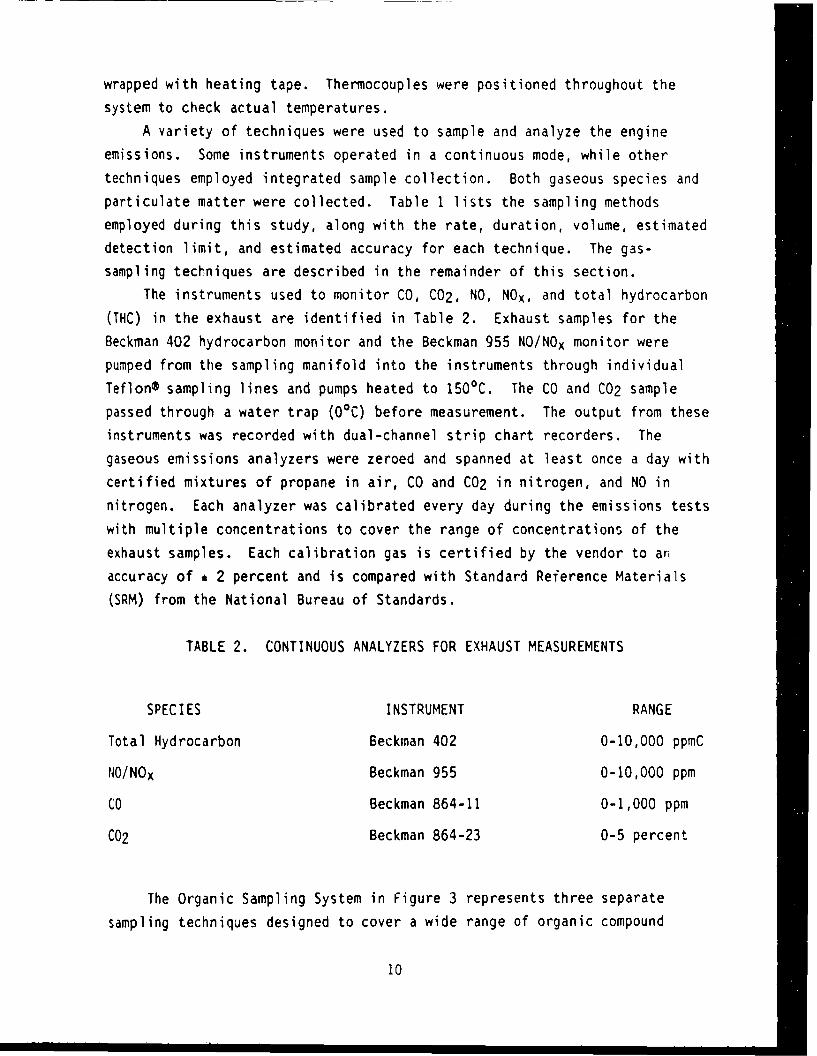
The instruments used to monitor CO, C02, NO, NOx, and total hydrocarbon
(THC) in the exhaust are identified in Table 2. Exhaust samples for the
Beckman 402 hydrocarbon monitor and the Beckman 955 NO/NOx monitor werepumped from the sampling manifold into the instruments through individual
Teflon$ sampling lines and pumps heated to 1500C. The CO and C02 sample
passed through a water trap (OC) before measurement. The output from theseinstruments was recorded with dual-channel strip chart recorders. The
gaseous emissions analyzers were zeroed and spanned at least once a day with
certified mixtures of propane in air, CO and C02 in nitrogen, and NO in
nitrogen. Each analyzer was calibrated every day during the emissions testswith multiple concentrations to cover the range of concentrations of the
exhaust samples. Each calibration gas is certified by the vendor to anaccuracy of * 2 percent and is compared with Standard Reference Materials
(SRM) from the National Bureau of Standards.
TABLE 2. CONTINUOUS ANALYZERS FOR EXHAUST MEASUREMENTS
SPECIES INSTRUMENT RANGE
Total Hydrocarbon Beckman 402 0-10,000 ppmC
NO/NOx Beckman 955 0-10,000 ppm
CO Beckman 864-11 0-1,000 ppm
C02 Beckman 864-23 0-5 percent
The Organic Sampling System in Figure 3 represents three separate
sampling techniques designed to cover a wide range of organic compound
10
I.-'
IL 4 K 0C
(.m u 4 (Z A
c-jW
CL. Uo
LI-
-'K 0 0 0 0 0 .aK
0600 1 ~fl
4 A A
C A# M -
'-0=A
K K. 0 0 0
4). V..
I C c K- cm ' 0- ac U 0
)K 92 V)J cm wa -j
classes and molecular weights. The sampling procedures include:
(1) collection on XAD-2 resin, (2) collection in stainless steel canisters,
and (3) collection in a liquid derivatizing reagent. These techniques are
described below.
1. Solid Adsorbent Sampling On XAD-2 Resin
Exhaust samples collected on XAD-2 resin were used to determine
polycyclic aromatic hydrocarbons (PAH). Each test employed a 22-gram
portion of XAD-2 resin which had been prepurified by Soxhlet® extractionwith dichloroinethane for 16 hours, A background check after cleaning showed
each batch of XAD-2 resin contained less than 5 jug of total
chromatographable organic material per gram of resin. The XAD-2 resin is
held in a glass sampling module thermostatted at 540 C. Exhaust samples were
collected from the sampling manifold at a rate of 0.028 m3 min-1 for 20
minutes, for a total volume of 0.56 m3 . After collection, the trap was
capped with glass connectors and returned to the laboratory for analysis.
The glass traps were wrapped with foil both before and after sampling to
exclude light. The XAD-2 resin samples were extracted for 16 hours withdichloromethane immediately after receipt at the laboratory. The extracts
were Kuderna-Danish (K-D) concentrated to 1 mL and stored at -78°C in the
dark until analysis.A Mettler ME-30 microbalance was used to determine the extractable
organic mass. A 25 uL aliquot of each of the concentrated sample extracts
was transferred to a tared aluminum pan and the pan placed under a heat lamp
at a distance of approximately 8 cm. After allowing 1 minute for the
solvent to evaporate, the pan was reweighed. Heating and weighing cycleswere repeated until the weight change was less than 1 to 2 isg. The residue
weight of the aliquot analyzed was then scaled to the total quantity in the
original sample extract.
The XAD-2 sample extracts were analyzed by Electron Impact (El)
GC/MS with conventional splitless injection to determine the selected
polynuclear aromatic hydrocarbons (PAH) in the multiple-ion detection (MID)
mode. A Finnigan TSQ GC/MS system interfaced with a Finnigan INCOS 2300
data system was used for these analyses. The GC column used was an Ultra 2
crosslinked phenylmethyl silicone column with the outlet of the column
located at the inlet of the MS ionization source. The instrument conditions
used are as follows:
12
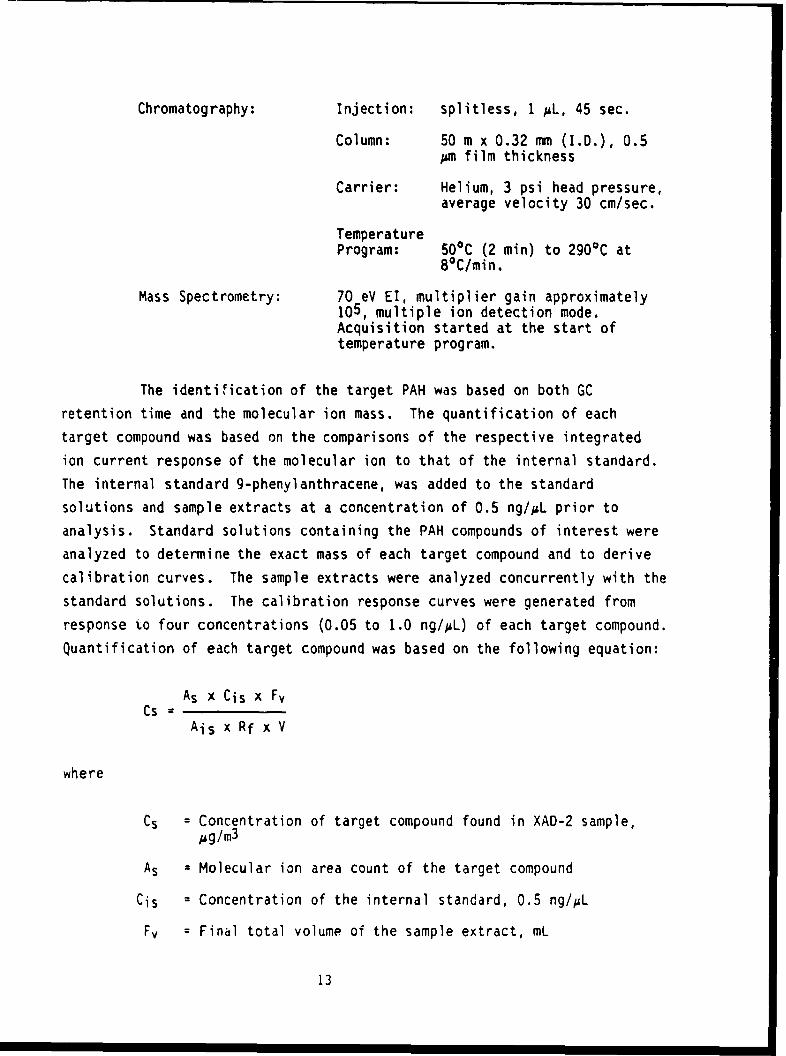
Chromatography: Injection: splitless, 1 uL, 45 sec.
Column: 50 m x 0.32 mmn (I.D.), 0.5,um film thickness
Carrier: Helium, 3 psi head pressure,average velocity 30 cm/sec.
TemperatureProgram: 500C (2 min) to 2900C at
8*C/min.
Mass Spectrometry: 70 eV El, multiplier gain approximately105, multiple ion detection mode.Acquisition started at the start oftemperature program.
The identi.lication of the target PAH was based on both GC
retention time and the molecular ion mass. The quantification of each
target compound was based on the comparisons of the respective integrated
ion current response of the molecular ion to that of the internal standard.
The internal standard 9-phenylanthracene, was added to the standard
solutions and sample extracts at a concentration of 0.5 ng/jL prior to
analysis. Standard solutions containing the PAH compounds of interest were
analyzed to determine the exact mass of each target compound and to derive
calibration curves. The sample extracts were analyzed concurrently with the
standard solutions. The calibration response curves were generated from
response to four concentrations (0.05 to 1.0 ng/pL) of each target compound.
Quantification of each target compound was based on the following equation:
As x Cis x FvCs =
Ais x Rf x V
where
Cs = Concentration of target compound found in XAD-2 sample,Ag/m3
As = Molecular ion area count of the target compound
Cis = Concentration of the internal standard, 0.5 ng/pL
Fv = Final total volume of the sample extract, mL
13

Ais = Molecular ion area count of the internal standard
Rf = Response factor of target compound
V = total sample volume, m3 .
2. Canister Sampling for Hydrocarbon Determination
Methane and C2-C15 hydrocarbons were determined by cryogenic
preconcentration and capillary column GC analysis of whole air samples
collected in surface-passivated canisters. Previous studies have
demonstrated excellent stability of Cl-C15 hydrocarbons in these canisters.
The canisters were analyzed at Battelle's Columbus laboratory following the
engine tests. The canisters were under vacuum at the start of each sampling
period, and were filled at a constant rate over the 20-minute test period.
The sampling rate was controlled by a contamination-free Metal Bellows pump
and Tylan mass flow controller. The details of this sampling system have
been reported in Reference 5.
A Hewlett-Packard Model 5890 gas chromatograph with microprocessor
control and integration capabilities was used for analysis of canisters for
C1 to C15 hydrocarbons. The analysis procedure involved collection of a
specific volume of air (usually 100 cc) through a freeze-out sample trap (15
cm long by 0.2 cm i.d. stainless steel tubing) filled with 60/80 mesh
silanized glass beads. Two traps were used in this study, for separate
analyses of C2 to C5 and C4 to C15 hydrocarbons, Methane was determined
separately. Sampling was initiated by immersing each trap in a dewar of
liquid argon (-186 0 C) and collecting a known volume of air from the
canister. Injections were accomplished by transferring the collected sample
from each trap through a heated (150*C) six-port valve (Carle Instruments
Model 5621) and onto the analytical column. The components in each trap
were flash-evaporated into the gas chromatograph by rapidly heating a
thermocouple wire which is wound around the sampling trap. During normal
operations, the trap is heated from -186 0 C to 150 0 C within 20 seconds. The
sample lines and traps were back-flushed with zero-grade N2 after each test
run.
The GC was equipped with two flame-ionization detectors. The C2
through C5 hydrocarbons were resolved with a 6-meter by 0.2-centimeter i.d.
column packed with phenylisocyanate on 80/100-mesh Porasil®C. The column is
14
housed in an oven external to the GC. Isothermal operation at 450 C provides
adequate resolution of these species. Methane was determined using this
same column and detector. In this case, a separate sample was analyzed
without cryogenic preconcentration. A 50-meter OV-1 wide-bore fused-silica
column (Hewlett-Packard) was used to separate the C4 through C15 organic
species. Optimum results in component resolution were achieved by
temperature programming from -500 to 1500 C at 8 degrees/minute. This two-
column analytical approach was necessary to resolve the major C2 to C15
organic species. Calibration of the gas chromatographic systems made use of
an external standard mixture. The standard mixtures were referenced to
several NBS primary standard "propane and benzene in air" calibration
mixtures.
Selected canister samples were aralyzed by GC-MS to identify or
confirm the identities of peaks observed in the normal chromatographic
analysis.
3. Liquid Impinger Sampling for Carbonyl Compounds
Carbonyl compounds in the exhaust stream were collected in liquid
impingers containing 2,4-dinitrophenylhydrazine (DNPH), wherein the DNPH
derivatives are formed. The derivatives were returned to the laboratory,
extracted into an organic solvent, concentrated, and analyzed by high-
performance liquid chromatography (HPLC) using a UV detector. Two impinger
samples were collected simultaneously over each 20-minute test, to provide a
backup sample in the event of sample loss during analysis.
The impinger procedure uses a solution consisting of 250 mg of
2,4-dinitrophenylhydrazine and 0.2 mL of 98 percent sulfuric acid dissolved
in 1 liter of acetonitrile (ACCN). This reagent was prepared just before
departing for the engine tests and was stored in a sealed 1-gallor metal can
containing a layer of charcoal. During emissions testing, two impingers,
each containing 10 mL of the ACCN/DNPH reagent, were placed in series in an
ice bath (because of the elevated temperature of the exhaust stream) and
samples were collected for 20 minutes at 1 liter/minute. The impinger
contents were transferred to a 20 mL glass vial having a Teflon8-lined screw
cap, and the impinger rinsed with 1-2 mL of ACCN which was added to the
vial. The vial was labeled, sealed with TeflonS tape, and placed in a
charcoal-containing metal can for transport back to the laboratory.
15

In the laboratory, the volume of the organic extract was adjusted
to 5 mL. A 10 #L aliquot was analyzed by HPLC with UV detection at 360 nm.
The amount of each aldehyde was determined from response factors for pure
DNPH derivatives. A Zorbax® ODS (4.6 x 25 cm) column and 60/40
acetonitrile/water mobile phase was used for the HPLC separation. Some
samples were also analyzed using a methanol/water mobile phase to achieve
better separation of acetone and propanal. The instrument was calibrated
daily by injecting a standard containing 2 mg/L of each DNPH derivative of
interest.
C. PARTICLE-SAMPLING SYSTEM
A particle-sampling system was designed to determine the size
distribution and mass loading of particles in the engine exhaust. The
components of this system are shown schematically in Figure 3. They consist
of a smoke meter, a filter preceding the main sampling pump (for mass
determination), and a dilution system followed by particle sizing
instrumentation.
Particulate mass was determined gravimetrically from the filter
preceding the pump. This filter was maintained at 150 0C during sampling.
The sample tubing between the rake and the filter also was held at 150 0C
during sampling. The sample tubing consisted of 125 feet of electrically
grounded carbon-impregnated Teflon0 tubing designed to minimize buildup of
static charge. Bends in the tubing were kept to a minimum and were of large
radius to minimize particle loss. Filter sampling was initiated when the
valve to the rake was opened (about 10 minutes before the start of a test)
and continued through the 20-minute sample collection period. Between 0.3
and 1.5 m3 of exhaust was sampled through the filter for each test,
depending cn power setting. A 6-inch diameter Teflon- coated glass fiber
filter was used for particle sampling. The filters were equilibrated for 24
hours at 40 percent relative humidity prior to weighing, both before and
after sample collection. After collection, each filter was folded in half
and sealed in a glassine envelope within a polyethylene zip-lock bag, for
transport back to the laboratory. The filters were stored in a freezer
before equilibration and weighing. Several blank filters were handled in
the field in the same manner as the actual samples.
Smoke number was determined by sampling exhaust t-rough a What-man
Number 4 filter according to the procedures recommended in ARP 1179A and CFR
I,

Title 40 Part 87. After sampling, smoke spot analysis was performed with a
reflectometer, and the smoke number was determined from semilog plots of
smoke number versus W/A, where W is the sample mass and A is the filter spot
area. A semiautomatic instrument manufactured by Roseco Corp. was used to
collect smoke samples. This instrument was on loan from Wright-Patterson
AFB. CFR Title 40 Part 87 specifies sampling times and volumes for
determination of smoke number, and it also specified a reference ratio of
exhaust gas mass to filter spot area (W/A) for reporting smoke number. Our
apparatus operated at higher W/A ratios than the reference value, even for
the minimum permitted sampling time of 1 minute. Even at higher W/A
values, F110 and F101 engines produced very minimal stains on the filter.
To provide some information on smoke emissions for these two engines, it was
decided to report a "smoke value", which we define as the smoke number at a
WIA of 0.080 lbs/in2 . This is higher than the reference W/A of 0.0230
lbs/in2 specified in CFR Part 87, so that the smoke values reported here
are not directly comparable with official smoke numbers. Values reported
here, at a higher W/A than the reference value, are expected to be biased on
the high side. Nevertheless, the reported values are still quite low.
The instrumentation used for determination of the aerosol size
distribution is a condensation nucleus counter (CNC), coupled with a
diffusion battery (DB) and automatic switching station. The CNC provides a
real-time measurement of particle concentration over a very wide range of
concentrations. In the photometric mode it covers the range 103 to 107
particles/cm3 , and, in the single particle mode, it can be used for even
lower concentrations. When coupled with the DB, the CNC can resolve the
aerosol size distribution in the 0.002-0.2 jsm aerodynamic size range. Up to
10 size increments are selectable in this range, in addition to a total
number concentration of submicron particles. Samples of the exhaust
particulate matter were taken, using an electrostatic aerosol sampler, to
provide for determination of particles larger than 0.2 jam. This device
deposits exhaust particles directly on a substrate for subsequent sizing by
Scanning Electron Microscopy (SEM). This technique also yields an electron
micrograph of the sample so that particle morphology can be examined.
The DB/CNC requires dilution and cooling of the exhaust before
measuremen t. rhe cooling must be accomplished in a manner which avoids
condensation of water vapor on the exhaust particles. Our approach was to
17

dilute an exhaust sample with dry particle-free air in a constant volume
vessel. For this purpose we used a sealed 220-liter steel drum mounted in
the mobile laboratory. Before each test, the drum was purged with ambient
air which had been dried and cleaned by passing it through Drierite and an
absolute filter. After confirming (with the CNC) that the dilution air in
the drum contained negligible levels of particles, the drum inlet was opened
to the exhaust stream and a pump downstream of the drum was used to pull
several liters of exhaust into the drum. This typically required 1 to 2
minutes, and resulted in a tenfold to thirtyfold dilution of the exhaust.
As soon as the dilution was complete, the DB/CNC sampling was initiated.
After sampling was complete, the exhaust monitors for CO and C02 were
switched to monitor the diluted sample in the drum. The ratios of the CO
and C02 concentrations in the drum to those in the undiluted exhaust were
used to determine the dilution factor.
For a typical test, the DB/CNC scanned each diluted exhaust sample
three times, providing three separate measurements of the size distribution.
An exhaust sample was diluted and analyzed at the beginning and end of each
test to check for changes in particle emissions over the 20-minute test
period, so that each test typically resulted in six separate particle size
determinations by the DB/CNC system.
The electrostatic sampler was used to collect exhaust particles for
scanning electron microscopy (SEM). Based on the results of previous
studies (Reference 3) the exhaust was sampled directly, without dilution.
Polycarbonate filters (Nuclepore) were used as the collection surface for
the electrostatic SEM samples. Samples typically were co!lected at a flow
rate of 5 L/min for at least 25 minutes. The electrostatic particle samples
were analyzed by scanning electron microscopy using an International
Scientific Instruments, Inc. Model S-IlIA SEM.
D. DATA REDUCTION METHODOLOGY
The procedures used to reduce the data generated in the experimental
program generally have been described in Reference 2. Procedures not
described in Reference 2 include determination of smoke number, particle
size distribution, emission rates, and emission indices. For this study,
smoke number was derived according to the procedures recommended in
Reference 6, with the exceptions noted above.
18
The data obtained from the diffusion battery-condensation nucleus
counter represent the concentration of aerosol particles penetrating the
various stages of the diffusion battery. These data cannot be interpreted
without further processing. The results reported in this document are
derived from a program which utilizes theoretical penetration efficiency
equations for each stage of the battery, and predicts the form of the
resulting data based upon an assumed initial size distribution, These
resulting "data" are compared against the actual measured values to derive a
better estimate of the actual distribution. 'Fhis process is repeated until
a satisfactory fit of the input data is obtained. This fitted distribution
is then used to represent the measured aerosol size distribution.
Emission rates and emission indices for power settings other than
afterburner, were derived using the equations provided in Reference 7. For
afterburner emissions we used a modified version of the procedures
recommended by Lyon et al. (Reference 8). Their procedure, which was
developed for outdoor downwind measurements of afterburning engine
emissions, consists of axial probing of the exhaust plume and linear
regression of the pollutant concentrations against the concentration of C02.
The afterburner measurements made during this study were performed well
downstream of the exhaust nozzle, as recommended in Reference 7, so that
thermal reactions in the exhaust gas are largely quenched. However, unlike
the measurements of Lyon et al. (Reference 8), our samples were obtained in
a confined exhaust stream which passed through the augmentor tube and roof
vent, as noted in Figure 1. In this mode, the exhaust was diluted with
entrained ambient air in the augmentor tube, and was turbulently mixed in
Lhe tube, blast room, and roof vents. Due to the turbulent mixing, the
exhaust was considered to be well-mixed by the time it reached the rooftop
sample probe, and axial probing of the exhaust was judged to be
unnecessary. Excellent agreement between emission indices obtained at high
power at the exhaust exit nozzle and the rooftop location has confirmed the
validity of this sampling strategy (Reference 2). Therefore, rather than
develop a linear regression of pollutant concentration versus C02
concentration, we used the time-averaged, background-corrected ratio of
pollutant concentration to C02 concentration. The measured species
concentrations were constant over the afterburner test interval, confirming
19

the homogeneity of the exhaust. The equations used to derive emission
indices (in lb/1000 lb fuel) are given below (Reference 8):
2.801 (bcO)
EICO = (MC + n MH) (1 + bCO + bHC) (1)
104
0.10 (bHC)
EIHC = I + bCO + bHC (2)
104
4.601 (bNO)
EINO = (MC + n MH) (1 + bCo + bHC) (3)104
4.601 (bNOx)
EINOx = (Mc + n MH) (I + bCO + bHC) (4)
104
where bz represents the ratio of the time-averaged, background-corrected
concentration of species z to C02, n is the hydrogen to carbon atomic ratio
of the fuel, MC is the atomic weight of carbon, MH is the atomic weight of
hydrogen, and concentrations are in units of percent for C02, ppmC for
hydrocarbons, and ppm for NO, NOx, and CO.
Emission rates in lb/hour were calculated using Equation (5),
ERz = 0.001 (EIz) (Ff) (5)
where ERz and EIz are the emission rate (lb/hr) and emission index (lb/1000
lb fuel) for species z, respectively, and Ff is the total engine fuel flow
rate in lb/hr.
20

SECTION III
RESULTS
A. ENGINE OPERATION
Engine emissions measurements were carried out from June 14 to June 17,
1988, at Tinker AFB in Oklahoma City, OK. The two engines examined during
these tests are listed in Table 3. The environmental conditions and engine
operating variables are given in Tables 4 and 5 for the two engines F110 and
FI01. The data on operating conditions represent the average of two
measurements made at the beginning and end of each 20-minute sampling
period.
TABLE 3. ENGINES USED IN EMISSIONS TESTS
ENGINE SERIAL NO.
F110 509153
F101 470135
B. FUEL ANALYSIS
All emissions tests employed JP-4 fuel from the standard Tinker AFB
commercial supplier. Fuel samples were collected each test day. The fuel
samples were analyzed by vaporizing 1 jAL of fuel into helium in a heated
cylinder (800C) and analyzing a 1 cc sample of the cylinder contents by
capillary column gas chromatography. Table 6 lists the percent composition
of the major organic species identified in the fuel samples. Approximately
60 percent of the mass was identified as specific compounds. A repre-
sentative chromatogram of JP-4 fuel is shown in Figure 6. Compared to JP-4
fuel used for prior emissions tests (References 2 and 3), the relative
abundance of the more volatile species was greater for these fuel samples.
21

.~--~~ O 0 r- nC oC - - c ý 0 0
* u o')o *aQ 4-1 00 .,, r-. Iý r.= Cm * 00-CD r- %.0 -0 ýo
gu1 Pý . O0 Lfl . -4 %.04 ko '0n w -.• E,. J 0 • ." 4 C' q -
CV)4L4- LO ON' * 0ý -4 nC . ~ nc* I C O 43, 0 D0 e ) q
tn V) M O N- 0D t. ('0 mJ " C =;o L")e',, rJ-.,..0 .• 0 J *• 0 * .u 0a *- .- o- . - . . ..mo r--,-4 0 04 e= )
-,,,4 0 040
L.n' ql.r LnLnL Q = OLn r,., Ln U') 00' k,.. c.n.")r,.(..'="n -'W" Co U•U•00 ' C€l .•ý% z€ •ý ,• L r.
-, . -, - , '.,--,-• m,.,•,4 -
V---, I.-: o6 06 4 a. mr en:• CD --I = .n-4 CD C,' )
Lo- ~t~. 0\ I L l -W. u~ r'l'LCD
•L,-
0,,0 L.-D
%4, • " -. (D L F- S' r-.
mZ0M nL (MO~~ (%lCDC1 CO "A( CD0 ' to 0E0n ow 440 43 tr
""--- (.. *,--o 0 : en-• 0 0D
Q," Ll - " ,. C4 1• 0•""
O.•
-- f
(*.3 LfL
(Z.N~0~f- U)fl*
,....s 00~0 *0
(UU
~~~~~~~~~~4 e.a- - ..• w • 4 :l v -• ,
S.-
4- 4.J C . ,-.-- >. 0 1- .6-1
4) r -. - I-,' .U 4,-- M., u• 4.- 0 ',' W.• ~ ~ 4. - •. ,--. 0 4'. = u -•' 41 v•-- .- / e
•J O ' S- e- (A ,, r- S--. 0 0 - (A 0
S-' a) *= 4-Q) 43 E O
c + - X 1.- -0 0 '. d)4o t j'(u .0 .. ai , V - . . 0 -W UC
2:-~ % ra 4) 4) d L- ev 1. - e CVL&
*- c3V c 4--*4-
4 WPC 43 4J.i'i 4 MC 4JCO'------.A
434- 43m=, C-C UMML 0OW .0' .M3 W - 1
(U( - C3.- C '-4- C -Z C M-~..C = EQ.4)= Z tV0L
0- 0 L3 " 43-. 43w.j - -W. < U- = x.- 0ax 3 3 U- 0jc
~ *43'V V 343 43 .4-'V L'4-' CQ22~

wc ,7 R LO L" , q 0 C .L ,. r.- 0C L .LA C r, -. 0 LA r.
r. . - m ko -. D -% 0 V-. " . r-- L• '• 0 00.. .- ' -..
I~ ~ r. a C4 (jaNe D 0 , C00 q -4
a, ,'-<C,• o\ % •¢1.I•- a. 0v• o. • 0
t .o U- 4.J CA
, ,>-m 4m. ccccccn 00-O-u4 k L L O o ý - Ln -W.
C14 en.. \o C -CIr .Clj- a7 MA j0i CO ON r--4 O P. 4* *(
m en %0 , , CD .,M ' .M ,,r-00 r.,
-"-, ... 0 1 L%0 A A , m %7 wr•L m 4 - J-
aý r a 6 C r C-6r.c 6ccc"'4 a- CDJO -- cc 0 a z)DL -
2 U 0\41\ C14 C%4 C14C\- (z (A m C. 0 C-11
o a ao , r •D -
co Ci C) " r•¢ l•Jr %0 .%0r~l, .,c7 D T - .r, •n 0,- C,- k t' - CD >k 0 f
U- .Q L"D
0-
1.0
(D 2= Ln Ln Ln N N0'0 0 LA CD enLi M %J Ln RrJ
2. C- .. 4 O'.-1 a-- l r"•" " I r-- CD
a- 0 * . * *• N. ----- v- ," Q'--t.- I=•"'
--- -.a - - c�C .. ::0 - " a-- -.(A 0 0D m-
0
2 23
LLJ
- -.
LA C a0. (a
~rL L.) -
im I.4fl"" I <D 4
ea ~L. s- -=
(A1 4) CA S.0)LA Lm40J- 0 W)- Q. 0 )
I 4.J 4J Q. (U C. > (A S- 4-' -0) 0 u o 00) m~O r 0) - C CA
4 - .J UJ =- '- .6-1 -C-..-- 0- M
- 0 C 4-J '- 0 4.-h u) Q) 4--- Cu-. +.j E''-
d) S 4J AA -- C( C(A 0 k-A V) ( 0 60.4-J PC C: 4J- (A evJ d C 41 4)L0)c'- C~ L 00 C J- ý-U A C.- - O -- 4A .6
rC-- ea0-- S 0 4-5--' -.- L0O w CM.OLC I. c -4--3: S- 3C .~ )C L
W -C .0 W~' 4-'5.03Lw.C 0. w)0w.aLou m ( w cu =41- *- L. -- o*- M c 0. 0i-
4-JC_ * -'- C C '-%~ 4-"' ( ea
tAJ)"* W ) l C7 C MMW(10C - O0)(AeVW- U- L 4J
'3
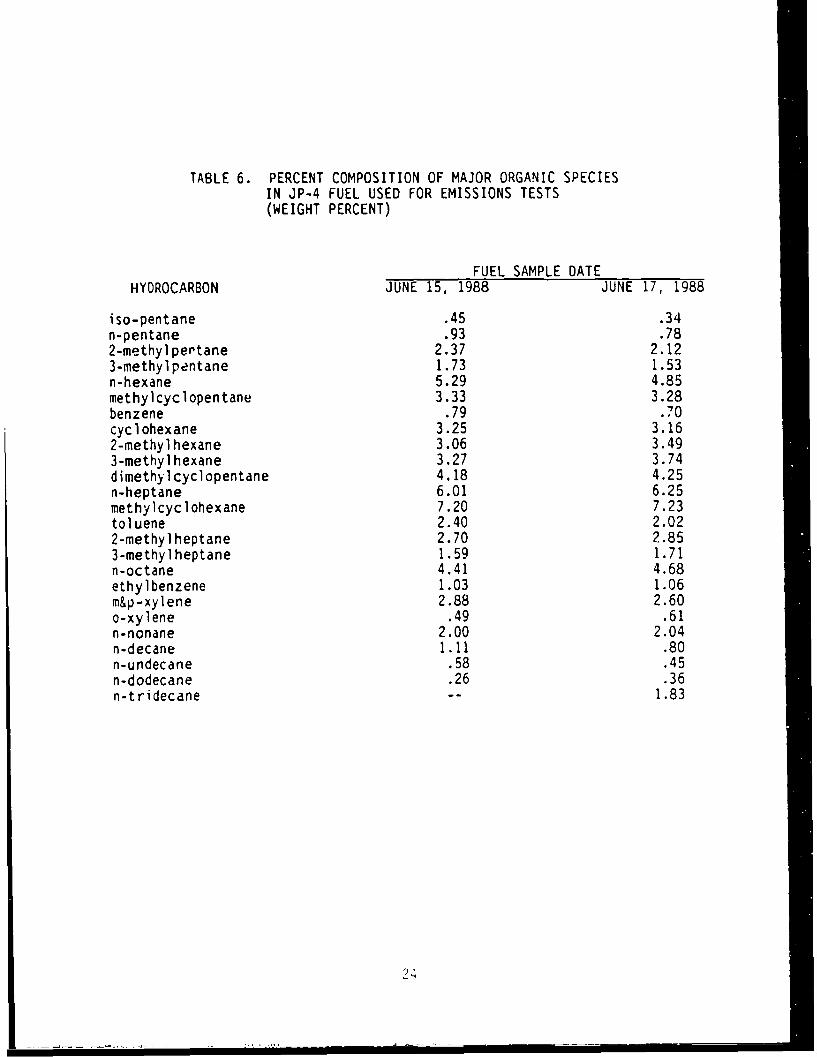
TABLE 6. PERCENT COMPOSITION OF MAJOR ORGANIC SPECIESIN JP-4 FUEL USED FOR EMISSIONS TESTS(WEIGHT PERCENT)
FUEL SAMPLE DATEHYDROCARBON JUNE 15, 1988 JUNE 17, 1988
iso-pentane .45 .34n-pentane .93 .782-methyl pertane 2.37 2.123-methyl pentane 1.73 1.53n-hexane 5.29 4.85methylcyclopentane 3.33 3.28benzene .79 .70cyc 1 ohexane 3.25 3.162-methyl hexane 3.06 3.493-methyl hexane 3.27 3.74dimethylcyclopentane 4.18 4.25n-heptane 6.01 6.25methylcyc l ohexane 7.20 7.23toluene 2.40 2.022-methyl heptane 2.70 2.853-methylheptane 1.59 1.71n-octane 4.41 4.68ethylbenzene 1.03 1.06m&p-xylene 2.88 2.60o-xylene .49 .61n-nonane 2.00 2.04n-decane 1.11 .80n-undecane .58 .45n-dodecane .26 .36n-tridecane -- 1.83
2•4
NC C "C1 aJ C Cc
, 44a, , , a
C~~iJ. 1CCY
(A4A
0 LA0
L.9
c c xx C C
C C to- P-CC jf-
C 4J 44X) * L2 4 J4
I0 C C 4-)
CC 0 X~ 0.0.;j
_ Q4 ';4:'
L..
J4)~.. U [email protected]. - .*c25

C. GASEOUS EMISSIONS
Gaseous emissions were measured at four power settings for each engineby sampling at the exhaust nozzle exit. The nominal power settings used for
the F101 engine were idle, 44 percent, 75 percent, and intermediate (highmach). The F110 tests were run at nominal settings of idle, 30 percent, 63percent, and intermediate (high mach). Emissions measurements also weremade at Stage 1 augmentation (afterburner) power, by sampling the exhaustfrom the roof of the engine test cell (see Figure 1). The exhaust
concentrations of total hydrocarbon, NOx, NO, CO, and C02 are reported in
Table 7.As noted above, the measurements made at Stage 1 augmentation power
were performed at the test cell roof vent, rather than at the exhaust nozzle
exit. The exhaust from these tests, which are noted by an asterisk in Table7, was diluted by entrainment of ambient air in the augmentor tube. As aconsequence, the results from these tests represent engine exhaust which hasbeen diluted significantly. As noted in Section II, these dilute exhaustresults are treated in a special manner to derive emission indices and
emission rates.The gaseous organic species measured in the exhaust from the two
engines are listed in Tables 8 and 9. Concentrations are given in partsper million carbon (ppmC) for all species. Table 8 shows results for the
F110 engine. The results for the F101 engine are shown in Table 9. The
tables list hydrocarbons, oxygenated species, and the distribution ofcompound classes for each engine power setting. As noted above, themeasurements made at afterburner power represent diluted exhaust
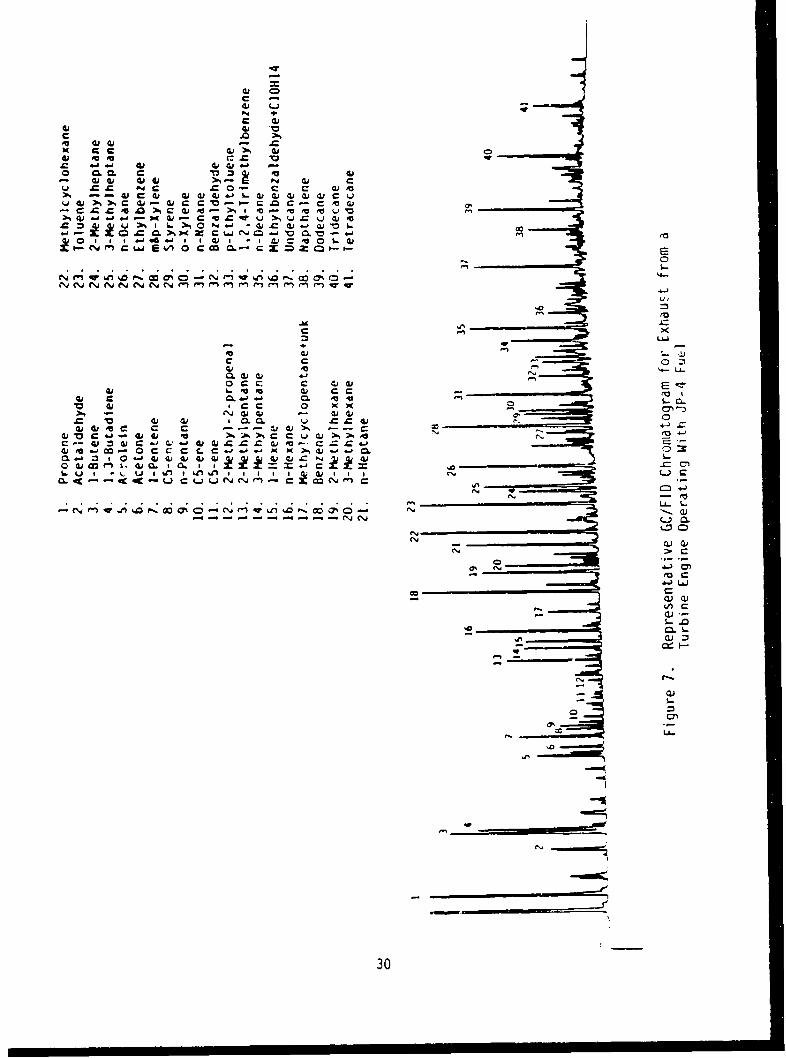
concentrations and should be compared with other power settings with this inmind. Representative chromatograms of the exhaust analysis for hydrocarbon
species and carbonyl species are provided in Figures 7-9.
0. POLYCYCLIC AROMATIC HYDROCARBON EMISSIC'S
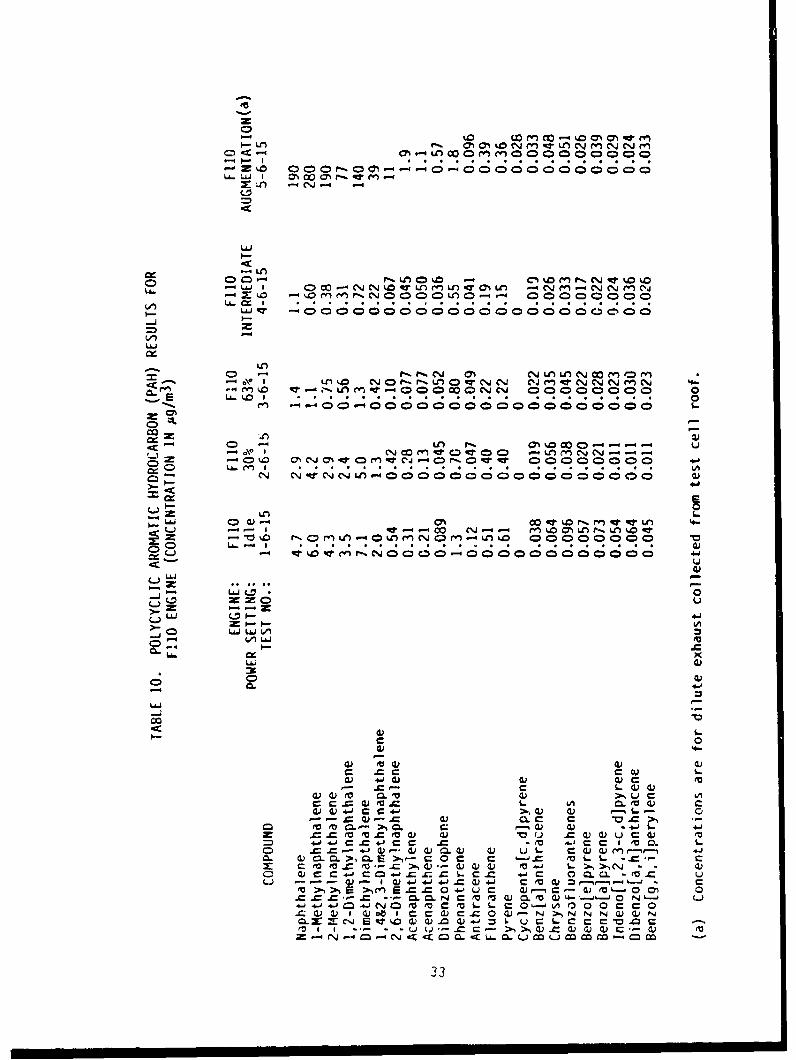
The results of GC-MS analysis of the XAD-2 samples for polycyclic
aromatic hydrocarbons are shown in Tables 10 and 11 for the two engines.All concentrations in Tabies 10 and 11 are in units of ag/m 3 . Extractable
organic mass is listed in Table 12. The XAD-2 sample trap for Test 3-6-17was broken, so no PAH or extractable mass results are reported for this
test.
26

C'IJ LhJ COLr) L rý,-4 c Ln 0004 4 cCD C-) ON CJ .- en 4% .j M *OLn ýrn€_ •. . . . . . . .
(a c. C-- • . ,
LU)LCL0AJ-- LALAAJ\
0 0. -0 N • -) J M 0C%
C) C , 14 -- .- %0 M
x -cnOl -0 C4 -k -C 0. 0- "
0
4d)- C.. ~ r-. 44D LA Ln r-.LAL L r-.
2Z
LJ
LAI LA Ln LA LA-- -4 1-4 -4 -4 -
0I I Is a I g g s g
L-La- .LA-L A- LA- &LL. LA LL. 0.) U
QV LA-~4-J
LA- (v - -W5(4-J.) 4-)- PCC -4-j
ea ~ 4.J t- zV
--- a) J O4 I I0 to
0)r~ C 0 w~ ~ L') cu4j -
a) (1 ' 1 S.- 4- - U cu E 2
27
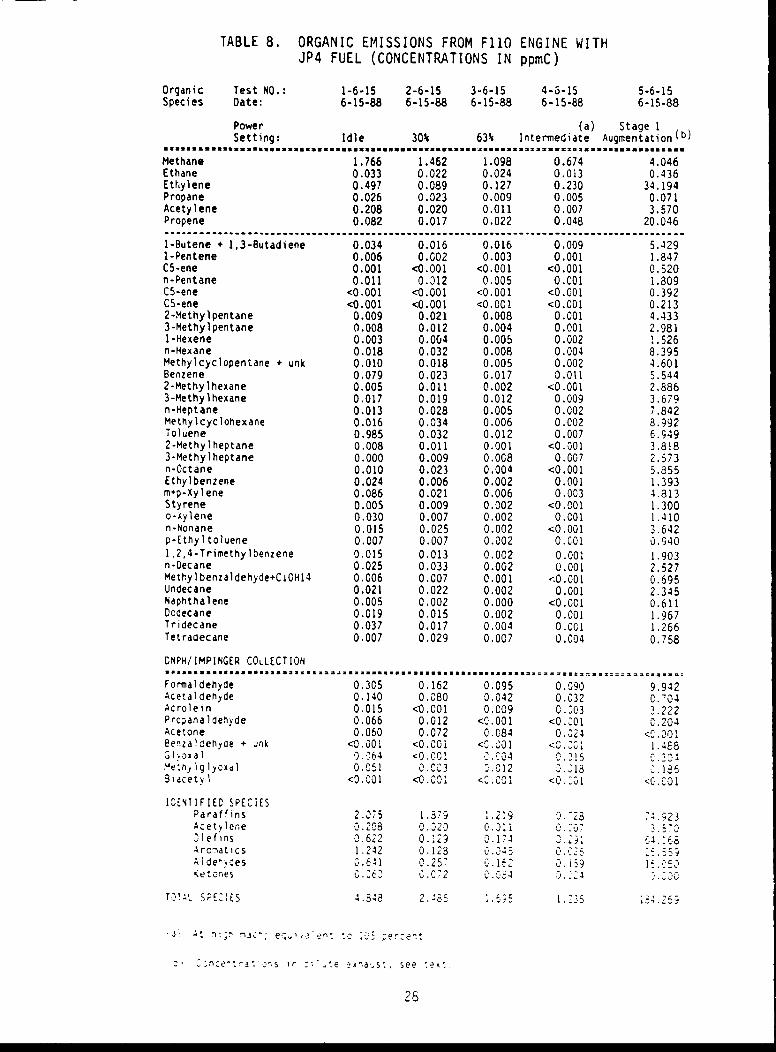
TABLE 8. ORGANIC EMISSIONS FROM FI1O ENGINE WITHJP4 FUEL (CONCENTRATIONS IN ppmC)
Organic Test NO.: 1-6-15 2-6-15 3-6-15 4-6-15 5-6-15Species Date: 6-15-88 6-15-88 6-15-88 6-15-88 6-15-88
Power (a) Stage 1Setting: Idle 30% 63% Intermediate Augmentation(b)
...3s.... ...... on ... man ..........i.....................s.s..ts.........
Methane 1.766 1.462 1.098 0.674 4.046Ethane 0.033 0.022 0.024 0.013 0.436Ethylene 0.497 0.089 0.127 0.230 34.194Propane 0.026 0.023 0.009 0.005 0.071Acetylene 0.208 0.020 0.011 0.007 3.570Propene 0.082 0.017 0.022 0.048 20.046
1-Butene + 1,3-Butadiene 0.034 0.016 0.016 0.009 5.4291-Pentene 0.006 0.002 0.003 0.001 1.847C5-ene 0.001 <0.001 <0.001 <0.001 0.520n-Pentane 0.011 0.312 0.005 0.001 1.809C5-ene <0.001 <0.001 <0.001 <0.001 0.392C5-ene <0.001 <0.001 <0.001 <0.001 0.2132-Methylpentane 0.009 0.021 0.008 0.001 4.4333-Methylpentane 0.008 0.012 0.004 0.001 2.9811-Hexene 0.003 0.004 0.005 0.002 1.526n-Hexane 0.018 0.032 0.008 0.004 8.395Methylcyclopentane + unk 0.010 0.018 0.005 0.002 4.601Benzene 0.079 0.023 0.017 0.011 5.5442-Methylhexane 0.005 0.011 0.002 <0.001 2.8863-Methylhexane 0.017 0.019 0.012 0.009 3.679n-Heptane 0.013 0.028 0.005 0.002 7.842Methylcyclohexane 0.016 0.034 0.006 0.002 8.992Toluene 0.985 0.032 0.012 0.C07 6.9492-Methyiheptane 0.008 0.011 0.001 <0.001 3.8183-Methyiheptane 0.000 0.009 0.008 0.007 2.573n-Octane 0.010 0.023 0.004 <0.001 5.855Ethylbenzene 0.024 0.006 0.002 0.001 1.393m~p-Xylene 0.086 0.021 0.006 0.003 4.313Styrene 0.005 0.009 0.002 <0.001 1.300o-Aylene 0.030 0.007 0.002 0.001 1.410n-Nonane 0.015 0.025 0.002 <0.001 3.642p-Ethyltoluene 0.007 0.007 0.002 O.C01 0.9401,2,4-Trimethylbenzene 0.015 0.013 0,002 0.001 1.903n-Oecane 0.025 0.033 0.002 0.001 2.527Methylbenzaldehyde+CiOH14 0.006 0.007 0.001 <0.001 0.695Undecane 0.021 0.022 0.002 0.001 2.345Naphthalene 0.005 0.002 0.000 <0.001 0.611DOcdecane 0.019 0.015 0.002 0.001 1.967Tridecane 0.037 0.017 0.004 0.CI1 1.266Tetrauecane 0.007 0.029 0.007 0.C04 0.758
CNPH/IMPINGER COLLECTION.l....M....S..........t.aZ. .............................l...h ...lsa S szl....
Formaldehyde 0.305 0.162 0.095 0.090 9.942Acetaldehyde 0.140 0.080 0.042 0.C32 0.704Acrolein 0.015 <0.001 0.009 0.203 3.222Prcpanaldehyde 0.066 0.012 <-.001 <O.2O1 C.204Acetone 0.060 0.072 0.084 0.024 <0.0018enza!dehyde + ink <0.001 <0.001 < 0,01 <0.2-1 1.458Gloxal 0.264 <0.001 0.004 .!'.Ye:riyiglycxdl 0.051 0.CC3 '.012 2.213 2.135Siacetyl <0.001 <0.001 <0.001 <0.C01 <0.0O1
IOENTIFIED SPECIESParaffins 2.-75 1.879 1.219 . -23 ?".923Acetylene 0.2.8 0.320 O.^2 0.007lefins 0.622 0.129 0.174 .3. £4. ;8
Arc.atic$ 1.242 0.123 0.3 5 O.Alde,ý¢es 0.611 0.257 0.152 0.i9 15.050g.etones 0.63 0.072 0.034 3.22 2.20
T3TAL. SPE2IES 4.343 2:35 .555 1.235 i34.259
, n e :ra:' s ir :•'. e , see -e2 t.
28

TABLE 9. ORGANIC EMISSIONS FROM F10 ENGINE WITHJP4 FUEL (CONCENTRATIONS IN ppmC)
Organic Test NO.: 1-6-17 2-6-17 3-6-17 4-6-17 5-6-17Species Date: 6-17-88 6-17-88 6-17-88 6-17-88 6-17-88
Power (a) Stage ISetting: Idle 44% 75% Intermediate AugmentationkC)
........... a . ....UU .............. * ........... GSU.......a.....U..60U .....iwas
Methane 1.865 1.542 1.302 1.231 2.837Ethane 0.042 0.016 0.009 0.011 0.458Ethylene 0.671 0.058 0.078 0.103 13.834Propane 0.023 0.021 0.015 0.014 0.086Acetylene 0.242 0.005 0.003 0.008 2.346Propene 0.172 0.005 0.013 0.019 6.441--------- °-----.-.---..----.----.-------------------.-..-° ---.--....---.-.--...-.---
1-Butene + 1,3-Butadiene 0.012 0.002 0.005 0.049 2.4611-Pentene 0.013 0.001 0.001 0.002 0.858C5-ene 0.001 <0.001 <0.001 <0.001 0.288n-Pentane 0.025 0.005 O.C03 0.005 2.386C5-ene <0.001 0.006 0.002 0.001 0.210C5-ene <0.001 <0.001 <0.001 <0.001 0.1112-Methylpentane 0.039 0.011 0.005 0.009 5.7313-Methylpentane 0.022 0.002 0.003 0.007 3.9831-Hexene 0.009 0.003 0.002 0.002 0.783n-Hexane 0.056 0.005 0.008 0.019 11.518Methylcyclopentane + unk 0.030 0.003 0.005 0.010 6.397Benzene 0.104 0.011 0.007 0.013 3.6432-Methylhexane 0.014 0.001 0.004 0.006 3.9923-Methylhexane 0.026 0.006 0.008 0.017 5.725n-Heptane 0.030 0.006 0.008 0.018 10.901Methylcyclohexane 0.036 0.004 0.008 0.021 14.035Toluene 0.070 0.016 0.009 0.015 6.6562-Methylheptane 0.010 0.003 0.002 0.005 4.2413-Methylheptane 0.008 0.008 0.006 0.012 3.578n-Octane 0.017 0.003 0.007 0.013 8.501Ethylbenzene 0.008 (b) 0.002 0.003 1.893m+p-.Xylene 0.028 0.005 0.005 0.008 5.736Styrene 0.005 0.0)8 0.002 0.004 2.035o-Xylene 0.008 0.006 0.002 0.009 1.671n-Nonane 0.009 0.003 0.004 0.007 5.503p-Ethyltoluene 0.005 0.002 0.002 0.002 1.1601,2,4-Trimethylbenzene 0.007 0.004 0.002 0.003 2.439n-Decane 0.007 0.011 0.003 0.005 3.862Methylbenzaldehyde+CIOH14 0.002 0.003 0.001 0.001 0.960Undecane 0.009 (b) 0.003 0.004 3.255Naphthalene <0.001 (b) <0.001 <0.001 0.349Dodecane 0.004 0.010 0.002 0.003 2.767T.iderane 0.004 0.015 0.002 0.003 1.793Tet.'adecane 0.007 0.010 0.001 0.002 1.008
DNPH/IMPINGER COLLECTION-... ......... =-- ... S - -- ==us=- . ... am fl ... . 2 . s .- ......
Formaldehyde 0.328 0.044 0.044 0.050 6.009Acetaldehyde 0.160 0.040 0.032 0.028 3.036Acrolein 0.006 <0.001 <0.001 <0.001 1.272Propanaldehyde 0.078 <0.001 <0.001 <0.001 1.776Acetone 0.087 0.063 0.054 0.054 0.516Benzaldehyde <0.001 <0.001 <0.001 <0.001 0.546G1yoxal 0.016 0.^04 <0.001 <0.001 <0.001Methylglyoxal 0.012 <0.001 <0.001 <0.001 <0.001Biacetyl 0.008 <0.001 <0.001 <0.001 <0.001
IDENTIFIED SPECIES
Paraffins 2.284 1.685 1.408 1.423 102.556Acetylene 0.242 0.005 0.003 0.008 2.346Olefins 0.878 0.075 0.101 0.176 24.987Aronatics 0.238 0.065 0.031 0.058 26.542Aidenydes 0.608 0.088 0.076 0.078 12.639Ketones 0.087 0.063 0.054 0.054 0.516
TOTAL SPECIES 4.336 1.981 1.673 1.796 169.587
(a) At high mach; equivaieit to 107 percent.
. .ata r.ssinq c•e to sar:1e corta..'at on.
'Ccncertrations in ciute eyhaJSt; see text.
29
N 4.
41 0)
4 4) -j c j4 4
c -- 4 14 a)4 c% N ;) cC
CL >% W o w Cc Q VCL
040,,
ada
IIa
4) '
0CC CL M)
c 4 CC 0 x~ 0 r
C -w- 4)j c 4) C 4).. 41o W ).W .. C w) m - c 4.j''2m. ' cc 0 - 0 CC C C. C - -- 4 .1 x )( >, w).. -S
.4 1 j41Q
-- - - - - - - - - C.. ('j 0
_____________j LL
304

f-
CU 0"(A
ap~gap elzuaqg
xL•J
mC
c
Lo°4-.
E
U' a L'LwV/al•qP (Dl# vu Kn'd •
0aucl~y aLLml" >,,
r,-
LA-
31

'I,
4A
4-
41
L.Ix
U,.
E
CL
ad
c2 SAJ~
. .- . . .
0 (71 -4 -14" --
CK r- Lf)40 k CIN 0 qwUD k0 00 00.u0 -mm n L 70%L ~ s ~
x LýJ MIw r 0 CJ4.' C~'LlOL 0 -4 ~ a - C a C ~C*
L~Ln
L- 0'\ I . N0 '. ~.u 0 N % .'~ NCJ~ . '4... . ..rn C)-0 C=0 MC0000000 CD
0r -l N% OC
cz L0jC 1 - C, w frk %.m OL%.~ --- 4
tI Je -q0 00 u4 m och ')rl n -ý0-vI .. . . . (
LL4J
LAJ (U4)ý
-; c S- cu c 0
W 4) 4- 4C.J 1Q) 4
-v M czJ '0,cl U
M 4.4) 1 e D
CL 0 UC LQ0c r - ui
+J~ 4J4-4ý C VC
N) C ot )a a( -- 6J0 N"4-J 4- 0J ý .S. 0 .J
= 1 u1() *a4 r- c 2)r ra C .CC "a a I a l 2 -j:
4)4I)4-':CC4-' s j() r >-,>4() a)4 4) r - W 0e< <) 0. C < l - Cjwmm
0 ''~o'- o. ~ 4) ) 4~33-

Co LA I % C .
L61. CD 0f0 -'ý C) -c "-)R
= L-.. P S 1 0m 00 0 0 00 0 0 00 0 0 0 L:
C=))
%L -'0 O O 0 O4OCNOO O OLOO 0 e00 0 0m0 0:
U- -4- 1~'so - ~ N 0 L~-. j c)~t0O 0IN 000o c000
LLJJ
LAWLhJi mL
>- a
R 4-J
LLJ1
- VCL ). C ) L
-4) m 4) cu 4)
4) 4-J () cu 4) c
= ) CU CL c 0a- ~ CL r-"4 W W 4-jL 4JI
m v mw a (v a4) a WC4M .-=C -C S-' CC W W V0MM. -> 0 >4) J .O =L 6..J- = f.- .- --a
C: to to M >.C0 a) e CI 4>
4iv C4~ C 4JI N = 4-1 C ~~.~ . 0 0a0 CL C
=C = = G )o = C'- ==N aC M 4- M ~ , N NM 4)4)d N- -N- 4- 4.0 4 4) 4) eu m )- a m .c 0 - " 0. 0 C C * a: .
-CC = <- LA C~-. L C-,).CM)M )4M C- o
34

0O
0)r. Ln r. to 0D 00 0
E 0* 0. 0w 00 to 0 0 r 0 en
(-)
0~
LAJ 0% co 0% 0N 07% Ln 1- MLe) VDC 00 m (n ts. m. 0 Lf
- CJ C\j '-4 en rn -4 (7 r'%LA.J -32 en en qr q~ 0
a- ~ 0
C) w
-i
0
4c =
La~ C.D LA
9-439
Lic LA V) Ln to Ln r.. r.% r. C~fLý ~ 4 -4 - -4 - .4 -4 -4 .
00 1 1 aa
CJ m 4w LA -4 CN. rn LA
4-J 0
.'- 4 -J -
-(D 4= C a C
U- LA U. * U - LA. U- La *- U. en
353
E. PARTICLE EMISSIONS
Several procedures were employed in an attempt to gather information on
the particulate emissions from turbine engines. The procedures include
determination of smoke number, gravimetric determination of mass loading,
and size distribution measurements by two different techniques. The results
from these measurements are described below.
1. Smoke Emissions
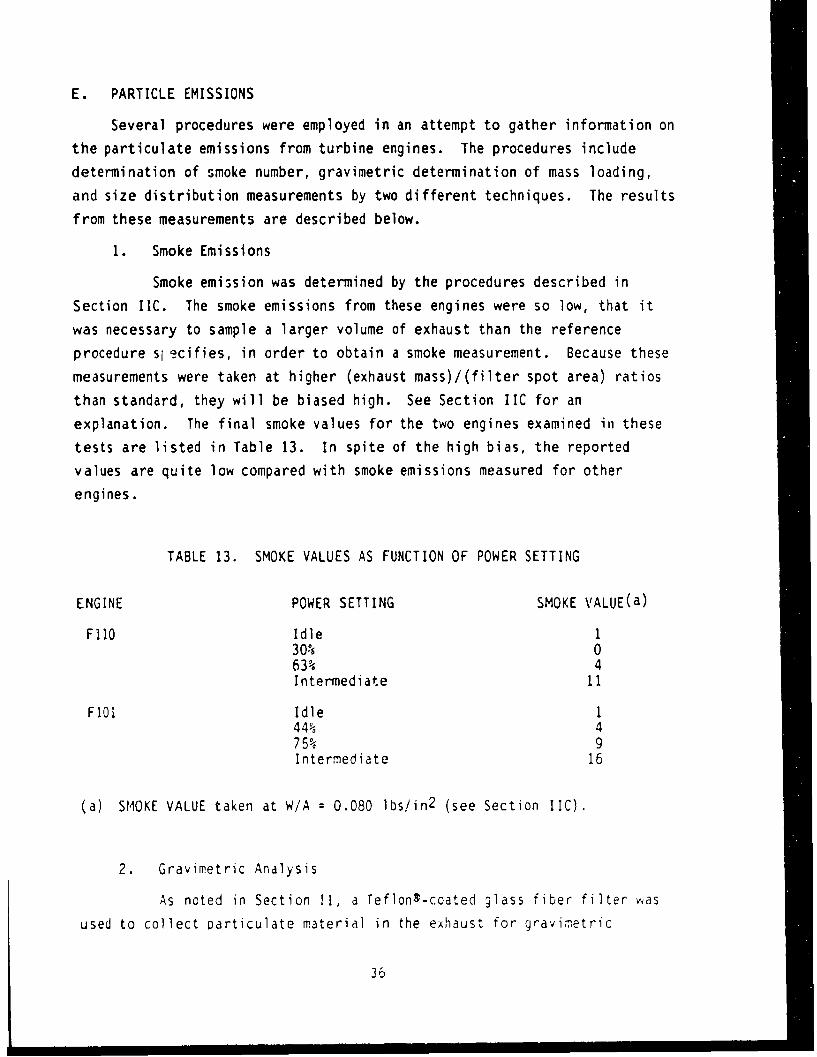
Smoke emission was determined by the procedures described in
Section IIC. The smoke emissions from these engines were so low, that it
was necessary to sample a larger volume of exhaust than the reference
procedure si ecifies, in order to obtain a smoke measurement. Because these
measurements were taken at higher (exhaust mass)/(filter spot area) ratios
than standard, they will be biased high. See Section IIC for an
explanation. The final smoke values for the two engines examined in these
tests are listed in Table 13. In spite of the high bias, the reportedvalues are quite low compared with smoke emissions measured for other
engines.
TABLE 13. SMOKE VALUES AS FUNCTION OF POWER SETTING
ENGINE POWER SETTING SMOKE VALUE(a)
F110 Idle 130% 063% 4Intermediate 11
FI01 Idle 144% 475% 9Intermediate 16
(a) SMOKE VALUE taken at W/A = 0.080 lbs/in 2 (see Section IIC).
2. Gravimetric Analysis
As noted in Section II, a Teflong-coated glass fiber filter vas
used to collect Darticulate material in the exhaust for gravimetric
36

analysis. The filter and filter holder were maintained at 150*C during
sampling. After each test, the filter was removed from the holder, sealed,
and transported to the laboratory for equilibration and weighing. The
filter masses were corrected to account for the mass change of handled blank
filters. These blanks were handled in the same manner as the samples,
including heating for 45 minutes at 150 0C in the stainless steel filter
holder, but without exhaust flow through the filter. The results from the
gravimetric analysis of the filters are shown in Table 14. The particle
mass concentrations in Table 14 are all below the detection limit. The very
low particle mass emissions in Table 14 are consistent with the low smoke
numbers reported above, and confirm the cleanliness of these engines in
terms of particle emissions.
TABLE 14. PARTICLE MASS EMISSIONS
PARTICULATE MASSPOWER EXHAUST CONCENTRATION,
ENGINE SETTING TEST NO. VOLUME a), m3 mg/m3
FIIO Idle 1-6-15 1.39 <0.4F110 30% 2-6-15 1.05 <0.4F110 63% 3-6-15 1.05 <0.4F110 Intermediate 4-6-15 1.41 <0.4
F101 Idle 1-6-17 0.51 <1F101 30% 2-6-17 0.49 <0.4FI01 75% 3-6-17 1.05 <0.4F101 100% 4-6-17 0.64 <0.4
(a) Corrected to NTP.
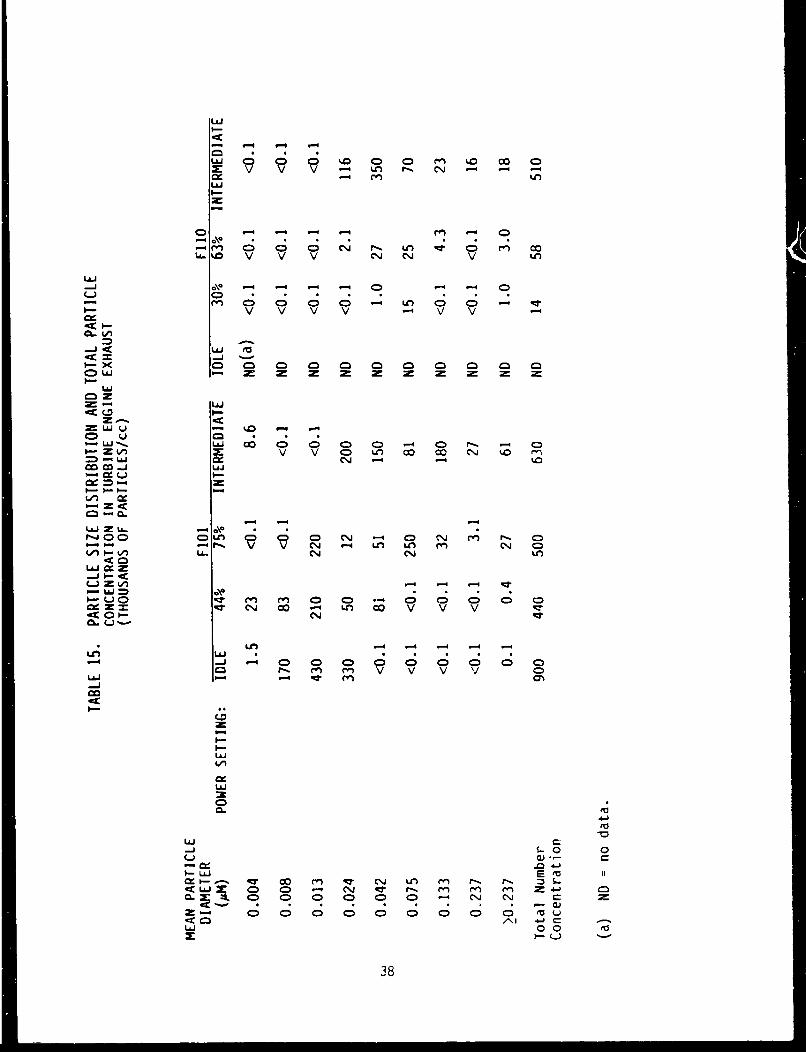
3. Particle Concentration and Size Distribution
Information on particle concentrations and size distributions in
the exhaust from the test engines was obtained using the dilution apparatus,
diffusion battery, and condensation nucleus counter noted earlier in Section
II. The results from these measurements are presented in Table 15. The
table shows particle concentration (in thousands of particles per cubic
centimeter of air) in eight size ranges. Also listed are the total particle
37
LUJ
I--
I-
0 -ý c- -ý 'n C
l- 4A -
ccU - jZ ~
LLLU
-2L= - LU 0 0 - 0 ?
Lbi U
I- u- -
r14 C)C Cj r
C-4 --4 n nC
L00 0x 2m 4 0 ~ -- I.- <, ( NC -) U, V). mr %JU
Z, -O 4 -4 -4 - ::
Le; LUJ
Cl t- D (D V V V
I-
co4
LUJ
LU
4-)
t-O 0
CT.-
0r 00 0n 0T 01 0n 0n m
LU 0 0 toz 3-C..)
38

concentration and the concentration of particles of mean diameter greater
than 0.237 Am. These data are shown for each engine and power setting. The
total number count is an observed value, whereas the size distributions are
based on a model fit to the data. For this reason, the sum of the
concentrations at the different particle sizes does not exactly correspond
to the total number concentration listed in the table.
The final technique used for particle collection was an electro-
static sampler. As described in Section II, the electrostitic sampler
collects particles on a substrate, which is then analyzed by scanning
electron microscopy (SEM). The electrostatic sampler was used to determinewhether particles larger than the upper limit of size discrimination
capability of the diffusion battery/CNC were present. For the system used
in this study, particles larger than 0.24 jm are counted, but no sizeinformation is determined. The electrostatic sampler was used to collect
particles from the undiluted exhaust. These samples were returned to thelaboratory and analyzed by SEM, initially at magnifications from 1000X to
2000X. The SEM analysis revealed that only a very few particles werevisible at this magnification. This confirms the DB/CNC results from Table
15, which indicate that there are relatively small numbers of particles of
diameter greater than 0.24 Am.
39

SECTION IV
OBSERVATIONS
A. CARBON BALANCE
An important aspect of this project is the accountability of organic
species in turbine engine exhaust. Until recently, less than 40 percent of
the organic emissions from turbine engines has been accounted for. However,
a recent study which employed multiple sampling and analysis techniques was
able to account for 98 * 10 percent of the total organic emissions
(Reference 1). In the current study, emission measurements were made on the
Fi1O and F10 engines. These engines were operated with JP-4 fuel at five
power settings from idle through Stage 1 augmentation (afterburner).
The normal method of accountability for orgai;ic species in turbine
engine exhaust involves carrying out a carbon balance. Ideally, the carbon
balance is defined as the ratio of the sum of all individual organic species
measured in the exhaust to the total organic carbon concentration measired
by a total carbon monitoring system. In this study, the total organic
carbon instrument, a Beckman 402 Analyzer, employs a flame-ionization
detector (FID) to continuously measure the sum of organic species
concentration. This monitor is essentialy a carbon-counting instrument;
however, it does not respond to oxygenated carbon. Because of this,
formaldehyde is not detected, only one of the two acetaldehyde carbons is
counted, etc. To compare the species sum with the total FID response, the
species sum must be adjusted to eliminate contributions from oxygenated
carbon.
The carbon balances achieved for' the engines and test conditions in the
current study are summarized in Table 16. The species data have been
corrected for oxygenated compound response as described above and in earlier
reports (References 1 and 2). As noted in the table, the response of the
continuous total organic monitor becomes rather uncertain at concentrations
less than dbout 10 ppmC, due to zero and span drift. As a consequence, the
carbon balance at exhaust concentrations less than 10 ppmC is highly
40
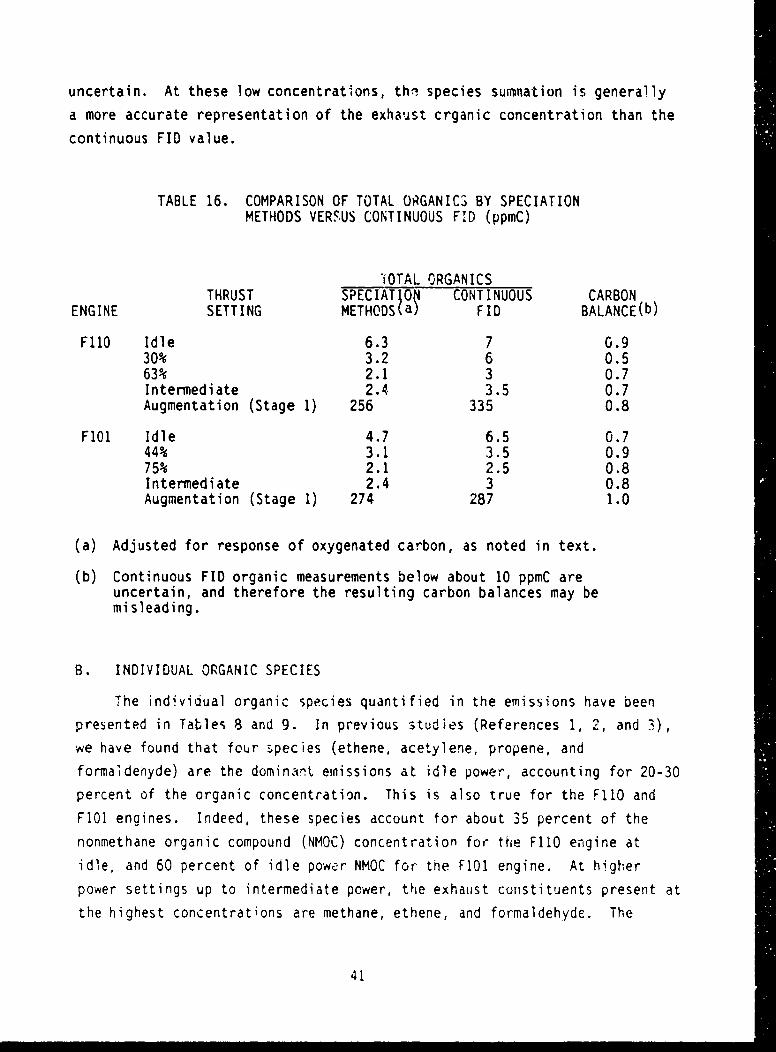
uncertain. At these low concentrations, thi species surmnation is generally
a more accurate representation of the exhaust crganic concentration than the
continuous FID value.
TABLE 16. COMPARISON OF TOTAL ORGANICS BY SPECIATIONMETHODS VERSUS CONTINUOUS FID (ppmC)
"iOTAL ORGANICSTHRUST SPECIATJO CONTINUOUS CARBON
ENGINE SETTING METHODS a) FID BALANCE(b)
FI1O Idle 6.3 7 0.930% 3.2 6 0.563% 2.1 3 0.7Intermediate 2.4 3.5 0.7Augmentation (Stage 1) 256 335 0.8
F101 Idle 4.7 6.5 0.744% 3.1 3.5 0.975% 2.1 2.5 0.8Intermediate 2.4 3 0.8Augmentation (Stage 1) 274 287 1.0
(a) Adjusted for response of oxygenated carbon, as noted in text.
(b) Continuous FID organic measurements below about 10 ppmC areuncertain, and therefore the resulting carbon balances may bemisleading.
B. INDIVIDUAL ORGANIC SPECIES
The individual organic species quantified in the emissions have been
presented in Tables 8 and 9. In previous studies (References 1, 2, and 3),
we have found that four species (ethene, acetylene, propene, and
formaldenyde) are the dominant emissions at idle power, accounting for 20-30
percent of the organic concentration. This is also true for the FiIO and
F10 engines. Indeed, these species account for about 35 percent of the
nonmethane organic compound (NMOC) concentration for the FiIO engine at
idle, and 60 percent of idle power NMOC for the F101 engine. At higher
power settings up to intermediate power, the exhaust constituents present at
the highest concentrations are methane, ethene, and formaldehyde. The
41

emissions pattern under augmented power was different for the two engines.
A substantial fraction of the organic emissions at Stage I augmentation was
unburned fuel hydrocarbon for the F101 engine. On the other hand, the
augmented power emissions from the F110 engine had a much higher
contribution of combustion cracking products and products of incomplete
combustion.
Examination of the data in Tables 8 and 9 reveal that the organic
emissions are reduced as the engine power is increased from idle to
intermediate power. The organic emissions increase substantially when the
engines are operated in the augmented power (afterburner) mode. Exhaust
organic concentrations for these two engines are much lower than for other
engines we have tested (References 1, 2, and 3).
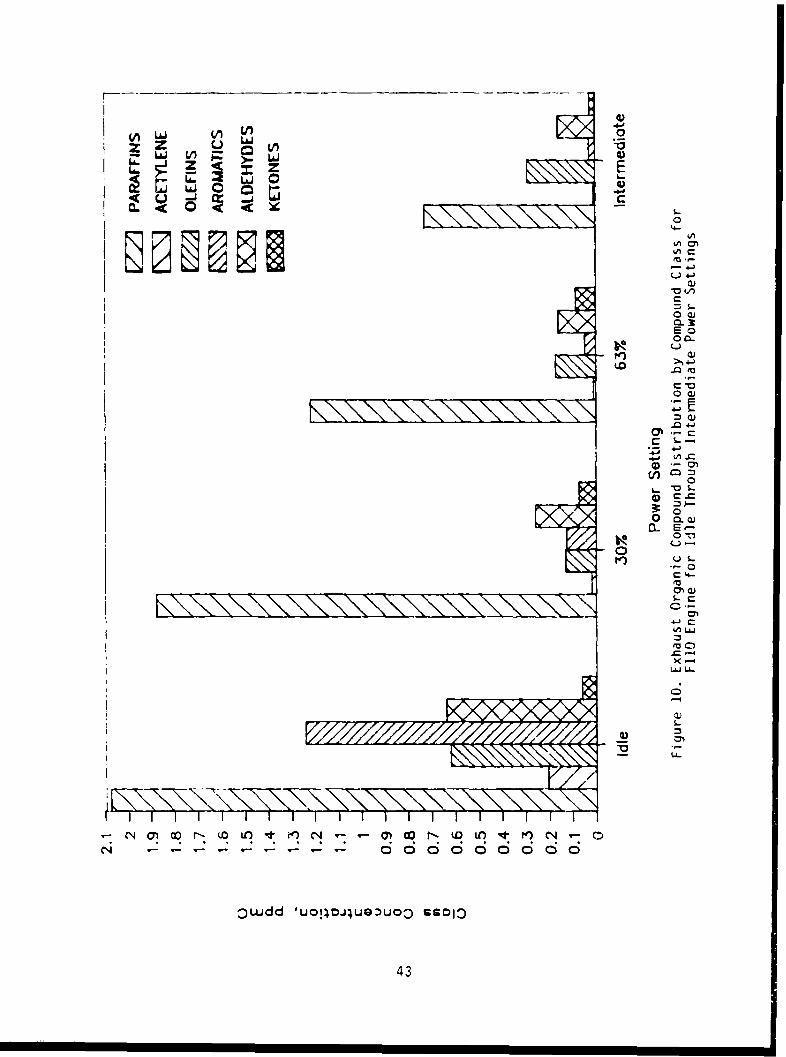
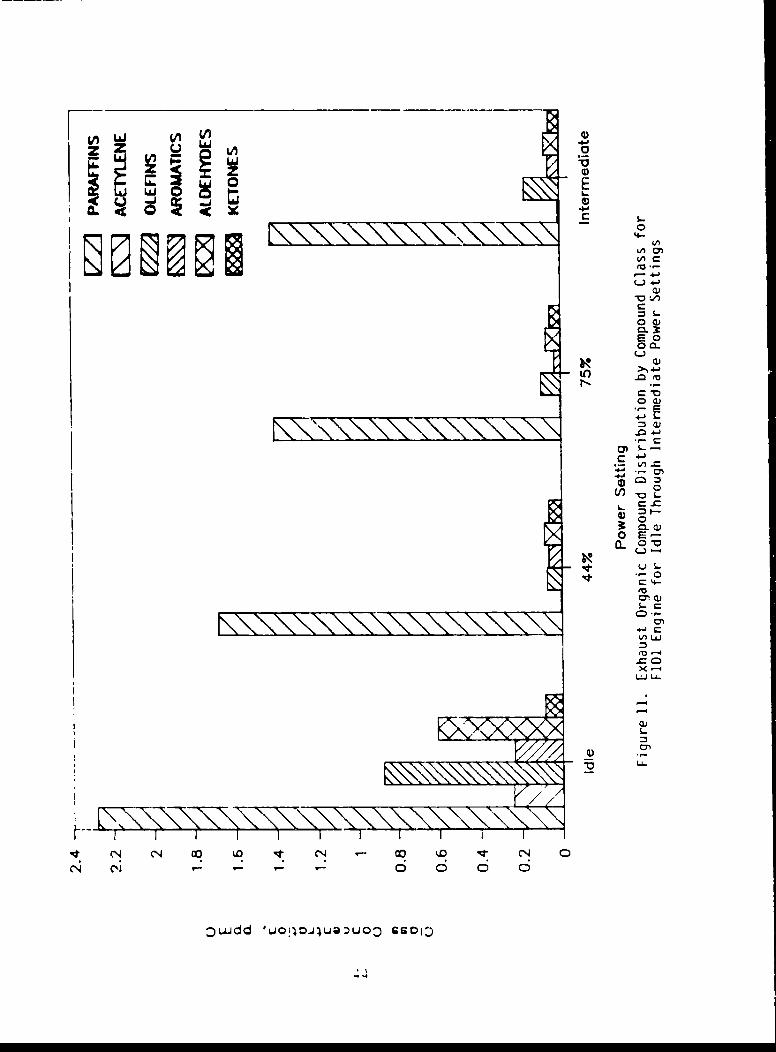
C. DISTRIBUTION OF EMISSIONS BY COMPOUND CLASS
The bottom portions of Tables 8 and 9 show the exhaust organic
distribution according to major compound classes for each of the engines
tested. This distribution is based only on identified compounds. The most
significant compound classes are paraffins, olefins, aromatics, and
aldehydes, with the relative contribution of these classes varying with
power level. The distribution of organic emissions by compound class and
for power settings from idle to intermediate is shown in Figure 10 for the
F110 engine and in Figure 11 for the F101 engine. Compound class emissions
for augmented power are shown for both engines in Figure 12.
D. DISTRIBUTION OF EMISSIONS BY CARBON NUMBER
The distribution of emissions by volatility is important because these
data most clearly distinguish the cracking and partial oxidation products
from the unburned fuel. The carbon number distributions for each of the
engines tested are presented in Table 17. The results are plotted in
Figures 13, 14, and 15.
E. EMISSION FACTORS
1. Nitrogen Oxide Emissions
The nitrogen oxide emissions from the F11O and F101 engines are
shown in Table 18. Also shown in this table is the ratio of N02 to NOx.
The emissions of N02 are of concern because it is a Criteria Pollutant,
regulated by the U.S. Environmental Protection Agency. The federal ambient
42
50..
~~LA
IO
z S
o a
C
'Ln
(D
V) lM
.0+
4-4Cý
43'4
S ij Vi-4LAJ 0
0 E
iL
S4-.
o 1)
ow
$+- LM
EllO o4-J
0(D)
C -)
ow
.- E
44)
C. 0 "
I.-0
:)wdd •uioju:u: r.-
444-.o.-
-:4..

LAJz
0U- bi
(aLa.M
S--
0 0) 4--o
t- )
E "
o -"
s n
4- r- e
r-C CL S
o 4
E,\ ,c cu
0 0 0 0 0 0 01.I..00
LA- 4-)
•~~~~~V -u W 1 • - • u) • t -5..
X _--4
0~~~ 0 00 )0 C
Lo 4-

i~e 0 e 0000
~-J0000N 0000C.zs
I- 0 00 ee00'
~CD
co 0
I0) 0OOC 000
pLU
ZLLJ CD0 0 0 r
LL.000CM. 1000A
CD z
00.....-00-
44A
LA-,
-L&J 6 6..46Y C; CQ 2
C-DC6 Cý '
Q)
wU O ooc if p W-
46-

T77 ui
o ,.- -
z z
9- 9-.-- -
0 >1
.0
x
r/77l
I-I
W
Iop k,_4
[~~~~ 7Z/2////!////XZ:.7 S•- .
C u.dd ' uol;O.juo) uo3
47
i I I I I I I I I C

U,)
L i LI 0.)z zLL.- LL
0 0
4.)
9.o
q-- I--I-
L.
CD
0.01.
00e-0
~ E4-z- 1-" 0
-- rO CC 0
r~ 0V././// •.2IN\0
V. j/-!_i./j~i//i oS1 l 1 l 1 I 1 I i0• - , -6 o d o 6 d 0
3uJ• 'uoIoJ~•0uo
a0.

'-.-
K44Z7477777Z 0 -
co E ,. 0 w= 0
I ., u..
r/7///7///C
CJ
0.00m
.ý 0 5.-
oc a)-
Z o Lt4-'ýt
7/Z c Cm4 0
en ru-a to
X X
FIZo '*'814-4-1
Lx \\ 1
-IC)
Uo 0)
I IiI V I."
:)udd 'uop!juQ:uo:
49
"F . . . .II • I III

air standard currently is based on annual average concentration. California
has enacted a short-term N02 standard and has expressed concern over N02
emissions from engine test cells due to visibility impairment.
The data in Table 18 show that the concentrations of both NO and
NOx increase with power setting from idle to intermediate power. The data
for afterburner power were taken at the test cell rooftop, where the exhaust
stream has been diluted with entrained ambient air. Therefore, the
concentrations of NO and NOx are lower for the afterburner power settings
than for intermediate power. However, even though the exhaust sampled at
afterburner power has been diluted, it still yields the highest N02
concentration for both engines. The final column of Table 18 shows the
N02/NOx ratio, which decreases as power increases up to full intermediate
power, and then increases abruptly at augmented power. This same phenomenon
was observed during tests with TF30-P103 and TF30-P109 engines
(Reference 2). One mechanism of N02 formation in engine exhaust is
oxidation of NO by peroxy radicals. The concentration of peroxy radicals is
expected to be enhanced in fuel-rich combustion, where organic species are
available for peroxy radical formation. Table 7 shows that organic
emissions are much higher under augmented power than at any other power
setting. This may account for the higher ratio of N02/NOx at afterburner
power, and at idle.
2. Fuel/Air Ratios
During the engine tests, fuel flow and air flow to the engines
were monitored. These data were reported in Tables 4 and 5, together with
the fuel/air ratios for each test. Two fuel/air ratios are reported in the
tables, one based on ambient conditions and the other corrected to "standard
day" conditions. For comparison data, we will use the corrected fuel/air
ratios to be consistent with our earlier reports (References 1, 2, and 3).
The measured fuel/air ratios from Tables 4 and 5 are compared with ratios
derived from exhaust composition data in Table 19. Ratios derived from
composition data are reported as F/A (Calculated) in Table 19. There isgreater deviation between the measured and calculated ratios than we have
observed in our previous engine emissions studies. The calculated ratio is
higher than the measured ratio for all tests but one. The deviation in
calculated and measured ratios ranges from 2 percent low to 35 percent high.
50

TABLE 18. NOx EMISSION DATA
POWER MODE RUN NO. NOx, ppm NO, ppm N02, ppm N02/NOx
Engine F110 (S/N 509153)
Idle 1-6-15 13.8 11.2 2.6 0.1930% 2-6-15 30.0 28.0 2.0 0.0763% 3-6-15 97.0 92.0 5.0 0.05I ntermedi ate 4-6-15 243.0 227.0 16.0 0.07Au mentation
MStage 1)(a) 5-6-15 21.5(a) 3.7(a) 17.8(a) 0.83(a)
Engine F101 (S/N 470135)
Idle 1-6-17 6.9 5.0 1.9 0.2844% 2-6-17 28.5 25.5 3.0 0.1175% 3-6-17 68.0 62.0 6.0 0.09Intermedi ate 4-6-17 140.0 133.0 7.0 0.05Augment at i o
mStage 1)7a) 5-6-17 21.8(a) 7.2(a) 14.6(a) 0.67(a)
(a) Afterburner measurements made on dilute exhaust.
TABLE 19. FUEL/AIR RATIOS
POWER MODE RUN NO. F/A (MEASURED) F/A (CALCULATED)
Engine F10 (S/N 509153)
Idle 1-6-15 0.003541 0.00464330% 2-6-15 0.005412 0.00591263% 3-6-15 0.008257 0.01116I ntermedi ate 4-6-15 0.01138 0.01504
Engine F101 (S/N 470135)
Idle 1-6-17 0.002342 0.00230844% 2-6-17 0.004386 0.00460575% 3-6-17 0.005977 0.007200Intermediate 4-6-17 0.007833 0.009591
51
On average, the ratios calculated from exhaust composition are 19 percent
higher than measured fuel/air ratios. Differences in the measured and
calculated fuel/air ratios could be due to nonrepresentative exhaust
sampling, but nonrepresentative sampling with the 12-port sampling rake used
in this study would most likely involve sampling of ambient air at the outer
edges of the exhaust plume, and this would result in a calculated F/A which
was too low, not too high as observed here. The other possibility for
deviation relates to measurement error or uncertainty in the fuel flows, air
flows, or exhaust composition results. We have reexamined all of these data
and the corresponding calibrations, and have found no reason to invalidate
any of the results. Consequently, we can not explain the observed
differences between the measured and calculated fuel/air ratios. The
measured air flow is very sensitive to small errors in pressure measurement,
where a 0.1 psia error in pressure measurement can cause a 16 percent error
in measured F/A at idle power. It is possible that drift of the output
signal from the pressure transducer could be contributing to the F/A ratio
discrepancies, but we have no evidence to support this or other alternative
explanations.
3. Emission Indices
The emission index, in pounds per thousand pounds of fuel, has
been calculated for CO, CuZ, total hydrocarbon, NO, N02, and NOx for power
levels from idle to intermediate. The emission index has also been
determined under augmented power for CO, NO, NOx, and total hydrocarbons.
The calculation procedures were noted in Section II. The emission indices
for the two engines at each power setting are given in Table 20. As noted
in the table, all oxidized nitrogen species were calculated using the
molecular weight of N02, in accordance with the convention employed in such
calculations. The emission indices show that emissions of CO and
hydrocarbons per thousand pounds of fuel decrease as power is increased from
idle to intermediate. Both increase substantially with augmented power.
Emission indices for NO and NOx increase with increasing power from idle tointermediate. The emissions index for N02 shows no clear trend with engine
power. The C02 emission index for the Fi1O engine shows little trend with
power setting, while the index for the F101 increases with power level.
52
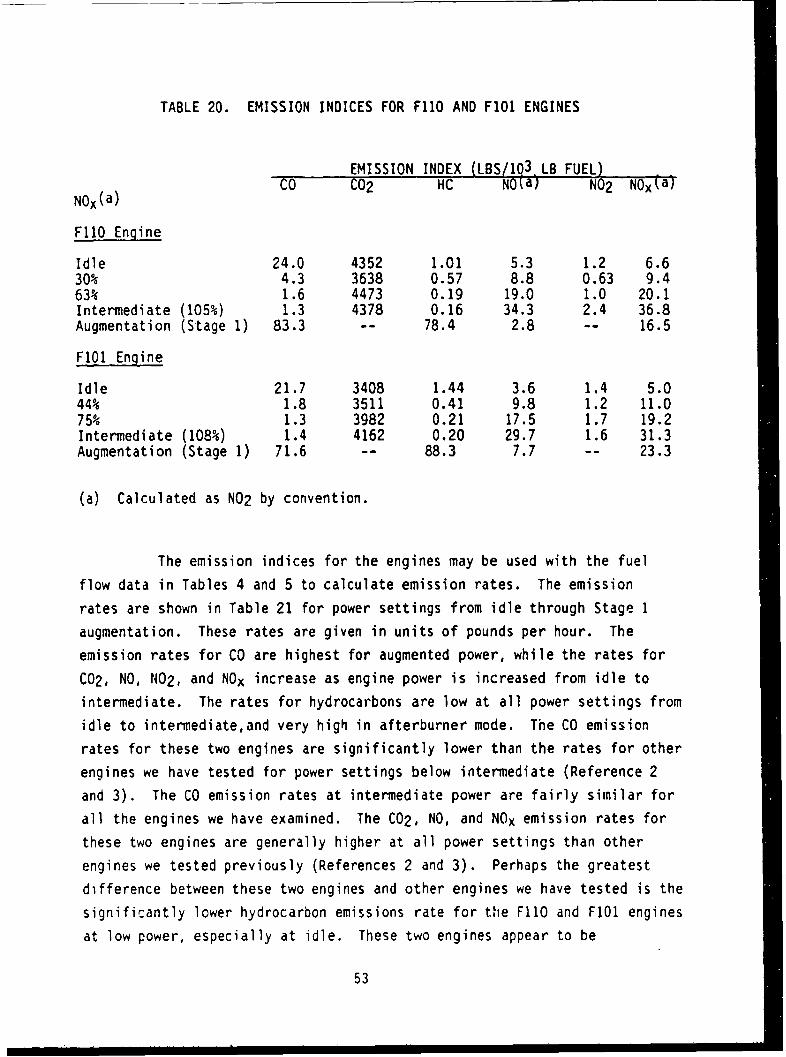
TABLE 20. EMISSION INDICES FOR F110 AND F10 ENGINES
EMISSION INDEX (LBS/i3. LB FUEL)CO C02 HC NOka) N02 NOxý%a)N0x(a)
FIlO Engine
Idle 24.0 4352 1.01 5.3 1.2 6.630% 4.3 3638 0.57 8.8 0.63 9.463% 1.6 4473 0.19 19.0 1.0 20.1Intermediate (105%) 1.3 4378 0.16 34.3 2.4 36.8Augmentation (Stage 1) 83.3 -- 78.4 2.8 -- 16.5
F101 Engine
Idle 21.7 3408 1.44 3.6 1.4 5.044% 1.8 3511 0.41 9.8 1.2 11.075% 1.3 3982 0.21 17.5 1.7 19.2Intermediate (108%) 1.4 4162 0.20 29.7 1.6 31.3Augmentation (Stage 1) 71.6 -- 88.3 7.7 -- 23.3
(a) Calculated as N02 by convention.
The emission indices for the engines may be used with the fuel
flow data in Tables 4 and 5 to calculate emission rates. The emission
rates are shown in Table 21 for power settings from idle through Stage I
augmentation. These rates are given in units of pounds per hour. The
emission rates for CO are highest for augmented power, while the rates for
C02, NO, N02, and NOx increase as engine power is increased from idle to
intermediate. The rates for hydrocarbons are low at all power settings from
idle to intermediate,and very high in afterburner mode. The CO emission
rates for these two engines are significantly lower than the rates for other
engines we have tested for power settings below intermediate (Reference 2
and 3). The CO emission rates at intermediate power are fairly similar for
all the engines we have examined. The C02, NO, and NOx emission rates for
these two engines are generally higher at all power settings than other
engines we tested previously (References 2 and 3). Perhaps the greatest
difference between these two engines and other engines we have tested is the
significantly lower hydrocarbon emissions rate for the FI1O and F101 engines
at low power, especially at idle. These two engines appear to be
53

substantially more efficient at fuel combustion at low power than engines
tested earlier. However, they are significant organic emitters under
Stage 1 augmented power. The sampling strategy and data reduction
methodology employed for the afterburner emissions were tested in an earlier
study (Reference 2), and the results confirmed the utility of this approach.
TABLE 21. EMISSION RATES FOR F110 AND F101 ENGINES
EMISSION RATES (LB/HR)CO C02 (x 103) HC NOta) N02 NOx(a)
F110 Engine
Idle 25.4 4.6 1.1 5.6 1.3 7.030% 10.5 9.0 1.4 21.7 1.6 2363% 8.7 24.7 1.0 105 5.7 111Intermediate (105%) 13.1 43.6 1.6 342 24 366Augmentation (Stage 1) 1289 -- 1213 43.3 -- 255
F101 Engine
Idle 22.0 3.4 1.5 3.7 1.4 5.144% 6.6 12.7 1.5 35.3 4.2 4075% 8.4 25.2 1.4 111 6.1 122Intermediate (108%) 13.4 38.6 1.9 275 14 290Augmentation (Stage 1) 1009 -- 1244 108 -- 328
(a) Calculated as N02 by convention.
Care should be exercised in comparing the various engines we have
tested, because the engines are not all rated at the same maximum thrust, so
the same "power setting" will produce different thrust for each engine.
These power output differences should be considered in comparing emissions
among engines.
F. RELATIVE EMISSIONS OF TOXIC CHEMICALS
Numerous methods are available to present data on emissions from a
source. From jet engines, the emissions can be reported as concentrations,
emission indices (g/kg fuel), emission rates (g/hr), mass per unit thrust,
and so forth. Because different uses of the data require different
54
presentations, our approach has been to list the data in concentration
units, and include all the ancillary information needed to calculate the
results in whatever form the user may require.
To provide some general perspective on emission levels of chemicals of
toxicological significance, the emissions from these engines were compared
with those from other combustion sources for selected chemicals. These
comparisons were made on the basis of pollutant mass per mass of fuel
consumed, or undiluted exhaust concentration. Other applicaticns mayrequire comparisons on the basis of thrust, miles traveled, unit time, etc.
The emissions for benzene and benzo(a)pyrene were calculated by multiplying
the weight percent of the constituent in the exhaust by the total organic
emissions index from Table 20. This yields emissions in mass per mass of
fuel consumed. The weight percent values were derived from the pollutant
concentrations (in ppmC) and the total organic emissions (in ppmC). The
data in Tables 8 and 9 were used for these calculations. The total species
summations in Table 17 were used to determine weight percentage, because
these values are consi 4 ered to be more accurate at the higher power settings
than the total hydroc rbon values reported in Table 7.
1. Benzene
Benzene is an environmentally significant compound because it is
known to cause leukemia in workers exposed to relatively high levels. The
current workplace standard for this chemical is set at 10 ppm (60 ppmC),
although this standard is controversial and has been set as low as 1 ppm (6
ppmC) in the recent past. Benzene's route of entry into the body is
primarily by inhalation of the gas. Benzene is poorly absorbed through
unbroken skin. Other routes include ingestion and eye contact. Acute
exposure can lead to headache, dizziness, causea, convulsions, coma, and
death in extreme cases. Chronic exposure causes changes in the blood,
including aplastic anemia, anemia, leukopenia, and thrombocytopenia. There
is strong evidence that benzene causes acute myelogenous leukemia
(Reference 9).
Emission levels of benzene from the two study engines were 79 ppbC
for the FIlO and 104 ppbC for the F101 in the undiluted exh3ust at idle
power (where exposure of flight line personnel is maximum). These exhaust
concentrations are one to two orders of magnitude lower than benzene
concentrations in the exhaust from other engines we have examined
55
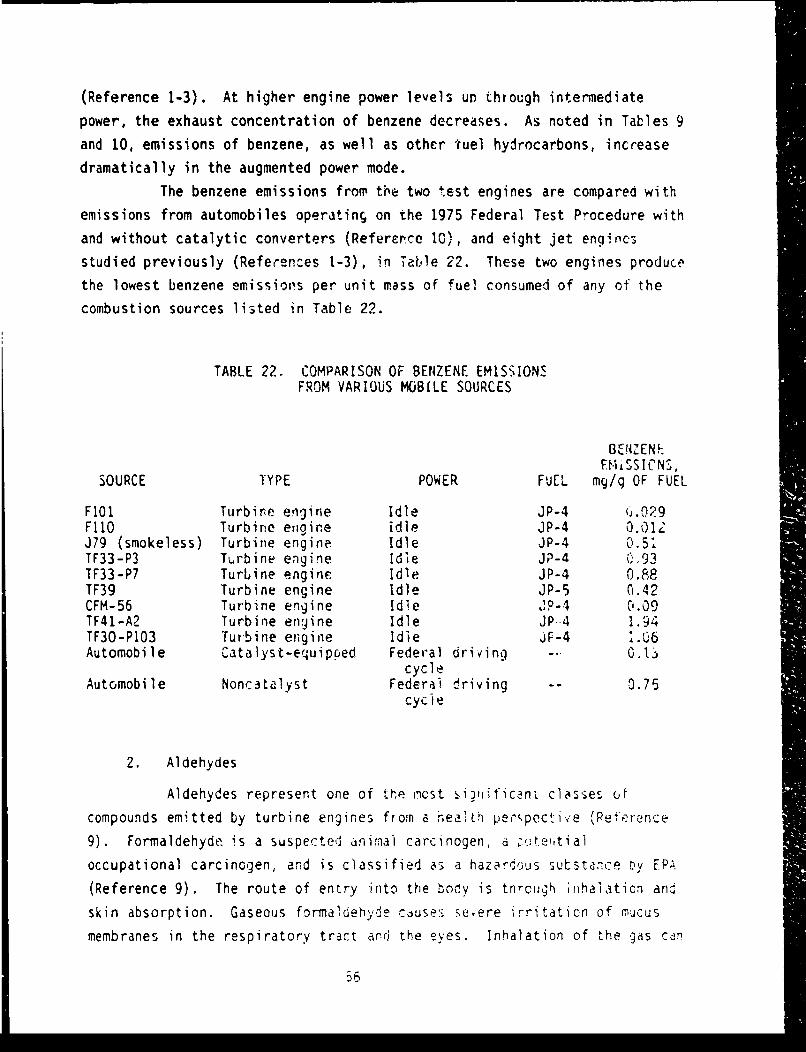
(Reference 1-3). At higher engine power levels up through intermediate
power, the exhaust concentration of benzene decreases. As noted in Tables 9
and 10, emissions of benzene, as well as other fuel hydrocarbons, increase
dramatically in the augmented power mode.
The benzene emissions from the two test engines are compared with
emissions from automobiles operatin§ on the 1975 Federal Test Procedure with
and without catalytic converters (Reference 10), and eight jet engines
studied previously (References 1-3), in Table 22. These two engines producethe lowest benzene emissions per unit mass of fuel consumed of any of the
combustion sources listed in Table 22.
TABLE 22. COMPARISON OF BENZENE EM1SSIONSFROM VARIOUS MOBILE SOURCES
BENZ ENEFM±SSICNS,
SOURCE TYPE POWER FUEL mg/q OF FUEL
F101 Turbire engine Idle JP-4 (J .0)29FI1O Turbine engine idle JP-4 0.012J79 (smokeless) Turbine engine Idle JP-4 0.51TF33-P3 Turbine engine Idle JP-4 (093TF33-P7 Turbine engine Idle JP-4 0.,8TF39 Turbine engine Idle JP-5 0.42CFM-56 Turbine engine Idle IP-4, 0.09TF41-A2 Turbine engine Idle JP-4 1.94TF30-PI03 Turbine egi ne Idle F- .6Automobile Catalyst-equipped Federal driiing -0 0.1.3
cycleAutomobile Noncatalyst Federal driving 0- 3.75
cycle
2. Aldehydes
Aldehydes represent one of the ncst ý.i~liificanL classes of
compounds emitted by turbine engines from a health perspective (Pe-erý!,r•e
9). Formaldehyde is a suspected animai carcinogen, d z,.te,,tiai
occupational carcinogen, and is classified as a hazardous sutstance Dy EP'.
(Reference 9). The route of entry into the boc!y is tnrcei.gh .nhalticn anr
skin absorption. Gaseous formaldehyde causes .e,.ere irritation of mucusmembranes in the respiratory tract and the eyes. Inhalation of the gas can

cause urticaria; at high concentrations coughing, breathing difficulty, and
pulitonary edema can occur. There is evidence that inhalation of
tonraldehyde causes nasal cancer in rats (Reference 9). Other hazardous
aldehydes include arrolein and acetaldehyde, which are irritating to the
eyes, skin, and upper respiratory tract at very low levels.
The Occupational Safety and Health Administration (OSHA) standard
for formaldehyde is 3 ppm, but National Institute of Occupational Safety and
Health (NIOSH) has recommended a ceiling of 0.8 ppm for any 30-minute period
(Reference 9). The concentration of formaldehyde in undiluted exhaust at
engine idle was 0.31 ppm for the F110 and 0.33 ppm for the F101. The
concentrations in diluted exhaust under augmented power were 9.9 and 6.0
ppm. We estimate that the exhaust was diluted by about an order of
magnitude, so the actual exhaust concentrations were probably in the range
of 50-100 ppm. This represents a very significant localized source of
formaldehyde in the atmosphere. lable 23 compares the concentration of
formaldehyde in exhaust from several mobile sources (References 1-3,11).
TABLE 23. FORMALDEHYDE CONCENTRATIONS IN EXHAUSTFROM MOBILE SOURCES
FORMALDEHYDECONCENTRATION,
SOURCE TYPE POWER FUEL ppm
FIIO Turbine engine Idle JP-4 0.31F101 Turbine engine Idle JP-4 0.33J79 (smokeless) Turbine engine Idle JP-4 15.9TF33-P3 Turbine engine Idle JP-4 15.5TF33-P7 Turbine engine Idle JP-4 16.6TF39 Turbine engine Idle JP-4 14.6CFM-56 Turbine engine Idle JP-4 9.3TF41-A2 Turbine engine Idle JP-4 17.8TF30-P103 Turbine engine Idle JP-4 9.3TF30-P109 Turbine engine Idle JP-4 9.0Automobile Noncatalytt Driving cycle -- 24Automobile Catalyst-equipped Driving cycle -- 3.6Diesel Light duty (1978) Driving cycle -- 5.7Diesel Light duty (1980) Driving cycle -- 7.0
57
•~ I I II

3. Polynuclear Aromatic Hydrocarbons (PAH)
The concentrations in exhaust from turbine engines are generally
higher than light duty diesels or catalyst-equipped automobiles, with the
exception of the F110 and F101 engines, for which the exhaust concentrations
i idle are more than an order of magnitude lower than the other sources
listed in Table 23. This comparison is for direct exhaust concentrations;
comparisons on the basis of fuel consumption, miles traveled, or emission
rates may yield a different perception of the relative emissions from these
sources.
The class of compounds known as polynuclear aromatic hydrocarbons
(PAH) contains numerous potent carcinogens (Reference 9). Benzo(a)pyrene
(BaP) is one of the most common and most hazardous members of this class of
compound, and is frequently used as a surrogate for PAH in general. The
route of entry for BaP is inhalation and ingestion. BaP has been found in
emissions from a variety of combustion sources, in urban air, cigarette
smoke, and food sources. BaP produces tumors in all nine animal species
which have been tested. It has both a local and a systemic carcin-,onic
effect (Reference 9). The OSHA standard for BaP is 0.2 mg/m 3 fc( iour
time-weighted average (Reference 9). Emissions of BaP from several mobile
sources are noted in Table 24 (Reference 12).
TABLE 24. COMPARISON OF BENZO(a)PYRENE EMISSIONSFROM SEVERAL EMISSIONS SOURCES
BaP, sg/gSOURCE TYPE POWER FUEL OF FUEL
F110 Turbine engine Idle JP-4 0.021FIOl Turbine engine Idle JP-4 0.018J79 (smokeless) Turbine engine Idle JP-4 < 0.0013TF33-P3 Turbine engine Idle JP-4 < 0.0013TF33-P7 Turbine engine Idle JP-4 < 0.0013TF39 Turbine engine Idle JP-5 0.0051CFM-56 Turbine engine Idle JP-4 0.024TF41-A2 Turbine engine Idle JP-4 0.0064TF30-P103 Turbine engine Idle JP-4 < 0.0013Automobile Diesel Driving cycle 0.03-0.16Automobile Internal Driving cycle Unleaded 0.014
combustionick Diesel Driving cycle -- 0.0038ick Internal Driving cycle -- 0.065
combustion
58

The data in Table 24 indicate that both the FI01 and F110 engines
emit more BaP per mass of fuel consumed than most of the other turbine
engines for which data are available. On this same comparison basis, diesel
automobiles and internal combustion engine trucks show higher emissions.
However, the exhaust concentrations of BaP, shown earlier in Tables 10 and
11, are over three orders of magnitude lower than the OSHA standard for an
8-hour time-weighted averdge exposure.
4. Carbon Monoxide
Carbon monoxide is an odorless, colorless, tasteless gas which is
emitted by nearly all combustion sources. Its route of entry is by
inhalation. It combines with hemoglobin in the blood to produce
carboxyhemoglobin, which reduces the capacity of the blood to carry oxygen,
leading to a state of tissue hypoxia. Acute exposure to CO can cause
headache, dizziness, drowsiness, nausea, vomiting, coma, and death. Severe
carbon monoxide exposure has been reported to permanently damage the
extrapyramidal system (Reference 9).
The OSHA standard for CO is 50 ppm for an 8-hour time-weighted
average. The EPA dmbient air standard is 9 ppm averaged over an 8-hour
period, and 35 ppm for I hour, not to be exceeded more than once a year
(Reference 9). Exhaust concentrations of CO for the study engines are
listed in Table 25. These are concentrations at idle power in undiluted
exhaust. The concentrations in FI1O and F10 exhaust at idle are
significantly lower thar. other engines listed in Table 25. Table 7 shows
that the CO concentration decreases significantly at higher power settings
below augmented power.
5. Nitrogen Dioxide
Nitrogen dioxide (N02) is classified as a hazardous substance by
EPA. Its route of entry to the body is inhalation, along with skin and eye
contact. At high concentrations, N02 may cause irritation of the eyes and
mucus membrances, and may result in severe pulmonary irritation. Even lower
concentrations may produce acute pulmonary edema. Chronic exposure may
result in pulmonary dysfunction with decreased vital capacity and signs of
emphysema (Reference 9).
59

TABLE 25. CONCENTRATIONS OF CO IN UNDILUTED ENGINEEXHAUST AT IDLE POWER (JP-4 FUEL)
ENGINE CO CONCENTRATION, ppm
F110 85F101 50J79 (smokeless) 700TF33-P3 680TF33-P7 930TF39 550CFM-56 640TF41-A2 772TF30-P103 276TF30-P109 283
The OSHA standard for N02 is 5 ppm for a time-weighted 8-hour
period. The EPA ambient air standard is 0.05 ppm on an annual averagebasis. The concentrations of N02 in exhaust from -everal turbine engines is
shown in Table 26. These concentrations are for undiluted exhaust. Asexpected, the N02 concentrations increase at higher power settings. The N02exhaust concentrations for the study engines are lower than the levels
reported for other turbine engines (References 1-3). The relationship
between N02 emissions and engine power settings was discussed earlier in
this report.
TABLE 26. CONCENTRATIONS OF N02 IN JET ENGINE EXHAUST
NO2 CONCENTRATION, ppmENGINE IDLE POWER 30 PERCENT POWER
F110 2.6 2.0FOI0 i.9 3.0(a)J79 (smokeless) 4.9 10.5TF33-P3 7.5 13.8TF33-P7 5.7 13.0TF39 5.8 18CFM-56 5.6 9TF41-A2 4.4 14.21F30-P103 4.1 13.1TF30-PI09 4.5 12.0
(a) 44 percent power.
60

G. PARTICLE SIZE DISTRIBUTION
The particle size distribution obtained at different power settings for
the F110 and F101 turbine engines is provided in Table 15. The table shows
that the particle concentrations are quite low for both the F101 and F11O
engines. The exhaust particle concentrations from these engines are
significantly lower than other engines we have examined (References 2 and3)), with the exception of the J7g (smokeless) engine, which yielded
particle emissions only slightly higher than the FI01. For both the F101
and F110 engines, the data in Table 15 indicate that most of the particles
have diameters less than 0.1 Aim. The particle size distribution for the
Fi01 engine shifts to larger diameter particles at higher power settings,while, for the F110, relatively few particles are found at power settings
below intermediate.
An increase in mean particle diameter with increasing power is
consistent with results from other engines (References 2 and 3). Table 13
showed that smoke emissions increased with power setting for both of these
engines. The fact that the greatest number concentration was observed for
the F101 at idle power demonstrates that number concentration alone can not
explain light attenuation, upon which smoke observations are based. Lightattenuation and light scattering depend strongly on particle size over this
range of sizes. Although there are a number of complicating factors,roughly speaking, the attenuation increases with particle volume below about
0.1 jsm and with -rticle surface area above this size. Thus, attenuationincreases with parL.cle radius cubed o- squared over the size range observed
for these engines. Because of this sensitive relationship betweenattenuation and size, small changes in the size distribution can yield
significant changes in light attenuation. This is clearly demonstrated by
the FI01 data, where the total particle number concentration changes little
with increasing power, but the smoke value increases significantly from
idle to intermediate power.
The data in Table 15 show that most particles emitted by these engines
are smaller than 0.2 um. This is confirmed by the photomicrographs whichresulted from the electrostatically collected exhaust particle samples.
These samples were collected to determine whether a significant
concentration of large particles (2 1 am) might be present in turbine engine
exhaust. Photomicrographs of three exhaust samples are shown in Figures
61

16-18. Particles were collected on Nuclepore filters as described in
Section II, and the filter pores which are visible in these pictures are 0.1
Am diameter. Very small particles (< 0.03 um) are not visible at these
magnifications, and are difficult to find at higher magnifications because
the number of particles emitted by these engines is so low, and the field ofview is greatly r-educed at higher magnification. Our microscopic analysis
of the filter samples confirms the negligible number of large particles in
the exhaust, and confirms that most particles emitted by these engines have
mean diameters less than 0.2 jam.
62

:j� �-' 0;, .c-
'7
e
0
U
- 0
0
J -
Figure 16. Photomicrograph of Exhaust Particles From FlOl Engine AtIdle (Filter Pores are 0.1 jim Diameter)
63

Figure 17. Photomicrograph of Exhaust Particles FromF10 Engine At Intermediate Power(Filter Pores are 0.1 ,m Diameter)
64
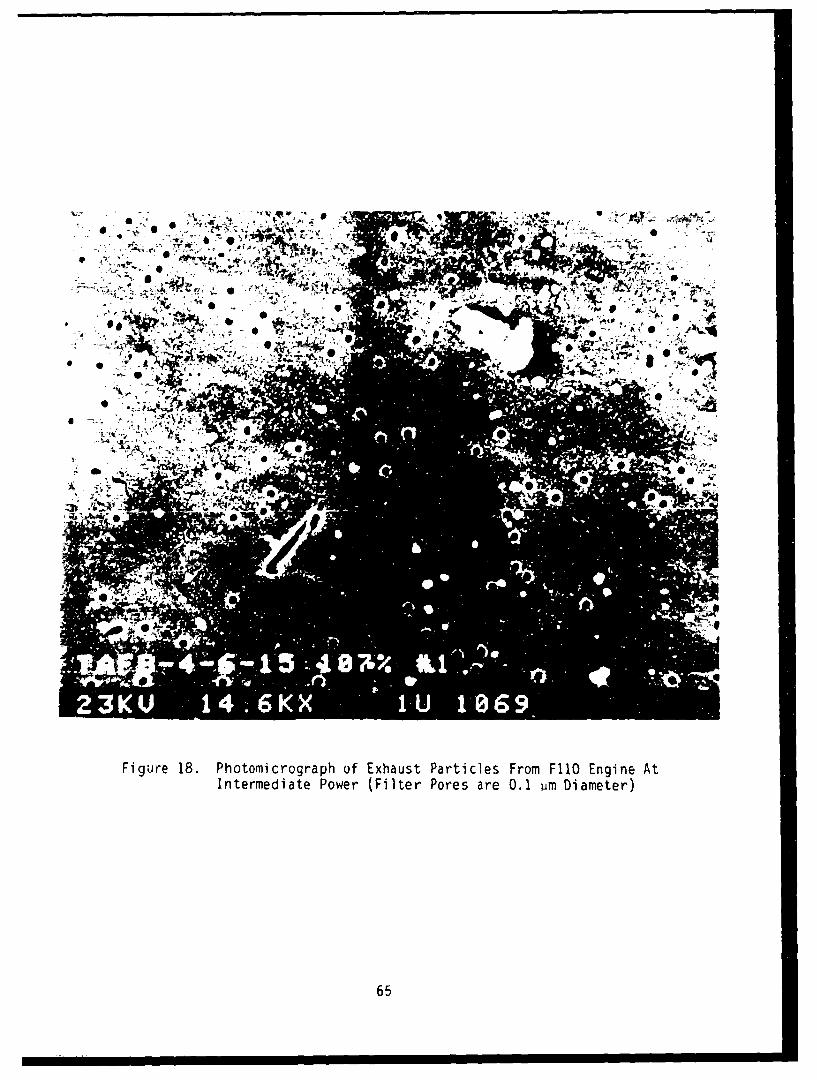
* 5': % .;• - +.< ..- *
S+ ,. , + 0 +• %..
Figure 18. Photomicrograph of Exhaust Particles From F110 Engine AtIntermediate Power (Filter Pores are 0.1 jim Diameter)
65

SECTION V
CONCLUSIONS
This study has characterized the gas and particle composition of
exhaust from two Air Force turbine engines: F110 and F101. Measurements
were made with the engines operating on JP-4 fuel, at power settings from
idle to intermediate. Augmented power (Stage 1) was also studied. Several
significant findings resulting from this study are summarized below:
Emissions of organic species, CO, and particles were very low for
both the F101 and F110 engines.
"* At idle, four combustion products (ethene, acetylene, propene,and formaldehyde) accounted for 40-60 percent of total nonmethaneorganic emissions for the F110 and F101 engines. At higher powerup to intermediate, ethene and formaldehyde are the dominantnonmethane organic compounds.
" Under augmented (afterburner) power, organic emissions increaseddramatically. A larger fraction of the organic emissions ataugmented power was unburned fuel for the F101, compared to theF110.
Aldehydes were present at significant concentrations in theexhaust from both engines.
0 Dicarbonyl compounds were observed in the exhaust from eachengine, consistent with our earlier studies (References 1-3).
0 Particle emissions were so low that particle mass measurementswere not feasible using our sampling protocol. Smoke measurementsand data on larticle number concentrations confirmed the very lowparticle concentrations in exhaust from these engines.
* Microscopic examination of exhaust particle samples collectedelectrostatically demonstrated that the vast majority of emittedparticles had diameters smaller than 0.2 um.
* Emission indices and emission rates were determined for CO, C02,hydrocarbons, NO, NO2, and NOx at power levels from idle tointermediate.
66

* After accounting for exhaust dilution during augmented-powersampling, the polynuclear aromatic hydrocarbon (PAH)concentrations were highest at this power setting. Measurablelevels of PAH were present at all power levels.
The ratio of N02/NOx was highest under augmented power, secondhighest at idle, and decreased from idle to intermediate power.
67

REFERENCES
1. Spicer, C. W., Holdren, M. W., Lyon, T. F., and Riggin, R. M.,Composition and Photochemical Reactivity of Turbine Engine Exhaust,Report ESL-TR-84-28, Tyndall AFB, FL, September, 1984.
2. Spicer, C. W., Holdren, M. W., Miller, S. E., Smith, D. L., Smith,R. N., Kuhlman, M. R., and Hughes, D. P., Aircraft EmissionsCharacterization: TF41-A2, TF30-P103, and TF30-P109 Engines, ReportESL-TR-87-27, Tyndall AFB, FL, June, 1987.
3. Spicer, C. W., Holdren, M. W., Miller, S. E., Smith, 0. L., Smith,R. N., and Hughes, D. P., Aircraft Emissions Characterization, ReportESL-TR-87-63, Tyndall AFB, FL, March, 1988.
4. Berry, D. A., Holdren, M. W., Lyon, T. F., Riggin, R. M., and Spicer,C. W., Turbine Engine Exhaust Hydrocarbon Analysis, Tasks 1 and 2,Report ESL-TR-82-43, Tyndall AFB, FL, June, 1983.
5. Spicer, C. W., Holdren, M. W., Slivon, L. E., Coutant, R. W., andShadwick 0. S., Intercomparison of Sampling Techniques for ToxicOrganic Compounds in Indoor Air, Battelle Columbus Final Report to EPA,Contract No. 68-02-3745, September, 1986.
6. Code of Federal Regulations, 40, Part 87, Subpart H, p. 702 (1982).
7. International Standards and Recommended Practices, EnvironmentalProtection, Vol. II, Aircraft Engine Emissions, Int. Civil AviationOrgan., 1981.
8. Lyon, T. F., Colley, W. C., Kenworthy, M. J., and Bahr, D. W.,Development of Emissions Measurement Techniques for AfterburiningTurbine Engines, AFAPL-TR-75-52, Air Force Aero Propulsion Laboratory,Wright-Patterson AFB, OH (1975).
9. Sittig, M., Handbook of Toxic and Hazardous Chemicals and Carcinogens,Noyes Publications, Park Ridge, NJ, 1985.
10. Nebel, G. J., "Benzene in Auto Exhaust," J. Air Poll. Control Assoc.,29, 391-392, 1979.
11. Lipari, F. and Swarin, S. J., , "Determination of Formaldehyde andOther Aldehydes in Automobile Exhaust With An Improved 2,4-Dinitrophenylhydrazine Method, J. Chrom., 247, 297-306, 1982.
12. Zweidinger, R. B., "Emission Factors from Diesel and Gasoline PoweredVehicles: Correlation With the Ames Test," in Toxicological Effects ofEmissions from Diesel Engines, J. Lewtas, ed., Elsevier Biomeicap83-96, 1982.
(c