Embed Size (px)
Citation preview
Federal Funds Management Office
Merril Oliver
Commonwealth of Puerto Rico
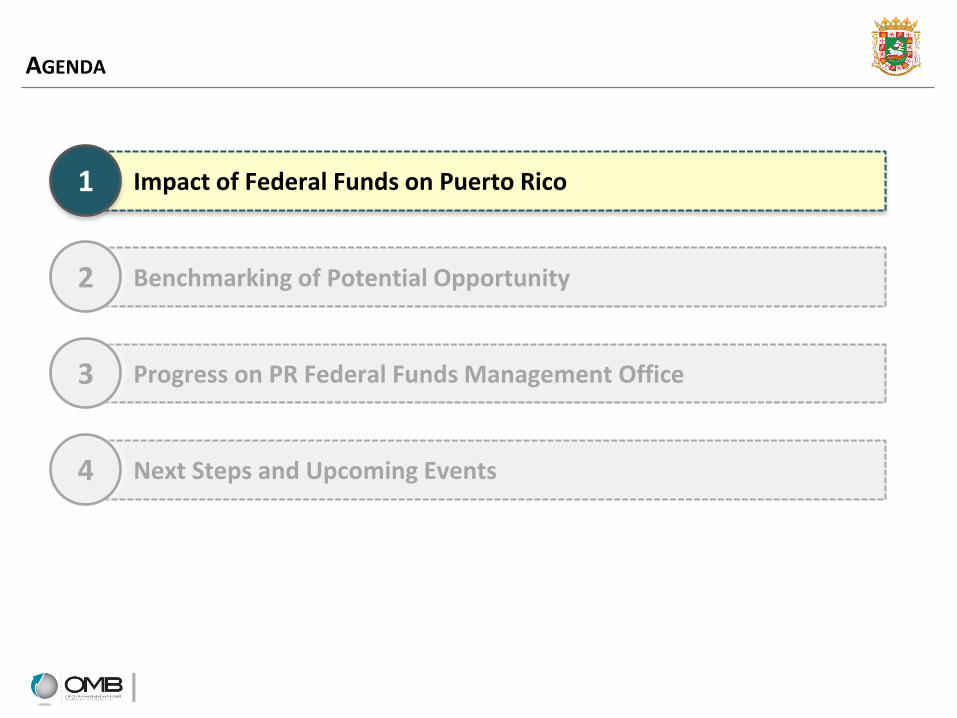
AGENDA
Impact of Federal Funds on Puerto Rico 1
Benchmarking of Potential Opportunity 2
Progress on PR Federal Funds Management Office 3
Next Steps and Upcoming Events 4
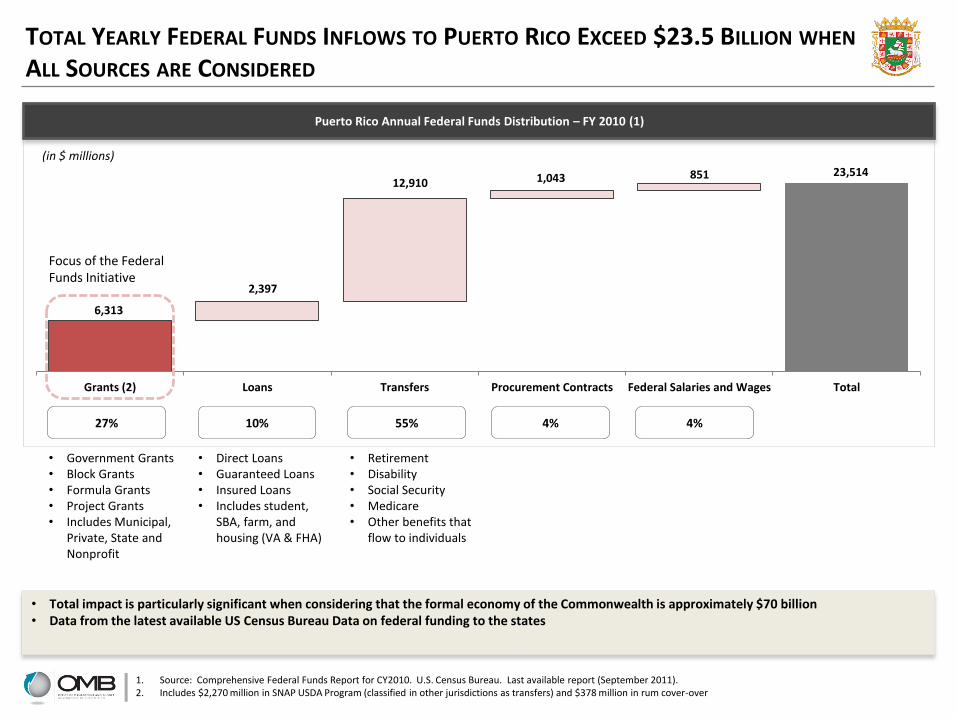
6,313
23,514
2,397
12,910 1,043 851
Grants (2) Loans Transfers Procurement Contracts Federal Salaries and Wages Total
TOTAL YEARLY FEDERAL FUNDS INFLOWS TO PUERTO RICO EXCEED $23.5 BILLION WHEN ALL SOURCES ARE CONSIDERED
Puerto Rico Annual Federal Funds Distribution – FY 2010 (1)
• Government Grants • Block Grants • Formula Grants • Project Grants • Includes Municipal,
Private, State and Nonprofit
• Direct Loans • Guaranteed Loans • Insured Loans • Includes student,
SBA, farm, and housing (VA & FHA)
• Retirement • Disability • Social Security • Medicare • Other benefits that
flow to individuals
(in $ millions)
Focus of the Federal Funds Initiative
• Total impact is particularly significant when considering that the formal economy of the Commonwealth is approximately $70 billion • Data from the latest available US Census Bureau Data on federal funding to the states
1. Source: Comprehensive Federal Funds Report for CY2010. U.S. Census Bureau. Last available report (September 2011). 2. Includes $2,270 million in SNAP USDA Program (classified in other jurisdictions as transfers) and $378 million in rum cover-over
27% 10% 55% 4% 4%
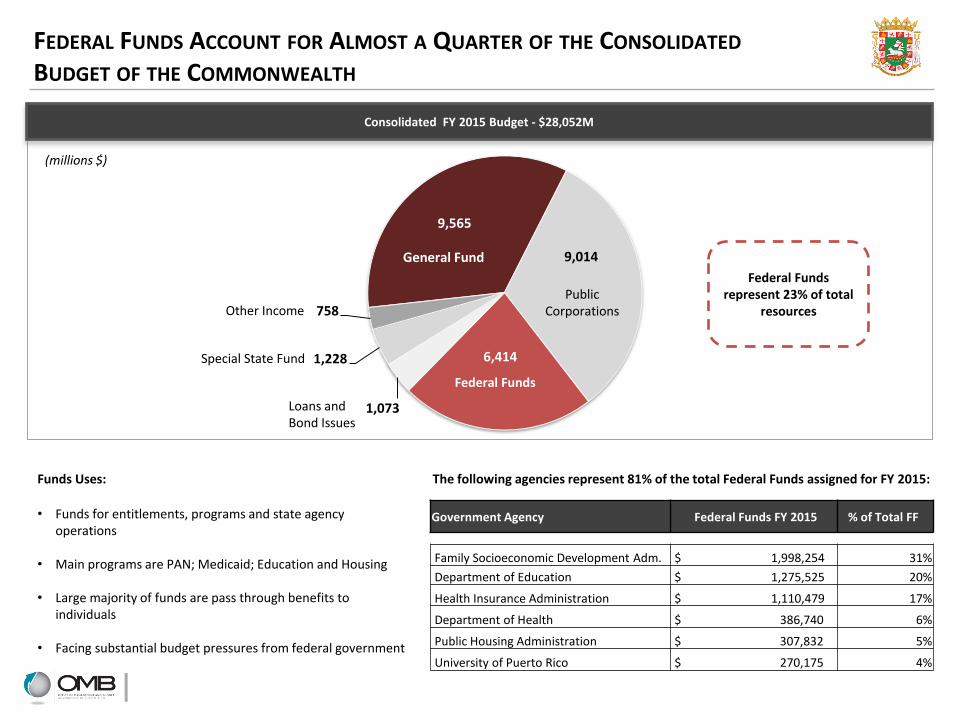
FEDERAL FUNDS ACCOUNT FOR ALMOST A QUARTER OF THE CONSOLIDATED BUDGET OF THE COMMONWEALTH
(millions $)
• Funds for entitlements, programs and state agency operations
• Main programs are PAN; Medicaid; Education and Housing
• Large majority of funds are pass through benefits to individuals
• Facing substantial budget pressures from federal government
9,565
9,014
6,414
1,073
1,228
758
General Fund
Public Corporations
Federal Funds
Other Income
Special State Fund
Loans and Bond Issues
Funds Uses:
Federal Funds represent 23% of total
resources
Government Agency Federal Funds FY 2015 % of Total FF
Family Socioeconomic Development Adm. $ 1,998,254 31%
Department of Education $ 1,275,525 20%
Health Insurance Administration $ 1,110,479 17%
Department of Health $ 386,740 6%
Public Housing Administration $ 307,832 5%
University of Puerto Rico $ 270,175 4%
The following agencies represent 81% of the total Federal Funds assigned for FY 2015:
Consolidated FY 2015 Budget - $28,052M
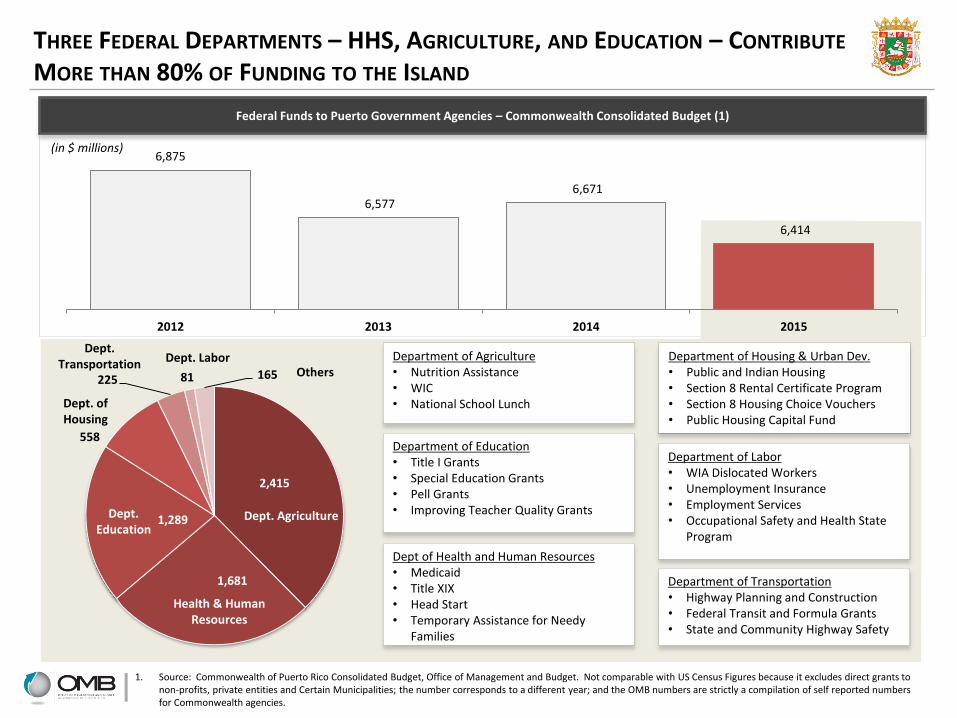
6,875
6,577 6,671
6,414
2012 2013 2014 2015
2,415
1,681
1,289
558
225 81 165
Federal Funds to Puerto Government Agencies – Commonwealth Consolidated Budget (1)
(in $ millions)
THREE FEDERAL DEPARTMENTS – HHS, AGRICULTURE, AND EDUCATION – CONTRIBUTE MORE THAN 80% OF FUNDING TO THE ISLAND
Dept. Agriculture
Health & Human Resources
Dept. Education
Department of Agriculture • Nutrition Assistance • WIC • National School Lunch
Dept of Health and Human Resources • Medicaid • Title XIX • Head Start • Temporary Assistance for Needy
Families
Department of Education • Title I Grants • Special Education Grants • Pell Grants • Improving Teacher Quality Grants
Department of Housing & Urban Dev. • Public and Indian Housing • Section 8 Rental Certificate Program • Section 8 Housing Choice Vouchers • Public Housing Capital Fund
Department of Transportation • Highway Planning and Construction • Federal Transit and Formula Grants • State and Community Highway Safety
Department of Labor • WIA Dislocated Workers • Unemployment Insurance • Employment Services • Occupational Safety and Health State
Program
Dept. Transportation
Others Dept. Labor
Dept. of Housing
1. Source: Commonwealth of Puerto Rico Consolidated Budget, Office of Management and Budget. Not comparable with US Census Figures because it excludes direct grants to non-profits, private entities and Certain Municipalities; the number corresponds to a different year; and the OMB numbers are strictly a compilation of self reported numbers for Commonwealth agencies.
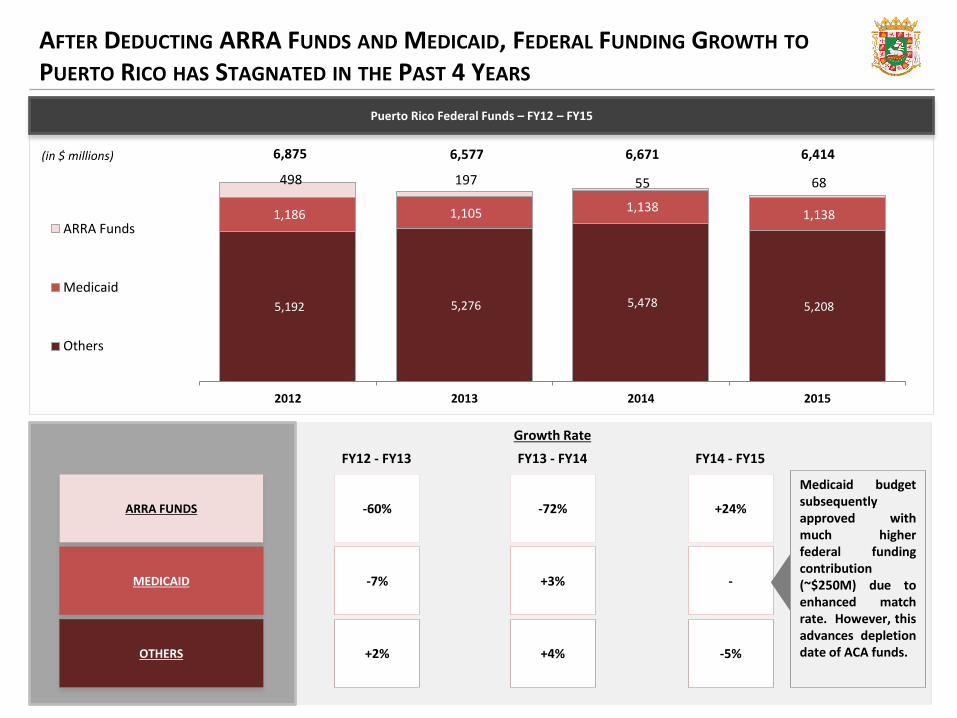
5,192 5,276 5,478 5,208
1,186 1,105 1,138 1,138
498 197 55 68
2012 2013 2014 2015
ARRA Funds
Medicaid
Others
Puerto Rico Federal Funds – FY12 – FY15
(in $ millions)
AFTER DEDUCTING ARRA FUNDS AND MEDICAID, FEDERAL FUNDING GROWTH TO PUERTO RICO HAS STAGNATED IN THE PAST 4 YEARS
6,875 6,577 6,671 6,414
ARRA FUNDS
MEDICAID
OTHERS
-60%
-7%
+2%
-72%
+3%
+4%
+24%
-
-5%
FY12 - FY13 FY13 - FY14 FY14 - FY15
Growth Rate
Medicaid budget subsequently approved with much higher federal funding contribution (~$250M) due to enhanced match rate. However, this advances depletion date of ACA funds.
AGENDA
Impact of Federal Funds on Puerto Rico 1
Benchmarking of Potential Opportunity 2
Progress on PR Federal Funds Management Office 3
Next Steps and Upcoming Events 4
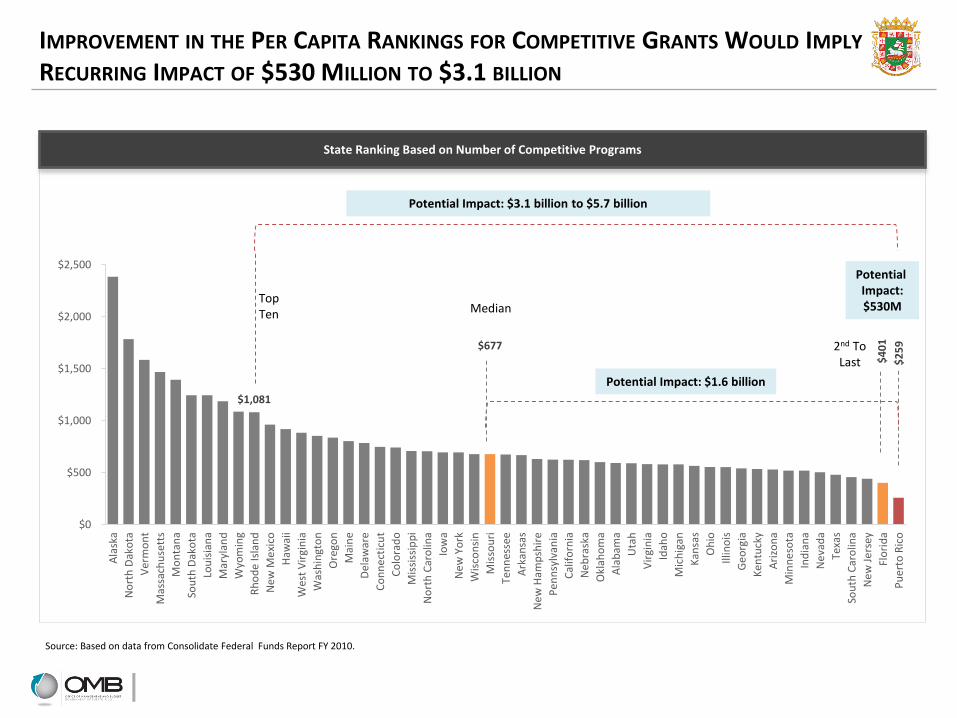
IMPROVEMENT IN THE PER CAPITA RANKINGS FOR COMPETITIVE GRANTS WOULD IMPLY A RECURRING IMPACT OF $530 MILLION TO $3.1 BILLION
$1,081
$677
$4
01
$2
59
$0
$500
$1,000
$1,500
$2,000
$2,500
Ala
ska
No
rth
Dak
ota
Ver
mo
nt
Mas
sach
use
tts
Mo
nta
na
Sou
th D
ako
ta
Lou
isia
na
Mar
ylan
d
Wyo
min
g
Rh
od
e Is
lan
d
Ne
w M
exi
co
Haw
aii
Wes
t V
irgi
nia
Was
hin
gto
n
Ore
gon
Mai
ne
Del
awar
e
Co
nn
ect
icu
t
Co
lora
do
Mis
siss
ipp
i
No
rth
Car
olin
a
Iow
a
Ne
w Y
ork
Wis
con
sin
Mis
sou
ri
Ten
nes
see
Ark
ansa
s
Ne
w H
amp
shir
e
Pen
nsy
lvan
ia
Cal
ifo
rnia
Ne
bra
ska
Okl
aho
ma
Ala
bam
a
Uta
h
Vir
gin
ia
Idah
o
Mic
hig
an
Kan
sas
Oh
io
Illin
ois
Ge
org
ia
Ken
tuck
y
Ari
zon
a
Min
ne
sota
Ind
ian
a
Ne
vad
a
Texa
s
Sou
th C
aro
lina
Ne
w J
ers
ey
Flo
rid
a
Pu
ert
o R
ico
Source: Based on data from Consolidate Federal Funds Report FY 2010.
State Ranking Based on Number of Competitive Programs
Potential Impact: $530M
Potential Impact: $1.6 billion
Potential Impact: $3.1 billion to $5.7 billion
2nd To Last
Top Ten Median
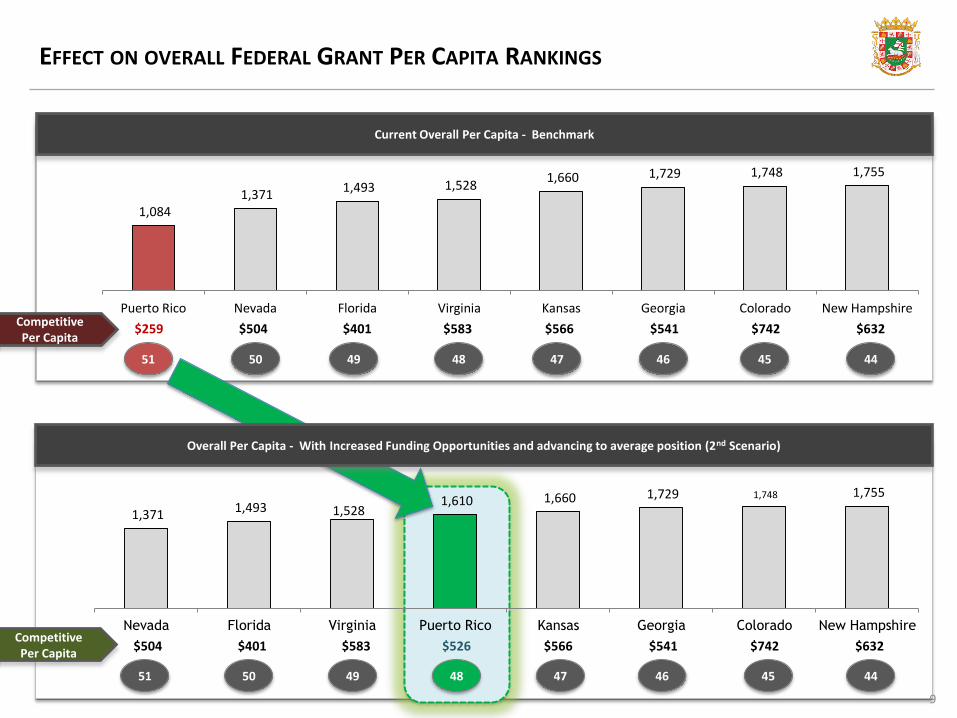
Current Overall Per Capita - Benchmark
1,084 1,371
1,493 1,528 1,660 1,729 1,748 1,755
Puerto Rico Nevada Florida Virginia Kansas Georgia Colorado New Hampshire
1,371 1,493 1,528
1,610 1,660 1,729 1,748 1,755
Nevada Florida Virginia Puerto Rico Kansas Georgia Colorado New Hampshire
Overall Per Capita - With Increased Funding Opportunities and advancing to average position (2nd Scenario)
51 50 49 48 47 46 45 44
51 50 49 48 47 46 45 44
9
$259 $504 $401 $583 $566 $541 $742 $632 Competitive Per Capita
Competitive Per Capita
$504 $401 $583 $526 $566 $541 $742 $632
EFFECT ON OVERALL FEDERAL GRANT PER CAPITA RANKINGS
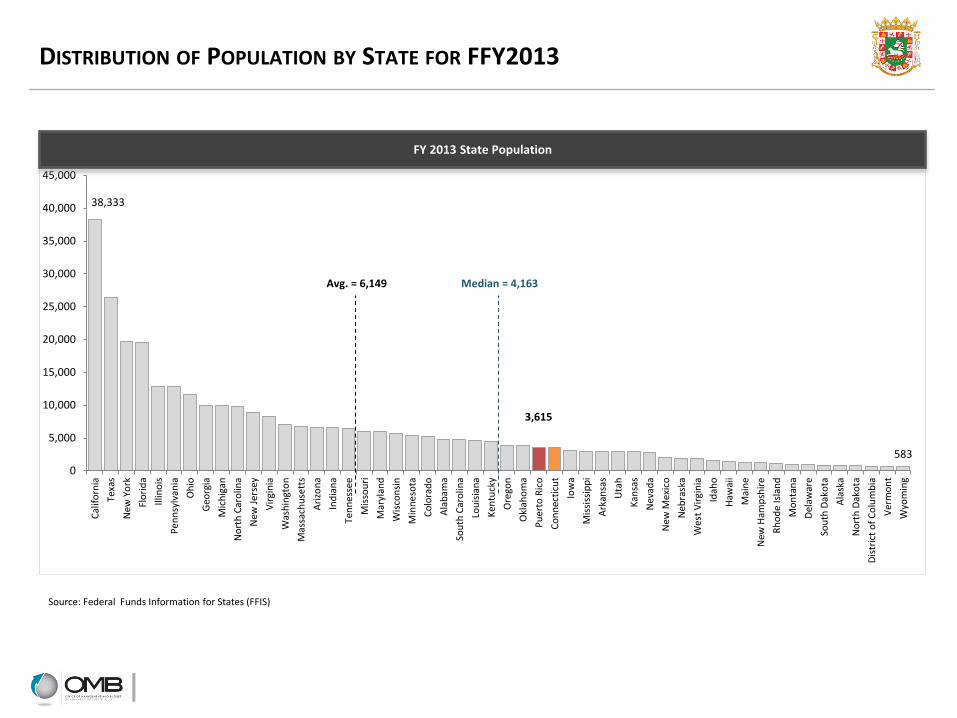
38,333
3,615
583
0
5,000
10,000
15,000
20,000
25,000
30,000
35,000
40,000
45,000
Cal
ifo
rnia
Texa
s
New
Yo
rk
Flo
rid
a
Illin
ois
Pe
nn
sylv
ania
Oh
io
Geo
rgia
Mic
hig
an
No
rth
Car
olin
a
New
Jer
sey
Vir
gin
ia
Was
hin
gto
n
Mas
sach
use
tts
Ari
zon
a
Ind
ian
a
Ten
nes
see
Mis
sou
ri
Mar
ylan
d
Wis
con
sin
Min
ne
sota
Co
lora
do
Ala
bam
a
Sou
th C
aro
lina
Lou
isia
na
Ken
tuck
y
Ore
gon
Okl
aho
ma
Pu
erto
Ric
o
Co
nn
ecti
cut
Iow
a
Mis
siss
ipp
i
Ark
ansa
s
Uta
h
Kan
sas
Nev
ada
New
Mex
ico
Neb
rask
a
Wes
t V
irgi
nia
Idah
o
Haw
aii
Mai
ne
New
Ham
psh
ire
Rh
od
e Is
lan
d
Mo
nta
na
Del
awar
e
Sou
th D
ako
ta
Ala
ska
No
rth
Dak
ota
Dis
tric
t o
f C
olu
mb
ia
Ver
mo
nt
Wyo
min
g
FY 2013 State Population
DISTRIBUTION OF POPULATION BY STATE FOR FFY2013
Median = 4,163 Avg. = 6,149
Source: Federal Funds Information for States (FFIS)
2,713.29
375.37
0.00
500.00
1,000.00
1,500.00
2,000.00
2,500.00
3,000.00
Dis
tric
t o
f C
olu
mb
ia
New
Yo
rk
Ver
mo
nt
Mis
siss
ipp
i
Ala
ska
New
Mex
ico
Wes
t V
irgi
nia
Mai
ne
Lou
isia
na
Mas
sach
use
tts
Rh
od
e Is
lan
d
Ark
ansa
s
Ten
nes
see
Del
awar
e
Cal
ifo
rnia
Oh
io
Ken
tuck
y
Co
nn
ecti
cut
Mis
sou
ri
Ore
gon
Pe
nn
sylv
ania
Ari
zon
a
Ind
ian
a
Mic
hig
an
Min
ne
sota
Idah
o
No
rth
Car
olin
a
Okl
aho
ma
Wis
con
sin
Ala
bam
a
Mo
nta
na
Iow
a
Sou
th C
aro
lina
Texa
s
Haw
aii
Mar
ylan
d
New
Jer
sey
Illin
ois
No
rth
Dak
ota
Neb
rask
a
Sou
th D
ako
ta
Geo
rgia
Flo
rid
a
Was
hin
gto
n
Wyo
min
g
Kan
sas
Uta
h
Co
lora
do
New
Ham
psh
ire
Vir
gin
ia
Nev
ada
Pu
erto
Ric
o
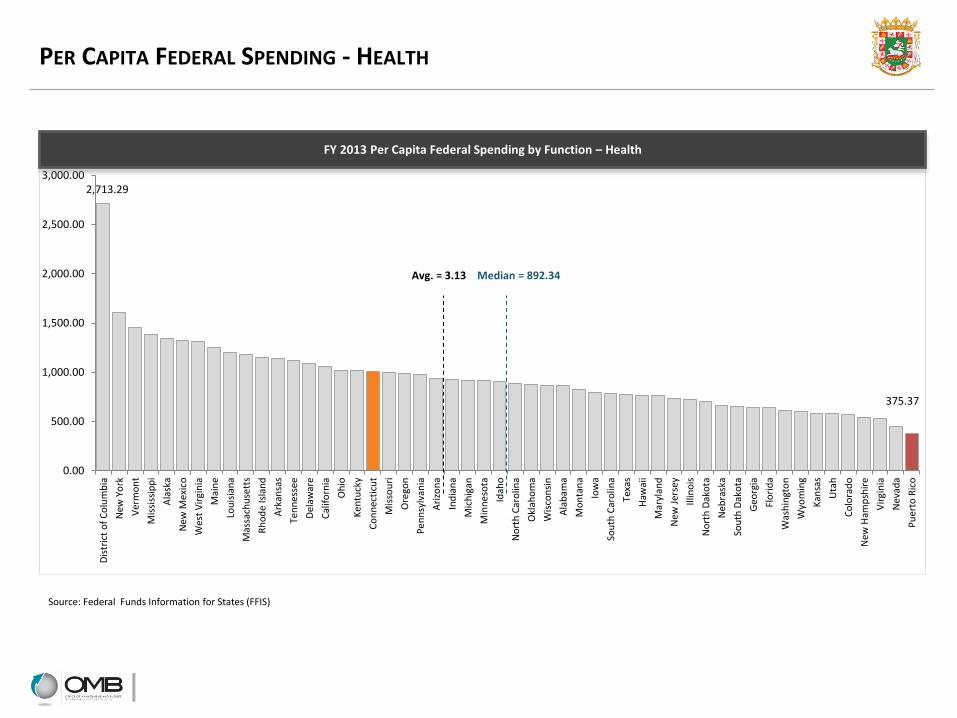
FY 2013 Per Capita Federal Spending by Function – Health
PER CAPITA FEDERAL SPENDING - HEALTH
Median = 892.34 Avg. = 3.13
Source: Federal Funds Information for States (FFIS)
1,001.35
63.33
0.00
200.00
400.00
600.00
800.00
1,000.00
1,200.00
Ala
ska
Dis
tric
t o
f C
olu
mb
ia
Wyo
min
g
Mo
nta
na
No
rth
Dak
ota
Sou
th D
ako
ta
Ver
mo
nt
Haw
aii
Wes
t V
irgi
nia
Rh
od
e Is
lan
d
Del
awar
e
New
Mex
ico
Idah
o
Co
nn
ecti
cut
Ark
ansa
s
Neb
rask
a
Ore
gon
Iow
a
Okl
aho
ma
Ala
bam
a
New
Yo
rk
Mis
siss
ipp
i
Mis
sou
ri
Mai
ne
New
Jer
sey
Ken
tuck
y
Lou
isia
na
Ind
ian
a
Illin
ois
Co
lora
do
Min
ne
sota
Pe
nn
sylv
ania
Vir
gin
ia
Was
hin
gto
n
Nev
ada
Wis
con
sin
Kan
sas
Geo
rgia
Ten
nes
see
Mas
sach
use
tts
Uta
h
Texa
s
New
Ham
psh
ire
Sou
th C
aro
lina
Cal
ifo
rnia
Mar
ylan
d
Ari
zon
a
Oh
io
No
rth
Car
olin
a
Mic
hig
an
Flo
rid
a
Pu
erto
Ric
o
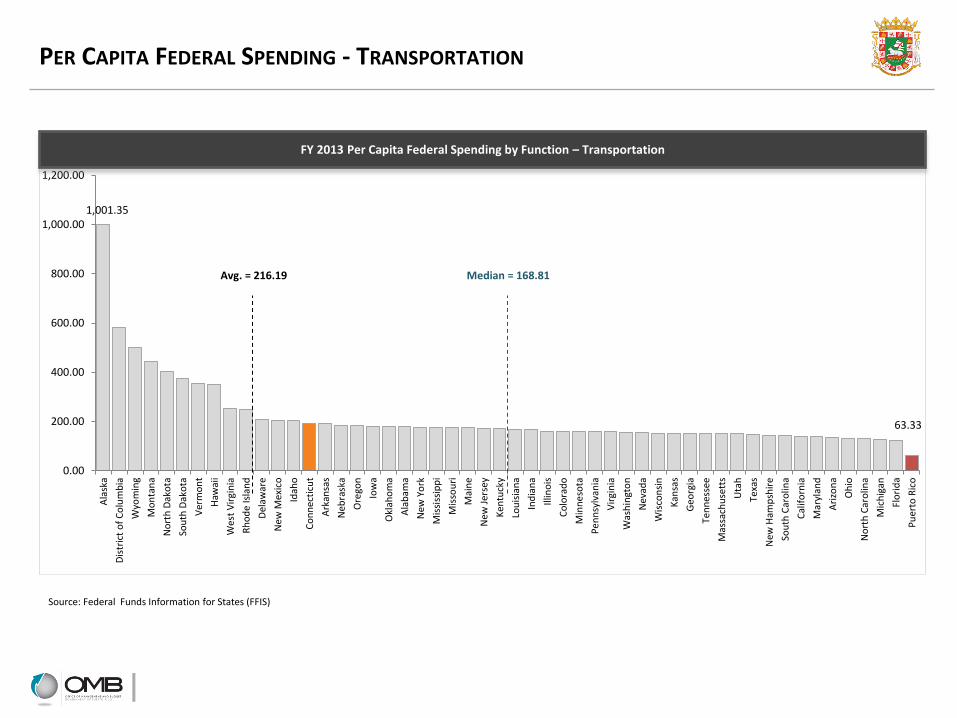
FY 2013 Per Capita Federal Spending by Function – Transportation
PER CAPITA FEDERAL SPENDING - TRANSPORTATION
Median = 168.81 Avg. = 216.19
Source: Federal Funds Information for States (FFIS)
10.07
3.36
0.90
0.00
2.00
4.00
6.00
8.00
10.00
12.00
No
rth
Dak
ota
Sou
th D
ako
ta
Wyo
min
g
Ver
mo
nt
Del
awar
e
Mo
nta
na
Mis
siss
ipp
i
Wes
t V
irgi
nia
Iow
a
Neb
rask
a
Ark
ansa
s
Ken
tuck
y
Ala
bam
a
Mai
ne
Ala
ska
Idah
o
Okl
aho
ma
Kan
sas
Mis
sou
ri
Dis
tric
t o
f C
olu
mb
ia
Ten
nes
see
Sou
th C
aro
lina
New
Ham
psh
ire
Pu
erto
Ric
o
Lou
isia
na
Min
ne
sota
Rh
od
e Is
lan
d
No
rth
Car
olin
a
Wis
con
sin
Haw
aii
Ore
gon
New
Mex
ico
Ind
ian
a
Vir
gin
ia
Geo
rgia
Was
hin
gto
n
Mic
hig
an
Mar
ylan
d
Oh
io
Pe
nn
sylv
ania
Uta
h
Co
lora
do
Co
nn
ecti
cut
Illin
ois
Texa
s
Nev
ada
Mas
sach
use
tts
Ari
zon
a
New
Yo
rk
Flo
rid
a
Cal
ifo
rnia
New
Jer
sey
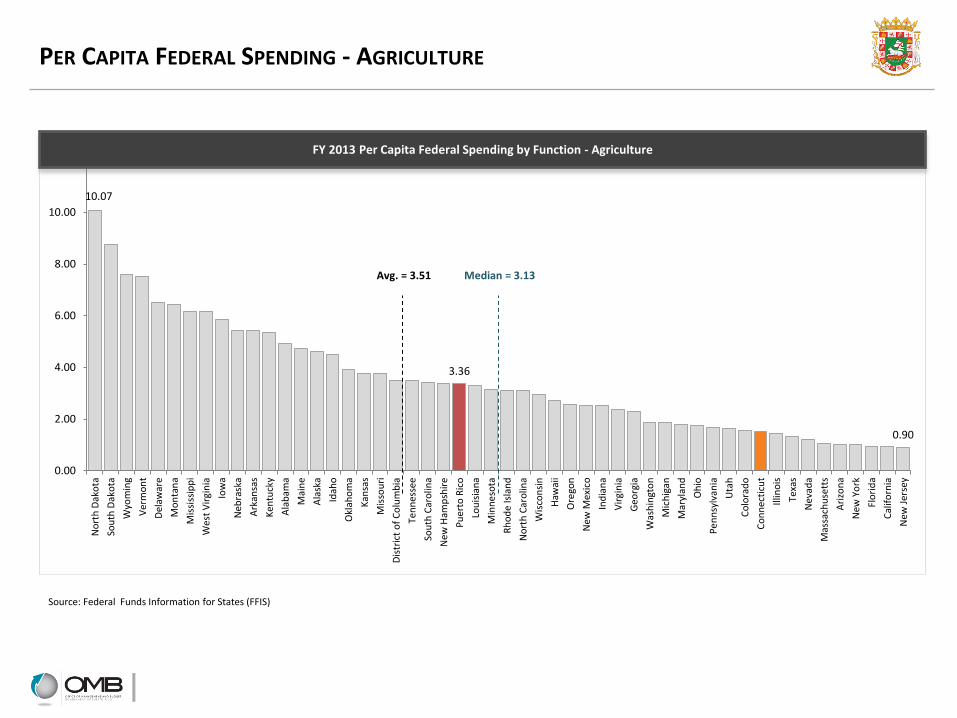
FY 2013 Per Capita Federal Spending by Function - Agriculture
PER CAPITA FEDERAL SPENDING - AGRICULTURE
Median = 3.13 Avg. = 3.51
Source: Federal Funds Information for States (FFIS)
12.23
3.30 2.91
0.00
2.00
4.00
6.00
8.00
10.00
12.00
14.00
Dis
tric
t o
f C
olu
mb
ia
Ala
ska
Del
awar
e
Ver
mo
nt
Wyo
min
g
No
rth
Dak
ota
Rh
od
e Is
lan
d
Sou
th D
ako
ta
Nev
ada
Cal
ifo
rnia
Mo
nta
na
New
Yo
rk
New
Mex
ico
Co
lora
do
Ari
zon
a
New
Ham
psh
ire
Haw
aii
New
Jer
sey
Mai
ne
Texa
s
Idah
o
Sou
th C
aro
lina
Ten
nes
see
Ore
gon
Wes
t V
irgi
nia
Uta
h
Neb
rask
a
Ark
ansa
s
Iow
a
Mis
siss
ipp
i
Okl
aho
ma
Geo
rgia
Kan
sas
Mis
sou
ri
Mas
sach
use
tts
Flo
rid
a
Mar
ylan
d
Was
hin
gto
n
Illin
ois
Co
nn
ecti
cut
Lou
isia
na
No
rth
Car
olin
a
Ala
bam
a
Pu
erto
Ric
o
Wis
con
sin
Ind
ian
a
Mic
hig
an
Pe
nn
sylv
ania
Min
ne
sota
Oh
io
Vir
gin
ia
Ken
tuck
y
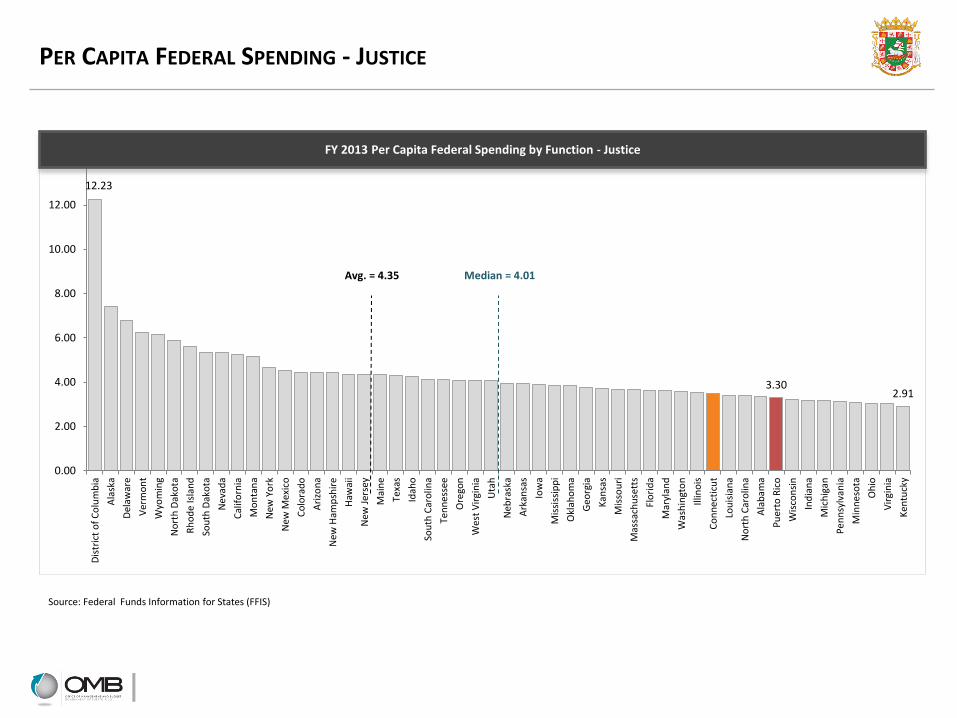
FY 2013 Per Capita Federal Spending by Function - Justice
PER CAPITA FEDERAL SPENDING - JUSTICE
Median = 4.01 Avg. = 4.35
Source: Federal Funds Information for States (FFIS)
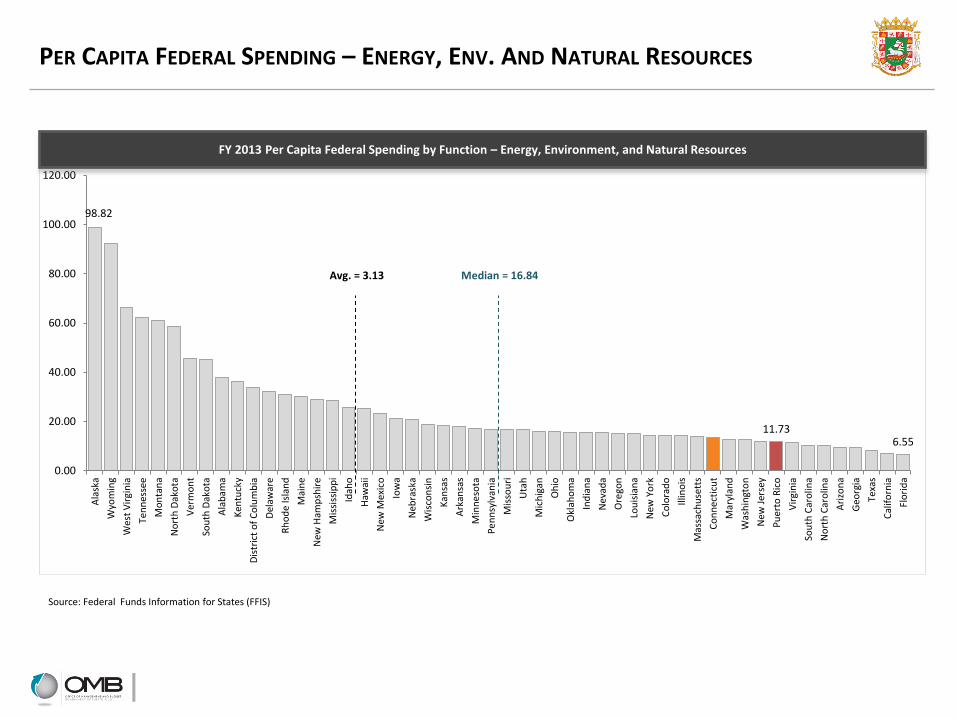
98.82
11.73 6.55
0.00
20.00
40.00
60.00
80.00
100.00
120.00
Ala
ska
Wyo
min
g
Wes
t V
irgi
nia
Ten
nes
see
Mo
nta
na
No
rth
Dak
ota
Ver
mo
nt
Sou
th D
ako
ta
Ala
bam
a
Ken
tuck
y
Dis
tric
t o
f C
olu
mb
ia
Del
awar
e
Rh
od
e Is
lan
d
Mai
ne
New
Ham
psh
ire
Mis
siss
ipp
i
Idah
o
Haw
aii
New
Mex
ico
Iow
a
Neb
rask
a
Wis
con
sin
Kan
sas
Ark
ansa
s
Min
ne
sota
Pe
nn
sylv
ania
Mis
sou
ri
Uta
h
Mic
hig
an
Oh
io
Okl
aho
ma
Ind
ian
a
Nev
ada
Ore
gon
Lou
isia
na
New
Yo
rk
Co
lora
do
Illin
ois
Mas
sach
use
tts
Co
nn
ecti
cut
Mar
ylan
d
Was
hin
gto
n
New
Jer
sey
Pu
erto
Ric
o
Vir
gin
ia
Sou
th C
aro
lina
No
rth
Car
olin
a
Ari
zon
a
Geo
rgia
Texa
s
Cal
ifo
rnia
Flo
rid
a
FY 2013 Per Capita Federal Spending by Function – Energy, Environment, and Natural Resources
PER CAPITA FEDERAL SPENDING – ENERGY, ENV. AND NATURAL RESOURCES
Median = 16.84 Avg. = 3.13
Source: Federal Funds Information for States (FFIS)
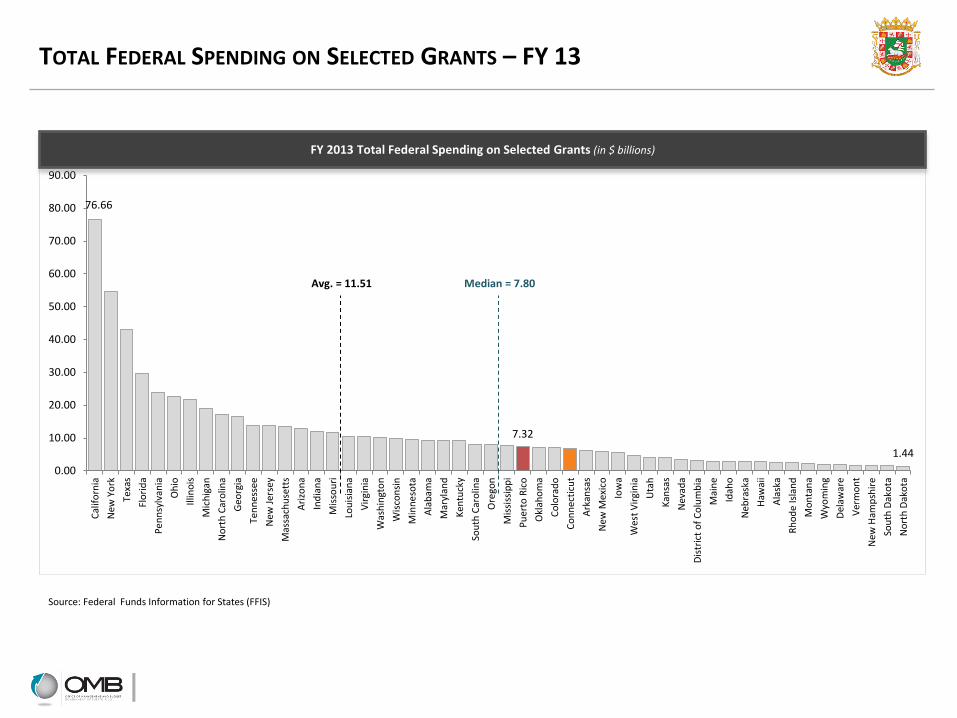
76.66
7.32
1.44
0.00
10.00
20.00
30.00
40.00
50.00
60.00
70.00
80.00
90.00
Cal
ifo
rnia
New
Yo
rk
Texa
s
Flo
rid
a
Pe
nn
sylv
ania
Oh
io
Illin
ois
Mic
hig
an
No
rth
Car
olin
a
Geo
rgia
Ten
nes
see
New
Jer
sey
Mas
sach
use
tts
Ari
zon
a
Ind
ian
a
Mis
sou
ri
Lou
isia
na
Vir
gin
ia
Was
hin
gto
n
Wis
con
sin
Min
ne
sota
Ala
bam
a
Mar
ylan
d
Ken
tuck
y
Sou
th C
aro
lina
Ore
gon
Mis
siss
ipp
i
Pu
erto
Ric
o
Okl
aho
ma
Co
lora
do
Co
nn
ecti
cut
Ark
ansa
s
New
Mex
ico
Iow
a
Wes
t V
irgi
nia
Uta
h
Kan
sas
Nev
ada
Dis
tric
t o
f C
olu
mb
ia
Mai
ne
Idah
o
Neb
rask
a
Haw
aii
Ala
ska
Rh
od
e Is
lan
d
Mo
nta
na
Wyo
min
g
Del
awar
e
Ver
mo
nt
New
Ham
psh
ire
Sou
th D
ako
ta
No
rth
Dak
ota
FY 2013 Total Federal Spending on Selected Grants (in $ billions)
TOTAL FEDERAL SPENDING ON SELECTED GRANTS – FY 13
Median = 7.80 Avg. = 11.51
Source: Federal Funds Information for States (FFIS)
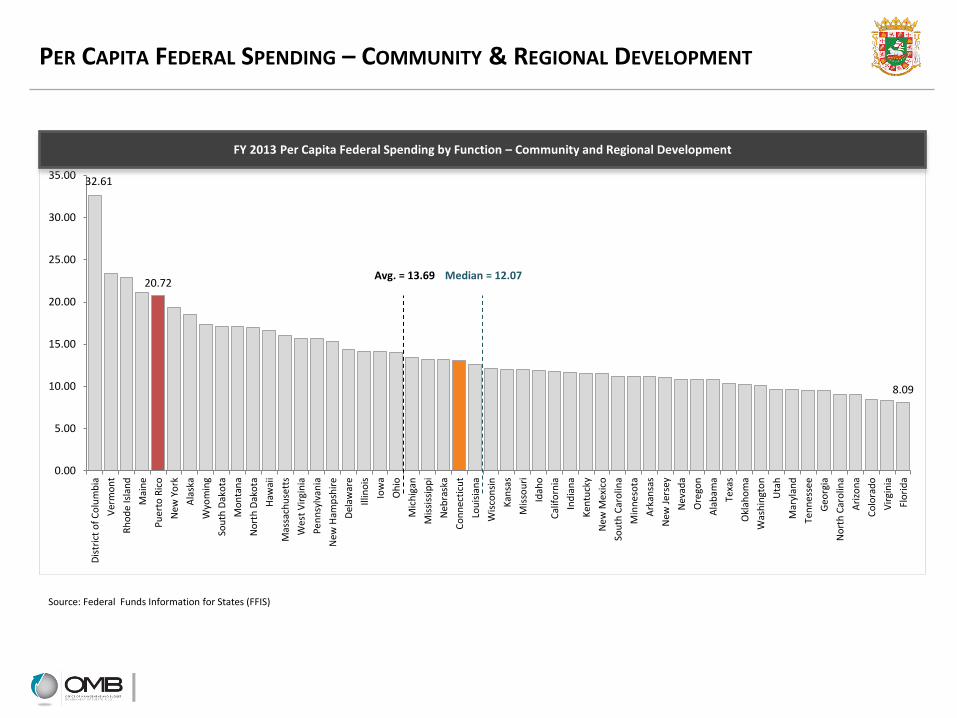
32.61
20.72
8.09
0.00
5.00
10.00
15.00
20.00
25.00
30.00
35.00
Dis
tric
t o
f C
olu
mb
ia
Ver
mo
nt
Rh
od
e Is
lan
d
Mai
ne
Pu
erto
Ric
o
New
Yo
rk
Ala
ska
Wyo
min
g
Sou
th D
ako
ta
Mo
nta
na
No
rth
Dak
ota
Haw
aii
Mas
sach
use
tts
Wes
t V
irgi
nia
Pe
nn
sylv
ania
New
Ham
psh
ire
Del
awar
e
Illin
ois
Iow
a
Oh
io
Mic
hig
an
Mis
siss
ipp
i
Neb
rask
a
Co
nn
ecti
cut
Lou
isia
na
Wis
con
sin
Kan
sas
Mis
sou
ri
Idah
o
Cal
ifo
rnia
Ind
ian
a
Ken
tuck
y
New
Mex
ico
Sou
th C
aro
lina
Min
ne
sota
Ark
ansa
s
New
Jer
sey
Nev
ada
Ore
gon
Ala
bam
a
Texa
s
Okl
aho
ma
Was
hin
gto
n
Uta
h
Mar
ylan
d
Ten
nes
see
Geo
rgia
No
rth
Car
olin
a
Ari
zon
a
Co
lora
do
Vir
gin
ia
Flo
rid
a
FY 2013 Per Capita Federal Spending by Function – Community and Regional Development
PER CAPITA FEDERAL SPENDING – COMMUNITY & REGIONAL DEVELOPMENT
Median = 12.07 Avg. = 13.69
Source: Federal Funds Information for States (FFIS)
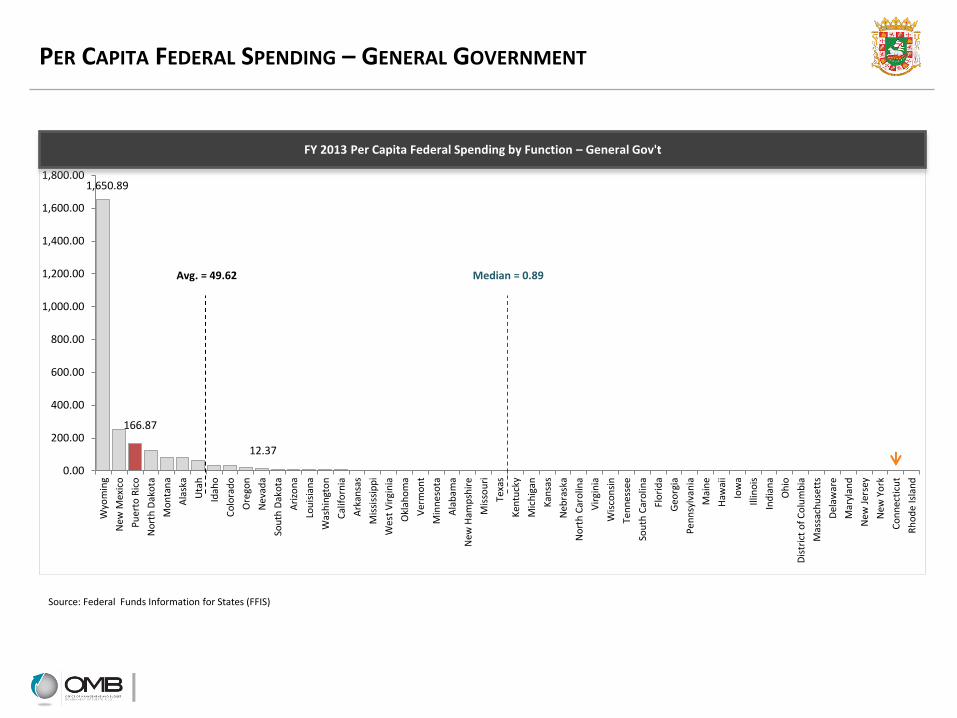
1,650.89
166.87
12.37
0.00
200.00
400.00
600.00
800.00
1,000.00
1,200.00
1,400.00
1,600.00
1,800.00
Wyo
min
g
New
Mex
ico
Pu
erto
Ric
o
No
rth
Dak
ota
Mo
nta
na
Ala
ska
Uta
h
Idah
o
Co
lora
do
Ore
gon
Nev
ada
Sou
th D
ako
ta
Ari
zon
a
Lou
isia
na
Was
hin
gto
n
Cal
ifo
rnia
Ark
ansa
s
Mis
siss
ipp
i
Wes
t V
irgi
nia
Okl
aho
ma
Ver
mo
nt
Min
ne
sota
Ala
bam
a
New
Ham
psh
ire
Mis
sou
ri
Texa
s
Ken
tuck
y
Mic
hig
an
Kan
sas
Neb
rask
a
No
rth
Car
olin
a
Vir
gin
ia
Wis
con
sin
Ten
nes
see
Sou
th C
aro
lina
Flo
rid
a
Geo
rgia
Pe
nn
sylv
ania
Mai
ne
Haw
aii
Iow
a
Illin
ois
Ind
ian
a
Oh
io
Dis
tric
t o
f C
olu
mb
ia
Mas
sach
use
tts
Del
awar
e
Mar
ylan
d
New
Jer
sey
New
Yo
rk
Co
nn
ecti
cut
Rh
od
e Is
lan
d
FY 2013 Per Capita Federal Spending by Function – General Gov't
PER CAPITA FEDERAL SPENDING – GENERAL GOVERNMENT
Avg. = 49.62 Median = 0.89
Source: Federal Funds Information for States (FFIS)
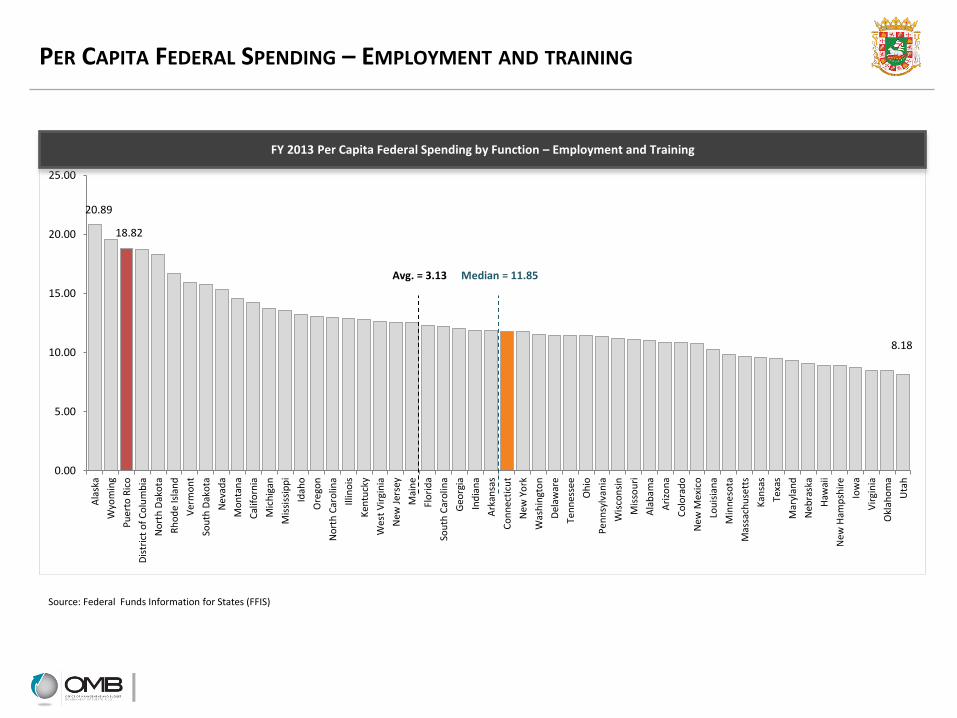
20.89
18.82
8.18
0.00
5.00
10.00
15.00
20.00
25.00
Ala
ska
Wyo
min
g
Pu
erto
Ric
o
Dis
tric
t o
f C
olu
mb
ia
No
rth
Dak
ota
Rh
od
e Is
lan
d
Ver
mo
nt
Sou
th D
ako
ta
Nev
ada
Mo
nta
na
Cal
ifo
rnia
Mic
hig
an
Mis
siss
ipp
i
Idah
o
Ore
gon
No
rth
Car
olin
a
Illin
ois
Ken
tuck
y
Wes
t V
irgi
nia
New
Jer
sey
Mai
ne
Flo
rid
a
Sou
th C
aro
lina
Geo
rgia
Ind
ian
a
Ark
ansa
s
Co
nn
ecti
cut
New
Yo
rk
Was
hin
gto
n
Del
awar
e
Ten
nes
see
Oh
io
Pe
nn
sylv
ania
Wis
con
sin
Mis
sou
ri
Ala
bam
a
Ari
zon
a
Co
lora
do
New
Mex
ico
Lou
isia
na
Min
ne
sota
Mas
sach
use
tts
Kan
sas
Texa
s
Mar
ylan
d
Neb
rask
a
Haw
aii
New
Ham
psh
ire
Iow
a
Vir
gin
ia
Okl
aho
ma
Uta
h
FY 2013 Per Capita Federal Spending by Function – Employment and Training
PER CAPITA FEDERAL SPENDING – EMPLOYMENT AND TRAINING
Median = 11.85 Avg. = 3.13
Source: Federal Funds Information for States (FFIS)
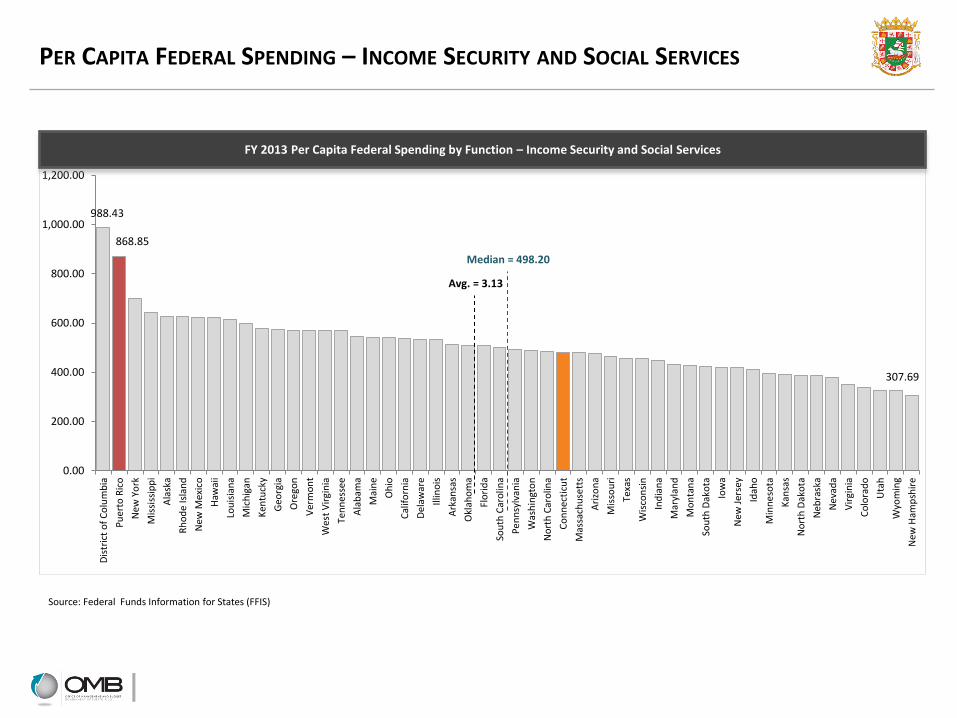
988.43
868.85
307.69
0.00
200.00
400.00
600.00
800.00
1,000.00
1,200.00
Dis
tric
t o
f C
olu
mb
ia
Pu
erto
Ric
o
New
Yo
rk
Mis
siss
ipp
i
Ala
ska
Rh
od
e Is
lan
d
New
Mex
ico
Haw
aii
Lou
isia
na
Mic
hig
an
Ken
tuck
y
Geo
rgia
Ore
gon
Ver
mo
nt
Wes
t V
irgi
nia
Ten
nes
see
Ala
bam
a
Mai
ne
Oh
io
Cal
ifo
rnia
Del
awar
e
Illin
ois
Ark
ansa
s
Okl
aho
ma
Flo
rid
a
Sou
th C
aro
lina
Pe
nn
sylv
ania
Was
hin
gto
n
No
rth
Car
olin
a
Co
nn
ecti
cut
Mas
sach
use
tts
Ari
zon
a
Mis
sou
ri
Texa
s
Wis
con
sin
Ind
ian
a
Mar
ylan
d
Mo
nta
na
Sou
th D
ako
ta
Iow
a
New
Jer
sey
Idah
o
Min
ne
sota
Kan
sas
No
rth
Dak
ota
Neb
rask
a
Nev
ada
Vir
gin
ia
Co
lora
do
Uta
h
Wyo
min
g
New
Ham
psh
ire
FY 2013 Per Capita Federal Spending by Function – Income Security and Social Services
PER CAPITA FEDERAL SPENDING – INCOME SECURITY AND SOCIAL SERVICES
Median = 498.20
Avg. = 3.13
Source: Federal Funds Information for States (FFIS)
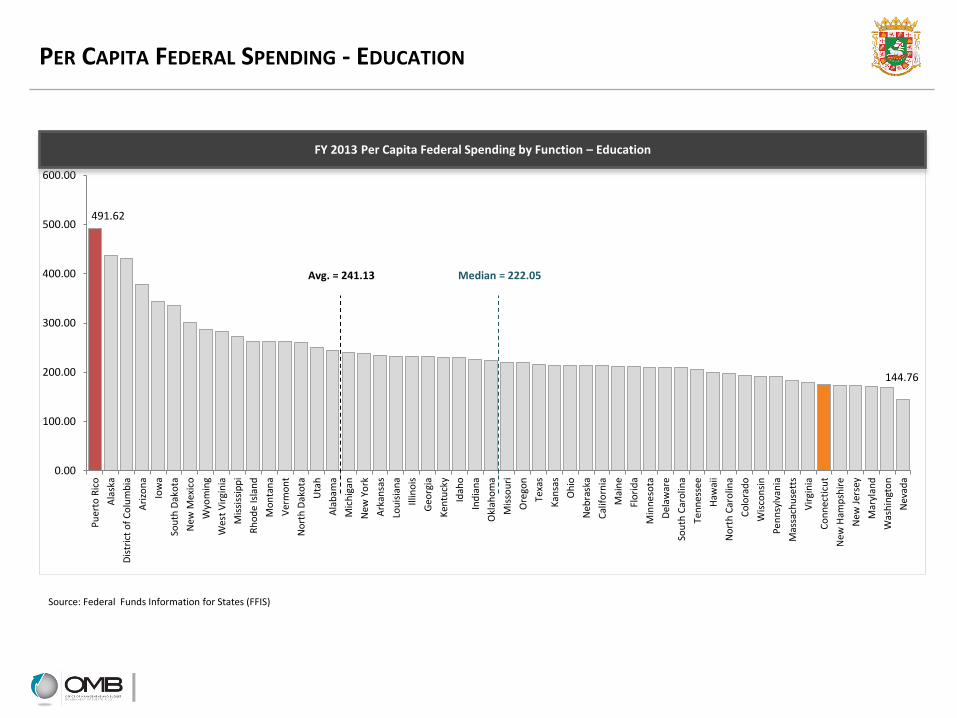
491.62
144.76
0.00
100.00
200.00
300.00
400.00
500.00
600.00
Pu
erto
Ric
o
Ala
ska
Dis
tric
t o
f C
olu
mb
ia
Ari
zon
a
Iow
a
Sou
th D
ako
ta
New
Mex
ico
Wyo
min
g
Wes
t V
irgi
nia
Mis
siss
ipp
i
Rh
od
e Is
lan
d
Mo
nta
na
Ver
mo
nt
No
rth
Dak
ota
Uta
h
Ala
bam
a
Mic
hig
an
New
Yo
rk
Ark
ansa
s
Lou
isia
na
Illin
ois
Geo
rgia
Ken
tuck
y
Idah
o
Ind
ian
a
Okl
aho
ma
Mis
sou
ri
Ore
gon
Texa
s
Kan
sas
Oh
io
Neb
rask
a
Cal
ifo
rnia
Mai
ne
Flo
rid
a
Min
ne
sota
Del
awar
e
Sou
th C
aro
lina
Ten
nes
see
Haw
aii
No
rth
Car
olin
a
Co
lora
do
Wis
con
sin
Pe
nn
sylv
ania
Mas
sach
use
tts
Vir
gin
ia
Co
nn
ecti
cut
New
Ham
psh
ire
New
Jer
sey
Mar
ylan
d
Was
hin
gto
n
Nev
ada
FY 2013 Per Capita Federal Spending by Function – Education
PER CAPITA FEDERAL SPENDING - EDUCATION
Median = 222.05 Avg. = 241.13
Source: Federal Funds Information for States (FFIS)
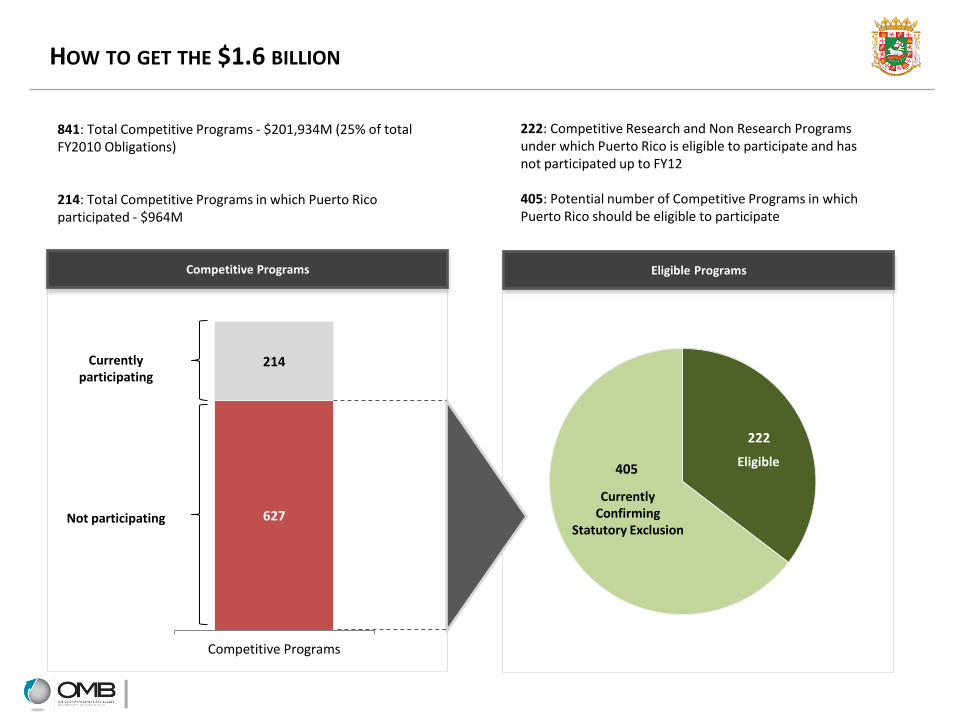
HOW TO GET THE $1.6 BILLION
Competitive Programs
627
214
Competitive Programs
Eligible Programs
222
405
Currently participating
Not participating
Currently Confirming
Statutory Exclusion
Eligible
841: Total Competitive Programs - $201,934M (25% of total FY2010 Obligations) 214: Total Competitive Programs in which Puerto Rico participated - $964M
222: Competitive Research and Non Research Programs under which Puerto Rico is eligible to participate and has not participated up to FY12 405: Potential number of Competitive Programs in which Puerto Rico should be eligible to participate
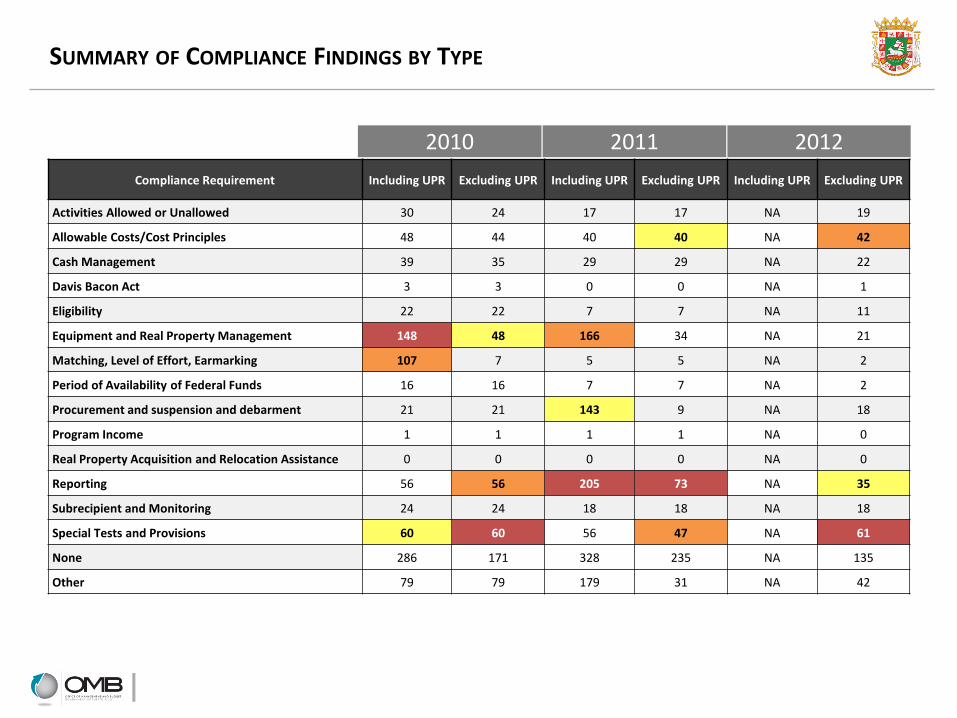
SUMMARY OF COMPLIANCE FINDINGS BY TYPE
Compliance Requirement Including UPR Excluding UPR Including UPR Excluding UPR Including UPR Excluding UPR
Activities Allowed or Unallowed 30 24 17 17 NA 19
Allowable Costs/Cost Principles 48 44 40 40 NA 42
Cash Management 39 35 29 29 NA 22
Davis Bacon Act 3 3 0 0 NA 1
Eligibility 22 22 7 7 NA 11
Equipment and Real Property Management 148 48 166 34 NA 21
Matching, Level of Effort, Earmarking 107 7 5 5 NA 2
Period of Availability of Federal Funds 16 16 7 7 NA 2
Procurement and suspension and debarment 21 21 143 9 NA 18
Program Income 1 1 1 1 NA 0
Real Property Acquisition and Relocation Assistance 0 0 0 0 NA 0
Reporting 56 56 205 73 NA 35
Subrecipient and Monitoring 24 24 18 18 NA 18
Special Tests and Provisions 60 60 56 47 NA 61
None 286 171 328 235 NA 135
Other 79 79 179 31 NA 42
2010 2011 2012
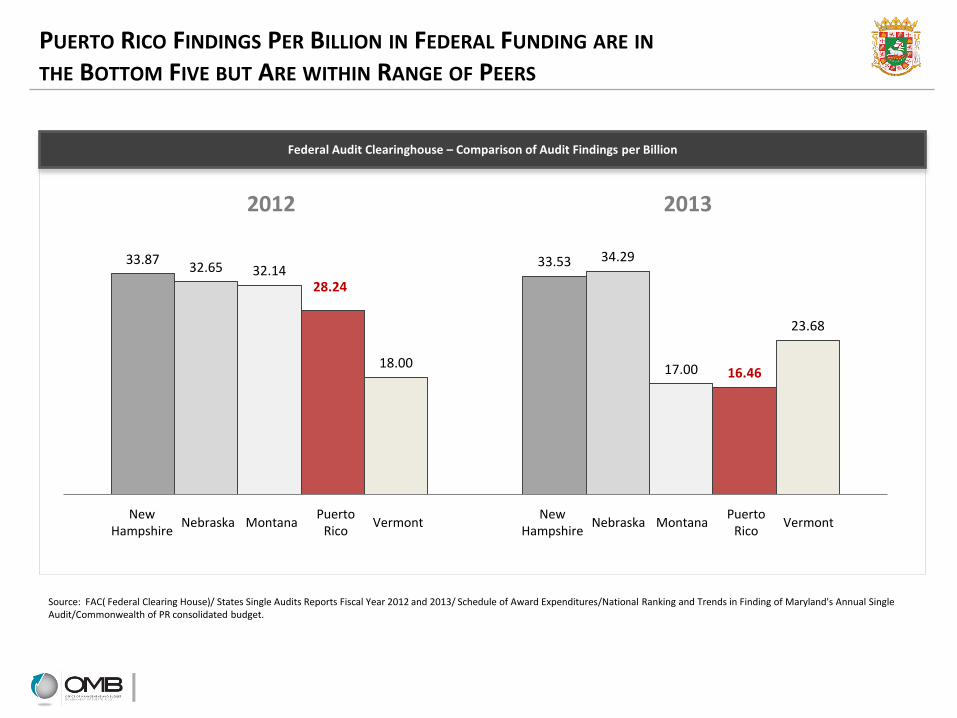
Federal Audit Clearinghouse – Comparison of Audit Findings per Billion
PUERTO RICO FINDINGS PER BILLION IN FEDERAL FUNDING ARE IN THE BOTTOM FIVE BUT ARE WITHIN RANGE OF PEERS
Source: FAC( Federal Clearing House)/ States Single Audits Reports Fiscal Year 2012 and 2013/ Schedule of Award Expenditures/National Ranking and Trends in Finding of Maryland's Annual Single Audit/Commonwealth of PR consolidated budget.
33.87 33.53 32.65 34.29
32.14
17.00
28.24
16.46 18.00
23.68
New Hampshire
Nebraska Montana Vermont Puerto
Rico New
Hampshire Nebraska Montana Vermont
Puerto Rico
2012 2013
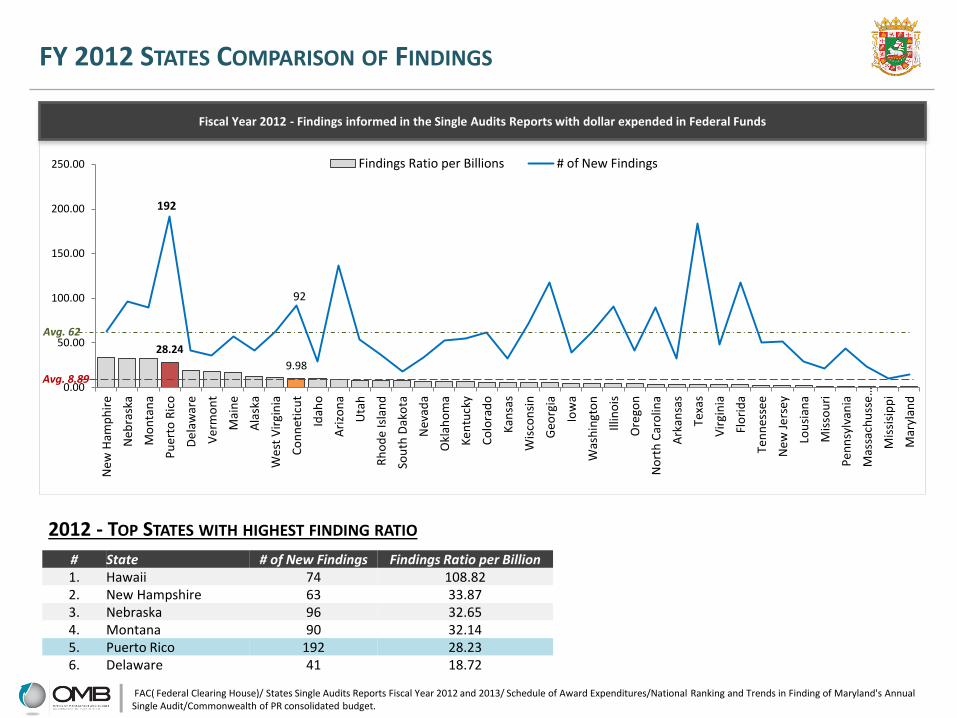
28.24
9.98
192
92
0.00
50.00
100.00
150.00
200.00
250.00
New
Ham
ph
ire
Neb
rask
a
Mo
nta
na
Pu
erto
Ric
o
De
law
are
Ve
rmo
nt
Mai
ne
Ala
ska
We
st V
irgi
nia
Co
nn
etic
ut
Idah
o
Ari
zon
a
Uta
h
Rh
od
e Is
lan
d
Sou
th D
ako
ta
Nev
ada
Okl
aho
ma
Ke
ntu
cky
Co
lora
do
Kan
sas
Wis
con
sin
Geo
rgia
Iow
a
Was
hin
gto
n
Illin
ois
Ore
gon
No
rth
Car
olin
a
Ark
ansa
s
Texa
s
Vir
gin
ia
Flo
rid
a
Ten
nes
see
New
Je
rse
y
Lou
sian
a
Mis
sou
ri
Pe
nn
sylv
ania
Mas
sach
uss
e…
Mis
sisi
pp
i
Mar
ylan
d
Findings Ratio per Billions # of New Findings
Fiscal Year 2012 - Findings informed in the Single Audits Reports with dollar expended in Federal Funds
FAC( Federal Clearing House)/ States Single Audits Reports Fiscal Year 2012 and 2013/ Schedule of Award Expenditures/National Ranking and Trends in Finding of Maryland's Annual Single Audit/Commonwealth of PR consolidated budget.
FY 2012 STATES COMPARISON OF FINDINGS
# State # of New Findings Findings Ratio per Billion 1. Hawaii 74 108.82 2. New Hampshire 63 33.87 3. Nebraska 96 32.65 4. Montana 90 32.14 5. Puerto Rico 192 28.23 6. Delaware 41 18.72
2012 - TOP STATES WITH HIGHEST FINDING RATIO
Avg. 8.89
Avg. 62
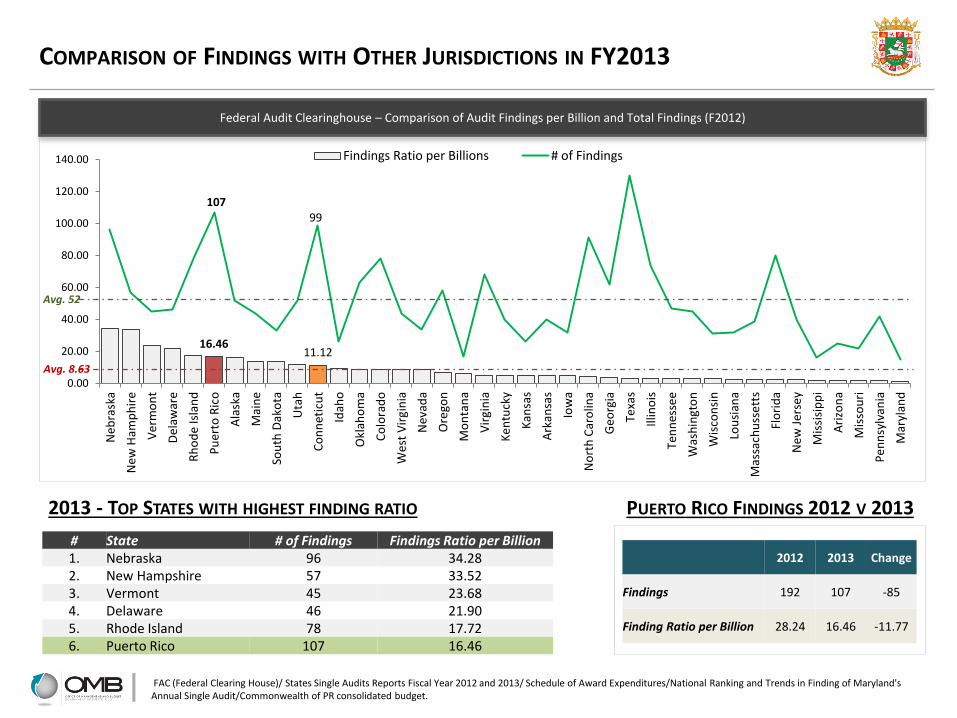
16.46 11.12
107 99
0.00
20.00
40.00
60.00
80.00
100.00
120.00
140.00
Neb
rask
a
New
Ham
ph
ire
Ve
rmo
nt
De
law
are
Rh
od
e Is
lan
d
Pu
erto
Ric
o
Ala
ska
Mai
ne
Sou
th D
ako
ta
Uta
h
Co
nn
etic
ut
Idah
o
Okl
aho
ma
Co
lora
do
We
st V
irgi
nia
Nev
ada
Ore
gon
Mo
nta
na
Vir
gin
ia
Ke
ntu
cky
Kan
sas
Ark
ansa
s
Iow
a
No
rth
Car
olin
a
Geo
rgia
Texa
s
Illin
ois
Ten
nes
see
Was
hin
gto
n
Wis
con
sin
Lou
sian
a
Mas
sach
uss
ett
s
Flo
rid
a
New
Je
rse
y
Mis
sisi
pp
i
Ari
zon
a
Mis
sou
ri
Pe
nn
sylv
ania
Mar
ylan
d
Findings Ratio per Billions # of Findings
Federal Audit Clearinghouse – Comparison of Audit Findings per Billion and Total Findings (F2012)
COMPARISON OF FINDINGS WITH OTHER JURISDICTIONS IN FY2013
# State # of Findings Findings Ratio per Billion 1. Nebraska 96 34.28 2. New Hampshire 57 33.52 3. Vermont 45 23.68 4. Delaware 46 21.90 5. Rhode Island 78 17.72 6. Puerto Rico 107 16.46
2013 - TOP STATES WITH HIGHEST FINDING RATIO PUERTO RICO FINDINGS 2012 V 2013
2012 2013 Change
Findings 192 107 -85
Finding Ratio per Billion 28.24 16.46 -11.77
FAC (Federal Clearing House)/ States Single Audits Reports Fiscal Year 2012 and 2013/ Schedule of Award Expenditures/National Ranking and Trends in Finding of Maryland's Annual Single Audit/Commonwealth of PR consolidated budget.
Avg. 8.63
Avg. 52
AGENDA
Impact of Federal Funds on Puerto Rico 1
Benchmarking of Potential Opportunity 2
Progress on PR Federal Funds Management Office 3
Next Steps and Upcoming Events 4
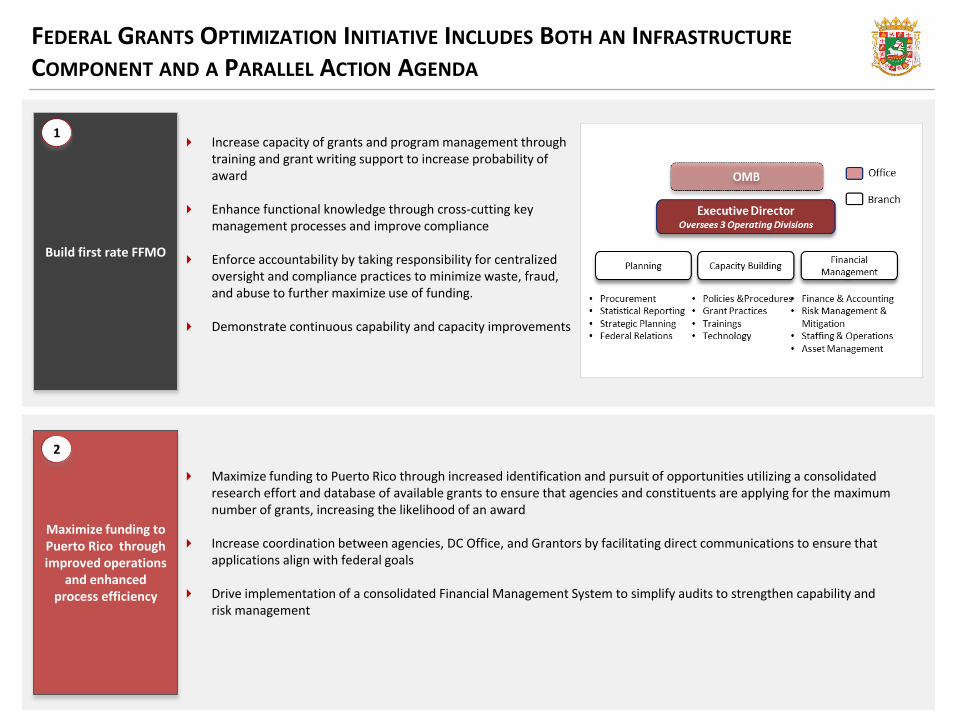
FEDERAL GRANTS OPTIMIZATION INITIATIVE INCLUDES BOTH AN INFRASTRUCTURE COMPONENT AND A PARALLEL ACTION AGENDA
Build first rate FFMO
Maximize funding to Puerto Rico through improved operations
and enhanced process efficiency
Maximize funding to Puerto Rico through increased identification and pursuit of opportunities utilizing a consolidated research effort and database of available grants to ensure that agencies and constituents are applying for the maximum number of grants, increasing the likelihood of an award
Increase coordination between agencies, DC Office, and Grantors by facilitating direct communications to ensure that applications align with federal goals
Drive implementation of a consolidated Financial Management System to simplify audits to strengthen capability and risk management
Increase capacity of grants and program management through training and grant writing support to increase probability of award
Enhance functional knowledge through cross-cutting key
management processes and improve compliance
Enforce accountability by taking responsibility for centralized oversight and compliance practices to minimize waste, fraud, and abuse to further maximize use of funding.
Demonstrate continuous capability and capacity improvements
1
2
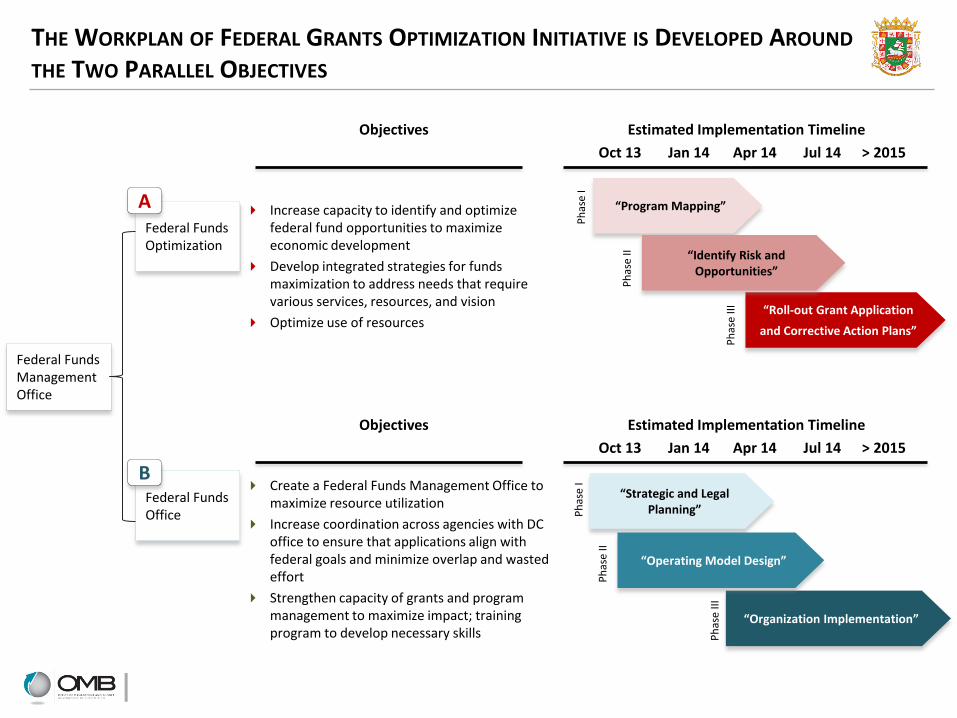
Federal Funds Optimization
Federal Funds Office
Objectives
Oct 13 Jan 14 Apr 14
Federal Funds Management Office - Our View of How to Structure this Initiative
> 2015 Jul 14
A
B Create a Federal Funds Management Office to
maximize resource utilization
Increase coordination across agencies with DC office to ensure that applications align with federal goals and minimize overlap and wasted effort
Strengthen capacity of grants and program management to maximize impact; training program to develop necessary skills
Increase capacity to identify and optimize federal fund opportunities to maximize economic development
Develop integrated strategies for funds maximization to address needs that require various services, resources, and vision
Optimize use of resources
Estimated Implementation Timeline
Federal Funds Management Office
THE WORKPLAN OF FEDERAL GRANTS OPTIMIZATION INITIATIVE IS DEVELOPED AROUND THE TWO PARALLEL OBJECTIVES
“Organization Implementation”
“Strategic and Legal Planning”
“Operating Model Design”
“Roll-out Grant Application
and Corrective Action Plans”
“Program Mapping”
“Identify Risk and Opportunities”
Objectives
Oct 13 Jan 14 Apr 14 > 2015 Jul 14
Estimated Implementation Timeline
Ph
ase
I
Ph
ase
II
Ph
ase
III
Ph
ase
I
Ph
ase
II
Ph
ase
III
30
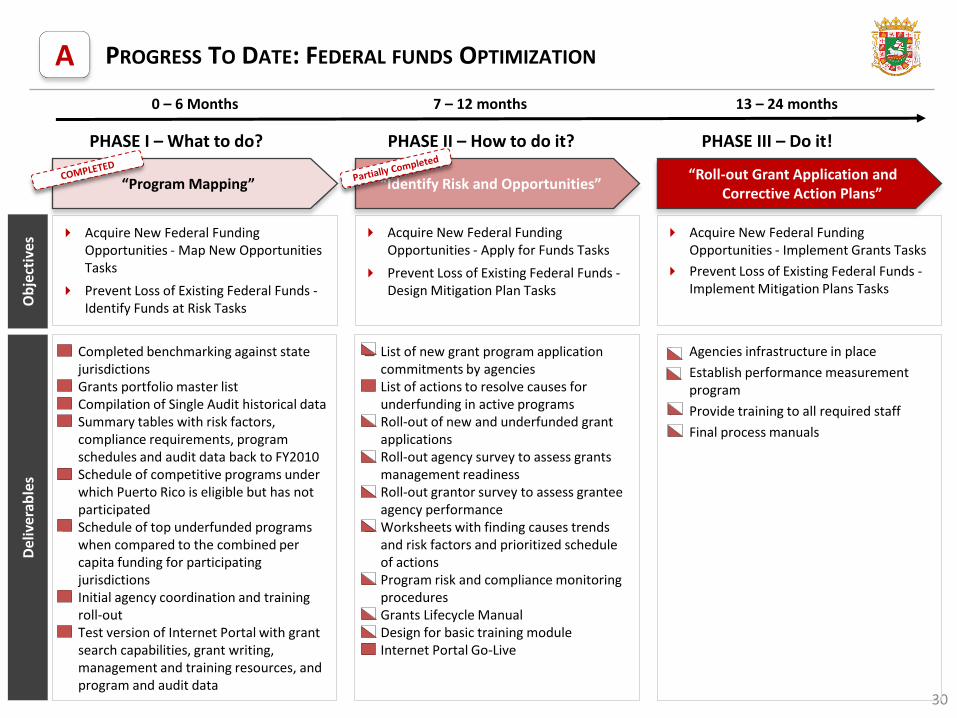
PROGRESS TO DATE: FEDERAL FUNDS OPTIMIZATION
Acquire New Federal Funding Opportunities - Apply for Funds Tasks
Prevent Loss of Existing Federal Funds - Design Mitigation Plan Tasks
Acquire New Federal Funding Opportunities - Map New Opportunities Tasks
Prevent Loss of Existing Federal Funds - Identify Funds at Risk Tasks
Acquire New Federal Funding Opportunities - Implement Grants Tasks
Prevent Loss of Existing Federal Funds - Implement Mitigation Plans Tasks
PHASE I – What to do? PHASE II – How to do it? PHASE III – Do it!
“Roll-out Grant Application and Corrective Action Plans”
“Program Mapping” “Identify Risk and Opportunities”
Ob
ject
ives
0 – 6 Months 7 – 12 months 13 – 24 months
List of new grant program application commitments by agencies
List of actions to resolve causes for underfunding in active programs
Roll-out of new and underfunded grant applications
Roll-out agency survey to assess grants management readiness
Roll-out grantor survey to assess grantee agency performance
Worksheets with finding causes trends and risk factors and prioritized schedule of actions
Program risk and compliance monitoring procedures
Grants Lifecycle Manual Design for basic training module Internet Portal Go-Live
Completed benchmarking against state jurisdictions
Grants portfolio master list Compilation of Single Audit historical data Summary tables with risk factors,
compliance requirements, program schedules and audit data back to FY2010
Schedule of competitive programs under which Puerto Rico is eligible but has not participated
Schedule of top underfunded programs when compared to the combined per capita funding for participating jurisdictions
Initial agency coordination and training roll-out
Test version of Internet Portal with grant search capabilities, grant writing, management and training resources, and program and audit data
Agencies infrastructure in place
Establish performance measurement program
Provide training to all required staff
Final process manuals
Del
iver
able
s
A
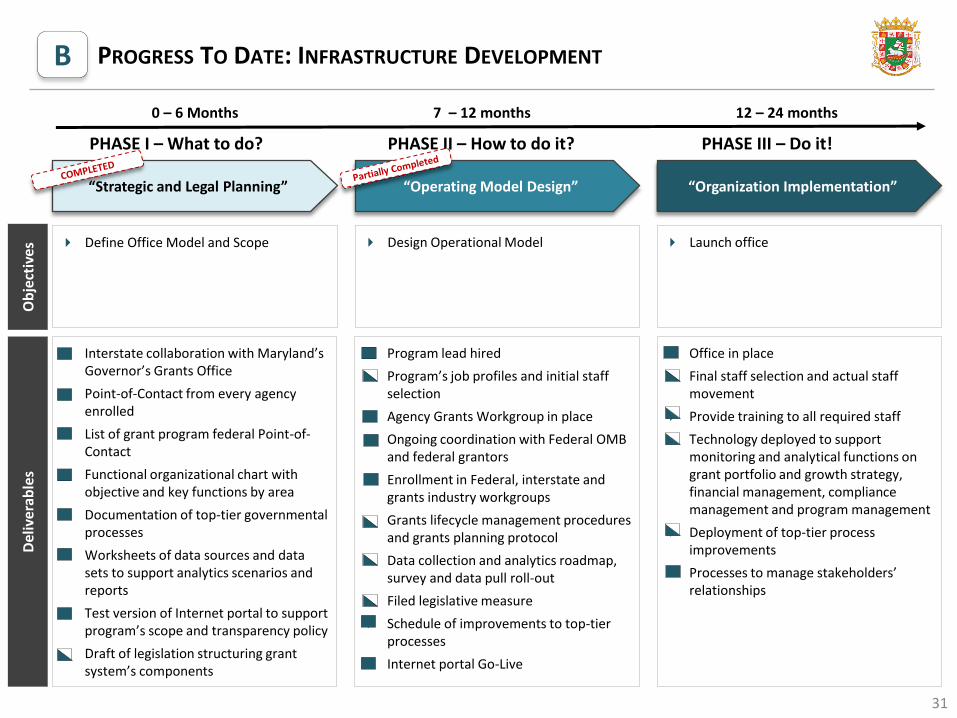
PROGRESS TO DATE: INFRASTRUCTURE DEVELOPMENT
Design Operational Model
Define Office Model and Scope
Launch office
PHASE I – What to do? PHASE II – How to do it? PHASE III – Do it!
“Organization Implementation” “Strategic and Legal Planning” “Operating Model Design”
Ob
ject
ives
0 – 6 Months 7 – 12 months 12 – 24 months
Program lead hired
Program’s job profiles and initial staff selection
Agency Grants Workgroup in place
Ongoing coordination with Federal OMB and federal grantors
Enrollment in Federal, interstate and grants industry workgroups
Grants lifecycle management procedures and grants planning protocol
Data collection and analytics roadmap, survey and data pull roll-out
Filed legislative measure
Schedule of improvements to top-tier processes
Internet portal Go-Live
Interstate collaboration with Maryland’s Governor’s Grants Office
Point-of-Contact from every agency enrolled
List of grant program federal Point-of-Contact
Functional organizational chart with objective and key functions by area
Documentation of top-tier governmental processes
Worksheets of data sources and data sets to support analytics scenarios and reports
Test version of Internet portal to support program’s scope and transparency policy
Draft of legislation structuring grant system’s components
Office in place
Final staff selection and actual staff movement
Provide training to all required staff
Technology deployed to support monitoring and analytical functions on grant portfolio and growth strategy, financial management, compliance management and program management
Deployment of top-tier process improvements
Processes to manage stakeholders’ relationships
Del
iver
able
s
B
31
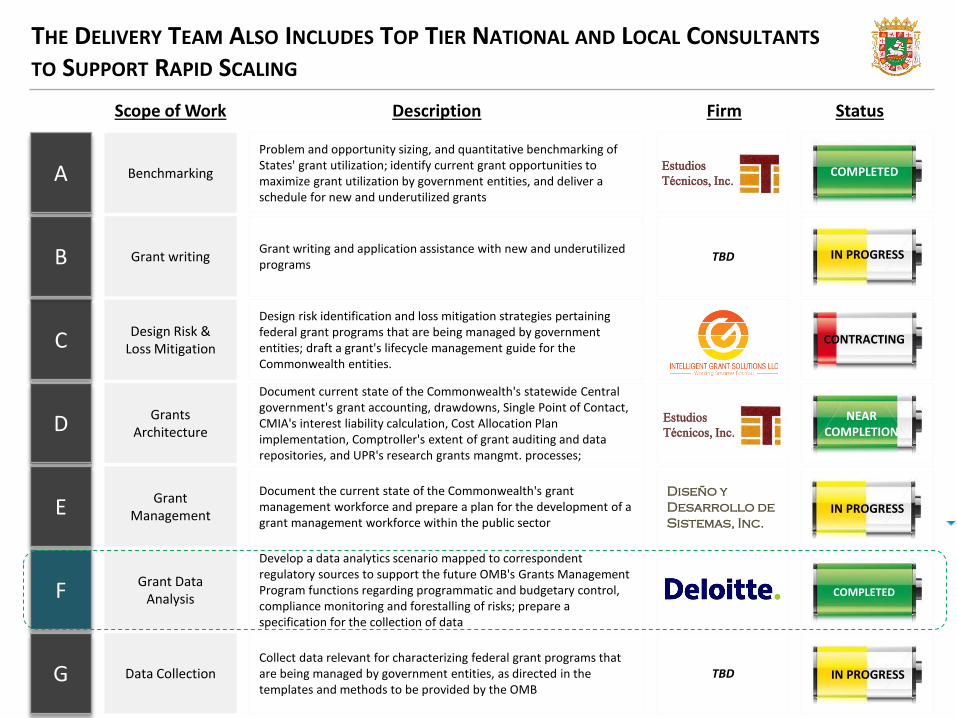
C
D
E
F
G
A
B
Design Risk & Loss Mitigation
Grants Architecture
Grant Management
Grant Data Analysis
Data Collection
Benchmarking
Grant writing
Design risk identification and loss mitigation strategies pertaining federal grant programs that are being managed by government entities; draft a grant's lifecycle management guide for the Commonwealth entities.
Document current state of the Commonwealth's statewide Central government's grant accounting, drawdowns, Single Point of Contact, CMIA's interest liability calculation, Cost Allocation Plan implementation, Comptroller's extent of grant auditing and data repositories, and UPR's research grants mangmt. processes;
Document the current state of the Commonwealth's grant management workforce and prepare a plan for the development of a grant management workforce within the public sector
Develop a data analytics scenario mapped to correspondent regulatory sources to support the future OMB's Grants Management Program functions regarding programmatic and budgetary control, compliance monitoring and forestalling of risks; prepare a specification for the collection of data
Collect data relevant for characterizing federal grant programs that are being managed by government entities, as directed in the templates and methods to be provided by the OMB
Problem and opportunity sizing, and quantitative benchmarking of States' grant utilization; identify current grant opportunities to maximize grant utilization by government entities, and deliver a schedule for new and underutilized grants
Grant writing and application assistance with new and underutilized programs
Diseño y
Desarrollo de
Sistemas, Inc.
TBD
Estudios Técnicos, Inc.
Estudios Técnicos, Inc.
TBD
COMPLETED
COMPLETED
IN PROGRESS
IN PROGRESS
IN PROGRESS
CONTRACTING
NEAR COMPLETION
Scope of Work Description Firm Status
THE DELIVERY TEAM ALSO INCLUDES TOP TIER NATIONAL AND LOCAL CONSULTANTS TO SUPPORT RAPID SCALING
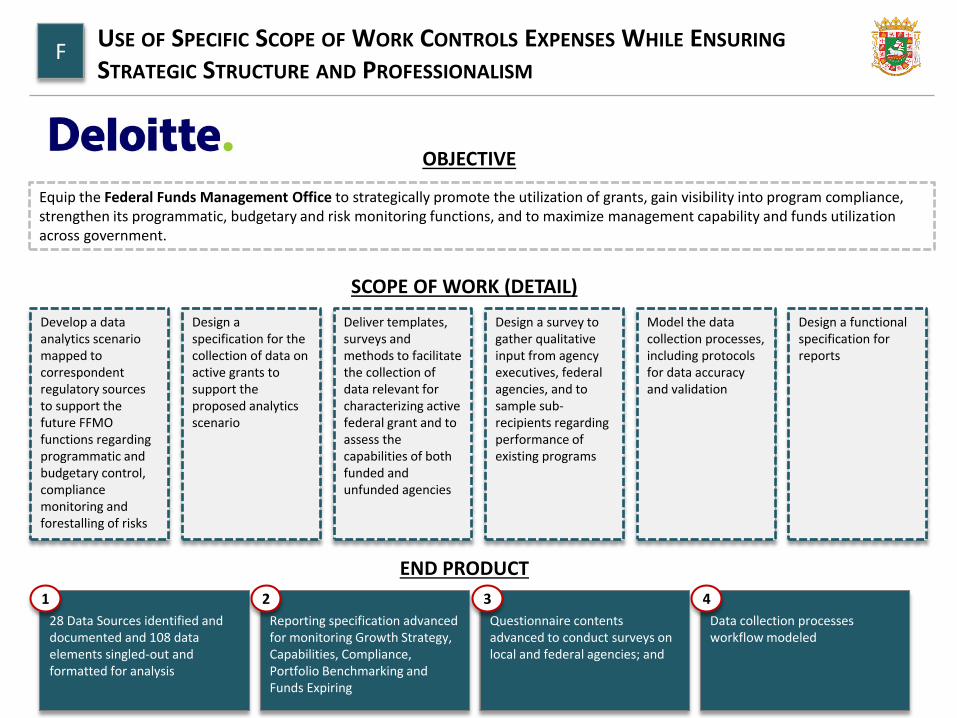
USE OF SPECIFIC SCOPE OF WORK CONTROLS EXPENSES WHILE ENSURING STRATEGIC STRUCTURE AND PROFESSIONALISM
F
Equip the Federal Funds Management Office to strategically promote the utilization of grants, gain visibility into program compliance, strengthen its programmatic, budgetary and risk monitoring functions, and to maximize management capability and funds utilization across government.
OBJECTIVE
SCOPE OF WORK (DETAIL)
Develop a data analytics scenario mapped to correspondent regulatory sources to support the future FFMO functions regarding programmatic and budgetary control, compliance monitoring and forestalling of risks
Design a specification for the collection of data on active grants to support the proposed analytics scenario
Deliver templates, surveys and methods to facilitate the collection of data relevant for characterizing active federal grant and to assess the capabilities of both funded and unfunded agencies
Model the data collection processes, including protocols for data accuracy and validation
Design a survey to gather qualitative input from agency executives, federal agencies, and to sample sub-recipients regarding performance of existing programs
Design a functional specification for reports
END PRODUCT
28 Data Sources identified and documented and 108 data elements singled-out and formatted for analysis
Reporting specification advanced for monitoring Growth Strategy, Capabilities, Compliance, Portfolio Benchmarking and Funds Expiring
Questionnaire contents advanced to conduct surveys on local and federal agencies; and
Data collection processes workflow modeled
1 2 3 4
AGENDA
Impact of Federal Funds on Puerto Rico 1
Benchmarking of Potential Opportunity 2
Progress on PR Federal Funds Management Office 3
Next Steps and Upcoming Events 4
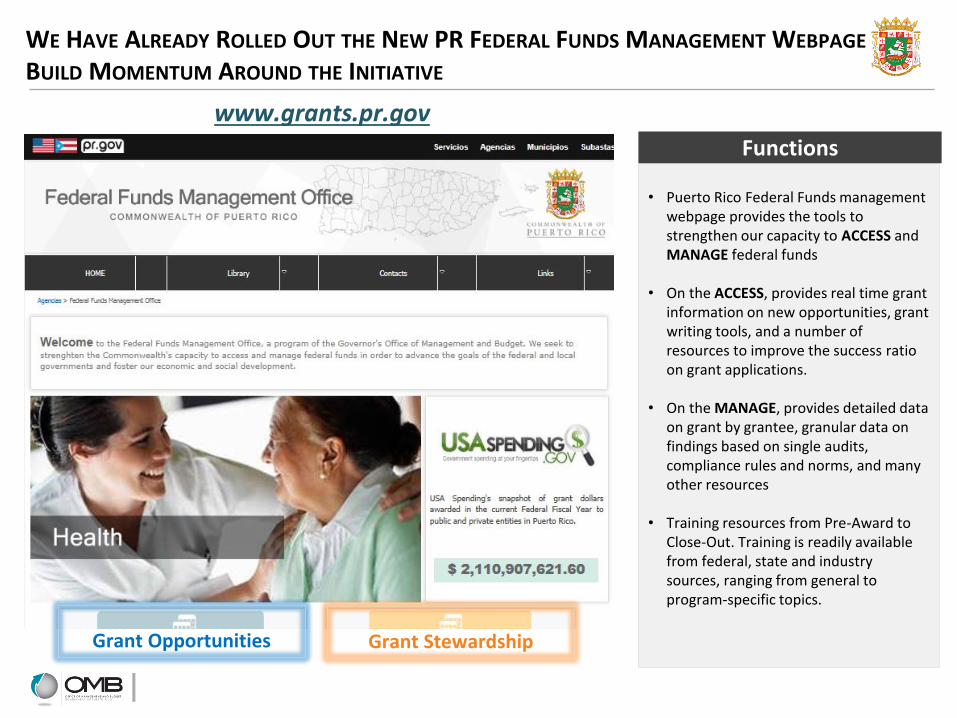
WE HAVE ALREADY ROLLED OUT THE NEW PR FEDERAL FUNDS MANAGEMENT WEBPAGE TO BUILD MOMENTUM AROUND THE INITIATIVE
www.grants.pr.gov
• Puerto Rico Federal Funds management
webpage provides the tools to strengthen our capacity to ACCESS and MANAGE federal funds
• On the ACCESS, provides real time grant information on new opportunities, grant writing tools, and a number of resources to improve the success ratio on grant applications.
• On the MANAGE, provides detailed data on grant by grantee, granular data on findings based on single audits, compliance rules and norms, and many other resources
• Training resources from Pre-Award to Close-Out. Training is readily available from federal, state and industry sources, ranging from general to program-specific topics.
Functions
Grant Stewardship Grant Opportunities
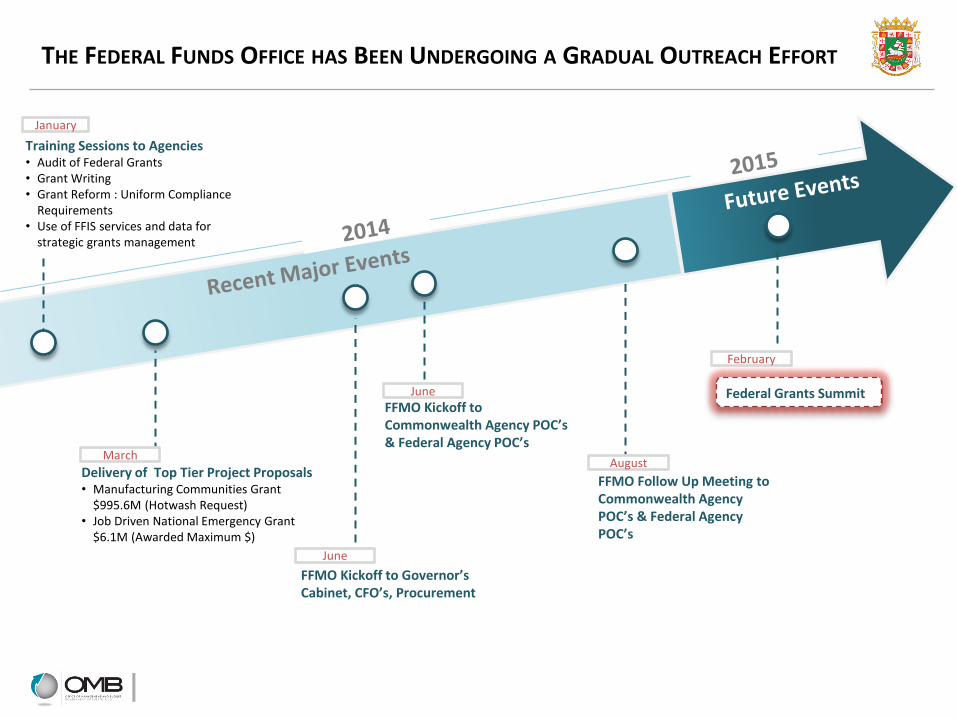
Training Sessions to Agencies • Audit of Federal Grants • Grant Writing • Grant Reform : Uniform Compliance
Requirements • Use of FFIS services and data for
strategic grants management
THE FEDERAL FUNDS OFFICE HAS BEEN UNDERGOING A GRADUAL OUTREACH EFFORT
Delivery of Top Tier Project Proposals • Manufacturing Communities Grant
$995.6M (Hotwash Request) • Job Driven National Emergency Grant
$6.1M (Awarded Maximum $)
FFMO Kickoff to Governor’s Cabinet, CFO’s, Procurement
FFMO Kickoff to Commonwealth Agency POC’s & Federal Agency POC’s
FFMO Follow Up Meeting to Commonwealth Agency POC’s & Federal Agency POC’s
Federal Grants Summit
January
March
June
June
August
February
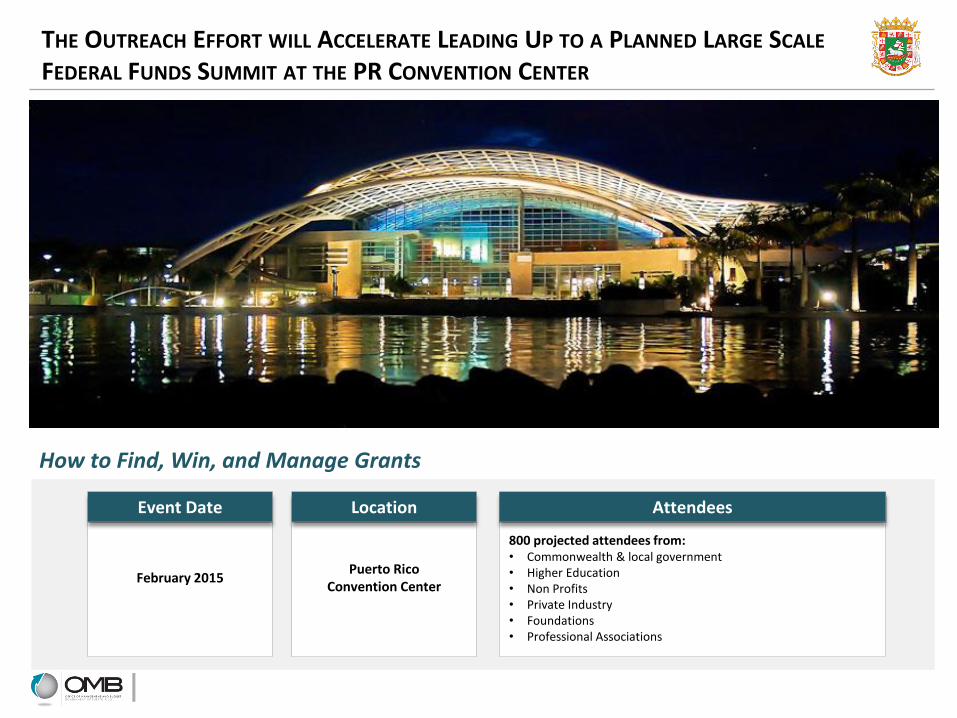
THE OUTREACH EFFORT WILL ACCELERATE LEADING UP TO A PLANNED LARGE SCALE FEDERAL FUNDS SUMMIT AT THE PR CONVENTION CENTER
How to Find, Win, and Manage Grants
February 2015
Event Date
Puerto Rico Convention Center
Location 800 projected attendees from: • Commonwealth & local government • Higher Education • Non Profits • Private Industry • Foundations • Professional Associations
Attendees
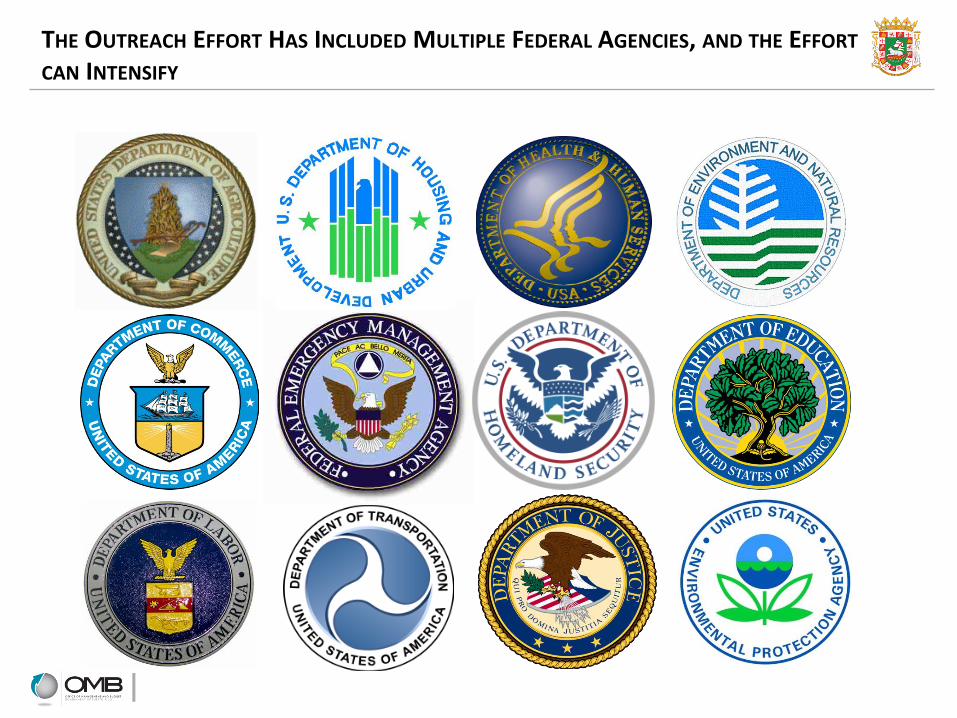
THE OUTREACH EFFORT HAS INCLUDED MULTIPLE FEDERAL AGENCIES, AND THE EFFORT CAN INTENSIFY