Embed Size (px)
Citation preview

1155 15th Street NW · Suite 900 · Washington, DC 20005 · Phone 202.621.2950
www.instituteforenergyresearch.org
BEFORE THE
HOUSE COMMITTEE ON ENERGY AND COMMERCE
SUBCOMMITTEE ON ENERGY
FEDERAL ENERGY RELATED TAX POLICY
AND ITS EFFECTS ON MARKETS, PRICES, AND CONSUMERS
MARCH 29, 2017
TESTIMONY OF ROBERT P MURPHY, PHD
SENIOR ECONOMIST, INSTITUTE FOR ENERGY RESEARCH
The Institute for Energy Research (IER) is a non-profit organization that conducts research and
analysis on the functions, operations, and government regulation of global energy markets. IER
articulates free market positions that respect private property rights and promote efficient
outcomes for energy consumers and producers. IER staff and scholars educate policymakers and
the general public on the economic and environmental benefits of free market energy. The
organization was founded in 1989 as a public foundation under Section 501(c)(3) of the Internal
Revenue Code. Funding for the institute comes from tax-deductible contributions of individuals,
foundations, and corporations.
Executive Summary
Economists generally agree that decentralized markets, operating through private property and
the profit-and-loss test, allocate resources better than top-down central planning. In the context
of tax policy, this principle means that policymakers should try to raise the desired amount of
revenue in a manner that distorts consumer and producer behavior as little as possible.
This principle is routinely violated when it comes to tax policy and energy markets. A recent
study estimates that from 2016-2020, the federal tax code will provide artificial support through
energy-specific provisions that cost the Treasury (in the form of forfeited revenues) $82.7
billion, with the renewables provisions of the Production Tax Credit and Investment Tax Credit
holding the #1 and #2 spots, receiving 47.5% of the total subsidy between them.
According to the Energy Information Administration (EIA), in Fiscal Year 2013 direct federal
financial interventions (a measure that includes, but is not limited to, tax expenditures) for

2
electricity production directed $5.9 billion to wind and $4.4 billion to solar, yet only $901
million for coal and $690 million for natural gas and petroleum electricity production. The
difference in federal support is even more striking when adjusted for the level of output: On a
per-megawatt-hour basis, in FY 2013 solar received $231 of support and wind received $35,
while natural gas and petroleum received 67 cents and coal received 57 cents.
As these figures amply demonstrate, federal tax policy currently provides artificial
encouragement to some sectors (such as wind and solar) at the expense of other energy sources.
The popular slogan “all of the above” to characterize a sensible U.S. energy policy is defensible,
if it means that policymakers will foster a level playing field. Artificially promoting the
development of wind and solar actually raises the true cost of electricity generation, because it is
currently much cheaper to produce electricity (all things considered) through coal and natural gas
plants, rather than new wind and solar.
As these newer technologies develop, the market may gradually shift to a greater reliance upon
them. However, if policymakers continue to use the tax code (as well as direct spending and
regulations) to artificially promote the expansion of some energy sources, this will further distort
behavior, reducing consumer welfare and in particular making the energy sector less efficient.
Introduction
Policymakers, members of the public, and even late-night comedians recognize there are
problems with the current U.S. tax code. As a bipartisan presidential panel on tax reform
concluded in 2005:
If you were to start from scratch, the current tax code would provide a guide on
what to avoid…[W]e have a tax code that distorts basic economic decisions, sets
up incentives for unwise or unproductive investments, and induces people to work
less, save less, and borrow more. By some estimates, this economic waste may be
as much as $1 trillion each year.1
One example that economists often use to show how the tax code perversely encourages
borrowing is the corporate tax treatment of debt versus equity finance. “[U]nder the U.S. tax
system, corporations may deduct payments of interest from taxable income, but are not allowed
to deduct dividends. The tax law therefore builds in a bias towards debt financing.”2
1 President’s Advisory Panel on Federal Tax Reform, 2005, p. 1, quoted in Harvey S. Rosen and Ted Gayer, Public Finance (New York: McGraw-Hill/Irwin), 9th edition, 2010, p. 477. 2 Rosen and Gayer, Public Finance, p. 450.
3
However, although such commentary is common—and is very useful to get the general public as
well as policymakers to see the way the tax code encourages behavior (in this case, a reliance on
debt versus equity financing) that many see as undesirable—the “solution” often advanced is
arguably a cure worse than the disease. Specifically, many tax reform proposals would deal with
this problem by eliminating a firm’s ability to deduct interest payments from its taxable income.
Yet this suggested fix doesn’t really match the tax treatment to the accounting realities; after all,
from a company’s perspective, interest payments to bond holders are a business expense, just as
surely as wage payments to employees.
Rather than saying, “By allowing the deductibility of interest expense, the tax code artificially
favors debt finance,” it would be more accurate to say, “By taxing net income, the corporate tax
artificially penalizes equity finance.” In any event, economists generally agree that the high rate
of U.S. corporate income taxation—currently the highest among advanced economies and one of
the highest in the world3—distorts business decisions, including the method of financing. This
effect is by no means trivial: A 2001 academic study by Gordon and Lee estimated that
“lowering the corporate [tax] rate by 10 percentage points lowers the percentage of the firm’s
assets financed by debt by 4 percent.”4
As this discussion indicates, the U.S. federal tax code has the power not simply to raise revenue
for the government, but also to alter behavior by households and firms. Generally speaking, it is
economically undesirable for members of the private sector to make decisions because of the tax
code. Yet we have also seen that having a broad economic framework for interpreting the
impacts of the tax code is also important, lest policymakers tweak the code to address a specific
problem in ways that simply invite further difficulties down the road.
The distortions emanating from the tax code occur across the economy, but our topic in this
analysis is the impact on energy markets in particular. Yet before we discuss this narrower field,
we should first provide a general framework of the economic analysis of taxes.
General Principles in the Economic Analysis of the Tax Code
Before analyzing the specifics of U.S. federal tax policy and its effects on energy markets, we
should first provide a general framework for the economic analysis of the tax code. Although
3 Kyle Pomerleau, “Corporate Income Tax Rates around the World, 2016,” Tax Foundation, August 18, 2016, available at: https://taxfoundation.org/corporate-income-tax-rates-around-world-2016. 4 The quotation is from Rosen and Gayer, Public Finance, p. 451. They are referring to Roger H. Gordon and Young Lee, “Do Taxes Affect Corporate Debt Policy? Evidence from U.S. Corporate Tax Return Data” (2001), Journal of Public Economics 8: 195-224.

4
economists would differ in the importance they might attribute to each of the considerations in
this section, the principles we discuss here are standard in this literature.5
The Economic Harm of an Inefficient Tax
Although the press often reports on tax code changes in terms of dollars—e.g. a “$240 billion tax
hike over ten years”—academic economists usually have something else in mind when they
discuss the economic harm or damage of the tax code. It is not the mere transfer of purchasing
power from the taxpayers to the government that is the issue; after all, perhaps the government in
principle could spend the money on something socially useful. Rather, when economists talk
about the inefficiency of the tax code, they usually mean that it is distorting behavior away from
the optimal patterns that would exist in the absence of tax incentives.
Among economists there is a default presumption in favor of allocating resources not through
top-down, command-and-control policies, but rather through the decentralized decisions of
consumers and firms operating in the context of a market economy with private property rights
and freely floating prices. To be sure, any economics textbook could list specific areas in which
the “free market outcome” might need to be augmented because of imperfections, but
nonetheless there is a general presumption in favor of letting consumers and entrepreneurs
“spontaneously” determine how society’s scarce resources (including workers’ labor hours) will
be allocated among specific industries. The market’s profit-and-loss test—operating on the basis
of the “true” prices reflecting genuine scarcity—is the feedback mechanism by which resources
are channeled into their most valuable uses.
Absent a compelling reason to doubt the market outcome in a particular case, as a general rule it
will reduce the efficiency of the economic system when the tax code distorts incentives and leads
consumers and producers to behave differently. To repeat, this is a different concept from the
mere amount of tax revenues raised by a certain tax. For example, a $1 per box tax on Cheerios
might raise the same total tax receipts as (say) a nickel tax on all cereal boxes, but most
economists would consider the latter approach to be much more sensible, since it would raise the
revenue in a way that did not distort consumer choices nearly as much.
When a tax causes individuals to alter their behavior in inefficient ways, the result is a
deadweight loss to society; the private sector ends up poorer, not just because of the immediate
loss of tax payments to the government, but also because tradeoffs have been artificially
distorted by the tax code.
5 For a textbook reference on the general discussion in this section, see Harvey S. Rosen and Ted Gayer, Public Finance (New York: McGraw-Hill/Irwin), 9th edition, 2010, especially chapters 15-17, 19, and 21.
5
Economists quantify a particular tax’s inefficiency according to its excess burden, which means
the extra amount by which the taxpayer is made poorer, in order to transfer a particular amount
of revenue to the tax collector. Economists differ widely in their estimates of the excess burden
of U.S. taxation, but one 2006 analysis from an expert in the field concluded that it cost the
private sector $1.75 for every $1 raised in government revenue.6
Examples of Economic Distortions Arising from the Tax Code
By artificially penalizing (or rewarding) certain behaviors, the tax code can distort activity and
(in general) reduce economic efficiency. These distortions can take place on many fronts.
For example, because the tax code typically focuses on market exchanges, it distorts the tradeoff
between labor and leisure. Consider a worker who earns $50 per hour of labor. Absent any tax
considerations, the worker will supply additional labor hours until the point at which he values
(on the margin) an hour of leisure more than the extra goods and services he could obtain with an
additional $50. However, if there is a 10 percent sales tax, then an extra $50 in hand will really
only yield approximately an extra $45 worth of goods and services to the worker. This will
artificially reduce the attractiveness of selling labor time for wages, and will (other things equal)
lead workers in the aggregate to consume more leisure, i.e. to work fewer hours.
For another example, consider an income tax. Like a sales tax, it too distorts the labor/leisure
decision and reduces the attractiveness of working. However, a typical income tax contains the
additional distortion that it artificially penalizes saving. Consider a worker who earns $10,000 in
gross income, when interest rates are 3%. In the absence of any taxation, the worker can
consume her income today and enjoy $10,000 worth of goods and services. Or, she can save her
money for a year, earn an additional $300 in interest income, and enjoy $10,300 in goods and
services next year. But with a 10% income tax, the tradeoff becomes $9,000 in enjoyment today
versus $9,243 in enjoyment next year. Instead of reaping the full $9,000 x 3% = $270 in interest
income as a reward for her year of abstinence, the worker is now only gaining an extra $243 in
consumption by waiting for a year, because the gross interest income of $270 ( = $9,000 x 3%)
was also taxed at 10%, meaning an extra $27 went to the government on top of the original
$1,000 income tax paid on the $10,000 in wage income. Thus, this worker is less likely to work,
and on top of that is less likely to save, because of the artificial distortion of the income tax.
6 The 75 percent estimate comes from Martin Feldstein, “The effects of taxes on efficiency and growth” (2006), NBER Working Paper No. 12201. Feldstein’s result and a broader discussion can be found in James R. Hines Jr., “Excess Burden of Taxation” (2007), Office of Tax Policy Research, University of Michigan Ross School of Business, May 31, 2007, available at: http://www.bus.umich.edu/otpr/WP2007-1.pdf.

6
Minimizing the Excess Burden of Taxation
If the goal were to raise a given amount of revenue with as little distortion as possible, one
solution would be to impose an equal, lump-sum head tax on every citizen. For example, if the
government wanted to raise $3.3 trillion in revenue, and we assume there are 330 million
identifiable people in the United States, then one possible tax system would simply assign a tax
bill of $10,000 to every man, woman, and child in the country. If this were feasible, it would
raise (roughly) the same amount as the current tax code but with hardly any distortion, because
Americans’ tax bill would have nothing to do with their behavior (except perhaps for the
decision to remain within the United States).
However, most people—including economists—recognize that such an approach, although very
efficient, violates the principle of tax equity. One obvious consideration when it comes to equity
is “ability to pay”; most people think a billionaire should pay more dollars in tax than someone
with no income or assets.
In this document, it is not my purpose to argue for a particular “optimal” design of tax policy.
There are competing principles at stake, such as the tradeoff between efficiency and equity, as
well as the broader, more philosophical questions of the proper size of government and the
proper amount of resources to be transferred to the political sector away from the private sector.
Although we will not seek to answer these difficult questions here, even so we can (in the
remainder of this subsection) consider methods of reducing the excess burden of taxation, i.e.
ways of making the tax code more efficient. Then in later sections we apply our discussion to the
case of energy markets.
A standard goal for minimizing inefficiency is to keep tax rates as low as possible, by applying
them to as wide a base as possible. If we are to have an income tax, this means consolidating the
number of tax brackets and reducing arbitrary deductions7 and credits currently available. The
logical end result of this approach would be a single, flat tax applied uniformly to the properly
calculated net income of the entity.8
7 It is important to note the word “arbitrary” in our statement. If a business is being taxed on its net income, it is perfectly sensible to allow the business to deduct its legitimate business expenses and thus reduce its taxable income. Part of the difficulty in tax reform is the treatment of household expenditures. When a household buys a new car, is that an investment or consumption? 8 A classic case for a single rate flat tax is Robert E. Hall and Alvin Rabushka, The Flat Tax (Hoover Institution), 2nd edition, 2007, available at: http://www.hoover.org/research/flat-tax. Note, however, that by allowing for the full deductibility of investment expenditures, the Hall/Rabushka flat tax is essentially a consumption tax, not an income tax.
7
The direct benefit of such a tax code is that it raises the target amount of revenue with the
smallest top marginal tax rate (by using a single rate and the broadest possible base). Thus it
minimizes the distortions we have discussed, on the leisure-labor and consumption-saving
decisions. In other words, such a tax would reduce the current penalties on working and
investment.
Beyond this direct benefit, there would also be economic gains in the form of the reduced
compliance costs. Without myriad deductions and credits, households and firms would no longer
need to retain as much paperwork, and would also save an extraordinary amount of time—both
their own and the time outsourced to tax professionals—with a much simpler tax code.
Finally, if households and businesses knew that there was a firm commitment to simplicity in the
tax code, they would reduce the amount of resources devoted to rent seeking. Currently, the tax
code contains high (some might argue punitive) marginal rates as the default, but with many
deductions and credits that favor particular groups or activities, thus shielding them from the
high rates. But when the tax code implicitly “picks winners and losers,” not only does this
directly distort behavior, but it also makes it worthwhile for various groups to spend resources
lobbying policymakers to tweak the tax code in ways favorable to them. Although these efforts
are rational at the individual level, in the aggregate they are largely an “arms’ race” that renders
the resulting tax code even worse from an efficiency standpoint. A truly simple tax code would
reduce the resources spent on such efforts. Resources would be allocated primarily through the
incentives given by market prices, not the tax code.
This brief discussion has distilled some of the key principles of tax analysis from an academic
economics perspective. In the real world, there are other considerations besides “textbook”
efficiency (and equity). For example, a tax “reform” package might introduce new taxes that in
theory are more efficient while phasing out other taxes. On paper this would seem to be a
desirable change, but if in reality policy makers reintroduced the original tax on top of the new
additions, then the result could be worse than the status quo.
Despite these difficulties, the framework we have presented summarizes some of the key lessons
from economists on tax policy. We now apply this framework specifically to the tax code and
energy markets.
THE U.S. FEDERAL TAX CODE AND ENERGY MARKETS
The general principles we discussed above apply to energy markets. For example, it is popular to
endorse an “all of the above” approach to the various sources of energy production. We agree,
but note that this does not mean that the tax code (or regulatory policy) should be designed with
the intention of promoting certain energy sources while penalizing others.
8
Instead, an appropriate “all of the above” approach means setting a uniform playing field, with as
low a tax rate as possible applied evenly to as broad a base as possible, so that the target amount
of revenue is raised while minimizing the distortion of behavior. Just as consumer choice, guided
by market prices, leads to the allocation of resources among different types of restaurants, so too
should consumers ultimately be the ones to determine the market’s mix of energy sources.9
In the remainder of this document we summarize some of the key facts concerning the tax
treatment of the energy sector, and how this distorts markets and reduces consumer well being.
Energy Information Administration (EIA) Assessment of Energy “Subsidies” as of FY 2013
The Energy Information Administration (EIA), an independent agency within the Department of
Energy (DOE), in 2015 issued a report on the “direct federal financial interventions and
subsidies that are provided by the federal government, provide a financial benefit with an
identifiable federal budget impact, and are specifically targeted at energy markets,” for Fiscal
Year 2013.10 The term “subsidy” here is construed broadly, and includes not only direct cash
assistance but also preferential treatment in the tax code that reduces an entity’s tax liability.11
We present some of EIA’s key findings below.
9 We deal with possible objections to such a strategy—such as the “market failure” argument in the context of carbon dioxide emissions and climate change—below. 10 Energy Information Administration, “Direct Federal Financial Interventions and Subsidies in Energy in Fiscal Year 2013,” March 12, 2015, available at: https://www.eia.gov/analysis/requests/subsidy/. 11 The EIA report notes (p. xi) that because it focuses on measures that are specifically targeted to the energy sector, its analysis does not include all federal provisions that might benefit the energy sector. For example, “Section 199 of the American Jobs Creation Act of 2004, referred to as the domestic manufacturing deduction, provides reductions in taxable income for American manufacturers, including domestic oil and gas producers and refiners.” In later sections we address some of the popular complaints about the “tax breaks” given to the oil industry.

9
Table 1. Value of Energy Subsidies By Major Use, FY 2010 and FY 2013 (millions of 2013
dollars)
Source: EIA (2015), “Direct Federal Financial Interventions and Subsidies in Energy in Fiscal
Year 2013,” Table ES1.
As Table 1 indicates, as of FY 2013 EIA had cataloged some $29 billion in direct federal
financial intervention in energy markets, with $16 billion going to electricity, $5 billion going to
other fuels, and just under $8 billion going to conservation, end uses, and low-income energy
assistance.
We now break down the totals by energy type.
10
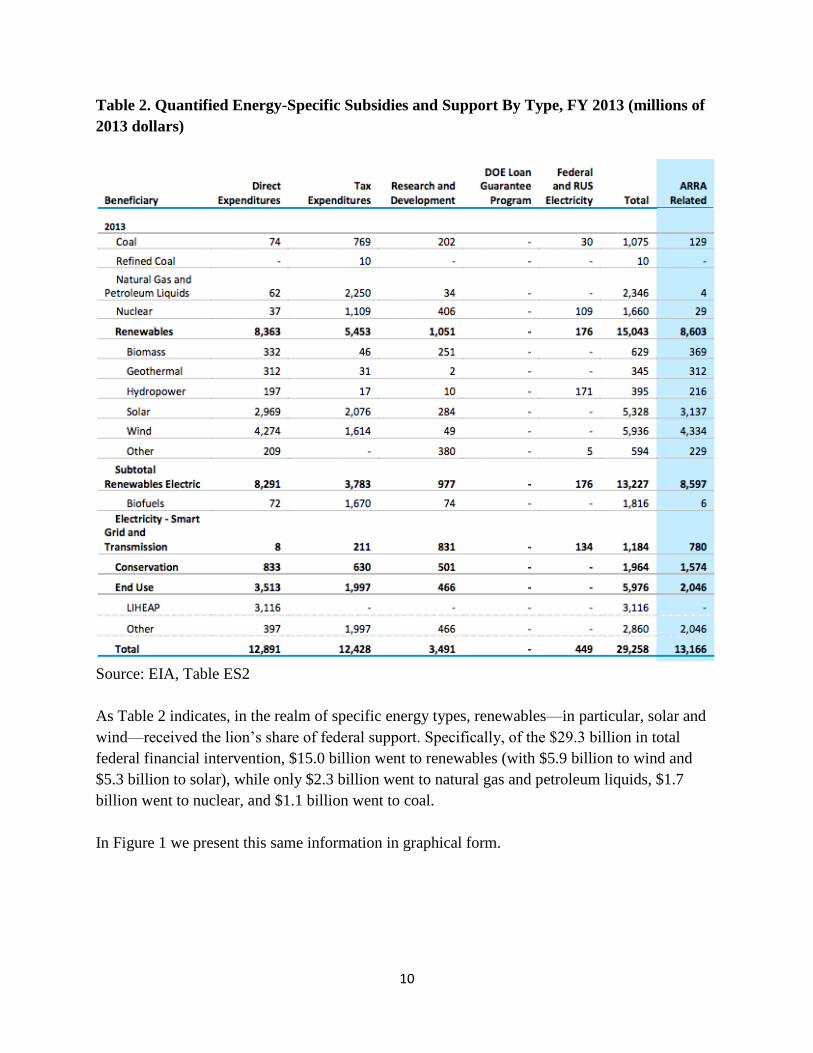
Table 2. Quantified Energy-Specific Subsidies and Support By Type, FY 2013 (millions of
2013 dollars)
Source: EIA, Table ES2
As Table 2 indicates, in the realm of specific energy types, renewables—in particular, solar and
wind—received the lion’s share of federal support. Specifically, of the $29.3 billion in total
federal financial intervention, $15.0 billion went to renewables (with $5.9 billion to wind and
$5.3 billion to solar), while only $2.3 billion went to natural gas and petroleum liquids, $1.7
billion went to nuclear, and $1.1 billion went to coal.
In Figure 1 we present this same information in graphical form.

11
Figure 1.
Source: EIA, Table ES2
We can further refine EIA’s analysis by looking just at electricity production subsidies.

12
Table 3. Electricity Production Subsidies and Support, FY 2013 (millions of 2013 dollars)
Source: EIA, Table ES4
As Table 3 shows, when we restrict our attention to electricity production, federal financial
intervention totaled $16.1 billion. Of that amount, 37 percent went to wind, 27 percent went to
solar, 10 percent went to nuclear, 6 percent went to coal, and 4 percent went to natural gas and
petroleum liquids.
Finally, although the EIA report does not directly provide these figures, we can use the
information from the report to calculate federal support for electricity production per unit of
electricity produced.12 We present these findings in Figure 2.
12 For more information on these calculations, and on EIA’s rationale for not directly providing the data, see Mary Hutzler, “EIA Report: Subsidies Continue to Roll In For Wind and Solar,” Institute for Energy Research blog post, March 18, 2015, available at: http://instituteforenergyresearch.org/analysis/eia-subsidy-report-solar-subsidies-increase-389-percent/.
13
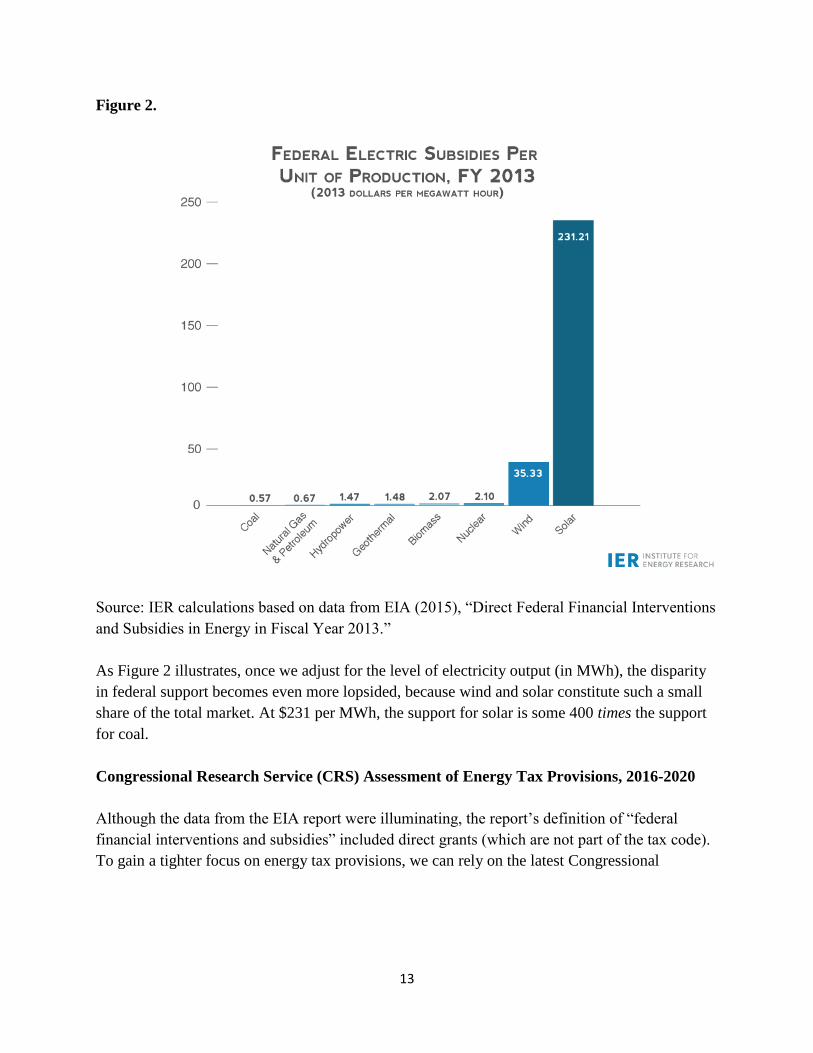
Figure 2.
Source: IER calculations based on data from EIA (2015), “Direct Federal Financial Interventions
and Subsidies in Energy in Fiscal Year 2013.”
As Figure 2 illustrates, once we adjust for the level of electricity output (in MWh), the disparity
in federal support becomes even more lopsided, because wind and solar constitute such a small
share of the total market. At $231 per MWh, the support for solar is some 400 times the support
for coal.
Congressional Research Service (CRS) Assessment of Energy Tax Provisions, 2016-2020
Although the data from the EIA report were illuminating, the report’s definition of “federal
financial interventions and subsidies” included direct grants (which are not part of the tax code).
To gain a tighter focus on energy tax provisions, we can rely on the latest Congressional
14
Research Service (CRS) report that specifically tallies them.13 Table 4 summarizes the latest
CRS findings.
13 The CRS data is included as an Appendix to the memo to committee members from the U.S. House of Representatives Committee on Energy and Commerce, March 27, 2017, available at: http://docs.house.gov/meetings/IF/IF03/20170329/105798/HHRG-115-IF03-20170329-SD002.pdf.
15
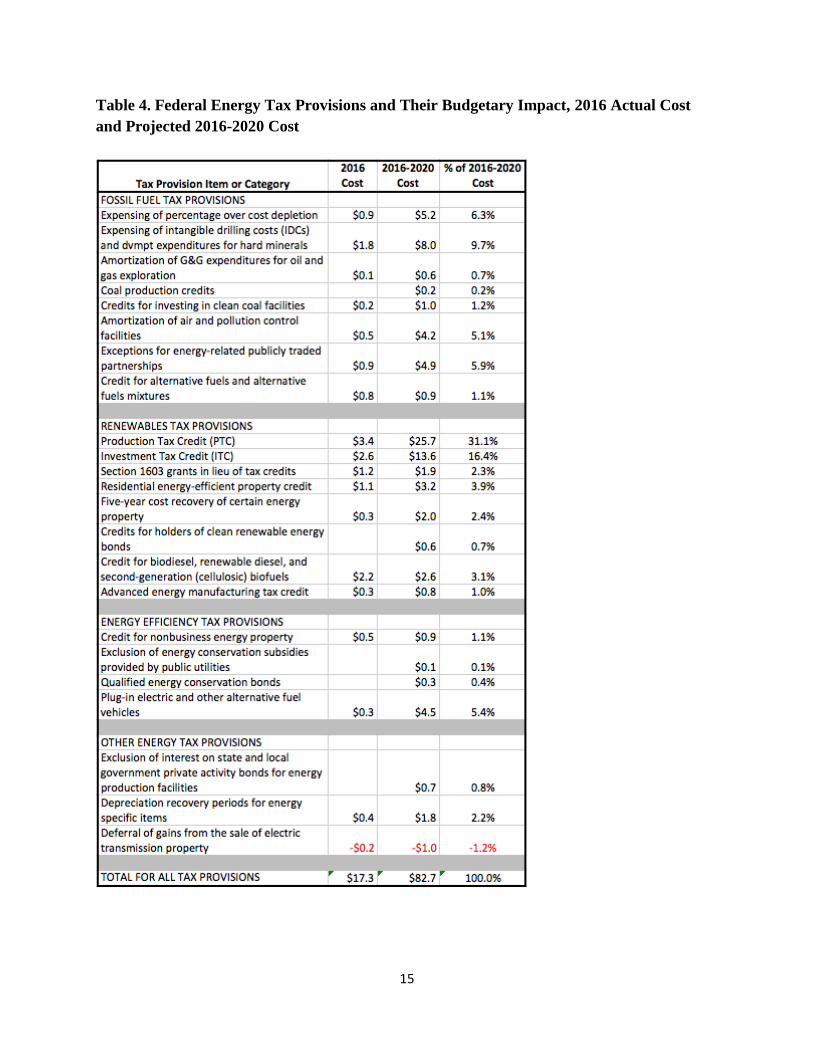
Table 4. Federal Energy Tax Provisions and Their Budgetary Impact, 2016 Actual Cost
and Projected 2016-2020 Cost

16
Source: Adapted from Congressional Research Service,14 Table 1.
As Table 4 indicates, of the measures analyzed by the CRS study, by far those with the largest
cost (in the sense of tax expenditures) were the Production Tax Credit (PTC) at $25.7 billion and
the Investment Tax Credit (ITC) at $13.6 billion, both targeted to renewable energy. The two
costliest measures catering to oil and natural gas, namely the expensing of intangible drilling
costs (IDCs) at $8.0 billion and percentage vs. cost depletion at $5.2 billion, constituted a much
smaller budgetary impact.
In Figure 3 we chart the six costliest items in the CRS study.
Figure 3.
SOURCE: Adapted from Congressional Research Service, Table 1.
14 See the appendix to the committee members memo at: http://docs.house.gov/meetings/IF/IF03/20170329/105798/HHRG-115-IF03-20170329-SD002.pdf.

17
Federal Revenues By Energy Source
In previous sections we have provided statistics on the amount of federal tax support (in the
sense of targeted deductions and credits) for participants in energy markets. To place these
numbers in context, it may help to see the revenues actually collected by the federal government
through various channels from the energy sector.
Unlike many other industries, those in the energy sector do not simply pay corporate income tax
to the federal government, but often may make very large non-tax payments because the federal
government legally owns resource-rich lands and waters. “When companies extract natural
resources on federal lands and waters, they pay royalties, rents, bonuses, and other fees, much
like they would to any landowner. This non-tax revenue is collected and reported by the Office
of Natural Resources Revenue (ONRR).”15
In Table 5 we summarize the results posted at the Department of Interior’s website, concerning
the 2015 payments of non-tax extraction revenues:
Table 5.
Source: Department of the Interior, https://useiti.doi.gov/explore/#revenue
As Table 5 illustrates, extraction revenues in 2015 from oil, natural gas, and coal dwarfed those
of geothermal and wind; the totals are $7.3 billion versus $17 million. (We can’t present the data
graphically, because the small values for geothermal and wind wouldn’t even show up in the
chart.)
To reiterate, the data in Table 5 only show the non-tax revenues associated with extraction
activities. We might also wonder about standard corporate income tax revenues associated with
various energy sources. Unfortunately, such data do not seem to be available from government
sources in this format.
15 Quotation from: https://useiti.doi.gov/explore/#revenue.
18
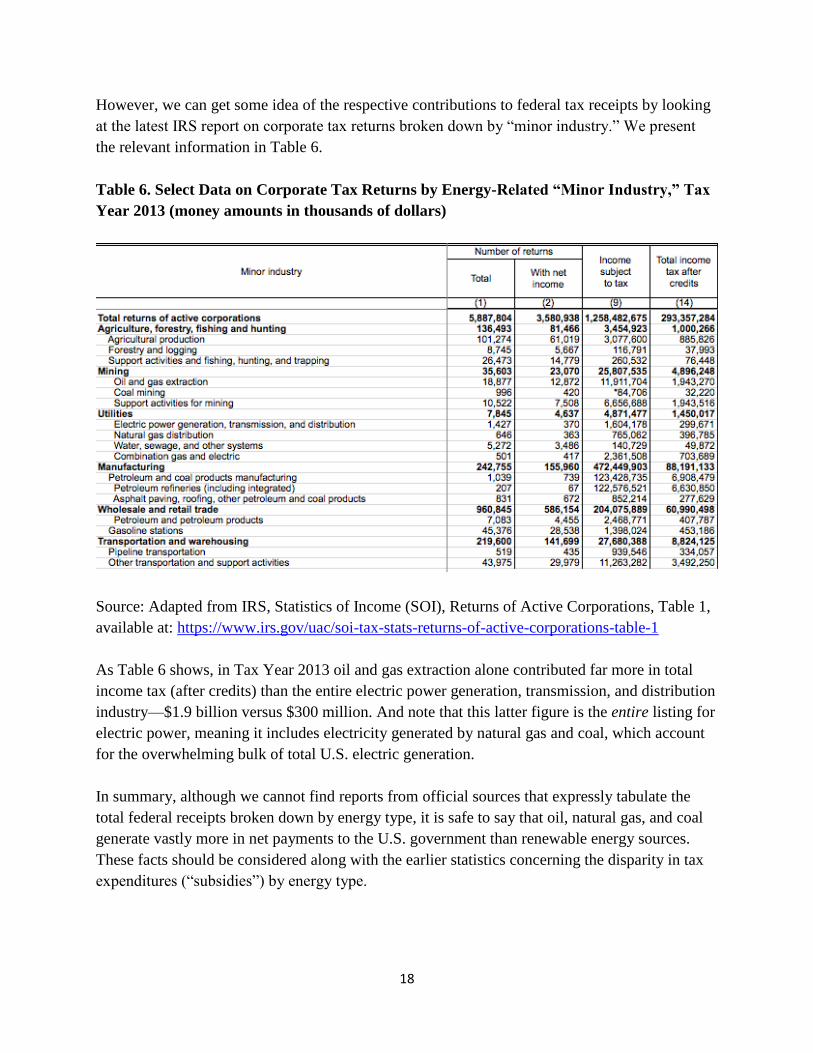
However, we can get some idea of the respective contributions to federal tax receipts by looking
at the latest IRS report on corporate tax returns broken down by “minor industry.” We present
the relevant information in Table 6.
Table 6. Select Data on Corporate Tax Returns by Energy-Related “Minor Industry,” Tax
Year 2013 (money amounts in thousands of dollars)
Source: Adapted from IRS, Statistics of Income (SOI), Returns of Active Corporations, Table 1,
available at: https://www.irs.gov/uac/soi-tax-stats-returns-of-active-corporations-table-1
As Table 6 shows, in Tax Year 2013 oil and gas extraction alone contributed far more in total
income tax (after credits) than the entire electric power generation, transmission, and distribution
industry—$1.9 billion versus $300 million. And note that this latter figure is the entire listing for
electric power, meaning it includes electricity generated by natural gas and coal, which account
for the overwhelming bulk of total U.S. electric generation.
In summary, although we cannot find reports from official sources that expressly tabulate the
total federal receipts broken down by energy type, it is safe to say that oil, natural gas, and coal
generate vastly more in net payments to the U.S. government than renewable energy sources.
These facts should be considered along with the earlier statistics concerning the disparity in tax
expenditures (“subsidies”) by energy type.
19
The History of the PTC and Its Impact on the Wind Sector
As discussed earlier, the Production Tax Credit (PTC) is the single most expensive (from the
perspective of forfeited revenue) energy-targeted tax provision; the latest CRS report projected
that the PTC would account for a tax expenditure of $25.7 billion from 2016-2020. Because of
its relative significance, and also because of its perverse effect of negative wholesale wind
prices, we discuss the PTC in detail in this section.16
Brief History of the PTC
The PTC was first enacted in 1992 and, as of this writing, has since been extended ten times. The
PTC provides owners of wind facilities a tax subsidy17 tied to the general price level that
currently works out to $23 per megawatt-hour (MWh) of electricity generated for the facility’s
first 10 years of operation. To put the size of the subsidy in perspective, prices in wholesale
electricity markets averaged $30 per MWh in 2016.18 Furthermore, because the PTC is a tax
credit, its official current value of $23 per MWh actually corresponds to a pre-tax wind price of
$23 / (0.65) = $35 per MWh, with the current corporate tax rate of 35 percent. (As we will see,
this explains why wind producers are willing to accept negative wholesale prices even below
minus $20 per MWh.)
The PTC was extended in January 2013 and expired at the end of that year. In the extension bill,
however, Congress expanded the qualification criteria to include facilities that had commenced
construction by the end of 2013 instead of requiring that facilities be complete.19 The change in
language enabled the Internal Revenue Service (IRS) to expand eligibility to projects that had not
initiated physical construction but had merely secured financing, including many facilities that
began or will begin operation between January 1, 2014 and January 1, 2016.20 (As a result, the
government would have been providing PTC support through the year 2025.)
16 This material draws heavily on the IER study, “The Case Against the Wind Production Tax Credit,” November 2014, available at: http://instituteforenergyresearch.org/wp-content/uploads/2014/11/The-Case-Against-the-PTC-Nov-2014.pdf. 17 Some analysts make a distinction between a tax credit (which reduces tax liability) and an explicit payment issued by the federal government, reserving the term “subsidy” for the latter. However, with the wind PTC the distinction is not crisp in practice, because the tax credit is so large that many wind operations cannot take full advantage of it. That is why they bring in Wall Street firms to effectively auction off the tax credit to outside financiers, and it also explains why so many renewable groups clamor to make the PTC a refundable tax credit. 18 Electricity wholesale prices for 2016 available at: https://www.eia.gov/electricity/wholesale/#history 19 Nick Juliano, IRS guidance clarifying PTC eligibility seen as boon for developers, E&E News Greenwire, August 11, 2014, http://www.eenews.net/greenwire/stories/1060004314/. 20 Although the PTC has expired, developers can qualify for the tax credit without starting physical construction on a wind facility. The IRS released a guidance document stating that a project would be eligible for the PTC if it had either: (1) started “physical work of a significant nature” or (2) satisfied “the Safe Harbor with respect to a facility,” as long as the developer made “continuous progress towards completion” once the construction phase had begun.
20
As of this writing, the latest legislation21 concerning the PTC is the Consolidated Appropriations
Act, 2016 (H.R. 2029, Sec. 301), passed in December 2015. This legislation enacted a gradual
“phase out” of the PTC. Specifically, for wind facilities commencing construction in 2017, the
PTC is reduced by 20 percent; for those starting in 2018, the PTC is reduced by 40 percent; and
for those starting in 2019, the PTC amount is reduced by 60 percent.
A Perversion of the Market: The PTC and Negative Wholesale Wind Prices
The case of the PTC is an excellent illustration of how generous tax code “support” for a
particular energy type—in this case, wind—can lead to results that clearly make no economic
sense. Specifically, at times of low demand wind operators can end up driving wholesale
electricity prices into very negative territory—even below minus $20 per MWh. Because the
PTC is only applicable for actual production, the owners of a wind facility can reduce their
overall tax liability by the PTC credit even if they are “losing money” on the wind generation
itself.
Although it might make sense for certain producers to offer negative prices for brief periods to
the grid in order to avoid a disruptive shutdown of generation, this does not make sense for wind
operators. “Unlike nuclear and fossil-fueled generation[,] wind generation is physically flexible,
as it can be shut down or turned back on reasonably quickly by altering the pitch of the turbine
blades or by disconnecting or reconnecting the turbines to the electric grid.”22 Clearly, the
unusual practice of prolonged selling at negative prices is driven by the tax code, not the
underlying economic realities.
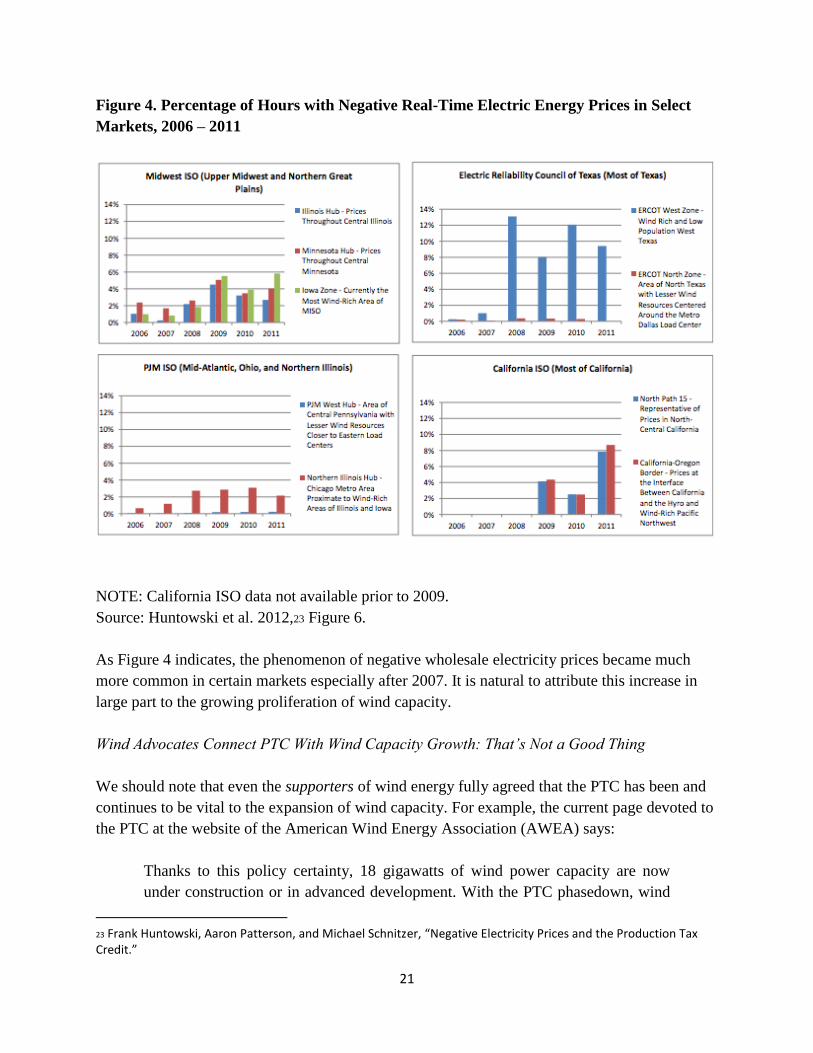
Furthermore, with the expansion of wind capacity over time, this phenomenon of negative
wholesale electricity prices became more pronounced, as we illustrate in Figure 4.
Many facilities that are placed in service before January 1, 2016 will satisfy the continuous progress standards. http://www.irs.gov/pub/irs-drop/n-14- 46.pdf 21 The current status of the PTC is taken from: https://energy.gov/savings/renewable-electricity-production-tax-credit-ptc. (Accessed March 25, 2017.) 22 Frank Huntowski, Aaron Patterson, and Michael Schnitzer, “Negative Electricity Prices and the Production Tax Credit,” The NorthBridge Group, September 10, 2012, available at: http://acore.org/wp-content/uploads/2012/09/Negative-Electricity-Prices-and-the-PTC-Sept-2012.pdf, p. 7.
21
Figure 4. Percentage of Hours with Negative Real-Time Electric Energy Prices in Select
Markets, 2006 – 2011
NOTE: California ISO data not available prior to 2009.
Source: Huntowski et al. 2012,23 Figure 6.
As Figure 4 indicates, the phenomenon of negative wholesale electricity prices became much
more common in certain markets especially after 2007. It is natural to attribute this increase in
large part to the growing proliferation of wind capacity.
Wind Advocates Connect PTC With Wind Capacity Growth: That’s Not a Good Thing
We should note that even the supporters of wind energy fully agreed that the PTC has been and
continues to be vital to the expansion of wind capacity. For example, the current page devoted to
the PTC at the website of the American Wind Energy Association (AWEA) says:
Thanks to this policy certainty, 18 gigawatts of wind power capacity are now
under construction or in advanced development. With the PTC phasedown, wind
23 Frank Huntowski, Aaron Patterson, and Michael Schnitzer, “Negative Electricity Prices and the Production Tax Credit.”
22
energy can [continue] growing to supply 10 percent of U.S. electricity by 2020
and support tens of thousands additional well-paying jobs.
With the help of the PTC and ITC, U.S. wind farms now provide enough power
for 24 million American homes and attract billions in private investment to the
U.S. economy each year…
The PTC and ITC has driven more wind development…24
The AWEA analysis is undoubtedly correct that a generous tax credit—so generous that it
justifies paying customers to take the product—will encourage the expansion of a particular
sector. But by itself, this is evidence that the outcome is a distortion, because of the artificial
advantage given to wind. Or, from the other side, we could say that the tax code (with the PTC)
has placed an artificial disadvantage on electrical generation sources that do not qualify for the
credit.
Although artificial tax advantages can make outcomes “rational” at the individual level, from the
perspective of the overall economy they are inefficient. It would distort producer and consumer
behavior less if the target amount of tax revenues were raised on a more uniform basis, with
resources flowing into various energy types based on their actual profitability and reliability.
Artificial Federal Support for Certain Energy Sources Leads to Inefficiency
To understand the inefficiencies resulting from an artificial advantage given to wind and solar,
consider the levelized cost of electricity generation from various sources.
24 American Wind Energy Association (AWEA), “Production Tax Credit,” available at: http://www.awea.org/production-tax-credit. Accessed March 25, 2017.
23
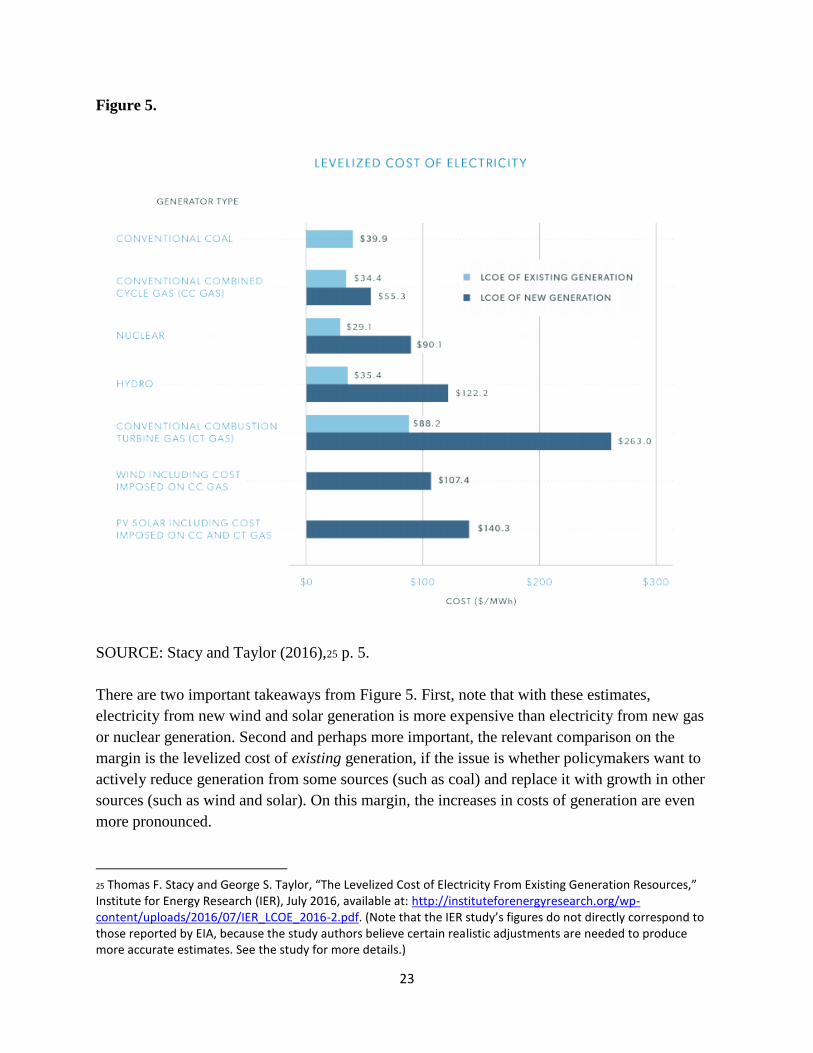
Figure 5.
SOURCE: Stacy and Taylor (2016),25 p. 5.
There are two important takeaways from Figure 5. First, note that with these estimates,
electricity from new wind and solar generation is more expensive than electricity from new gas
or nuclear generation. Second and perhaps more important, the relevant comparison on the
margin is the levelized cost of existing generation, if the issue is whether policymakers want to
actively reduce generation from some sources (such as coal) and replace it with growth in other
sources (such as wind and solar). On this margin, the increases in costs of generation are even
more pronounced.
25 Thomas F. Stacy and George S. Taylor, “The Levelized Cost of Electricity From Existing Generation Resources,” Institute for Energy Research (IER), July 2016, available at: http://instituteforenergyresearch.org/wp-content/uploads/2016/07/IER_LCOE_2016-2.pdf. (Note that the IER study’s figures do not directly correspond to those reported by EIA, because the study authors believe certain realistic adjustments are needed to produce more accurate estimates. See the study for more details.)

24
The Economic Impact of Certain Tax Provisions Related to the Oil Sector
Although the PTC is explicitly designed to foster growth in electricity generation from
renewables, there are other aspects of the current tax code that provide benefits to the oil sector.
For example, the provision for percentage depletion (rather than cost depletion, which is more
analogous to standard depreciation of business expenses) gives an artificial advantage to oil
production under certain conditions.26 However, we note that the percentage depletion is not
available to integrated oil companies and is limited to output below 1,000 barrels per day;27 this
is not a “tax break for Big Oil” as many critics allege.
Two other provisions—namely, the Domestic Manufacturer’s Section 199 deduction and the
allowance of Last-In, First-Out (LIFO) inventory accounting—are beneficial to oil and natural
gas companies. However, it is incorrect to classify these as “tax breaks for oil and gas
companies” as critics often allege. These are standard tax code provisions available to all sectors.
(In fact, the Section 199 deduction has been made artificially lower for oil and gas companies
than for others, with the former only able to claim a 6 percent deduction versus the standard 9
percent deduction for other manufacturers.28)
Two Challenges to the General Principle of Allowing the Price System to Guide Energy
Markets
Before closing, we should address two common challenges made to the general presumption of
letting free consumer and producer decisions guide energy markets, without outside “steering”
from the political process. These challenges are the “infant industry” argument and the concern
over anthropogenic climate change.
The infant industry argument claims that a new domestic industry needs a helping hand from
policymakers (such as in the form of protective tariffs or other preferential tax treatment) to get
up and running. In general this is a dubious proposition. Private investors are just as capable of
forecasting the long-term benefits of today’s investments, and indeed have more incentive to get
their forecasts right because their own money is on the line.
Regarding federal support for renewables, the infant industry argument is particularly weak since
these arguments have been made for decades. These are not infant industries, these are grown
adults. If they can’t compete (except in niche markets) on a level playing field with other sources
of electrical generation, this reflects economic realities, not birthing pains.
26 See Timothy Fitzgerald and John Horowitz, “Economics of the Tax Treatment of Depletable Costs,” November 11, 2014, Working Paper. 27 There are other limitations on percentage depletion; see: http://www.ipaa.org/wp-content/uploads/downloads/2012/01/2009-04-PercentageDepletion.pdf. 28 See: http://www.thetaxadviser.com/issues/2010/may/sec199.html.

25
A completely separate argument claims that the “negative externality” from carbon dioxide
emissions is not reflected in market prices, and therefore the tax code (so it is alleged) implicitly
gives a “subsidy” to carbon-intensive energy sources. In this view, providing federal support for
alternative energy sources is merely mitigating this long-standing bias.
The present document concerns tax policy, not climate science. However, we refer to IER’s work
on the dubious use of the “social cost of carbon” as a policymaking tool.29 It is important for
policymakers to realize that even if we stipulate the physical science of climate change as
codified in, for example, the Intergovernmental Panel on Climate Change (IPCC) reports, that it
does not follow that the U.S. government should therefore adopt measures to penalize carbon
dioxide emissions. The “social cost of carbon” is not an objective fact of the world, analogous to
the charge on an electron or the mass of the moon. Rather, it is an arbitrary concept dependent on
subjective parameters such as the discount rate applied to estimates of damages that will not
occur for centuries. Once we consider these and other complications—such as the interaction of
penalties on carbon dioxide emissions with existing inefficiencies in the tax code—the case for
promoting alternative energy sources becomes much weaker.
Conclusion
Although they differ on the emphasis to be given to certain priorities, economists generally agree
that if we were to design a tax code from scratch, the desired revenue would be raised by
applying the tax to as broad a base as possible, with as low a rate as possible. Adding in artificial
privileges to particular groups is a self-defeating and inefficient process, because it distorts
consumer and producer behavior and invites “rent seeking” from groups trying to shield
themselves from unfavorable tax treatment. When policymakers try to steer markets through the
tax code, it makes Americans poorer because resources are no longer being channeled into their
most important uses. This includes the resources being spent in complying with the
(unnecessarily complex) tax code itself.
In the context of energy, there are several provisions of the tax code that give advantages to
particular producers or consumers. A recent Congressional Research Service (CRS) study
estimated that from 2016-2020, the total cost of these energy tax provisions would be $82.7
billion. Of the provisions analyzed, the two most expensive were the Production Tax Credit
(PTC) and the Investment Tax Credit (ITC), both tailored to renewable energy.
29 For example, see Robert P. Murphy’s testimony on “The ‘Social Cost of Carbon’: Some Surprising Facts,” before the Senate Committee on Environment and Public Works, July 18, 2013, available at: http://www.instituteforenergyresearch.org/wp-content/uploads/2013/07/2013.07.18-Murphy-EPW-Testimony-on-Social-Cost-of-Carbon-FINAL.pdf.
26
It is clear that these tax provisions distort energy markets. For example, the generous PTC has
made it commonplace for wholesale electricity prices to be negative, because wind producers can
benefit financially once the tax credit is taken into account. Yet it is inefficient to artificially
encourage wind (and solar) in this manner, because their correctly-calculated levelized cost of
generation—particularly when we look at existing facilities which some wish to retire through
policy—is so much higher than that of coal and natural gas.
A popular slogan says that the U.S. should embrace an “all of the above” approach to energy
sources. This is a sensible stance, if understood to mean that policymakers do not try to foster
those energy sources that are currently providing only a small share of total output. Both theory
and history have shown that private property and market prices lead to superior outcomes than
top-down planning. This result holds for energy markets just as it does for restaurants.


![Federal Income Tax - Basic Federal Income Tax, 1st Ed. - Westin - Law ...[1]](https://img.pdfslide.us/doc/110x75/577d34ae1a28ab3a6b8e9712/federal-income-tax-basic-federal-income-tax-1st-ed-westin-law-1.jpg)