Embed Size (px)
Citation preview

29 October 2010 Economics & FI/FX Research
Curves & Crosses
UniCredit Research page 1 See last pages for disclaimer.
Fed unlikely to go ALL-IN Fixed Income
■ FI Strategizer: Next week’s calendar is packed with data and events, but we think the only one really driving bonds will be the long awaited FOMC meeting. Expectations on the size of the QE program have been scaled down in the past week, and only a bold move coupled with a dovish FOMC statement would trigger a significant rally in 10Y USTs. Real yields, although already very low, should benefit more from Fed buying.
■ EU Portfolio Strategy: After reverting to benchmark weightings on all peripheral countries except Italy, we leave our allocation unchanged ahead of the FOMC and we also stay duration neutral.
■ ECB: The ECB November meeting should not be a relevant market mover. The recent rise in MM rates and the 3M LTRO outcome suggest the exit strategy is well on track. The recent discussion on economic governance in the eurozone may attract questions in the Q&A session.
■ MM: Demand at the 3M LTRO surprised on the upside. This is due to the increase in MM rates rather than to renewed tensions on the MM. In the coming months, the full allotment should keep the 3M Euribor stable.
■ Inflation: The October flash estimate came in at 1.9% yoy, a touch higher than we had expected. The HICP ex-tobacco should print at 1.8%. We think that this will be the peak for several months.
■ Supply Corner: Next week, there will be no redemptions in the EMU. Gross supply should be EUR 18.5/20.5bn, mainly from core. Within periphery, Spain is the only country issuing (new 5Y Apr16). Portugal will hold a T-bill auction on 3 November, the day of the budget vote.
Forex
■ FX Strategizer: The Fed’s decision, NFP and US mid-term elections will be the main drivers for FX majors in the coming days. On balance, we expect the greenback to remain on the offer side across the board.
■ EUR: A gradual Fed approach to QE2, ECB welcoming the normalization in the EU money market and a less convincing US job report should all lift EUR-USD further. We expect it to rally far beyond 1.40.
■ JPY: As the USD stays weak, Japanese MoF & the BoJ will face a hard time to avoid a USD-JPY fall to the record low of 79.75. Caught between USD-JPY & EUR-USD, EUR-JPY will move in the 111.50-114.80 band.
■ CHF: The continuation of the CHF downward correction will depend on the USD reaction to the Fed’s QE2 decisions: any poor USD response should trim recent USD-CHF gains and prevent a further EUR-CHF rise.
■ GBP: Even in case the USD weakens, cable is unlikely to rally above this month’s highs at 1.6110. EUR-GBP should remain in the 0.86-0.88 band, despite creeping EMU woes, as the BoE meeting will be a non-event.
■ The three dollars: A new USD slide should recommend reopening AUD-USD & NZD-USD long positions, but only in the aftermath of the US job report. The RBA is expected to remain on hold at 4.50% on Tuesday.
■ Nordics: A less aggressive stance on rates by both the Riksbank and the Norges Bank should weigh on both the SEK and the NOK, at least in the near term. We also lowered our Norwegian key rate trajectory
More insight in our monitors: Swap Curve – Trade Idea – EGB spreads – Money Market – Real Money – Inflation - FX Monitor – IMM Monitor – FX PPP – Beta analysis – FX Correlation – FX Hit Parade – Data Calendar - Periphery Calendar – Forecasts.
MARKET PRICES & FORECASTS
Actual Dec10 Mar11 Jun11 Sep11
US FedFunds 0.25 0.25 0.25 0.25 0.25 2Y UST 0.36 0.45 0.50 0.80 0.90 10Y UST 2.65 2.50 2.40 2.70 2.85 EUROZONE Refi 1.00 1.00 1.00 1.00 1.00 2Y Bund 0.99 0.80 0.80 1.10 1.40 10Y Bund 2.54 2.25 2.25 2.50 2.75 UK Base rate 0.50 0.50 0.50 0.50 0.50 2Y Gilt 0.69 0.70 0.70 1.00 1.25 10Y Gilt 3.11 2.80 2.70 2.90 3.10 (10Y, bp) US - EU 10 25 15 20 10 US - UK -46 -30 -30 -20 -25 UK - EU 57 55 45 40 35 Swap Spread (10Y, bp) US 8 5 5 10 10 EUROZONE 29 30 30 25 20 UK 11 10 10 20 20
Currencies EUR-USD 1.38 1.43 1.39 1.42 1.44 USD-JPY 81 83 85 88 90 GBP-USD 1.59 1.61 1.58 1.63 1.67 EUR-CHF 1.37 1.33 1.30 1.33 1.36
BUY THE RUMOR, SELL THE FACT?
Fed announces LSAP
Bernanke says Fed could buy USTs
Fed to buy up to USD 300bn of USTs
FOMC to "keep constant holdings of securities"
FED prepared to provide additional accommodation
0.00
0.25
0.50
0.75
1.00
1.25
1.50
1.75
2.00
2.25
2.50
2.75
3.00
3.25
Jun-08 Nov-08 May-09 Nov-09 May-10 Nov-10
Fed Funds 10Y TIPS
Source: Bloomberg, UniCredit Research
Chief Economist – UniCredit Group Global Head of Economics & FI/FX Research Marco Annunziata +44 20 7826-1770 [email protected] Head of Global FI & FX Research Michael Rottmann +49 89 378-15121 [email protected]
Editor Luca Cazzulani +39 02 8862-0640 [email protected]
Editorial deadline Friday, October 29, 2010 15:30 Prices as of Friday, October 29, 2010, 15:00 Bloomberg: UCGR Internet: www.research.unicreditgroup.eu

29 October 2010 Economics & FI/FX Research
Curves & Crosses
UniCredit Research page 2 See last pages for disclaimer.
The story so far… Yield 1w ch 1m ch DE IT US UK DE IT US UK DE IT US UK2Y 1.01 1.50 0.36 0.73 3 4 0 6 21 -9 -7 45Y 1.61 2.53 1.02 1.85 7 9 5 21 23 0 -6 1110Y 2.55 3.89 2.56 3.15 9 8 10 20 28 6 11 1830Y 3.06 4.80 4.03 4.22 6 8 11 14 18 2 32 302/5 61 104 65 112 4 5 5 15 2 9 1 75/10 94 136 155 130 2 -2 6 -1 5 6 17 72/10 155 239 220 242 6 4 10 14 7 15 18 1410/30 51 91 147 107 -3 1 1 -6 -10 -4 21 122/5/10 -17 -16 -45 -9 1 3 0 8 -1 1 -8 010Y BE 168 168 215 284 0 0 3 4 0 9 33 14
ASW 1w ch 1m ch DE IT US UK DE IT US UK DE IT US UK2Y -54 11 -16 -50 -1 2 2 -1 6 -18 4 35Y -46 59 -20 -28 -1 1 0 4 3 -20 5 510Y -28 101 -2 3 -1 -3 0 5 2 -20 1 -130Y 3 175 40 28 -1 -2 -1 1 1 -17 0 02/5 7 48 -4 23 0 -1 -2 5 -4 -2 1 25/10 19 42 18 31 1 -3 0 1 -1 0 -5 -610/30 31 73 42 25 -1 1 -1 -3 -1 3 0 1
Swap curves EMU 10Y benchmarks EU US BP SZ JP Yield ASW Spread
vs. DE 1w ch 1m ch
EONIA 0.79 0.23 0.55 0.06 0.10 GE10Y 2.55 -28 - - -1M 0.85 0.25 0.57 0.13 0.13 NL10Y 2.76 -7 21 -2 -23M 1.05 0.29 0.74 0.17 0.20 FI10Y 2.77 -3 22 -1 -46M 1.27 0.45 1.03 0.24 0.40 FR10Y 2.86 5 31 -3 -712M 1.54 0.76 1.48 0.52 0.64 AT10Y 2.94 12 39 -2 -142Y 1.61 0.53 1.32 0.52 0.38 BE10Y 3.36 53 81 -7 -25Y 2.20 1.48 2.17 1.21 0.48 IT10Y 3.89 101 134 -1 -2210Y 2.85 2.74 3.26 1.87 1.01 SP10Y 4.11 124 156 -3 -1930Y 3.00 3.68 3.93 1.90 1.90 PT10Y 5.92 279 337 -1 -472/5 58 95 86 68 9 IE10Y 6.81 348 426 20 95/10 65 126 109 66 53 GR10Y 10.39 619 784 95 -210/30 16 94 68 3 90
Forex EUR USD Last 1w ch 1m ch 3m ch 6m ch Last 1w ch 1m ch 3m ch 6m chEUR-USD 1.3857 -0.7% 1.7% 5.9% 4.7% EUR-USD 1.3857 -0.7% 1.7% 5.9% 4.7%EUR-JPY 111.89 -0.8% -3.5% -7.0% -14.1% USD-JPY 80.75 -0.8% -3.5% -7.0% -14.1%EUR-GBP 0.8685 1.2% 1.2% -5.0% -8.7% GBP-USD 1.5956 1.2% 1.2% -5.0% -8.7%EUR-SEK 9.3589 1.7% 1.1% 2.2% 4.2% USD-SEK 6.7540 1.7% 1.1% 2.2% 4.2%EUR-NOK 8.1929 -0.8% 0.5% 8.3% 5.1% USD-NOK 5.9126 -0.8% 0.5% 8.3% 5.1%EUR-CHF 1.3707 1.5% 2.7% 4.8% 4.8% USD-CHF 0.9892 1.5% 2.7% 4.8% 4.8%EUR-AUD 1.4215 -0.5% -1.1% -1.6% 1.6% AUD-USD 0.9748 -0.5% -1.1% -1.6% 1.6%EUR-NZD 1.8277 -1.4% -1.9% -1.4% -10.1% NZD-USD 0.7582 -1.4% -1.9% -1.4% -10.1%EUR-CAD 1.4145 0.6% 3.0% 0.7% -4.4% USD-CAD 1.0208 0.6% 3.0% 0.7% -4.4%
Equity Commodities Last 1w ch 1m ch 3m ch 6m ch Last 1w ch 1m ch 3m ch 6m chS&P 1183.8 0.3% 3.4% 7.5% -1.9% OIL 81.83 0% 5% 4% -4%Eurostoxx 2835.4 -1.3% 3.0% 3.0% 0.3% Gold 1351.35 2% 3% 16% 16%DAX 6584.3 -0.3% 5.4% 7.3% 7.2% CRB 492.34 1% 2% 14% 10%FTSE 5659.7 -1.4% 1.6% 6.5% 0.7% iTraxx 458.34 0 -53 -20 28Nikkei 9202.5 -2.4% -3.7% -5.1% -15.8% Shanghai 2978.8 0.1% 14.1% 12.5% 3.8%

29 October 2010 Economics & FI/FX Research
Curves & Crosses
UniCredit Research page 3 See last pages for disclaimer.
Favorite Trends & Medium-Term Strategies
Fixed Income EU US UK Change Actual Expected trend Change Actual Expected trend Change Actual Expected trend -3M -1M 1M 3M -3M -1M 1M 3M -3M -1M 1M 3M Key policy
rates 1.00 1.00 1.00 0.25 0.25 0.25 0.50 0.50 0.50
Libor rates 0.90 0.88 1.05 0.47 0.29 0.29 0.74 0.73 0.74
10Y 2.72 2.25 2.55 2.98 2.47 2.64 3.41 2.93 3.11
2/10Y 188 151 156 240 203 227 291 220 241
2/5/10Y -6 -8 -4 -12 -22 -29 2 -18 -24
10Y SwSp 26 32 29 -2 3 10 5 8 10
Portfolio allocation After reverting to benchmark on all periphery except Italy, we leave our allocation unchanged ahead of the FOMC meeting. We stay duration neutral ahead of next week FOMC, given the may uncertainties surrounding the Fed announcement.
Supply
Liquidity in November will be pretty low. Redemptions will amount to EUR 21bn, while coupons will be EUR 4.8bn. We expect gross supply in November to be EUR 64/71bn, slightly lower than in October and still much lower than the average monthly volume registered so far (EUR 87bn). Net supply however, should be much higher than in October, in the EUR 42/50bn area (vs. EUR 33bn), as redemptions will be lower. 60% of the supply should come from core/mid countries, while 40% should come from periphery, with Italy and Spain the main contributors. Ireland and Belgium should not hold any auction in November.
FX Change Actual Expected
trend Change Actual Expected
trend Change Actual Expected
trend -3M -1M 1W 1M -3M -1M 1W 1M -3M -1M 1W 1M EUR-USD 6% 1% 1.38 EUR-JPY -2% -2% 112 EUR-NOK 3% 3% 8.21 USD-JPY -7% -3% 81 EUR-CHF 0% 3% 1.37 AUD-USD 8% 0% 0.97 USD-CHF -5% 1% 0.99 EUR-GBP 4% 1% 0.87 NZD-USD 4% 2% 0.75 GBP-USD 2% 1% 1.59 EUR-SEK -1% 2% 9.37 USD-CAD -1% -1% 1.02
EUR-USD Divergences between the Fed and the ECB monetary policy, with the Fed expected to run an ultra-loose monetary policy through a new round of QE, while the ECB may start an exit strategy as early as in 2H11, should keep EUR-USD firm going forward, in the 1.43-1.46 band. A minor correction below 1.40 is possible in 1Q11, if EMU tensions escalate again.
JPY
The BoJ intervention failed to pose a floor to the USD-JPY depreciation and a test of 80 is still possible, if the USD slide persists. Looking ahead, with global risk aversion gradually easing, the JPY should lose its grip, but USD-JPY is unlikely to break through the 90-93 area in 1Y time, while EUR-JPY should rally further above 1.30, as long as EUR-USD stays firm.
CHF
The renewed EUR-USD strength should spill over to EUR-CHF too, but as long as global uncertainty persists, risks of a EUR-CHF retreat back towards 1.30 are still concrete, considering a possible SNB rate hike in 1Q11. EUR-CHF recovery on a better global risk picture in about 1Y time should not exceed 1.40.
GBP
Cable should remain mostly dominated by the renewed broad-based USD weakness, increasing the room for a test towards 1.62-1.63. As the USD should stay weak and the BoE is expected to hike rates next year, cable should rally back above 1.70 in late 2011. EUR-GBP should show smoother fluctuations, but the start of the BoE’s tightening process should bring it back below 0.85 at the end of 2011.
Pacific Rim & the CAD
The Aussie, the Kiwi and the loonie dollar should remain firm against the USD for now and the AUD still seems to be in the best shape, as chances of a break through parity increased. Both the NZD and the CAD are most exposed to some correction due to a less aggressive monetary policy at home. In any case, all three dollars are now overstretched and some retreat is required before buying them again.
Nordic Block A more dovish stance on rates by both the Riksbank and the Norges Bank should weigh on the SEK and the NOK in the near term, spurring more consolidation for both EUR-SEK and EUR-NOK. Indeed, as the rate hike cycle in both countries is not over, we still target EUR-SEK and EUR-NOK at 9.05 and 7.75 by 4Q11.
Source: UniCredit Research

29 October 2010 Economics & FI/FX Research
Curves & Crosses
UniCredit Research page 4 See last pages for disclaimer.
Favorite Trades
Favorite FI trades Type Trade Rationale Entry date Entry
level Act. Stop Target P&L (bp)
Curve trades
Buy SPGB Jul25, sell SPGB Oct20 & Jul41
On the Spanish curve the 15Y has reached interesting levels vs. the 10Y and the 30Y. We expect the recent trend to reverse.
24-Sep-10 16 21 35 0 -4.6
Buy Obl Oct15 sell Obl Apr15
The new OBL Oct15 offers an historical high premium vs. its forerunner OBL Apr15. We expect the market to arbitrage away this large roll spread.
24-Sep-10 13 11 25 0 1.6
EMU cross country
Sell BTP Apr15 buy SPGB Apr15
At the 5Y tenor SPGBs have cheapened more than BTPs opening a switch opportunity. We expect the spread between BTP Apr15 and SPGB Apr15 to tighten.
10-Sep-10 45 33 40 10 11.1
Buy BTP Jun13 vs. SPGB Apr13
TAKE PROFIT 30-Jul-10 10 20 20 60 9.8
Buy RFGB Jul15 vs. DSL Jul15
Finland trades at roughly the same level of the Netherlands in ASW, however, it enjoys a more favorable public finance outlook, a lower refinancing risk and a lower private debt. We thus expect it to richen vs. the Netherlands.
11-Jun-10 2 0 -9 12 -1.5
Buy FRTR Apr41 Sell DBR Jul40
At the 30Y, France has cheapened significantly vs. Germany; the current level appears too wide. We expect the yield spread to tighten.
2-Sep-10 31 36 45 20 -4.6
Swap spreads
Buy 10Y Gilts vs. Swap
10Y Gilts appear attractive given the reduced case for rating downgrade and the recent UK budget
9-Jul-10 -4 -10 -5 -50 6.4
Buy 10Y bund vs swap, sell 2Y
Germany has richened up vs. Swap at the short end due to safe haven demand. We expect a normalization.
7-Jul-10 47 32 35 10 15.3
Inflation Buy US 10Y BE, Sell UK 10Y BE
The US BE at the 10Y maturity has started moving up, with the Fed aiming at higher inflation expectations this trend will not likely reverse in the near future. In the UK, inflation expectations should, on the contrary, slow down. Hence, we suggest buying US 10Y BE and selling UK 10Y BE.
15-Oct-10 65 69 100 20 -3.8

29 October 2010 Economics & FI/FX Research
Curves & Crosses
UniCredit Research page 5 See last pages for disclaimer.
FX Trades SHORT-TERM SPOT TRADES
Cross Position Start Entry Level
Target Current Spot
Stop 3M Carry % Return P/L net EUR
Rationale / Status
EUR-SEK short 22-Oct-10 9.29 9.15 9.34 9.34 0.017 -0.54% -5.456 S/L reached on Oct, 26 P/L Open Trades 0.000 P/L Closed Trades 171.865
Update 29-Oct-10 12:15h CET
P/L Total Trades 171.865
Note: P/L Net EUR also includes carry cost calculations and refers to a notional amount (1mn EUR or USD). Source: Bloomberg, UniCredit Research
MEDIUM-TERM OPTION STRATEGIES
Strategy Direction Start Maturity Strike Current Spot
Entry Level
Actual
% Return P/L net EUR
Rationale / Status
EUR-GBP strangle
short 27-Aug-10 1-Sep-11 0.86-0.76 0.8682 4.35% 5.20% -0.85% -8.500 We close at current levels, as we cannot rule out a resumption of the BoE QE expanding topic
EUR-NOK put spread
long 10-Sep-10 14-Jun-11 7.85-7.70 8.24 0.83% 0.23% -0.60% -6.000 NOK to benefit from gradual rising Norges Bank key rates and a brighter global risk picture next year
EUR-SEK put spread
long 17-Sep-10 21-Jun-11 9.20-9.10 9.40 0.60% 0.30% -0.30% -3.000 SEK to benefit further from rate hikes by the Riksbank and a brighter global risk scenario next year
USD-CAD strangle
short 01-Oct-10 4-Oct-11 1.10-0.98 1.0240 5.32% 5.55% -0.23% -1.653 USD weakness and Canada's wish to protect its export competitiveness to offset each other
Cable call spread
long 15-Oct-10 19-Apr-11 1.63-1.70 1.594 1.37% 1.20% -0.17% -1.950 More dollar weakness to come and close correlation between Cable and EUR-USD likely to persist
P/L Open Trades -1.30% -12.603
P/L Closed Trades -3.03% -28.054
Update 29-Oct-10 12:15h CET
P/L Total Trades -4.33% -40.657
Note: entry/actual levels are calculated as cost/income as a percentage of the notional amount (EUR 1mn or USD). Source: Bloomberg, UniCredit Research
SUMMARY TABLE
FX Open Trades -12.603
FX Closed Trades 143.811 FX Total Trades 131.208
Update 29-Oct-10

29 October 2010 Economics & FI/FX Research
Curves & Crosses
UniCredit Research page 6 See last pages for disclaimer.
Macroeconomic focus
ECB: Rendez-vous in December Marco Annunziata (UniCredit Bank) +44 20 7826-1770 [email protected]
Marco Valli (UniCredit Bank Milan) +39 02 8862-8688 [email protected]
The 4 November ECB meeting is unlikely to bring major news – for market-sensitive announcements, the "rendez-vous" is in December, with the publication of updated macroeconomic forecasts (including for the first time the estimates for 2012) and new details on the liquidity strategy. Next week, Trichet should confirm that the central bank remains cautiously optimistic on the area’s growth prospects, with higher interbank rates seen reflecting the ongoing process of normalization in the financial sector.
The ECB’s disappointment about recent proposals to reform economic governance in the euro area will probably be a topic of discussion during the Q&A session.
Economic and monetary analysis On balance, the October round of business surveys provided reassuring evidence on the
health of the eurozone economy, validating the ECB’s assessment that the recovery remains on track. If anything, the most recent growth data indicate some upside risks to the central bank’s GDP projections for the final part of 2010.
The renewed acceleration in the German Ifo to the highest level since mid-2007, with a surprising rebound also in the expectations index, points to an increasingly sustainable upswing in the largest economy of the area. This helps further reduce the (already low) probability that the eurozone will face nasty GDP surprises down the road. Even the growth implications of the recent euro appreciation should not be overestimated, in our view. This is because prospects of further expansionary measures by the Fed – the key driver of USD weakness since the end of August – led to a generalized increase in equity prices and a drop in volatility and corporate bond spreads, which will probably suffice to neutralize some of the damaging growth impact of a stronger euro.
Coming to the monetary analysis, the main novelty is the second consecutive increase in the monthly flow of lending to Non-financial corporations (NFCs) in September, which will probably make the ECB more confident that the credit cycle is about to turn
Although overall lending to the private sector remained very weak at 1.2% yoy and M3 growth fell back to only 1% yoy, the ECB could be temped to start sounding slightly more upbeat on the monetary pillar. The October Bank Lending Survey released yesterday showed mixed results, but on balance confirmed a picture of moderate improvement
Money market normalization On 19 October, the 3M Euribor rate rose above the refi rate for the first time since July 2009.
This adjustment, which is endogenously determined by the decline in excess liquidity and therefore contains no monetary policy signal, certifies that the financial sector continues to recover, as also shown by the fact that Spain, Greece and Portugal in September reported a decline in central bank funding.
We also point out that the upward trend in the 3M Euribor rate has tracked very closely the “fair” refi rate prescribed by our Taylor rule in response to some narrowing of the output gap and a moderate recovery in lending to the private sector. In other words, money market normalization is now fully justified by the improvement recorded both in the financial sector and the real economy. What’s more, the last leg up of interbank rates has been relatively fast, a signal that the ECB doesn’t need to be overly cautious in its exit.
Note that higher demand at the last 3M LTRO (EUR 42bn bid vs. EUR 23bn expiring) is unlikely to have reflected increased money market tensions. Rather, it was probably due to the fact that the Euribor rate is now slightly above the refi rate, with risks skewed towards a further increase in the coming weeks. If anything, this suggests that the full-allotment is creating some distortions in demand for liquidity and offers arguments for removing it as soon as possible.
29 October 2010 Economics & FI/FX Research
Curves & Crosses
UniCredit Research page 7 See last pages for disclaimer.
Although there remain considerable pockets of weakness in the banking sector of peripheral countries, our view that the ECB will drop the full-allotment on 3M LTROs at the December meeting seems fully on track.
Economic governance The ECB has done nothing to hide its disappointment on the agreement reached by euro
area finance ministers on the reform of economic governance. By de-facto leaving the decision to impose sanctions in political hands, the final accord is weak on all the main points that the central bank deemed as important to solve the problem of moral hazard, namely automatism and timeliness in the application of sanctions. This low-profile compromise puts the ECB in a difficult position: the central bank has the right to forcefully argue its point of view on economic governance issues, because it is ultimately the ECB that is left “holding the bag”, i.e., acting to ensure financial stability: this is the case both for its enhanced liquidity support measures to help the residual pockets of weakness in the banking sector, and for the government bond purchase program. Remember that the government bond purchase program has been particularly controversial, and Governing Council member Weber has recently again called for it to be discontinued soon. Lack of significant and credible progress on strengthening the Stability and Growth Pact, instead, flags the risk that the program might need to remain in place for quite a while longer.
Back to front page

29 October 2010 Economics & FI/FX Research
Curves & Crosses
UniCredit Research page 8 See last pages for disclaimer.
FI Strategizer
Final countdown before the Fed meeting Luca Cazzulani (UniCredi Bank Milan) +39 02 8862 0640 [email protected] Chiara Cremonesi (UniCredit Bank London) +44 207 826 1771 [email protected]
In line with expectations, yield curves have remained stable during the week, as investors have preferred to stay on the sidelines ahead of the FOMC meeting. If anything, during the week, investors have focused more on the level of disagreement within the FOMC, which has somewhat cooled expectations for an impressive announcement at next week's meeting. 10Y USTs have moved up, leading to an only modest increase in 10Y BE. The USD has also remained fairly stable vs. the euro, with renewed concerns on some periphery countries unable to significantly alter investors' 'mood.
Periphery again under pressure Periphery were under strong pressure for most of the week: Greek spreads widened a whopping 100bp; Ireland widened 20bp and Portugal was volatile but, at the end of the week, unchanged. Market rumors suggested that the ECB intervened in the market, supporting Irish bonds. This is certainly possible, although at odds with the recent weeks’ trend when the ECB did not buy anything in the market. A confirmation will only arrive with the Monday release of ECB data.
Demand for the 3M LTRO surprised on the upside
Demand at the 3M LTRO surprised on the upside. As a result, liquidity in the eurosystem increased around EUR 20bn, pushing down short maturity rates. The EONIA and the 1M OIS fell back to 0.60%. The full allotment will likely keep liquidity abundant enough so that rates shorter than 3M will remain below 1%. See MM rates for a more detailed discussion.
Equities correcting their recent gains
Equities corrected some of their recent gains, with a more pronounced correction in the EMU than in the US. Overall, S&P was almost unchanged vs. last week, Dow Jones declined by 0.16% , while the Dax declined by 0.25%.
Next week: a very crowded calendar, but with only one event really important
Next week’s calendar will be extremely crowded: US personal income, ISM manufacturing, US NFP, UK manufacturing PMIs and three central bank meetings. However, the only one event that will be central for market action is the FOMC.
Ahead of the FOMC meeting: US real yields at all-time lows. BE has risen in the last few weeks
At the time of writing, real yields in the US have plunged to historical lows. This week, the UST sold a 5Y TIPS at a negative real yield for the first time ever. US 10Y TIPS trade at an all-time low of 0.50%. The breakeven, although lower than the historical average as we pointed out in last week's inflation monitor, has increased over the last few weeks as investors have attached great credibility to the Fed’s QE strategy.
Analyzing previous QE episodes, it possible to draw three main conclusions. The first is that most of the movement in yields (especially the nominal curve) happened before the program is actually launched. The second is that on the announcement date markets tend to display a high volatility. The third is that the medium-term reaction of markets can be significantly different from the near term one.
Fed QE1 suggests: buy the rumor, sell the fact Greece widens further
Fed announces LSAP
Bernanke says Fed could buy USTs
Fed cut rates from 1% to 0.25%
Fed to buy up to USD 300bn of USTs
FOMC to "keep constant holdings of securities"
FOMC "is prepared to provide additional accommodation"
0.000.250.500.751.001.251.501.752.002.252.502.753.003.25
Jun-08 Nov-08 May-09 Nov-09 May-10 Nov-10
Fed Funds 10Y TIPS
0
200
400
600
800
1000
1200
1400
1600
1800
Jan-09 Jul-09 Jan-10 Jul-10 Jan-11
10Y 2Y
Source: Bloomberg, UniCredit Research

29 October 2010 Economics & FI/FX Research
Curves & Crosses
UniCredit Research page 9 See last pages for disclaimer.
Focus on the Fed meeting
The key variables to watch at the Fed meeting: 1) The size of the announced asset purchases 2) The timing and mode of QE2 3) The wording of the statement
It is needless to say that the main even next week will be the Fed meeting. As we argued last week, three aspects will be key to watch at the meeting:
1) The size of the announced asset purchases. At present, one of the most popular view in the market sees the Fed buying around USD 500bn of Treasuries in six months. We think that any size below this would be taken as disappointing by the market. A size higher than USD 1tn would represent positive news for the market.
2) The timing and mode of QE2. Our economists expect an initial purchase volume of Treasuries of USD 300-500bn, with the explicit option of expanding the program further if needed. Another possibility would be that the Fed announces its intention to buy a certain amount (USD 50-100bn) per month, reviewed every quarter. This more gradual approach, however, might disappoint markets.
3) The wording of the statement. The Fed could attempt to push yields even lower by modifying the wording of its statement. That would probably mean that the mantra so far – that the Fed would hold interest rates at this extremely low level "for an extended period" – will be modified.
Starting from an analysis of QE in the UK
Before analyzing the impact of the Fed announcement on the markets, we briefly review what happened in the UK when, at the beginning of 2009, the BoE decided to embark on QE. It is interesting to analyze QE in the UK because the BoE bought mainly Gilts from the secondary market through the APF, and this represents an important analogy with what we expect will be the Fed’s QE2. The possible disadvantage of this comparison is that, after all, we are comparing two different markets.
Official announcement of QE at the 5 March meeting: GBP 75bn of Gilt buying
On 5 March in 2009, the BoE cut the repo rate to 0.5% and announced QE, stating it could use the APF up to GBP 150bn to buy Gilts. Also, on March 5, the BoE announced that it would buy GBP 75bn in the following three months (12% of the Gilts stock).
…increased to GBP 125bn at the May meeting…
At the May meeting, the BoE announced that it would buy an additional GBP 50bn, but this did not come as a surprise, as with the first announcement they already suggested that they could use the APF up to GBP 150bn.
…and again to GBP 175bn at the August meeting…
At the August meeting, they surprised the market by announcing that they would buy a further GBP 50bn of Gilts, also expanding the APF from GBP 125bn to GBP 175bn.
…and finally upgraded to GBP 200bn at the November meeting
At the November 2009 meeting, the BoE announced the last GBP 25bn increase to GBP 200bn. While there were a few revisions during the life of the QE, the bulk of the amount was announced right at the beginning. Hence, the first announcement is the one that should have had the strongest market impact.
Analyzing the market impact of QE in the UK before and after the official announcement (5 March)
Analyzing the market impact of the BoE QE could be helpful in giving us a guideline of the impact which QE2 could have in the US. The table below shows the changes in nominal and real yields in three different periods:
1) From the start of February to 5 March 2009: when the market started to price in QE.
2) From 5 March 2009 to 12 March 2009: since the BoE officially announced the beginning of QE and the timing of the purchases for the first purchase. This can give an interesting indication about the short-term reaction of investors to the announcement of QE.
3) From 12 March 2009 to 30 November 2009: from the date of the first Gilt purchase by the BoE to November 2009, when for the last time the BoE increased the APF size by GBP 25bn from GBP 175bn to GBP 200bn.
Most of the plunge in nominal yields happened before the actual start of the BoE’s Gilts buying…
Results show that most of the reaction in Gilts nominal yields happened before the official announcement of QE (March 5) and in the first week after the announcement itself. After the start of the Gilt purchases by the BoE, nominal yields started to rise, correcting much of the plunge ahead of the QE beginning.
…while real yields continued to plunge during the actual start of the BoE’s Gilts buying
Like nominal yields, real yields fell between February 2009 and the official QE announcement, as the market priced in the QE effect, but then retraced slightly during the first week after the official QE announcement. Then, real yields experienced a large fall during the actual Gilt purchase program by the BoE.

29 October 2010 Economics & FI/FX Research
Curves & Crosses
UniCredit Research page 10 See last pages for disclaimer.
In other words, while most of the impact on nominal yields happened BEFORE the program started, real yields plunged sizably DURING the program. In the US, the dynamics of nominal yields during QE1 were similar to the UK, while real yields did not really fall.
So, looking at the BoE QE program, the main conclusion is that nominal yields tended to rise after the beginning of the program (this was also due to factors such as increasing credit risk premia) and real yields fell after the beginning of the program. Reaction one week after the beginning of the program was quite different from the medium term impact of the program.
MARKET IMPACT OF QE IN UK
Nominal yield Real yield 2Y 5Y 10Y 15Y 30Y 2Y 5Y 10Y 30Y
4-Feb-09 1.7 2.9 3.8 4.5 4.4 0.1 1.5 1.7 1.0 5-Mar-09 1.2 2.3 3.4 4.1 4.3 0.7 1.2 1.3 1.3 12-Mar-09 1.4 2.1 3.0 3.6 3.9 0.9 1.4 1.4 1.1 30-Nov-09 1.2 2.6 3.5 4.0 4.1 -1.1 0.0 0.4 0.4 Change before QE -48.1 -60.5 -41.4 -34.7 -15.9 67.6 -30.5 -42.3 25.5 Change after official QE announcement first week 16.3 -17.9 -40.7 -56.4 -34.4 19.1 18.6 14.0 -16.6 Change during QE -19.3 47.7 57.2 48.0 18.3 -208.4 -133.2 -98.2 -69.4
Source: Bloomberg, UniCredit Research
As we have argued in the introduction, there are three aspects that need to be taken into consideration to analyze the market impact of QE2: the size, the timing and the wording of the statement. Right now, the market expects the Fed to announce USD 500bn in six months. To make things simple, we first analyze the short-term impact of next week's announcement and in a second step we try to analyze the market implications in the medium term.
Three different scenario for the size of the Fed’s QE2… …in all the three scenario, the Fed should buy a percentage of Treasuries outstanding lower compared to the one the BoE bought
First of all, we distinguish between three different scenarios:
■ The negative scenario: the Fed announces it will buy less than USD 500bn
■ The neutral scenario: the Fed announces it will buy between USD 500bn and USD 1tn.
■ The positive scenario: the Fed announces it will buy between USD 1tn and USD 2tn.
Note that in all the three scenarios, the Fed will buy a percentage of the Treasuries outstanding lower than the one bought by the BoE. At the time of writing, the total outstanding of US Treasuries (excluding Bills) amounts to USD 6.7tn. Hence, USD 300/500bn would represent 4.5% / 7.5% of the current outstanding. USD 1tn would represent almost 15% of UST outstanding. To buy an amount similar to the UK (28%), the Fed would have to buy USD 1.8tn.
….also in terms of timing, the purchases by the Fed should be slower
In terms of timing of the buying, one of the most popular view in the market sees the Fed buying around USD 500bn of Treasuries in six months, which would correspond to USD 83bn each month, or 1.2% of the overall Treasuries outstanding each month. In its program, the BoE bought an average of GBP 18bn each month, or 2.5% of the total Gilt outstanding each month; the speed of the buying was even higher in the first months of the program. So far, it seems that the Fed QE2 should overall have a milder impact on yields, as we are likely talking about a less massive purchase program both in size and in terms of speed of buying.
In the US, the actual level of both nominal and real yield is more stretched than in the UK ahead of the QE start
Finally, we have to take into consideration that in the US the level of both nominal and real yields is more stretched than the level of yields in UK ahead of the QE start, meaning that yields in the US have much less room to rally.

29 October 2010 Economics & FI/FX Research
Curves & Crosses
UniCredit Research page 11 See last pages for disclaimer.
Short-term market impact in the negative, neutral and positive scenarios
The table below shows the market impact we expect on nominal yields, real yields and BE in the short term in the three different scenarios outlined above.
Let’s start with the short-term.
■ Negative scenario: Market would be disappointed with both real and nominal yields climbing significantly. Inflation expectations would decline at least a bit.
■ Neutral scenario: Both real and nominal yields should trade sideways around current levels. Inflation expectations remain unchanged.
■ Positive scenario: both real yields and nominal yields would plunge, however nominal yields are unlikely to re-test 2008 lows. Inflation expectations should rise further from the current levels.
Better than expected As expected Worse than expected
RY NY BE RY NY BE RY NY BE
Impact (1st week)
-30/-40b -10/-20bp +15/25bp 0.55% 2.70% 215bp +20/30bp +10/20bp -5/-15bp
Judging the reaction in the medium-term is a bit more complicated, because a view on how
effective the QE would be is required, and not even the FOMC members agree on this point. In this paragraph, we base the reasoning on the assumption that a USD 500/1000bn program would have some positive impact on the US inflation and growth. Hence:
■ Negative scenario: Less buying than USD 500/1000bn would not be enough to support inflation and inflation expectations. After an initial rise, real yields would probably decline a bit to revert, probably, to current levels.
■ Neutral scenario: Under this outcome, real and nominal yields would rise moderately, and so would BE. After all, the Fed would be pouring some money into the economy.
■ Positive scenario: In the medium term real yields would probably rise as a result of improved expectations on the economic cycle. Inflation expectations would pick up relative to current levels, leading to a rise in nominal yields.
Back to front page

29 October 2010 Economics & FI/FX Research
Curves & Crosses
UniCredit Research page 12 See last pages for disclaimer.
Periphery Calendar Where When What Greece November IMF/EU officials visit Athens to decide on the third tranche of the loan (EUR 9bn) Event
November Eurostat publishes the revised public finance figures for 2009 Event 9-Nov-10 26W, 52W T-bill auction Auction 9-Nov-10 CPI (Oct)/ IP (Sep) Macroeconomic data 11-Nov-10 Unemployment rate (Aug) Macroeconomic data 12-Nov-10 GDP (3Q P) Macroeconomic data 16-Nov-10 13W T-bill auction Auction 19-Nov-10 Current account (Sep) Macroeconomic data 30-Nov-10 Retail sales (Sep) Macroeconomic data 8-Dec-10 CPI (Nov) Macroeconomic data 9-Dec-10 GDP (3Q F)/ Unemployment rate (Sep) Macroeconomic data 10-Dec-10 IP (Oct) Macroeconomic data 14-Dec-10 26W, 52W T-bill auction Auction 21-Dec-10 Current Account (Oct) Macroeconomic data 21-Dec-10 13W T-bill auction Auction 30-Dec-10 Retail sales (Oct) Macroeconomic data
Ireland 1-Nov-10 Manufacturing PMI Macroeconomic data 3-Nov-10 Service PMI/ Unemployment rate (Oct) Macroeconomic data Early November Finance Ministry to publish detailed 4Y plan Event 8/12 Nov-10 IP (Sep)/ Retail sales (Sep) Macroeconomic data 8/15 Nov-10 CPI (Oct) Macroeconomic data 22/26 Nov-10 Trade balance (Sep) Macroeconomic data 1-Dec-10 Manufacturing PMI/ Unemployment rate (Nov) Macroeconomic data 3-Dec Service PMI Macroeconomic data 7-Dec-10 Presentation of Budget for 2011 Event 7/13 Dec10 CPI (Nov)/ IP (Oct) Macroeconomic data 20/27 Dec10 Trade Balance (Oct) Macroeconomic data 28/31 Dec10 Current Account Balance (3Q)/ GDP (3Q) Macroeconomic data
Portugal 3-Nov-10 Debate and vote on general guidelines of draft 2011 budget bill in Parliament Event 3-Nov-10 4M T-bills (EUR 0.5/0.75bn), 12M T-bills (EUR 00.5/0.75bn) Auction 9-Nov-10 Trade Balance (Sep) Macroeconomic data 11-Nov-10 CPI (Oct) Macroeconomic data 12-Nov-10 GDP (4Q P) Macroeconomic data 17-Nov-10 Unemployment rate (3Q) Macroeconomic data 17-Nov-10 12M T-bill auction (EUR 750/1.25bn) Auction 24-Nov-10 Portugal largest union, the CGTP, to hold general strike Event 29-Nov-10 Retail sales (Oct) Macroeconomic data 30-Nov-10 IP (Oct) Macroeconomic data 9-Dec-10 GDP (3Q F) Macroeconomic data 14-Dec-10 CPI (Nov) Macroeconomic data 30-Dec-10 IP(Nov)/ Retails Sales (Nov) Macroeconomic data (-) IGCP will hold one bond auctions offering a total of EUR 1.5 Auction
Source: Reuters, UniCredit Research

29 October 2010 Economics & FI/FX Research
Curves & Crosses
UniCredit Research page 13 See last pages for disclaimer.
Real Money Section: Euroland Portfolio Strategy Rocky Horror Picture Show hurts domestic bond market
Michael Rottmann (UniCredit Bank) +49 89 378-15121 [email protected] A wide range of factors put further pressure on EGBs …
"It's just a jump to the left and then a step to the right. With your hands on your hips, you bringyour knees in tight…" This may describes the battle over the idea of a stability pact with teeth.The abandonment of positions and a continuous search for compromise with the risk of losing the hoped-for "teeth" ultimately impacted sentiment towards Europeangovernment bonds across the board. Furthermore, the bickering over austerity packagesin Portugal and the discussion of early elections in Greece are of course poisonous. ECB rhetoric that increasingly sounds like the central bank is determined to forge ahead with the exit strategy as quickly as possible is also taking its toll, driving the total return down to4.33% YTD with our excess return unchanged at 25 bp.
EGB RETURNS, VOLATILITY AND CROSS ASSET CORRELATIONS
5-day return
20-day return
YTD return
20-day return
volatility
YTD return
volatility
60-day return/20-day return correlation
EGBs> 1Y
EGBHICP-ILB
1-10Y
iBoxx EUR Corp. BBB
Euro- Stoxx
DJ AIG Commodity
Oilprice
3M Euribor 0.01 0.05 0.54 0.04 0.03 EGBs >1 1 0.61 0.77 -0.47 -0.04 -0.12EGBs >1Y -0.42 -0.51 4.33 3.41 3.55 EGB HICP-ILB 1-10Y 0.70 1 0.45 -0.21 0.16 0.01EGBs 1-3Y -0.13 -0.01 1.30 1.07 1.77 iBoxx EUR Corp. BBB 0.73 0.57 1 -0.41 -0.05 -0.25EGBs 3-5Y -0.33 -0.25 3.11 2.25 3.00 EuroStoxx -0.12 -0.06 0.03 1 0.43 0.44EGBs 5-7Y -0.45 -0.46 3.99 3.24 3.75 DJ AIG Commodity 0.40 0.40 0.26 0.29 1 0.61EGBs 7-10Y -0.64 -0.65 4.15 4.56 4.72 Oil price 0.41 0.29 0.00 0.20 0.65 1EGBs >10Y -0.58 -1.11 8.75 6.31 6.20 EGB HICP-ILB 1-10Y -0.38 -0.45 2.52 2.79 3.40
Source: Bloomberg, UniCredit Research
… and given the almost unpredictable response to the outcome of the FOMC-meeting … … we keep a neutral duration stance
From a domestic standpoint, the ECB press conference next week is consequently of paramount importance. Details on the future timing of the exit strategy will most likely held back until the December meeting, but we see few chances for "dovish" overtones. There is, therefore, the fear that the money market forwards will shift slightly higher again and pull the long end up with them, even though developments here will depend to a very large extent on US influences. In the US, by far the most interesting FOMC meeting in several months is on the agenda, and the usual data heavyweights. There has been no end to the metaphors. Rogoff compared the US strategy to a bunker shot in golf. What is needed here in his view is an explosion shot – the stronger the better. Whether you overshoot the green is irrelevant, the main thing is that you are out of the bunker. Using a turkey Thanksgiving analogy in an article entitled "Run Turkey Run", Bill Gross espoused the view that - one way or another - the FOMC announcement on Wednesday will mark the final turning point at the long end. But what is more important than a volume of USD 400 or 600bn is the message between the lines. If investors conclude that the US central bank will continue this program doggedly until, for example, an annual rate of change in the core deflator of 2% or higher is reached, the reaction is likely to be positive. There is reason todoubt whether there will already be such a commitment in the current situation where FOMC members are in some cases espousing diametrically opposing views. Overall, there is the fear that the current rise in yields at the long end in the euro zone is not over yet and we stick to the neutral duration position.
EGBS: EXPECTED RETURNS AND PORTFOLIO RECOMMENDATION
Modified Duration in Years Effas Benchmark weighting Recommended UniCredit weighting3M Euribor 0.25 0EGBs 1-3Y 1.80 24.20 24EGBs 3-5Y 3.60 19.70 20EGBs 5-7Y 5.21 11.71 11EGBs 7-10Y 7.05 18.69 19EGBs >10Y 12.43 25.70 26EGB HICP-ILB 1-10Y 5.28 0Average Duration 6.27 6.30
Source: Bloomberg, UniCredit Research

29 October 2010 Economics & FI/FX Research
Curves & Crosses
UniCredit Research page 14 See last pages for disclaimer.
Real Money Section: Euroland Country Strategy
No changes ahead of FOMC meeting Elia Lattuga (UniCredit Bank Milan) +39 02 88622027 [email protected]
EMU bonds delivered a negative performance last week, especially Greece and Ireland. FI markets have been on a wait-and-see mood during the last weeks, with investors adjusting their positions ahead of the next FOMC meeting. Renewed concerns on the fiscal outlook ofGreece, Ireland and Portugal weighted on the performance of periphery. Greece has been particularly hit with the 10Y yield rising again to above10%. Thin market volumes favoredlarge yield swings.
The EFFAs index lost 0.48%, after last week rebalancing on peripheral countries, our portfolioperformed slightly better than the market. The main benefit came from Belgium, which wasthe best performer of the week.
Next week, we expect gross supply to be ca EUR 20bn, mainly coming from core countries(France, Germany and Finland). Among periphery, Spain will sell a new 5Y Bono while Portugal will sell T-bills. Supply will not be too friendly.
We decide not to make major changes ahead of next week’s FOMC meeting. We remain overweigh Belgium among core-mid countries and Italy among periphery.
EFFAS redemption yield EFFAS weekly returns
2
3
4
5
6
7
8
9
10
11
GR IE PT ES IT BE AT FR NL DE FI
Core Mid Periphery
-4.0%
-3.5%
-3.0%
-2.5%
-2.0%
-1.5%
-1.0%
-0.5%
0.0%
BE PT AT FR FI ES NL DE IT IE GR
weekly performance
Source: Bloomberg, UniCredit Research EGB COUNTRY RECOMMENDATION >1Y YTM Duration YTD return Last week return EFFAS weighting Our weighting Ch. since last week Over / Under w.Austria 2.81 6.61 8.60% -0.29% 4.0% 4.5% 0.5%Belgium 3.08 6.04 5.26% -0.01% 6.0% 7.5% 1.5%Germany 2.49 6.20 7.57% -0.39% 21.6% 19.5% -2.1%Spain 4.10 5.86 1.74% -0.34% 9.9% 10.5% 0.6%Finland 2.37 5.39 6.83% -0.30% 1.3% 0.0% -1.3%France 2.78 6.75 7.48% -0.29% 21.0% 19.5% -1.5%Greece 10.14 4.56 -14.96% -3.68% 3.6% 3.5% -0.1%Ireland 6.31 5.17 -5.73% -1.30% 2.0% 1.5% -0.5%Italy 3.96 6.52 3.44% -0.44% 23.0% 26.0% 3.0%Netherlands 2.58 6.34 7.55% -0.35% 5.5% 5.5% 0.0%Portugal 5.45 5.59 -5.15% -0.22% 2.1% 2.0% -0.1%Eurozone 3.45 6.27 4.19% -0.48%
SUMMARY
Yield 3.51 3.54
Duration 6.27 6.28
YTD return 4.32% 4.15%
Tot. Ret. Last week -0.48% -0.47%
Source: Bloomberg, UniCredit Research (all tables and charts on this page)

29 October 2010 Economics & FI/FX Research
Curves & Crosses
UniCredit Research page 15 See last pages for disclaimer.
Total Return Monitor
TOTAL RETURN YTD OF FIXED INCOME ASSETS
1.3
13.4
2.6
10.3
2.7
5.2
0.2
13.4
2.6
10.1
2.5
5.5
0.5
18.2
7.0
5.9
19.7
4.0
13.7
25.7
0
5
10
15
20
25
30
35
Euro 7-10 Euro 1-3 US 7-10 US 1-3 UK 7-10 UK 1-3 JP 7-10 JP 1-3
Tota
l ret
urn
(%)
Asset return Hedged EUR Eur return
TOTAL RETURN YTD OF CURRENCIES AND EQUITIES
4.3
3.1
19.4
8.7
4.5
8.7
-13.
6
2.7
19.3
14.6
8.9
8.7
3.1 5.
9
24.4
19.5
-20-16-12-8-4048
121620242832
USD GBP JPY CHF S&P DAX Nikkei FTSE Gold CRB
Tota
l ret
urn
(%)
Asset return Eur return
TOTAL RETURN BY COUNTRY AND MATURITY BUCKET
Euro 7-10
Euro 1-3
US 7-10
US 1-3 UK 7-10
UK 1-3
JP 7-10
JP 1-3
1W -0.68 -0.13 -0.69 0.01 -1.39 -0.16 -0.08 0.01 1M -0.88 -0.07 -0.57 0.16 -0.96 -0.02 0.37 0.01
TOTAL RETURN BY ASSET CLASS EUROZONE (2010 YTD)
5.3
9.6
5.7
-0.9
1.6
4.5
4.0
3.4
3.3
1.8
3.8
6.7
4.1
1.3
2.5
2.2
1.9
3.6 4.
1
1.0
4.3
-0.1
7.6
9.5
3.5
-0.1
3.5 3.9
6.9
2.4
9.8
2.0
-4
-2
0
2
4
6
8
10
12
2003 2004 2005 2006 2007 2008 2009 2010
YTD
tota
l ret
urn
(%).
Euro 7-10 Euro 1-3 CCT ILB
TOTAL RETURN BY COUNTRY AND MATURITY BUCKET
USD GBP JPY CHF S&P DAX Nikkei
FTSE
Gold CRB
1W 0.93 2.33 1.70 -0.18 0.06 -0.43 -2.38 -1.61 0.66 0.91 1M -0.2 0.3 2.8 -1.7 3.3 5.9 -2.1 1.0 1.4 1.7
TOTAL RETURN BY ASSET CLASS US (2010 YTD)
3.3 4.
9
2.8
2.5
10.1
-5.2
13.4
2.4
1.0
3.8
7.3
6.4
0.9 2.
6
7.9
7.5
2.3
1.4
11.3
-2.6
6.5
17.2
1.8
12.0
-10
-5
0
5
10
15
20
2003 2004 2005 2006 2007 2008 2009 2010
YTD
tota
l ret
urn
(%).
US 7-10 US 1-3 ILB
TOTAL RETURN YTD BY COUNTRY AND MATURITY BUCKET
Maturity bucket DE FR AT FI NL BE ES PT IT GR IE EU 1 -3 1.53% 1.69% 2.13% 2.04% 1.73% 1.64% 0.96% 0.96% 1.42% -3.31% -0.41% 1.22% 3 -5 4.84% 4.71% 5.18% 4.83% 4.95% 3.50% 2.52% -1.59% 2.85% -11.21% - 3.02% 5 - 7 6.84% 6.60% 7.29% 4.39% 6.85% 4.43% 2.64% -3.39% 3.77% -18.14% -5.12% 3.90% 7 - 10 8.87% 8.55% 8.98% 9.02% 9.00% 5.95% 2.33% -6.59% 4.47% -22.02% -7.93% 4.05% >1 7.59% 7.50% 8.66% 6.85% 7.57% 5.31% 1.74% -5.11% 3.46% -14.88% -5.72% 4.21% SPREAD TO DE 1 -3 - 0.16% 0.60% 0.51% 0.20% 0.11% -0.57% -0.57% -0.11% -4.84% -1.94% -0.31% 3 -5 - -0.13% 0.34% -0.01% 0.11% -1.34% -2.32% -6.43% -1.99% -16.05% - - 5 - 7 - -0.25% 0.45% -2.46% 0.01% -2.41% -4.21% -10.23% -3.08% -24.98% -11.96% -2.94% 7 - 10 - -0.32% 0.10% 0.15% 0.13% -2.92% -6.54% -15.46% -4.40% -30.89% -16.80% -4.82% >1 - -0.09% 1.07% -0.74% -0.02% -2.28% -5.85% -12.70% -4.13% -22.47% -13.31% -3.38%
Total return for the following combinations of bucket & countries are calculated using EFFAS indices of total return: EUR 7-10, EUR 1-3, US 7-10, US 1-3, UK 7-10, UK 1-3, JP 7-10, JP 1-3. CCTs total return is calculated using MTS index
Source: Bloomberg, EFFAS, UniCredit Research (all tables and charts in this page)
Back to front page

29 October 2010 Economics & FI/FX Research
Curves & Crosses
UniCredit Research page 16 See last pages for disclaimer.
Money Market Monitor
High demand at 3M LRO does not reflect higher MM tension Luca Cazzulani (HVB) +39 02 8862 0640 [email protected]
Demand at the 1W MRO was in line with the past week (EUR 183bn), but the number ofbanks participating in the auction increased sizably. This has led to a fall in the averageallotted size.
Demand at the 3M LTRO increased EUR 20bn …
The 3M LTRO was somewhat of a surprise: demand was EUR 42bn, well above the EUR23bn expiring. The number of banks participating in the auction was 132, higher than the 70 banks that participated in the end of July auction of the 3M LTRO that expired on Wednesday. The average bid size was EUR 300mn/bidder, in line with the expiring auction.
… we think this is mostly related to the recent rise in MM rates …
The increase in demand is most likely due to the recent rise in Euribor that has brought the rate above the 1% level. Even if the two rates are not directly comparable, the rise in the3M Euribor is a good thermometer of market expectations, and its recent rise suggestsseveral banks preferred to bid at the ECB and secure funds for three months at 1%. The increase in demand, hence, does not reflect an increase in tensions on the moneymarket, but rather the banks' response to the current level of rates.
… the year-end effect has probably supported demand
The approach of the end of the year has probably been also a factor supportive fordemand: the recent 3M LTRO will expire in January.
The increase in demand does not change our expectations for the exit strategy
From a monetary policy perspective, the outcome of the 3M LTRO does not change our expected path for the exit strategy (the full allotment at the 3M LTRO will not be extended into 2011, while it will remain at the 1W MRO, at least in 1Q). If anything, this week outcome shows that the full allotment is creating some distortions in demand for liquidity and offersarguments for removing it as soon as possible.
We expect the 3M Euribor to stabilize at current levels or even fall back to 1%. Actually, the recent fixings point already in this direction. Shorter maturities (the EONIA, the 1W, the 1M) have dropped consistently. At the end of November, there will be another 3M LTRO(EUR 19bn will expire, 49 banks participated to the auction in August). If the 3M Euribor willstill be above the 1% level, we expect an outcome similar to the one we had this week.
Demand at 3M LTRO in the next months:
Demand at the 3M LTRO in the next few months will come from: - Banks with still difficult access to liquidity - Banks with easy access to liquidity but which will bid at the ECB as long as it’s cheaper than the market. Hence, as long as the full allotment framework remains in place, bank demand at ECB refinancing operations will keep excess liquidity at a level that stabilizes MM rates (up to the 3M tenor) at 1% (or less).
KEY CHARTS
Excess liquidity in the EMU Normalization, at last
-100
-50
0
50
100
150
200
250
300
350
400
May-07 Nov-07 May-08 Nov-08 May-09 Nov-09 May-10 Nov-10
0.0
0.5
1.0
1.5
2.0
2.5
3.0
3.5
4.0
Oct-08 Apr-09 Oct-09 Apr-10 Oct-10
Refi 1M OIS EONIA Depo
Source: Bloomberg, UniCredit Global Research

29 October 2010 Economics & FI/FX Research
Curves & Crosses
UniCredit Research page 17 See last pages for disclaimer.
Short maturities have been more affected by the 3M LTRO
The result of the recent 3M LTRO has had an important impact on short maturities. The EONIA has fallen some 20bp in the last few days and the 1W OIS has experienced a similardecline.
Compared to a month ago, the OIS curve has moved up with a parallel movement. The 1MOIS is now projected to reach 1% by the end of the year and to trade at 1.25% at the end of 2011. We regard the first target as possibly a bit too high, while the second one is in line withour expectations.
Next week should be a rather quiet week on the MM side, at least in the eurozone. There are several central bank meetings but only the Fed meeting will be a real market mover, while the ECB and BOE meetings should have a very moderate market impact.
KEY MONEY MARKET CHARTS
1M OIS forward Euribor futures before and after the 12M LTRO expiry
0.00
0.25
0.50
0.75
1.00
1.25
1.50
1.75
2.00
2.25
2.50
2.75
Jan-09 Jul-09 Dec-09 Jul-10 Dec-10 Jun-11 Dec-11
Refi 1M OIS 1-Oct-10 29-Oct-10
0.50
0.75
1.00
1.25
1.50
1.75
2.00
Jan-09 Jul-09 Feb-10 Aug-10 Mar-11 Sep-11 Apr-12
3M EU Strip nowStrip @ 01-Oct-10 3M (e)key rate
Source: Bloomberg, UniCredit Global Research
EUROSYSTEM: LIQUIDITY CONDITIONS AT A GLANCE (EUR BN) Liquidity demand Liquidity supply Excess liquidity Use of excess Res. requirement Autonomous fact. Total ECB overnight Exc. Reserves1W ch. 0.0 11.1 11.1 19 8 16 -81M ch. 2.1 -10.5 -8.4 -60 -51 -36 -1528-Oct-10 214 269 483 531 48 37 1121-Oct-10 214 258 472 513 41 22 1922-Sep-10 212 280 491 591 99 73 26
ECB LIQUIDITY CALENDAR
Expiry schedule Upcoming auction calendar 1w 1m 3m 6m 12m total 1W 1M 3M Other03-Nov-10 183 52 235.6 2-Nov-10 9-Nov-10 24-Nov-10 11-Nov-10 (6D)11-Nov-10 36 35.7 9-Nov-10 7-Dec-10 22-Dec-10 23-Dec-10 (13D)25-Nov-10 19 19.1 16-Nov-10 23-Dec-10 104 97 200.9 23-Nov-10 27-Jan-11 43 42.5 30-Nov-10 7-Dec-10 14-Dec-10 21-Dec-10
Auction calendar report the auction dates (settlement is t+1). Figures in EUR bn - Source: ECB, UniCredit research

29 October 2010 Economics & FI/FX Research
Curves & Crosses
UniCredit Research page 18 See last pages for disclaimer.
Euribor rates: historical movements and expectations 3M EURIBOR STRIP (RATES, %)***
0.6
0.7
0.8
0.9
1.0
1.1
1.2
1.3
1.4
1.5
Current 1st (Dec10 ) 2nd (Mar11 ) 3rd (Jun11 ) 4th (Sep11 )
Strip now Strip @ 29-Sep-10 3M (e) keyrate (e)
3M USD LIBOR STRIP (RATES, %)***
0.0
0.1
0.2
0.3
0.4
0.5
0.6
0.7
0.8
Current 1st (Dec10 ) 2nd (Mar11 ) 3rd (Jun11 ) 4th (Sep11 )
Strip now Strip @ 29-Sep-10 3M (e) keyrate (e)
3M GBP LIBOR STRIP (RATES, %)***
0.0
0.2
0.4
0.6
0.8
1.0
1.2
1.4
Current 1st (Dec10 ) 2nd (Mar11 ) 3rd (Jun11 ) 4th (Sep11 )
Strip now Strip @ 29-Sep-10 3M (e) keyrate (e)
3M 6M BASIS SWAP
-20
-15
-10
-5
0
5
10
15
20
25
30
35
Jun-02 Dec-03 Jun-05 Dec-06 Jun-08 Dec-09
3M 6M EUR
***. Triangles are the difference between the Euribor future with maturity are the indicated date and the 3M forward on the OIS curve, starting from the expiration date of the future. For example, the Mar09 triangles is the difference between the Euribor future expiring in Mar09 and the 3M forward on the OIS curve starting on the expiration date.
MONEY MARKET RATES RECENT CHANGES
Refi EONIA Euribor OIS Euribor / OIS 1M 3M 6M 12M 1M 3M 6M 12M 1M 3M 6M 12MLast M 1.00 0.70 0.79 1.00 1.23 1.50 0.74 0.76 0.81 0.89 5 24 42 61Last 3M 1.00 0.52 0.67 0.92 1.16 1.44 0.55 0.60 0.65 0.74 12 32 51 70Last week 1.00 0.83 0.84 1.04 1.26 1.53 0.78 0.82 0.88 0.98 6 23 38 55 1W ch. 0.0 -6.4 2.5 1.6 1.7 1.9 3.8 5.0 3.9 2.8 -1.3 -3.4 -2.2 -0.91M ch. 0.0 11.5 12.1 9.2 7.6 7.0 11.2 13.6 15.5 16.4 0.9 -4.4 -7.9 -9.43M ch. 0.0 23.0 23.6 17.5 14.5 14.8 19.0 20.4 20.4 20.8 4.6 -2.9 -5.9 -6.01Y ch. 0.0 46.1 42.1 32.5 26.6 30.2 37.0 38.0 37.4 23.3 5.1 -5.5 -10.8 6.9
The first three rows of the above table show average values computed on monthly, quarterly and weekly horizons. Row five to eight display the bp rate changes vs. the values recorded 1 week, month, quarter and year ago.
Back to front page

29 October 2010 Economics & FI/FX Research
Curves & Crosses
UniCredit Research page 19 See last pages for disclaimer.
Swap Monitor SWAP CURVE: PAST, SPOT, 6M FRA
1.6
1.9
2.7
5.7
5.84.8
0.5
1.0
1.5
2.0
2.5
3.0
3.5
0 5 10 15 20 25 30Maturity (years)
29-Oct-10 3 months ago Forward 6M
Numbers denote the 1w bp change in yields
ROLLDOWN &CARRY (6M HORIZON)
0
2
4
6
8
10
12
14
16
18
0 2 4 6 8 10 12 14 16 18 20 22 24 26 28 30
maturity (years)
bp
Today 1 week ago
2 & 5 YEAR SWAP RATE: WHAT FORWARDS TELL US
Cur
rent
: 59
3m: 5
7
6m: 5
8
9m: 5
7
0.5
1.0
1.5
2.0
2.5
3.0
3.5
4.0
4.5
5.0
5.5
Dec-06 Jun-07 Dec-07 Jun-08 Dec-08 Jun-09 Dec-09 Jun-10 Dec-10 Jun-11
2Y swap rate (%) 5Y swap rate (%) Forward rates
Numbers denote the spread in bp
10 & 30 YEAR SWAP RATE: WHAT FORWARDS TELL US
9m: 2
6m: 7
3m: 1
1
Cur
rent
: 17
2.0
2.5
3.0
3.5
4.0
4.5
5.0
5.5
Dec-06 Jun-07 Dec-07 Jun-08 Dec-08 Jun-09 Dec-09 Jun-10 Dec-10 Jun-11
10Y swap rate (%) 30Y swap rate (%) Forward rates
Numbers denote the spread in bp
10&30 AND 2&30 SPREADS: HISTORY AND FORWARD
140
3m 6m 9m
-100
-50
0
50
100
150
200
250
Dec-06 Jun-07 Dec-07 Jun-08 Dec-08 Jun-09 Dec-09 Jun-10 Dec-10 Jun-11
10/30Y spread (bp)
2/30Y spread (bp)
2/10Y spread (bp)
Forward spread
SWAP RATES AT A GLANCE
Average Cheap / rich Last Short term
(last 6M) Long term
(Jan99)Short term
(last 6M) Long term
(Jan99)2Y 1.60 1.37 3.38 CCCC EEEE5Y 2.18 2.04 3.89 CCC EEEE10Y 2.83 2.80 4.40 E EEEE15Y 3.13 3.15 4.65 E EEEE30Y 2.99 3.11 4.77 E EEEE
Cheap and rich indicators are base on distribution percentiles. EEEE=Very expensive, E= Expensive, CCCC=Very cheap, C=cheap. Valuations are from the investor’s perspective.
5Y SWAP-OPTION VOLA AT 5Y TENOR
22.59
13.6
16.0
8
10
12
14
16
18
20
22
24
26
28
Jan-99 Dec-00 Dec-02 Dec-04 Dec-06 Dec-08 Dec-10 Dec-12
Swaption vola (5Y) average since 1999 average since Aug07
SWAP CURVE AT A GLANCE
Average Cheap / rich Last Short term
(last 6M)Long term
(Jan99) Short term
(last 6M)Long term
(Jan99)2/5 58 67 49 EE -5/10 65 76 49 EEE C10/15 30 35 25 EEEE C15/30 -13 -4 11 EEEE EEEE2/5/10 -3 -5 0 CC E10/15/30 22 19 7 CCC CCCC
Source: Bloomberg, UniCredit Research
Back to front page

29 October 2010 Economics & FI/FX Research
Curves & Crosses
UniCredit Research page 20 See last pages for disclaimer.
Relative Value Monitor Greek spreads widen significantly
Elia Lattuga (UniCredit Bank Milan) +39 02 8862 2027 [email protected]
This week was characterized by choppy trading as investors' focus was on the upcoming FOMC meeting. Overall, Bund and UST yields moved up a bit. Peripheral countries delivereda very volatile performance (especially Ireland and Portugal). Most of EMU issuers moved inline with the swap curve, at the 30Y maturity most countries widened several bp. The dramatic sell-off hitting Greek bonds triggered a widening of GGBs vs. swap and vs.Germany, particularly at the belly and at the 10Y maturity. The GGBs ASW spread vs.Germany approached 790bp at the 5Y and 650bp at the 10Y.
1-WEEK ASW CHANGE (BP) 5Y MATURITY ASW SPREAD VS. GERMANY (BP)
-10
0
10
20
30
40
50
60
70
80
BE FR NL AT GE PT IT SP GR
13 18 3266
107144
263
789
0
100
200
300
400
500
600
700
800
900
NL FR AT BE IT SP PT GR
10Y MATURITY
-10
0
10
20
30
40
50
60
BE FR NL AT GE PT IT SP GR
21 33 4178
129154
305
647
0
100
200
300
400
500
600
700
NL FR AT BE IT SP PT GR
30Y MATURITY
-2
0
2
4
6
8
10
12
14
PT BE AT GE NL FR IT SP GR
1136 41
81
174188
237
369
0
50
100
150
200
250
300
350
400
NL AT FR BE IT SP PT GR
29 October 2010 Economics & FI/FX Research
Curves & Crosses
UniCredit Research page 21 See last pages for disclaimer.
Trade Ideas Elia Lattuga (UniCredit Bank Milan) +39 02 8862 2027 [email protected]
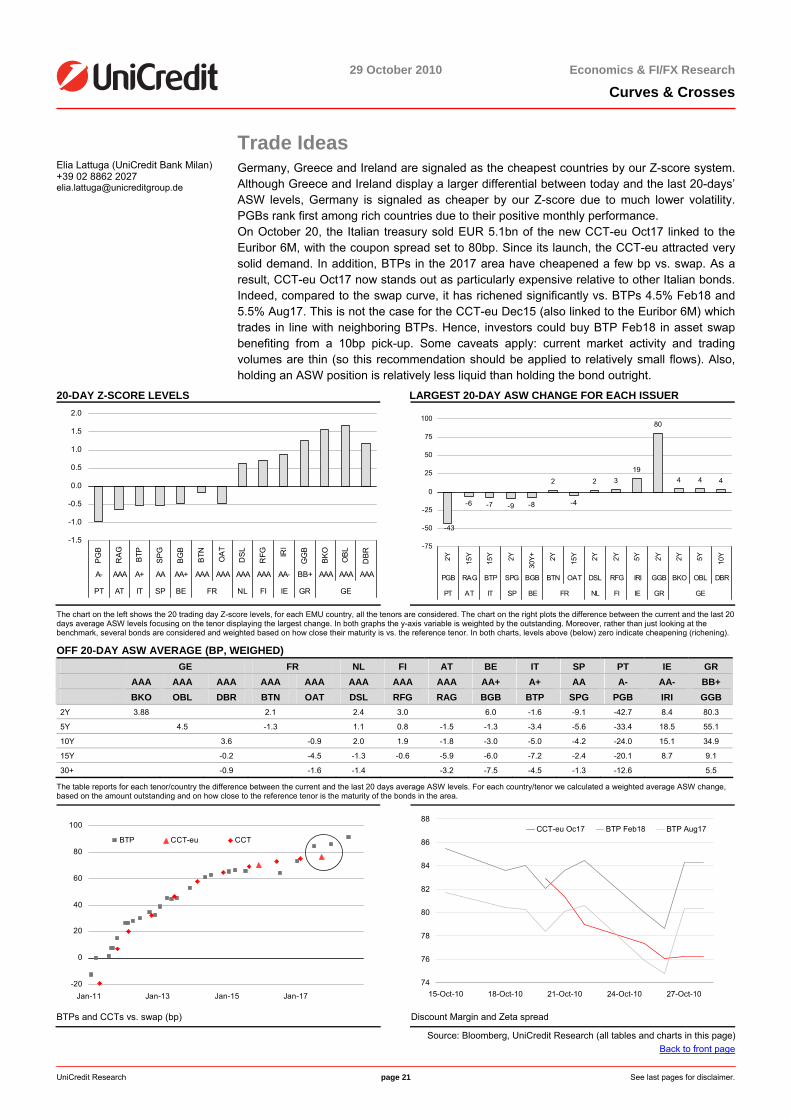
Germany, Greece and Ireland are signaled as the cheapest countries by our Z-score system. Although Greece and Ireland display a larger differential between today and the last 20-days’ ASW levels, Germany is signaled as cheaper by our Z-score due to much lower volatility. PGBs rank first among rich countries due to their positive monthly performance. On October 20, the Italian treasury sold EUR 5.1bn of the new CCT-eu Oct17 linked to the Euribor 6M, with the coupon spread set to 80bp. Since its launch, the CCT-eu attracted very solid demand. In addition, BTPs in the 2017 area have cheapened a few bp vs. swap. As aresult, CCT-eu Oct17 now stands out as particularly expensive relative to other Italian bonds.Indeed, compared to the swap curve, it has richened significantly vs. BTPs 4.5% Feb18 and5.5% Aug17. This is not the case for the CCT-eu Dec15 (also linked to the Euribor 6M) which trades in line with neighboring BTPs. Hence, investors could buy BTP Feb18 in asset swapbenefiting from a 10bp pick-up. Some caveats apply: current market activity and trading volumes are thin (so this recommendation should be applied to relatively small flows). Also, holding an ASW position is relatively less liquid than holding the bond outright.
20-DAY Z-SCORE LEVELS LARGEST 20-DAY ASW CHANGE FOR EACH ISSUER
-1.5
-1.0
-0.5
0.0
0.5
1.0
1.5
2.0
PG
B
RA
G
BTP
SP
G
BG
B
BTN OA
T
DS
L
RFG IR
I
GG
B
BK
O
OB
L
DB
R
A- AAA A+ AA AA+ AAA AAA AAA AAA AA- BB+ AAA AAA AAA
PT AT IT SP BE FR NL FI IE GR GE
-6 -7 -9 -8
2
-4
2 319
80
4 4 4
-43
-75
-50
-25
0
25
50
75
100
2Y 15Y
15Y 2Y
30Y+ 2Y 15Y 2Y 2Y 5Y 2Y 2Y 5Y 10Y
PGB RAG BTP SPG BGB BTN OAT DSL RFG IRI GGB BKO OBL DBR
PT AT IT SP BE FR NL FI IE GR GE
The chart on the left shows the 20 trading day Z-score levels, for each EMU country, all the tenors are considered. The chart on the right plots the difference between the current and the last 20 days average ASW levels focusing on the tenor displaying the largest change. In both graphs the y-axis variable is weighted by the outstanding. Moreover, rather than just looking at the benchmark, several bonds are considered and weighted based on how close their maturity is vs. the reference tenor. In both charts, levels above (below) zero indicate cheapening (richening).
OFF 20-DAY ASW AVERAGE (BP, WEIGHED) GE FR NL FI AT BE IT SP PT IE GR AAA AAA AAA AAA AAA AAA AAA AAA AA+ A+ AA A- AA- BB+ BKO OBL DBR BTN OAT DSL RFG RAG BGB BTP SPG PGB IRI GGB 2Y 3.88 2.1 2.4 3.0 6.0 -1.6 -9.1 -42.7 8.4 80.3
5Y 4.5 -1.3 1.1 0.8 -1.5 -1.3 -3.4 -5.6 -33.4 18.5 55.1
10Y 3.6 -0.9 2.0 1.9 -1.8 -3.0 -5.0 -4.2 -24.0 15.1 34.9
15Y -0.2 -4.5 -1.3 -0.6 -5.9 -6.0 -7.2 -2.4 -20.1 8.7 9.1
30+ -0.9 -1.6 -1.4 -3.2 -7.5 -4.5 -1.3 -12.6 5.5
The table reports for each tenor/country the difference between the current and the last 20 days average ASW levels. For each country/tenor we calculated a weighted average ASW change, based on the amount outstanding and on how close to the reference tenor is the maturity of the bonds in the area.
-20
0
20
40
60
80
100
Jan-11 Jan-13 Jan-15 Jan-17
BTP CCT-eu CCT
BTPs and CCTs vs. swap (bp)
74
76
78
80
82
84
86
88
15-Oct-10 18-Oct-10 21-Oct-10 24-Oct-10 27-Oct-10
CCT-eu Oc17 BTP Feb18 BTP Aug17
Discount Margin and Zeta spread
Source: Bloomberg, UniCredit Research (all tables and charts in this page) Back to front page

29 October 2010 Economics & FI/FX Research
Curves & Crosses
UniCredit Research page 22 See last pages for disclaimer.
EGB spread monitor: yield spreads vs. Germany (bp) Country Bond 10Y yield Spread vs. DE 1W ch. (bp) 1M ch. (bp) All-time high All-time low DE DBR 2.25 Sep-20 2.54 - NL NETHER 3.5 Jul-20 2.75 21 -1 -1 87 17-Feb-09 -9.4 20-May-05 FI RFGB 3.375 Apr-20 2.76 22 0 -3 89 21-Jan-09 -9.2 25-Nov-05 FR FRTR 2.5 Oct-20 2.93 39 -1 2 63 9-Mar-09 -1.4 11-Jul-03 AT RAGB 3.9 Jul-20 2.93 39 -1 -12 137 18-Feb-09 -7 21-Apr-06 BE BGB 3.75 Sep-20 3.36 82 -5 1 138 22-Jan-09 -3.5 27-Jan-05 IT BTPS 3.75 Mar-21 3.94 140 3 -17 178 8-Jun-10 3.5 2-Jul-03 ES SPGB 4.85 Oct-20 4.20 166 0 -15 221 16-Jun-10 -5.9 25-Nov-04 PT PGB 4.8 Jun-20 6.04 350 11 -34 427 28-Sep-10 -3.2 7-Mar-05 IE IRISH 5 Oct-20 6.94 440 35 37 449 28-Sep-10 -6.9 14-Jan-04 GR GGB 6.25 Jun-20 10.71 817 129 31 965 7-May-10 8.1 18-Feb-05
AAA GROUP NOT AAA GROUP 5Y MATURITY
-20
0
20
40
60
80
100
120
140
160
Apr-07 Oct-07 Apr-08 Oct-08 Apr-09 Oct-09 Apr-10 Oct-10
5Y FR-DE 5Y AT-DE 5Y NL-DE
5Y MATURITY
0
200
400
600
800
1000
1200
1400
Apr-07 Oct-07 Apr-08 Oct-08 Apr-09 Oct-09 Apr-10 Oct-10
5Y IT-DE 5Y GR-DE 5Y PT-DE
5Y BE-DE 5Y ES-DE
10Y MATURITY
0
20
40
60
80
100
120
140
160
Apr-07 Oct-07 Apr-08 Oct-08 Apr-09 Oct-09 Apr-10 Oct-10
10Y FR-DE 10Y AT-DE 10Y NL-DE
10Y MATURITY
0
100
200
300
400
500
600
700
800
900
1000
Apr-07 Oct-07 Apr-08 Oct-08 Apr-09 Oct-09 Apr-10 Oct-10
10Y IT-DE 10Y GR-DE 10Y PT-DE
10Y BE-DE 10Y ES-DE
30Y MATURITY
0
20
40
60
80
100
120
Apr-07 Oct-07 Apr-08 Oct-08 Apr-09 Oct-09 Apr-10 Oct-10
30Y FR-DE 30Y AT-DE 30Y NL-DE
30Y MATURITY
0
100
200
300
400
500
600
700
Apr-07 Oct-07 Apr-08 Oct-08 Apr-09 Oct-09 Apr-10 Oct-10
30Y IT-DE 30Y GR-DE 30Y PT-DE30Y BE-DE 30Y ES-DE
Note: We use Bloomberg generics for all issuers across maturities Source Bloomberg, UniCredit Research (for all charts in this page) Back to front page

29 October 2010 Economics & FI/FX Research
Curves & Crosses
UniCredit Research page 23 See last pages for disclaimer.
Inflation Monitor
Eurozone October inflation: a tad higher than expected Marco Valli (UniCredit Bank Milan) +39 02 8862 8688 [email protected]
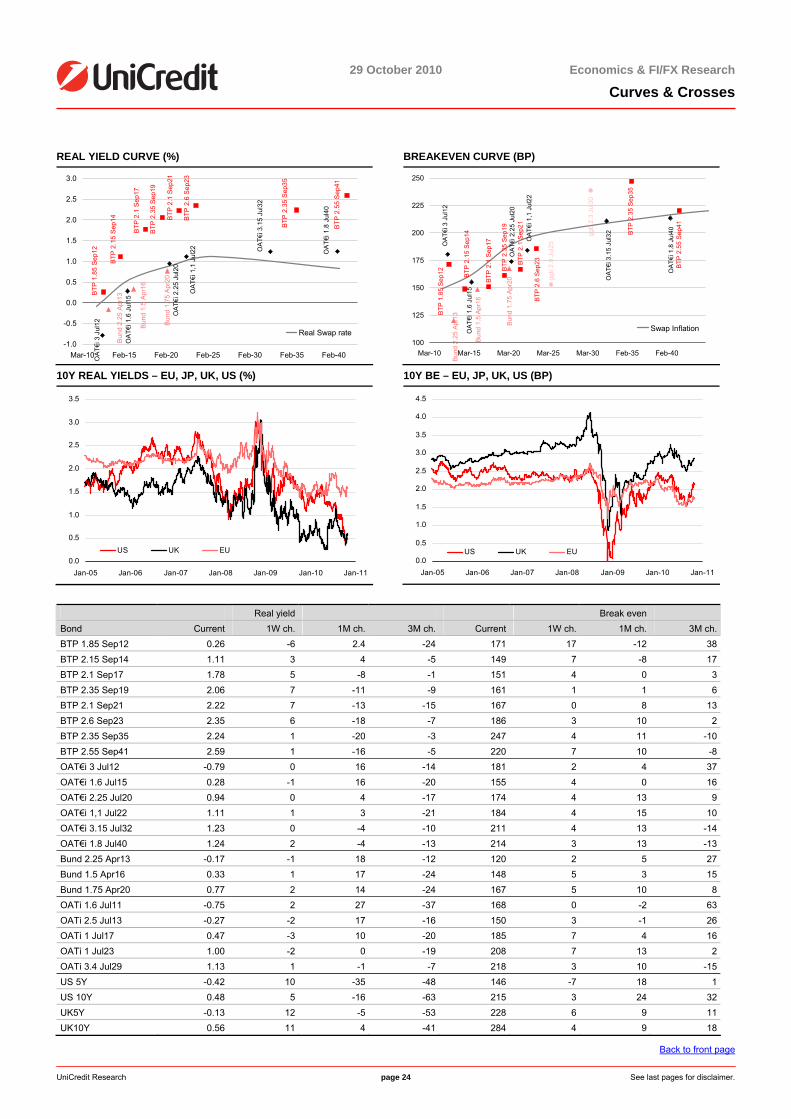
• The flash estimate showed that eurozone inflation in October was a tad higher than we had expected, showing an acceleration to 1.9% yoy vs. the previous 1.8%. We and consensushad penciled in a stable outcome. On a monthly basis, prices probably rose 0.3%. Theflash estimate is consistent with HICP ex tobacco printing at 1.8% yoy.
• Judging from the limited information available at the country level, we think that the upsidesurprise with respect to our forecast was mostly driven by core items, while food andenergy inflation seems to have moved broadly in line with our forecast. For the final release, we see risks skewed towards a downward revision of the preliminary estimate.
• In Italy, October CPI was reported at +0.2% mom, +1.7% yoy. The monthly reading was0.1pp higher than we had expected, while the yearly rate was on track. The data breakdown shows unusually solid gains in leisure/culture and hotels/restaurants prices,which we suspect hide some changes in the usual seasonal pattern. If this reading iscorrect, today’s upside surprise on these price categories should be reversed inNovember.
• We don’t expect eurozone inflation to rise further from the current level for several months.
• Our year-end inflation target in the eurozone remains 1.8% yoy.
US INFLATION-LINKED MARKET
0.0
0.5
1.0
1.5
2.0
2.5
3.0
BE 30Y BE 10Y BE 5Y 5Y5Y FFWD Inflation
L-T 1Y 6M Last
EU INFLATION-LINKED MARKET
0.0
0.5
1.0
1.5
2.0
2.5
3.0
BE 30Y BE 10Y BE 5Y 5Y5Y FFWD Inflation
L-T 1Y 6M Last
Source: Bloomberg, UniCredit Research
29 October 2010 Economics & FI/FX Research
Curves & Crosses
UniCredit Research page 24 See last pages for disclaimer.
REAL YIELD CURVE (%)
BTP
2.6
Sep
23
BTP
2.1
Sep
21
BTP
2.3
5 S
ep19
BTP
2.1
Sep
17
BTP
2.1
5 S
ep14
BTP
1.8
5 S
ep12
BTP
2.3
5 S
ep35
BTP
2.5
5 S
ep41
OAT
€i 3
Jul
12
OAT
€i 1
.6 J
ul15
OA
T€i 2
.25
Jul2
0
OA
T€i 1
,1 J
ul22 O
AT€
i 3.1
5 Ju
l32
OA
T€i 1
.8 J
ul40
Bun
d 2.
25 A
pr13
Bun
d 1.
5 A
pr16
Bun
d 1.
75 A
pr20
-1.0
-0.5
0.0
0.5
1.0
1.5
2.0
2.5
3.0
Mar-10 Feb-15 Feb-20 Feb-25 Feb-30 Feb-35 Feb-40
Real Swap rate
BREAKEVEN CURVE (BP)
BTP
2.55
Sep
41
BTP
2.35
Sep
35
BTP
1.85
Sep
12 BTP
2.15
Sep
14
BTP
2.1
Sep1
7
BTP
2.35
Sep
19
BTP
2.1
Sep2
1
BTP
2.6
Sep2
3
OAT
€i 1
.8 J
ul40
OA
T€i 3
.15
Jul3
2
OAT
€i 1
,1 J
ul22
OAT
€i 2
.25
Jul2
0
OAT
€i 1
.6 J
ul15
OAT
€i 3
Jul
12
Bund
1.7
5 Ap
r20
Bund
1.5
Apr
16
Bund
2.2
5 Ap
r13
ggb
2.3
Jul3
0
ggb
2.9
Jul2
5
100
125
150
175
200
225
250
Mar-10 Mar-15 Mar-20 Mar-25 Mar-30 Feb-35 Feb-40
Swap Inflation
10Y REAL YIELDS – EU, JP, UK, US (%)
0.0
0.5
1.0
1.5
2.0
2.5
3.0
3.5
Jan-05 Jan-06 Jan-07 Jan-08 Jan-09 Jan-10 Jan-11
US UK EU
10Y BE – EU, JP, UK, US (BP)
0.0
0.5
1.0
1.5
2.0
2.5
3.0
3.5
4.0
4.5
Jan-05 Jan-06 Jan-07 Jan-08 Jan-09 Jan-10 Jan-11
US UK EU
Real yield Break even Bond Current 1W ch. 1M ch. 3M ch. Current 1W ch. 1M ch. 3M ch.BTP 1.85 Sep12 0.26 -6 2.4 -24 171 17 -12 38BTP 2.15 Sep14 1.11 3 4 -5 149 7 -8 17BTP 2.1 Sep17 1.78 5 -8 -1 151 4 0 3BTP 2.35 Sep19 2.06 7 -11 -9 161 1 1 6BTP 2.1 Sep21 2.22 7 -13 -15 167 0 8 13BTP 2.6 Sep23 2.35 6 -18 -7 186 3 10 2BTP 2.35 Sep35 2.24 1 -20 -3 247 4 11 -10BTP 2.55 Sep41 2.59 1 -16 -5 220 7 10 -8OAT€i 3 Jul12 -0.79 0 16 -14 181 2 4 37OAT€i 1.6 Jul15 0.28 -1 16 -20 155 4 0 16OAT€i 2.25 Jul20 0.94 0 4 -17 174 4 13 9OAT€i 1,1 Jul22 1.11 1 3 -21 184 4 15 10OAT€i 3.15 Jul32 1.23 0 -4 -10 211 4 13 -14OAT€i 1.8 Jul40 1.24 2 -4 -13 214 3 13 -13Bund 2.25 Apr13 -0.17 -1 18 -12 120 2 5 27Bund 1.5 Apr16 0.33 1 17 -24 148 5 3 15Bund 1.75 Apr20 0.77 2 14 -24 167 5 10 8OATi 1.6 Jul11 -0.75 2 27 -37 168 0 -2 63OATi 2.5 Jul13 -0.27 -2 17 -16 150 3 -1 26OATi 1 Jul17 0.47 -3 10 -20 185 7 4 16OATi 1 Jul23 1.00 -2 0 -19 208 7 13 2OATi 3.4 Jul29 1.13 1 -1 -7 218 3 10 -15US 5Y -0.42 10 -35 -48 146 -7 18 1US 10Y 0.48 5 -16 -63 215 3 24 32UK5Y -0.13 12 -5 -53 228 6 9 11UK10Y 0.56 11 4 -41 284 4 9 18
Back to front page

29 October 2010 Economics & FI/FX Research
Curves & Crosses
UniCredit Research page 25 See last pages for disclaimer.
Supply Corner: The week ahead
Focus on the new 5Y benchmark from Spain Weekly recap
Chiara Cremonesi (UniCredit Bank London) +44 207 826 1771 [email protected]
The leading theme of the week was a progressive deterioration in the sentiment on periphery, especially on Ireland, Portugal and Greece. Results at the Spanish T-bill and Portuguese bond auctions were not up to the standards of the previous auctions; nevertheless, demand held up rather well considering the difficult environment. As expected, demand at the Italian auctions was healthy.
Italian and Spanish T-bill auctions The Italian 6M BOT auction on Tuesday was well received, while Spain did not collect themaximum of the range announced with the 3M & 6M T-bills sale.
Portugal On Wednesday, Portugal sold EUR 0.611bn of OT Oct 2014 and EUR 0.614bn of OTJun2018, overall EUR 1.225bn, towards the upper end of the announced range (EUR0.75/1.25). Demand was less strong than at previous auctions, with OT Jun18 registering a 1.7x bid to cover and OT Oct14 registering a 2.8x bid-to-cover. Portugal managed to sell both bonds at an average yield below market level ahead of the auction. However, one has to takeinto consideration that both bonds were under pressure yesterday. While the auction results compare unfavorably with the previous Portuguese auctions, they were still rather decent taking into account that negotiations on the 2011 budget between thegovernment and the opposition are still ongoing and there is a lot of uncertainty on this issue (note that the opposition interrupted the talks right after the auction). With this auction, YTD Portugal has issued EUR 19.725bn, completing 94% of theissuance target for this year. We expect Portugal to hold another auction until year end to complete its yearly funding.
The new 3Y benchmark from Italy Yesterday, the Italian Treasury sold EUR 4bn of the new 3Y benchmark, BTP Nov11 andEUR 3.25bn of BTP Mar2. The auction went well. Overall, Italy sold EUR 7.25bn, the maximum of the range announced. BTP Mar21 was sold at 3.89%, roughly corresponding to the level where the 10Y benchmark was sold one monthago (3.90%). The new 3Y benchmark was sold at 2.32%, 11bp higher than the level of the 3Yat the end of September auction (the Treasury sold BTP Jun13 back then). The higher yield, however, is entirely due to the longer maturity of the new benchmark. Bid-to-cover ratios were 1.41x for the 10Y and 1.34x for the new 3Y, only slightly lower thanat the previous auctions (1.48x for the 10Y re-opening at the end of September and 1.52x, back at the end of May auction, when Italy issued the previous 3Y benchmark, BTP Jun13). Overall, the results were good and confirmed that appetite for Italian paper remains sound. AsEUR 21bn of BTPs will expire on Monday, one could argue that demand could have beeneven stronger. However, some investors could have been unwilling to open fresh positionsahead of the crucial Fed meeting next week. Moreover, the environment for periphery has sharply deteriorated over the last few days, as also confirmed by the not stellar results at the Spanish T-bill and Portuguese bond auctions. With this auction, YTD Italy has issued EUR 243bn of bonds (including CCTs andCTZs). We expect Italy to hold one CTZ re-opening, a 5Y/long-term BTP auction in mid-November, and a 3/10Y BTP, CCT auction at the end of November for an overall amount ofca. EUR 16/17bn, which would lead to a yearly target of gross issuance in the EUR 260bnarea. We expect the November ILB auction and the mid-December BTP auctions to becancelled.
Next week's preview Next week, there will be no redemptions and we expect gross supply to be in the EUR 18.5/20.5bn
Next week, there will be no redemptions in the EMU and this will remain the case until the end of November. We expect gross supply to be EUR 18.5/20.5bn, roughly in line with the weekly average registered so far (EUR 19.5bn).
Activity will mainly come from core countries
Activity in the bond market will mainly come from core countries (France, Germany and Finland), while only Spain will hold a bond auction in the periphery group.

29 October 2010 Economics & FI/FX Research
Curves & Crosses
UniCredit Research page 26 See last pages for disclaimer.
More than 50% of supply will come on the 5Y, the rest on long/extra-long maturities
In terms of maturities, more than 50% of the issuance will come on the 5Y maturities. France and Finland will instead re-open long and extra long bonds.
Finland will hold the last auction for this year
On Tuesday, Finland will sell up to EUR 1.5bn of RFGB Apr20 and Jul25. The Finnish Treasury said that with this auction, it will complete this year's funding. Finland will have issued EUR 13.5bn in domestic bonds (EUR 3.5bn more than last year) and EUR 3.5bn ininternational bonds (double the amount sold last year).
Germany will sell EUR 5bn of Obl Oct15
On Wednesday, Germany will sell EUR 5bn of Obl Oct15. Over the last few weeks, the 5Y area cheapened significantly vs. the 2Y & the 10Y area and at the current level, some investors could find it interesting to invest in this bucket, especially if the environment on periphery continues to deteriorate. However, some investors could also wait for the Fedmeeting before running the risk that a disappointing outcome weighs heavily on the bondmarket.
France will issue EUR 7.5/9bn of OAT Oct20, Oct23 and Apr60
On Thursday, France will sell EUR 7.5/9.0bn of OAT Oct20, Oct23 and Apr60. The amount announced for the next week’s auction is larger than what we expected. We nowexpect gross bond supply this year from France to be higher than EUR 200bn, meaning more than EUR 12bn should be pre-funding for the next year (officially France issuance net of buybacks should be EUR 188bn in 2010).
Spain: a new 5Y benchmark On Thursday, Spain will sell a new 5Y Bono, SPGB 3.25% Apr16. SW+105bp (3.35%) is the fair value calculated by interpolating SPGB Jan16 and SPGB Jan17. At this level, thenew 5Y benchmark would trade 40bp cheaper than BTP Aug16 in ASW, offering a 38bp ofyield pick-up vs. the Italian bond, so some investors could find it interesting. We expect Spain to issue EUR 4.5/5bn of the new benchmark, a higher amount compared to the averageregistered so far as Spain still has to issue EUR 16bn in bonds till year-end with only four more auctions scheduled (including the one next week).
Portugal: 4M and 12M T-bills Another key event next week will be the Portuguese T-bill auction. As the opposition ended talks with the government on the 2011 budget, Portuguese bonds have suffered a lot. Nextweek, on 3 November, the first parliamentary vote is scheduled. The vote will come after the T-bill auction. It will thus be interesting to see how the auction goes both in terms of yieldslevel and strength of demand.
NEXT TWO WEEKS' SUPPLY (GROSS SUPPLY FIGURES ARE EX BOTS, CCTS AND CTZS)
Date Country Bond in issue Min Max Bucket Date Country Bond in issue Min Max Bucket 2-Nov FI RFGB Apr20 & Jul25 1.5 10Y &
15Y 9-Nov NL DSL Jul20 2.5 / 3.5 10Y
3-Nov GE Obl Oct15 5.0 5Y 9-Nov AT RAGB Feb17 & Mar26
1.3 / 1.5
3-Nov PT T-bills 4M T-bills, 12M T-bills 1.0 / 1.3 MM 10-Nov IT 12M BOT 5.5 MM 4-Nov FR OAT OAT Oct20, Oct23 &
Apr60 7.5 / 9.0 10Y &
50Y 10-Nov GE New Schatz Dec12 6.0 2Y
4-Nov SP New 5Y Bono 4.5 / 5.0 5Y 12-Nov IT BTP New 5Y & 15/30Y BTP
6.5 / 7.0 5Y, 15Y & 30Y
Gross supply (ex BOTs, CCTs, CTZs)
18.5 / 20.5 Gross supply (ex BOTs, CCTs, CTZs)
16.3 / 18.0
Redemptions 0.0 Redemptions 0.0 Coupons 0.0 Coupons 0.2 Net supply 18.5 / 20.5 Net supply 16.3 / 18.0
NEXT FOUR WEEKS’ REDEMPTIONS IN DETAIL NEXT FOUR WEEKS’ COUPONS IN DETAIL 30-Oct/06-Nov /06-Nov/13-Nov 13-Nov/20-Nov 20-Nov/27-Nov 16-Oct/23-Oct 23-Oct/30-Oct 30-Oct/06-Nov /06-Nov/13-Nov
2/5Y - 0.2 - 0.7
Total - - - - 6/8Y 0.0 - - -
10Y - - - -
15/30Y - - - -
0.0 0.2 - 0.7
Total - 0.0 1.5 2.8
Redemptions are inserted in the indicated weeks as if they were paid three days in advance with respect to the actual date at which the bond is redeemed. This is done to allow for the exact matching of redemption flows with the auction settlement date (T+3). Source: Ministries of Finance, UniCredit Research

29 October 2010 Economics & FI/FX Research
Curves & Crosses
UniCredit Research page 27 See last pages for disclaimer.
Next month’s preview Liquidity will be very low in November and will come from Italy
Liquidity has been rather low In October but November will be even less liquid. Redemptions will amount to a modest EUR 21bn, while coupons will be EUR 4.5bn. Liquidity will allcome from Italy on 1 November.
Slightly lower gross supply in November with respect to October, but higher net supply
We expect gross supply in November to be EUR 64/71bn, slightly lower than in October and still much lower than the average monthly volume registered so far (EUR 87bn). Net supply should be much higher than in October, in the EUR 42/50bn area (vs. EUR33bn).
Gross supply in December should be EUR 25/30bn
Given our estimates for November, we expect gross supply in December to be ca. EUR 25/30bn. This will be slightly more than in December 2009 (EUR 3/8bn) and ca. in line withDecember 2008. Net supply should be EUR -3/2bn, roughly in line with the last two years.
Net supply in November will be negative in Italy (by EUR 3.5/6bn), while it should be higher in Germany, France and Spain.
60% of the activity will come from core/mid countries, while 40% will come from periphery
60% of the supply should come from core/mid countries, while 40% should come fromperiphery, with Italy and Spain the main contributors. Ireland and Belgium should not hold any auction in November.
Lively activity at the 10Y and 5Y… Activity will be lively at the 10Y and 5Y (30% and 27% of the EMU supply, respectively). At the 5Y, Spain and Italy will issue new benchmarks, while at the 10Y Germany will issue a new Bund Jan21. Supply flows will be relevant at the short end (20%), where Italy has issued a new 3Y BTP (settling in November) and Germany will issue a new Schatz Dec12.
…as well as on the extra long end 13% of the overall November gross supply will come on the extra long end, of which only 4% should go on the 15Y and 8% on the 30/30Y+.
USD 170bn of supply in the US In the US, we expect ca. USD 170bn of supply in November (see calendar for details). If theFed announces a strong QE program, demand for USTs should be quite healthy at the nextmonths’ auctions.

29 October 2010 Economics & FI/FX Research
Curves & Crosses
UniCredit Research page 28 See last pages for disclaimer.
Supply recap
YTD SUPPLY BY MATURITY: 2009 & 2010 YTD SUPPLY BY COUNTRY: 2009 & 2010
243
212 221
61 51
33 40
213
66 54 44 35
248
217
0
40
80
120
160
200
240
280
320
360
3y 5y 10y 15y 30y + IL Floater
EU
R b
n
2009 2010YTD Supply 2009: €861 bn 2010 : €876 bn
23
157
136
253
44
4 4
98
38.8
179.
0
19.7
2.5 6.8
10
14
32 33
12.0
18.7
19.9
81.5
185.
0
243.
3
48.5
0
40
80
120
160
200
240
280
320
AT BE FI FR GE IE IT NL PT SL SK SP
EUR
bn
2009 2010
Source: Bloomberg, UniCredit Research
PROGRESS OF FUNDING BY MATURITY & BY COUNTRY
Country AT BE FI FR GE GR IE IT NL PT SL SK SP TOT
YTD Exp YTD Exp YTD Exp YTD Exp YTD Exp YTD Exp YTD Exp YTD Exp YTD Exp YTD Exp YTD Exp YTD Exp YTD Exp YTD Exp
Maturity
3y 0 - 3 4 0 - 35 39 63 74 0 - 0 - 78 84 16 16 3 3 0 - 1 1 18 20 217 240
5y 8 10 11 11 5 5 50 52 42 52 13 13 6 6 41 44 13 13 5 6 1 1 1 1 17 22 213 235
10y 7 8 19 19 6 6 48 54 54 60 5 5 12 12 49 52 10 13 10 10 2 2 2 2 24 30 248 273
15y 3 4 1 1 2 3 18 18 0 - 0 - 1 1 19 20 3 3 2 3 0 - 2 2 15 17 66 72
30y + 1 1 5 5 0 - 14 18 10 10 0 - 0 - 11 13 7 8 0 - 0 - 0 - 6 7 54 60
IL 0 - 0 - 0 - 19 21 10 12 0 - 0 - 15 15 0 - 0 - 0 - 0 - 0 - 44 48
Floater 0 - 0 - 0 - 0 - 0 - 2 2 0 - 31 33 0 - 0 - 0 - 1 0 2 2 35 37
Total ‘10 19 22 39 39 12 14 185 202 179 208 20 20 20 20 243 260 49 53 20 21 3 3 7 7 82 97 876 965
Red. ‘10 9 26 5 91 134 17 1 172 23 6 1 3 34 518
Net supply ‘10 13 13 9 111 74 3 19 88 30 15 2 4 63 438
Total ‘09 23 35 10 178 158 60 34 263 48 15 4 4 113 0 937
Red. ‘09 13 19 6 112 138 28 5 162 35 6 0 3 31 555
Net supply ‘09 10 16 4 66 20 32 29 101 13 9 4 2 82 382
Source: Bloomberg, UniCredit Research
PROGRESS OF SUPPLY BY MATURITY (%) PROGRESS OF SUPPLY BY COUNTRIES (%)
€ 35
bn
€ 44
bn
€ 54
bn
€ 66
bn
€ 24
8bn
€ 21
3bn
€ 21
7bn
€ 6
bn
€ 2
bn
€ 2
3bn
€ 2
2bn
€ 2
6bn
€ 6
bn
€ 4
bn
0%
10%
20%
30%
40%
50%
60%
70%
80%
90%
100%
3y 5y 10y 15y 30y + IL Floater
YTD Still to do
€ 1
9bn
€ 4b
n
€ 8
2bn
€ 3
bn
€ 1
79bn
€ 2
0bn
€ 3
9bn
€ 7
bn
€ 2
0bn
€ 2
43bn
€ 4
9bn
€ 1
85bn
€ 1
2bn
€ 15
bn
€ 29
bn
€ 0b
n
€ 0b
n
€ 0b
n
€ 0b
n
€ 1b
n
€ 17
bn
€ 4b
n
€ 17
bn
€ 2b
n
0%
10%
20%
30%
40%
50%
60%
70%
80%
90%
100%
IE SL BE SK PT IT NL FR FI GE SP AT
YTD Still to do
Source: Bloomberg, UniCredit Research (all tables and charts in this and the previous page)

29 October 2010 Economics & FI/FX Research
Curves & Crosses
UniCredit Research page 29 See last pages for disclaimer.
Eurozone Debt Structure DEBT MATURING IN THE NEXT 12 M (AS % OF TOT DEBT)
28 45 103 2 10
14328
1916
422
8 0
5787 210 4 19
8540
1469
68
40
0%
5%
10%
15%
20%
25%
30%
35%
NL SP FR SK PT GE BE IT FI IE GR AT SL
M/L MM
Numbers denote the amount in EUR bn
S&P RATING VS. SWAP SPREAD
SKSLAT
FI
FRNL BE
SP
PT
GE
IT
IE
GR
BBB
-
BBB
BBB
+A-A
A+
AA-AA
AA+
AAA
BB+
y = 66.941x - 91.46R2 = 0.834
-100
0
100
200
300
400
500
600
700
800
900
1 3 5 7 9 11
The chart takes into account the rating & the outlook MARKETABLE DEBT REDEMPTIONS PROFILE
EUR bn AT BE FI FR GE GR IE IT NL PT SP SK SL EU
Next 30Days (M/L) 0 0 0 0 0 0 0 21 0 0 0 0 0 21 Next 12M (M/L) 8 28 6 103 143 22 4 191 28 10 45 2 0 587 2010 0 0 0 0 14 0 0 35 0 0 0 0 0 50 2011 8 28 6 103 147 28 4 155 28 10 45 2 0 562 2012 10 30 6 122 140 31 6 186 28 9 46 3 1 613 2013 12 27 6 99 79 25 6 119 30 9 55 2 0 466 2014 22 23 7 81 85 31 12 89 14 13 41 1 2 419 2015 11 27 5 103 86 20 0 112 28 10 32 2 1 434 2016 10 22 4 50 51 8 10 42 13 6 15 1 1 231 2017 12 20 6 63 39 21 0 74 13 6 28 1 0 282 2018 11 10 0 42 41 8 9 42 13 7 16 0 0 199 2019 11 10 5 64 48 24 14 82 13 8 27 1 1 307 2020 12 17 6 56 60 5 20 66 12 7 23 2 2 283 >2020 36 45 5 247 150 60 8 331 44 22 95 3 2 1043 Total M/L 158 260 55 1029 940 259 90 1333 237 105 423 19 10 4917 MM 4 40 9 210 85 8 6 146 57 19 87 4 0 676 Other instruments in EUR 2 1 0 0 0 15 0 30 0 0 0 5 1 55 Foreign debt 13 5 4 0 3 5 0 36 0 3 8 0 0 77 Total debt (including foreign and MM)
176 307 68 1239 1028 288 96 1545 294 126 518 28 12 5725
EUROZONE COUNTRIES BIRD'S EYE
GDP Deficit/GDP Debt/GDP Rating (S&P) Debt (bn of EUR) Swap Spread Yield current
5Y avg
2010e 2011e 5Y avg
2010e 2011e 5Y avg
2010e 2011e Rating Outlook MM (EUR bn)
M/L (EUR bn)
Avg life
5Y avg
Act. Act.
AT 2.4 1.9 1.7 -1.5 -4.3 -3.8 63 69 70 AAA stable 5 158 10.1 -4 10 2.93BE 1.1 1.3 1.6 -2.0 -5.0 -5.0 90 99 101 AA+ stable 45 257 8.5 2 53 3.36FI 1.1 1.4 2.1 2.7 -3.8 -2.9 39 51 55 AAA stable 9 55 7.9 -13 -7 2.77FR 0.8 1.5 1.4 -3.7 -7.7 -6.3 68 83 93 AAA stable 211 1184 8.1 -13 11 2.94GE 0.7 3.3 2.5 -1.5 -3.5 -2.6 68 85 86 AAA stable 86 980 8.6 -31 -29 2.55GR 2.3 -4.0 -2.6 -7.0 -7.8 -7.0 102 133 145 BB+ negative 12 259 8.6 120 786 10.69IE* 2.7 -0.3 -2.6 -3.4 -32.0 -9.5 37 99 104 AA- negative 6 90 8.8 45 412 6.96IT -0.4 1.0 1.1 -3.4 -5.0 -4.3 108 119 119 A+ stable 143 1317 8.8 31 110 3.94NL 1.5 1.9 1.8 -0.9 -5.8 -4.0 53 64 66 AAA stable 51 237 7.6 -12 -8 2.76PT 0.4 1 -1.3 -5.0 -7.3 -4.6 66 82 87 A- negative 18 104 8.2 33 312 5.96SP 1.7 -0.3 0.4 -2.1 -9.3 -7.3 42 64 73 AA negative 85 426 7.8 13 137 4.20SL 2.6 1.1 1.8 -1.1 -6.0 -4.7 27 40 43 AA stable 0 10 8.8 - 73 3.56SK 5.5 2.7 3.6 -3.4 -6.0 -5.5 31 39 43 A+ stable 4 19 7.6 - 96 3.79
(*) Figures include over 20pp in banking sector related costs Source: Bloomberg, EC, UniCredit Research (all tables and charts in this page)
Back to front page

29 October 2010 Economics & FI/FX Research
Curves & Crosses
UniCredit Research page 30 See last pages for disclaimer.
Eurozone Money Market Monitor STOCK OF MONEY MARKET INSTRUMENTS (CURRENT, AT 31ST DECEMBER 2007, 2008 & 2009 (ESTIMATES)) & FUTURE REDEMPTIONS (1 & 3M)
Outstanding Net Change Redemptions Dec-08 Dec-09 Dec-10 (e) Current (current/end 2009) (end 2010 (e) /end 2009) Next 1M Next 3M - - 5 8 4 -1 3 0 1
27 41 38 40 40 2 2 6 17 6 8 12 11 9 -3 -1 0 0
78 139 214 200 210 -4 -15 43 109 36 39 104 87 85 -19 -17 9 25 - 1 8 10 8 0 2 0 5 0 0 8 8 6 -2 0 0 2
128 148 140 140 146 6 0 15 48 16 81 60 65 57 -3 5 14 31 9 12 17 19 19 2 2 4 7
32 45 85 85 87 2 0 10 28 332 514 692 673 672 -20 -19 102 273
Source: Ministry of Finance of different eurozone countries, Bloomberg, UniCredit Research
EUROZONE MONEY MARKET YIELDS1
3M & 6M YIELDS AND SPREAD VS. EONIA 3M & 6M YIELDS IN EACH COUNTRY
3M Spread vs. Eonia (bp) 6M Spread vs.
Eonia (bp) AT - - 0.93 2.7 BE 0.76 -8.0 0.88 -2.2 FI 0.71 -12.5 0.77 -13.5 FR 0.66 -18.0 0.78 -12.3 GE 0.58 -25.3 0.70 -19.6 GR 4.84 400.2 5.26 436.1 IE 1.48 64.1 1.90 99.8 IT 0.99 14.8 1.17 26.7 NL 0.66 -17.6 0.74 -15.7 PT 1.47 62.8 1.80 89.8 SP 0.99 15.5 1.32 42.3
EONIA 0.838 0.900 EURIBOR 1.045 1.267
0.00
0.66
0.58
4.84
1.48
0.99
0.66
1.47
0.99
0.93
0.88
0.77
0.78
0.70
5.26
1.90
1.17
0.74
1.80
1.32
0.71
0.76
0.00
1.00
2.00
3.00
4.00
5.00
6.00
AT
BE FI FR GE
GR IE IT NL
PT
SP
3M 6M
Source: Bloomberg, UniCredit Research
MONEY MARKET REDEMPTIONS
…IN THE NEXT MONTH …AND IN THE NEXT 3 MONTHS
0
20
40
60
80
100
120
IT GR PT BE SP IE NL AT FI FR DE EU
Eur b
n
0
50
100
150
200
250
300
IT GR PT BE SP IE NL AT FI FR DE EU
Eur b
n
Source: Bloomberg, UniCredit Research (all tables and charts in this page) Back to front page
1 We computed the yield as a weighted average of the yields at each of the maturity considered (3&6M). We used the outstanding amounts of each T-bill as weighs.
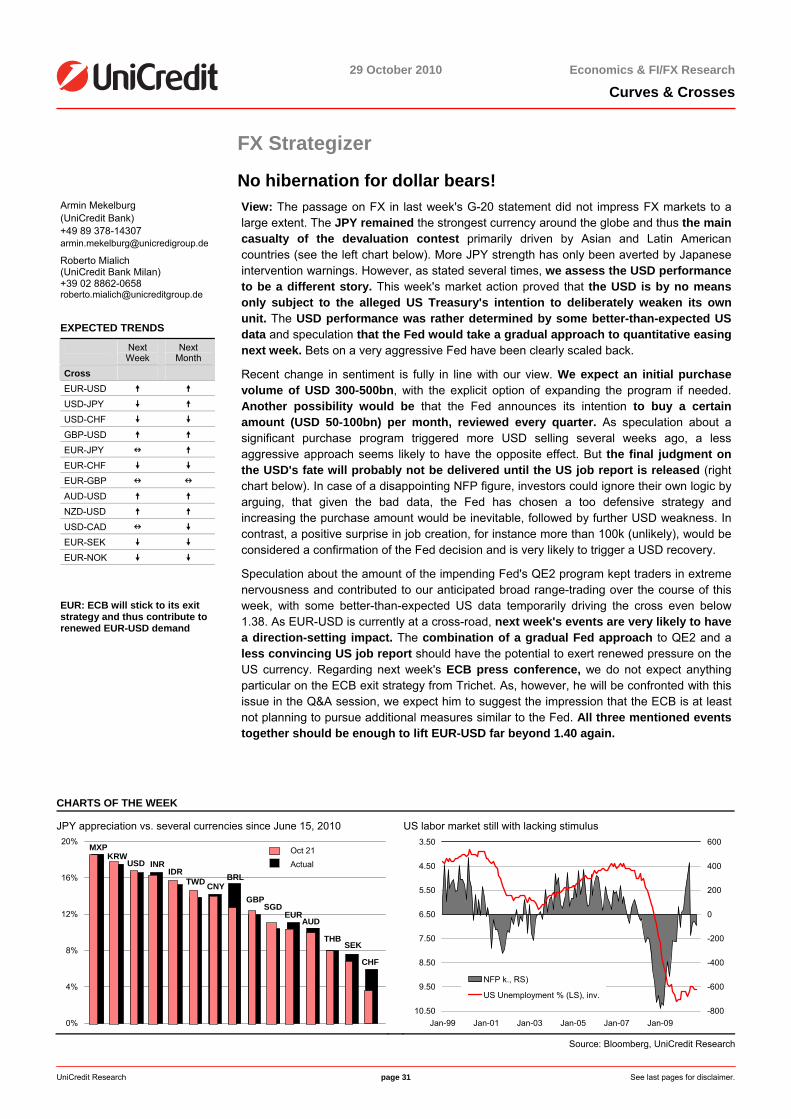
29 October 2010 Economics & FI/FX Research
Curves & Crosses
UniCredit Research page 31 See last pages for disclaimer.
FX Strategizer
No hibernation for dollar bears! Armin Mekelburg (UniCredit Bank) +49 89 378-14307 [email protected]
Roberto Mialich (UniCredit Bank Milan) +39 02 8862-0658 [email protected]
EXPECTED TRENDS
Next Week
Next Month
Cross EUR-USD USD-JPY USD-CHF GBP-USD EUR-JPY EUR-CHF EUR-GBP AUD-USD NZD-USD USD-CAD EUR-SEK EUR-NOK
EUR: ECB will stick to its exit strategy and thus contribute to renewed EUR-USD demand
View: The passage on FX in last week's G-20 statement did not impress FX markets to a large extent. The JPY remained the strongest currency around the globe and thus the main casualty of the devaluation contest primarily driven by Asian and Latin American countries (see the left chart below). More JPY strength has only been averted by Japanese intervention warnings. However, as stated several times, we assess the USD performance to be a different story. This week's market action proved that the USD is by no means only subject to the alleged US Treasury's intention to deliberately weaken its own unit. The USD performance was rather determined by some better-than-expected US data and speculation that the Fed would take a gradual approach to quantitative easing next week. Bets on a very aggressive Fed have been clearly scaled back.
Recent change in sentiment is fully in line with our view. We expect an initial purchase volume of USD 300-500bn, with the explicit option of expanding the program if needed. Another possibility would be that the Fed announces its intention to buy a certain amount (USD 50-100bn) per month, reviewed every quarter. As speculation about a significant purchase program triggered more USD selling several weeks ago, a less aggressive approach seems likely to have the opposite effect. But the final judgment on the USD's fate will probably not be delivered until the US job report is released (right chart below). In case of a disappointing NFP figure, investors could ignore their own logic by arguing, that given the bad data, the Fed has chosen a too defensive strategy and increasing the purchase amount would be inevitable, followed by further USD weakness. In contrast, a positive surprise in job creation, for instance more than 100k (unlikely), would be considered a confirmation of the Fed decision and is very likely to trigger a USD recovery.
Speculation about the amount of the impending Fed's QE2 program kept traders in extreme nervousness and contributed to our anticipated broad range-trading over the course of this week, with some better-than-expected US data temporarily driving the cross even below 1.38. As EUR-USD is currently at a cross-road, next week's events are very likely to have a direction-setting impact. The combination of a gradual Fed approach to QE2 and a less convincing US job report should have the potential to exert renewed pressure on the US currency. Regarding next week's ECB press conference, we do not expect anything particular on the ECB exit strategy from Trichet. As, however, he will be confronted with this issue in the Q&A session, we expect him to suggest the impression that the ECB is at least not planning to pursue additional measures similar to the Fed. All three mentioned events together should be enough to lift EUR-USD far beyond 1.40 again.
CHARTS OF THE WEEK
JPY appreciation vs. several currencies since June 15, 2010 US labor market still with lacking stimulus
MXPKRW
USD INRIDR
TWD CNYBRL
GBPSGD
EURAUD
THBSEK
CHF
0%
4%
8%
12%
16%
20%
ActualOct 21 3.50
4.50
5.50
6.50
7.50
8.50
9.50
10.50Jan-99 Jan-01 Jan-03 Jan-05 Jan-07 Jan-09
-800
-600
-400
-200
0
200
400
600
NFP k., RS)
US Unemployment % (LS), inv.
Source: Bloomberg, UniCredit Research

29 October 2010 Economics & FI/FX Research
Curves & Crosses
UniCredit Research page 32 See last pages for disclaimer.
JPY: G-20 left Japan out in the rain. Intervention seems to be the only option to prevent the JPY from further increasing
With its lukewarm statement on currencies, the G-20 left Japan out in the rain. Even though it sounded sardonic, sarcastic and like a slap in the face, a Chinese official was right in saying that for Japan there would be nothing left but to permanently intervene. Given likely pressure from the dollar side at the end of next week at the latest, and with so far all monetarymeasures not having succeeded, MoF/BoJ will face a hard time to prevent USD-JPY from falling to the all-time low of around 79.75 in April 1995. Caught between two major crosses, we expect EUR-JPY to move between 111.50 and 114.80.
CHF: USD strength temporarily deflated the franc’s strength
The partial retreat of the Swiss franc across the board remained the theme this week too, butwhile the move was originally led by the firmer EUR-USD, the rebound of the greenback across the board has been the main driver this time. In detail, the USD-CHF ability to hold the line above 0.95 eventually paved the way for a return back close to parity that spilled then over to EUR-CHF, pushing it above the 1.36 base. Actually, the continuation of the current CHF downward correction will mostly depend on the USD reaction to the Fed’s QE2 decisions: determining ex-ante the USD reaction is not an easy task, but the US employment report on Friday may help gauge the final impact. As a rule of thumb, any poor USD response should trim recent USD-CHF gains, although an immediate retest of the 0.95 area from the current levels seems excessive. EUR-CHF should retreat as well at least towards 1.35, but a new EUR-USD rally should still pose a floor to any EUR-CHF fall.
GBP: Strong UK GDP reduced BoE QE2 fears
UK GDP for 3Q10, revealing a quite sound economic expansion (+0.8% qoq and +2.8% yoy),offered a strong floor to sterling, together with S&P’s decision to raise the UK rating outlook to stable from negative. The fact that Britain showed a healthy growth pace in the 3Q10 doesnot guarantee that this rate will be maintained in the coming quarters too, taking into accountthe draconian deficit correction which Chancellor Osborne unveiled this month. But strong growth at home at least cooled down speculation that the BoE will be forced to offsetsooner rather than later through further monetary stimuli the impact of tighter fiscal policy. Hence, we don’t expect important news from the BoE meeting next Thursday, while firm UK PMI surveys should in theory offer sterling some support too. In practice, sterling will alsodepend on the USD response to both the Fed’s decisions and the NFP data, but even in case the USD returns on offer, cable is unlikely to break much above this month’s highs at1.6110. On the other hand, creeping EMU woes affecting Ireland, Portugal and Greece may weigh on EUR-GBP, but on balance the 0.86-0.88 band should stay of reference further.
The three dollars (AUD, NZD & CAD): Firm, but not firmer as bets on tighter monetary policies eased
Commodity currencies have had so far a constrained week, considering the partial USD recovery and negative issues at home, but ultimately managed to hold the line. However, the Aussie dollar was clearly penalized by soft CPI data at home for 3Q10, with core inflation easing to 2.3% yoy and thus dashing speculation about another RBA rate hike on Tuesday, but rebounded steadily from lows at around 0.9650. Likewise, the Kiwi dollar recovered from an early dip below 0.74 as the RBNZ, after keeping the OCR steady at 3% and admitting that recovery at home slowed, stated that high export prices and reconstructionin earthquake-hit areas were likely to offset weaker spending. The bank also affirmed thatthere is no need to lower further the path of monetary policy. Looking ahead, a new USD slide should recommend reopening AUD-USD & NZD-USD long positions, but only in the aftermath of the Fed decision or even better after US NFP will be released.
Nordics: SEK & NOK rally frozen by dovish central banks on rates. We thus lowered our Norway’s key rate trajectory
Central banks showing a less aggressive stance on rates were the main drag for both SEKand NOK this week. In Sweden, the key rate was hiked as expected by another 25bp to 1%,but the Riksbank affirmed that rates do not need to be raised as much in the comingyears. This still fits our current forecasts predicting a steady rate for the rest of the year, while monetary tightening should resume in 1Q11 to 1.25% and continue in each quarter up to 2% in4Q11. However, the Norges Bank picture is even more complex: new Governor Olsen confirmed his dovish stance, making it clear that rates should remain at 3% until summer 2011 and that both rates and the NOK should not hurt exporters and the economy.We thus lowered our Norwegian key rate trajectory, which is now expected to stay at the current 2% throughout 1Q11. The rate hike cycle will thus resume in 2Q11 and will end at 2.75% from the previous 3.25%. Hence, for the time being, EUR-SEK and EUR-NOK will be exposed to more consolidation above 9.35 and 8.15, respectively.
Back to front page

29 October 2010 Economics & FI/FX Research
Curves & Crosses
UniCredit Research page 33 See last pages for disclaimer.
FX Monitor: G-10 Weekly Change Charts below show weekly changes among the G-10 currencies. In particular, positive percentage changes indicate a gain of the currency indicated in the title against the others, while negative percentage changes indicate a loss.
USD WEEKLY PERFORMANCE EUR WEEKLY PERFORMANCE
0.50%
-1.08%
0.82%
-1.52%
0.77%
-1.14%
-0.32%
2.49% 2.56%
-5.0%
-4.0%
-3.0%
-2.0%
-1.0%
0.0%
1.0%
2.0%
3.0%
4.0%
5.0%
EUR JPY CHF GBP AUD NZD CAD SEK NOK
Weekly spot gains / losses of the USD vs. the other G-10 units
-0.51%
-1.46%
0.34%
-1.99%
0.25%
-1.62%
-0.66%
2.00% 2.05%
-5.0%
-4.0%
-3.0%
-2.0%
-1.0%
0.0%
1.0%
2.0%
3.0%
4.0%
5.0%
USD JPY CHF GBP AUD NZD CAD SEK NOK
Weekly spot gains / losses of the EUR vs. the other G-10 units
JPY WEEKLY PERFORMANCE CHF WEEKLY PERFORMANCE
0.98%1.50%
-0.56%
0.62%
3.59%
1.92%1.74%
3.48%
-0.18%
-5.0%
-4.0%
-3.0%
-2.0%
-1.0%
0.0%
1.0%
2.0%
3.0%
4.0%
5.0%
USD EUR CHF GBP AUD NZD CAD SEK NOK
Weekly spot gains / losses of the JPY vs. the other G-10 units
-0.80%-0.35%
-1.78%-2.36%
-1.21%
1.65% 1.74%
-0.06%
-1.93%
-5.0%
-4.0%
-3.0%
-2.0%
-1.0%
0.0%
1.0%
2.0%
3.0%
4.0%
5.0%
USD EUR JPY GBP AUD NZD CAD SEK NOK
Weekly spot gains / losses of the CHF vs. the other G-10 units
GBP WEEKLY PERFORMANCE NORDICS WEEKLY PERFORMANCE
1.54%2.05%
2.36%
1.21%
4.08% 4.09%
2.32%
0.56% 0.40%
-5.0%
-4.0%
-3.0%
-2.0%
-1.0%
0.0%
1.0%
2.0%
3.0%
4.0%
5.0%
USD EUR JPY CHF AUD NZD CAD SEK NOK
Weekly spot gains / losses of the GBP vs. the others G.10 units
-2.42%
-1.89%-1.55%
-3.95%-3.51%
-2.71%
0.13%
-2.49%
-1.94%
-3.44%
-1.62%
-4.00%
-1.77%
-3.64%
-2.82%
-0.03%
-3.37%
-1.63%
-5.0%
-4.0%
-3.0%
-2.0%
-1.0%
0.0%
1.0%
2.0%
3.0%
4.0%
5.0%
USD EUR JPY CHF GBP AUD NZD CAD NOK
Weekly spot gains / losses of the SEK vs. the other G-10 units
Weekly spot gains / losses of the NOK vs. the other G-10 units
Update: October 29, 2010, 09.00 CET Source: Bloomberg, UniCredit Research (all charts in this page)

29 October 2010 Economics & FI/FX Research
Curves & Crosses
UniCredit Research page 34 See last pages for disclaimer.
FX Monitor: G-10 Implied Volatility Curves Charts below show the term structure of implied volatility for FX majors at different maturities (today, last week and last month)
EUR-USD USD-JPY
13.9214.1514.0114.05
12.0
13.0
14.0
15.0
16.0
1M 3M 6M 12M
TodayLast weekLast month
EUR-USD
11.69
11.99
12.72
13.55
11.0
12.0
13.0
14.0
15.0
1M 3M 6M 12M
TodayLast weekLast month
USD-JPY
USD-CHF GBP-USD
13.19 13.20
13.0313.02
12.0
13.0
14.0
1M 3M 6M 12M
TodayLast weekLast month
USD-CHF
11.67
12.89
11.21
12.31
10.0
11.0
12.0
13.0
14.0
15.0
1M 3M 6M 12M
TodayLast weekLast month
GBP-USD
EUR-JPY EUR-GBP
13.95
15.98
13.08
14.94
12.0
13.0
14.0
15.0
16.0
17.0
18.0
1M 3M 6M 12M
TodayLast weekLast month
EUR-JPY
11.68
10.30
11.26
10.70
9.0
10.0
11.0
12.0
13.0
1M 3M 6M 12M
TodayLast weekLast month
EUR-GBP
Update: October 29, 2010, 09.00 CET Source: Bloomberg, UniCredit Research (all charts in this page)

29 October 2010 Economics & FI/FX Research
Curves & Crosses
UniCredit Research page 35 See last pages for disclaimer.
FX Monitor: Risk Reversal The risk reversal (RR) consists of a pair of options (a call and a put) on the same exchange rate with an identical expiration date (here 3M) and the same delta (usually 25 delta). They can be seen as proxies of investors’ bets on the exchange rate direction and of the underlying market positioning. A positive RR means that calls are preferred to puts and that investors are betting on an upward move in the underlying exchange rate, while a negative RR hints at puts being preferred to calls and at investors betting on a downward move in the underlying currency pair. When at “extreme values”, Risk Reversals also work as contrarian indicators: a large positive RR implies an “overbought market” while a large negative RR implies an “oversold market”.
EUR-USD USD-JPY
-4.0
-3.5
-3.0
-2.5
-2.0
-1.5
-1.0
-0.5
0.0
0.5
1.0
1.5
Mar-08 Jul-08 Nov-08 Mar-09 Jul-09 Nov-09 Mar-10 Jul-101.15
1.20
1.25
1.30
1.35
1.40
1.45
1.50
1.55
1.60
1.65EUR-USD 3M RR (LS)
EUR-USD (RS)
-2.0
-1.5
-1.0
-0.5
0.0
0.5
1.0
1.5
2.0
Mar-08 Jul-08 Nov-08 Mar-09 Jul-09 Nov-09 Mar-10 Jul-1080
85
90
95
100
105
110
115USD-JPY 3M RR (LS)
USD-JPY (RS)
GBP-USD USD-CHF
-4.0
-3.5
-3.0
-2.5
-2.0
-1.5
-1.0
-0.5
0.0
0.5
Mar-08 Jul-08 Nov-08 Mar-09 Jul-09 Nov-09 Mar-10 Jul-101.30
1.40
1.50
1.60
1.70
1.80
1.90
2.00
2.10GBP-USD 3M RR (LS)GBP-USD (RS)
-2.0
-1.5
-1.0
-0.5
0.0
0.5
1.0
1.5
2.0
Mar-08 Jul-08 Nov-08 Mar-09 Jul-09 Nov-09 Mar-10 Jul-100.95
1.00
1.05
1.10
1.15
1.20
1.25USD-CHF3M RR (LS)USD-CHF (RS)
AUD-USD USD-CAD
-9.0
-7.0
-5.0
-3.0
-1.0
1.0
3.0
Mar-08 Jul-08 Nov-08 Mar-09 Jul-09 Nov-09 Mar-10 Jul-100.60
0.65
0.70
0.75
0.80
0.85
0.90
0.95
1.00
1.05AUD-USD 3M RR (LS)AUD-USD (RS)
-1.0
-0.5
0.0
0.5
1.0
1.5
2.0
2.5
3.0
3.5
4.0
Mar-08 Jul-08 Nov-08 Mar-09 Jul-09 Nov-09 Mar-10 Jul-100.95
1.00
1.05
1.10
1.15
1.20
1.25
1.30
1.35USD-CAD 3M RR (LS)USD-CAD (RS)
Update: October 29, 2010, 09.00 CET Source: Bloomberg, UniCredit Research (all charts in this page) Back to front page

29 October 2010 Economics & FI/FX Research
Curves & Crosses
UniCredit Research page 36 See last pages for disclaimer.
FX Monitor: IMM Non-Commercial Commitments The Commodity Futures Trading Commission (CFTC) reports the long and short positions that are opened on a weekly basis at the Chicago IMM when a trader is not using future contracts in a particular currency for hedging purposes. These positions refer to individual investors, hedge funds and other large financial institutions engaged in trading currencies for speculative purposes. Data below are reported as net long positions and are viewed as a proxy of the speculative attitude of the entire FX market.
IMM NON-COMMERCIAL COMMITMENTS
Currency Last Week Previous Week Net Change Market Positioning vs. Previous Week EUR-USD 46,748 41,511 5,237 more long USD-JPY -45,856 -48,285 2,429 less short USD-CHF -11,235 -19,947 8,712 less short GBP-USD 5,796 8,066 -2,270 less long AUD-USD 59,181 67,691 -8,510 less long NZD-USD 15,331 16,573 -1,242 less long USD-CAD -30,740 -43,786 13,046 less short
Source: Bloomberg, UniCredit Research
EUR-USD: NET LONG USD-JPY: NET LONG
-125,000
-100,000
-75,000
-50,000
-25,000
0
25,000
50,000
75,000
100,000
Jan-08 May-08 Sep-08 Jan-09 May-09 Sep-09 Jan-10 May-10 Sep-101.15
1.25
1.35
1.45
1.55
1.65EUR-USD (RS)Net EUR-USD Long (LS)
-75,000
-50,000
-25,000
0
25,000
50,000
75,000
Jan-08 May-08 Sep-08 Jan-09 May-09 Sep-09 Jan-10 May-10 Sep-1080
85
90
95
100
105
110
115USD-JPY (RS)Net USD-JPY Long (LS)
GBP-USD: NET LONG AUD-USD: NET LONG
-80,000
-60,000
-40,000
-20,000
0
20,000
40,000
Jan-08 May-08 Sep-08 Jan-09 May-09 Sep-09 Jan-10 May-10 Sep-101.30
1.40
1.50
1.60
1.70
1.80
1.90
2.00
2.10
2.20
GBP-USD Net Long (LS)GBP-USD (RS)
-20,000
0
20,000
40,000
60,000
80,000
100,000
Jan-08 May-08 Sep-08 Jan-09 May-09 Sep-09 Jan-10 May-10 Sep-100.50
0.60
0.70
0.80
0.90
1.00
1.10AUD-USD NET LONG (LS)AUD-USD (RS)
Update: October 29, 2010, 09.00 CET Source: Bloomberg, UniCredit Research (all charts in this page)

29 October 2010 Economics & FI/FX Research
Curves & Crosses
UniCredit Research page 37 See last pages for disclaimer.
FX Monitor: Spot Exchange Rates and Two-year Swap Differentials The charts below display the co-movement between spot exchange rates and two-year interest rate swap differentials for selected G10 currencies. In particular, changes in two-year swap differentials tend to anticipate spot exchange rate fluctuations.
In each graph we report as well the 30-day rolling correlation between daily changes in the swap rate differential and daily changes in the exchange rate for each currency pair. Please note that our use of first differences of both, exchange rates and swap rate differentials, adds to the intuition of our correlation analysis, although it clearly results in lower correlations as such.
EUR-USD & 2Y SWAP DIFFERENTIAL USD-JPY & 2Y SWAP DIFFERENTIAL
-0.25
0.25
0.75
1.25
1.75
2.25
2.75
Jan-08 Apr-08 Jul-08 Oct-08 Jan-09 Apr-09 Jul-09 Oct-09 Jan-10 Apr-10 Jul-10 Oct-101.15
1.20
1.25
1.30
1.35
1.40
1.45
1.50
1.55
1.60
1.65EU2Y-US2Y (LS)EUR-USD (RS)
30-day correlation of deltas: 0.0
0.00
0.50
1.00
1.50
2.00
2.50
3.00
Jan-08 Apr-08 Jul-08 Oct-08 Jan-09 Apr-09 Jul-09 Oct-09 Jan-10 Apr-10 Jul-10 Oct-1080
85
90
95
100
105
110
115
US2Y-JP2Y (LS)USD-JPY (RS)
30-day correlation of deltas: 0.5
GBP-USD & 2Y SWAP DIFFERENTIAL USD-CHF & 2Y SWAP DIFFERENTIAL
0.00
0.50
1.00
1.50
2.00
2.50
3.00
Jan-08 Apr-08 Jul-08 Oct-08 Jan-09 Apr-09 Jul-09 Oct-09 Jan-10 Apr-10 Jul-10 Oct-101.30
1.40
1.50
1.60
1.70
1.80
1.90
2.00
2.10
2.20UK2Y-US2Y (LS)GBP-USD (RS)
30-day correlation of deltas: 0.2
-0.75
-0.50
-0.25
0.00
0.25
0.50
0.75
1.00
1.25
Jan-08 Apr-08 Jul-08 Oct-08 Jan-09 Apr-09 Jul-09 Oct-09 Jan-10 Apr-10 Jul-10 Oct-100.90
0.95
1.00
1.05
1.10
1.15
1.20
1.25US2Y-SZ2Y (LS)USD-CHF (RS)
30-day correlation of deltas: 0.1
AUD-USD & 2Y SWAP DIFFERENTIAL USD-CAD & 2Y SWAP DIFFERENTIAL
1.00
1.50
2.00
2.50
3.00
3.50
4.00
4.50
5.00
5.50
6.00
Jan-08 Apr-08 Jul-08 Oct-08 Jan-09 Apr-09 Jul-09 Oct-09 Jan-10 Apr-10 Jul-10 Oct-100.60
0.65
0.70
0.75
0.80
0.85
0.90
0.95
1.00AU2Y-US2Y (LS)AUD-USD (RS)
30-day correlation of deltas: 0.5
-1.25
-1.00
-0.75
-0.50
-0.25
0.00
0.25
0.50
0.75
1.00
Jan-08 Apr-08 Jul-08 Oct-08 Jan-09 Apr-09 Jul-09 Oct-09 Jan-10 Apr-10 Jul-10 Oct-100.80
0.90
1.00
1.10
1.20
1.30
1.40US2Y-CA2Y (LS)USD-CAD (RS)
30-day correlation of deltas: 0.4
Update: October 29, 2010, 09.00 CET Source: Bloomberg, UniCredit Research (all charts in this page)

29 October 2010 Economics & FI/FX Research
Curves & Crosses
UniCredit Research page 38 See last pages for disclaimer.
FX Monitor: Purchasing Power Parities (PPP) Purchasing Power Parities (PPP) calculate the exchange rate at which one country’s price level equals another country’s price levels and are generally used to calculate “fair values” of exchange rates and determine whether spot rates are “overvalued”, “undervalued” or “fairly valued” with respect to their long-run theoretical values. We define sharp under- or overvaluation as a more than 10% deviation of a currency pair from PPP, while fair valuation refers to pairs trading inside a 5% band around PPP. Here, PPP values are calculated using CPI data and are reported along with spot rates and the resulting respective percentage deviations. However, note that spot rates may significantly diverge from PPP in the near term.
SPOT RATES, PPP AND PERCENTAGE DEVIATIONS
vs. USD Current PPP % Deviation Status vs. EUR Current PPP % Deviation Status
EUR-USD 1.39 1.12 23.56% EUR sharply overvalued EUR-USD 1.39 1.12 23.56% EUR sharply overvalued USD-JPY 81 95 -14.92% JPY sharply overvalued EUR-JPY 112 106 9.00% JPY undervalued USD-CHF 0.98 1.27 -22.46% CHF sharply overvalued EUR-CHF 1.37 1.43 -4.19% CHF fairly valued GBP-USD 1.59 1.45 9.90% GBP overvalued EUR-GBP 0.87 0.78 12.44% GBP sharply undervalued AUD-USD 0.98 0.69 41.58% AUD sharply overvalued EUR-AUD 1.42 1.63 -12.73% AUD sharply overvalued NZD-USD 0.76 0.57 31.42% NZD sharply overvalued EUR-NZD 1.84 1.96 -5.98% NZD overvalued USD-CAD 1.02 1.21 -15.50% CAD sharply overvalued EUR-CAD 1.42 1.36 4.42% CAD fairly valued USD-SEK 6.78 6.37 6.50% SEK undervalued EUR-SEK 9.42 7.16 31.59% SEK sharply undervalued USD-NOK 5.94 6.76 -12.13% NOK sharply overvalued EUR-NOK 8.25 7.60 8.58% NOK undervalued
Red and black color represent tendency of under- and overvaluation, respectively Source: Bloomberg, UniCredit Research
EUR-USD: SPOT RATE % DEVIATION FROM PPP USD-JPY: SPOT RATE % DEVIATION FROM PPP
-30%
-20%
-10%
0%
10%
20%
30%
40%
50%
1999 2000 2001 2002 2003 2004 2005 2006 2007 2008 2009 2010
% Deviation from PPP: EUR-USD
-30%
-20%
-10%
0%
10%
20%
30%
1999 2000 2001 2002 2003 2004 2005 2006 2007 2008 2009 2010
% Deviation from PPP: USD-JPY
USD-CHF: SPOT RATE % DEVIATION FROM PPP GBP-USD: SPOT RATE % DEVIATION FROM PPP
-30%
-20%
-10%
0%
10%
20%
30%
1999 2000 2001 2002 2003 2004 2005 2006 2007 2008 2009 2010
% Deviation from PPP: USD-CHF
-20%
-10%
0%
10%
20%
30%
40%
50%
1999 2000 2001 2002 2003 2004 2005 2006 2007 2008 2009 2010
% Deviation from PPP: GBP-USD
Update: October 29, 2010, 09.00 CET Source: Bloomberg, UniCredit Research (all charts in this page)
Back to front page

29 October 2010 Economics & FI/FX Research
Curves & Crosses
UniCredit Research page 39 See last pages for disclaimer.
FX Monitor: The Betas G10 Parade
We define the FX beta as the beta resulting from the following regression:
y(t) = α + β*x(t)+ε
where y(t) is the daily percentage change in an exchange rate and x(t) is the daily percentage change in a synthetic index. The regression is performed over a 10D
horizon and the coefficients in the table represent the value of the Beta over the last 10 days. Beta measures the reaction of the dependent variables (y(t)) to a
marginal movement in the independent variable (x(t)). In this monitor, the dependent variables are all the G10 crosses, while the independent variables are the USD
TWI, the EUR TWI, the US stocks (as proxied by the S&P 500 index) and oil prices. As for the stock-market betas, we can identify high beta exchange rates (with |β|
>1) and low beta exchange rate (with |β|<1), depending on whether they tend to overreact or underreact to changes of the independent variable. More precisely and
in line with the betas in the standard CAPM theory, a beta coefficient>1 indicates that a variable return moves in the same direction of the reference index with a
multiplying effect, while a beta coefficient <-1 means that a variable return moves in the opposite direction of the reference index with still a multiplying effect (we call
them "aggressive" pairs). On the other hand, a beta coefficient below 1 in absolute value indicates a variable return may move in the same or opposite direction of
the reference index, but underperforming the latter (we thus can call them "defensive pairs"). Taxonomy of possible outcome is reported in the table below:
TAXONOMY OF BETA OUTCOMES
β Sign Type Description
β>1 Aggressive Pair (same direction of the X variable) Changes of variable Y tend to outperform changes in variable X (in the same direction)
0<β<1 Defensive Pair (same direction of the X variable) Changes of variable Y tend to under perform changes in variable X (in the same direction)
−1<β<0 Defensive Pair (opposite direction of the X variable) Changes of variable Y tend to under perform changes in variable X (in the opposite direction)
β<−1 Aggressive Pair (opposite direction of the X variable) Changes of variable Y tend to outperform changes in variable X (in the opposite direction)
For each of the independent variables, we calculate the beta coefficients with all the G10 crosses and each of the following tables picks up the five highest and five
lowest FX betas.
BETA COEFFICIENTS WITH USD TWI BETA COEFFICIENTS WITH EUR TWI
1.421.03 0.89 0.86
-0.60
-1.01 -1.05-1.21
-0.69
0.62
-2
-1
0
1
2
USDSEK
USDNOK
USDCHF
USDCAD
GBPAUD
GBPUSD
AUDJPY
NZDUSD
EURUSD
AUDUSD
AGGRESSIVE BETA
AGGRESSIVE BETA
2.03 1.72 1.621.17 1.07
-1.35 -1.45 -1.72-2.16
-3.04-4
-3
-2
-1
0
1
2
3
4
EURUSD
EURGBP
AUDUSD
NZDUSD
EURJPY
USDCAD
GBPCHF
USDCHF
USDNOK
USDSEK
AGGRESSIVE BETA
AGGRESSIVE BETA
BETA COEFFICIENTS WITH US STOCKS BETA COEFFICIENTS WITH OIL PRICES
0.98 0.95
-0.75 -0.82 -0.83-0.99
-1.32
1.330.94
0.59
-2
-1
0
1
2
AUDUSD
EURUSD
AUDJPY
NZDUSD
EURJPY
USDCHF
GBPAUD
USDCAD
USDNOK
USDSEK
AGGRESSIVE BETA
AGGRESSIVE BETA
0.34 0.33 0.22
-0.24 -0.27 -0.29 -0.36 -0.46
0.350.46
-2
-1
0
1
2
AUDUSD
NZDUSD
EURUSD
AUDJPY
NZDJPY
USDCHF
GBPAUD
USDCAD
USDNOK
USDSEK
AGGRESSIVE BETA
AGGRESSIVE BETA
Source: Bloomberg, UniCredit Research for all charts and tables in this page
Back to front page

29 October 2010 Economics & FI/FX Research
Curves & Crosses
UniCredit Research page 40 See last pages for disclaimer.
FX Monitor: a world of correlations THE BEST 20 DAYS & 80 DAYS CORRELATIONS2
3 MOST POSITIVE 3 MOST NEGATIVE 20dd 80dd 20dd 80dd 20dd 80dd 20dd 80dd 20dd 80dd 20dd 80dd
1st Future USDCAD CADJPY SEKNZD NZDCHF NOKNZD GBPNZD (spread change) 65.9% 54.1% 65.9% 49.1% 58.6% 27.9% -52.9% 42.1% -19.3% 30.4% -18.5% 32.8%
10Y yields GBPAUD GBPCAD GBPSEK NZDJPY USDCHF JPYCHF (spread change) 62.4% 12.4% 59.8% 34.6% 58.5% 40.9% -12.6% 16.9% -7.8% 29.4% -6.3% 21.9%
Oil price NZDJPY NZDUSD AUDJPY USDCAD USDNOK USDCHF (return) 81.6% 48.6% 80.6% 61.4% 75.7% 48.0% -79.0% -60.9% -70.7% -54.4% -57.2% -17.0%
Gold price NZDUSD NZDJPY AUDUSD USDCAD USDNOK USDCHF (return) 84.8% 42.0% 80.5% 21.5% 76.5% 44.2% -86.8% -44.6% -74.6% -47.2% -66.1% -52.9%
Copper price NZDUSD AUDUSD EURUSD USDCAD USDCHF USDNOK (return) 71.5% 54.8% 65.4% 56.1% 57.7% 38.8% -74.2% -60.7% -64.9% -29.7% -57.3% -53.8%
S&P 500 NZDUSD NZDJPY EURUSD USDCAD GBPNZD USDNOK (return) 68.0% 76.6% 67.2% 75.7% 62.9% 56.2% -69.1% -80.5% -57.0% -54.1% -55.0% -68.5%
Vix Index GBPCAD USDCAD GBPAUD EURJPY CADJPY AUDJPY 45.4% 46.2% 42.5% 65.8% 40.0% 55.3% -44.6% -57.4% -43.2% -58.0% -42.6% -63.7%
G10 FX RETURNS VS. CHANGE IN MM FUTURES SPREAD 3 G10 FX RETURNS VS. CHANGE IN 10Y YIELDS SPREAD
JPY GBP CHF AUD CAD NZD NOK SEK USD JPY GBP CHF AUD CAD NZD NOK SEK USDEUR 27% 8% 31% 53%* 40% 24% -17% 49%* 11% EUR 19% 43% 22% 13% -2% 19% 28% 39% -4%
JPY -33% 6% 3% -66%* -16% 17% -45% 2% JPY -49% -6% -15% -41% 13% -15% -13% -31%
GBP -14% 19% 33% -19% -18% 46% 15% GBP 56%* 62%* 60%* 36% 42% 59%* 5%CHF -26% -26% 53%* 4% -50%* 9% CHF -1% -12% -13% -38% -45% 8%AUD -41% -43% -32% -44% 9% AUD -27% -9% -24% -28% 26%
CAD -2% 9% -39% -66%* CAD 39% -21% -22% -33%NZD 19% -59%* -1% NZD -53%* -26% 17%NOK 52%* 5% NOK 44% -5%SEK -40% SEK -14%
LOOKING BACK – 20 DAYS ROLLING CORRELATIONS OVER THE LAST MONTHS
NZD-USD & GOLD PRICES USD-CAD & GOLD PRICES
-80%
-60%
-40%
-20%
0%
20%
40%
60%
80%
100%
Jan-10 Feb-10 Apr-10 May-10 Jul-10 Sep-10 Oct-10
20dd correlation Last 6M average
average +/- 1.5*st.dev.
20dd
cor
rela
tion
betw
een
NZD
US
D
and
gold
-100%
-80%
-60%
-40%
-20%
0%
20%
40%
60%
Jan-10 Feb-10 Apr-10 May-10 Jul-10 Sep-10 Oct-10
20dd rolling correlation Last 6M average
average +/- 1.5*st.dev. 20dd
cor
rela
tion
betw
een
US
DC
AD
an
d go
ld
Source: Bloomberg, UniCredit Research
1 We compute the rolling correlation over the last 20 trading days between the daily return of each G10 cross and each of the variables specified on the left. For the FI variables, we considered the daily change of the spread of the variables in the two countries to which the cross refers to. More specifically, we considered the spread of the 1st generic money market future and the spread of the 10Y yields. For commodities, we considered the daily return. Finally, we used the daily return on the Standard & Poor 500 as a proxy for the equity market performance and the Vix index as an indicator of volatility. The table displays the 3 crosses showing the highest positive (on the left hand side) and the 3 highest negative (on the right hand side) correlations with the variables on the left. On the right hand side of each 20dd correlation, we report the rolling correlation over the last 80 trading days. 3 The tables report the 20dd rolling correlation between the daily return of each of the G10 crosses and the corresponding daily change in the spread between 1st generic money market future contracts (left table) and 10Y yields (right table) in the two countries the cross refers to. In each cell the correlation refers to the cross obtained by taking the currencies on the same row and the one on the same column. For example cell(2,2) refers to EUR-JPY. We highlight in grey the correlation if its absolute value is greater than the mean+1.5*standard deviation over the all sample.

29 October 2010 Economics & FI/FX Research
Curves & Crosses
UniCredit Research page 41 See last pages for disclaimer.
FX Monitor: The Over & Undervaluation G-10 Parade G10 FX OVER/UNDERVALUATION TABLE
Key G10 exchange rates The other most over/undervalued crosses EURUSD GBPUSD USDJPY USDCHF EURCHF JPYCHF AUDCHF EURSEK GBPCHF EURNOK
Constant 1.1974 1.4426 93.3020 1.1659 1.4046 1.2513 0.9646 9.7335 1.6874 7.8822 Slope 0.0066 0.0061 -0.4527 -0.0078 -0.0032 -0.0026 -0.0010 -0.0201 -0.0054 0.0064
Fair Value 1.3745 1.6071 81.0788 0.9553 1.32 1.18 0.94 9.19 1.54 8.05 Actual Value 1.3864 1.5905 80.6400 0.9886 1.37 1.23 0.96 9.39 1.57 8.21
Over/Undervaluation 0.9% -1.0% -0.5% 3.5% 4.1% 3.9% 2.8% 2.2% 2.0% 2.0%
The table shows the results of coefficient estimates for the regression: X(t) = a+b*t+e, in which t is a linear trend and X represents an exchange rate in the G-10 universe. The regression is performed on a 6M horizon and on a sample of weekly data. The over/undervaluation coefficient is the percentage difference between the traded value of the exchange rate considered and its “fair value” as implied by its linear trend. A positive (negative) number in the over/undervaluation coefficient means that the indicated exchanged rate is overvalued (undervalued) with respect to its last 6M trend. The table reports on the left side results for EUR-USD, GBP-USD, USD-JPY and USD-CHF and on the right hand side the other six most over/undervalued exchange rates in the G10 world.
EUR-USD: OVER/UNDERVALUATION OVER TIME USD-CHF: OVER/UNDERVALUATION OVER TIME
-8.0
-4.0
0.0
4.0
8.0
12.0
Jan-08 Jul-08 Feb-09 Aug-09 Mar-10 Sep-10
%
Exchange rate is overvalued
Exchange rate is undervalued
Last 6M average
Last 12M average
-12
-10
-8
-6
-4
-2
0
2
4
6
8
Jan-08 May-08 Oct-08 Mar-09 Aug-09 Jan-10 Jun-10
%
Exchange rate is overvalued
Exchange rate is undervalued
Las t 6M average
Last 12M average
The left chart above shows the dynamics of the weekly over/undervaluation coefficient of EUR-USD since January 2008. At any point in time, a coefficient greater than 0 signals that EUR-USD is overvalued on that specific week with respect to its last 6M trend, while a coefficient below zero indicates that EUR-USD is undervalued with respect to its linear trend. The charts also display the average of the over/under valuation coefficient over the last 6 and 12 months. The second chart shows the dynamics of the weekly over/undervaluation coefficient of another G10 cross selected among the most over/undervalued G10 crosses reported in the two charts below.
THE TOP TEN MOST OVERVALUED G-10 CROSSES THE TOP TEN MOST UNDERVALUED G-10 CROSSES
4.1% 3.9% 3.5%2.8%
2.2% 2.0% 2.0% 1.9% 1.5% 1.2%
-7%
-5%
-3%
-1%
1%
3%
5%
7%
EURCHF
JPYCHF
USDCHF
AUDCHF
EURSEK
GBPCHF
EURNOK
EURGBP
USDSEK
USDNOK
0.0%
0.0% -0.2% -0.5% -0.8% -1.0% -1.0% -1.0%-1.7% -1.8%
-7%
-5%
-3%
-1%
1%
3%
5%
7%
USDCAD
NZDJPY
AUDUSD
USDJPY
GBPAUD
GBPCAD
AUDJPY
GBPUSD
GBPNZD
GBPJPY
The two charts above show the top ten most overvalued/undervalued currencies within the G-10 universe over the last week with respect to their last 6M trend.
Source: Bloomberg, UniCredit Research for all charts in this page
Back to front page
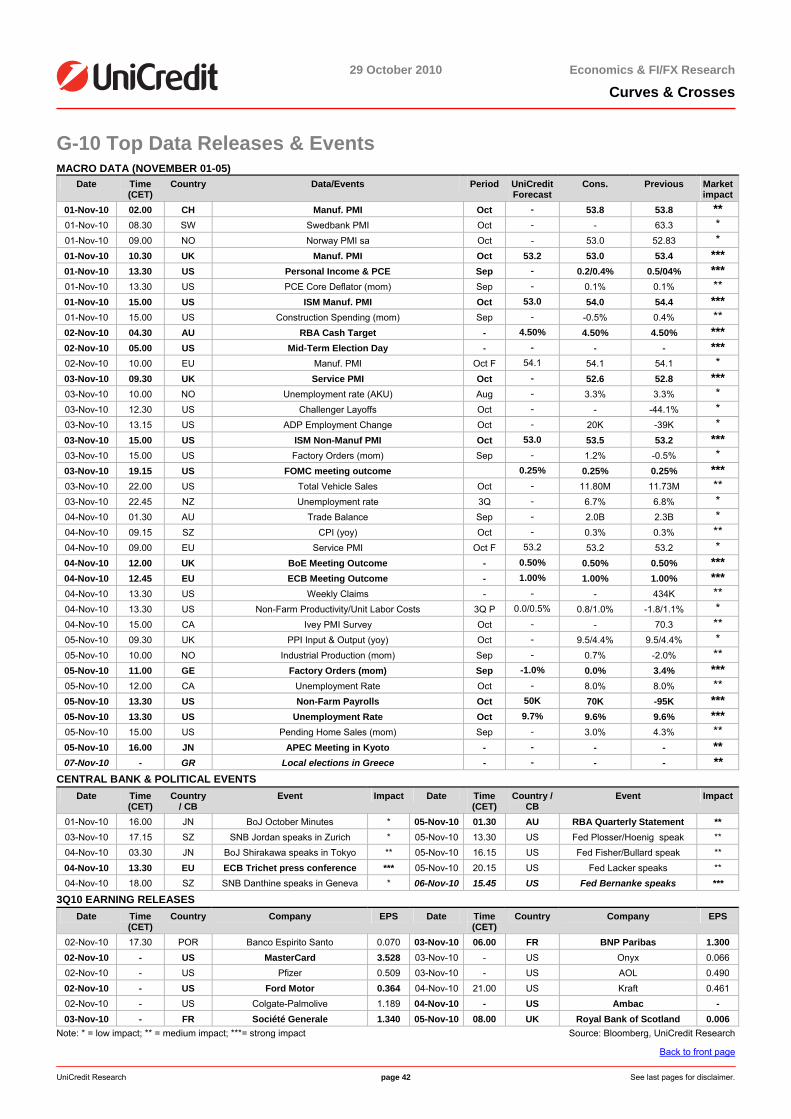
29 October 2010 Economics & FI/FX Research
Curves & Crosses
UniCredit Research page 42 See last pages for disclaimer.
G-10 Top Data Releases & Events MACRO DATA (NOVEMBER 01-05)
Date Time (CET)
Country Data/Events Period UniCredit Forecast
Cons. Previous Market impact
01-Nov-10 02.00 CH Manuf. PMI Oct - 53.8 53.8 ** 01-Nov-10 08.30 SW Swedbank PMI Oct - - 63.3 * 01-Nov-10 09.00 NO Norway PMI sa Oct - 53.0 52.83 * 01-Nov-10 10.30 UK Manuf. PMI Oct 53.2 53.0 53.4 *** 01-Nov-10 13.30 US Personal Income & PCE Sep - 0.2/0.4% 0.5/04% *** 01-Nov-10 13.30 US PCE Core Deflator (mom) Sep - 0.1% 0.1% ** 01-Nov-10 15.00 US ISM Manuf. PMI Oct 53.0 54.0 54.4 *** 01-Nov-10 15.00 US Construction Spending (mom) Sep - -0.5% 0.4% ** 02-Nov-10 04.30 AU RBA Cash Target - 4.50% 4.50% 4.50% *** 02-Nov-10 05.00 US Mid-Term Election Day - - - - *** 02-Nov-10 10.00 EU Manuf. PMI Oct F 54.1 54.1 54.1 * 03-Nov-10 09.30 UK Service PMI Oct - 52.6 52.8 *** 03-Nov-10 10.00 NO Unemployment rate (AKU) Aug - 3.3% 3.3% * 03-Nov-10 12.30 US Challenger Layoffs Oct - - -44.1% * 03-Nov-10 13.15 US ADP Employment Change Oct - 20K -39K * 03-Nov-10 15.00 US ISM Non-Manuf PMI Oct 53.0 53.5 53.2 *** 03-Nov-10 15.00 US Factory Orders (mom) Sep - 1.2% -0.5% * 03-Nov-10 19.15 US FOMC meeting outcome 0.25% 0.25% 0.25% *** 03-Nov-10 22.00 US Total Vehicle Sales Oct - 11.80M 11.73M ** 03-Nov-10 22.45 NZ Unemployment rate 3Q - 6.7% 6.8% * 04-Nov-10 01.30 AU Trade Balance Sep - 2.0B 2.3B * 04-Nov-10 09.15 SZ CPI (yoy) Oct - 0.3% 0.3% ** 04-Nov-10 09.00 EU Service PMI Oct F 53.2 53.2 53.2 * 04-Nov-10 12.00 UK BoE Meeting Outcome - 0.50% 0.50% 0.50% *** 04-Nov-10 12.45 EU ECB Meeting Outcome - 1.00% 1.00% 1.00% *** 04-Nov-10 13.30 US Weekly Claims - - - 434K ** 04-Nov-10 13.30 US Non-Farm Productivity/Unit Labor Costs 3Q P 0.0/0.5% 0.8/1.0% -1.8/1.1% * 04-Nov-10 15.00 CA Ivey PMI Survey Oct - - 70.3 ** 05-Nov-10 09.30 UK PPI Input & Output (yoy) Oct - 9.5/4.4% 9.5/4.4% * 05-Nov-10 10.00 NO Industrial Production (mom) Sep - 0.7% -2.0% ** 05-Nov-10 11.00 GE Factory Orders (mom) Sep -1.0% 0.0% 3.4% *** 05-Nov-10 12.00 CA Unemployment Rate Oct - 8.0% 8.0% ** 05-Nov-10 13.30 US Non-Farm Payrolls Oct 50K 70K -95K *** 05-Nov-10 13.30 US Unemployment Rate Oct 9.7% 9.6% 9.6% *** 05-Nov-10 15.00 US Pending Home Sales (mom) Sep - 3.0% 4.3% ** 05-Nov-10 16.00 JN APEC Meeting in Kyoto - - - - ** 07-Nov-10 - GR Local elections in Greece - - - - **
CENTRAL BANK & POLITICAL EVENTS Date Time
(CET) Country
/ CB Event Impact Date Time
(CET) Country /
CB Event Impact
01-Nov-10 16.00 JN BoJ October Minutes * 05-Nov-10 01.30 AU RBA Quarterly Statement ** 03-Nov-10 17.15 SZ SNB Jordan speaks in Zurich * 05-Nov-10 13.30 US Fed Plosser/Hoenig speak ** 04-Nov-10 03.30 JN BoJ Shirakawa speaks in Tokyo ** 05-Nov-10 16.15 US Fed Fisher/Bullard speak ** 04-Nov-10 13.30 EU ECB Trichet press conference *** 05-Nov-10 20.15 US Fed Lacker speaks ** 04-Nov-10 18.00 SZ SNB Danthine speaks in Geneva * 06-Nov-10 15.45 US Fed Bernanke speaks ***
3Q10 EARNING RELEASES Date Time
(CET) Country Company EPS Date Time
(CET) Country Company EPS
02-Nov-10 17.30 POR Banco Espirito Santo 0.070 03-Nov-10 06.00 FR BNP Paribas 1.300 02-Nov-10 - US MasterCard 3.528 03-Nov-10 - US Onyx 0.066 02-Nov-10 - US Pfizer 0.509 03-Nov-10 - US AOL 0.490 02-Nov-10 - US Ford Motor 0.364 04-Nov-10 21.00 US Kraft 0.461 02-Nov-10 - US Colgate-Palmolive 1.189 04-Nov-10 - US Ambac - 03-Nov-10 - FR Société Generale 1.340 05-Nov-10 08.00 UK Royal Bank of Scotland 0.006
Note: * = low impact; ** = medium impact; ***= strong impact Source: Bloomberg, UniCredit Research
Back to front page

29 October 2010 Economics & FI/FX Research
Curves & Crosses
UniCredit Research page 43
UniCredit Global Forecasts EU US
Current Dec-10 Mar-11 Jun-11 Sep-11 Current Dec-10 Mar-11 Jun-11 Sep-11Key rate 1.00 1.00 1.00 1.00 1.00 Key rate 0.25 0.25 0.25 0.25 0.253M 1.05 1.00 1.05 1.10 1.20 3M 0.29 0.35 0.35 0.35 0.352Y 0.99 0.80 0.80 1.10 1.40 2Y 0.37 0.45 0.50 0.80 0.905Y 1.74 1.30 1.35 1.70 2.03 5Y 1.22 1.33 1.35 1.70 1.8810Y 2.55 2.25 2.25 2.50 2.75 10Y 2.64 2.50 2.40 2.70 2.8530Y 3.01 2.75 2.80 3.05 3.10 30Y 4.02 3.50 3.35 3.50 3.602/10 156 145 145 140 135 2/10 76 205 190 190 1952/5/10 -4 -23 -18 -10 -5 2/5/10 -29 -15 -10 -5 010/30 46 50 55 55 35 10/30 138 100 95 80 752Y SwSp 61 60 60 55 50 2Y SwSp 16 35 40 40 4010Y SwSp 29 30 30 25 20 10Y SwSp 10 5 5 10 10 UK SZ Current Dec-10 Mar-11 Jun-11 Sep-11 Current Dec-10 Mar-11 Jun-11 Sep-11Key rate 0.50 0.50 0.50 0.50 0.50 Key rate 0.25 0.25 0.50 0.75 1.003M 0.74 0.75 0.75 0.75 0.90 3M 0.17 0.25 0.50 0.75 1.002Y 0.69 0.70 0.70 1.00 1.25 2Y 0.53 0.75 1.10 1.35 1.605Y 1.66 1.60 1.55 1.85 2.13 5Y 0.93 0.81 1.13 1.48 1.8310Y 3.11 2.80 2.70 2.90 3.10 10Y 1.52 1.50 1.75 2.00 2.2530Y 4.19 3.70 3.50 3.55 3.65 30Y 1.65 1.80 2.05 2.30 2.552/10 241 210 200 190 185 2/10 99 75 65 80 802/5/10 -24 -15 -15 -10 -5 2/5/10 -10 -16 -15 -10 -510/30 108 90 80 65 55 10/30 13 30 30 30 30
10Y SwSp 10 10 10 20 20 10Y SwSp 35 40 40 40 40 JN CA Current Dec-10 Mar-11 Jun-11 Sep-11 Current Dec-10 Mar-11 Jun-11 Sep-11Key rate 0.10 0.10 0.10 0.10 0.10 Key rate 1.00 1.00 1.00 1.25 1.503M 0.20 0.20 0.20 0.20 0.25 3M 1.22 1.10 1.30 1.50 1.75
NO SW Current Dec-10 Mar-11 Jun-11 Sep-11 Current Dec-10 Mar-11 Jun-11 Sep-11Key rate 2.00 2.00 2.00 2.25 2.50 Key rate 1.00 1.00 1.25 1.50 1.753M 2.49 2.75 3.00 3.25 3.50 3M 1.54 1.30 1.40 1.65 2.15
AU NZ Current Dec-10 Mar-11 Jun-11 Sep-11 Current Dec-10 Mar-11 Jun-11 Sep-11Key rate 4.50 4.75 5.00 5.25 5.50 Key rate 3.00 3.25 3.25 3.50 3.753M 4.75 5.05 5.25 5.25 5.25 3M 3.20 3.40 3.40 4.00 4.25
FX Forecasts
vs. EUR 29-Oct-10 Dec-10 Mar-11 Jun-11 Sep-11 vs. USD 29-Oct-10 Dec-10 Mar-11 Jun-11 Sep-11EUR-USD 1.38 1.43 1.39 1.42 1.44 EUR-USD 1.38 1.43 1.39 1.42 1.44EUR-JPY 112 119 118 125 130 USD-JPY 81 83 85 88 90EUR-GBP 0.87 0.89 0.88 0.87 0.86 GBP-USD 1.59 1.61 1.58 1.63 1.67EUR-SEK 9.37 9.25 9.20 9.15 9.10 USD-SEK 6.78 6.47 6.62 6.44 6.32EUR-NOK 8.22 8.05 7.95 7.90 7.85 USD-NOK 5.95 5.63 5.72 5.56 5.45EUR-CHF 1.36 1.33 1.30 1.33 1.36 USD-CHF 0.99 0.93 0.94 0.94 0.94EUR-AUD 1.43 1.43 1.43 1.49 1.50 AUD-USD 0.97 1.00 0.97 0.95 0.96EUR-NZD 1.83 1.86 1.85 1.95 1.89 NZD-USD 0.75 0.77 0.75 0.73 0.76EUR-CAD 1.41 1.43 1.36 1.45 1.51 USD-CAD 1.02 1.00 0.98 1.02 1.05
Source: Bloomberg, UniCredit Research

29 October 2010 Economics & FI/FX Research
Curves & Crosses
UniCredit Research page 44
GROSS DOMESTIC PRODUCT
% y-o-y Actual UniCredit forecasts 2006 2007 2008 2009 2010 2011UNITED STATES 2.7 2.1 0.4 -2.6 2.6 1.9JAPAN 2.0 2.3 -1.2 -5.2 2.7 1.8EUROZONE 3.1 2.8 0.5 -4.0 1.6 1.3GERMANY 3.4 2.6 1.0 -4.7 3.2 2.5ITALY 2.1 1.4 -1.3 -5.1 1.0 1.1FRANCE 2.4 2.3 0.1 -2.5 1.5 1.4SPAIN 4.0 3.6 0.9 -3.6 -0.3 0.4AUSTRIA 3.5 3.5 2.0 -3.6 1.3 1.4SWEDEN 4.5 2.7 -0.5 -4.7 4.2 3.2NORWAY (mainland) 4.5 5.4 2.0 -1.4 1.5 2.6UNITED KINGDOM 2.9 2.6 0.5 -5.0 1.6 1.8SWITZERLAND 3.6 3.6 1.8 -1.5 2.8 1.5
CONSUMER PRICE INDEX Actual UniCredit forecasts 2006 2007 2008 2009 2010 2011UNITED STATES 3.2 2.9 3.8 -0.3 1.6 1.8JAPAN 0.3 0.0 1.4 -1.4 -1.0 -0.3EUROZONE 2.2 2.1 3.3 0.3 1.5 1.7GERMANY 1.6 2.3 2.6 0.3 1.1 1.4ITALY 2.1 1.8 3.3 0.8 1.5 1.9FRANCE 1.7 1.5 2.8 0.1 1.5 1.6SPAIN 3.5 2.8 4.1 -0.3 1.8 2.2AUSTRIA 1.5 2.2 3.2 0.5 1.7 1.7SWEDEN 1.4 2.2 3.5 -0.3 1.2 1.5NORWAY 2.3 0.7 3.8 2.2 2.3 2.2UNITED KINGDOM 2.3 2.3 3.6 2.2 3.1 2.5SWITZERLAND 1.1 0.7 2.4 -0.5 0.7 0.7
UNICREDIT QUARTERLY FORECASTS
Eurozone 2009 2010 2011 Q1-09 Q2-09 Q3-09 Q4-09 Q1-10 Q2-10 Q3-10 Q4-10 Q1-11 Q2-11 Q3-11 Q4-11
GDP (% qoq)
-2.5 -0.1 0.4 0.2 0.3 1.0 0.4 0.3 0.2 0.3 0.4 0.4
HICP Inflation (% yoy)
1.0 0.2 -0.4 0.4 1.1 1.5 1.7 1.8 1.7 1.6 1.7 1.9
Core HICP Inflation (% yoy)
1.6 1.6 1.3 1.1 0.9 0.8 1.0 0.9 0.8 0.7 0.5 0.6
US 2009 2010 2011 Q1-09 Q2-09 Q3-09 Q4-09 Q1-10 Q2-10 Q3-10 Q4-10 Q1-11 Q2-11 Q3-11 Q4-
GDP (% qoq, annualized)
-4.9 -0.7 1.6 5.0 3.7 1.7 2.0 1.8 1.8 2.0 2.2 2.2
HICP Inflation (% yoy)
-0.2 -1.0 -1.6 1.5 2.4 1.8 1.2 1.0 1.1 1.8 2.0 2.1
Core HICP Inflation (% yoy)
1.7 1.8 1.5 1.7 1.3 1.0 1.0 0.8 1.1 1.2 1.2 1.5
Source: Bloomberg, UniCredit Research
Back to front page

29 October 2010 Economics & FI/FX Research
Curves & Crosses
UniCredit Research page 45
Disclaimer Our recommendations are based on information obtained from, or are based upon public information sources that we consider to be reliable but for the completeness and accuracy of which we assume no liability. All estimates and opinions included in the report represent the independent judgment of the analysts as of the date of the issue. We reserve the right to modify the views expressed herein at any time without notice. Moreover, we reserve the right not to update this information or to discontinue it altogether without notice. This analysis is for information purposes only and (i) does not constitute or form part of any offer for sale or subscription of or solicitation of any offer to buy or subscribe for any financial, money market or investment instrument or any security, (ii) is neither intended as such an offer for sale or subscription of or solicitation of an offer to buy or subscribe for any financial, money market or investment instrument or any security nor (iii) as an advertisement thereof. The investment possibilities discussed in this report may not be suitable for certain investors depending on their specific investment objectives and time horizon or in the context of their overall financial situation. The investments discussed may fluctuate in price or value. Investors may get back less than they invested. Changes in rates of exchange may have an adverse effect on the value of investments. Furthermore, past performance is not necessarily indicative of future results. In particular, the risks associated with an investment in the financial, money market or investment instrument or security under discussion are not explained in their entirety. This information is given without any warranty on an "as is" basis and should not be regarded as a substitute for obtaining individual advice. Investors must make their own determination of the appropriateness of an investment in any instruments referred to herein based on the merits and risks involved, their own investment strategy and their legal, fiscal and financial position. As this document does not qualify as an investment recommendation or as a direct investment recommendation, neither this document nor any part of it shall form the basis of, or be relied on in connection with or act as an inducement to enter into, any contract or commitment whatsoever. Investors are urged to contact their bank's investment advisor for individual explanations and advice. Neither UniCredit Bank AG, UniCredit Bank AG London Branch, UniCredit Bank AG Vienna Branch, UniCredit Bank AG Milan Branch, UniCredit Securities, UniCredit Menkul Değerler A.Ş., UniCredit Bulbank, Zagrebačka banka, UniCredit Bank, Bank Pekao, Yapi Kredi, UniCredit Tiriac Bank, ATFBank nor any of their respective directors, officers or employees nor any other person accepts any liability whatsoever (in negligence or otherwise) for any loss howsoever arising from any use of this document or its contents or otherwise arising in connection therewith. This analysis is being distributed by electronic and ordinary mail to professional investors, who are expected to make their own investment decisions without undue reliance on this publication, and may not be redistributed, reproduced or published in whole or in part for any purpose. Responsibility for the content of this publication lies with: a) UniCredit Bank AG, Am Tucherpark 16, 80538 Munich, Germany, (also responsible for the distribution pursuant to §34b WpHG). The company belongs to UCI Group. Regulatory authority: “BaFin“ – Bundesanstalt für Finanzdienstleistungsaufsicht, Lurgiallee 12, 60439 Frankfurt, Germany. b) UniCredit Bank AG London Branch, Moor House, 120 London Wall, London EC2Y 5ET, United Kingdom. Regulatory authority: “BaFin“ – Bundesanstalt für Finanzdienstleistungsaufsicht, Lurgiallee 12, 60439 Frankfurt, Germany and subject to limited regulation by the Financial Services Authority (FSA), 25 The North Colonnade, Canary Wharf, London E14 5HS, United Kingdom. Details about the extent of our regulation by the Financial Services Authority are available from us on request. c) UniCredit Bank AG Milan Branch, Via Tommaso Grossi 10, 20121 Milan, Italy, duly authorized by the Bank of Italy to provide investment services. Regulatory authority: “Bank of Italy”, Via Nazionale 91, 00184 Roma, Italy and Bundesanstalt für Finanzdienstleistungsaufsicht, Lurgiallee 12, 60439 Frankfurt, Germany. d) UniCredit Bank AG Vienna Branch, Julius-Tandler-Platz 3, 1090 Vienna, Austria Regulatory authority: Finanzmarktaufsichtsbehörde (FMA), Praterstrasse 23, 1020 Vienna, Austria and subject to limited regulation by the “BaFin“ – Bundesanstalt für Finanz-dienstleistungsaufsicht, Lurgiallee 12, 60439 Frankfurt, Germany. Details about the extent of our regulation by the Bundesanstalt für Finanzdienstleistungsaufsicht are available from us on request. e) UniCredit Securities, Boulevard Ring Office Building, 17/1 Chistoprudni Boulevard, Moscow 101000, Russia Regulatory authority: Federal Service on Financial Markets, 9 Leninsky prospekt, Moscow 119991, Russia f) UniCredit Menkul Değerler A.Ş., Büyükdere Cad. No. 195, Büyükdere Plaza Kat. 5, 34394 Levent, Istanbul, Turkey Regulatory authority: Sermaye Piyasası Kurulu – Capital Markets Board of Turkey, Eskişehir Yolu 8.Km No:156, 06530 Ankara, Turkey g) UniCredit Bulbank, Sveta Nedelya Sq. 7, BG-1000 Sofia, Bulgaria Regulatory authority: Financial Supervision Commission (FSC), 33 Shar Planina str.,1303 Sofia, Bulgaria h) Zagrebačka banka, Paromlinska 2, HR-10000 Zagreb, Croatia Regulatory authority: Croatian Agency for Supervision of Financial Services, Miramarska 24B, 10000 Zagreb, Croatia i) UniCredit Bank, Na Príkope 858/20, CZ-11121 Prague, Czech Republic Regulatory authority: CNB Czech National Bank, Na Příkopě 28, 115 03 Praha 1, Czech Republic j) Bank Pekao, ul. Grzybowska 53/57, PL-00-950 Warsaw, Poland Regulatory authority: Polish Financial Supervision Authority, Plac Powstańców Warszawy 1, 00-950 Warsaw, Poland k) UniCredit Bank, Prechistenskaya emb. 9, RF-19034 Moscow, Russia Regulatory authority: Federal Service on Financial Markets, 9 Leninsky prospekt, Moscow 119991, Russia l) UniCredit Bank, Šancova 1/A, SK-813 33 Bratislava, Slovakia Regulatory authority: National Bank of Slovakia, Stefanikovo nam. 10/19, 967 01 Kremnica, Slovakia m) Yapi Kredi, Yapi Kredi Plaza D Blok, Levent, TR-80620 Istanbul, Turkey Regulatory authority: Sermaye Piyasası Kurulu – Capital Markets Board of Turkey, Eskişehir Yolu 8.Km No:156, 06530 Ankara, Turkey n) UniCredit Tiriac Bank, Ghetarilor Street 23-25, RO-014106 Bucharest 1,Romania Regulatory authority: CNVM, Romanian National Securities Commission, Foişorului street, no.2, sector 3, Bucharest, Romania o) ATFBank, 100 Furmanov Str., KZ-050000 Almaty, Kazakhstan Agency of the Republic of Kazakhstan on the state regulation and supervision of financial market and financial organisations, 050000, Almaty, 67 Aiteke Bi str., Kazakhstan POTENTIAL CONFLICTS OF INTEREST UniCredit Bank AG acts as a Specialist or Primary Dealer in government bonds issued by the Italian, Portuguese and Greek Treasury. Main tasks of the Specialist are to participate with continuity and efficiency to the governments' securities auctions, to contribute to the efficiency of the secondary market through market making activity and quoting requirements and to contribute to the management of public debt and to the debt issuance policy choices, also through advisory and research activities. ANALYST DECLARATION The author’s remuneration has not been, and will not be, geared to the recommendations or views expressed in this study, neither directly nor indirectly. ORGANIZATIONAL AND ADMINISTRATIVE ARRANGEMENTS TO AVOID AND PREVENT CONFLICTS OF INTEREST To prevent or remedy conflicts of interest, UniCredit Bank AG, UniCredit Bank AG London Branch, UniCredit Bank AG Vienna Branch, UniCredit Bank AG Milan Branch, UniCredit Securities, UniCredit Menkul Değerler A.Ş., UniCredit Bulbank, Zagrebačka banka, UniCredit Bank, Bank Pekao, Yapi Kredi, UniCredit Tiriac Bank, ATFBank have established the organizational arrangements required from a legal and supervisory aspect, adherence to which is monitored by its compliance department. Conflicts of interest arising are managed by legal and physical and non-physical barriers (collectively referred to as “Chinese Walls”) designed to restrict the flow of information between one area/department of UniCredit Bank AG, UniCredit Bank AG London Branch, UniCredit Bank AG Vienna Branch, UniCredit Bank AG Milan Branch, UniCredit Securities, UniCredit Menkul Değerler A.Ş., UniCredit Bulbank, Zagrebačka banka, UniCredit Bank, Bank Pekao, Yapi Kredi, UniCredit Tiriac Bank, ATFBank and another. In particular, Investment Banking units, including corporate finance, capital market activities, financial advisory and other capital raising activities, are segregated by physical and non-physical boundaries from Markets Units, as well as the research department. In the case of equities execution by UniCredit Bank AG Milan Branch, other than as a matter of client facilitation or delta hedging of OTC and listed derivative positions, there is no proprietary trading. Disclosure of publicly available conflicts of interest and other material interests is made in the research. Analysts are supervised and managed on a day-to-day basis by line managers who do not have responsibility for Investment Banking activities, including corporate finance activities, or other activities other than the sale of securities to clients.

29 October 2010 Economics & FI/FX Research
Curves & Crosses
UniCredit Research page 46
ADDITIONAL REQUIRED DISCLOSURES UNDER THE LAWS AND REGULATIONS OF JURISDICTIONS INDICATED Notice to Austrian investors This document does not constitute or form part of any offer for sale or subscription of or solicitation of any offer to buy or subscribe for any securities and neither this document nor any part of it shall form the basis of, or be relied on in connection with or act as an inducement to enter into, any contract or commitment whatsoever. This document is confidential and is being supplied to you solely for your information and may not be reproduced, redistributed or passed on to any other person or published, in whole or part, for any purpose. Notice to Czech investors This report is intended for clients of UniCredit Bank AG, UniCredit Bank AG London Branch, UniCredit Bank AG Vienna Branch, UniCredit Bank AG Milan Branch, UniCredit Securities, UniCredit Menkul Değerler A.Ş., UniCredit Bulbank, Zagrebačka banka, UniCredit Bank, Bank Pekao, Yapi Kredi, UniCredit Tiriac Bank, ATFBank in the Czech Republic and may not be used or relied upon by any other person for any purpose. Notice to Italian investors This document is not for distribution to retail clients as defined in article 26, paragraph 1(e) of Regulation n. 16190 approved by CONSOB on October 29, 2007. In the case of a short note, we invite the investors to read the related company report that can be found on UniCredit Research website www.research.unicreditgroup.eu. Notice to Russian investors As far as we are aware, not all of the financial instruments referred to in this analysis have been registered under the federal law of the Russian Federation “On the Securities Market” dated April 22, 1996, as amended, and are not being offered, sold, delivered or advertised in the Russian Federation. Notice to Turkish investors Investment information, comments and recommendations stated herein are not within the scope of investment advisory activities. Investment advisory services are provided in accordance with a contract of engagement on investment advisory services concluded with brokerage houses, portfolio management companies, non-deposit banks and the clients. Comments and recommendations stated herein rely on the individual opinions of the ones providing these comments and recommendations. These opinions may not suit your financial status, risk and return preferences. For this reason, to make an investment decision by relying solely on the information stated here may not result in consequences that meet your expectations. Notice to Investors in Japan This document does not constitute or form part of any offer for sale or subscription for or solicitation of any offer to buy or subscribe for any securities and neither this document nor any part of it shall form the basis of, or be relied on in connection with or act as an inducement to enter into, any contract or commitment whatsoever. Notice to UK investors This communication is directed only at clients of UniCredit Bank AG, UniCredit Bank AG London Branch, UniCredit Bank AG Vienna Branch, UniCredit Bank AG Milan Branch, UniCredit Securities, UniCredit Menkul Değerler A.Ş., UniCredit Bulbank, Zagrebačka banka, UniCredit Bank, Bank Pekao, Yapi Kredi, UniCredit Tiriac Bank, ATFBank in the Czech Republic who (i) have professional experience in matters relating to investments or (ii) are persons falling within Article 49(2)(a) to (d) (“high net worth companies, unincorporated associations, etc.”) of the United Kingdom Financial Services and Markets Act 2000 (Financial Promotion) Order 2005 or (iii) to whom it may otherwise lawfully be communicated (all such persons together being referred to as “relevant persons”). This communication must not be acted on or relied on by persons who are not relevant persons. Any investment or investment activity to which this communication relates is available only to relevant persons and will be engaged in only with relevant persons. Notice to U.S. investors This report is being furnished to U.S. recipients in reliance on Rule 15a-6 ("Rule 15a-6") under the U.S. Securities Exchange Act of 1934, as amended. Each U.S. recipient of this report represents and agrees, by virtue of its acceptance thereof, that it is such a "major U.S. institutional investor" (as such term is defined in Rule 15a-6) and that it understands the risks involved in executing transactions in such securities. Any U.S. recipient of this report that wishes to discuss or receive additional information regarding any security or issuer mentioned herein, or engage in any transaction to purchase or sell or solicit or offer the purchase or sale of such securities, should contact a registered representative of UniCredit Capital Markets, Inc. (“UCI Capital Markets”). Any transaction by U.S. persons (other than a registered U.S. broker-dealer or bank acting in a broker-dealer capacity) must be effected with or through UCI Capital Markets. The securities referred to in this report may not be registered under the U.S. Securities Act of 1933, as amended, and the issuer of such securities may not be subject to U.S. reporting and/or other requirements. Available information regarding the issuers of such securities may be limited, and such issuers may not be subject to the same auditing and reporting standards as U.S. issuers. The information contained in this report is intended solely for certain "major U.S. institutional investors" and may not be used or relied upon by any other person for any purpose. Such information is provided for informational purposes only and does not constitute a solicitation to buy or an offer to sell any securities under the Securities Act of 1933, as amended, or under any other U.S. federal or state securities laws, rules or regulations. The investment opportunities discussed in this report may be unsuitable for certain investors depending on their specific investment objectives, risk tolerance and financial position. In jurisdictions where UCI Capital Markets is not registered or licensed to trade in securities, commodities or other financial products, transactions may be executed only in accordance with applicable law and legislation, which may vary from jurisdiction to jurisdiction and which may require that a transaction be made in accordance with applicable exemptions from registration or licensing requirements. The information in this publication is based on carefully selected sources believed to be reliable, but UCI Capital Markets does not make any representation with respect to its completeness or accuracy. All opinions expressed herein reflect the author’s judgment at the original time of publication, without regard to the date on which you may receive such information, and are subject to change without notice. UCI Capital Markets may have issued other reports that are inconsistent with, and reach different conclusions from, the information presented in this report. These publications reflect the different assumptions, views and analytical methods of the analysts who prepared them. Past performance should not be taken as an indication or guarantee of future performance, and no representation or warranty, express or implied, is provided in relation to future performance. UCI Capital Markets and any company affiliated with it may, with respect to any securities discussed herein: (a) take a long or short position and buy or sell such securities; (b) act as investment and/or commercial bankers for issuers of such securities; (c) act as market makers for such securities; (d) serve on the board of any issuer of such securities; and (e) act as paid consultant or advisor to any issuer. The information contained herein may include forward-looking statements within the meaning of U.S. federal securities laws that are subject to risks and uncertainties. Factors that could cause a company’s actual results and financial condition to differ from expectations include, without limitation: political uncertainty, changes in general economic conditions that adversely affect the level of demand for the company’s products or services, changes in foreign exchange markets, changes in international and domestic financial markets and in the competitive environment, and other factors relating to the foregoing. All forward-looking statements contained in this report are qualified in their entirety by this cautionary statement This document may not be distributed in Canada or Australia.

29 October 2010 Economics & FI/FX Research
Curves & Crosses
UniCredit Research page 47
UniCredit Research* Thorsten Weinelt, CFA Global Head of Research & Chief Strategist +49 89 378-15110 [email protected]
Dr. Ingo Heimig Head of Research Operations +49 89 378-13952 [email protected]
Economics & FI/FX Research
Marco Annunziata, Ph.D., Chief Economist +44 20 7826-1770 [email protected]
Economics & Commodity Research European Economics Marco Valli, Chief Eurozone Economist +39 02 8862-8688 [email protected]
Andreas Rees, Chief German Economist +49 89 378-12576 [email protected]
Stefan Bruckbauer, Chief Austrian Economist +43 50505 41951 [email protected]
Tullia Bucco +39 02 8862-2079 [email protected]
Chiara Corsa +39 02 8862-2209 [email protected]
Dr. Loredana Federico +39 02 8862-3180 [email protected]
Alexander Koch, CFA +49 89 378-13013 [email protected]
Chiara Silvestre [email protected]
US Economics Dr. Harm Bandholz, CFA, Chief US Economist +1 212 672 5957 [email protected]
Commodity Research Jochen Hitzfeld +49 89 378-18709 [email protected]
Nikolaus Keis +49 89 378-12560 [email protected]
EEMEA Economics & FI/FX Strategy Gillian Edgeworth, Chief EEMEA Economist +44 0207 826 1772, [email protected]
Gyula Toth, Head of EEMEA FI/FX Strategy +43 50505 823-62, [email protected]
Cevdet Akcay, Ph.D., Chief Economist, Turkey +90 212 319-8430, [email protected]
Matteo Ferrazzi, Economist, EEMEA +39 02 8862-8600, [email protected]
Dmitry Gourov, Economist, EEMEA +43 50505 823-64, [email protected]
Hans Holzhacker, Chief Economist, Kazakhstan +7 727 244-1463, [email protected]
Marcin Mrowiec, Chief Economist, Poland +48 22 656-0678, [email protected]
Vladimir Osakovsky, Ph.D., Head of Strategy and Research, Russia +7 495 258-7258 ext.7558, [email protected]
Rozália Pál, Ph.D., Chief Economist, Romania +40 21 203-2376, [email protected]
Kristofor Pavlov, Chief Economist, Bulgaria +359 2 9269-390, [email protected]
Goran Šaravanja, Chief Economist, Croatia +385 1 6006-678, [email protected]
Pavel Sobisek, Chief Economist, Czech Republic +420 2 211-12504, [email protected]
Global FI/FX Strategy Michael Rottmann, Head +49 89 378-15121, [email protected]
Dr. Luca Cazzulani, Deputy Head, FI Strategy +39 02 8862-0640, [email protected]
Chiara Cremonesi, FI Strategy +44 20 7826-1771, [email protected]
Elia Lattuga, FI Strategy +39 02 8862-2027, [email protected]
Dr. Stephan Maier, FX Strategy +39 02 8862-8604, [email protected]
Armin Mekelburg, FX Strategy +49 89 378-14307, [email protected]
Roberto Mialich, FX Strategy +39 02 8862-0658, [email protected]
Kornelius Purps, FI Strategy +49 89 378-12753, [email protected]
Herbert Stocker, Technical Analysis +49 89 378-14305, [email protected]
Publication Address
UniCredit Research Corporate & Investment Banking UniCredit Bank AG Milan Branch Economics & FI/FX Research Via Tommaso Grossi, 10 - 20121 Milan Tel +39 02 8862.2019 - Fax +39 02 8862.2585
Bloomberg UCGR Internet www.research.unicreditgroup.eu
* UniCredit Research is the joint research department of UniCredit Bank AG (UniCredit Bank), UniCredit CAIB Group (UniCredit CAIB), UniCredit Securities (UniCredit Securities),
UniCredit Menkul Değerler A.Ş. (UniCredit Menkul), UniCredit Bulbank, Zagrebačka banka, UniCredit Bank, Bank Pekao, Yapi Kredi, UniCredit Tiriac Bank and ATFBank.