Embed Size (px)
Citation preview

Resultados enero-diciembre 2007
www.prisa.es //Información para accionistas e inversores
Annual Results January- December 2007
February 7th 2008

January- December 2007 Results
www.prisa.es // Investor Relations Information
2
2007 RESULTS
PRISA´S PROFIT BEFORE TAX REACHED €289.00 MILLION (+73.7%).
EBIT (€519.93 MILLION) AND EBITDA (€779.62 MILLION) INCREASED BY 81.8% AND
46.7% RESPECTIVELY.
Revenues increased by 31.4% to reach €3,696.03 million. Operating margins improvement.
Most relevant events in 2007:
• Advertising growth (+46.7%). The increase in Radio in Spain (+11.0%), El País (+6.4%), International Radio (+20.4%) and Digital (+48.3%), together with the contribution of Sogecable and Media Capital, explain this performance.
• Newspapers and magazines sales growth (+4.8%), explained by the positive performance of the circulation of El País (+0.7%), AS (+9.3%) and Cinco Días (+19.3%).
• Radio increased its EBITDA by 24.3%. The operating profit exceeded one hundred million euros (€101.79 million, +26.3%). Cadena SER´s audience, with 5,056,000 daily listeners, surpassed the sum of its three main competitors´s audience.
• Santillana registered the best results ever reached: revenues (€560.00 million) increased by 14.6%. It is worth highlighting the educational campaigns in Brazil (+42.1%) and Spain (+9.5%), as well as in Venezuela (+38.3%), Colombia (+22.3%), Chile (+22.2%) and Argentina (+14.6%).
• Sogecable´s EBITDA reached €323.92 million. Cuatro recorded a profit in its second year in operation and closed the year with an average audience of 7.8% in December and an average of 7.7% for the full year.
• As of December 31st, 2007 DIGITAL+ reached 2,065,000 subscribers.
• TVI, the leader Portuguese free-to-air TV, maintained its leadership: the average audience share reached 34.3% in 2007 and 37.9% in prime time.
• Audiovisual Production (Plural) improved its EBITDA by 79.3%.
• Internet (Prisacom) reached €34.67 million revenues (+12.4%).

January- December 2007 Results
www.prisa.es // Investor Relations Information
3
Other important events in 2007:
• After the death of D. Jesús de Polanco, Prisa´s Board of Directors appointed D. Ignacio Polanco Moreno as Chairman.
• Prisa reached an irrevocable agreement with Eventos, S.A. that guarantees Prisa reaching a majority of Sogecable´s share capital and launched a takeover bid over the whole share capital of the company.
• Prisa increased its stake in Media Capital to reach 94.69%, as a consequence of the results of the voluntary and mandatory takeover bids launched by Prisa for the 100% of the company.
• Memorandum of Understanding with 3i Europe by means of which the latter will entrance the shareholder structure of Unión Radio with an approximate stake of 16.20%, through a share purchase and an increase of capital for a total investment of €225 million. The entrance of this new partner will develop the expansion of Unión Radio in the US Spanish speaking market.
• Relaunching of El País, both in its printed and online versions, with a new design and the vocation of a global newspaper in Spanish.
• Prisa acquired all the shares of Iberoamericana Radio Chile, S.A. (IARC). The price of the transaction amounted to €57.81 million.
• Prisa sold its stake in the Regional Press (El Correo de Andalucía, Diario Jaén and Novotécnica) for an amount of €29 million. The capital gain of this operation amounted to €3.47 million.
• Media Capital sold its Outdoor business for a total amount of €47million.

January- December 2007 Results
www.prisa.es // Investor Relations Information
4
The following changes in the scope of consolidation should be taken into account:
• Sogecable is fully consolidated in 2007 Prisa´s figures. In the first quarter of 2006, Sogecable was accounted by the equity method and from the 1st of April 2006 on, it was fully consolidated.
• Media Capital is fully consolidated in Prisa´s figures since February 1st, 2007. In 2006, it was accounted by the equity method.
• Iberoamericana Radio Chile is fully consolidated since July 1st, 2007.
• Regional Press (El Correo de Andalucía, Diario Jaén and Novotécnica) ceased to contribute to the consolidated figures since July 1st, 2007.
• Printing was accounted by the equity method since January 1st, 2007. In 2006, it was classified as an asset held for sale.
January- December 2007 Results
www.prisa.es // Investor Relations Information
5
PROFIT AND LOSS ACCOUNT
€ Million 2007 2006 Chg.
%
Operating Revenues 3,696.03 2,811.76 31.4
EBITDA 779.62 531.46 46.7
EBIT 519.93 285.95 81.8
Net financial result (195.26) (110.80) (76.2)
Result from associates and other
investments (35.67) (8.73) -
Profit before tax 289.00 166.42 73.7
Income tax expense (26.92) 64.36 (141.8)
Results from discontinued activities 0.00 (0.45) -
Minority interest (70.11) (1.42) -
Net profit 191.97 228.91 (16.1)
EBITDA Margin 21.1% 18.9%
EBIT Margin 14.1% 10.2%
JANUARY - DECEMBER
OPERATING REVENUES
As of December 2007, total operating revenues increased by 31.4% to reach €3,696.03 million compared to €2,811.76 million in 2006. The revenue breakdown by line of activity is shown below:
€ Million 2007 2006 Chg.%
Advertising 1,122.27 765.20 46.7
Books and training 536.47 465.05 15.4
Newspapers and magazine sales 210.52 200.82 4.8
Subscriber revenues 1,136.32 795.60 42.8
Audiovisual production revenues 313.71 219.34 43.0
Add-ons revenues 88.09 99.78 (11.7)
Printing sales 0.51 53.76 (99.1)
Revenues from fixed assets 22.38 27.79 (19.5)
Other revenues 265.76 184.42 44.1
Total operating revenues 3,696.03 2,811.76 31.4
JANUARY - DECEMBER
3
1
2
_____________________ 1 In 2006 figures, €10.49 million have been reclassified from “Books and training” to “Other revenues”, corresponding to the greater part of the revenues coming from Canal de Editoriales (Crisol bookshops), in order to make these figures comparable with the ones of 2007.
2 Revenues coming from the Printing business are accounted by the equity method since since January 1st, 2007. 3 Includes: services of telephone marketing, transmission services, advertising services, magazine services, distribution services, events, music sales, e-commerce, Internet services, bookshops sales, rentals and other revenues.

January- December 2007 Results
www.prisa.es // Investor Relations Information
6
Sogecable full consolidation since April 1st, 2006 and Media Capital full consolidations since February 1st, 2007, has resulted in a redistribution of the different sources of revenues. The chart shown below shows revenue contribution by different lines of activity during 2007 and 2006:
January-
December 07
January-
December 06
9%4%7%
8%
17%
27%
28%
8%2%6%8%
15%
30%
31%
Subscribers
Advertising
Books and training
Audiovisual Production
Newspaper and magazines
Add-ons
Others
The geographic breakdown is as follows:
80%
20%
Spain
International
85%
15%
Spain
International
In 2007, revenues coming from the international area accounted for 20%. The 52% of the international revenues came from Santillana, 33% from Media Capital and the remaining from press and radio activities.
� Advertising
Advertising revenues (€1,122.27 million) increased by 46.7%. By businesses, the advertising revenues evolution in 2007 was the following:
January- December 2007 January-December 2006

January- December 2007 Results
www.prisa.es // Investor Relations Information
7
€ Million 2007 2006 % Chg.
Press 272.49 259.16 5.1%
El Pais 218.22 205.13 6.4%
Prensa Especializada y RegionalSpecialized & Regional Press 51.77 50.39 2.7%
AS 21.67 18.93 14.5%
Cinco Días 11.73 11.00 6.6%
Regional Press* 8.69 12.47 (30.3%)
Magazines 9.72 7.92 22.8%
Others (0.04) 0.08 (154.6%)
International Press 3.98 4.92 (19.0%)
Consolidation adjustments (1.48) (1.27) (16.7%)
Radio 353.85 319.06 10.9%
Radio in Spain 270.55 243.64 11.0%
International Radio 82.82 68.78 20.4%
Music 0.50 6.67 (92.5%)
Consolidation adjustments (0.02) (0.03) 29.0%
Audiovisual 491.70 187.00 162.9%
Sogecable 301.19 166.90 80.5%
Cuatro 272.70 144.93 88.2%
Digital+ 28.49 21.97 29.7%
Media Capital** 168.94 --- ---
Local TV 20.05 19.97 0.4%
OtrosPlural 1.52 0.13 ---
Digital 15.81 10.66 48.3%
Others 0.11 0.60 (82.0%)
Consolidation adjustments (11.68) (11.28) (3.5%)
TOTAL 1,122.27 765.20 46.7%
JANUARY - DECEMBER
� Books and training
In 2007, books and training sales increased by 15.4% compared to 2006 (€536.47 million compared to €465.05 million). Regarding the northern campaigns, it is worth highlighting Spain (+9.5%), where market share increased by one point. It is also worth highlighting Venezuela, where revenues increased by 38.3%.
* Regional Press (El Correo de Andalucía and Diario Jaén) contributes to the advertising revenues until June, 2007.
** In order to adapt these figures to the Group´s accounting policies, it includes the amount coming from the “Outdoor” segment up to the date of the sale. These figures are classified in Media Capital’s profit and loss account as held for sale.
January- December 2007 Results
www.prisa.es // Investor Relations Information
8
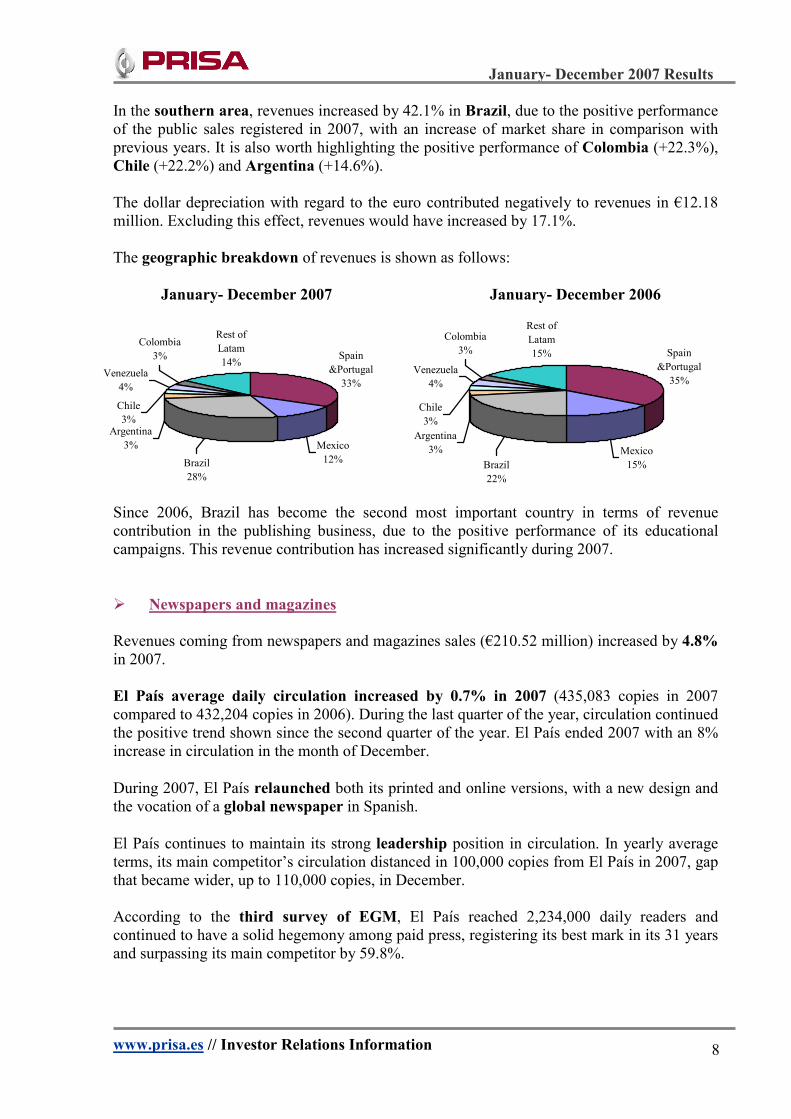
In the southern area, revenues increased by 42.1% in Brazil, due to the positive performance of the public sales registered in 2007, with an increase of market share in comparison with previous years. It is also worth highlighting the positive performance of Colombia (+22.3%), Chile (+22.2%) and Argentina (+14.6%). The dollar depreciation with regard to the euro contributed negatively to revenues in €12.18 million. Excluding this effect, revenues would have increased by 17.1%. The geographic breakdown of revenues is shown as follows:
January- December 2007 January- December 2006
Spain
&Portugal
33%
Mexico
12%
Chile
3%
Brazil
28%
Argentina
3%
Rest of
Latam
14%
Colombia
3%
Venezuela
4%
Spain
&Portugal
35%
Mexico
15%
Chile
3%
Brazil
22%
Argentina
3%
Rest of
Latam
15%
Colombia
3%
Venezuela
4%
Since 2006, Brazil has become the second most important country in terms of revenue contribution in the publishing business, due to the positive performance of its educational campaigns. This revenue contribution has increased significantly during 2007.
� Newspapers and magazines
Revenues coming from newspapers and magazines sales (€210.52 million) increased by 4.8% in 2007. El País average daily circulation increased by 0.7% in 2007 (435,083 copies in 2007 compared to 432,204 copies in 2006). During the last quarter of the year, circulation continued the positive trend shown since the second quarter of the year. El País ended 2007 with an 8% increase in circulation in the month of December.
During 2007, El País relaunched both its printed and online versions, with a new design and the vocation of a global newspaper in Spanish.
El País continues to maintain its strong leadership position in circulation. In yearly average terms, its main competitor’s circulation distanced in 100,000 copies from El País in 2007, gap that became wider, up to 110,000 copies, in December. According to the third survey of EGM, El País reached 2,234,000 daily readers and continued to have a solid hegemony among paid press, registering its best mark in its 31 years and surpassing its main competitor by 59.8%.

January- December 2007 Results
www.prisa.es // Investor Relations Information
9
In 2007, the sport newspaper AS increased by 9.3% its average daily circulation to reach 234,587 copies. During this period, AS gained market share, consolidated its leadership position in Madrid, established itself ahead of its main competitor in Barcelona and reached a significant growth in the rest of Spain. This growth was especially remarkable in Andalusia, and specifically in Seville, where leadership was close. According to EGM last survey, AS broke its own audience record, reaching 1,170,000 readers, (+9.7% increase compared to the previous survey). In 2007, Cinco Días increased its average daily circulation by 19.3%. Cinco Días reached 72,000 readers (+5.9% increase compared to the previous EGM survey), which was its best audience data for two years.
Evolution of the Group´s newspaper circulation
El País 435,083 432,204 0.7 (7.2) 2.0 4.4 4.5
AS 234,587 214,654 9.3 8.4 13.4 16.3 (1.3)
Cinco Días 40,552 33,997 19.3 30.7 16.9 14.9 15.5
Chg. % 07/06
1Q 2Q 3Q 4Q
January- December
2007 2006 Chg. %
(*) 2007 figures certified by the Spanish Circulation Audit Office (OJD) until June, except for the Sunday
supplement EPS.
� Subscriber revenues
DIGITAL+ closed the year 2007 with 2,065,000 subscribers and added 21,000 new subscribers in 2007. The commercial activity of DIGITAL+, which is aimed at the attraction of new subscribers, has progressively recovered from the complications faced in relation to the exploitation of Spanish football broadcasting rights in the three first months of the current season. Following the favourable court rulings in October, normal customer recruitment rates were resumed in November and December, and the number of new subscribers even exceeded the figures recorded in the previous year.
DIGITAL+ subscriber evolution (thousand of subscribers)
1,9601,985 1,990 2,006 2,044
2,065 2,056 2,046 2,065
Dec-05 Mar-06 Jun-06 Sep-06 Dec-06 Mar-07 Jun-07 Sep-07 Dec-07
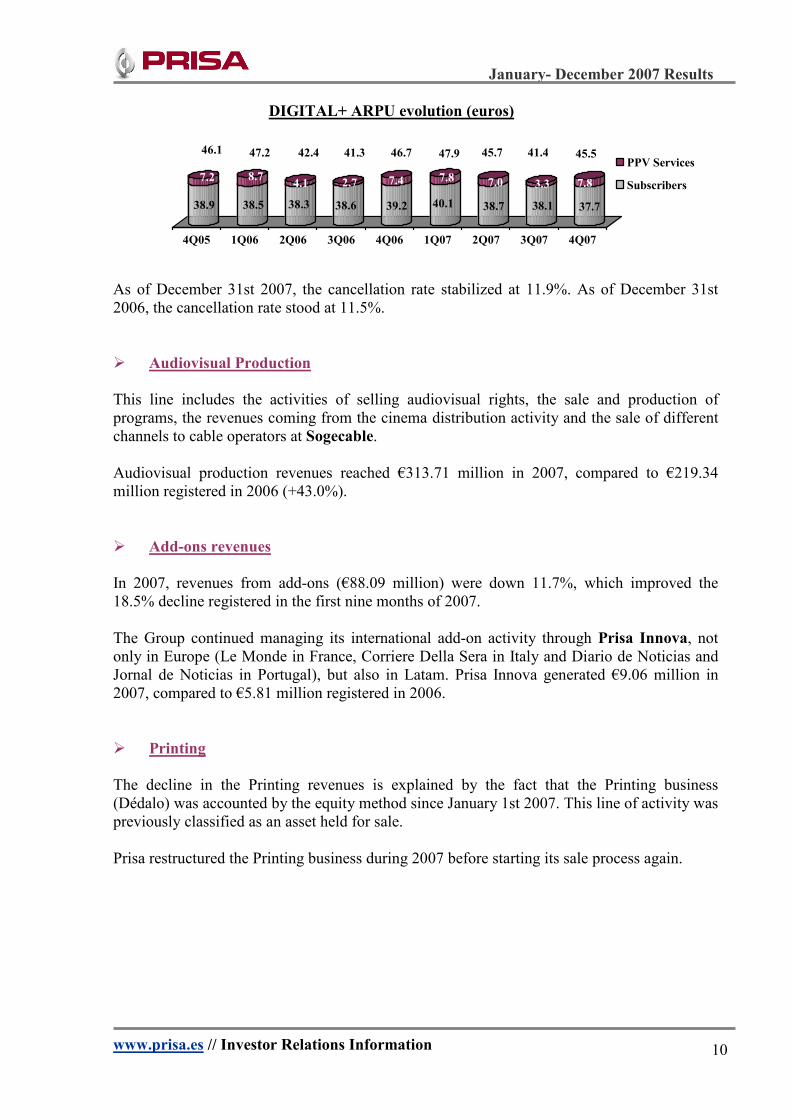
The average revenue in the fourth quarter of 2007 was 45.5 euros per subscriber and month.
January- December 2007 Results
www.prisa.es // Investor Relations Information
10
DIGITAL+ ARPU evolution (euros)
38.9
7.2
38.5
8.7
38.3
4.1
38.6
2.7
39.2
7.4
40.1
7.8
38.7
7.0
38.1
3.3
37.7
7.8
4Q05 1Q06 2Q06 3Q06 4Q06 1Q07 2Q07 3Q07 4Q07
PPV Services
Subscribers
As of December 31st 2007, the cancellation rate stabilized at 11.9%. As of December 31st 2006, the cancellation rate stood at 11.5%.
� Audiovisual Production
This line includes the activities of selling audiovisual rights, the sale and production of programs, the revenues coming from the cinema distribution activity and the sale of different channels to cable operators at Sogecable. Audiovisual production revenues reached €313.71 million in 2007, compared to €219.34 million registered in 2006 (+43.0%).
� Add-ons revenues
In 2007, revenues from add-ons (€88.09 million) were down 11.7%, which improved the 18.5% decline registered in the first nine months of 2007. The Group continued managing its international add-on activity through Prisa Innova, not only in Europe (Le Monde in France, Corriere Della Sera in Italy and Diario de Noticias and Jornal de Noticias in Portugal), but also in Latam. Prisa Innova generated €9.06 million in 2007, compared to €5.81 million registered in 2006.
� Printing
The decline in the Printing revenues is explained by the fact that the Printing business (Dédalo) was accounted by the equity method since January 1st 2007. This line of activity was previously classified as an asset held for sale. Prisa restructured the Printing business during 2007 before starting its sale process again.
46.1 47.2 42.4 41.3 46.7 47.9 45.7 41.4 45.5

January- December 2007 Results
www.prisa.es // Investor Relations Information
11
� Revenues from fixed assets
The amount of €22.38 million registered included mainly the following capital gains:
• €16.88 million from the disposal of Media Capital´s outdoor business.
• €3.47 million from the disposal of the Regional Press. In 2006, revenues from fixed assets included the €18.45 million capital gain from the selling of the 20% stake of GLR to Grupo Godó, as well as €4.38 million capital gain from the disposal of some real estate properties and €3.07 million capital gain from the disposal of Radio Latina, a radio station located in Paris.

January- December 2007 Results
www.prisa.es // Investor Relations Information
12
EBITDA
During 2007, the Group EBITDA reached €779.62 milion compared to €531.46 million in 2006 (+46.7%).
The EBITDA breakdown by business areas is shown below:
779.62
385.61
136.73 119.92 115.60 1.81 19.97
TOTAL Audiovisual Press Education Radio Digital Others
In 2007, EBITDA margin was 21.1% compared to 18.9% in 2006, mainly due to the full consolidation of Media Capital as well as the improvement in the margins in Sogecable and in the Radio business. The evolution of the EBITDA is explained by the following:
• The integration of Sogecable. Sogecable´s contribution to the EBITDA of the Group reached €323.92 million, which means an increase of €161.40 million compared to 2006 (+99.3%).
• Media Capital full consolidation since February 1st, 2007. The contribution of Media Capital to the EBITDA reached €67.11 million.
• The contribution of the Radio in Spain, which increased its EBITDA by €17.07 million (+19.9%), mainly explained by the positive evolution of the advertising revenues.
• The evolution of Education- Publishing, which increased its EBITDA by €10.97 million (+10.1%), mainly because of the positive performance of the educational campaign in Spain and the public sale in Brazil.
EBITDA (€ Million)
El País: 113.31 Spec. Press: 22.08
Int Press: 1.34
Radio in Spain: 102.81 Int. Radio: 11.26
Music: 1.52
Sogecable: 323.92 Digital+: 319.97 Cuatro: 3.95 Media Capital*: 67.11 Local TV: -13.53 Plural: 8.11
* Media Capital is fully consolidated as of February 1st, 2007. In order to adapt these figures to the Group’s accounting policies, it includes the amount coming from the “Outdoor” segment up to the date of the sale, as well as the capital gain of the operation. These figures are classified in Media Capital’s profit and loss account as held for sale.
** “Others” include mainly the activities from Real Estate and Head Quarters.
GDM: 9.38 Distribution: 2.16 Others**: 8.43
Latam: 80.17 Spain and Portugal: 39.75
January- December 2007 Results
www.prisa.es // Investor Relations Information
13
• The contribution of the International Radio, which increased its EBITDA by €4.95 million (+78.5%), mainly because of the improvement of the EBITDA of Radio Caracol in Colombia, the full consolidation of Iberoamericana Radio de Chile since July 1st, 2007 and the reduction in the losses coming from the radio in USA. This positive performance is compensated by the €3.07 million capital gain registered in 2006 as a consequence of the sale of Radio Latina in France.
• Specialized and Regional Press EBITDA reached €22.08 million (+12.1%), mainly explained by the €3.47 million capital gain from the disposal of the Regional Press.
• The EBITDA of Plural reached €8.11 million (+79.3%).
• Gran Vía Musical reached an EBITDA of €1.52 million, compared to €0.97 million reached in 2006.
• The area of Local TV reduced its losses at the EBITDA level by 9.1%.
• The evolution of the EBITDA of El País (-7.9%) is explained by the impact of the add-ons activity.
During 2007, the Group operating profit (EBIT) registered a profit of €519.93 million compared to the €285.95 million profit registered in 2006 (+81.8%). In 2007, the EBIT margin was 14.1% compared to 10.2% in 2006.
The net financial result reached a loss of €195.26 million compared to the €110.80 million loss in 2006. This difference is due to the increase in the interest rates during 2007, as well as due to the increase of the contribution of the financial losses coming from Sogecable (+€25.00 million loss) and the financial losses coming from Media Capital (€9.11 million loss) and due to the increase in the financial expenses as a result of a higher level of debt reached after the Sogecable 20% takeover bid and after the Media Capital´s takeover bids, as well as other acquisitions made during 2007. Results from associates and other investments reached a €35.67 million loss, compared to the €8.73 million loss registered in 2006. This higher loss is explained by the contribution of the Printing activity, which was accounted by the equity method in 2007, and includes the impact of the restructuring plan in this business.
Minority interest reached a loss of €70.11 million compared to €1.42 million loss of the previous year. The difference is due to the minority interest coming from Sogecable, Media Capital and Radio in Spain. Profit befote tax reached €289.00 million compared to €166.42 million registered in 2006 (+73.7%).

January- December 2007 Results
www.prisa.es // Investor Relations Information
14
In 2007, the income tax expense included a deduction coming from the additional investment in Media Capital as a result of the mandatory takeover bid launched for the company. In 2006, the income tax expense included an income mainly due to the deductions for investing in foreign countries (the majority came from the investments in Portugal and Chile). Net profit reached €191.97 million compared to €228.91 million registered in 2006 (-16.1%), mainly because of the increase in the financial expenses and the higher expense register in the income tax expense line compared to the last year.
January- December 2007 Results
www.prisa.es // Investor Relations Information
15
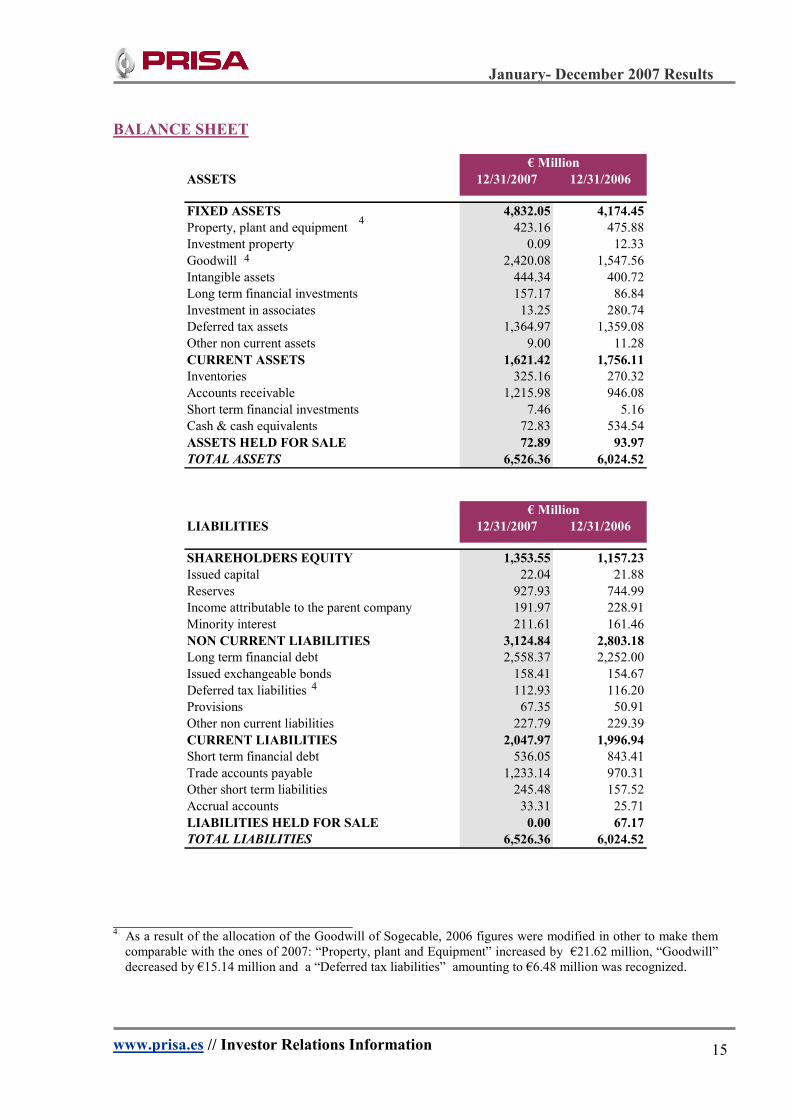
BALANCE SHEET
ASSETS 12/31/2007 12/31/2006
FIXED ASSETS 4,832.05 4,174.45
Property, plant and equipment 423.16 475.88
Investment property 0.09 12.33
Goodwill 2,420.08 1,547.56
Intangible assets 444.34 400.72
Long term financial investments 157.17 86.84
Investment in associates 13.25 280.74
Deferred tax assets 1,364.97 1,359.08
Other non current assets 9.00 11.28
CURRENT ASSETS 1,621.42 1,756.11
Inventories 325.16 270.32
Accounts receivable 1,215.98 946.08
Short term financial investments 7.46 5.16
Cash & cash equivalents 72.83 534.54
ASSETS HELD FOR SALE 72.89 93.97
TOTAL ASSETS 6,526.36 6,024.52
LIABILITIES 12/31/2007 12/31/2006
SHAREHOLDERS EQUITY 1,353.55 1,157.23
Issued capital 22.04 21.88
Reserves 927.93 744.99
Income attributable to the parent company 191.97 228.91
Minority interest 211.61 161.46
NON CURRENT LIABILITIES 3,124.84 2,803.18
Long term financial debt 2,558.37 2,252.00
Issued exchangeable bonds 158.41 154.67
Deferred tax liabilities 112.93 116.20
Provisions 67.35 50.91
Other non current liabilities 227.79 229.39
CURRENT LIABILITIES 2,047.97 1,996.94
Short term financial debt 536.05 843.41
Trade accounts payable 1,233.14 970.31
Other short term liabilities 245.48 157.52
Accrual accounts 33.31 25.71
LIABILITIES HELD FOR SALE 0.00 67.17
TOTAL LIABILITIES 6,526.36 6,024.52
€ Million
€ Million
4
4
4
______________________________ 4 As a result of the allocation of the Goodwill of Sogecable, 2006 figures were modified in other to make them comparable with the ones of 2007: “Property, plant and Equipment” increased by €21.62 million, “Goodwill” decreased by €15.14 million and a “Deferred tax liabilities” amounting to €6.48 million was recognized.

January- December 2007 Results
www.prisa.es // Investor Relations Information
16
The integration of Media Capital explains the main changes in the different lines of the balance sheet. Total assets and liabilities coming from Media Capital reached €412.55 million.
The most important change corresponds to the “Goodwill”, due to the reclassification to this line of the goodwill generated by the acquisition of the initial 33% stake in Media Capital in 2005, previously registered in the line “Investment in associates” and to the new goodwills generated as a result of the voluntary and mandatory takeover bids launched for the 100% of Media Capital, after which Prisa´s stake in Media Capital reached 94.69%. This line also includes the new goodwill generated in 2007 by the acquisition of Iberoamericana Radio Chile and the one generated by the acquisition of an additional 4.15% stake in Sogecable in 2007.
During 2007, Prisa ceased to classify the 40% of the assets and liabilities of Dédalo (Printing) as held for sale, as the process iniciated in 2006 for the disposal of this business was not completed within a year. As a consequence, the Printing activity is consolidated by the equity method since January, 1st 2007.
Additionally, during 2007 Prisa has started a process of sale of its Real Estate (three buildings). As a consequence, the net value of the Real Estate was classified to “Assets held for sale” as of December 31st, 2007.
INVESTMENTS
During 2007, total investments reached €868.22 million. By business units, investments were as follows:
€ Million CAPEX Long term
financial
investments
TOTAL
Press 15.68 --- 15.68
El País 15.07 --- 15.07
Specialized & Regional Press 0.41 --- 0.41
International Press 0.20 --- 0.20
Radio 22.25 65.61 87.86
Radio in Spain 17.11 7.80 24.91
International Radio 5.09 57.81 62.90
Music 0.05 --- 0.05
Education-Publishing 46.49 --- 46.49
Audiovisual 115.58 28.65 144.23
Sogecable 99.10 0.13 99.23
Media Capital 12.41 27.57 39.98
Local TV 1.13 0.95 2.08
Plural 2.95 --- 2.95
Digital 4.03 0.01 4.04
Others 8.57 561.35 569.92
Vertix --- 403.42 403.42
Prisa 6.01 152.45 158.47
Distribution 1.04 5.48 6.52
Prisa División Inmobiliaria 0.78 --- 0.78
GDM 0.58 --- 0.58
Others 0.15 --- 0.15
Total 212.60 655.62 868.22 The most important long term financial investments were the following:
January- December 2007 Results
www.prisa.es // Investor Relations Information
17
• Vertix: because of the acquisition of an additional 61.69% stake in Media Capital, mainly as a result of the voluntary takeover bid (acquisition of a 40.70% stake amounting to €255.95 million) and as a result of the mandatory takeover bid (acquisition of a 20.68% stake amounting to €145.23 million).
• Prisa: mainly because of the acquisition of an additional 4.15% stake in Sogecable to reach a 47.09% stake in the company (€152.30 million).
• International Radio: acquisition of all the shares of Iberoamericana Radio Chile through Unión Radio (€57.81 million; US$79.72 million).
• Media Capital: mainly because of the acquisition of an additional 40% stake in CLMC Multimedia amounting €3.21 million (company focused in the distribution of cinema, video and other multimedia products) as well as the acquisition of the minorities of the audiovisual production business (Grupo NBP) amounting to €15.20 million.

January- December 2007 Results
www.prisa.es // Investor Relations Information
18
NET FINANCIAL POSITION
Net financial position as of December 31st, 2007 amounted to €3,014.13 million compared to €2,555.71 million registered in December 2006.
NET DEBT 12/31/2007 12/31/2006
Financial debt 3,094.42 3,095.41
Non current liabilities 2,558.37 2,252.00
Current liabilities 536.05 843.41
Cash and cash equivalents (80.28) (539.70)
Net debt 3,014.13 2,555.71
€ Million
In 2007, net debt increased by €458.42 million compared to December 2006, due to the following:
• The acquisition of an additional 61.69% stake in Media Capital, amounting to €403.09 million.
• The change in the net financial position of Sogecable in 2007, which decreased the Group´s debt by €125.18 million.
• Media Capital´s full consolidation, which contributed with €97.16 million to the Group´s net debt.
• The acquisition of all the shares of Iberoamericana Radio Chile, amounting to €57.81 million.
• The additional 4.15% stake in Sogecable, amounting to €152.30 million.
Prisa´s net debt, excluding Sogecable, amounted to €2,157.66 million compared to €1,574.05 million as of December, 2006. As of December, 2007, the Group signed a six month bridge loan with HSBC for a maximum of €4,230 million, tied to market interests. The purpose of this financial facility is attending the financial obligations derived from the bid presented to the Spanish Securities Market Commission (CNMV) on December 28th, 2007 over the whole share capital of Sogecable. This agreement includes both the guarantee for the offer presented to the CNMV and a credit facility amounting to €2,050 million with the purpose of refinancing if necessary the syndicated loan the Group signed in June, 2007.
The average interest rate on the Group´s financial debt was 4.98% in 2007 and 3.68% in 2006.

January- December 2007 Results
www.prisa.es // Investor Relations Information
19
CASH FLOW
€ Million
EBIT 519.93 285.95
Amortization 231.44 219.73
Change in working capital 33.66 118.67
Capex (212.60) (199.09)
Operating cashflow 572.43 425.26
Financial investments and other non
recurrent investments (655.62) (1,041.33)
Financial result (195.26) (110.80)
Dividends (33.71) (30.20)
Taxes (26.92) 64.36
Other (119.35) (1,260.10)
NET DEBT CHANGE 458.42 1,952.82
12/31/2007 12/31/2006
As of December 31st 2007, Grupo Prisa´s cash flow is influenced by the full consolidation of Media Capital since February 1st, 2007. The effect of this consolidation has resulted in an increase of €97.16 million in the Group´s net debt change.
The cash flow statement is only comparable when excluding the impact of the consolidation of Media Capital as of December 31st, 2007 and excluding the impact of the consolidation of Sogecable as of December 31st, 2006.
January- December 2007 Results
www.prisa.es // Investor Relations Information
20
ACQUISITIONS AND RELEVANT EVENTS RELEASED IN 2007
Media Capital
As a result of the voluntary takeover bid launched for the 100% of Grupo Media Capital as of October, 2006, after which Prisa´s stake in Media Capital (through Vertix) reached 73.70%, Prisa launched as of Februrary, 2007, a mandatory takeover bid for the 100% of Grupo Media Capital. As a result of this mandatory takeover bid, Prisa´s stake in Grupo Media Capital reached 94.39%. As of December, 2007, Prisa communicated that its Portuguese subsidiary Grupo Media Capital S.G.P.S. S.A., where Prisa owns a 94.69% stake, reached an agreement with Dali Invest Outdoor, SA, for the sale of the total shares representing the share capital and voting rights of Media Capital Outdoors –Publicidade, SA, for a global amount of €47 million.
Specialized Press
As of May 2007, Prisa, through Grupo Empresarial de Medios Impresos, S.L., reached a preliminary agreement with Grupo Alfonso Gallardo, S.L. to sell: i) the 100% stake in El Correo de Andalucía, S.L., editor of the newspaper “El Correo de Andalucía” and ii) the 59.27% stake in Diario Jaén, S.A., editor of “Diario Jaén”. The total price amounted to €19 million. As of June 2007, Prisa, through Espacio Editorial Andaluza Holding, S.L., reached an agreement with D. José Luis Martínez García, to sell the 31.89% stake in Novotécnica, S.A. (editor of “La Voz de Almería”), and the remaining stakes Espacio Editorial Andaluza Holding, S.L. had in other companies participated by Novotécnica, S.A. The total price amounted to €10 million.
Radio
As of July, 2007, Prisa announced that it had acquired from Claxson Chile, S.A. all the shares of Iberoamericana Radio Chile, S.A., (IARC) through Grupo Latino de Radiodifusión Chile (GLR Chile), a subsidiary of Unión Radio. This transaction was authorized by the “Tribunal de Defensa de la Competencia” (TDLC) of Chile, which imposed several conditions. As of December, 2007 Prisa communicated that, jointly with Grupo Godó de Comunicación, S.A., and with its subsidiary Sociedad de Servicios Radiofónicos Unión Radio, S.L., it had signed a Memorandum of Understanding with 3i Europe plc, a fund management company integrated in the European venture capital firm 3i Group plc, by means of which the latter will entrance the shareholder structure of Unión Radio with an approximate stake of 16.20%, through a share purchase and an increase of capital, for a total investment of €225 million.

January- December 2007 Results
www.prisa.es // Investor Relations Information
21
Sogecable
As of June, 2007, Sogecable and Telefónica reached an agreement to jointly offer Telefónica’s telecom and Sogecable’s digital television services as well as collaborating in the acquisition of contents for pay-television in the Spanish market.
As of December 20th, 2007, Prisa communicated that it had reached an irrevocable agreement with Eventos, S.A., by means of which the latter had agreed to sell to Prisa its shareholding in Sogecable (2.94%) within a takeover bid to be launched by Prisa at a price per class A ordinary share of €27.98. This agreement guarantees Prisa reaching a majority of Sogecable’s share capital and guarantees Eventos, S.A. the sale of its shares at the price mentioned above. In the same day, The Board of Directors of Prisa agreed to launch a mandatory takeover bid over the whole share capital of Sogecable.
As of December 28th, 2007, Prisa filed an application requesting authorization of the Offer at the Spanish Securities Market Commission, together with the duly subscribed prospectus and the corresponding supplementary documentation required. Prisa raised the initial price of the offer, rounding it off to 28 euros per share.

January- December 2007 Results
www.prisa.es // Investor Relations Information
22
APPENDIXES
I. Group Structure.
II. January- December financials breakdown by business unit
II.I. Operating revenue breakdown by business unit. II.II. Operating expense breakdown by business unit. II.III. EBIT breakdown by business unit. II.IV. EBITDA breakdown by business unit.
III. Quarterly 2007-2006 financials breakdown by business unit
III.I. Advertising revenue breakdown by business unit. III.II. Operating revenue breakdown by business unit. III.III. Operating expense breakdown by business unit. III.IV. EBIT breakdown by business unit. III.V. EBITDA breakdown by business unit.
IV. Audience of Cuatro.
V. Audience of TVI (Portugal).
VI. Prisacom: unic users
January- December 2007 Results
www.prisa.es // Investor Relations Information
23
Appendix I
GROUP STRUCTURE
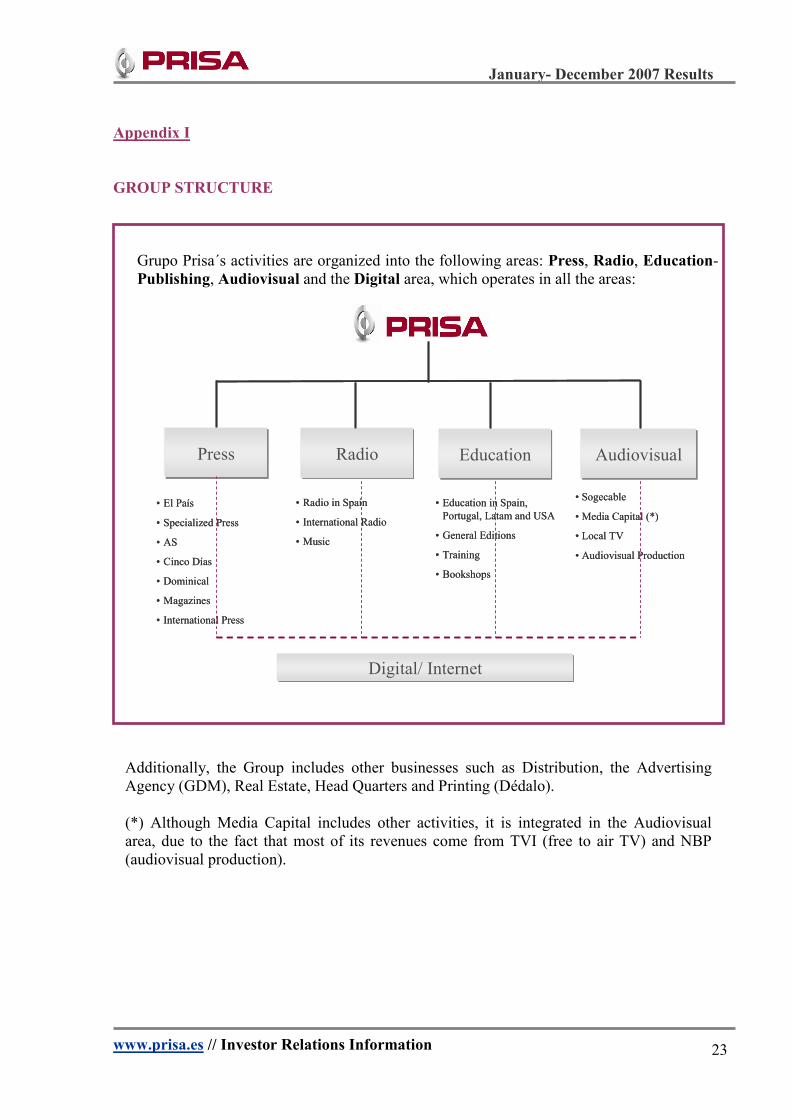
Grupo Prisa´s activities are organized into the following areas: Press, Radio, Education-Publishing, Audiovisual and the Digital area, which operates in all the areas:
Additionally, the Group includes other businesses such as Distribution, the Advertising Agency (GDM), Real Estate, Head Quarters and Printing (Dédalo).
(*) Although Media Capital includes other activities, it is integrated in the Audiovisual area, due to the fact that most of its revenues come from TVI (free to air TV) and NBP (audiovisual production).
• El País
• Specialized Press
• AS
• Cinco Días
• Dominical
• Magazines
• International Press
• Radio in Spain
• International Radio
• Music
• Sogecable
• Media Capital (*)
• Local TV
• Audiovisual Production
• Education in Spain,
Portugal, Latam and USA
• General Editions
• Training
• Bookshops
Press Radio Education Audiovisual
Digital/ Internet

January- December 2007 Results
www.prisa.es // Investor Relations Information
24
Appendix II.I.
OPERATING REVENUES
€ Million 2007 2006 % Chg.
Press 572.28 564.94 1.3%
El Pais 411.90 410.50 0.3%
Advertising 218.22 205.13 6.4%Circulation 126.24 125.03 1.0%Add-ons 64.50 77.97 (17.3%)
Others 2.95 2.37 24.5%
Specialized & Regional Press 156.29 148.01 5.6%AS 87.50 78.10 12.0%Cinco Días 20.05 19.67 1.9%
Regional Press* 17.94 21.17 (15.3%)
Magazines 28.40 27.22 4.3%
Others 2.41 1.86 29.9%
International Press 8.01 9.21 (13.1%)
Consolidation Adjustments (3.93) (2.78) (41.3%)
Radio 422.76 375.81 12.5%
Radio in Spain 307.83 273.72 12.5%International Radio 88.60 75.85 16.8%Music 29.70 27.14 9.4%Consolidation Adjustments (3.38) (0.90) ---
Education - Publishing 560.00 488.81 14.6%
Audiovisual 2,105.60 1,272.35 65.5%
Sogecable 1,809.52 1,221.54 48.1%
Digital + 1,522.03 1,067.13 42.6%
Cuatro 287.49 154.41 86.2%
Media Capital** 238.97 --- ---
Local TV 27.12 35.26 (23.1%)
Plural 53.96 30.24 78.4%
Consolidation Adjustments (23.96) (14.69) (63.2%)
Digital 34.67 30.86 12.4%
Other Revenues 129.86 204.60 (36.5%)
Printing --- 71.00 ---Distribution 39.13 32.27 21.3%GDM 26.36 25.36 3.9%Others*** 64.36 75.96 (15.3%)
Consolidation adjustments (129.13) (125.60) (2.8%)
TOTAL 3,696.03 2,811.76 31.4%
* Regional Press (El Correo de Andalucía and Diario Jaén) contributes to the operating revenues until June, 2007.
** In order to adapt Media Capital´s figures to the Group´s accounting policies, this figure includes the amount coming
from the Outdoor segment up to the date of the sale, as well as the capital gain of the operation, classified in Media
Capital´s profit and loss account as held for sale.
*** Others include mainly the activities from Real Estate and Head Quarters.
JANUARY - DECEMBER

January- December 2007 Results
www.prisa.es // Investor Relations Information
25
Appendix II.II.
OPERATING EXPENSES
€ Million 2007 2006 % Chg.
Press 450.77 436.95 3.2%
El Pais 311.50 300.38 3.7%
Prensa Especializada y RegionalSpecialized & Regional Press 135.70 130.80 3.7%
AS 72.70 63.57 14.4%
Cinco Dias 19.34 19.26 0.4%
Regional Press* 12.18 18.78 (35.2%)
Magazines 26.88 26.00 3.4%Others 4.60 3.19 44.3%
International Press 7.49 8.55 (12.3%)
Consolidation adjustments (3.93) (2.78) (41.3%)
Radio 320.97 295.18 8.7%
Radio in Spain 213.49 195.19 9.4%International Radio 82.41 74.20 11.1%Music 28.45 26.69 6.6%Consolidation adjustments (3.38) (0.90) ---
Education - Publishing 484.94 428.67 13.1%
Audiovisual 1,887.15 1,269.64 48.6%
Sogecable 1,633.37 1,201.67 35.9%
Digital+ 1,346.04 971.01 38.6%
Cuatro 287.33 230.67 24.6%
Media Capital** 185.19 --- ---
Local TV 42.66 53.07 (19.6%)
Plural 49.89 29.58 68.6%
Consolidation adjustments (23.96) (14.69) (63.2%)
Digital 34.31 30.40 12.9%
Other Expenses 125.93 186.45 (32.5%)
Printing --- 80.01 ---Distribution 37.63 30.47 23.5%GDM 17.34 16.66 4.1%
Others*** 70.96 59.32 19.6%
Consolidation adjustments (127.97) (121.49) (5.3%)
TOTAL 3,176.10 2,525.81 25.7%
* Regional Press (El Correo de Andalucía and Diario Jaén) contributes to the operating expenses until June, 2007.
** In order to adapt Media Capital´s figures to the Group´s accounting policies, this figure includes the amount coming
from the Outdoor segment up to the date of the sale, classified in Media Capital´s profit and loss account as held for sale.
*** Others include mainly the activities from Real Estate and Headquarters. Provisions for owned companies are not included.
JANUARY - DECEMBER
January- December 2007 Results
www.prisa.es // Investor Relations Information
26
Appendix II.III.
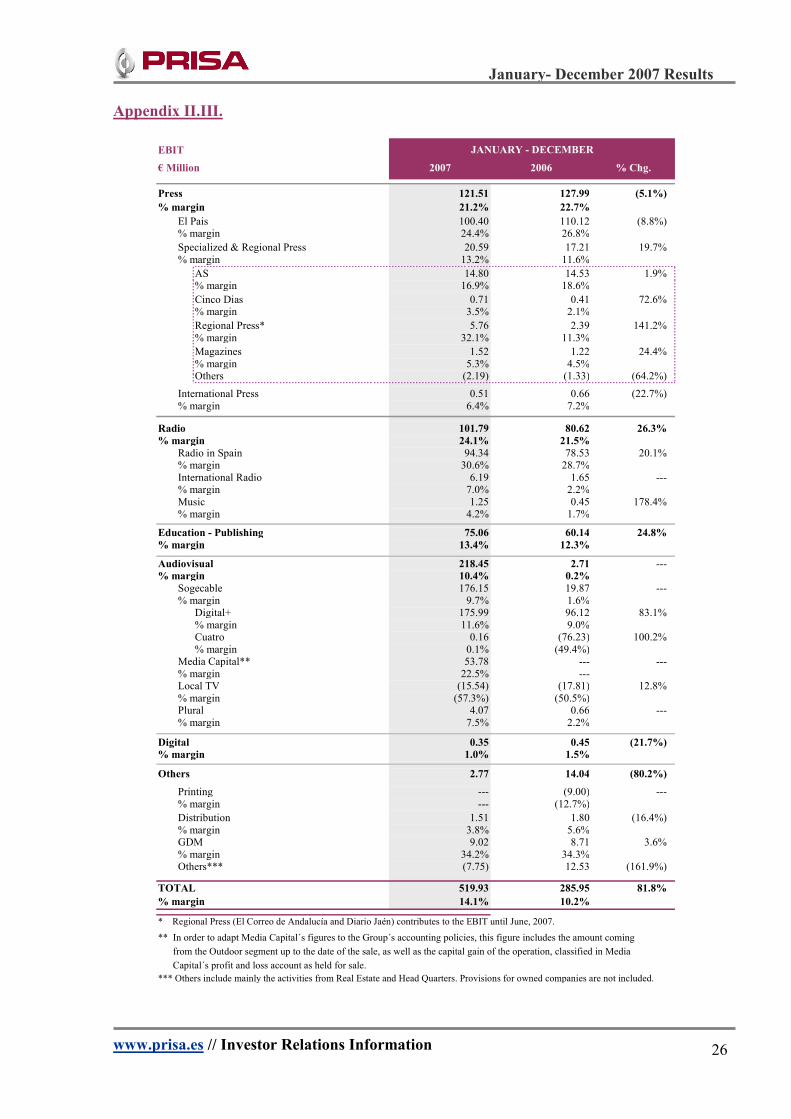
EBIT
€ Million 2007 2006 % Chg.
Press 121.51 127.99 (5.1%)
% margin 21.2% 22.7%
El Pais 100.40 110.12 (8.8%)% margin 24.4% 26.8%
Specialized & Regional Press 20.59 17.21 19.7%% margin 13.2% 11.6%
AS 14.80 14.53 1.9%% margin 16.9% 18.6%
Cinco Dias 0.71 0.41 72.6%% margin 3.5% 2.1%
Regional Press* 5.76 2.39 141.2%% margin 32.1% 11.3%
Magazines 1.52 1.22 24.4%% margin 5.3% 4.5%Others (2.19) (1.33) (64.2%)
International Press 0.51 0.66 (22.7%)% margin 6.4% 7.2%
Radio 101.79 80.62 26.3%
% margin 24.1% 21.5%
Radio in Spain 94.34 78.53 20.1%% margin 30.6% 28.7%International Radio 6.19 1.65 ---% margin 7.0% 2.2%Music 1.25 0.45 178.4%% margin 4.2% 1.7%
Education - Publishing 75.06 60.14 24.8%
% margin 13.4% 12.3%
Audiovisual 218.45 2.71 ---% margin 10.4% 0.2%
Sogecable 176.15 19.87 ---% margin 9.7% 1.6%
Digital+ 175.99 96.12 83.1%% margin 11.6% 9.0%Cuatro 0.16 (76.23) 100.2%% margin 0.1% (49.4%)
Media Capital** 53.78 --- ---% margin 22.5% ---Local TV (15.54) (17.81) 12.8%% margin (57.3%) (50.5%)Plural 4.07 0.66 ---% margin 7.5% 2.2%
Digital 0.35 0.45 (21.7%)
% margin 1.0% 1.5%
Others 2.77 14.04 (80.2%)
Printing --- (9.00) ---% margin --- (12.7%)
Distribution 1.51 1.80 (16.4%)% margin 3.8% 5.6%GDM 9.02 8.71 3.6%% margin 34.2% 34.3%Others*** (7.75) 12.53 (161.9%)
TOTAL 519.93 285.95 81.8%
% margin 14.1% 10.2%
* Regional Press (El Correo de Andalucía and Diario Jaén) contributes to the EBIT until June, 2007.
** In order to adapt Media Capital´s figures to the Group´s accounting policies, this figure includes the amount coming
from the Outdoor segment up to the date of the sale, as well as the capital gain of the operation, classified in Media
Capital´s profit and loss account as held for sale.
*** Others include mainly the activities from Real Estate and Head Quarters. Provisions for owned companies are not included.
JANUARY - DECEMBER
January- December 2007 Results
www.prisa.es // Investor Relations Information
27
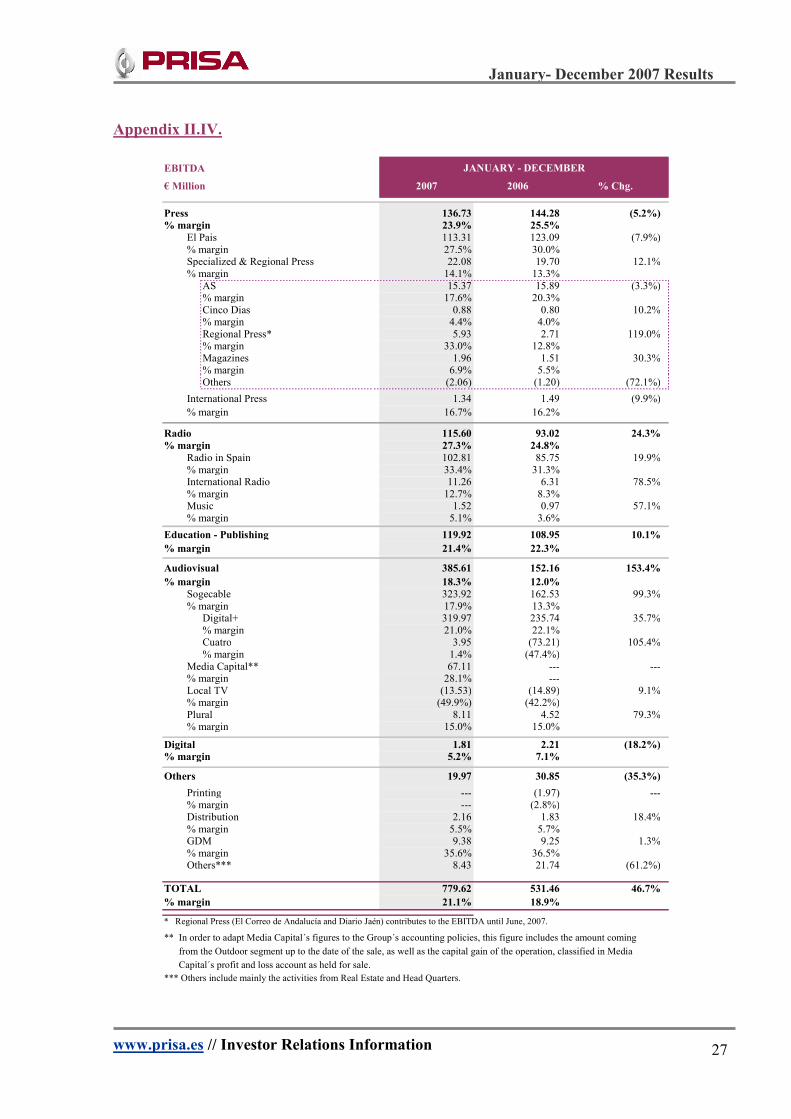
Appendix II.IV.
EBITDA
€ Million 2007 2006 % Chg.
Press 136.73 144.28 (5.2%)
% margin 23.9% 25.5%
El Pais 113.31 123.09 (7.9%)% margin 27.5% 30.0%Specialized & Regional Press 22.08 19.70 12.1%% margin 14.1% 13.3%
AS 15.37 15.89 (3.3%)% margin 17.6% 20.3%Cinco Dias 0.88 0.80 10.2%% margin 4.4% 4.0%Regional Press* 5.93 2.71 119.0%% margin 33.0% 12.8%Magazines 1.96 1.51 30.3%% margin 6.9% 5.5%Others (2.06) (1.20) (72.1%)
International Press 1.34 1.49 (9.9%)
% margin 16.7% 16.2%
Radio 115.60 93.02 24.3%
% margin 27.3% 24.8%
Radio in Spain 102.81 85.75 19.9%% margin 33.4% 31.3%International Radio 11.26 6.31 78.5%% margin 12.7% 8.3%Music 1.52 0.97 57.1%% margin 5.1% 3.6%
Education - Publishing 119.92 108.95 10.1%
% margin 21.4% 22.3%
Audiovisual 385.61 152.16 153.4%
% margin 18.3% 12.0%
Sogecable 323.92 162.53 99.3%% margin 17.9% 13.3%
Digital+ 319.97 235.74 35.7%% margin 21.0% 22.1%Cuatro 3.95 (73.21) 105.4%% margin 1.4% (47.4%)
Media Capital** 67.11 --- ---% margin 28.1% ---Local TV (13.53) (14.89) 9.1%% margin (49.9%) (42.2%)Plural 8.11 4.52 79.3%% margin 15.0% 15.0%
Digital 1.81 2.21 (18.2%)
% margin 5.2% 7.1%
Others 19.97 30.85 (35.3%)
Printing --- (1.97) ---% margin --- (2.8%)Distribution 2.16 1.83 18.4%% margin 5.5% 5.7%GDM 9.38 9.25 1.3%% margin 35.6% 36.5%Others*** 8.43 21.74 (61.2%)
TOTAL 779.62 531.46 46.7%
% margin 21.1% 18.9%
* Regional Press (El Correo de Andalucía and Diario Jaén) contributes to the EBITDA until June, 2007.
** In order to adapt Media Capital´s figures to the Group´s accounting policies, this figure includes the amount coming
from the Outdoor segment up to the date of the sale, as well as the capital gain of the operation, classified in Media
Capital´s profit and loss account as held for sale.
*** Others include mainly the activities from Real Estate and Head Quarters.
JANUARY - DECEMBER

January- December 2007 Results
www.prisa.es // Investor Relations Information
28
Appendix III.I
ADVERTISING REVENUES
€ Million Q1 Q2 Q3 Q4 Q1 Q2 Q3 Q4 Q1 Q2 Q3 Q4
Press 64.87 82.64 46.79 78.19 58.03 76.91 46.77 77.45 11.8% 7.5% 0.0% 0.9%--- --- --- ---
El Pais 52.42 65.87 37.95 61.98 46.03 60.58 36.42 62.11 13.9% 8.7% 4.2% (0.2%)
Specialized & Regional Press 12.54 15.73 7.75 15.75 11.81 15.53 9.17 13.87 6.1% 1.3% (15.5%) 13.5%
AS 4.83 5.64 3.51 7.70 4.11 6.13 3.80 4.88 17.3% (8.1%) (7.6%) 57.8%
Cinco Días 3.17 3.75 1.72 3.09 2.97 3.20 1.60 3.22 6.9% 17.0% 7.2% (4.2%)
Regional Press 2.69 3.62 0.79 1.59 2.95 3.82 2.56 3.14 (8.8%) (5.2%) (69.3%) (49.3%)
Magazines 1.87 2.74 1.74 3.38 1.79 2.32 1.21 2.59 4.2% 18.1% 43.2% 30.3%
Others (0.02) (0.01) (0.01) (0.01) (0.01) 0.06 (0.00) 0.04 (80.0%) (123.7%) (50.4%) (113.8%)
International Press 0.93 1.02 1.11 0.92 0.90 0.96 1.25 1.81 3.9% 6.0% (11.2%) (49.1%)
Consolidation adjustments (1.03) 0.02 (0.01) (0.47) (0.71) (0.16) (0.06) (0.34) (44.2%) 115.5% 77.2% (37.8%)--- --- --- ------ --- --- ---
Radio 78.77 98.19 74.88 102.01 68.16 88.13 67.05 95.72 15.6% 11.4% 11.7% 6.6%
Radio in Spain 64.13 79.12 52.44 74.87 53.32 70.35 50.56 69.42 20.3% 12.5% 3.7% 7.8%
International Radio 14.14 19.09 22.44 27.15 14.85 17.79 16.51 19.62 (4.8%) 7.3% 35.9% 38.3%
Music 0.50 0.00 0.00 0.00 0.00 0.00 0.00 6.67 --- --- --- (100.0%)
Consolidation adjustments 0.00 (0.01) (0.01) (0.00) (0.01) (0.00) (0.02) (0.00) 100.0% --- 61.4% (4.3%)--- --- --- ------ --- --- ---
Audiovisual 98.66 151.69 94.73 146.62 4.48 67.46 42.22 72.85 --- 124.9% 124.4% 101.3%
Sogecable 65.08 92.45 51.55 92.12 --- 62.24 38.43 66.24 --- 48.5% 34.1% 39.1%
Cuatro 58.09 84.36 46.17 84.08 --- 54.10 33.23 57.60 --- 55.9% 38.9% 46.0%
Digital+ 6.99 8.09 5.37 8.04 --- 8.10 5.24 8.64 --- (0.1%) 2.6% (6.9%)
Media Capital 28.47 53.45 39.17 47.84 --- --- --- --- --- --- --- ---
Local TV 4.66 5.41 3.71 6.27 4.48 5.22 3.79 6.48 4.1% 3.6% (2.0%) (3.3%)
Plural 0.44 0.38 0.31 0.39 0.00 0.00 0.00 0.13 --- --- --- 193.6%--- --- --- ------ --- --- ---Digital 2.64 4.00 3.50 5.66 1.78 2.88 2.04 3.96 48.7% 39.0% 71.4% 43.0%--- --- --- ---
Others 0.22 0.11 0.42 (0.65) 0.11 0.06 0.23 0.20 93.8% 97.9% 84.5% ---0.00 0.00 0.00 0.00 0.00 0.00 0.00 --- --- --- ------ --- --- ---
Consolidation adjustments (2.17) (4.05) (0.88) (4.58) (1.74) (4.31) (0.24) (4.99) (24.7%) 6.0% --- 8.2%--- --- --- ---
TOTAL 242.98 332.60 219.44 327.25 130.82 231.12 158.07 245.19 85.7% 43.9% 38.8% 33.5%
% Chg.2007 2006

January- December 2007 Results
www.prisa.es // Investor Relations Information
29
OPERATING REVENUES
€ Million Q1 Q2 Q3 Q4 Q1 Q2 Q3 Q4 Q1 Q2 Q3 Q4
Press 134.87 163.89 120.37 153.14 146.18 158.36 113.68 146.72 (7.7%) 3.5% 5.9% 4.4%
El Pais 96.71 116.00 85.44 113.75 110.55 115.92 79.34 104.68 (12.5%) 0.1% 7.7% 8.7%
Advertising 52.42 65.87 37.95 61.98 46.03 60.58 36.42 62.11 13.9% 8.7% 4.2% (0.2%)Circulation 30.70 31.75 31.41 32.38 33.40 31.05 30.08 30.51 (8.1%) 2.3% 4.4% 6.1%Add-ons 12.90 17.77 15.36 18.47 30.57 23.72 12.28 11.40 (57.8%) (25.1%) 25.0% 62.1%
Others 0.69 0.61 0.73 0.92 0.56 0.58 0.56 0.67 22.8% 5.9% 29.3% 37.9%
Specialized & Regional Press 37.53 46.49 33.38 38.89 34.53 40.88 32.48 40.13 8.7% 13.7% 2.8% (3.1%)AS 20.06 23.07 22.09 22.27 17.44 20.72 19.09 20.84 15.0% 11.3% 15.7% 6.9%Cinco Días 5.44 5.83 3.63 5.16 5.49 5.52 3.49 5.18 (1.0%) 5.7% 4.0% (0.4%)
Regional Press 5.02 9.23 1.47 2.23 5.31 6.45 4.59 4.82 (5.6%) 43.2% (68.1%) (53.8%)
Magazines 6.61 7.95 5.45 8.39 6.16 8.01 4.99 8.06 7.2% (0.7%) 9.3% 4.2%
Others 0.41 0.42 0.74 0.84 0.12 0.19 0.32 1.23 --- 125.3% 134.3% (32.1%)
International Press 2.32 1.91 2.03 1.74 1.85 2.14 2.33 2.88 25.5% (10.7%) (12.8%) (39.7%)--- --- --- ---Consolidation Adjustments (1.69) (0.52) (0.48) (1.23) (0.75) (0.58) (0.47) (0.98) (124.9%) 10.0% (2.0%) (26.1%)--- --- --- ---
--- --- --- ---
Radio 89.80 114.59 98.33 120.03 78.65 104.36 84.19 108.61 14.2% 9.8% 16.8% 10.5%
Radio in Spain 72.91 88.13 59.67 87.12 60.60 77.66 57.43 78.03 20.3% 13.5% 3.9% 11.6%International Radio 14.93 19.98 23.35 30.33 15.43 18.43 20.56 21.42 (3.2%) 8.4% 13.6% 41.6%Music 2.79 7.61 15.72 3.59 2.69 8.30 6.38 9.77 3.6% (8.3%) 146.4% (63.3%)Consolidation Adjustments (0.83) (1.14) (0.40) (1.01) (0.07) (0.03) (0.18) (0.61) --- --- (118.5%) (64.7%)--- --- --- ------ --- --- ---
Education - Publishing 124.01 107.19 185.24 143.56 116.72 109.00 160.06 103.03 6.2% (1.7%) 15.7% 39.3%--- --- --- ------ --- --- ---Audiovisual 527.20 549.98 424.00 604.42 10.14 429.86 351.79 480.56 --- 27.9% 20.5% 25.8%--- --- --- ---
Sogecable 478.79 471.93 359.85 498.95 --- 420.85 336.82 463.87 --- 12.1% 6.8% 7.6%
Digital + 418.09 383.93 310.02 410.00 --- 364.30 301.02 401.81 --- 5.4% 3.0% 2.0%
Cuatro 60.70 88.01 49.83 88.95 --- 56.60 35.75 62.07 --- 55.5% 39.4% 43.3%
Media Capital 35.55 64.33 53.38 85.71 --- --- --- --- --- --- --- ---
Local TV 5.97 7.34 5.09 8.71 8.52 8.91 6.36 11.47 (29.9%) (17.6%) (20.0%) (24.0%)
Plural 11.68 12.93 10.10 19.25 3.00 4.13 11.56 11.55 --- --- (12.6%) 66.6%
Consolidation Adjustments (4.79) (6.55) (4.42) (8.20) (1.38) (4.02) (2.95) (6.34) --- (63.1%) (49.9%) (29.3%)0.00 0.00 0.00 0.00 0.00 0.00 0.00 0.00 --- --- --- ---
Digital 9.02 7.83 7.42 10.40 5.98 8.30 6.29 10.29 51.0% (5.8%) 18.0% 1.1%0.00 0.00 0.00 0.00 0.00 0.00 0.00 0.00 --- --- --- ------ --- --- ---Other Revenues 44.64 50.05 42.15 (6.98) 41.43 64.82 39.62 58.73 7.7% (22.8%) 6.4% (111.9%)
Printing 16.36 16.33 12.98 (45.68) 18.03 19.49 15.48 18.01 (9.2%) (16.2%) (16.1%) ---Distribution 8.18 10.26 9.32 11.37 7.55 8.03 7.27 9.42 8.3% 27.7% 28.2% 20.8%GDM 6.08 6.74 5.11 8.44 5.52 6.82 5.11 7.92 10.2% (1.1%) (0.1%) 6.5%Others 14.02 16.72 14.74 18.89 10.34 30.48 11.76 23.39 35.6% (45.2%) 25.3% (19.2%)
Consolidation adjustments (35.51) (39.21) (29.94) (24.47) (23.49) (37.37) (27.17) (37.56) (51.1%) (4.9%) (10.2%) 34.9%0.00 0.00 0.00 0.00 0.00 0.00 0.00 0.00 --- --- --- ------ --- --- ---
TOTAL 894.03 954.32 847.57 1,000.10 375.60 837.33 728.45 870.38 138.0% 14.0% 16.4% 14.9%
2007 2006 %Chg.Appendix III.II.

January- December 2007 Results
www.prisa.es // Investor Relations Information
30
Appendix III.III
OPERATING EXPENSES
€ Million Q1 Q2 Q3 Q4 Q1 Q2 Q3 Q4 Q1 Q2 Q3 Q4
Press 102.54 124.54 106.03 117.66 108.38 118.18 93.46 116.92 (5.4%) 5.4% 13.4% 0.6%--- --- --- ---
El Pais 67.28 85.60 74.33 84.28 74.85 80.93 62.67 81.93 (10.1%) 5.8% 18.6% 2.9%
Prensa Especializada y RegionalSpecialized & Regional Press 34.89 37.72 30.37 32.72 32.41 35.80 29.20 33.39 7.6% 5.4% 4.0% (2.0%)
AS 17.49 19.42 17.61 18.18 15.26 16.94 14.03 17.34 14.6% 14.7% 25.5% 4.9%
Cinco Dias 5.13 5.07 4.34 4.79 5.26 5.05 4.30 4.65 (2.3%) 0.4% 1.0% 3.0%
Regional Press 4.75 4.76 1.28 1.38 5.39 5.67 4.95 2.78 (11.8%) (16.1%) (74.1%) (50.3%)
Magazines 6.51 7.48 5.68 7.21 6.04 7.62 5.23 7.11 7.8% (1.8%) 8.5% 1.4%Others 1.01 0.99 1.45 1.15 0.47 0.52 0.68 1.51 114.4% 88.7% 112.6% (23.7%)0.00 0.00 0.00 0.00 0.00 0.00 0.00 0.00 --- --- --- ---
International Press 2.06 1.74 1.80 1.89 1.87 2.03 2.07 2.58 10.4% (14.4%) (12.8%) (26.8%)
Consolidation adjustments (1.69) (0.52) (0.48) (1.23) (0.75) (0.58) (0.47) (0.98) (124.9%) 10.0% (2.0%) (26.1%)
Radio 73.56 81.72 83.20 82.49 67.64 77.61 69.52 80.42 8.7% 5.3% 19.7% 2.6%
Radio in Spain 52.62 55.81 47.94 57.12 46.69 50.91 45.36 52.24 12.7% 9.6% 5.7% 9.4%International Radio 18.83 19.56 21.48 22.55 17.87 18.67 18.13 19.53 5.4% 4.7% 18.4% 15.5%Music 2.93 7.50 14.19 3.84 3.16 8.07 6.21 9.27 (7.2%) (7.0%) 128.6% (58.6%)Consolidation adjustments (0.83) (1.14) (0.40) (1.01) (0.07) (0.03) (0.19) (0.61) --- --- (118.5%) (64.7%)
Education - Publishing 102.81 107.46 135.84 138.83 100.58 98.64 118.28 111.17 2.2% 8.9% 14.8% 24.9%
Audiovisual 502.80 466.25 382.70 535.40 16.58 420.67 354.29 478.11 --- 10.8% 8.0% 12.0%
Sogecable 455.66 399.82 320.21 457.68 --- 405.48 336.54 459.66 --- (1.4%) (4.9%) (0.4%)
Digital+ 387.19 327.24 257.03 374.59 --- 327.50 267.46 376.05 --- (0.1%) (3.9%) (0.4%)
Cuatro 68.47 72.59 63.19 83.09 --- 78.00 69.05 83.61 --- (6.9%) (8.5%) (0.6%)
Media Capital 29.97 49.03 47.74 58.46 --- --- --- --- --- --- ---- ----
Local TV 10.70 11.36 9.35 11.25 14.15 14.27 10.82 13.83 (24.4%) (20.4%) (13.6%) (18.7%)
Plural 11.27 12.58 9.82 16.22 3.81 4.93 9.88 10.96 195.5% 155.2% (0.6%) 48.0%
Consolidation adjustments (4.79) (6.55) (4.42) (8.20) (1.38) (4.02) (2.95) (6.34) --- (63.2%) (49.8%) (29.3%)
Digital 10.34 7.99 7.66 8.32 6.33 7.89 6.56 9.62 63.4% 1.3% 16.7% (13.5%)
Other Expenses 46.62 51.10 45.49 (17.29) 44.35 47.15 44.53 50.42 5.1% 8.4% 2.2% (134.3%)
Printing 17.87 17.10 15.59 (50.56) 19.36 20.66 18.79 21.20 (7.7%) (17.2%) (17.1%) ---Distribution 7.93 9.83 9.16 10.71 7.19 7.61 7.28 8.39 10.4% 29.2% 25.8% 27.6%GDM 4.56 4.32 3.92 4.54 4.13 4.12 3.95 4.45 10.3% 4.8% (0.8%) 2.0%
Otros *Others 16.26 19.86 16.82 18.02 13.68 14.77 14.50 16.38 18.9% 34.5% 16.0% 10.0%
Consolidation adjustments (35.59) (39.65) (27.77) (24.96) (23.38) (37.18) (26.72) (34.20) (52.3%) (6.6%) (3.9%) 27.0%
TOTAL 803.08 799.41 733.15 840.46 320.49 732.95 659.91 812.46 150.6% 9.1% 11.1% 3.4%
2007 2006 %Chg.
January- December 2007 Results
www.prisa.es // Investor Relations Information
31
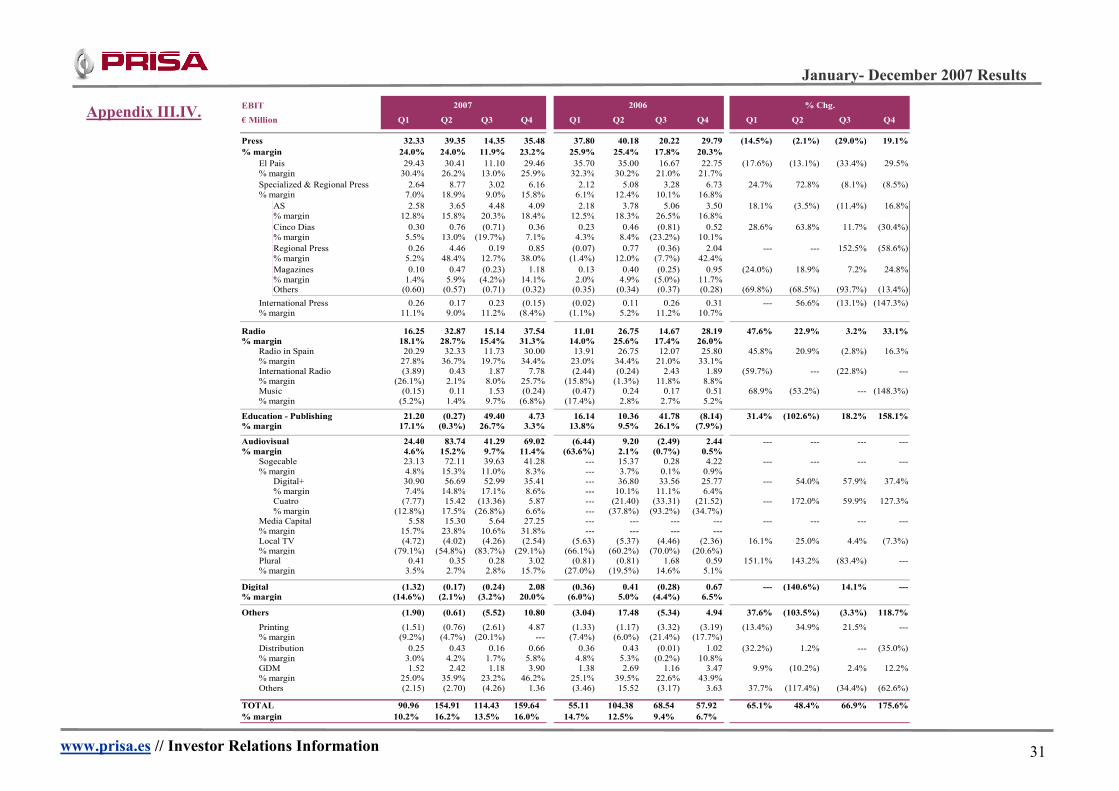
EBIT
€ Million Q1 Q2 Q3 Q4 Q1 Q2 Q3 Q4 Q1 Q2 Q3 Q4
Press 32.33 39.35 14.35 35.48 37.80 40.18 20.22 29.79 (14.5%) (2.1%) (29.0%) 19.1%
% margin 24.0% 24.0% 11.9% 23.2% 25.9% 25.4% 17.8% 20.3%
El Pais 29.43 30.41 11.10 29.46 35.70 35.00 16.67 22.75 (17.6%) (13.1%) (33.4%) 29.5%% margin 30.4% 26.2% 13.0% 25.9% 32.3% 30.2% 21.0% 21.7%
Specialized & Regional Press 2.64 8.77 3.02 6.16 2.12 5.08 3.28 6.73 24.7% 72.8% (8.1%) (8.5%)% margin 7.0% 18.9% 9.0% 15.8% 6.1% 12.4% 10.1% 16.8%
AS 2.58 3.65 4.48 4.09 2.18 3.78 5.06 3.50 18.1% (3.5%) (11.4%) 16.8%% margin 12.8% 15.8% 20.3% 18.4% 12.5% 18.3% 26.5% 16.8%
Cinco Dias 0.30 0.76 (0.71) 0.36 0.23 0.46 (0.81) 0.52 28.6% 63.8% 11.7% (30.4%)% margin 5.5% 13.0% (19.7%) 7.1% 4.3% 8.4% (23.2%) 10.1%
Regional Press 0.26 4.46 0.19 0.85 (0.07) 0.77 (0.36) 2.04 --- --- 152.5% (58.6%)% margin 5.2% 48.4% 12.7% 38.0% (1.4%) 12.0% (7.7%) 42.4%
Magazines 0.10 0.47 (0.23) 1.18 0.13 0.40 (0.25) 0.95 (24.0%) 18.9% 7.2% 24.8%% margin 1.4% 5.9% (4.2%) 14.1% 2.0% 4.9% (5.0%) 11.7%Others (0.60) (0.57) (0.71) (0.32) (0.35) (0.34) (0.37) (0.28) (69.8%) (68.5%) (93.7%) (13.4%)
International Press 0.26 0.17 0.23 (0.15) (0.02) 0.11 0.26 0.31 --- 56.6% (13.1%) (147.3%)% margin 11.1% 9.0% 11.2% (8.4%) (1.1%) 5.2% 11.2% 10.7%
Radio 16.25 32.87 15.14 37.54 11.01 26.75 14.67 28.19 47.6% 22.9% 3.2% 33.1%
% margin 18.1% 28.7% 15.4% 31.3% 14.0% 25.6% 17.4% 26.0%
Radio in Spain 20.29 32.33 11.73 30.00 13.91 26.75 12.07 25.80 45.8% 20.9% (2.8%) 16.3%% margin 27.8% 36.7% 19.7% 34.4% 23.0% 34.4% 21.0% 33.1%International Radio (3.89) 0.43 1.87 7.78 (2.44) (0.24) 2.43 1.89 (59.7%) --- (22.8%) ---% margin (26.1%) 2.1% 8.0% 25.7% (15.8%) (1.3%) 11.8% 8.8%Music (0.15) 0.11 1.53 (0.24) (0.47) 0.24 0.17 0.51 68.9% (53.2%) --- (148.3%)% margin (5.2%) 1.4% 9.7% (6.8%) (17.4%) 2.8% 2.7% 5.2%
Education - Publishing 21.20 (0.27) 49.40 4.73 16.14 10.36 41.78 (8.14) 31.4% (102.6%) 18.2% 158.1%
% margin 17.1% (0.3%) 26.7% 3.3% 13.8% 9.5% 26.1% (7.9%)
Audiovisual 24.40 83.74 41.29 69.02 (6.44) 9.20 (2.49) 2.44 --- --- --- ---% margin 4.6% 15.2% 9.7% 11.4% (63.6%) 2.1% (0.7%) 0.5%
Sogecable 23.13 72.11 39.63 41.28 --- 15.37 0.28 4.22 --- --- --- ---% margin 4.8% 15.3% 11.0% 8.3% --- 3.7% 0.1% 0.9%
Digital+ 30.90 56.69 52.99 35.41 --- 36.80 33.56 25.77 --- 54.0% 57.9% 37.4%% margin 7.4% 14.8% 17.1% 8.6% --- 10.1% 11.1% 6.4%Cuatro (7.77) 15.42 (13.36) 5.87 --- (21.40) (33.31) (21.52) --- 172.0% 59.9% 127.3%% margin (12.8%) 17.5% (26.8%) 6.6% --- (37.8%) (93.2%) (34.7%)
Media Capital 5.58 15.30 5.64 27.25 --- --- --- --- --- --- --- ---% margin 15.7% 23.8% 10.6% 31.8% --- --- --- ---Local TV (4.72) (4.02) (4.26) (2.54) (5.63) (5.37) (4.46) (2.36) 16.1% 25.0% 4.4% (7.3%)% margin (79.1%) (54.8%) (83.7%) (29.1%) (66.1%) (60.2%) (70.0%) (20.6%)Plural 0.41 0.35 0.28 3.02 (0.81) (0.81) 1.68 0.59 151.1% 143.2% (83.4%) ---% margin 3.5% 2.7% 2.8% 15.7% (27.0%) (19.5%) 14.6% 5.1%
Digital (1.32) (0.17) (0.24) 2.08 (0.36) 0.41 (0.28) 0.67 --- (140.6%) 14.1% ---
% margin (14.6%) (2.1%) (3.2%) 20.0% (6.0%) 5.0% (4.4%) 6.5%
Others (1.90) (0.61) (5.52) 10.80 (3.04) 17.48 (5.34) 4.94 37.6% (103.5%) (3.3%) 118.7%
Printing (1.51) (0.76) (2.61) 4.87 (1.33) (1.17) (3.32) (3.19) (13.4%) 34.9% 21.5% ---% margin (9.2%) (4.7%) (20.1%) --- (7.4%) (6.0%) (21.4%) (17.7%)
Distribution 0.25 0.43 0.16 0.66 0.36 0.43 (0.01) 1.02 (32.2%) 1.2% --- (35.0%)% margin 3.0% 4.2% 1.7% 5.8% 4.8% 5.3% (0.2%) 10.8%GDM 1.52 2.42 1.18 3.90 1.38 2.69 1.16 3.47 9.9% (10.2%) 2.4% 12.2%% margin 25.0% 35.9% 23.2% 46.2% 25.1% 39.5% 22.6% 43.9%Others (2.15) (2.70) (4.26) 1.36 (3.46) 15.52 (3.17) 3.63 37.7% (117.4%) (34.4%) (62.6%)
TOTAL 90.96 154.91 114.43 159.64 55.11 104.38 68.54 57.92 65.1% 48.4% 66.9% 175.6%
% margin 10.2% 16.2% 13.5% 16.0% 14.7% 12.5% 9.4% 6.7%
2007 2006 % Chg.Appendix III.IV.

January- December 2007 Results
www.prisa.es // Investor Relations Information
32
EBITDA
€ Million Q1 Q2 Q3 Q4 Q1 Q2 Q3 Q4 Q1 Q2 Q3 Q4
Press 35.81 43.00 18.44 39.48 41.45 43.74 23.82 35.28 (13.6%) (1.7%) (22.6%) 11.9%
% margin 26.6% 26.2% 15.3% 25.8% 28.4% 27.6% 21.0% 24.0%
El Pais 32.42 33.46 14.72 32.71 38.70 37.95 19.59 26.84 (16.2%) (11.8%) (24.9%) 21.9%% margin 33.5% 28.8% 17.2% 28.8% 35.0% 32.7% 24.7% 25.6%Specialized & Regional Press 3.01 9.17 3.32 6.57 2.60 5.59 3.84 7.68 16.0% 64.1% (13.5%) (14.4%)% margin 8.0% 19.7% 9.9% 16.9% 7.5% 13.7% 11.8% 19.1%
AS 2.73 3.80 4.62 4.22 2.36 3.97 5.33 4.23 15.5% (4.4%) (13.3%) (0.1%)% margin 13.6% 16.5% 20.9% 19.0% 13.5% 19.2% 27.9% 20.3%Cinco Dias 0.35 0.80 (0.7) 0.41 0.36 0.58 (0.7) 0.56 (4.4%) 37.1% 4.9% (27.4%)% margin 6.3% 13.7% (18.5%) 7.9% 6.6% 10.6% (20.3%) 10.8%Regional Press 0.33 4.55 0.19 0.85 0.02 0.87 (0.3) 2.09 --- --- 169.2% (59.3%)% margin 6.6% 49.3% 13.0% 38.2% 0.3% 13.6% (6.0%) 43.4%Magazines 0.17 0.56 (0.1) 1.38 0.18 0.46 (0.2) 1.05 (2.3%) 20.6% 18.7% 31.6%% margin 2.6% 7.0% (2.7%) 16.4% 2.8% 5.8% (3.6%) 13.0%Others (0.56) (0.54) (0.68) (0.29) (0.32) (0.30) (0.33) (0.25) (78.7%) (76.6%) (103.8%) (15.5%)--- --- --- ---
International Press 0.38 0.37 0.39 0.19 0.16 0.19 0.39 0.75 146.9% 92.6% 2.2% (74.6%)
% margin 16.5% 19.4% 19.4% 11.0% 8.4% 9.0% 16.5% 26.2% --- --- --- ------ --- --- ---
Radio 19.39 36.06 18.55 41.60 14.23 29.82 17.62 31.35 36.3% 20.9% 5.2% 32.7%
% margin 21.6% 31.5% 18.9% 34.7% 18.1% 28.6% 20.9% 28.9%
Radio in Spain 22.30 34.39 13.72 32.40 15.68 28.49 13.88 27.69 42.2% 20.7% (1.1%) 17.0%% margin 30.6% 39.0% 23.0% 37.2% 25.9% 36.7% 24.2% 35.5%International Radio (2.8) 1.52 3.25 9.32 (1.2) 0.99 3.45 3.03 (143.3%) 53.7% (5.7%) ---% margin (18.9%) 7.6% 13.9% 30.7% (7.5%) 5.4% 16.8% 14.2%Music (0.1) 0.15 1.57 (0.1) (0.3) 0.35 0.29 0.63 71.3% (55.3%) --- (118.4%)% margin (3.0%) 2.0% 10.0% (3.2%) (11.0%) 4.2% 4.5% 6.4% --- --- --- ---
Education - Publishing 29.40 12.13 80.75 (2.4) 28.55 21.77 68.68 (10.1) 3.0% (44.3%) 17.6% 76.5%
% margin 23.7% 11.3% 43.6% (1.6%) 24.5% 20.0% 42.9% (9.8%) --- --- --- ------ --- --- ---
Audiovisual 67.84 125.67 80.55 111.55 (4.9) 63.01 37.71 56.38 --- 99.5% 113.6% 97.8%
% margin 12.9% 22.9% 19.0% 18.5% (48.8%) 14.7% 10.7% 11.7%
Sogecable 62.62 109.94 74.47 76.90 --- 67.64 38.94 55.94 --- 62.5% 91.2% 37.5%% margin 13.1% 23.3% 20.7% 15.4% --- 16.1% 11.6% 12.1%
Digital+ 69.34 93.45 86.84 70.34 --- 88.10 71.20 76.44 --- 6.1% 22.0% (8.0%)% margin 16.6% 24.3% 28.0% 17.2% --- 24.2% 23.7% 19.0%Cuatro (6.73) 16.49 (12.37) 6.55 --- (20.50) (32.20) (20.51) --- 180.5% 61.6% 131.9%% margin (11.1%) 18.7% (24.8%) 7.4% --- (36.2%) (90.1%) (33.0%)
Media Capital 7.54 18.50 8.88 32.19 --- --- --- --- --- --- --- ---
% margin 21.2% 28.8% 16.6% 37.6% --- --- --- ---Local TV (4.12) (3.41) (4.14) (1.85) (4.96) (4.68) (3.78) (1.47) 16.9% 27.1% (9.7%) (25.7%)% margin (69.0%) (46.5%) (81.4%) (21.2%) (58.3%) (52.6%) (59.3%) (12.8%)Plural 1.80 0.65 1.34 4.32 0.02 0.04 2.54 1.92 --- --- (47.5%) 125.4%% margin 15.4% 5.0% 13.2% 22.4% 0.6% 1.1% 22.0% 16.6% --- --- --- ------ --- --- ---
Digital (1.0) 0.22 0.21 2.35 0.13 0.87 0.12 1.09 --- (75.2%) 76.3% 116.5%
% margin (10.8%) 2.7% 2.9% 22.6% 2.2% 10.4% 1.9% 10.6% --- --- --- ------ --- --- ---Others 3.50 6.67 0.95 8.86 0.15 22.62 (1.1) 9.15 --- (70.5%) 188.6% (3.2%)--- --- --- ---
Printing 0.38 0.75 (0.88) (0.24) 0.269 0.518 (1.51) (1.25) 39.9% 44.6% 41.8% 80.4%% margin 2.3% 4.6% (6.8%) 0.5% 1.5% 2.7% (9.8%) (6.9%)Distribution 0.39 0.66 0.29 0.83 0.40 0.50 0.07 0.86 (2.3%) 32.3% --- (3.8%)% margin 4.8% 6.4% 3.1% 7.3% 5.3% 6.2% 0.9% 9.2%GDM 1.64 2.49 1.27 3.99 1.50 2.81 1.27 3.68 9.2% (11.5%) 0.1% 8.4%% margin 26.9% 36.9% 24.9% 47.3% 27.1% 41.2% 24.8% 46.5%Others 1.10 2.78 0.27 4.29 (2.0) 18.80 (0.9) 5.86 154.3% (85.2%) 130.1% (26.8%)
TOTAL 154.97 223.74 199.43 201.48 79.57 181.82 146.88 123.20 94.8% 23.1% 35.8% 63.5%
% margin 17.3% 23.4% 23.5% 20.1% 21.2% 21.7% 20.2% 14.2% (18.2%) 8.0% 16.7% 42.3%
2007 2006 % Chg. Appendix III.V.
January- December 2007 Results
www.prisa.es // Investor Relations Information
33
Appendix IV
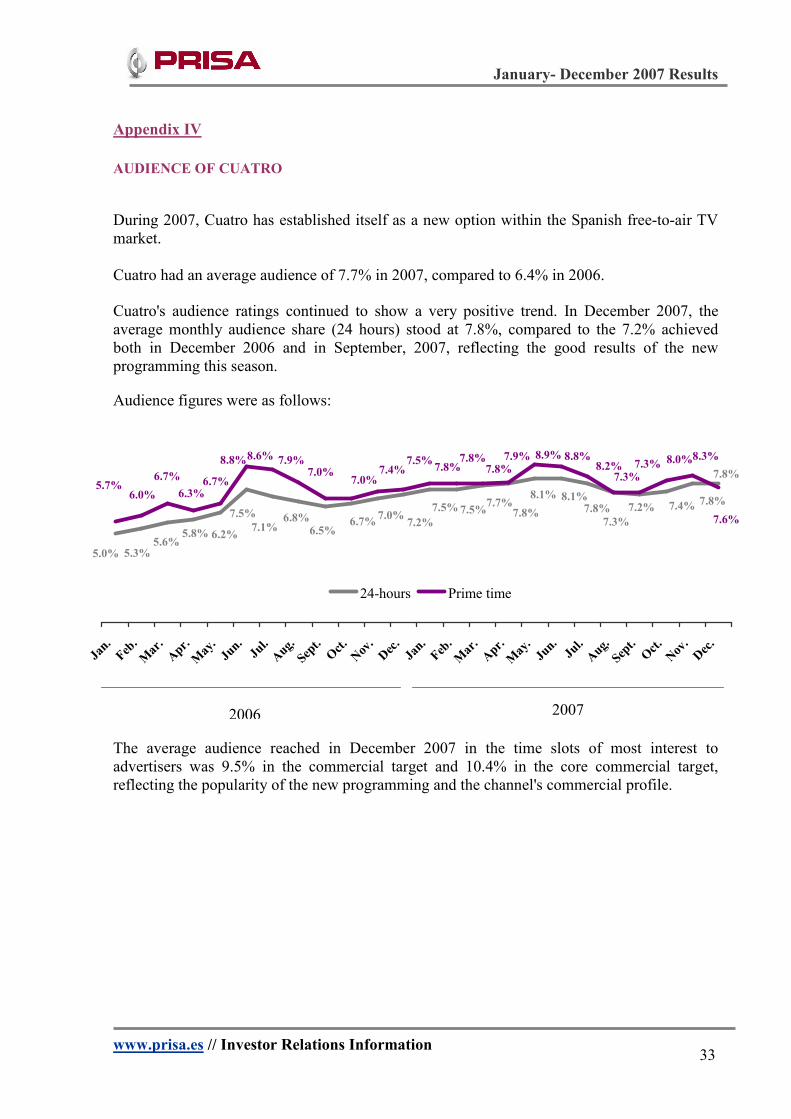
AUDIENCE OF CUATRO
During 2007, Cuatro has established itself as a new option within the Spanish free-to-air TV market. Cuatro had an average audience of 7.7% in 2007, compared to 6.4% in 2006. Cuatro's audience ratings continued to show a very positive trend. In December 2007, the average monthly audience share (24 hours) stood at 7.8%, compared to the 7.2% achieved both in December 2006 and in September, 2007, reflecting the good results of the new programming this season.
Audience figures were as follows:
7.4% 7.8%
7.8%
7.3%
7.2%7.8%8.1%8.1%
7.8%7.7%
7.5%7.5%
7.2%7.0%
6.7%6.5%7.1%
6.8%
5.0% 5.3%5.6%
5.8% 6.2%
7.5%7.6%
8.3%8.0%
7.3%8.2% 7.3%
8.8%8.9%7.9%7.8%
7.8%7.8%
7.5%7.4%
7.0%7.0%
8.6% 7.9%
5.7%6.0%
6.7%
6.3%6.7%
8.8%
Jan.
Feb.
Mar.
Apr.
May.Jun.
Jul.
Aug.
Sept.Oct.
Nov.
Dec.Jan.
Feb.
Mar.
Apr.
May.Jun.
Jul.
Aug.
Sept.Oct.
Nov.
Dec.
24-hours Prime time
The average audience reached in December 2007 in the time slots of most interest to advertisers was 9.5% in the commercial target and 10.4% in the core commercial target, reflecting the popularity of the new programming and the channel's commercial profile.
2006 2007

January- December 2007 Results
www.prisa.es // Investor Relations Information
34
Appendix V
AUDIENCE OF TVI (Portugal)
TVI, the free-to-air TV of Media Capital, maintained its leadership in Portugal, both in 24-hours audience share and in prime time. The evolution of its audience share compared with its main competitors in 2007 is as follows:
30.7%29.8%
28.6% 29.7%34.3%34.6%
4Q 2007 January- Dec. 2007
RTP1
SIC
TVI
28.0%28.3%
28.6%28.3%
37.9%37.9%
4Q 2007 January-Dec. 2007
RTP1
SIC
TVI
24-hours audience share evolution
Prime time audience share evolution

January- December 2007 Results
www.prisa.es // Investor Relations Information
35
Appendix VI
UNIC USERS PRISACOM: Unic users average (in thousands).
During 2007, Prisacom developed a new online Project called ParaSaber.com (www.parasaber.com), a website with more than 20 thematic guides written by experts where users can participate.
Also in 2007, Santillana and Prisacom developed Kalipedia, (www.kalipedia.com), a free content encyclopaedia project.
January-Dec.
2006
January-Dec.
2007
12,234
18,551
(*)Source: internal estimates.
Elpais.com: 3,812 As.com: 3,221 Los40.com: 2,226 Cadenaser.com: 1,220 Cuatro: 765 Plus.es: 567 5dias.com: 423
Elpais.com: 6,996 As.com: 4,228 Los40.com: 2.292 Cadenaser.com: 1,790 Cuatro: 1,326 Plus.es: 753 5dias.com: 686 Kalipedia.com: 402 Parasaber.com: 78
+51.6%
January- December 2007 Results
www.prisa.es // Investor Relations Information
36
For further information:
Grupo Prisa Investor Relations department Gran Vía 32, 6th floor Telephone: +34- 91-330-10-85 Fax: +34- 91-330-10-88 E-mail: [email protected] www.prisa.es