Embed Size (px)
Citation preview
February 23, 2012
Bryce StokesSenior AdvisorCNJV/DOEWashington, DC
Biomass Potential –The Billion-Ton Study Update

2 Managed by UT-Battellefor the U.S. Department of Energy
Oak Ridge National LaboratoryRobert D. Perlack* Laurence M. EatonAnthony F. Turhollow Matt H. LangholtzCraig C. BrandtLynn L. WrightRobin L. GrahamMark E. DowningJacob M. KavkewitzAnna M. Shamey
Idaho National LaboratoryDavid J. Muth J. Richard HessJared M. Abodeely
Kansas State UniversityRichard G. Nelson
State University of New YorkTimothy A. VolkThomas S. BuchholzLawrence P. Abrahamson
Iowa State UniversityRobert P. Anex
CNJV LLC
Bryce J. Stokes*
University of TennesseeChad HellwinckelDaniel De La Torre UgarteDaniel C. YoderJames P. Lyon Timothy G. Rials
USDA Agricultural Research Service
Douglas L. KarlenJane M. F. JohnsonRobert B. MitchellKenneth P. VogelEdward P. RichardJohn TatarkoLarry E. Wagner
University of MinnesotaWilliam BergusonDon E. Riemenschneider
Texas A&M UniversityWilliam L. Rooney
USDA Forest ServiceKenneth E. Skog, Patricia K. Lebow
Dennis P. DykstraMarilyn A. Buford Patrick D. MilesD. Andrew ScottJames H. PerdueRobert B. RummerJamie BarbourJohn A. StanturfDavid B. McKeeverRonald S. ZalesnyEdmund A. Gee
USDA National Institute of Food and Agriculture
P. Daniel Cassidy
USDA Natural Resources Conservation Service
David Lightle
University of IllinoisThomas B. Voigt
Contributors
* Co-leads
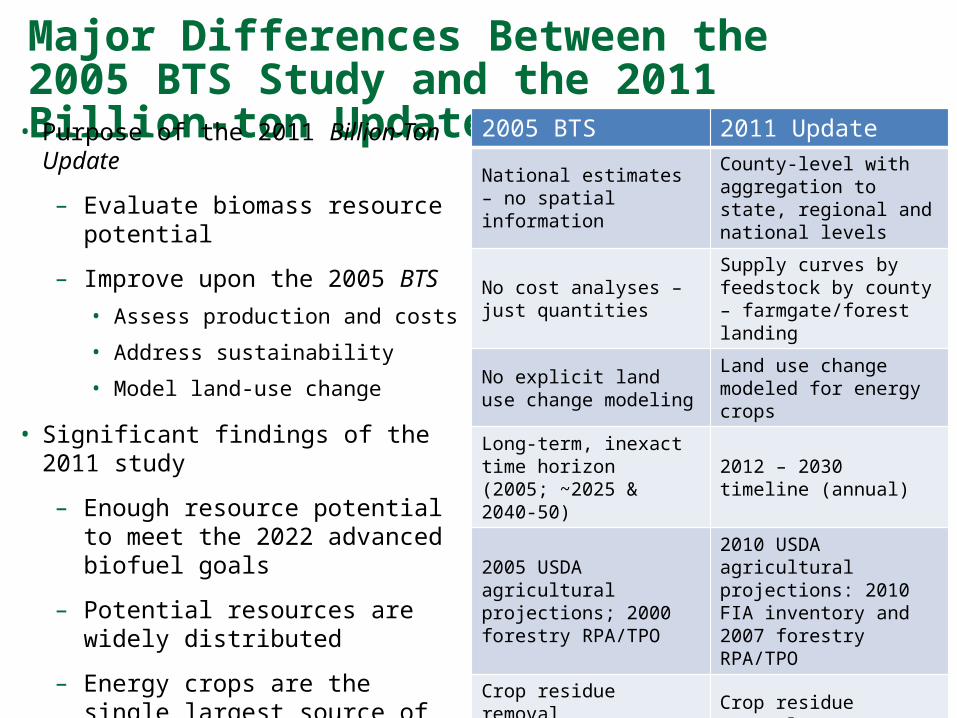
Major Differences Between the 2005 BTS Study and the 2011 Billion-ton Update
• Purpose of the 2011 Billion-Ton Update
– Evaluate biomass resource potential
– Improve upon the 2005 BTS
• Assess production and costs
• Address sustainability
• Model land-use change
• Significant findings of the 2011 study
– Enough resource potential to meet the 2022 advanced biofuel goals
– Potential resources are widely distributed
– Energy crops are the single largest source of new feedstock
2005 BTS 2011 Update
National estimates – no spatial information
County-level with aggregation to state, regional and national levels
No cost analyses – just quantities
Supply curves by feedstock by county – farmgate/forest landing
No explicit land use change modeling
Land use change modeled for energy crops
Long-term, inexact time horizon (2005; ~2025 & 2040-50)
2012 – 2030 timeline (annual)
2005 USDA agricultural projections; 2000 forestry RPA/TPO
2010 USDA agricultural projections: 2010 FIA inventory and 2007 forestry RPA/TPO
Crop residue removal sustainability addressed from national perspective; erosion only
Crop residue removal sustainability modeled at soil level (wind & water erosion, soil C)
Erosion constraints to forest residue collection
Greater erosion plus wetness constraints to forest residue collection

4 Managed by UT-Battellefor the U.S. Department of Energy
• Forest resources
– Logging residues
– Forest thinnings (fuel treatments)
– Other removals and other forestlands
– Conventional wood (new)
– Fuelwood
– Mill residues
– Pulping liquors
– Urban wood residues
• Agricultural resources
– Crop residues
– Grains to biofuels
– Perennial grasses
– Short-rotation woody crops
– Animal manures
– Annual energy crop (new)
– Food/feed processing residues
– MSW and landfill gases
• About one-half of the land in the contiguous U.S.– Forestland resources: 504 million acres of timberland, 91 million acres of other
forestland
– Agricultural resources: 340 million acres cropland, 40 million acres idle cropland, 404 million acres pasture (cropland pasture & permanent pasture)
Biomass Feedstock Resource Base
Combined into composite
EXCLUDES ALGAL FEEDSTOCKS
• 5 Managed by UT-Battellefor the U.S. Department of Energy
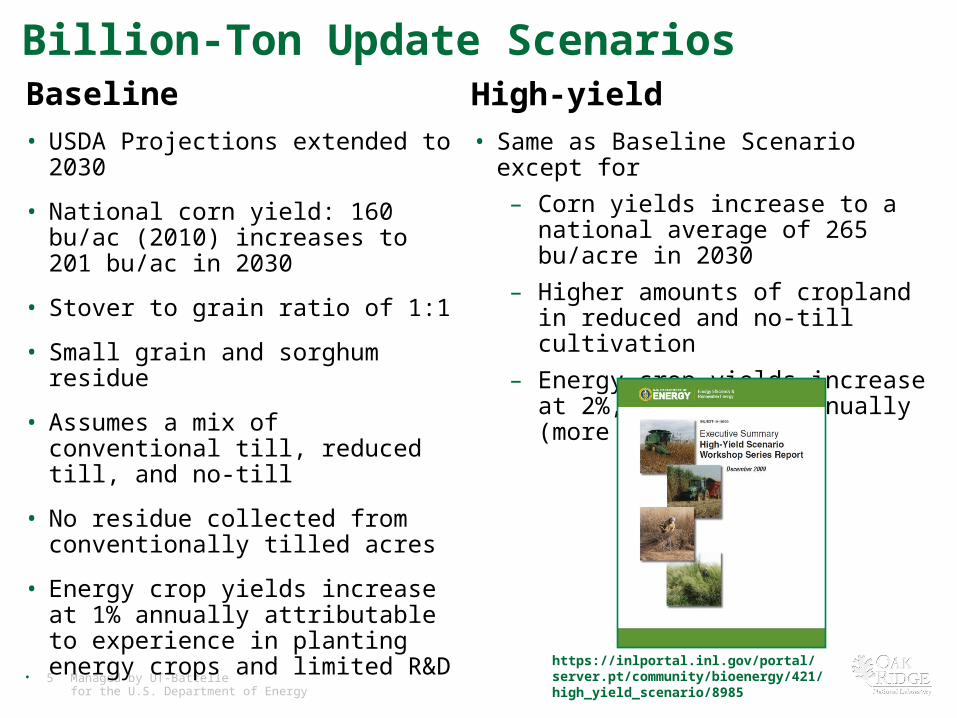
Billion-Ton Update ScenariosBaseline• USDA Projections extended to 2030
• National corn yield: 160 bu/ac (2010) increases to 201 bu/ac in 2030
• Stover to grain ratio of 1:1
• Small grain and sorghum residue
• Assumes a mix of conventional till, reduced till, and no-till
• No residue collected from conventionally tilled acres
• Energy crop yields increase at 1% annually attributable to experience in planting energy crops and limited R&D
High-yield• Same as Baseline Scenario except for
– Corn yields increase to a national average of 265 bu/acre in 2030
– Higher amounts of cropland in reduced and no-till cultivation
– Energy crop yields increase at 2%, 3%, and 4% annually (more R&D)
https://inlportal.inl.gov/portal/server.pt/community/bioenergy/421/high_yield_scenario/8985

• 6 Managed by UT-Battellefor the U.S. Department of Energy
Approach to Supply Curve Estimation• Focus on major primary feedstocks• Currently used and potential feedstocks • Farmgate or roadside analysis – no losses• POLYSYS (Econ model) for ag residues and energy crops
– USDA data – USDA projections, Census, NASS, extended to 2030– Sustainability – erosion, soil carbon, BMPs in costs– Costs – Grower payments, production costs for energy crops,
collection /harvest based on INL and ORNL modeling
• Forestland resources separate– Cost-quantity analysis used to estimate supply curves– USDA/FS data – Forest Inventory Analysis, Timber Product Output,
Resource Planning Act– Sustainability – roadless areas, steep and wet sites, road building,
biomass retention, best management practices in costs– Costs – stumpage, FS FRCS model (Fuel Reduction Cost Simulator)
• Secondary processing residues and tertiary wastes estimated using technical coefficients
• 7 Managed by UT-Battellefor the U.S. Department of Energy
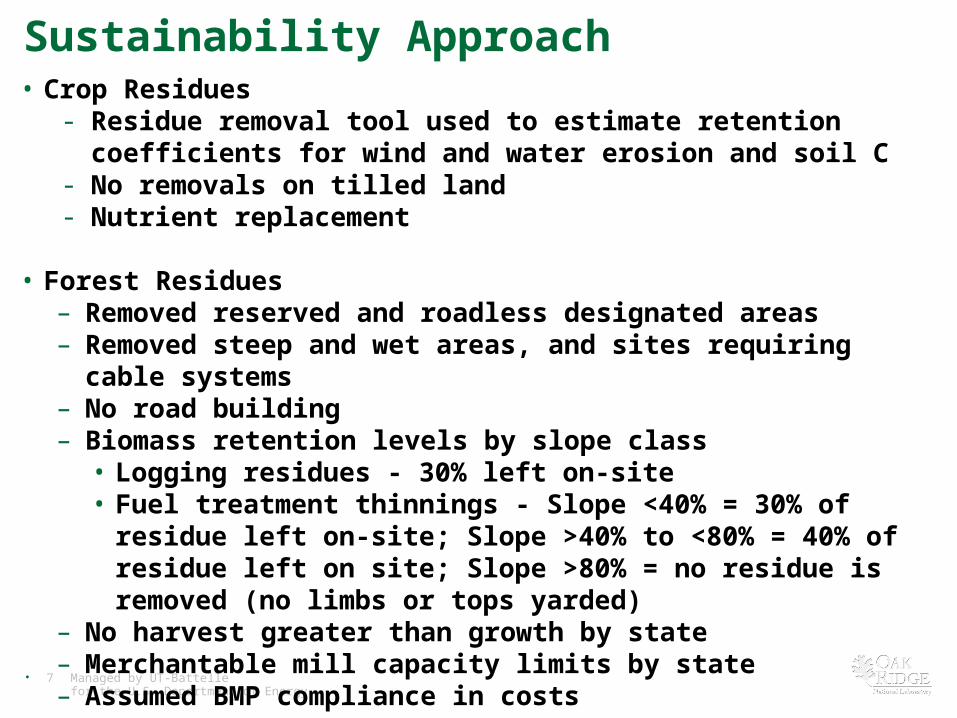
Sustainability Approach• Crop Residues
- Residue removal tool used to estimate retention coefficients for wind and water erosion and soil C
- No removals on tilled land- Nutrient replacement
• Forest Residues– Removed reserved and roadless designated areas– Removed steep and wet areas, and sites requiring cable systems– No road building– Biomass retention levels by slope class
• Logging residues - 30% left on-site• Fuel treatment thinnings - Slope <40% = 30% of residue left on-
site; Slope >40% to <80% = 40% of residue left on site; Slope >80% = no residue is removed (no limbs or tops yarded)
– No harvest greater than growth by state– Merchantable mill capacity limits by state– Assumed BMP compliance in costs
• 8 Managed by UT-Battellefor the U.S. Department of Energy
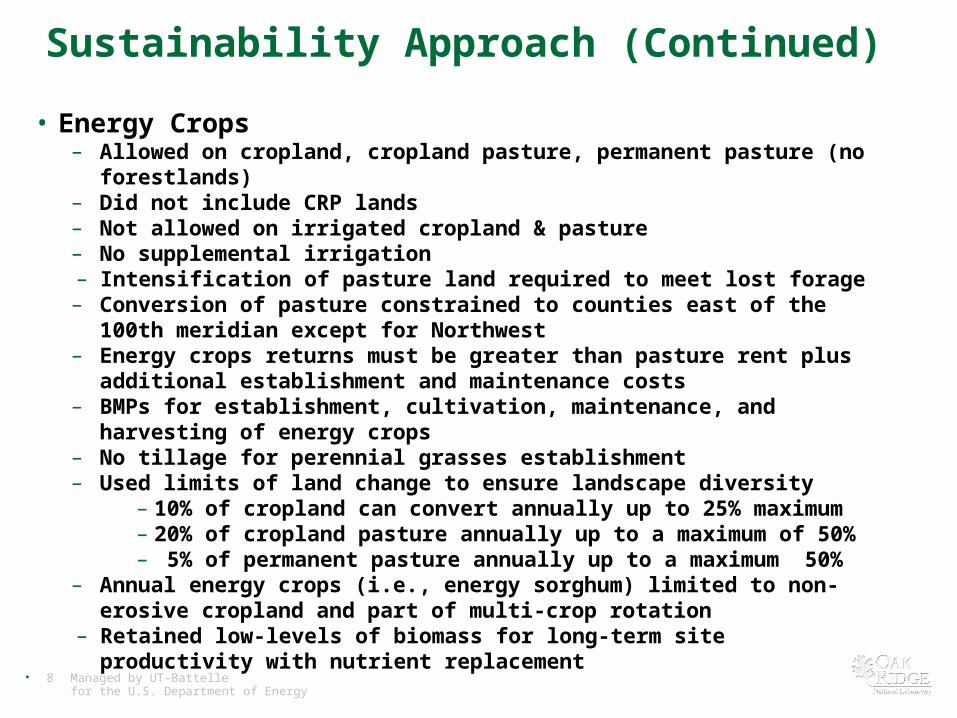
Sustainability Approach (Continued)
• Energy Crops– Allowed on cropland, cropland pasture, permanent pasture (no forestlands)– Did not include CRP lands– Not allowed on irrigated cropland & pasture– No supplemental irrigation– Intensification of pasture land required to meet lost forage– Conversion of pasture constrained to counties east of the 100th meridian
except for Northwest– Energy crops returns must be greater than pasture rent plus additional
establishment and maintenance costs– BMPs for establishment, cultivation, maintenance, and harvesting of energy
crops – No tillage for perennial grasses establishment– Used limits of land change to ensure landscape diversity
– 10% of cropland can convert annually up to 25% maximum– 20% of cropland pasture annually up to a maximum of 50%– 5% of permanent pasture annually up to a maximum 50%
– Annual energy crops (i.e., energy sorghum) limited to non-erosive cropland and part of multi-crop rotation
– Retained low-levels of biomass for long-term site productivity with nutrient replacement

• 9 Managed by UT-Battellefor the U.S. Department of Energy
• How to find– Update report is national
summaries at selected prices and years for all feedstocks, sorts, and scenarios
– KDF for desired spatial analyses, prices, and years for all feedstock categories, sorts, and scenarios
• It all depends– Specific feedstock
or feedstock category
– Sorts – currently used or potential
– Spatial interest– Selected price– Specific year– Scenario
How Much Biomass is Available According to the New 2011 Update?
http://bioenergykdf.net9
• 10 Managed by UT-Battellefor the U.S. Department of Energy
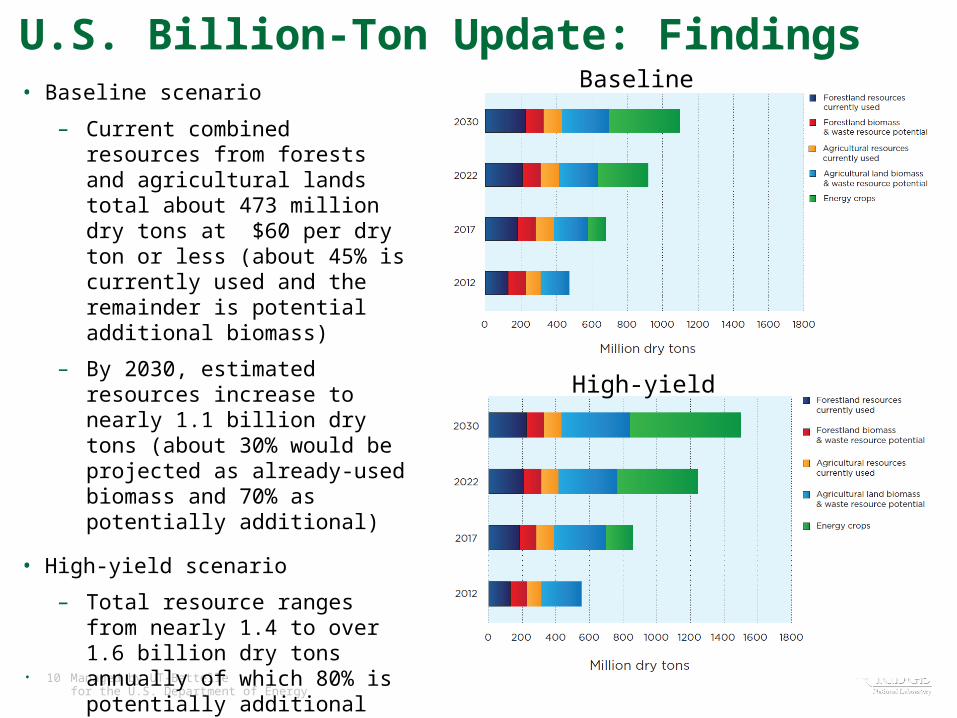
U.S. Billion-Ton Update: Findings • Baseline scenario
– Current combined resources from forests and agricultural lands total about 473 million dry tons at $60 per dry ton or less (about 45% is currently used and the remainder is potential additional biomass)
– By 2030, estimated resources increase to nearly 1.1 billion dry tons (about 30% would be projected as already-used biomass and 70% as potentially additional)
• High-yield scenario
– Total resource ranges from nearly 1.4 to over 1.6 billion dry tons annually of which 80% is potentially additional biomass
– No high-yield scenario was evaluated for forest resources, except for the woody crops
Baseline
High-yield

• 11 Managed by UT-Battellefor the U.S. Department of Energy
0
10
20
30
40
50
60
70
80
90
2012 2014 2016 2018 2020 2022 2024 2026 2028 2030
Mill
ion
acre
s
Baseline High-yield (4%)
• Total land use change ($60/dry ton) is 63 million acres under the
baseline scenario and 79 million acres under the high-yield
scenario (4% annual growth in energy crop yield) by 2030
Land-use Change
11
• 12 Managed by UT-Battellefor the U.S. Department of Energy
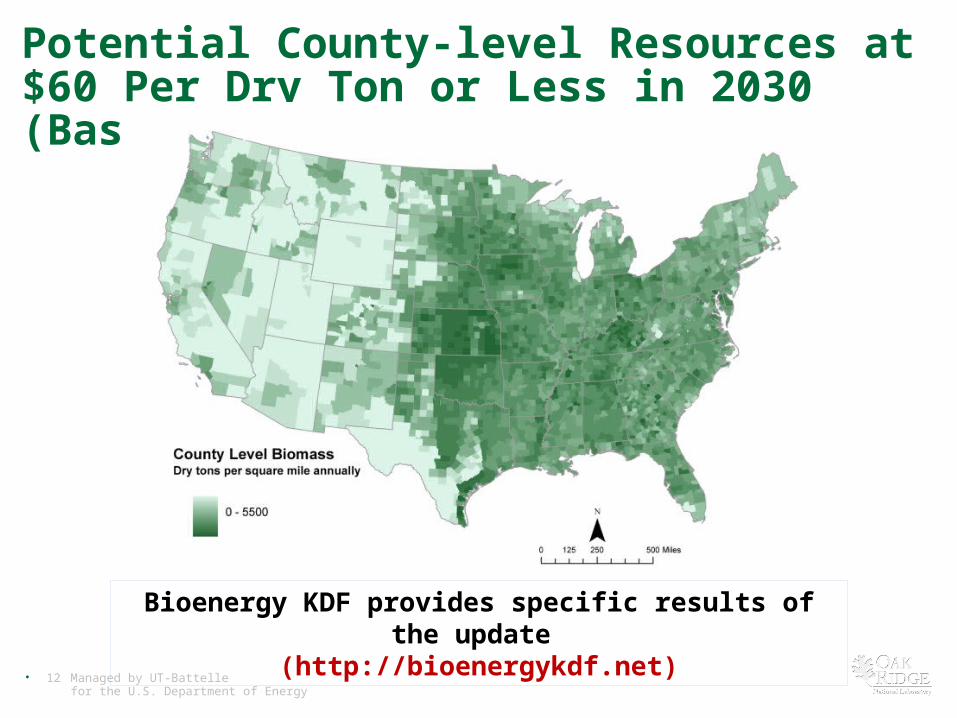
Potential County-level Resources at $60 Per Dry Ton or Less in 2030 (Baseline Scenario)
Bioenergy KDF provides specific results of the update (http://bioenergykdf.net)