Embed Size (px)
Citation preview
%Q2The Outcomes-Based
Line of Credit A New Model for Investing in Social Impact
FEBRUARY 2019
Anna Smukowski Public-Private Partnerships Program Manager
THE OUTCOMES-BASED LINE OF CREDIT | 1
Contents
2 LISC’s Role and Pay for Success
3 Introducing the Outcomes-Based Line of Credit
4 Traditional Borrowing Base Line of Credit
7 The Outcomes-Based Line of Credit Tab 1: Cash Flow Model
Tab 2: Outcomes
Tab 3: Budget
Tab 4: Project Summary
12 Benefits and Risks
14 Conclusion
15 Sample Model Assumptions
Financial Sources and Uses
19 Appendix
THE OUTCOMES-BASED LINE OF CREDIT | 2
LISC’s Role and Pay for SuccessIn our almost four decades of working with communities to improve the lives of residents, the Local Initiatives Support Corporation (LISC) has always looked for new innovative and effective ways to achieve our mission. The most promising efforts have consistently involved partnerships between government, nonprofit groups, and private investors. Enter Pay for Success (PFS), a new way for government to partner with the private sector and nonprofit groups to fund and scale proven programs that have real, measurable benefits for people.
In 2016, LISC was awarded funding from the federal Social Innovation Fund (SIF), which is administered by the Corporation for National & Community Service, to implement a PFS program. Through this funding, we help social service providers design effective programs, raise private capital and produce the metrics needed to demonstrate positive outcomes required by PFS.
What is Pay for Success?PFS leverages upfront philanthropic and other private dollars to fund social service programs that demonstrate success through measurable outcomes. PFS ultimately seeks to change the way government spends taxpayer money, increasing efficiency and accountability by focusing on lower-cost preventative interventions that create both long-term positive effects for individuals and long-term savings for increasingly strained public budgets. PFS works by tapping private capital to provide upfront financing for social programs, with the agreement that the public funding source will repay investors after evidence that people have in fact been helped. It encourages cooperation between local groups, the private and philanthropic sector, and government.
THE OUTCOMES-BASED LINE OF CREDIT | 3
$
Introducing the Outcomes-Based Line of CreditPFS financing at its essence is the bridging of an outcome receivable that we expect to be collectible based on agreed-upon targets. As we approach PFS 2.0 with the entry of rate cards, the financial modeling of PFS transactions can draw a lot of benefit from looking at how community development lenders have structured transactions for service providers bridging government or philanthropic receivables through borrowing base lines of credit.
Borrowing base lines of credit are credit facilities that have long been part of the Local Initiatives Support Corporation (LISC) wheelhouse of community development investments to social service providers. As we look to the expansion of outcomes-based financing, we believe a new type of borrowing base lines of credit, for which we’ve coined the term outcomes-based lines of credit, can be an effective tool to help social service providers receive the upfront bridge financing needed to expand their programs and services to achieve impact at scale.
Below, we will walk through a traditional asset-backed borrowing base line of credit, then look at how this can be applied to the outcomes-based financing model.
Borrowing base lines of credit are credit facilities that have long been part of LISC’s wheelhouse of community development investments to social service providers.
THE OUTCOMES-BASED LINE OF CREDIT | 4
Discount factors/advanced rates between 50% and 80% of the eligible receivables are typically used to calculate the borrowing base and should be determined based on the strength of the receivable.
Traditional Borrowing Base Line of CreditBorrowing base loans are credit facilities secured by the borrower’s current assets, typically accounts receivable. The loan is structured so that collateral is readily available if the loan must be liquidated. The amount of money the lender will loan to a company is based on the value of the collateral the company pledges. Borrowing base lines of credit provide a flexible source of financing that can grow in line with the borrower’s finances.
Calculating the Borrowing BaseCreditors typically allow only receivables in the borrowing base, set at all receivables ranging from 1 to 90 days past due, depending on the borrower. Some lenders will set limits on the percentage of total receivables that one customer can hold. For example, if there are total receivables of $1,000,000 and they are all current, no single customer can account for more than 20%, or $200,000, of the total receivables. If one does, then all amounts for that customer over $200,000 are excluded from the borrowing base.
Once the total eligible receivables have been established, the lender determines a discount factor/advanced rate that is then multiplied by the value of the collateral. This method, called margining, is determined based on the risk the lender associates with the borrower. Discount factors/advanced rates between 50% and 80% of the eligible receivables are typically used to calculate the borrowing base and should be determined based on the strength of the receivable. Once the discount factor/advanced rate has been applied, the end result is the amount of money that will be loaned to the borrower. For example, if the borrower offers collateral worth $100,000 and the lender assigns a discount factor/advanced rate of 80%, the maximum amount the lender will have outstanding to the borrower at any point in time will be $80,000. The borrower is then required to report on the status of the borrowing base on a monthly or more frequent basis.
THE OUTCOMES-BASED LINE OF CREDIT | 5
LISC has provided CRCD with two lines of credit to help fund the costs associated with its contract revenue.
1 http://www.occ.gov/publications/publications-by-type/comptrollers-handbook/arif.pdf
Traditional LISC Project ExampleFormed in 2005, the Coalition for Responsible Community Development (CRCD) is a Los Angeles-based service provider that offers comprehensive community services to young people in South LA’s Vernon-Central neighborhood, including education, career preparation, jobs, housing, support services, and business assistance.
As part of its work, CRCD administers a number of public agency contracts for services like job training and graffiti abatement programs that are on a reimbursement basis, meaning CRCD needs to incur the expenses before being reimbursed by the City or other funders. To help the organization manage cash flow and make payroll, LISC has provided CRCD with two lines of credit to help fund the costs associated with its contract revenue. LISC has set our borrowing base to 80% of committed and receivable accounts within the most recent 90-day period.
Borrower AnalysisFinancial analysis should focus on the borrower’s cash flow from receivables, rather than from operations. The analysis should emphasize the quality and value of the receivables, ability of the underwriter to understand and monitor the borrower’s business and accounts, and the lender’s ability to convert the borrowing base into cash if needed. The underwriter should thoroughly analyze the borrower’s business and industry, the borrower’s position within the industry, and the types of customers with whom the borrower does business to adequately address potential issues.
RisksCommon risks in this type of financing include credit risk, compliance risk, and transaction risk.1
• Credit risk is the risk to earnings or capital arising from the borrower’s failure to meet the terms of any contract with the lender or otherwise to perform as agreed. It arises any time bank funds are extended, committed, invested, or otherwise exposed through contractual agreements.
• Compliance risk is the risk to earnings or capital arising from violations of or nonconformance with laws, rules, regulations, prescribed practices, or ethical standards. Compliance risk also arises in situations where the laws or rules governing certain bank products or the activities of the bank’s clients may be ambiguous or untested.
• Transaction risk is the current and prospective risk to earnings and capital arising from fraud, error, or the inability to deliver products or services, maintain a competitive position, or manage information. Transaction risk can also develop when management or staff does not provide sufficient oversight.
THE OUTCOMES-BASED LINE OF CREDIT | 6
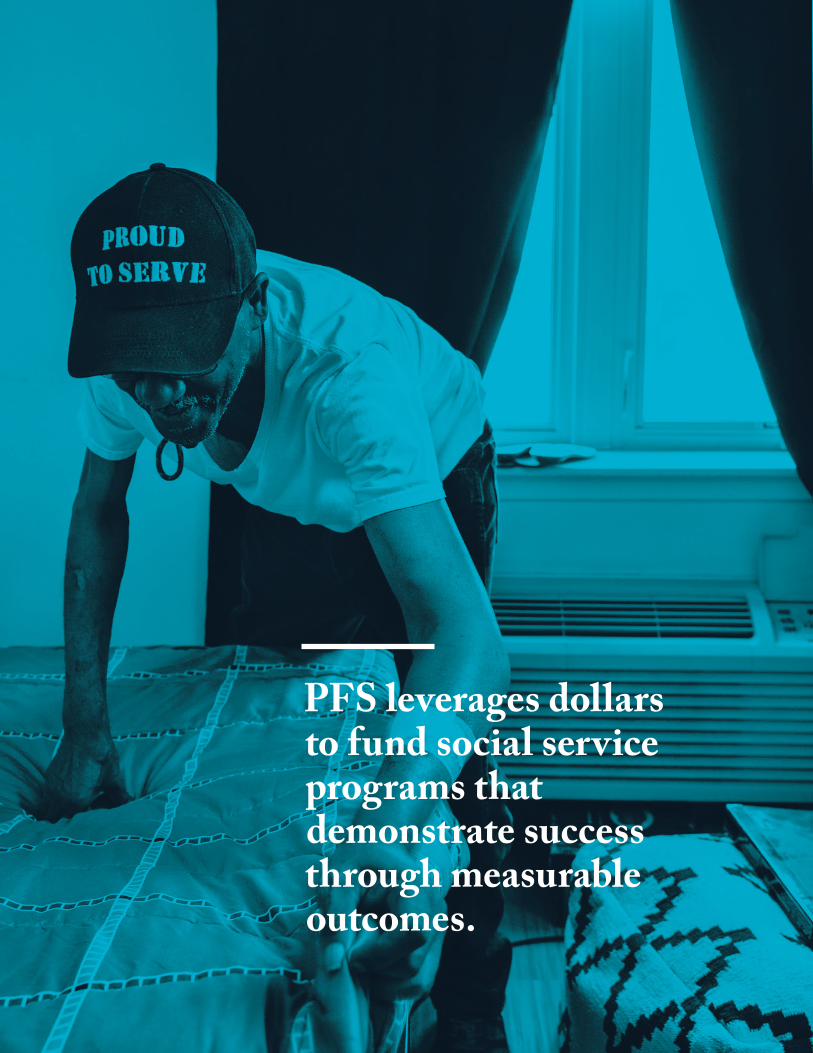
PFS leverages dollars to fund social service programs that demonstrate success through measurable outcomes.
THE OUTCOMES-BASED LINE OF CREDIT | 7
The Outcomes-Based Line of CreditThe outcomes-based line of credit is a credit facility bridging to outcomes receivables. The loan is structured so that lenders will have interest in outcomes and the amount of money the lender will loan an organization is based on the needed project cash flow and anticipated outcomes payments.
LISC has created a sample model to help service providers, governments, investors, and financial intermediaries think through how this model can be applied to outcomes-based financing.
Sample Borrowing Base Pay for Success ModelThe attached template is a bare-bones model that can be built off of to take into account the differences and nuances in your own PFS or outcomes-based financing project. It is broken into four tabs:
1. Cash Flow Model
2. Outcomes
3. Budget
4. Project Summary
The Summary tab is filled through the other tree tabs, so we will discuss it last. On each tab, input fields are shaded blue.
Tab 1: Cash Flow ModelThe key tab that leverages the borrowing base model is the cash flow tab.
• Investor draws are set to minimize the account balance to the three-month average of working capital. This provides the project with the initial cash flow needed to hire and train program staff, pay for program expenses, and cover transaction costs. This also limits interest expense since the project account will not have a large balance.
• When outcomes payments are received, they are used to pay down investor principal and to pay for ongoing project costs. In this model, once outcomes are measured and earned, they are paid to the project instead of sitting in a separate designated account. This helps minimize interest expense and reduce investors’ overall exposure to the project.
• In the final project month, the outstanding loan is repaid through the final outcomes payment. Any remaining funds can be used to pay an upside payment to the service provider or investor.
Unlike the traditional borrowing base line of credit, the investor loan is set to cover three months of project expenses that are bridging to an outcome payment.
THE OUTCOMES-BASED LINE OF CREDIT | 8
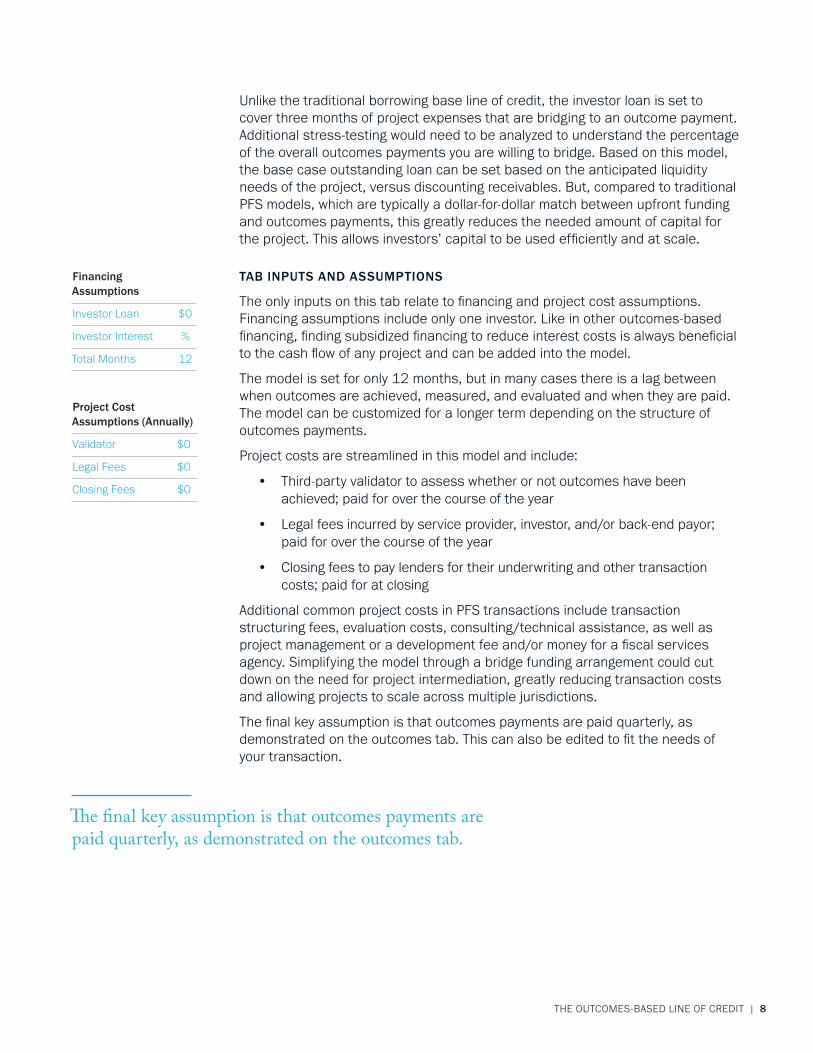
Financing Assumptions
Investor Loan $0
Investor Interest %
Total Months 12
Project Cost Assumptions (Annually)
Validator $0
Legal Fees $0
Closing Fees $0
Unlike the traditional borrowing base line of credit, the investor loan is set to cover three months of project expenses that are bridging to an outcome payment. Additional stress-testing would need to be analyzed to understand the percentage of the overall outcomes payments you are willing to bridge. Based on this model, the base case outstanding loan can be set based on the anticipated liquidity needs of the project, versus discounting receivables. But, compared to traditional PFS models, which are typically a dollar-for-dollar match between upfront funding and outcomes payments, this greatly reduces the needed amount of capital for the project. This allows investors’ capital to be used efficiently and at scale.
TAB INPUTS AND ASSUMPTIONS
The only inputs on this tab relate to financing and project cost assumptions. Financing assumptions include only one investor. Like in other outcomes-based financing, finding subsidized financing to reduce interest costs is always beneficial to the cash flow of any project and can be added into the model.
The model is set for only 12 months, but in many cases there is a lag between when outcomes are achieved, measured, and evaluated and when they are paid. The model can be customized for a longer term depending on the structure of outcomes payments.
Project costs are streamlined in this model and include:
• Third-party validator to assess whether or not outcomes have been achieved; paid for over the course of the year
• Legal fees incurred by service provider, investor, and/or back-end payor; paid for over the course of the year
• Closing fees to pay lenders for their underwriting and other transaction costs; paid for at closing
Additional common project costs in PFS transactions include transaction structuring fees, evaluation costs, consulting/technical assistance, as well as project management or a development fee and/or money for a fiscal services agency. Simplifying the model through a bridge funding arrangement could cut down on the need for project intermediation, greatly reducing transaction costs and allowing projects to scale across multiple jurisdictions.
The final key assumption is that outcomes payments are paid quarterly, as demonstrated on the outcomes tab. This can also be edited to fit the needs of your transaction.
The final key assumption is that outcomes payments are paid quarterly, as demonstrated on the outcomes tab.
THE OUTCOMES-BASED LINE OF CREDIT | 9
Tab 2: OutcomesThe Outcomes tab will require the most work between the service provider and back-end payor to agree on terms. As such, this tab has the most inputs as it will be highly project specific.
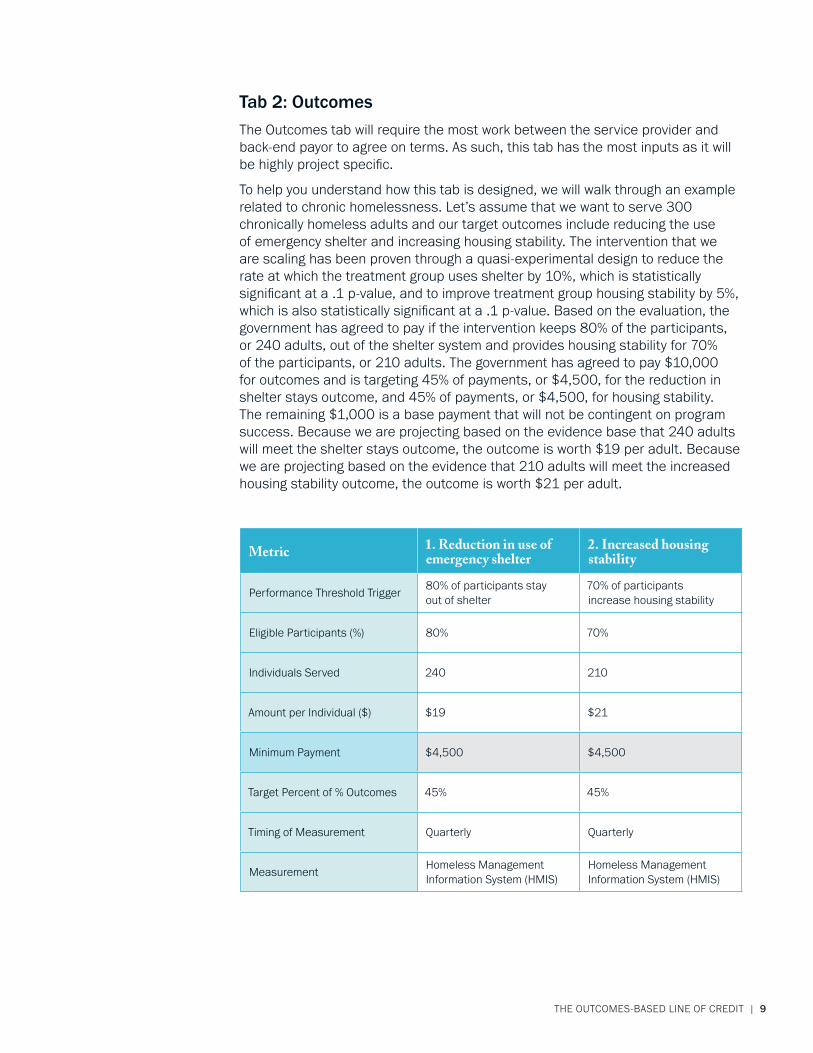
To help you understand how this tab is designed, we will walk through an example related to chronic homelessness. Let’s assume that we want to serve 300 chronically homeless adults and our target outcomes include reducing the use of emergency shelter and increasing housing stability. The intervention that we are scaling has been proven through a quasi-experimental design to reduce the rate at which the treatment group uses shelter by 10%, which is statistically significant at a .1 p-value, and to improve treatment group housing stability by 5%, which is also statistically significant at a .1 p-value. Based on the evaluation, the government has agreed to pay if the intervention keeps 80% of the participants, or 240 adults, out of the shelter system and provides housing stability for 70% of the participants, or 210 adults. The government has agreed to pay $10,000 for outcomes and is targeting 45% of payments, or $4,500, for the reduction in shelter stays outcome, and 45% of payments, or $4,500, for housing stability. The remaining $1,000 is a base payment that will not be contingent on program success. Because we are projecting based on the evidence base that 240 adults will meet the shelter stays outcome, the outcome is worth $19 per adult. Because we are projecting based on the evidence that 210 adults will meet the increased housing stability outcome, the outcome is worth $21 per adult.
Metric 1. Reduction in use of emergency shelter
2. Increased housing stability
Performance Threshold Trigger80% of participants stay out of shelter
70% of participants increase housing stability
Eligible Participants (%) 80% 70%
Individuals Served 240 210
Amount per Individual ($) $19 $21
Minimum Payment $4,500 $4,500
Target Percent of % Outcomes 45% 45%
Timing of Measurement Quarterly Quarterly
MeasurementHomeless Management Information System (HMIS)
Homeless Management Information System (HMIS)
THE OUTCOMES-BASED LINE OF CREDIT | 10
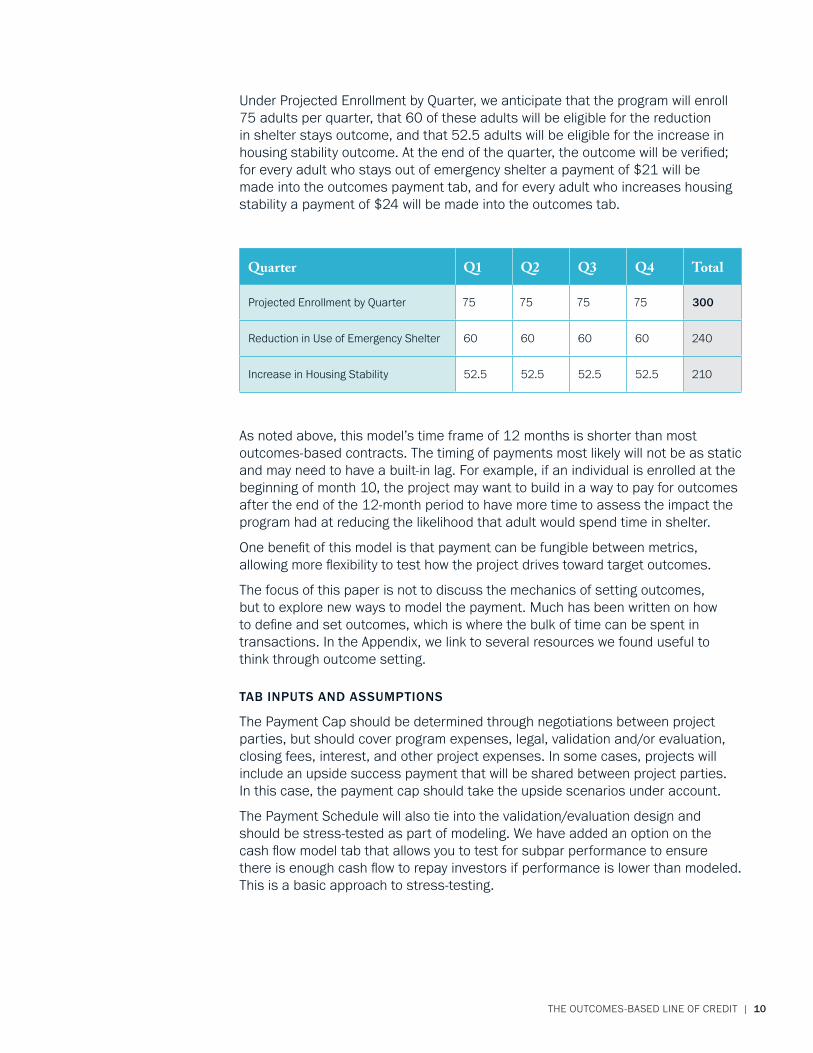
Under Projected Enrollment by Quarter, we anticipate that the program will enroll 75 adults per quarter, that 60 of these adults will be eligible for the reduction in shelter stays outcome, and that 52.5 adults will be eligible for the increase in housing stability outcome. At the end of the quarter, the outcome will be verified; for every adult who stays out of emergency shelter a payment of $21 will be made into the outcomes payment tab, and for every adult who increases housing stability a payment of $24 will be made into the outcomes tab.
As noted above, this model’s time frame of 12 months is shorter than most outcomes-based contracts. The timing of payments most likely will not be as static and may need to have a built-in lag. For example, if an individual is enrolled at the beginning of month 10, the project may want to build in a way to pay for outcomes after the end of the 12-month period to have more time to assess the impact the program had at reducing the likelihood that adult would spend time in shelter.
One benefit of this model is that payment can be fungible between metrics, allowing more flexibility to test how the project drives toward target outcomes.
The focus of this paper is not to discuss the mechanics of setting outcomes, but to explore new ways to model the payment. Much has been written on how to define and set outcomes, which is where the bulk of time can be spent in transactions. In the Appendix, we link to several resources we found useful to think through outcome setting.
TAB INPUTS AND ASSUMPTIONS
The Payment Cap should be determined through negotiations between project parties, but should cover program expenses, legal, validation and/or evaluation, closing fees, interest, and other project expenses. In some cases, projects will include an upside success payment that will be shared between project parties. In this case, the payment cap should take the upside scenarios under account.
The Payment Schedule will also tie into the validation/evaluation design and should be stress-tested as part of modeling. We have added an option on the cash flow model tab that allows you to test for subpar performance to ensure there is enough cash flow to repay investors if performance is lower than modeled. This is a basic approach to stress-testing.
Quarter Q1 Q2 Q3 Q4 Total
Projected Enrollment by Quarter 75 75 75 75 300
Reduction in Use of Emergency Shelter 60 60 60 60 240
Increase in Housing Stability 52.5 52.5 52.5 52.5 210
THE OUTCOMES-BASED LINE OF CREDIT | 11
Tab 3: BudgetsThe budget tab is for program expenses associated with the intervention and carries to the program expenses line item in the Cash Flow Model tab. If another budget model works better for your intervention, link the final total program costs from your model to the Program Expenses line item in the budget sheet.
TAB INPUTS AND ASSUMPTIONS
All project expenses are assumed to be spread evenly over the 12-month period. To customize the template, you may want to look at what expenses you may need to incur earlier on in the project to ensure adequate funding for program provision.
Tab 4: Project SummaryThe Project Summary tab provides an overview of financing sources and uses, assumptions, success payments, and upside payments.
Sources in this model include investor principal and outcomes payments. Additional sources that could be included in a customized version include any earnings on a cash account, grant capital, or a break-out between junior and senior debt capital. This model can assume that the payor will pay a negotiated portion for contracted services that are not only for outputs or outcomes. In many cases, the government will provide base payments that are paid regardless of whether the program achieves any outcomes, but there may be cases where this is not true.
Uses include program and transaction costs. The program costs are further outlined under the budget tab. Transaction costs include project evaluation, legal fees, and closing service fees. Unlike more robust PFS models, this model does not contemplate the use of a financial intermediary so does not include additional staff, insurance, fiscal agent fees, or audit fees associated with setting up a third-party intermediary. This could be included on an as-needed basis. The final use is the payment of investor interest and principal. Depending on the timing of payments, a separate interest reserve could be set up to pay investor interest while payments are being bridged.
In many cases, the government will provide base payments that are paid regardless of whether the program achieves any outcomes.
TAB INPUTS AND ASSUMPTIONS
All project expenses are assumed to be spread evenly over the 12-month period. To customize the template, you may want to look at what expenses you may need to incur earlier on in the project to ensure adequate funding for program provision.
THE OUTCOMES-BASED LINE OF CREDIT | 12
Benefits and Risks
InvestorsThe key benefit of the outcomes-based, revolving line of credit lies in the minimization of debt financing needed to help scale the program intervention. This can hopefully lead to synergies in the underwriting process while increasing the amount of debt available for additional projects.
Due to the simplicity of the model, there can also be a great reduction in transaction costs by the reduced need for ongoing technical assistance or a third-party financial intermediary.
The risks with the outcomes-based line of credit mirror those of the traditional borrowing base line of credit and include credit risk, compliance risk, and transaction risk. Inherent in all PFS transactions are appropriations risks; however, with this type of financing contracts could be done under a shorter time frame, greatly reducing potential multi-year appropriations issues.
Service ProvidersFor the service provider, this facility will improve liquidity, providing the financial stability and needed cash flow to expand its program. The facility can help stabilize cash flows with the expectation that the service provider will be able to achieve outcomes in the future.
For service providers that are newer to managing debt, the facility also provides them with less debt exposure, helping them better understand the policies and procedures they need to have in place to access capital markets. But unlike other PFS models, the lack of intermediary can put them at more financial risk since they are the ultimate borrower.
In this example, we modeled for only a one-year contract term, moving away from multi-year appropriations. This could reduce the scale a service provider may be able to achieve under its program, so may be best suited for funding of existing evidenced-based interventions.
Back-End PayorThe biggest benefit for the back-end payor is having to factor fewer transaction costs into the project, ensuring the payor is truly paying for project outcomes. By limiting the amount of external financing, the back-end payor has to pay less in interest expense. Additionally, the model removes a third-party intermediary, allowing the back-end payor to contract directly with the service provider, which can create efficiencies especially for smaller transactions.
Because the outcomes payments are based on a rate-card structure, there may be risks associated with causality between the program and measured impacts. However, outcomes-based financing has been moving toward leveraging existing evidence bases to create more streamlined outcomes payments versus leveraging a quasi-experimental payment structure. This model can be leveraged for projects across issue areas.
THE OUTCOMES-BASED LINE OF CREDIT | 13
The outcomes-based line of credit can help transaction parties create a funding mechanism to help create the cash flow needed to scale social service delivery.
THE OUTCOMES-BASED LINE OF CREDIT | 14
ConclusionAs outcomes-based contracting becomes a more ubiquitous approach to funding our social service landscape, the outcomes-based line of credit can help transaction parties create a funding mechanism to help create the cash flow needed to scale social service delivery.
We hope this model helps you think through some of the nuances of your own projects, and helps drive toward a streamlined approach to financing outcomes-based transactions.
#
THE OUTCOMES-BASED LINE OF CREDIT | 15
Sample Model If you want to explore the model further, try using it with the following project scenario from our Underwriting Pay for Success Transaction Presentation at Opportunity Finance Network with Living Cities, Nonprofit Finance Fund and Reinvestment Fund, from September 2017.
Child Welfare and Family-Based RecoveryIn America, more than 420,000 children are being raised in foster care, at a cost to taxpayers of more than $9 billion annually. Youth who spend time in foster care are disproportionately likely to experience poverty, housing instability, medical issues, and other poor outcomes that can exact even higher costs to the individual and to society at large.
Our hypothetical service provider, “Project ABC,” is a 25-year-old organization that helps address the number of children entering the foster care system due to family members suffering from opioid use disorders and / or other family-based needs. A community-based program, Project ABC offers home-based substance abuse and family counseling, as well as parent education, nursing services, parenting groups, domestic violence groups, sobriety support, and links to other services like affordable housing, substance abuse counseling, and health care. Upon referral and enrollment, each family is connected to a team including a clinician, nurse, and parent educator. If a child is currently in foster care, staff work with the parents and foster families to support relationships while in out-of-home care.
A rigorous evaluation indicated numerous outcomes including increased reunifications between families and children and reduced referrals and re-referrals to Child Protective Services (CPS), in addition to a positive change in a child’s developmental well-being.
Project ABC has partnered with CPS to use Pay for Success to expand its services from one county to statewide and is interested in using a rate-card model to pay for outcomes. Based on negotiations, CPS has agreed to pay Project ABC up to $300 for every family that is reunified and an additional $1,000 if that family is not re-referred to CPS after 3 months of reunification. A local university has agreed to be the evaluator to ensure the initiative achieves the stated outcomes. Project parties are working with LLC Corp to structure their transaction and are now looking for financing.
THE OUTCOMES-BASED LINE OF CREDIT | 16
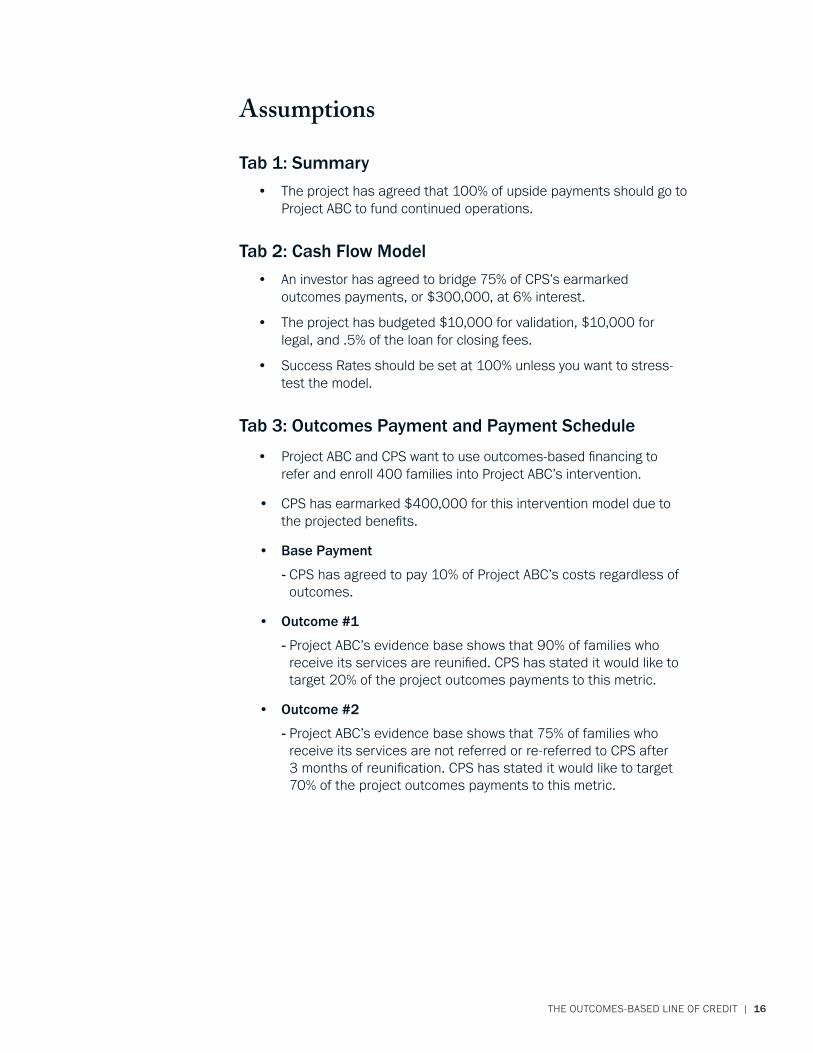
Assumptions
Tab 1: Summary• The project has agreed that 100% of upside payments should go to
Project ABC to fund continued operations.
Tab 2: Cash Flow Model• An investor has agreed to bridge 75% of CPS’s earmarked
outcomes payments, or $300,000, at 6% interest.
• The project has budgeted $10,000 for validation, $10,000 for legal, and .5% of the loan for closing fees.
• Success Rates should be set at 100% unless you want to stress-test the model.
Tab 3: Outcomes Payment and Payment Schedule
• Project ABC and CPS want to use outcomes-based financing to refer and enroll 400 families into Project ABC’s intervention.
• CPS has earmarked $400,000 for this intervention model due to the projected benefits.
• Base Payment
- CPS has agreed to pay 10% of Project ABC’s costs regardless of outcomes.
• Outcome #1
- Project ABC’s evidence base shows that 90% of families who receive its services are reunified. CPS has stated it would like to target 20% of the project outcomes payments to this metric.
• Outcome #2
- Project ABC’s evidence base shows that 75% of families who receive its services are not referred or re-referred to CPS after 3 months of reunification. CPS has stated it would like to target 70% of the project outcomes payments to this metric.
THE OUTCOMES-BASED LINE OF CREDIT | 17
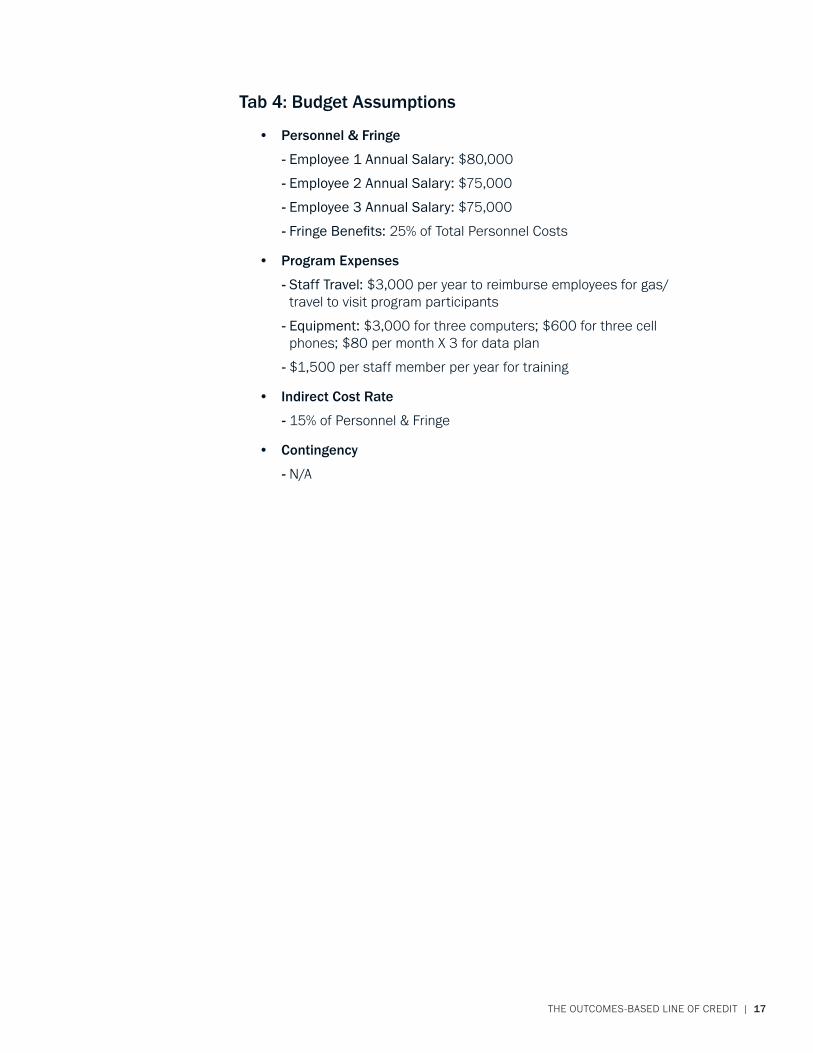
Tab 4: Budget Assumptions
• Personnel & Fringe
- Employee 1 Annual Salary: $80,000
- Employee 2 Annual Salary: $75,000
- Employee 3 Annual Salary: $75,000
- Fringe Benefits: 25% of Total Personnel Costs
• Program Expenses
- Staff Travel: $3,000 per year to reimburse employees for gas/travel to visit program participants
- Equipment: $3,000 for three computers; $600 for three cell phones; $80 per month X 3 for data plan
- $1,500 per staff member per year for training
• Indirect Cost Rate
- 15% of Personnel & Fringe
• Contingency
- N/A
THE OUTCOMES-BASED LINE OF CREDIT | 18
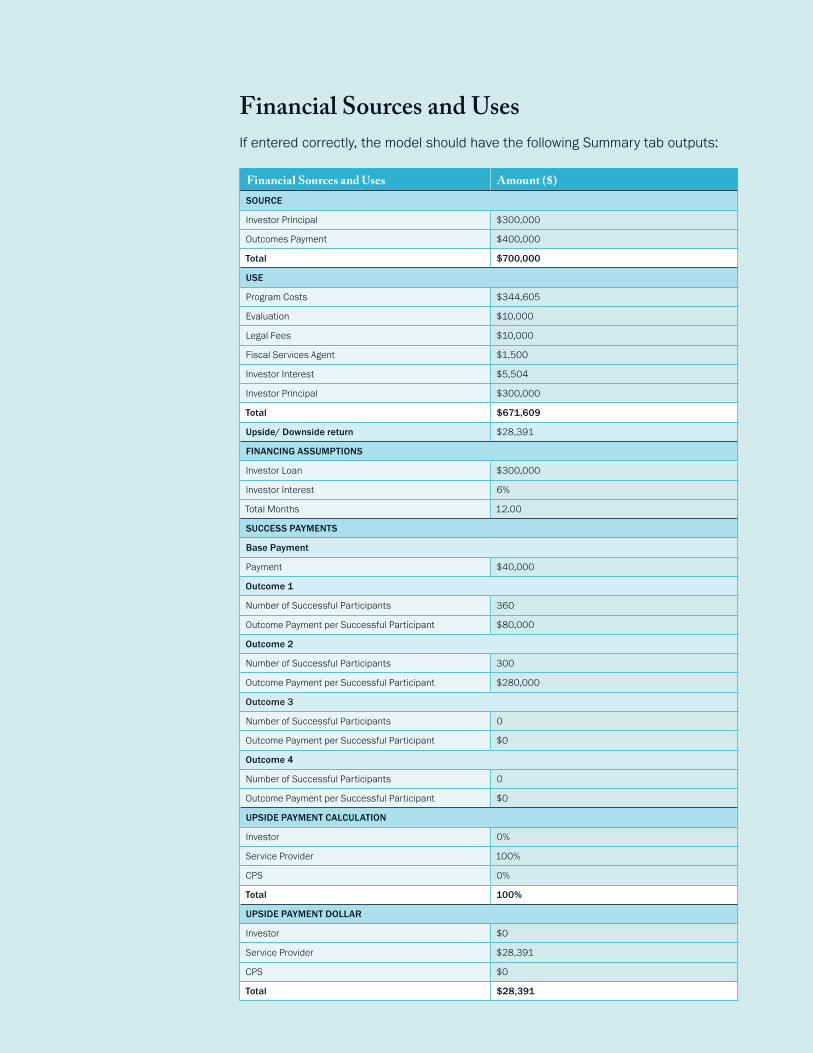
Financial Sources and UsesIf entered correctly, the model should have the following Summary tab outputs:
Financial Sources and Uses Amount ($)
SOURCE
Investor Principal $300,000
Outcomes Payment $400,000
Total $700,000
USE
Program Costs $344,605
Evaluation $10,000
Legal Fees $10,000
Fiscal Services Agent $1,500
Investor Interest $5,504
Investor Principal $300,000
Total $671,609
Upside/ Downside return $28,391
FINANCING ASSUMPTIONS
Investor Loan $300,000
Investor Interest 6%
Total Months 12.00
SUCCESS PAYMENTS
Base Payment
Payment $40,000
Outcome 1
Number of Successful Participants 360
Outcome Payment per Successful Participant $80,000
Outcome 2
Number of Successful Participants 300
Outcome Payment per Successful Participant $280,000
Outcome 3
Number of Successful Participants 0
Outcome Payment per Successful Participant $0
Outcome 4
Number of Successful Participants 0
Outcome Payment per Successful Participant $0
UPSIDE PAYMENT CALCULATION
Investor 0%
Service Provider 100%
CPS 0%
Total 100%
UPSIDE PAYMENT DOLLAR
Investor $0
Service Provider $28,391
CPS $0
Total $28,391
THE OUTCOMES-BASED LINE OF CREDIT | 19
Appendix
Outcome Setting ResourcesWe recommend several resources that can help project parties set outcomes.
PFS + ECE: Outcomes Measurement and Pricing Monica Rohacek and Julia Isaacs, Urban Institute
This Pay for Success Early Childhood Education Toolkit Report provides the types of early childhood education (ECE) outcomes that might be used to establish repayments and offers guidance on how partners in a PFS project might select an outcome, a measure, and a definition of success that is appropriate for the project.
Outcomes Rate Cards: A Scalable Pay for Success Approach Diana Crumley and Allison Hamblin, Center for Healthcare Strategies
This blog post explores how outcomes rate cards can be used to support projects addressing social determinants of health.
Innovations in Pay for Success: Outcomes Rate Cards Annie Dear and Casey Littlefield, Social Finance
This blog post describes the work Social Finance has done to develop and launch PFS projects using outcomes rate cards, including guidance on selecting and pricing outcomes, covering provider costs, measuring project performance, and providing the service provider working capital.
A Special Thanks to Additional Contributors
Samantha Creath, LISC Terry Gillen, LISC Malini Nayar, LISC David Streim, Nonprofit Finance Fund Sara Vernon Sterman, Reinvestment Fund
The Social Innovation Fund (SIF) was a program of the Corporation for National and Community Service that received funding from 2010 to 2016. Using public and private resources to find and grow community-based nonprofits with evidence of results, SIF intermediaries received funding to award subgrants that focus on overcoming challenges in economic opportunity, healthy futures, and youth development. Although CNCS made its last SIF intermediary awards in fiscal year 2016, SIF intermediaries will continue to administer their subgrant programs until their federal funding is exhausted.

THE OUTCOMES-BASED LINE OF CREDIT | 20
lisc.org