Embed Size (px)
Citation preview
Warwick Economics Research Papers
ISSN 2059-4283 (online)
ISSN 0083-7350 (print)
Is Envy Harmful to a Society’s Psychological Health and
Wellbeing? A Longitudinal Study of 18,000 Adults
Redzo Mujcic& Andrew J. Oswald
(This paper also appears as CAGE Discussion paper 361)
February 2018 No: 1154
1
Forthcoming in Social Science and Medicine
Is Envy Harmful to a Society’s Psychological Health and Wellbeing? A LongitudinalStudy of 18,000 Adults
January 2018
Redzo Mujcic1 and Andrew J. Oswald2,3,*
1 Assistant Professor, Wirtschaftsuniversität Wien, 1020 Vienna, Austria. Email address:[email protected] Professor of Behavioral Science and Economics, University of Warwick and CAGE Centre,Coventry, CV4 7AL, UK. Email address: [email protected] IZA Institute, Schaumburg-Lippe-Str. 5-9, D-53113 Bonn, Germany.
* To whom correspondence should be addressed: Email: [email protected]
2
Is Envy Harmful to a Society’s Psychological Health and Wellbeing? A LongitudinalStudy of 18,000 Adults
Abstract
Nearly 100 years ago, the philosopher and mathematician Bertrand Russell warned of the
social dangers of widespread envy. One view of modern society is that it is systematically
developing a set of institutions -- such as social media and new forms of advertising -- that
make people feel inadequate and envious of others. If so, how might that be influencing the
psychological health of our citizens? This paper reports the first large-scale longitudinal
research into envy and its possible repercussions. The paper studies 18,000 randomly selected
individuals over the years 2005, 2009, and 2013. Using measures of SF-36 mental health and
psychological well-being, four main conclusions emerge. First, the young are especially
susceptible. Levels of envy fall as people grow older. This longitudinal finding is consistent
with a cross-sectional pattern noted recently by Nicole E. Henniger and Christine R. Harris,
and with the theory of socioemotional regulation suggested by scholars such as Laura L.
Carstensen. Second, using fixed-effects equations and prospective analysis, the analysis
reveals that envy today is a powerful predictor of worse SF-36 mental health and well-being
in the future. A change from the lowest to the highest level of envy, for example, is
associated with a worsening of SF-36 mental health by approximately half a standard
deviation (p <0.001). Third, no evidence is found for the idea that envy acts as a useful
motivator. Greater envy is associated with slower -- not higher -- growth of psychological
well-being in the future. Nor is envy a predictor of later economic success. Fourth, the
longitudinal decline of envy leaves unaltered a U-shaped age pattern of well-being from age
20 to age 70. These results are consistent with the idea that society should be concerned
about institutions that stimulate large-scale envy.
Keywords: Envy, age, SF-36, mental health, well-being, longitudinal data
3
“Of all the characteristics of ordinary human nature, envy is the most unfortunate … not onlydoes the envious person wish to inflict misfortune… but he is also himself rendered unhappy byenvy….Whoever wishes to increase human happiness must … diminish envy.”
Bertrand Russell, 1930, The Conquest of Happiness, 1st edition,George Allen & Unwin, London.
There is growing interest -- partly because of the rise of social media -- in the possible
psychological harm done within a society by widespread envy and social comparison. Studies
such as Appel, Gerlach, & Crusius (2015), Tandoc, Ferrucci & Duffy (2015), Verduyn et al.
(2015), Taylor & Strutton (2016), Christakis & Shakya (2017), and Shensa et al. (2017)
document recent evidence on connections between social-media use, envy, and lower mental
well-being. A second literature, on related concerns about advertising and psychological
well-being, is beginning to emerge (Opree, Buijzen, & van Reijmersdal, 2016). Brain
scientists have also recently become interested in the detection of human envy (for example,
Fliessbach et al. 2007).
What might large-scale envy do to the mental health of a whole society? Currently,
almost nothing is known by social scientists about the longitudinal consequences of envy. A
search on the Web of Science, for example, reveals that, although there are over 2000
published papers in social-science journals that mention the topic of envy, essentially none of
this research uses statistically representative or large-scale longitudinal data. This is for the
understandable reason that data sets on recorded envy levels have been exceptionally rare.
The contribution of this paper is to try to fill the lacuna by providing new evidence on
the longitudinal nature of envy and psychological well-being. The study examines data on
envy using a sample of 18,000 randomly selected men and women who are interviewed in
2005 and then re-interviewed in the years 2009 and 2013. This data set is a statistically
4
representative population sample and comes from the nation of Australia. The paper
addresses research questions that include:
What are the empirical connections, in the short and long run, between envy and
psychological health?
How do envious feelings alter over the human life-cycle?
Might being envious (or perceiving oneself to be envious) have a valuable or positive side --
perhaps as a kind of motivator?
Are changes in envy part of the explanation for U-shaped well-being over the course of life?
The third of these questions links to an emerging literature on the potential difference between
‘malicious’ envy and ‘benign’ envy (Parks, Rumble, & Posey 2002; Smith & Kim, 2007; and
Van de Ven et al. 2009, and recent arguments against such a distinction have been proposed
by Cohen-Charash & Larson 2017). A later part of the paper provides a test of whether self-
reported enviousness is associated with beneficial outcomes in the future. However, the
survey data at hand do not allow us to isolate the specific form of envy (i.e., malicious,
benign, or general) which may be driving this result.
Background
The modern study of human well-being has led to a large literature across the
behavioral, social, and medical sciences (e.g., Diener et al., 1999; Easterlin, 2003; Steptoe,
Wardle, & Marmot, 2005; Scollon & Diener, 2006; Fowler & Christakis, 2008; De Neve &
Oswald, 2012; Boyce et al., 2013; White et al., 2013). A particular concern has been that of
how happiness and mental health alter as people grow older (Mroczek & Spiro, 2005;
Blanchflower & Oswald, 2008; Stone et al., 2010; Lang et al., 2011; Cheng, Powdthavee, &
Oswald 2017; Graham & Pozuelo, 2017), and some of the latest research has begun to
examine the different constituent emotions -- such as worry, anger, joy -- that lie below, and
5
are presumably themselves determining elements of, the lifetime pattern of overall human
well-being. Research on these detailed emotions is largely in its infancy. Moreover, with
important but rare exceptions (Scollon & Diener, 2006; Kunzmann, Richter, & Schmukle,
2013; Charles, Reynolds, & Gatz, 2001), much of the large-scale research has been cross-
sectional (Stone et al., 2010; Henniger & Harris, 2015; Van de Ven, 2017).
It is necessary for the methodology of studies such as the current one to take the view
that, although people’s survey answers about how they feel will almost certainly contain some
measurement error, such survey answers also provide some element of reliable information.
There are precedents for this and there is evidence that people mean what they say (Vetschera
& Kainz, 2013; Oswald & Wu, 2010). More broadly, the paper is a contribution to the
existing literature on envy, which includes work in a number of sciences (Fliessbach et al.,
2007; Takashi et al., 2009; Swencioncis & Fiske, 2014) and social psychology (Buss et al.,
1992; Parks, Rumble, & Posey 2002; Smith & Kim 2007; Van De Ven, Zeelenberg, &
Pieters, 2010; Hill, DelPriore, & Vaughan, 2011; Lange & Crusius, 2015). Research by
economists includes Varian (1974), Kirchsteiger (1994), Mui (1995), Feldman & Kirman
(1974), Grinblatt, Keloharju & Ikaheimo (2008), Chen & Li (2009) and Winkelmann (2012).
A related set of studies also examines the empirical association between dispositional envy
and individual mental health outcomes. For example, Smith et al. (1999) study a sample of
undergraduate university students and find self-reported measures of envy to be negatively
correlated with one’s self-esteem and positively correlated with the incidence of depression.
Similarly, Gold (1996) reports an association between enviousness and anxiety as well as
depression. Nevertheless, the present paper’s analysis is of a different kind than has
previously been done. This is due to our ability to follow the same representative group of
randomly selected adults over a prolonged period of time, while observing changes in their
feelings of envy and in their mental health and subjective well-being as well as later economic
outcomes.
6
Method
The data come from the Household, Income and Labour Dynamics in Australia
(HILDA) Survey. This is a nationally-representative longitudinal survey which was first
conducted in 2001. The HILDA Survey collects annual information from members of
Australian households who are at least 15 years of age. It began providing information on a
total of 13,969 individuals from 7,682 different households interviewed since the first survey
wave. Data are collected each year by face-to-face interviews and self-completion
questionnaires. The former technique is mainly used to record demographic and
socioeconomic information, while the latter is used to measure respondent health behaviours
and lifestyle choices. Overall, quality individual-level information is collected on a variety of
general and specialised topics including labour market dynamics, income and education
levels, family composition, as well as the physical and emotional well-being of individuals.
The analysis in the present study uses Waves 5, 9 and 13 (years 2005, 2009, 2013) of
the HILDA Survey. It is in these survey waves only that the unique and direct measures of
individual feelings of envy (and jealousy) are available. The exact questions asked of the
survey respondents are worded as follows:
“How well do the following words describe you? For each word, cross one box to
indicate how well that word describes you. There are no right or wrong answers.” –
Envious; Jealous.
with possible responses ranging on a seven-point scale from (1) ‘Does not describe me at all’
to (7) ‘Describes me very well’. These are the main dependent variables used in our fixed-
effects regression equations. After excluding respondents with missing information on the key
7
outcome and other control variables, the total available sample is 18,345 individuals (aged 15
to 101) and 34,019 person-year observations. Overall, the average self-reported envy score is
2.66 with a standard deviation of 1.42. The median response to this question is equal to 2, and
the distribution of responses is positively skewed, with more than 70 percent of respondents
choosing an envy score of less than 4 out of 7. A similar distribution of responses is apparent
for self-reported jealousy, with a mean score of 2.37 and a standard deviation of 1.46.
A referee has pointed out that we could use the word ‘enviousness’ rather than ‘envy’.
The former is almost never used in the scientific published literature (a search of the Web of
Science produces 4 mentions compared to approximately 2300 mentions); conventional
dictionaries typically treat the words as synonyms. In this paper we adopt the latter term.
We also checked, and replicated, the analysis using measures of jealousy (rather than
envy). Because the statistical equation structures turn out to be similar, we have concentrated
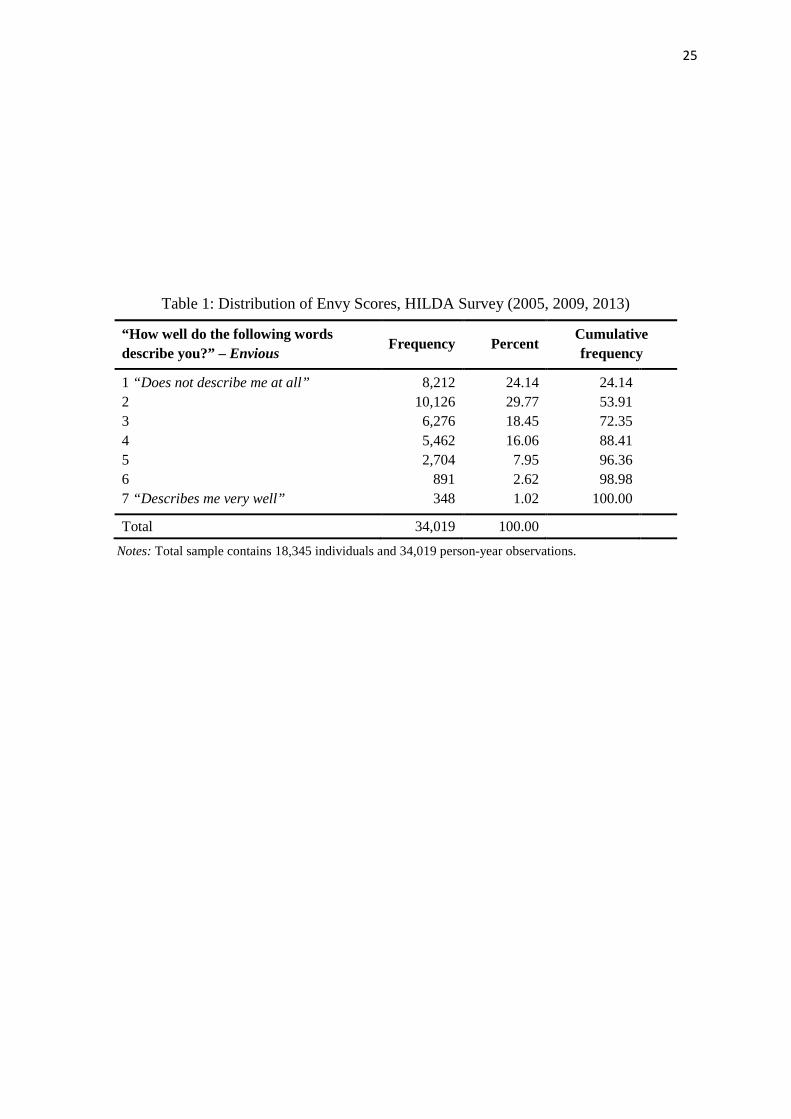
on envy; equivalent results on jealousy are available on request. Table 1 displays the overall
response frequency for the envy outcome measure.
Another feature of the HILDA Survey is the available information on recent
occurrences of major life events including shocks to personal finances (e.g., winning the
lottery, receiving an inheritance, or going bankrupt); getting married; being promoted at work;
being fired; and becoming retired. Specifically, respondents are told:
We now would like you to think about major events that have happened in your life over
the past 12 months. For each statement cross the YES box or the NO box to indicate
whether each event happened during the past 12 months. If you answer ‘YES’, then also
cross one box to indicate how long ago the event happened or started. This information
is given by quarter.
Since such positive and negative life events are likely to influence human envy and
jealousy levels, we also account for these shocks in our formal analysis. The life event
covariates are summarised in Table S3. In the total sample, we observe close to 25,000
reported life events, with the most common event being ‘change of residence’ (17% of total
8
occurrences) followed by ‘change of job’ (13%) and ‘serious personal injury or illness’ (9%).
The death of a spouse or child is the least observed event (1%). A long list of other
socioeconomic and lifestyle factors -- such as income, physical health, employment and
marital status, which are also included as added controls in the regression equations -- is
summarised in Table S1.
The paper uses data on two different measures of psychological well-being. As a
general outcome measure of a person’s mental health, we take the SF-36 Mental Health
Index, which forms one of eight aggregated scales in the Medical Outcomes Short Form (SF-
36) Questionnaire. The SF-36 is a one of the most widely used and validated self-completion
measures of health status available (Butterworth & Crosier 2004). The Mental Health Index is
a 5-item scale consisting of the following five questions “How much of the time in the
previous 4 weeks: Have you been a very nervous person? Have you felt so down in the dumps
that nothing could cheer you up? Have you felt calm and peaceful? Have you felt down? Have
you been a happy person?” The raw survey responses are transformed and standardised to a
100-point scale ranging from 0 (worst) to 100 (best mental health). This aggregated variable
has a mean of 74.65 and a standard deviation of 16.82. Second, reported life-satisfaction data
are derived from the question: “All things considered, how satisfied are you with your life?”
Respondents are told to: “Pick a number between 0 and 10 to indicate how satisfied you are”,
and that “the more satisfied you are the higher number you should pick”. The full sample
mean is 7.91 with a standard deviation of 1.41. About two-thirds of respondents give a life
satisfaction score of more than 7 out of 10.
Results
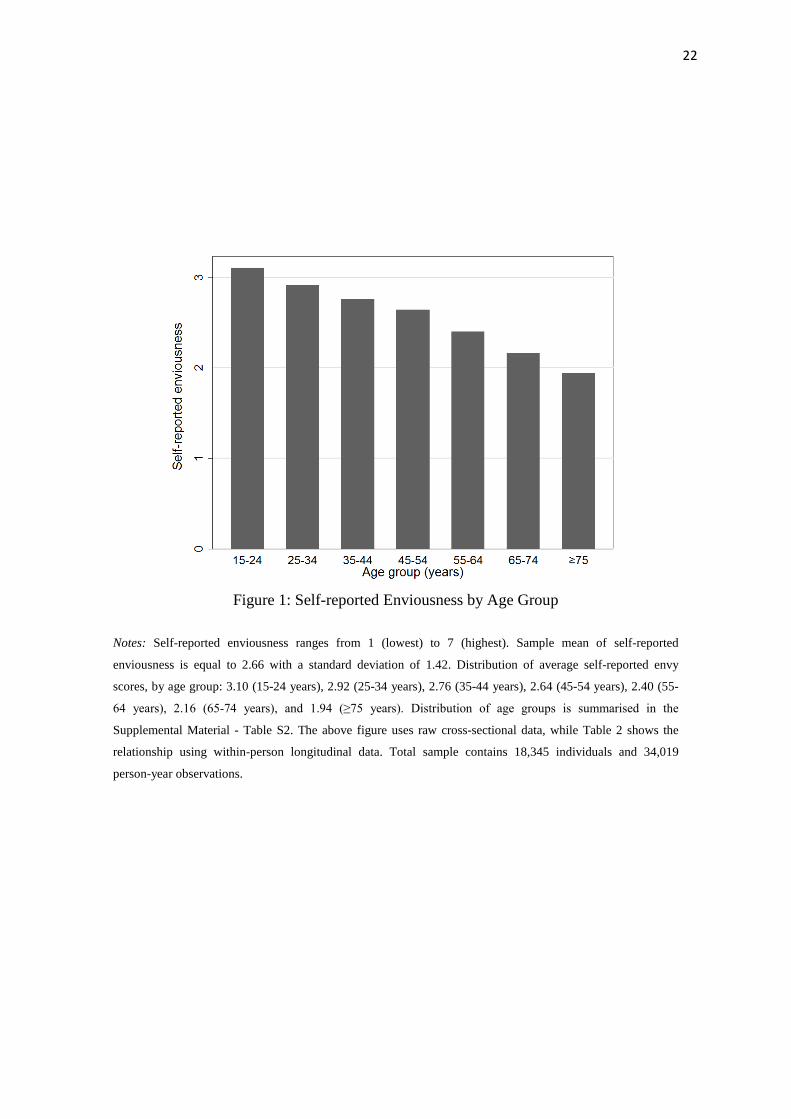
Fig. 1 illustrates the study’s first finding, which is based on 34,019 person-year
observations. It plots the (uncorrected) downward-sloping relationship between envy and age.
9
Here the level of envy is scaled using seven integers in the way described in Table 1. The
mean level of envy falls from approximately 3.2 among young people to approximately 1.9
among those older than 75 years. Women report slightly lower scores than men (shown in
Fig. S1 in the Supplemental Material). Figure 1 is effectively cross-sectional, so is subject to
standard statistical concerns, including the possibility that the negative slope is some form of
spurious pattern generated by cohort effects.
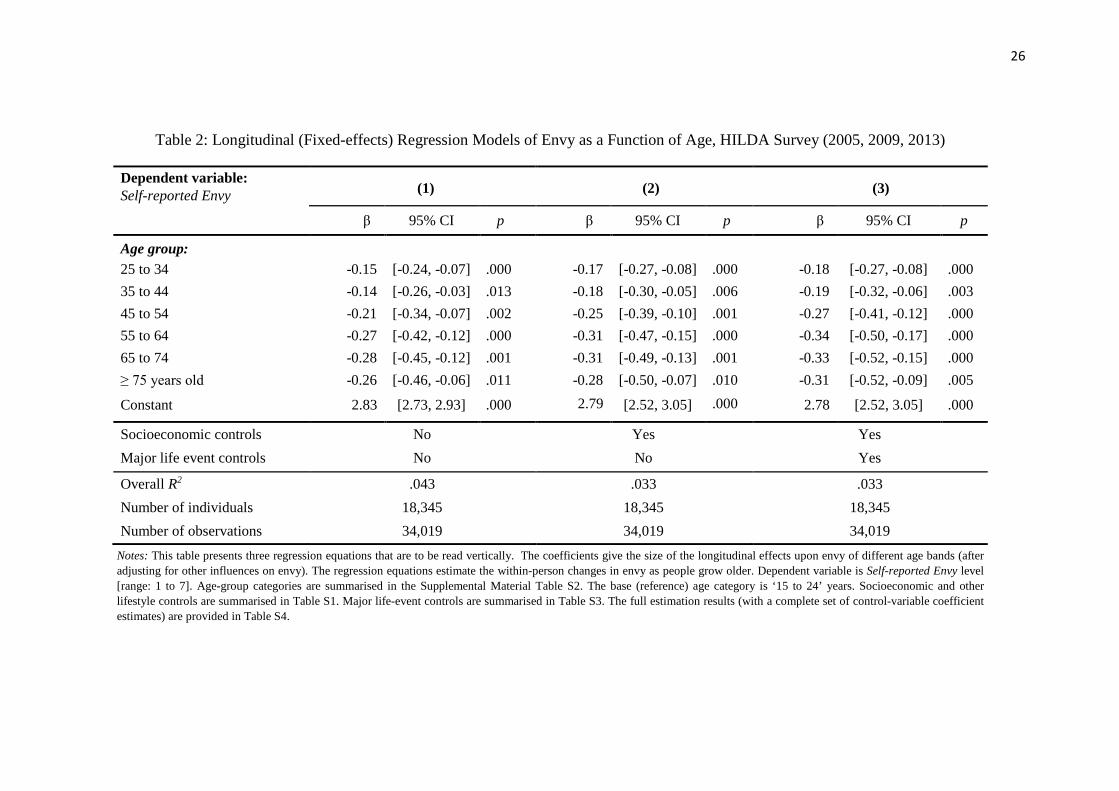
Table 2 turns to a formal longitudinal analysis of envy. Here the individuals are
followed through time and the statistical calculations adjust for a range of other influences.
Table 2 provides ‘within-person’ estimates using fixed-effects regression equations. These
are derived by observing how the envy scores of individuals alter as those individuals
themselves grow steadily older between 2005 and 2013. In Table 2, the reference category is
15-24 years old. Hence the Table shows that the group aged 25-34 have, in the final column
of Table 2, approximately -0.18 lower envy than those aged 15-24. The group aged greater
than 75 years old have -0.31 lower envy. These findings are qualitatively consistent with
cross-sectional results by Henniger & Harris (2015). They are also compatible with Laura
Carstensen’s socioemotional selectivity theory and related literature (Carstensen, Pasupathi,
Mayr, & Nesselroade, 2000; Charles, Mather, & Carstensen 2003; Gross et al., 1997; Brassen
et al., 2012) in which it is postulated that aging helps humans to regulate their feelings of
negative affect. The complete regression equations behind Table 2 can be seen in Table S4 in
the Supplemental Material.
Another related and important strand of empirical research is that on the difference
between positive and negative hedonic well-being, and in particular the finding that while
positive human emotions tend to track together, negative emotions do not (see Stone and
Mackie, 2013). To this end, we also compared the empirical patterns found for our self-
reported envy and jealously measures to those which may arise for other negative emotions or
experiences such as feeling ‘fretful’; ‘moody’; ‘temperamental’; and ‘touchy’. These
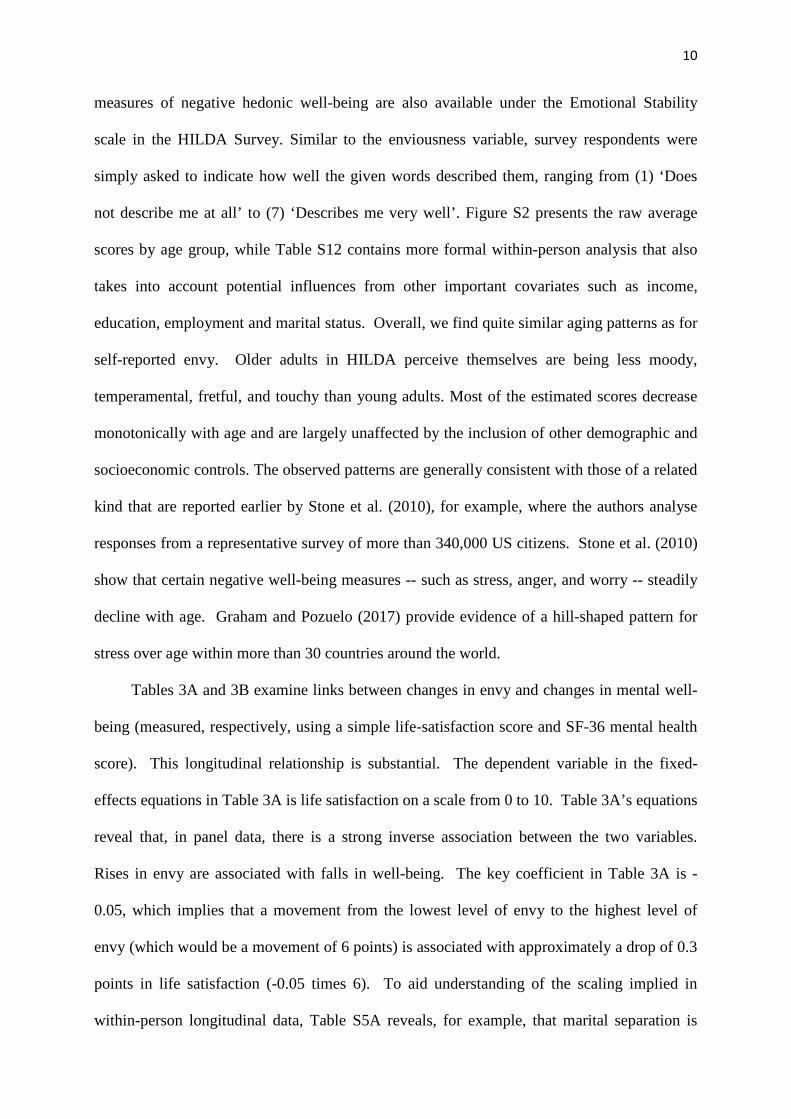
10
measures of negative hedonic well-being are also available under the Emotional Stability
scale in the HILDA Survey. Similar to the enviousness variable, survey respondents were
simply asked to indicate how well the given words described them, ranging from (1) ‘Does
not describe me at all’ to (7) ‘Describes me very well’. Figure S2 presents the raw average
scores by age group, while Table S12 contains more formal within-person analysis that also
takes into account potential influences from other important covariates such as income,
education, employment and marital status. Overall, we find quite similar aging patterns as for
self-reported envy. Older adults in HILDA perceive themselves are being less moody,
temperamental, fretful, and touchy than young adults. Most of the estimated scores decrease
monotonically with age and are largely unaffected by the inclusion of other demographic and
socioeconomic controls. The observed patterns are generally consistent with those of a related
kind that are reported earlier by Stone et al. (2010), for example, where the authors analyse
responses from a representative survey of more than 340,000 US citizens. Stone et al. (2010)
show that certain negative well-being measures -- such as stress, anger, and worry -- steadily
decline with age. Graham and Pozuelo (2017) provide evidence of a hill-shaped pattern for
stress over age within more than 30 countries around the world.
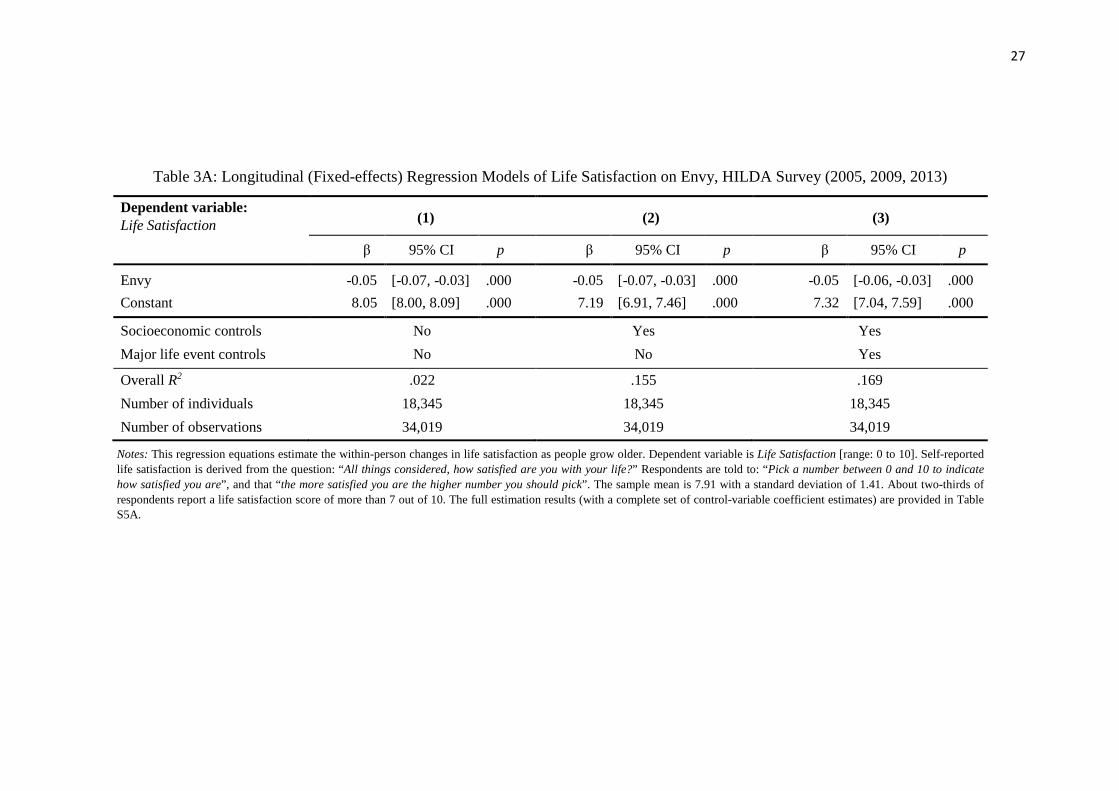
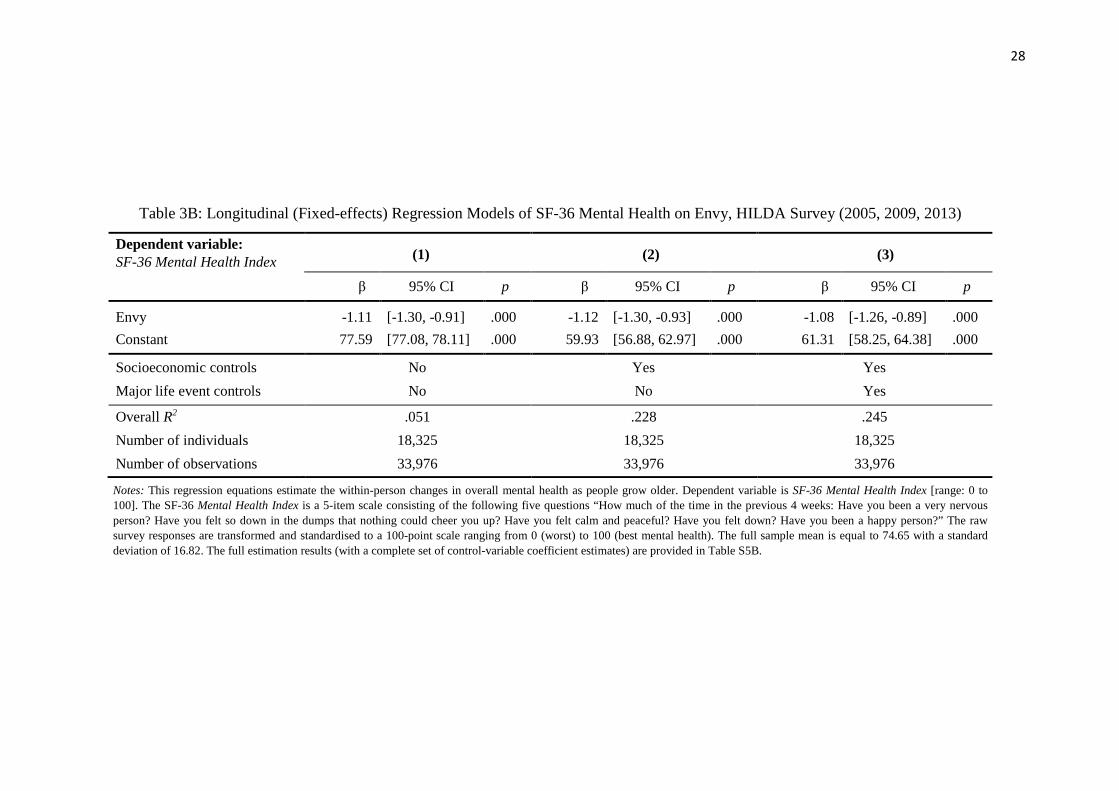
Tables 3A and 3B examine links between changes in envy and changes in mental well-
being (measured, respectively, using a simple life-satisfaction score and SF-36 mental health
score). This longitudinal relationship is substantial. The dependent variable in the fixed-
effects equations in Table 3A is life satisfaction on a scale from 0 to 10. Table 3A’s equations
reveal that, in panel data, there is a strong inverse association between the two variables.
Rises in envy are associated with falls in well-being. The key coefficient in Table 3A is -
0.05, which implies that a movement from the lowest level of envy to the highest level of
envy (which would be a movement of 6 points) is associated with approximately a drop of 0.3
points in life satisfaction (-0.05 times 6). To aid understanding of the scaling implied in
within-person longitudinal data, Table S5A reveals, for example, that marital separation is
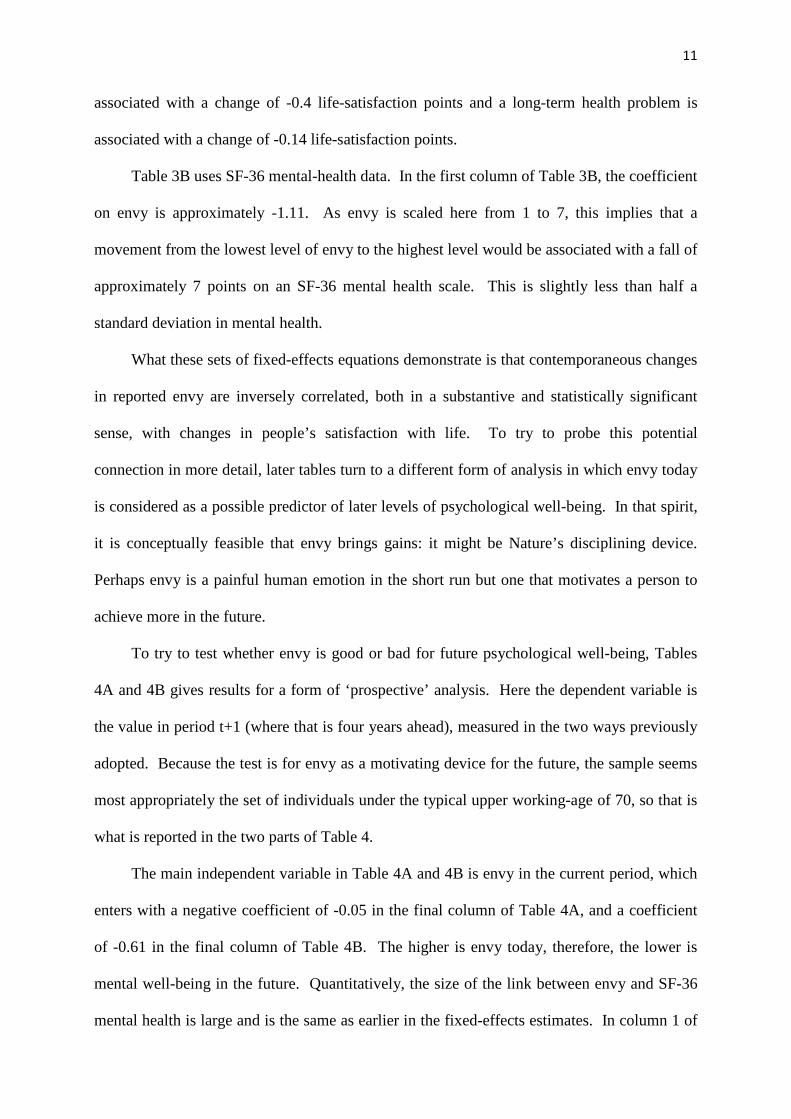
11
associated with a change of -0.4 life-satisfaction points and a long-term health problem is
associated with a change of -0.14 life-satisfaction points.
Table 3B uses SF-36 mental-health data. In the first column of Table 3B, the coefficient
on envy is approximately -1.11. As envy is scaled here from 1 to 7, this implies that a
movement from the lowest level of envy to the highest level would be associated with a fall of
approximately 7 points on an SF-36 mental health scale. This is slightly less than half a
standard deviation in mental health.
What these sets of fixed-effects equations demonstrate is that contemporaneous changes
in reported envy are inversely correlated, both in a substantive and statistically significant
sense, with changes in people’s satisfaction with life. To try to probe this potential
connection in more detail, later tables turn to a different form of analysis in which envy today
is considered as a possible predictor of later levels of psychological well-being. In that spirit,
it is conceptually feasible that envy brings gains: it might be Nature’s disciplining device.
Perhaps envy is a painful human emotion in the short run but one that motivates a person to
achieve more in the future.
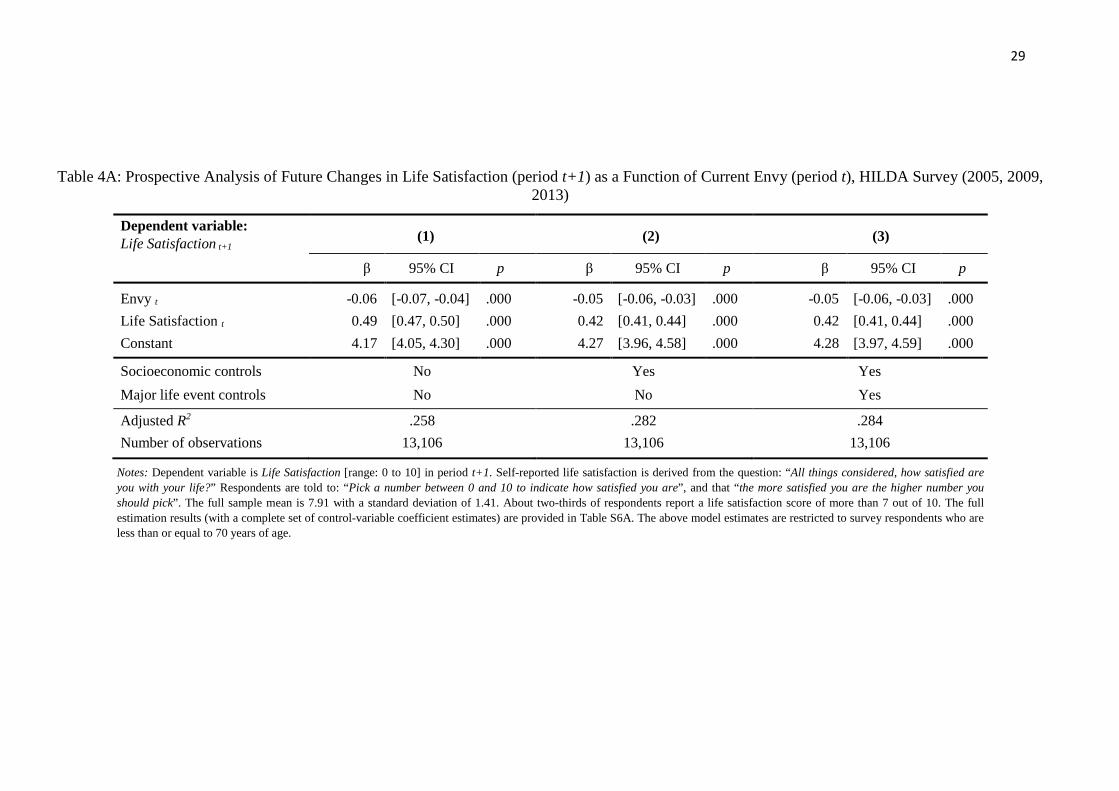
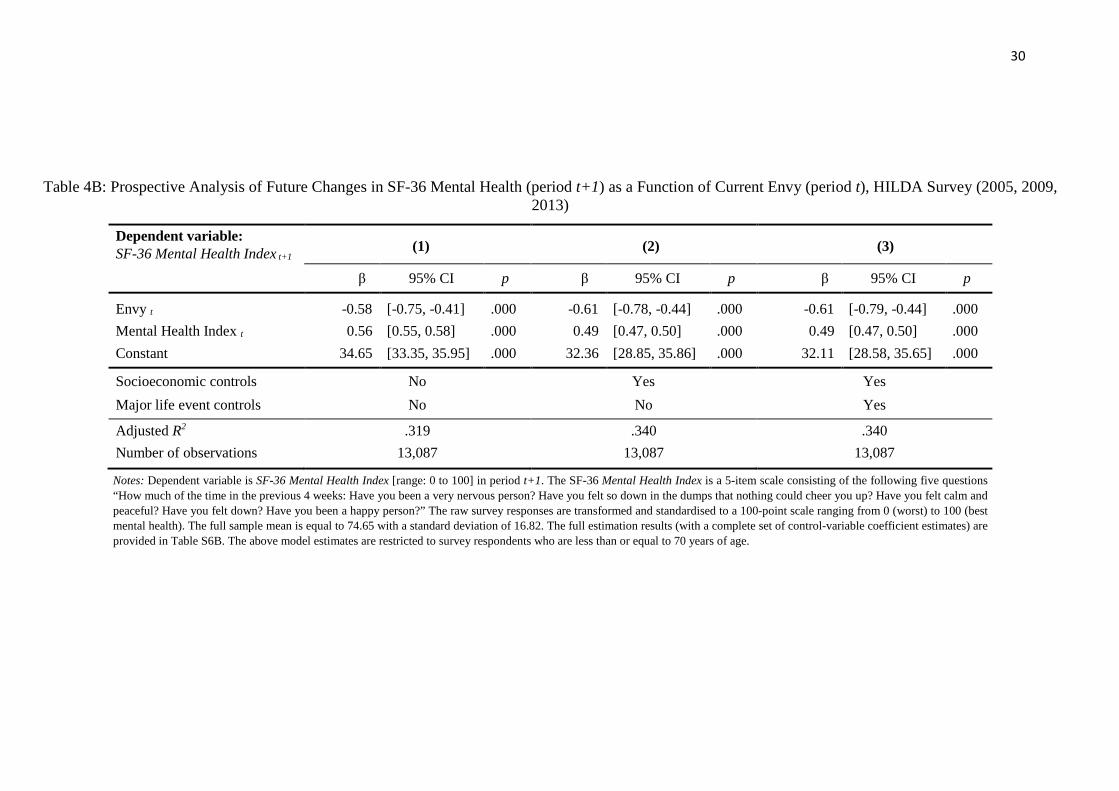
To try to test whether envy is good or bad for future psychological well-being, Tables
4A and 4B gives results for a form of ‘prospective’ analysis. Here the dependent variable is
the value in period t+1 (where that is four years ahead), measured in the two ways previously
adopted. Because the test is for envy as a motivating device for the future, the sample seems
most appropriately the set of individuals under the typical upper working-age of 70, so that is
what is reported in the two parts of Table 4.
The main independent variable in Table 4A and 4B is envy in the current period, which
enters with a negative coefficient of -0.05 in the final column of Table 4A, and a coefficient
of -0.61 in the final column of Table 4B. The higher is envy today, therefore, the lower is
mental well-being in the future. Quantitatively, the size of the link between envy and SF-36
mental health is large and is the same as earlier in the fixed-effects estimates. In column 1 of
12
Table 4B, for example, the coefficient on the lagged dependent variable is 0.56, and the
coefficient on envy is -0.58. Hence the putative long-run consequences of envy can be
viewed here as given approximately by a coefficient of -1.3 on envy (where we solve out for
the implied long-run equilibrium of a discrete difference equation using the calculation [1/(1–
0.56) multiplied by -0.58] = 1.3 approx.). Tables S6A and S6B in the Supplemental Material
discusses the other current variables that are predictive of future well-being and mental health.
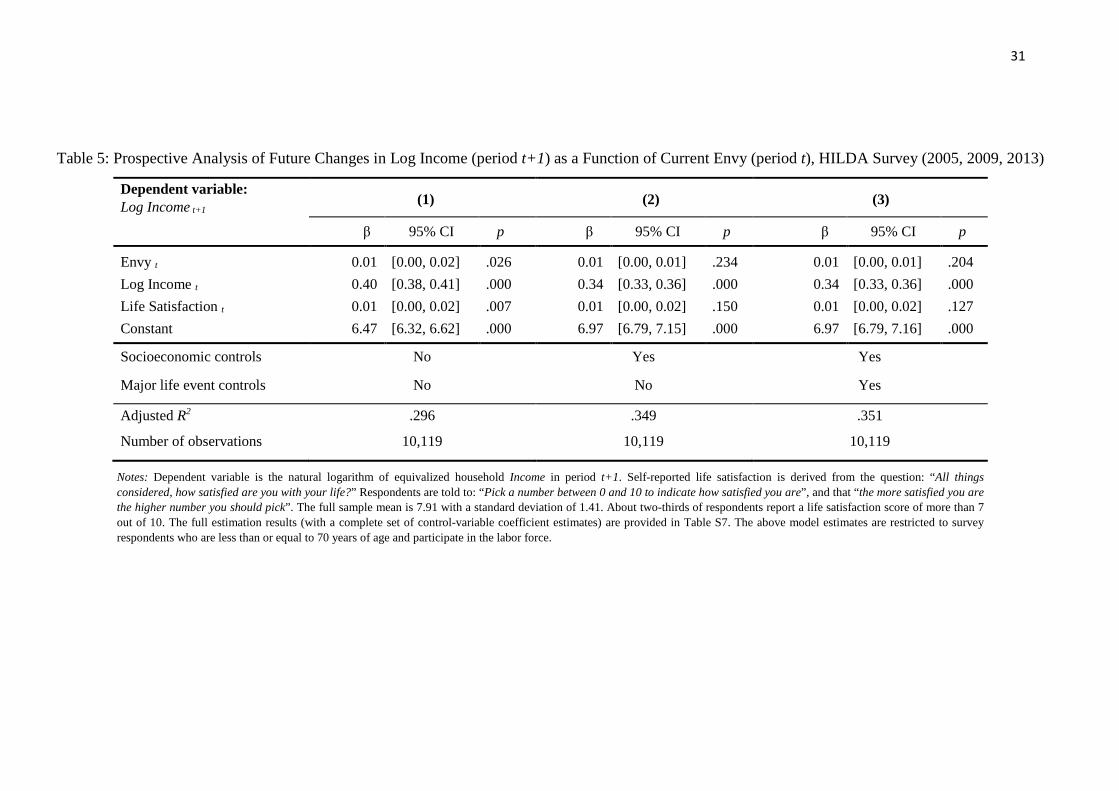
Table 5 looks at the equivalent issue for future economic prosperity. It, also, fails to
find evidence for a beneficial long-term effect from being envious today. In the final column
of Table 5, the coefficient on envy does enter positively, but it has a tiny coefficient (of 0.01)
and a p-value of 0.204. It is not possible to reject the null hypothesis of a zero effect from
envy upon later income.
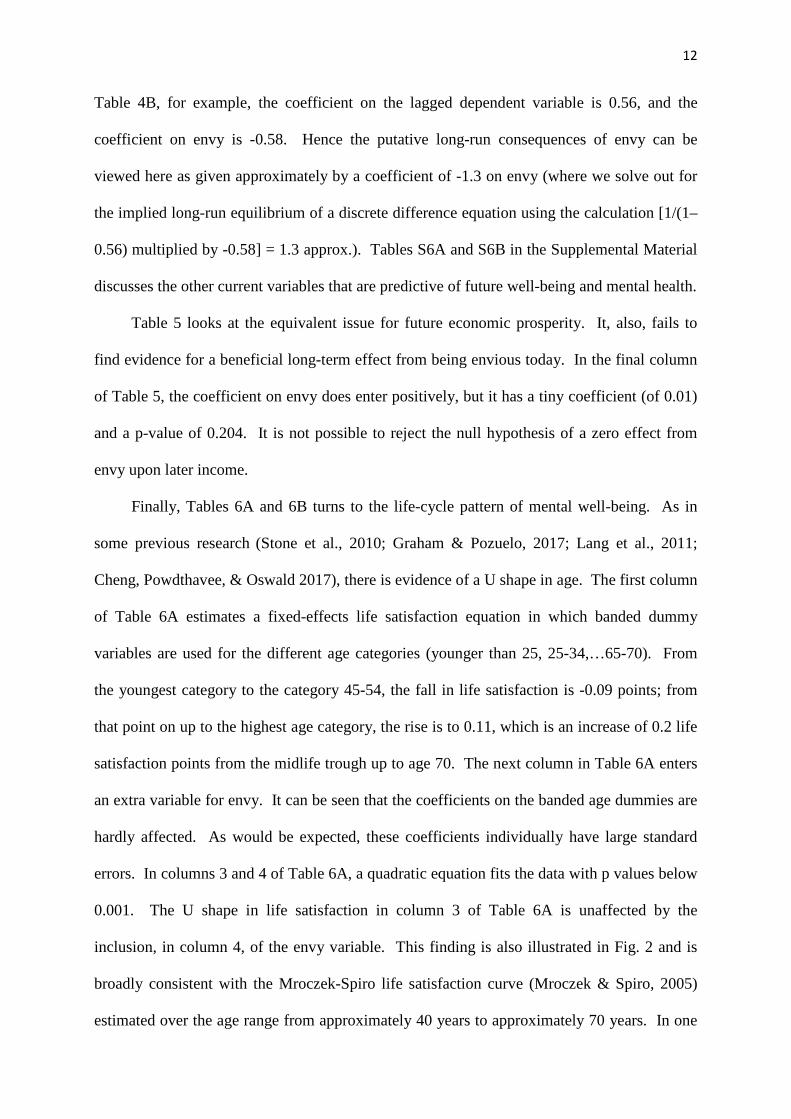
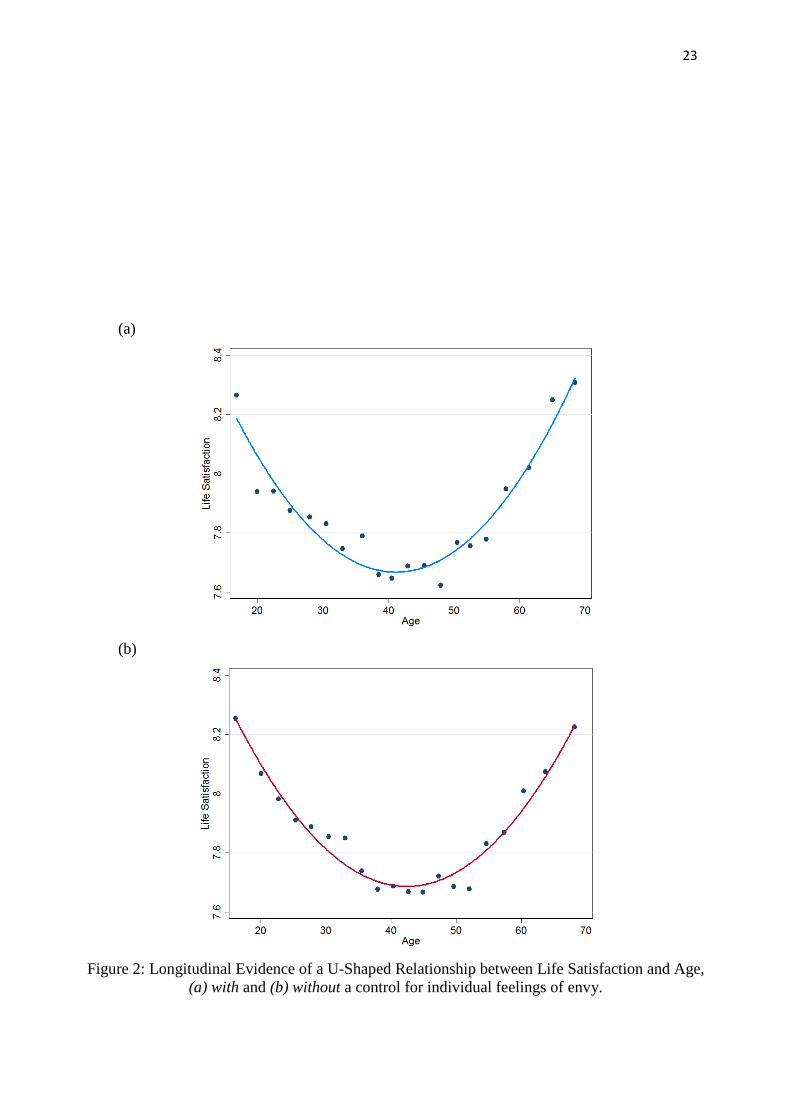
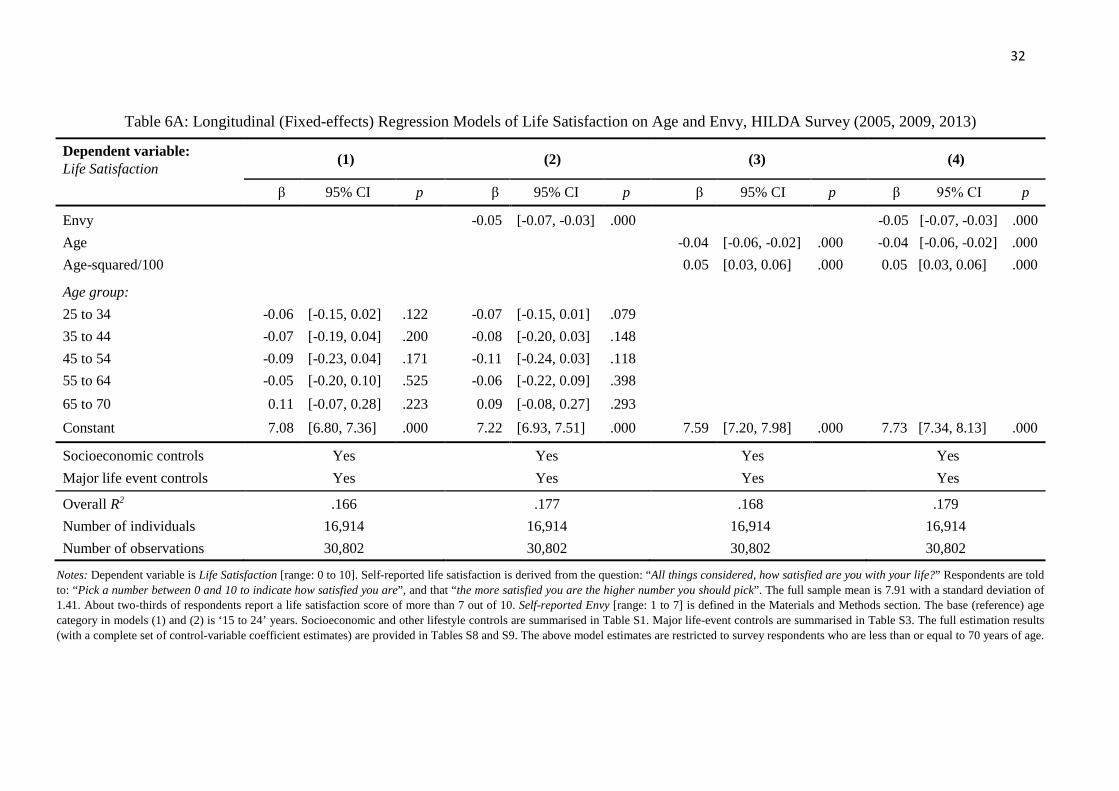
Finally, Tables 6A and 6B turns to the life-cycle pattern of mental well-being. As in
some previous research (Stone et al., 2010; Graham & Pozuelo, 2017; Lang et al., 2011;
Cheng, Powdthavee, & Oswald 2017), there is evidence of a U shape in age. The first column
of Table 6A estimates a fixed-effects life satisfaction equation in which banded dummy
variables are used for the different age categories (younger than 25, 25-34,…65-70). From
the youngest category to the category 45-54, the fall in life satisfaction is -0.09 points; from
that point on up to the highest age category, the rise is to 0.11, which is an increase of 0.2 life
satisfaction points from the midlife trough up to age 70. The next column in Table 6A enters
an extra variable for envy. It can be seen that the coefficients on the banded age dummies are
hardly affected. As would be expected, these coefficients individually have large standard
errors. In columns 3 and 4 of Table 6A, a quadratic equation fits the data with p values below
0.001. The U shape in life satisfaction in column 3 of Table 6A is unaffected by the
inclusion, in column 4, of the envy variable. This finding is also illustrated in Fig. 2 and is
broadly consistent with the Mroczek-Spiro life satisfaction curve (Mroczek & Spiro, 2005)
estimated over the age range from approximately 40 years to approximately 70 years. In one
13
sense, this is discouraging: it might be hoped that the perplexing rise in life satisfaction from
midlife could be explained partly by a decline in feelings of envy. In another sense, it is
scientifically valuable, because it implies that evidence for a U shape is apparently robust
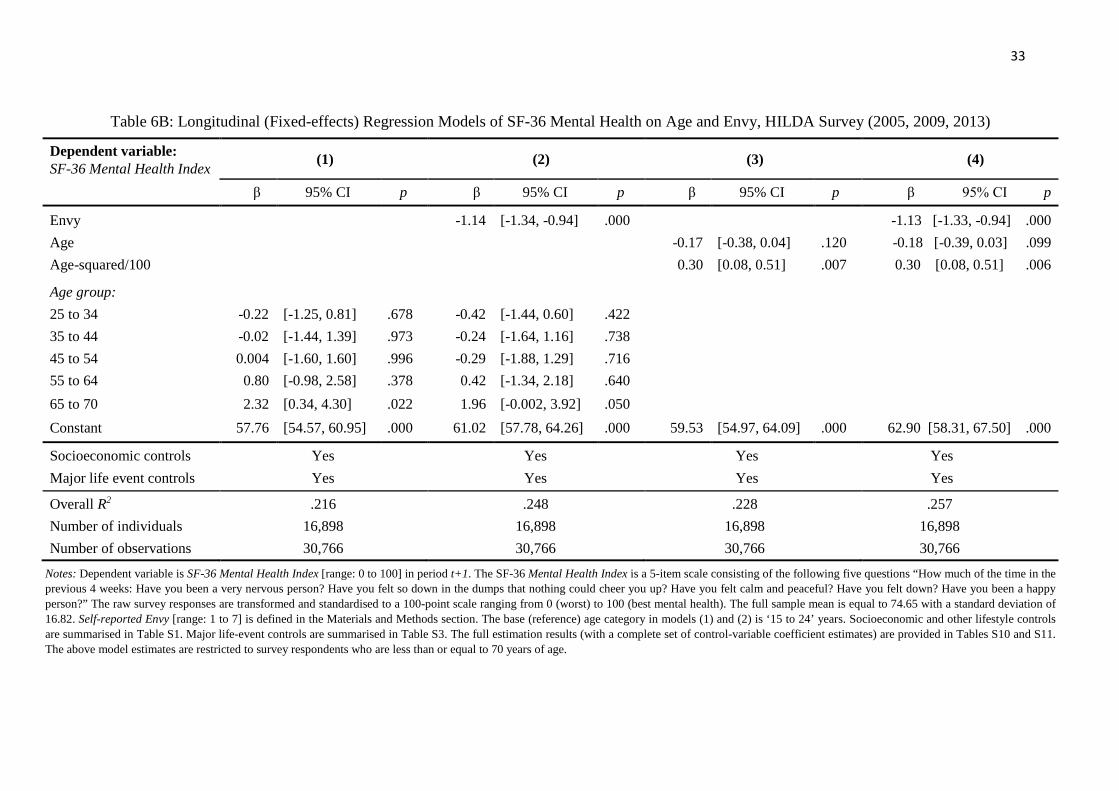
even to the inclusion of such a powerful variable. The standard errors in Table 6B are,
broadly, too large to allow definite conclusions about aging, although in the final column
there are signs of a convex relationship between SF-36 mental health and age.
Further checks and details are reported in Tables S7-S11 in the Supplemental Material.
These lay out a set of further regression equations.
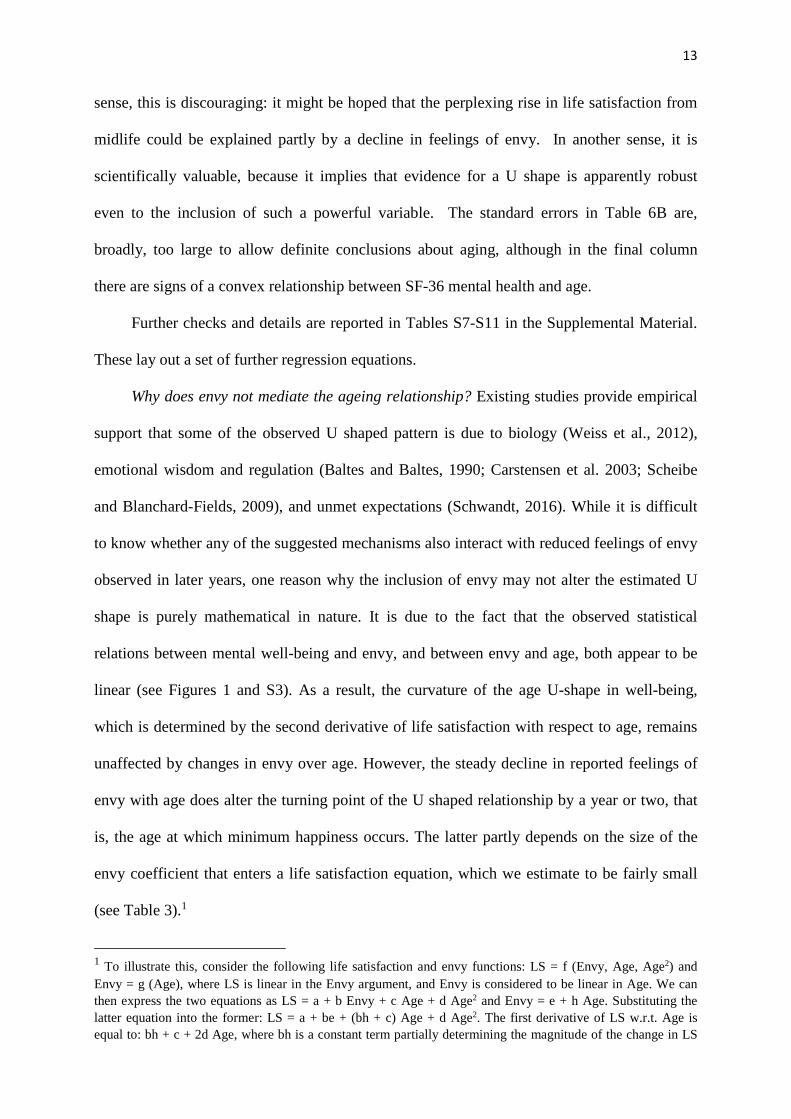
Why does envy not mediate the ageing relationship? Existing studies provide empirical
support that some of the observed U shaped pattern is due to biology (Weiss et al., 2012),
emotional wisdom and regulation (Baltes and Baltes, 1990; Carstensen et al. 2003; Scheibe
and Blanchard-Fields, 2009), and unmet expectations (Schwandt, 2016). While it is difficult
to know whether any of the suggested mechanisms also interact with reduced feelings of envy
observed in later years, one reason why the inclusion of envy may not alter the estimated U
shape is purely mathematical in nature. It is due to the fact that the observed statistical
relations between mental well-being and envy, and between envy and age, both appear to be
linear (see Figures 1 and S3). As a result, the curvature of the age U-shape in well-being,
which is determined by the second derivative of life satisfaction with respect to age, remains
unaffected by changes in envy over age. However, the steady decline in reported feelings of
envy with age does alter the turning point of the U shaped relationship by a year or two, that
is, the age at which minimum happiness occurs. The latter partly depends on the size of the
envy coefficient that enters a life satisfaction equation, which we estimate to be fairly small
(see Table 3).1
1 To illustrate this, consider the following life satisfaction and envy functions: LS = f (Envy, Age, Age2) and
Envy = g (Age), where LS is linear in the Envy argument, and Envy is considered to be linear in Age. We can
then express the two equations as LS = a + b Envy + c Age + d Age2 and Envy = e + h Age. Substituting the
latter equation into the former: LS = a + be + (bh + c) Age + d Age2. The first derivative of LS w.r.t. Age is
equal to: bh + c + 2d Age, where bh is a constant term partially determining the magnitude of the change in LS
14
Discussion
One view of the modern world, and especially of western society, is that it is
unconsciously developing a set of institutions -- including social media and large-scale
advertising -- that make people feel envious and inadequate. If so, it is of scholarly and policy
importance to try to understand how envy might affect people’s mental health.
This paper is the first to be able to study envy within a nationally representative
longitudinal data set. The paper offers four contributions. First, it cross-validates in panel
data the recent cross-section result of Henniger & Harris (2015) that older adults have
monotonically lower levels of envy than young adults. Second, it shows that envy today is
predictive of reduced psychological health, both contemporaneously and in the future. Third,
the paper can find no evidence that envy is beneficial (for example, as a future economic
motivator). Fourth, statistical evidence for U-shaped mental well-being is independent of
declining lifetime levels of envy.
For policy-makers, the existence of these mechanisms raises the concern, as Bertrand
Russell surmised, that a happier society may be one that somehow manages to foster lower
levels of envy. Whether that would be feasible, and if so whether it might be achieved by
some conscious government strategy, perhaps through policy on the nature of advertising or
as individuals age, with h being the corresponding component due to a change (estimated decrease) in one’s
level of Envy. Consequently, the second derivative of LS w.r.t. Age is equal to: 2d, which is independent of the
above bh term. The minimum point of the expanded LS function occurs at age: −(bh+c)/(2d), where we find c <
0 and | c | > bh. Since the magnitude of b is reasonably small (see Table 3), when compared to the sum of other
influences upon the well-being gradient, the turning point of the U curve is moved only by a comparatively small
amount (i.e., a year or two).

15
education or social media, are profound issues on which this study cannot adjudicate. Much
remains to be understood about envy and mental health in modern society. These issues
demand attention.
16
References
Appel H, Gerlach AL, Crusius J (2015). The interplay between Facebook use, social
comparison, envy, and depression. Current Opinion in Psychology 9, 44-49.
Baltes P B, Baltes M M (1990). Psychological perspectives on successful aging: The model of
selective optimization with compensation. Successful Aging: Perspectives from the
Behavioral Sciences, 1(1), 1-34.
Blanchflower DG, Oswald AJ (2008). Is well-being U-shaped over the life cycle? Social
Science & Medicine 66, 1733-1749.
Boyce CJ, Wood AM, Banks J, Clark AE, Brown GDA (2013). Money, well-being and loss
averson: Does an income loss have a greater effect on well-being than an equivalent
income gain? Psychological Science 24, 2557-2562.
Brassen S, Gamer M, Peters J, Gluth S, Büchel C (2012). Don’t look back in anger!
Responsiveness to missed chances in successful and non-successful aging. Science 336,
612-614.
Buss D M, Larsen RJ, Westen D, Semmelroth J (1992). Sex differences in jealousy:
Evolution, physiology, and psychology. Psychological Science, 3(4), 251-255.
Butterworth P, Crosier T (2004). The validity of the SF-36 in an Australian National
Household Survey: Demonstrating the applicability of the Household Income and Labour
Dynamics in Australia (HILDA) Survey to examination of health inequalities. BMC Public
Health, 4(1), 44.
Carstensen L L, Fung H H, Charles S T (2003). Socioemotional selectivity theory and the
regulation of emotion in the second half of life. Motivation and Emotion, 27(2), 103-123.
Carstensen LL, Pasupathi M, Mayr U, Nesselroade J R (2000). Emotional experience in
everyday life across the adult life span. Journal of Personality and Social Psychology,
79(4), 644-655.
17
Charles ST, Mather M, Carstensen LL (2003). Aging and emotional memory: The forgettable
nature of negative images for older adults. Journal of Experimental Psychology - General
132(2), 310–324.
Charles ST, Reynolds CA, Gatz M (2001). Age-related differences and change in positive and
negative affect over 23 years. Journal of Personality and Social Psychology 80(1), 136-
151.
Chen Y, Li SX (2009). Group identity and social preferences. American Economic Review
99(1), 431-457.
Cheng T, Powdthavee N, Oswald AJ (2017). Longitudinal evidence for a midlife nadir in
human well-being: Results from four data sets. Economic Journal 127 (599), 126-142.
Christakis N, Shakya HB (2017). Association of Facebook use with compromised well-being:
A longitudinal study. American Journal of Epidemiology 185(3), 203-211.
Cohen-Charash Y, Larson EC (2017). An emotion divided: Studying envy is better than
studying ‘benign’ envy and ‘malicious’ envy. Current Directions in Psychological Science
26(2), 174-183.
De Neve J, Oswald, AJ (2012). Estimating the influence of life satisfaction and positive affect
upon later income using sibling fixed effects. Proceedings of the National Academy of
Sciences of the USA 109, 19953-19958.
Diener E, Suh EM, Lucas RE, Smith HL (1999). Subjective well-being: Three decades of
progress. Psychological Bulletin 125(2), 276-302.
Easterlin RA (2003). Explaining happiness. Proceedings of the National Academy of Sciences
of the USA 100(19), 11176-11183.
Feldman A, Kirman A (1974). Fairness and envy. American Economic Review 64(6), 995-
1005.
18
Fliessbach K, Weber B, Trautner P, Dohmen T, Sunde U, Elger CE, Falk A (2007). Social
comparison affects reward-related brain activity in the human ventral striatum. Science
318, 1305-1308.
Fowler JH, Christakis NA (2008). Dynamic spread of happiness in a large social network:
Longitudinal analysis over 20 years in the Framingham Heart Study. BMJ 337, a2338.
Gold BT (1996). Enviousness and its relationship to maladjustment and psychopathology.
Personality and Individual Differences 21, 311-321.
Grinblatt M, Keloharju M, Ikaheimo S (2008). Social influence and consumption: Evidence
from the automobile purchases of neighbors. Review of Economics and Statistics 90(4),
735-753.
Graham C, Pozuelo JR (2017). Happiness, stress, and age: How the U curve varies across
people and places. Journal of Population Economics 30(1), 225-264.
Gross JJ, Carstensen LL, Pasupathi M, Tsai J, Skorpen CG, Hsu AYC (1997). Emotion and
aging: Experience, expression, and control. Psychology and Aging 12(4), 590–599.
Henniger NE, Harris CR (2015). Envy across adulthood: The what and the who. Basic and
Applied Psychology 37(6), 303–318.
Hill S E, DelPriore DJ, Vaughan PW (2011). The cognitive consequences of envy: attention,
memory, and self-regulatory depletion. Journal of Personality and Social Psychology
101(4), 653-666.
Kirchsteiger G (1994). The role of envy in ultimatum games. Journal of Economic Behavior
& Organization 25(3), 373-389.
Kunzmann U, Richter D, Schmukle SC (2013). Stability and change in affective experience
across the adult life span: Analyses with a national sample from Germany. Emotion 13(6),
1086–1095.
Lang IA, Llewellyn DJ, Hubbard RE, Langa KM, Melzer D (2011). Income and the midlife
peak in common mental disorder prevalence. Psychological Medicine 41, 1365-1372.
19
Lange J, Crusius J (2015). The tango of two deadly sins: The social-functional relation of
envy and pride. Journal of Personality and Social Psychology, 109(3), 453-472.
Mroczek DK, Spiro III A (2005). Change in life satisfaction during adulthood: findings from
the veterans affairs normative aging study. Journal of Personality and Social Psychology
88(1), 189-202.
Mui VL (1995). The economics of envy. Journal of Economic Behavior & Organization
26(3), 311–336.
Opree SJ, Buijen M, van Reijmersdal E (2016). The impact of advertising on children’s
psychological well-being and life satisfaction. European Journal of Marketing 50(11),
1975-1992.
Oswald AJ, Wu S (2010). Objective confirmation of subjective measures of human well-
being: Evidence from the USA. Science 327, 576-579.
Parks AA, Rumble AC, Posey DC (2002). The effects of envy on reciprocation in a social
dilemma. Personality & Social Psychology Bulletin, 28, 509-520.
Scheibe S, Blanchard-Fields F (2009). Effects of regulating emotions on cognitive
performance: what is costly for young adults is not so costly for older adults. Psychology
and aging, 24(1), 217.
Schwandt H (2016). Unmet aspirations as an explanation for the age U-shape in wellbeing.
Journal of Economic Behavior & Organization, 122, 75-87.
Scollon C N, Diener E (2006). Love, work, and changes in extraversion and neuroticism over
time. Journal of Personality and Social Psychology 91(6), 1152-1165.
Shensa A, Escobar-Viera CG, Sidani JE, Bowman ND, Marshal MP, Primack BA (2017).
Problematic social media use and depressive symptoms among US young adults: A
nationally representative study. Social Science & Medicine 182, 150-157.
Smith RH, Kim SH (2007). Comprehending envy. Psychological Bulletin 133(1), 46–64.
20
Smith RH, Parrott WG, Diener E, Hoyle RH, Kim SH (1999). Dispositional envy. Personality
and Social Psychology Bulletin, 25, 1007-1020.
Steptoe A, Wardle J, Marmot M (2005). Positive affect and health-related neuroendocrine,
cardiovascular, and inflammatory processes. Proceedings of the National Academy of
Sciences of the USA 102, 6508-6512.
Stone AA, Schwartz JE, Broderick JE, Deaton A (2010). A snapshot of the age distribution of
psychological well-being in the United States. Proceedings of the National Academy of
Sciences of the USA 107, 9985–9990.
Swencioncis JK, Fiske ST (2014). How social neuroscience can inform theories of social
comparison. Neuropsychologia 56, 140–146.
Takashi H, Kato M, Matsura M, Mobbs D, Suhara T, Okubo Y (2009). When your gain is my
pain and your pain is my gain: Neural correlates of envy and Schadenfreude. Science
32(5916), 937–939.
Tandoc EC, Ferrucci P, Duffy M (2015). Facebook use, envy, and depression among college
students: Is Facebook depressing? Computers in Human Behavior 43, 139-146.
Taylor DG, Strutton D (2016). Does Facebook usage lead to conspicuous consumption? The
role of envy, narcissism, and self-promotion. Journal of Research in Interactive Marketing
10(3), 231-248.
Van de Ven N (2017). Envy and admiration: Emotion and motivation following upward
comparison. Cognition and Emotion 31(1), 193–200.
Van de Ven N, Zeelenberg M, Pieters R (2009). Leveling up and down: The experiences of
benign and malicious envy. Emotion 9(3), 419-429.
Van de Ven N, Zeelenberg M, Pieters R. (2010). Warding off the evil eye: When the fear of
being envied increases prosocial behavior. Psychological Science 21(11), 1671-1677.
Varian HR (1974). Equity, envy, and efficiency. Journal of Economic Theory 9(1), 63-91.
21
Verduyn P, Lee DS, Park J, Shablack H, Orvell A, Bayer J, Ybarra O, Jonides J, Kross E
(2015). Passive Facebook usage undermines affective well-being: Experimental and
longitudinal evidence. Journal of Experimental Psychology - General 144(2), 480-488.
Vetschera R, Kainz G (2013). Do self-reported strategies match actual behavior in a social
preference experiment? Group Decision and Negotiation 22(5), 823–849.
Weiss A, King JE, Inoue-Murayama M, Matsuzawa T, Oswald AJ (2012). Evidence for a
midlife crisis in great apes consistent with the U-shape in human well-being. Proceedings
of the National Academy of Sciences, 109(49), 19949-19952.
White MP, Alcock I, Wheeler BW, Depledge MH (2013). Would you be happier living in a
greener urban area? A fixed-effects analysis of panel data. Psychological Science 24, 920-
928.
Winkelmann R (2012). Conspicuous consumption and satisfaction. Journal of Economic
Psychology 33(1), 183–191.
22
Figure 1: Self-reported Enviousness by Age Group
Notes: Self-reported enviousness ranges from 1 (lowest) to 7 (highest). Sample mean of self-reported
enviousness is equal to 2.66 with a standard deviation of 1.42. Distribution of average self-reported envy
scores, by age group: 3.10 (15-24 years), 2.92 (25-34 years), 2.76 (35-44 years), 2.64 (45-54 years), 2.40 (55-
64 years), 2.16 (65-74 years), and 1.94 (≥75 years). Distribution of age groups is summarised in the
Supplemental Material - Table S2. The above figure uses raw cross-sectional data, while Table 2 shows the
relationship using within-person longitudinal data. Total sample contains 18,345 individuals and 34,019
person-year observations.
23
(a)
(b)
Figure 2: Longitudinal Evidence of a U-Shaped Relationship between Life Satisfaction and Age,(a) with and (b) without a control for individual feelings of envy.
24
Notes: Each dot measures the average life satisfaction of individuals of that particular age. The solid curves depict a fitted
quadratic relationship as formally estimated using fixed-effects (‘within-person’) regression equations such as those in columns (3)
and (4) of Table 6. The latter approach uses information on ‘within-person’ changes in life satisfaction as the same respondent
steadily grows older, and not merely cross-sectional patterns between respondents of different age. The fitted (blue) curve in the
top panel (a) does not control for individual self-reported feelings of envy. On the other hand, the fitted (red) curve in the bottom
panel (b) controls for individual self-reported feelings of envy. Total sample contains 18,345 individuals and 34,019 person-year
observations.
25
Table 1: Distribution of Envy Scores, HILDA Survey (2005, 2009, 2013)
“How well do the following words
describe you?” – EnviousFrequency Percent
Cumulative
frequency
1 “Does not describe me at all” 8,212 24.14 24.14
2 10,126 29.77 53.91
3 6,276 18.45 72.35
4 5,462 16.06 88.41
5 2,704 7.95 96.36
6 891 2.62 98.98
7 “Describes me very well” 348 1.02 100.00
Total 34,019 100.00
Notes: Total sample contains 18,345 individuals and 34,019 person-year observations.
26
Table 2: Longitudinal (Fixed-effects) Regression Models of Envy as a Function of Age, HILDA Survey (2005, 2009, 2013)
Notes: This table presents three regression equations that are to be read vertically. The coefficients give the size of the longitudinal effects upon envy of different age bands (after
adjusting for other influences on envy). The regression equations estimate the within-person changes in envy as people grow older. Dependent variable is Self-reported Envy level
[range: 1 to 7]. Age-group categories are summarised in the Supplemental Material Table S2. The base (reference) age category is ‘15 to 24’ years. Socioeconomic and other
lifestyle controls are summarised in Table S1. Major life-event controls are summarised in Table S3. The full estimation results (with a complete set of control-variable coefficient
estimates) are provided in Table S4.
Dependent variable:Self-reported Envy
(1) (2) (3)
β 95% CI p β 95% CI p β 95% CI p
Age group:
25 to 34 -0.15 [-0.24, -0.07] .000 -0.17 [-0.27, -0.08] .000 -0.18 [-0.27, -0.08] .000
35 to 44 -0.14 [-0.26, -0.03] .013 -0.18 [-0.30, -0.05] .006 -0.19 [-0.32, -0.06] .003
45 to 54 -0.21 [-0.34, -0.07] .002 -0.25 [-0.39, -0.10] .001 -0.27 [-0.41, -0.12] .000
55 to 64 -0.27 [-0.42, -0.12] .000 -0.31 [-0.47, -0.15] .000 -0.34 [-0.50, -0.17] .000
65 to 74 -0.28 [-0.45, -0.12] .001 -0.31 [-0.49, -0.13] .001 -0.33 [-0.52, -0.15] .000
≥ 75 years old -0.26 [-0.46, -0.06] .011 -0.28 [-0.50, -0.07] .010 -0.31 [-0.52, -0.09] .005
Constant 2.83 [2.73, 2.93] .000 2.79 [2.52, 3.05] .000 2.78 [2.52, 3.05] .000
Socioeconomic controls No Yes Yes
Major life event controls No No Yes
Overall R2 .043 .033 .033
Number of individuals 18,345 18,345 18,345
Number of observations 34,019 34,019 34,019
27
Table 3A: Longitudinal (Fixed-effects) Regression Models of Life Satisfaction on Envy, HILDA Survey (2005, 2009, 2013)
Notes: This regression equations estimate the within-person changes in life satisfaction as people grow older. Dependent variable is Life Satisfaction [range: 0 to 10]. Self-reported
life satisfaction is derived from the question: “All things considered, how satisfied are you with your life?” Respondents are told to: “Pick a number between 0 and 10 to indicate
how satisfied you are”, and that “the more satisfied you are the higher number you should pick”. The sample mean is 7.91 with a standard deviation of 1.41. About two-thirds of
respondents report a life satisfaction score of more than 7 out of 10. The full estimation results (with a complete set of control-variable coefficient estimates) are provided in Table
S5A.
Dependent variable:Life Satisfaction
(1) (2) (3)
β 95% CI p β 95% CI p β 95% CI p
Envy -0.05 [-0.07, -0.03] .000 -0.05 [-0.07, -0.03] .000 -0.05 [-0.06, -0.03] .000
Constant 8.05 [8.00, 8.09] .000 7.19 [6.91, 7.46] .000 7.32 [7.04, 7.59] .000
Socioeconomic controls No Yes Yes
Major life event controls No No Yes
Overall R2 .022 .155 .169
Number of individuals 18,345 18,345 18,345
Number of observations 34,019 34,019 34,019
28
Table 3B: Longitudinal (Fixed-effects) Regression Models of SF-36 Mental Health on Envy, HILDA Survey (2005, 2009, 2013)
Notes: This regression equations estimate the within-person changes in overall mental health as people grow older. Dependent variable is SF-36 Mental Health Index [range: 0 to
100]. The SF-36 Mental Health Index is a 5-item scale consisting of the following five questions “How much of the time in the previous 4 weeks: Have you been a very nervous
person? Have you felt so down in the dumps that nothing could cheer you up? Have you felt calm and peaceful? Have you felt down? Have you been a happy person?” The raw
survey responses are transformed and standardised to a 100-point scale ranging from 0 (worst) to 100 (best mental health). The full sample mean is equal to 74.65 with a standard
deviation of 16.82. The full estimation results (with a complete set of control-variable coefficient estimates) are provided in Table S5B.
Dependent variable:SF-36 Mental Health Index
(1) (2) (3)
β 95% CI p β 95% CI p β 95% CI p
Envy -1.11 [-1.30, -0.91] .000 -1.12 [-1.30, -0.93] .000 -1.08 [-1.26, -0.89] .000
Constant 77.59 [77.08, 78.11] .000 59.93 [56.88, 62.97] .000 61.31 [58.25, 64.38] .000
Socioeconomic controls No Yes Yes
Major life event controls No No Yes
Overall R2 .051 .228 .245
Number of individuals 18,325 18,325 18,325
Number of observations 33,976 33,976 33,976
29
Table 4A: Prospective Analysis of Future Changes in Life Satisfaction (period t+1) as a Function of Current Envy (period t), HILDA Survey (2005, 2009,2013)
Notes: Dependent variable is Life Satisfaction [range: 0 to 10] in period t+1. Self-reported life satisfaction is derived from the question: “All things considered, how satisfied are
you with your life?” Respondents are told to: “Pick a number between 0 and 10 to indicate how satisfied you are”, and that “the more satisfied you are the higher number you
should pick”. The full sample mean is 7.91 with a standard deviation of 1.41. About two-thirds of respondents report a life satisfaction score of more than 7 out of 10. The full
estimation results (with a complete set of control-variable coefficient estimates) are provided in Table S6A. The above model estimates are restricted to survey respondents who are
less than or equal to 70 years of age.
Dependent variable:Life Satisfaction t+1
(1) (2) (3)
β 95% CI p β 95% CI p β 95% CI p
Envy t -0.06 [-0.07, -0.04] .000 -0.05 [-0.06, -0.03] .000 -0.05 [-0.06, -0.03] .000
Life Satisfaction t 0.49 [0.47, 0.50] .000 0.42 [0.41, 0.44] .000 0.42 [0.41, 0.44] .000
Constant 4.17 [4.05, 4.30] .000 4.27 [3.96, 4.58] .000 4.28 [3.97, 4.59] .000
Socioeconomic controls No Yes Yes
Major life event controls No No Yes
Adjusted R2 .258 .282 .284
Number of observations 13,106 13,106 13,106
30
Table 4B: Prospective Analysis of Future Changes in SF-36 Mental Health (period t+1) as a Function of Current Envy (period t), HILDA Survey (2005, 2009,2013)
Notes: Dependent variable is SF-36 Mental Health Index [range: 0 to 100] in period t+1. The SF-36 Mental Health Index is a 5-item scale consisting of the following five questions
“How much of the time in the previous 4 weeks: Have you been a very nervous person? Have you felt so down in the dumps that nothing could cheer you up? Have you felt calm and
peaceful? Have you felt down? Have you been a happy person?” The raw survey responses are transformed and standardised to a 100-point scale ranging from 0 (worst) to 100 (best
mental health). The full sample mean is equal to 74.65 with a standard deviation of 16.82. The full estimation results (with a complete set of control-variable coefficient estimates) are
provided in Table S6B. The above model estimates are restricted to survey respondents who are less than or equal to 70 years of age.
Dependent variable:SF-36 Mental Health Index t+1
(1) (2) (3)
β 95% CI p β 95% CI p β 95% CI p
Envy t -0.58 [-0.75, -0.41] .000 -0.61 [-0.78, -0.44] .000 -0.61 [-0.79, -0.44] .000
Mental Health Index t 0.56 [0.55, 0.58] .000 0.49 [0.47, 0.50] .000 0.49 [0.47, 0.50] .000
Constant 34.65 [33.35, 35.95] .000 32.36 [28.85, 35.86] .000 32.11 [28.58, 35.65] .000
Socioeconomic controls No Yes Yes
Major life event controls No No Yes
Adjusted R2 .319 .340 .340
Number of observations 13,087 13,087 13,087
31
Table 5: Prospective Analysis of Future Changes in Log Income (period t+1) as a Function of Current Envy (period t), HILDA Survey (2005, 2009, 2013)
Notes: Dependent variable is the natural logarithm of equivalized household Income in period t+1. Self-reported life satisfaction is derived from the question: “All things
considered, how satisfied are you with your life?” Respondents are told to: “Pick a number between 0 and 10 to indicate how satisfied you are”, and that “the more satisfied you are
the higher number you should pick”. The full sample mean is 7.91 with a standard deviation of 1.41. About two-thirds of respondents report a life satisfaction score of more than 7
out of 10. The full estimation results (with a complete set of control-variable coefficient estimates) are provided in Table S7. The above model estimates are restricted to survey
respondents who are less than or equal to 70 years of age and participate in the labor force.
Dependent variable:Log Income t+1
(1) (2) (3)
β 95% CI p β 95% CI p β 95% CI p
Envy t 0.01 [0.00, 0.02] .026 0.01 [0.00, 0.01] .234 0.01 [0.00, 0.01] .204
Log Income t 0.40 [0.38, 0.41] .000 0.34 [0.33, 0.36] .000 0.34 [0.33, 0.36] .000
Life Satisfaction t 0.01 [0.00, 0.02] .007 0.01 [0.00, 0.02] .150 0.01 [0.00, 0.02] .127
Constant 6.47 [6.32, 6.62] .000 6.97 [6.79, 7.15] .000 6.97 [6.79, 7.16] .000
Socioeconomic controls No Yes Yes
Major life event controls No No Yes
Adjusted R2 .296 .349 .351
Number of observations 10,119 10,119 10,119
32
Table 6A: Longitudinal (Fixed-effects) Regression Models of Life Satisfaction on Age and Envy, HILDA Survey (2005, 2009, 2013)
Notes: Dependent variable is Life Satisfaction [range: 0 to 10]. Self-reported life satisfaction is derived from the question: “All things considered, how satisfied are you with your life?” Respondents are told
to: “Pick a number between 0 and 10 to indicate how satisfied you are”, and that “the more satisfied you are the higher number you should pick”. The full sample mean is 7.91 with a standard deviation of
1.41. About two-thirds of respondents report a life satisfaction score of more than 7 out of 10. Self-reported Envy [range: 1 to 7] is defined in the Materials and Methods section. The base (reference) age
category in models (1) and (2) is ‘15 to 24’ years. Socioeconomic and other lifestyle controls are summarised in Table S1. Major life-event controls are summarised in Table S3. The full estimation results
(with a complete set of control-variable coefficient estimates) are provided in Tables S8 and S9. The above model estimates are restricted to survey respondents who are less than or equal to 70 years of age.
Dependent variable:Life Satisfaction
(1) (2) (3) (4)
β 95% CI p β 95% CI p β 95% CI p β 95% CI p
Envy -0.05 [-0.07, -0.03] .000 -0.05 [-0.07, -0.03] .000
Age -0.04 [-0.06, -0.02] .000 -0.04 [-0.06, -0.02] .000
Age-squared/100 0.05 [0.03, 0.06] .000 0.05 [0.03, 0.06] .000
Age group:
25 to 34 -0.06 [-0.15, 0.02] .122 -0.07 [-0.15, 0.01] .079
35 to 44 -0.07 [-0.19, 0.04] .200 -0.08 [-0.20, 0.03] .148
45 to 54 -0.09 [-0.23, 0.04] .171 -0.11 [-0.24, 0.03] .118
55 to 64 -0.05 [-0.20, 0.10] .525 -0.06 [-0.22, 0.09] .398
65 to 70 0.11 [-0.07, 0.28] .223 0.09 [-0.08, 0.27] .293
Constant 7.08 [6.80, 7.36] .000 7.22 [6.93, 7.51] .000 7.59 [7.20, 7.98] .000 7.73 [7.34, 8.13] .000
Socioeconomic controls Yes Yes Yes Yes
Major life event controls Yes Yes Yes Yes
Overall R2 .166 .177 .168 .179
Number of individuals 16,914 16,914 16,914 16,914
Number of observations 30,802 30,802 30,802 30,802
33
Table 6B: Longitudinal (Fixed-effects) Regression Models of SF-36 Mental Health on Age and Envy, HILDA Survey (2005, 2009, 2013)
Notes: Dependent variable is SF-36 Mental Health Index [range: 0 to 100] in period t+1. The SF-36 Mental Health Index is a 5-item scale consisting of the following five questions “How much of the time in the
previous 4 weeks: Have you been a very nervous person? Have you felt so down in the dumps that nothing could cheer you up? Have you felt calm and peaceful? Have you felt down? Have you been a happy
person?” The raw survey responses are transformed and standardised to a 100-point scale ranging from 0 (worst) to 100 (best mental health). The full sample mean is equal to 74.65 with a standard deviation of
16.82. Self-reported Envy [range: 1 to 7] is defined in the Materials and Methods section. The base (reference) age category in models (1) and (2) is ‘15 to 24’ years. Socioeconomic and other lifestyle controls
are summarised in Table S1. Major life-event controls are summarised in Table S3. The full estimation results (with a complete set of control-variable coefficient estimates) are provided in Tables S10 and S11.
The above model estimates are restricted to survey respondents who are less than or equal to 70 years of age.
Dependent variable:SF-36 Mental Health Index
(1) (2) (3) (4)
β 95% CI p β 95% CI p β 95% CI p β 95% CI p
Envy -1.14 [-1.34, -0.94] .000 -1.13 [-1.33, -0.94] .000
Age -0.17 [-0.38, 0.04] .120 -0.18 [-0.39, 0.03] .099
Age-squared/100 0.30 [0.08, 0.51] .007 0.30 [0.08, 0.51] .006
Age group:
25 to 34 -0.22 [-1.25, 0.81] .678 -0.42 [-1.44, 0.60] .422
35 to 44 -0.02 [-1.44, 1.39] .973 -0.24 [-1.64, 1.16] .738
45 to 54 0.004 [-1.60, 1.60] .996 -0.29 [-1.88, 1.29] .716
55 to 64 0.80 [-0.98, 2.58] .378 0.42 [-1.34, 2.18] .640
65 to 70 2.32 [0.34, 4.30] .022 1.96 [-0.002, 3.92] .050
Constant 57.76 [54.57, 60.95] .000 61.02 [57.78, 64.26] .000 59.53 [54.97, 64.09] .000 62.90 [58.31, 67.50] .000
Socioeconomic controls Yes Yes Yes Yes
Major life event controls Yes Yes Yes Yes
Overall R2 .216 .248 .228 .257
Number of individuals 16,898 16,898 16,898 16,898
Number of observations 30,766 30,766 30,766 30,766