Embed Size (px)
Citation preview

February 2016
Interims Presentation

High Level Summary Good progress through transition
Half the company already generating revenue
Second franchise release will mark the exit from transition in calendar Q4
Elite Dangerous franchise continues to grow, sold over 1.4m units
Added Xbox One as a platform
New season (Horizons) now started
Planet Coaster gaining visibility as second self-published franchise
‘Dev diaries’ approach leading into early access
Release still on track for calendar Q4
Working with key industry partners to increase Frontier’s reach
Distribution relationship with Valve - Microsoft and Amazon now added

Elite Dangerous Progress
3
• Elite Dangerous to date • 1.4m paid sales to end of December 2015
• Regular updates kept interest high
• Support for PC, Xbox Console, Mac and VR
• Frontier, Steam, Microsoft, Amazon sales platforms
• Better than expected price promotion in November
• Elite Dangerous going forwards • Premium £40/$60 price point addressed with
Horizons bundle
• Further Horizons expansions announced
• Further seasons already being worked on
• Mid £20/$30 price point addressed with season one

Planet Coaster progress
Using experience from Elite Dangerous development to follow ‘open development’
trajectory
Announcement trailer and developer diary videos create awareness and interest
Announcement trailer on stage at E3
Development diaries showing progression to our growing community
January 2016 videos and social media activities ‘reach’ was 1.5M people.
Announced that first Alpha code ships in March, with release in calendar Q4 2016
Many new features and major step forwards from the current ‘go to’ coaster game – RollerCoaster
Tycoon 3

Financial Performance
Six months to 30 Nov 2015, compared to six months to 30 Nov 2014:
Net cash £8.6m at 30 November 2015 [1H 14/15: £9.8m]
Recognised revenue up 50% to £10.9m [1H 14/15: £7.3m]
Profit/loss for period £0.4m [1H 14/15: (£1.9m)]
EBITDA £2.1m [1H 14/15: £0.5m]
Adjusted Operating Result (£1.7m) [1H 14/15: (£1.4m)]
Earnings per share of 1.2p [1H 14/15: (5.7p)]
5
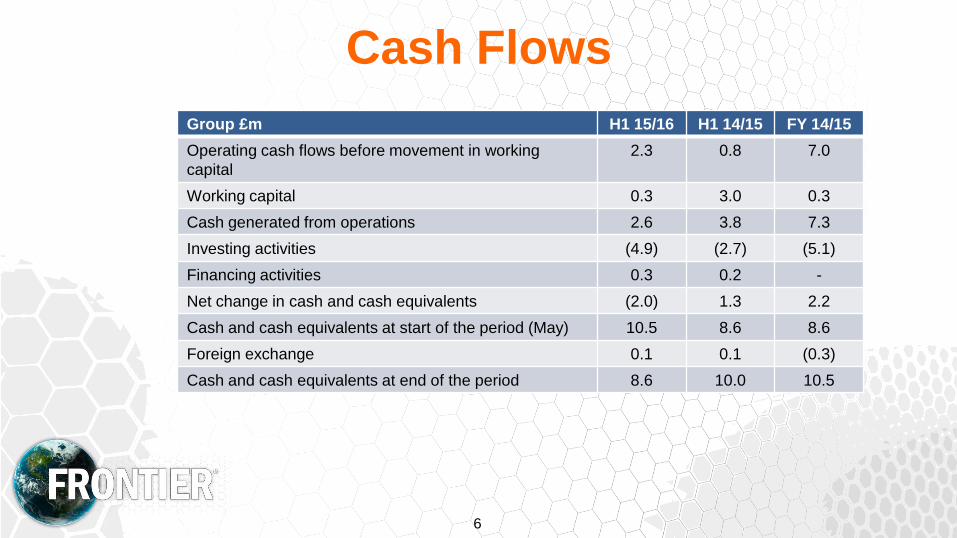
Cash Flows
Group £m H1 15/16 H1 14/15 FY 14/15
Operating cash flows before movement in working
capital
2.3 0.8 7.0
Working capital 0.3 3.0 0.3
Cash generated from operations 2.6 3.8 7.3
Investing activities (4.9) (2.7) (5.1)
Financing activities 0.3 0.2 -
Net change in cash and cash equivalents (2.0) 1.3 2.2
Cash and cash equivalents at start of the period (May) 10.5 8.6 8.6
Foreign exchange 0.1 0.1 (0.3)
Cash and cash equivalents at end of the period 8.6 10.0 10.5
6
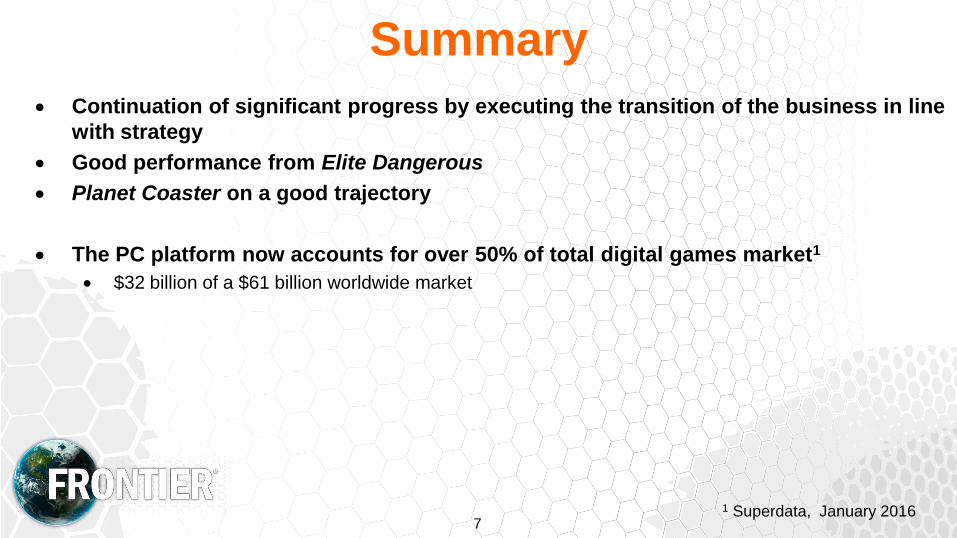
Summary
7
Continuation of significant progress by executing the transition of the business in line
with strategy
Good performance from Elite Dangerous
Planet Coaster on a good trajectory
The PC platform now accounts for over 50% of total digital games market1
$32 billion of a $61 billion worldwide market
1 Superdata, January 2016

Ownership Structure Directors
David Braben 50.3%
David Walsh 3.7%
Jonathan Watts 0.2%
David Gammon 0.9%
Jonathan Milner 1.9%
Board 57.0%
Lansdowne Partners 9.6%
Chris Sawyer 3.9%
Amati VCT 3.1%
EBT holding 0.5%
Other holders 25.9%
Free Float 43.0%

Disclaimer The information contained in this confidential document (“Presentation”) has been prepared by Frontier Developments plc (the “Company”).
This Presentation has not been approved by an authorised person in accordance with Section 21 of the Financial Services and Markets Act 2000 (“FSMA”) and therefore it is being delivered for information purposes only to a very limited number of
persons and companies who are persons who have professional experience in matters relating to investments and who fall within the category of person set out in Article 19 of the Financial Services and Markets Act 2000 (Financial Promotion) Order
2005 (the “Order”) or are high net worth companies within the meaning set out in Article 49 of the Order or are otherwise permitted to receive it.
Any other person who receives this Presentation should not rely or act upon it. By accepting this Presentation and not immediately returning it, the recipient represents and warrants that they are a person who falls within the above description of persons
entitled to receive the Presentation. This Presentation is not to be disclosed to any other person or used for any other purpose.
The securities referred to in this Presentation have not been registered under the Securities Act of 1933, as amended (the “Securities Act”), or the securities laws of any state of the United States, and may not be offered or sold within the United States or
to, or for the account or benefit of, U.S. Persons (as defined in the Securities Act) except pursuant to an exemption from the registration requirements of the Securities Act and applicable state securities laws.
Neither the Securities and Exchange Commission nor any state securities commission has approved or disapproved of these securities or passed upon the adequacy or accuracy of this Presentation. Any representation to the contrary is a criminal
offence.
This Presentation does not constitute an offer, or any solicitation of an offer to subscribe for or purchase, any securities in the Company. Such an offer will be made only by delivery of an offering memorandum and subscription agreement.
While the information contained herein has been prepared in good faith, neither the Company nor any of its shareholders, directors, officers, agents, employees or advisers give, have given or have authority to give, any representations or warranties
(express or implied) as to, or in relation to, the accuracy, reliability or completeness of the information in this Presentation, or any revision thereof, or of any other written or oral information made or to be made available to any interested party or its
advisers (all such information being referred to as “Information”) and liability therefore is expressly disclaimed. Accordingly, neither the Company nor any of its shareholders, directors, officers, agents, employees or advisers take any responsibility for, or
will accept any liability whether direct or indirect, express or implied, contractual, tortious, statutory or otherwise, in respect of, the accuracy or completeness of the Information or for any of the opinions contained herein or for any errors, omissions or
misstatements or for any loss, howsoever arising, from the use of this Presentation. This Presentation has not been fully verified and is subject to material updating, revision and further amendment.
This Presentation may contain forward-looking statements that involve substantial risks and uncertainties, and actual results and developments may differ materially from those expressed or implied by these statements. These forward-looking statements
are statements regarding the Company's intentions, beliefs or current expectations concerning, among other things, the Company's results of operations, financial condition, prospects, growth, strategies and the industry in which the Company operates.
By their nature, forward-looking statements involve risks and uncertainties because they relate to events and depend on circumstances that may or may not occur in the future. These forward-looking statements speak only as of the date of this
Presentation and the Company does not undertake any obligation to update or revise these forward-looking statements to reflect events or circumstances after the date of this Presentation.
This Presentation should not be considered as the giving of investment advice by the Company or any of its shareholders, directors, officers, agents, employees or advisers. Each party to whom this Presentation is made available must make its own
independent assessment of the Company after making such investigations and taking such advice as may be deemed necessary. In particular, any estimates or projections or opinions contained herein necessarily involve significant elements of
subjective judgment, analysis and assumptions and each recipient should satisfy itself in relation to such matters.
Neither this Presentation nor any copy of it may be (a) taken or transmitted into Australia, Canada, Japan, the Republic of Ireland, the Republic of South Africa or the United States of America (each a “Restricted Territory”), their territories or possessions;
(b) distributed to any U.S. person (as defined in Regulation S under the Securities Act) or (c) distributed to any individual outside a Restricted Territory who is a resident thereof in any such case for the purpose of offer for sale or solicitation or invitation to
buy or subscribe any securities or in the context where its distribution may be construed as such offer, solicitation or invi tation, in any such case except in compliance with any applicable exemption. The distribution of this document in or to persons
subject to other jurisdictions may be restricted by law and persons into whose possession this document comes should inform themselves about, and observe, any such restrictions. Any failure to comply with these restrictions may constitute a violation
of the laws of the relevant jurisdiction.
9

Summary Income Statement
10
Group £m H1 15/16 H1 14/15 FY 14/15
Revenue 10.9 7.2 22.8
Cost of sales (3.1) (0.4) (2.2)
Gross profit 7.8 6.8 20.6
Selling and distribution expenses (2.0) (0.9) (2.7)
Administrative expenses (2.0) (2.3) (4.6)
Research and development expenses (3.4) (5.5) (11.7)
Operating result 0.4 (1.9) 1.6
Result before taxation 0.4 (1.9) 1.6
EBITDA 2.1 0.5 6.1
Adjusted Operating result (2.0) (1.4) 2.5
Earnings per share (pence)
Basic 1.2 (5.7) 4.9
Adjusted basis 1.1 (3.9) 4.7
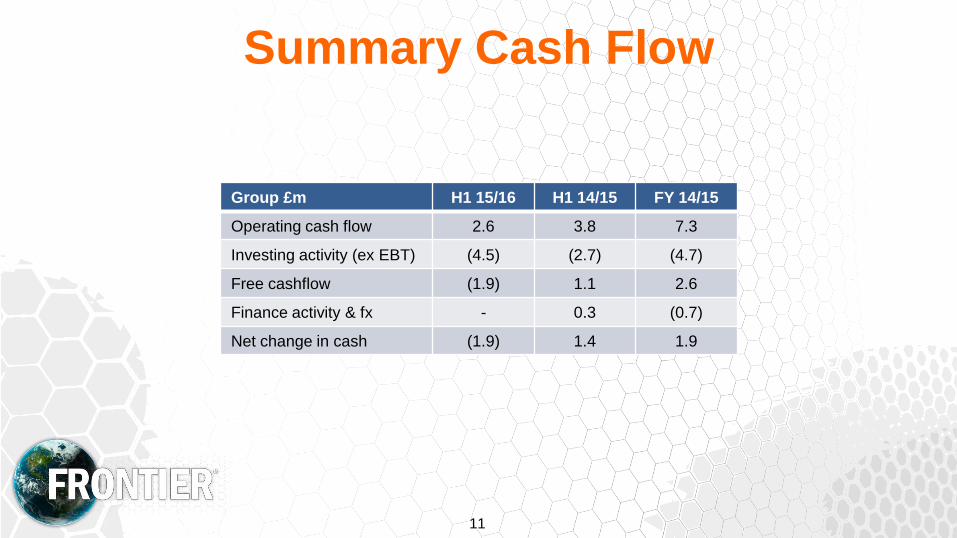
Summary Cash Flow
11
Group £m H1 15/16 H1 14/15 FY 14/15
Operating cash flow 2.6 3.8 7.3
Investing activity (ex EBT) (4.5) (2.7) (4.7)
Free cashflow (1.9) 1.1 2.6
Finance activity & fx - 0.3 (0.7)
Net change in cash (1.9) 1.4 1.9
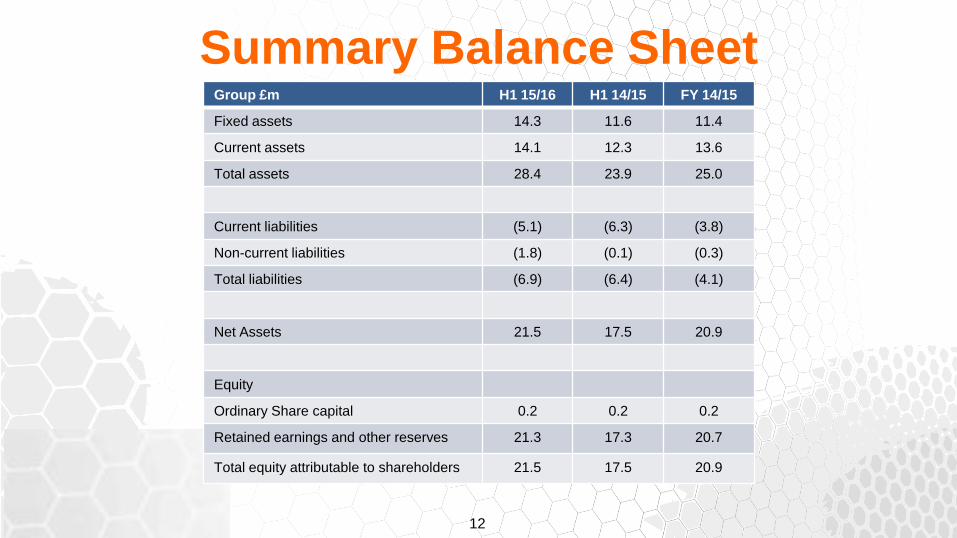
Summary Balance Sheet
12
Group £m H1 15/16 H1 14/15 FY 14/15
Fixed assets 14.3 11.6 11.4
Current assets 14.1 12.3 13.6
Total assets 28.4 23.9 25.0
Current liabilities (5.1) (6.3) (3.8)
Non-current liabilities (1.8) (0.1) (0.3)
Total liabilities (6.9) (6.4) (4.1)
Net Assets 21.5 17.5 20.9
Equity
Ordinary Share capital 0.2 0.2 0.2
Retained earnings and other reserves 21.3 17.3 20.7
Total equity attributable to shareholders 21.5 17.5 20.9