Embed Size (px)
Citation preview
MEDICARE
Payment Methods for Certain Cancer Hospitals Should Be Revised to Promote Efficiency
Report to the Chairman, Committee on Ways and Means, House of Representatives
February 2015
GAO-15-199
United States Government Accountability Office
United States Government Accountability Office
Highlights of GAO-15-199, a report to the Chairman, Committee on Ways and Means, House of Representatives
February 2015
MEDICARE Payment Methods for Certain Cancer Hospitals Should Be Revised to Promote Efficiency
Why GAO Did This Study To control costs and reward efficiency, Medicare pays the majority of hospitals under PPSs, which make payments on the basis of the clinical classification of each service. In response to concerns that cancer hospitals would experience payment reductions under a PPS, beginning in 1983, Congress required the establishment of criteria under which 11 PCHs are currently exempted from the inpatient PPS and are receiving payment adjustments under the outpatient PPS. As such, PCHs are paid largely on the basis of their reported costs. GAO was asked to examine PCHs in terms of their characteristics and Medicare payments.
This report compares (1) the characteristics of PCHs with those of PPS teaching hospitals, (2) the inpatient and outpatient methodologies Medicare uses to pay PCHs and PPS teaching hospitals, and (3) Medicare payments to PCHs with payments to PPS teaching hospitals. GAO analyzed CMS claims and cost report data for 2012 to determine various characteristics, estimate inpatient payment differentials for comparable beneficiaries, and calculate the average payment differences for outpatient services.
What GAO Recommends Congress should consider requiring Medicare to pay PCHs as it pays PPS teaching hospitals, or provide the Secretary of Health and Human Services (HHS) with the authority to otherwise modify how Medicare pays PCHs. In doing so, Congress should provide that all forgone outpatient payments be returned to the Trust Fund. HHS had no general comments.
What GAO Found Unlike beneficiaries seen at teaching hospitals paid under Medicare’s prospective payment systems (PPS) in 2012, nearly all beneficiaries seen at PPS-exempt cancer hospitals (PCH)—a group of 11 facilities having met certain statutory criteria—had a diagnosis of cancer. However, the health status of Medicare beneficiaries with cancer who were treated at PCHs and PPS teaching hospitals was not markedly different. The average risk score—a Medicare measure of overall health—of cancer beneficiaries at PCHs was comparable to that of cancer beneficiaries at PPS teaching hospitals both in the inpatient and outpatient settings. This similarity was also evident in comparing the relative case mix—an indicator of the cost and resource intensity of care—for cancer beneficiaries admitted to PCHs and PPS teaching hospitals.
Compared with how PPS teaching hospitals are paid, the methodologies for paying PCHs provide little incentive for efficiency. Under a PPS, Medicare pays hospitals a predetermined amount based on the clinical classification of each service they provide. PPS hospitals can retain any cost savings relative to their Medicare payments. In contrast, as required by the exemption, Medicare pays PCHs for inpatient services based on their reported costs, subject to an upper limit, as well as potential add-on payments. For outpatient care, Medicare pays PCHs at service-specific rates with an upward payment adjustment based on reported costs.
In 2012, Medicare payments—both inpatient and outpatient—were substantially higher at PCHs than at PPS teaching hospitals in the same geographic area for beneficiaries with the same diagnoses or services. GAO estimated that PCHs received, on average, about 42 percent more in Medicare inpatient payments per discharge than what Medicare would have paid a local PPS teaching hospital to treat cancer beneficiaries with the same level of complexity. Similarly, Medicare outpatient payment adjustments to PCHs resulted in overall payments that were about 37 percent higher, on average, than payments Medicare would have made to PPS teaching hospitals for the same set of services. The estimated differences in Medicare payments varied greatly across PCHs. Furthermore, GAO found no association between the proportion of Medicare payments for cancer patient care and Medicare profit margins at PPS teaching hospitals, indicating that the PPS or an alternative payment methodology may be reasonable for cancer care.
Because Medicare’s payment methodology for PCHs lacks strong incentives for cost containment, it has the potential to result in substantially higher total Medicare expenditures. If, in 2012, PCH beneficiaries had received inpatient and outpatient services at nearby PPS teaching hospitals—and the forgone outpatient adjustments were returned to the Supplementary Medical Insurance Trust Fund—Medicare may have realized annual savings of almost $0.5 billion. Until Medicare pays PCHs to at least, in part, encourage efficiency, Medicare remains at risk for overspending.
View GAO-15-199. For more information, contact James Cosgrove at (202) 512-7114 or [email protected].

Page i GAO-15-199 Medicare Cancer Hospitals
Letter 1
Background 5 PCHs Differed from PPS Teaching Hospitals in Their Focus on
Cancer, Payer Mix, Bed Size, and Use Rates, but Treated Medicare Cancer Patients of Similar Health Status 8
Unlike PPS Teaching Hospitals, PCHs’ Medicare Payments Are Based on Reported Costs, Offering Little Incentive for Efficiency 14
Medicare Payments Were Greater for PCHs than for Local PPS Teaching Hospitals in 2012, but Medicare Profit Margins Were Generally Low for PCHs 19
Conclusion 27 Matter for Congressional Consideration 28 Agency and Third-Party Comments and Our Evaluation 28
Appendix I Scope and Methodology 32
Appendix II Selected Characteristics of Prospective Payment System-Exempt Cancer Hospitals 36
Appendix III Types of Services Provided to Cancer and Noncancer Beneficiaries at PCHs 38
Appendix IV GAO Contact and Staff Acknowledgments 41
Tables
Table 1: Summary Statistics for the Number of Beds, by Hospital Type, Fiscal Year 2012 13
Table 2: Summary Statistics for Occupancy Rates, by Hospital Type, Fiscal Year 2012 13
Table 3: Medicare Updated Target Amount per Discharge for Prospective Payment System (PPS)-Exempt Cancer Hospitals (PCH), Fiscal Year 2012 16
Contents
Page ii GAO-15-199 Medicare Cancer Hospitals
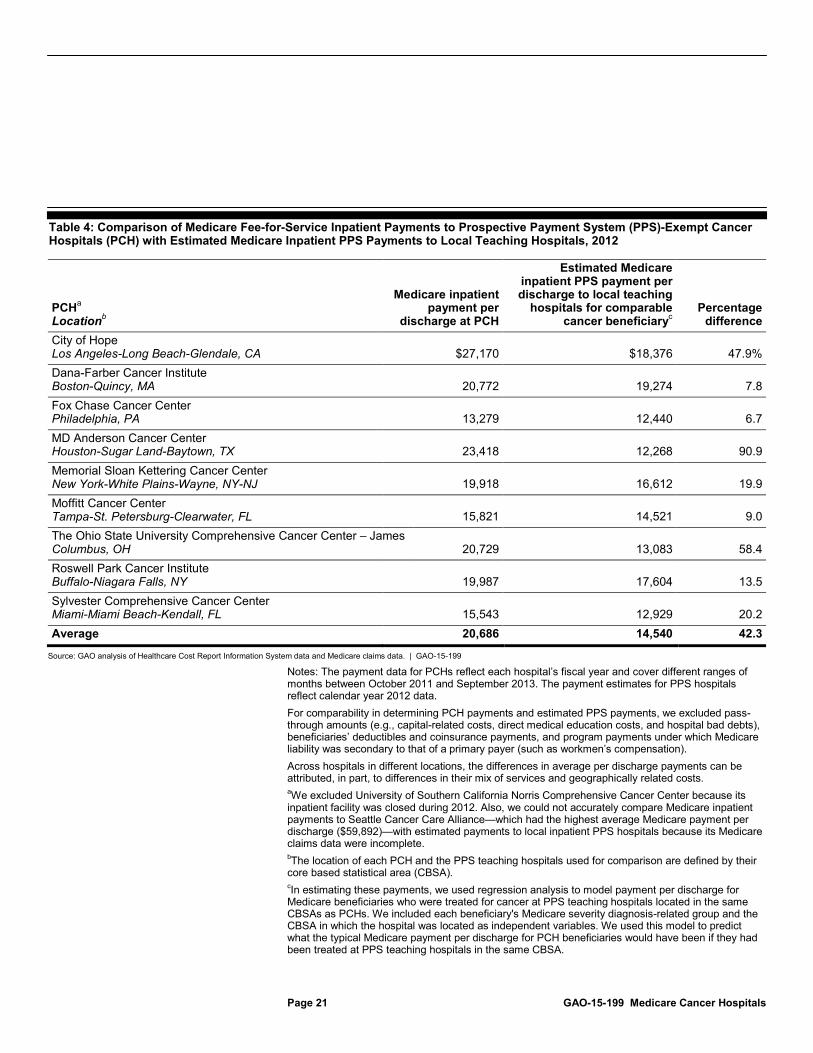
Table 4: Comparison of Medicare Fee-for-Service Inpatient Payments to Prospective Payment System (PPS)-Exempt Cancer Hospitals (PCH) with Estimated Medicare Inpatient PPS Payments to Local Teaching Hospitals, 2012 21
Table 5: Medicare Fee-for-Service Relief or Bonus Payments to Prospective Payment System (PPS)-Exempt Cancer Hospitals (PCH), Fiscal Year 2012 22
Table 6: Medicare Fee-for-Service Aggregate Outpatient Payment Adjustments to Prospective Payment System (PPS)-Exempt Cancer Hospitals (PCH), Fiscal Year 2012 23
Table 7: Estimated Additional Medicare Fee-for-Service Outpatient Payment at Prospective Payment System (PPS)-Exempt Cancer Hospitals (PCH) After Application of Payment Adjustment for Selected Service Categories, 2012 24
Table 8: Medicare and All-Payer Profit Margins, by Prospective Payment System-Exempt Cancer Hospitals, Fiscal Year 2012 26
Table 9: Share of Medicare Fee-for-Service Beneficiary Admissions Listing a Cancer Diagnosis, by Prospective Payment System-Exempt Cancer Hospital (PCH), Calendar Year 2012 36
Table 10: Relative Case Mix and Risk Scores for Medicare Fee-for-Service Cancer Beneficiaries, by Prospective Payment System-Exempt Cancer Hospital (PCH), Calendar Year 2012 36
Table 11: Distribution of Patient Days for Medicare Fee-for-Service (FFS), Medicaid FFS, and Other Payers, by Prospective Payment System-Exempt Cancer Hospital (PCH), Fiscal Year 2012 37
Table 12: Selected Characteristics of Prospective Payment System-Exempt Cancer Hospitals (PCH), 2012 37
Table 13: Most Common Medicare Severity Diagnosis-Related Groups (MS-DRG) for Inpatient Admissions at Prospective Payment System (PPS)-Exempt Cancer Hospitals (PCH), by Beneficiary Type, Calendar Year 2012 39
Table 14: Most Common Types of Outpatient Services at Prospective Payment System (PPS)-Exempt Cancer Hospitals (PCH), by Service Type, Calendar Year 2012 40
Page iii GAO-15-199 Medicare Cancer Hospitals
Figures
Figure 1: Prospective Payment System (PPS)-Exempt Cancer Hospitals (PCH), Location and Effective Date 7
Figure 2: Aggregate Share of Medicare Fee-for-Service Beneficiary Admissions Listing a Cancer Diagnosis, by Hospital Type, Calendar Year 2012 9
Figure 3: Average Risk Scores for Medicare Fee-for-Service Cancer Beneficiaries, by Hospital Type, Calendar Year 2012 10
Figure 4: Median Shares of Patient Days for Medicare Fee-for-Service, Medicaid Fee-for-Service, and Other Payers, by Hospital Type, Fiscal Year 2012 12
Abbreviations APC ambulatory payment classification CBSA core based statistical area CCC comprehensive cancer center CMS Centers for Medicare & Medicaid Services FFS fee-for-service HCRIS Healthcare Cost Report Information System HHS Department of Health and Human Services MS-DRG Medicare severity diagnosis-related group PCH prospective payment system-exempt cancer hospital PCR payment-to-cost ratio PPS prospective payment system
This is a work of the U.S. government and is not subject to copyright protection in the United States. The published product may be reproduced and distributed in its entirety without further permission from GAO. However, because this work may contain copyrighted images or other material, permission from the copyright holder may be necessary if you wish to reproduce this material separately.

Page 1 GAO-15-199 Medicare Cancer Hospitals
441 G St. N.W. Washington, DC 20548
February 20, 2015
The Honorable Paul D. Ryan Chairman Committee on Ways and Means House of Representatives
Dear Mr. Chairman:
To control costs and reward efficiency, Medicare pays the majority of hospitals under the inpatient and outpatient prospective payment systems (PPS). Under a PPS, hospitals are reimbursed a predetermined amount based on the clinical classification of each service they provide. However, Congress required the establishment of criteria under which 11 cancer hospitals are currently exempted from the inpatient PPS and are also receiving payment adjustments under the outpatient PPS. Generally, Medicare pays these PPS-exempt cancer hospitals (PCH) based on their reported costs.
At the time Congress established the inpatient PPS exemption in 1983, it was believed that the types of care provided at cancer hospitals were unsuited to PPS reimbursement. PPS rates are based on national averages of costs that efficient facilities would be expected to incur in furnishing covered inpatient services and of resource requirements for outpatient services. There was concern that cancer hospitals would experience large payment reductions under the PPS, which would result in a decline of their disease-specific focus. PCHs continue to assert that they provide a unique set of services to very complex cancer patients that are more intensive and costly than similar services provided in most other hospitals. PCHs also contend that because they focus mainly on cancer, their ability to balance costs and payments across a mix of service lines is diminished.
Most PCHs—which are all teaching hospitals—are National Institutes of Health National Cancer Institute-designated comprehensive cancer centers (CCC).1
1To qualify as a CCC, a cancer center must conduct laboratory, clinical, and population-based research, as well as research bridging these areas. It must also undertake outreach and education efforts in the community it serves.
Since PCHs were first established in the early 1980s,

Page 2 GAO-15-199 Medicare Cancer Hospitals
cancer care and Medicare’s payment system have changed significantly. Advances in techniques and drugs have increased treatment options and allowed for more localized delivery of care. Along with these developments, the primary setting for cancer care has shifted from the inpatient setting to the outpatient setting. For example, patients now typically have chemotherapy and radiation treatments without staying overnight in a hospital. In addition, in 2007, the Centers for Medicare & Medicaid Services (CMS)—the agency within the Department of Health and Human Services that administers the Medicare program—refined the inpatient PPS methodology to better account for variation in the severity and complexity of beneficiaries in its payment calculations. Medicare’s current payment system better recognizes the resource intensity of hospital care than the system put in place in 1983.
In light of these changes, you requested that we examine PCHs’ characteristics and Medicare payments relative to hospitals paid under the PPS.2
(1) the characteristics of PCHs to those of PPS teaching hospitals,
In this report, we compare
(2) the Medicare inpatient and outpatient methodologies CMS uses to determine payments to PCHs and PPS teaching hospitals, and
(3) Medicare payments to PCHs with payments to PPS teaching hospitals.
To address these issues, we divided Medicare fee-for-service (FFS) beneficiaries into two groups: beneficiaries with cancer and beneficiaries without cancer. Using cancer diagnosis codes provided by CMS, we scanned calendar years 2011 and 2012 Medicare claims data—the most recent 24-month period available at the time of our analysis—from the inpatient, outpatient, skilled nursing facility, and physician settings. If the beneficiary had at least one inpatient or skilled nursing facility claim or two outpatient or physician claims with a cancer diagnosis code, we considered the beneficiary to be a cancer beneficiary.3
2This report was originally requested by the Honorable Dave Camp, former chairman of the House Ways and Means Committee.
If the beneficiary
3This methodology is based on the algorithms developed through the Chronic Conditions Warehouse—a CMS research database—to determine Medicare beneficiaries with five specific types of cancer. We applied these algorithms, but used a broader list of cancer diagnosis codes to encompass all types of cancer.
Page 3 GAO-15-199 Medicare Cancer Hospitals
did not meet the criteria, we considered the beneficiary to be a noncancer beneficiary.
To compare the characteristics between PCHs and PPS teaching hospitals,4 we analyzed Medicare FFS inpatient and outpatient claims data from calendar year 2012 and Healthcare Cost Report Information System (HCRIS) data from fiscal year 2012.5 In addition to claims and cost data, the databases also contain information on certain patient and hospital characteristics, such as diagnoses, illness severity, and number of hospital beds. We examined characteristics pertaining broadly to all hospital patients and payers, and more narrowly to Medicare beneficiaries with cancer. We compared these characteristics across the PCHs and between the PCH group and a group of 964 PPS teaching hospitals nationwide. We further examined a subgroup of PPS teaching hospitals composed of 26 hospitals with CCCs.6
4Teaching hospitals provide clinical education for health professionals along with basic health services. These hospitals report data on medical residents’ hours on cost reports submitted to Medicare.
When analyzing hospital characteristics and inpatient payment data, we excluded the University of Southern California Norris CCC, a PCH, because its inpatient facility was
5HCRIS includes a series of forms that collect descriptive, financial, and statistical data. Most institutional providers, including hospitals, are required to submit these forms annually. CMS conducts desk reviews of all cost reports submitted for hospitals each year, unless the hospital treats a low percentage of Medicare beneficiaries. Based on the results of the desk review, some hospitals receive a full audit.
Medicare claims data are based on the calendar year; HCRIS data are based on each hospital’s fiscal year. The most recent full year of claims and HCRIS data available for all hospitals at the time of our analysis was 2012. 6Because nearly all CCCs do not have their own provider number, but bill Medicare under the provider number of a larger entity, such as a hospital system, the data for PPS teaching hospitals with CCCs reflect information both inside and outside the CCC.There are 41 CCCs nationwide, of which 10 are PCHs. One PCH—Sylvester Comprehensive Cancer Center in Miami, Florida—is not designated as a CCC. One CCC—Barbara Ann Karmanos Cancer Institute in Detroit, Michigan—had its own Medicare provider number and was not part of a broader hospital system. For completeness, in this report, we included Karmanos when referring to CCCs within PPS teaching hospitals. We excluded the following 5 CCCs from our analyses because they lacked 2012 cost report data as of July 2014 or were exempt from the PPS: Sidney Kimmel CCC at Johns Hopkins, St. Jude Children’s Research Hospital, University of Arizona Cancer Center, University of California Davis CCC, and University of Colorado Cancer Center.

Page 4 GAO-15-199 Medicare Cancer Hospitals
closed in 2012.7
To compare the Medicare inpatient and outpatient methodologies CMS uses to pay PCHs and PPS teaching hospitals, we reviewed legislation, CMS regulations, and other documents. We also interviewed agency officials and Medicare payment experts in order to determine key differences between the methodologies.
This PCH was included in the outpatient payment analysis.
To compare Medicare payments to PCHs with payments to PPS teaching hospitals, we analyzed FFS claims data from calendar year 2012 and HCRIS data from fiscal year 2012. For inpatient services, we had to estimate the Medicare payments for PPS teaching hospitals due to limitations in the comparability of the data. We first calculated the average Medicare payment per discharge at each PCH. We then compared these PCH average payments to our estimates of what payments would have been to PPS teaching hospitals. In estimating these payments, we used a regression analysis to determine what Medicare typically would have paid a PPS teaching hospital in the same local geographic area to treat cancer beneficiaries with the same clinical complexity. For outpatient services, we determined the overall percentage payment adjustment to PCHs—representing the difference in Medicare payments between PCHs and local PPS teaching hospitals for the same set of outpatient services. To illustrate how add-on payments would have affected particular services, we applied that overall percentage to geographically adjusted outpatient PPS payment rates for a set of commonly performed services. We also determined profit margins—the profitability measure calculated as payments minus costs, divided by payments—for PCHs and each group of PPS teaching hospitals. Appendix I contains a more complete description of our methodology.
Any significant differences in coding practices may affect some of our comparisons between PCHs and PPS teaching hospitals. Because PCH reimbursement is based largely on costs, rather than on patient diagnoses and treatments, PCHs do not have a strong incentive to code diagnoses accurately and completely on claims submitted to Medicare. At the same time, inpatient PPS hospitals have an incentive to assign higher
7University of Southern California Norris CCC’s inpatient facility was closed during 2012 for remediation construction on its building to bring it up to state seismic safety standards.
Page 5 GAO-15-199 Medicare Cancer Hospitals
and additional diagnosis codes on claims to increase Medicare payment. Therefore, to the extent that such coding issues are present in our data, our findings may understate or overstate the differences between the groups of hospitals.
We ensured the reliability of the Medicare claims data and HCRIS data used in this report by performing appropriate electronic data checks, reviewing relevant documentation, and interviewing officials and representatives knowledgeable about the data. We found the data were sufficiently reliable for the purpose of our analyses.
We conducted this performance audit from March 2014 through February 2015 in accordance with generally accepted government auditing standards. Those standards require that we plan and perform the audit to obtain sufficient, appropriate evidence to provide a reasonable basis for our findings and conclusions based on audit objectives. We believe that the evidence obtained provides a reasonable basis for our findings and conclusions based on our audit objectives.
In 1983, Congress required the establishment of an inpatient PPS.8 The law specified exceptions to the PPS for certain types of hospitals and authorized CMS to develop regulations for additional exceptions for hospitals involved extensively in cancer research and treatment.9 In 1984, CMS established three criteria that hospitals had to meet when applying to be a PCH: (1) be designated as a CCC, (2) be organized primarily for treating and researching cancer, and (3) show that at least 50 percent of its total discharges had a principal diagnosis of cancer or other neoplastic disease.10
8See the Social Security Amendments of 1983, Pub. L. No. 98-21, §§ 601 et seq., 97 Stat. 65, 149 (pertinent provisions codified, as amended, at 42 U.S.C. § 1395ww(d)).
Four hospitals meeting these criteria were initially exempted from the inpatient PPS and 4 additional hospitals were exempted over the
9See Pub. L. No. 98-21, § 601(e), 97 Stat. 65, 137 (1983) (codified, as amended, at 42 U.S.C. § 1395ww(d)(1)(B)). Among the hospitals specifically excluded from the PPS were rehabilitation, psychiatric, and long-term care hospitals, which continued to be reimbursed based on reported costs until the late 1990s and early 2000s when separate PPSs were established for each type. 1049 Fed. Reg. 234, 312 (Jan. 3, 1984) (codified at 42 C.F.R. § 405.476(f)(1)) (1984)) (effective for cost reporting periods beginning on or after October 1, 1983) (currently codified, as amended, at 42.C.F.R. § 412.23(f)(1) (2013)).
Background
Page 6 GAO-15-199 Medicare Cancer Hospitals
following 2 years.11 In 1989, Congress established specific statutory criteria for exempting certain cancer hospitals from the inpatient PPS, effectively incorporating the 8 previously exempted hospitals and 1 new cancer hospital.12 Subsequent legislation established additional criteria under which 2 more hospitals were exempted, bringing the number of exempted cancer hospitals to its current total of 11.13 (See fig. 1.) After the outpatient PPS was established in 1999, PCHs obtained special treatment under this outpatient payment system as well.14
11The four additional hospitals were participating in authorized demonstrations or state cost control systems that continued unaffected when the inpatient PPS was first implemented, thereby delaying their designation as inpatient PPS-exempted cancer hospitals. See 48 Fed. Reg. 39752, 39758 (preamble, III, A, 2).
While PCHs are not expressly excluded from the outpatient PPS, they receive special payments designed to hold them harmless—meaning that they are paid no less than what they would have been paid prior to the implementation of the outpatient PPS. Any addition to the current number of PCHs would appear to require legislation since the statutory deadlines for applying criteria by which CMS may designate PCHs have all passed.
12Omnibus Budget Reconciliation Act of 1989, Pub. L. No. 101-239, § 6004(a), 103 Stat. 2106, 2159 (codified as amended at 42 U.S.C. § 1395ww(d)(1)(B)(v)). 13See the Balanced Budget Act of 1997, Pub. L. No. 105-33, § 4418, 111 Stat. 251, 408 and the Consolidated Appropriations Act, 2001, Pub. L. No. 106-554, § 1(a)(4) [App. D, div. B, tit. 1, § 152(a)], 114 Stat. 2763, 2763A-251 (both provisions codified as amended at 42 U.S.C. § 1395ww(d)(1)(B)(v)). 14See. Pub. L. No. 105-33, § 4523, 111 Stat. 445 (codified as amended at 42 U.S.C. § 1395l(t)).

Page 7 GAO-15-199 Medicare Cancer Hospitals
Figure 1: Prospective Payment System (PPS)-Exempt Cancer Hospitals (PCH), Location and Effective Date

Page 8 GAO-15-199 Medicare Cancer Hospitals
PCHs’ unique cancer focus was evident in the share of Medicare admissions that were beneficiaries with cancer. We found that 97 percent of admissions at PCHs in 2012 were cancer beneficiaries, which was nearly three times greater than the proportion at PPS teaching hospitals with CCCs (34 percent) and over four times greater than at PPS teaching hospitals without CCCs (21 percent). The cancer beneficiary share of admissions was consistent across PCHs, between approximately 94 percent and 100 percent. Similarly, we found that cancer was listed as the principal diagnosis—the main medical condition requiring inpatient care—for 51 percent of admissions at PCHs compared with 12 percent at PPS teaching hospitals with CCCs and 5 percent at PPS teaching hospitals without CCCs. (See fig. 2.) A cancer beneficiary may be admitted for cancer treatment, but is also likely to be admitted to treat other medical conditions, such as infections, that are complicated due to the beneficiary’s cancer diagnosis. The share of Medicare admissions that listed cancer as the principal diagnosis varied widely across PCHs. Approximately 32 percent of admissions at Seattle Cancer Care Alliance listed cancer as the principal diagnosis, whereas 59 percent of admissions at Sylvester Comprehensive Cancer Center did so.15
15Some PCHs did not meet all the original eligibility criteria for PPS exclusion in 2012. The criteria for determining PCH eligibility had to be met when the exemption was granted. CMS is not required to monitor compliance with these criteria for PCHs to remain exempted.
(See table 9 in app. II for information on the share of beneficiary admissions listing a cancer diagnosis at each PCH.)
PCHs Differed from PPS Teaching Hospitals in Their Focus on Cancer, Payer Mix, Bed Size, and Use Rates, but Treated Medicare Cancer Patients of Similar Health Status Cancer Beneficiaries Accounted for Nearly All PCH Medicare Patients; Their Health Status Was Similar to That of Cancer Beneficiaries Treated at PPS Teaching Hospitals

Page 9 GAO-15-199 Medicare Cancer Hospitals
Figure 2: Aggregate Share of Medicare Fee-for-Service Beneficiary Admissions Listing a Cancer Diagnosis, by Hospital Type, Calendar Year 2012
The share of Medicare outpatient services provided to cancer beneficiaries also illustrated PCHs’ unique cancer focus. We found that the large difference in patient mix between PCHs and PPS teaching hospitals both with and without CCCs was as evident in the outpatient setting as it was on the inpatient side. In 2012, about 89 percent of outpatient services at PCHs were provided to cancer beneficiaries, compared with approximately 37 percent at PPS teaching hospitals with CCCs and 24 percent at PPS teaching hospitals without CCCs.
Additionally, in 2012, the health status of cancer beneficiaries treated at PCHs and PPS teaching hospitals was similar. The average risk score—a measure of relative health status—of inpatient and outpatient cancer beneficiaries at PCHs was comparable to that of cancer beneficiaries at

Page 10 GAO-15-199 Medicare Cancer Hospitals
PPS teaching hospitals both with and without CCCs.16
Figure 3: Average Risk Scores for Medicare Fee-for-Service Cancer Beneficiaries, by Hospital Type, Calendar Year 2012
While the average risk score for inpatient cancer beneficiaries at PCHs was 2.6, it was 2.4 at PPS teaching hospitals with CCCs and 2.5 at PPS teaching hospitals without CCCs. The average risk score for outpatient cancer beneficiaries, who tended to be slightly healthier than inpatient cancer beneficiaries, was also similar between hospital types. Outpatient cancer beneficiaries at PCHs had an average risk score of 2.2, compared with 1.9 and 2.0 at PPS teaching hospitals with and without CCCs, respectively. (See fig. 3.)
Note: A risk score is a measure of relative health status. A risk score above 1.0 indicates that a Medicare beneficiary was predicted to be sicker than the average beneficiary.
16A risk score is based on a beneficiary’s demographic characteristics, such as age and gender, and major medical conditions generally obtained from diagnoses on claims. A higher average risk score indicates that a hospital cares for a sicker beneficiary population. A risk score of 1.0 represents the predicted health care costs for the average Medicare beneficiary. A beneficiary with a risk score of 1.05, for example, would have expected expenditures that were 5 percent greater than for the average Medicare beneficiary.

Page 11 GAO-15-199 Medicare Cancer Hospitals
Furthermore, this similarity was evident in comparing the relative case mix—a measure of the cost and resources needed to treat inpatient beneficiaries—between hospital types. On average, the relative case mix for inpatient cancer beneficiaries at PCHs was 1.9 and, for cancer beneficiaries at PPS teaching hospitals with and without CCCs, it was 2.1 and 1.8, respectively.17 Moreover, the majority of PCHs had a lower relative case mix for inpatient cancer beneficiaries than the average for cancer beneficiaries at PPS teaching hospitals with CCCs. Among the PCHs, Fox Chase Cancer Center’s relative case mix of 1.6 was the lowest and Roswell Park Cancer Institute’s relative case mix of 2.4 was the highest.18
(See table 10 in app. II for information on the average risk score for cancer beneficiaries and relative case mix at each PCH.)
When considering both cancer and noncancer patients, we found that the mix of inpatients by type of payer differed between PCHs and PPS teaching hospitals. In general, public payers accounted for a smaller share of patient days at PCHs than at PPS teaching hospitals in 2012.19
17By comparison, the relative case mix for all inpatient Medicare beneficiaries was 1.8 at PCHs, 2.1 at PPS teaching hospitals with CCCs, and 1.7 at PPS teaching hospitals without CCCs, on average.
Medicare’s FFS median share of patient days was about 28 percent at PCHs and PPS teaching hospitals with CCCs but approximately 35 percent at PPS teaching hospitals without CCCs. In addition, Medicaid’s FFS median share of patient days for PCHs (roughly 6 percent) was about half that of PPS teaching hospitals with and without CCCs (approximately 14 percent and 11 percent, respectively). (See fig. 4.) However, the shares of Medicare and Medicaid patient days varied considerably across PCHs. Medicare FFS beneficiaries accounted for approximately 17 percent to 37 percent of patient days across PCHs, whereas Medicaid FFS beneficiaries accounted for about 0 to
18CMS data were insufficient to calculate a relative case mix for two PCHs, Seattle Cancer Care Alliance and University of Southern California Norris CCC. 19The median number of patient days at PCHs (49,104) was about one-quarter that of PPS teaching hospitals with CCCs (182,551) and about three-quarters that of PPS teaching hospitals without CCCs (65,798). The number of patient days at PCHs ranged from 6,100 at Seattle Cancer Care Alliance to 201,989 at MD Anderson Cancer Center.
PCHs Generally Relied Less on Public Payers Than Did PPS Teaching Hospitals

Page 12 GAO-15-199 Medicare Cancer Hospitals
21 percent.20
Figure 4: Median Shares of Patient Days for Medicare Fee-for-Service, Medicaid Fee-for-Service, and Other Payers, by Hospital Type, Fiscal Year 2012
(See table 11 in app. II for information on the share of patient days across Medicare, Medicaid, and other payers at each PCH.)
Note: Other payers include private insurance and any other non-Medicare, non-Medicaid sources. The data reflect each hospital’s fiscal year and cover different ranges of months between October 2011 and September 2013.
20States have choices in their approach to delivery system design under the Medicaid program, including FFS, managed care, and other integrated care models. While states are increasingly moving away from the FFS model, the data we used only indicated Medicaid beneficiaries paid under the FFS model.
Page 13 GAO-15-199 Medicare Cancer Hospitals
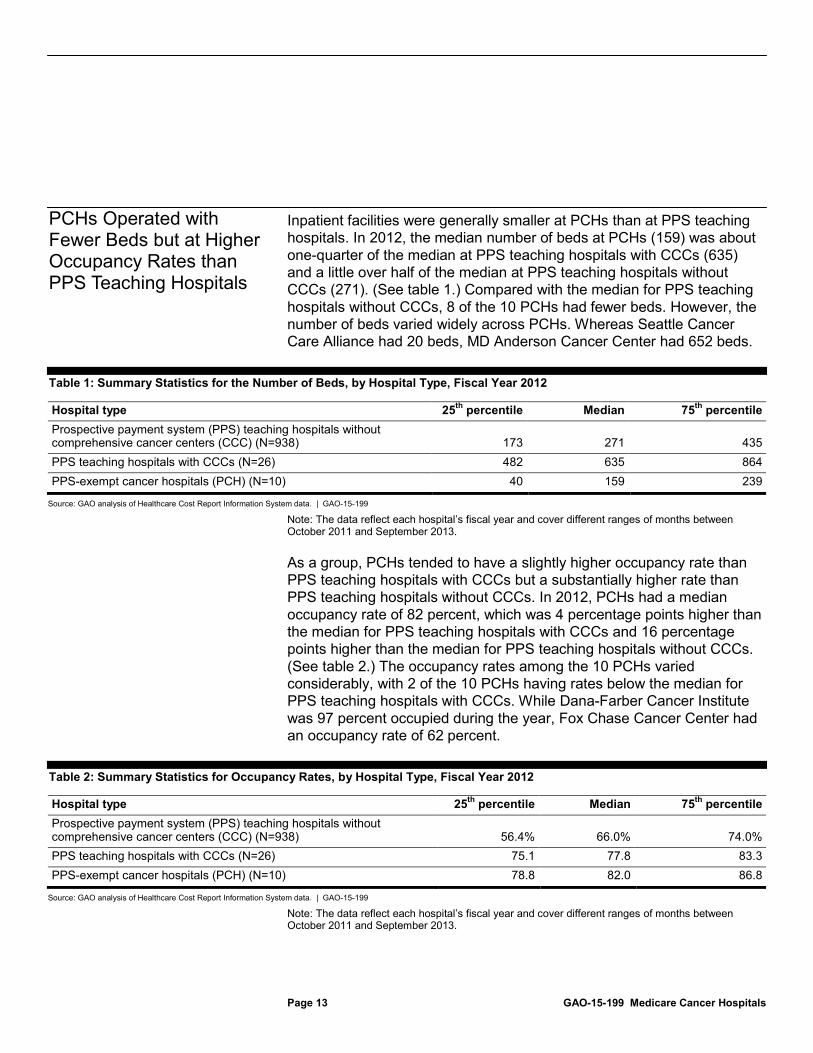
Inpatient facilities were generally smaller at PCHs than at PPS teaching hospitals. In 2012, the median number of beds at PCHs (159) was about one-quarter of the median at PPS teaching hospitals with CCCs (635) and a little over half of the median at PPS teaching hospitals without CCCs (271). (See table 1.) Compared with the median for PPS teaching hospitals without CCCs, 8 of the 10 PCHs had fewer beds. However, the number of beds varied widely across PCHs. Whereas Seattle Cancer Care Alliance had 20 beds, MD Anderson Cancer Center had 652 beds.
Table 1: Summary Statistics for the Number of Beds, by Hospital Type, Fiscal Year 2012
Hospital type 25th Median percentile 75th
Prospective payment system (PPS) teaching hospitals without comprehensive cancer centers (CCC) (N=938)
percentile
173 271 435 PPS teaching hospitals with CCCs (N=26) 482 635 864 PPS-exempt cancer hospitals (PCH) (N=10) 40 159 239
Source: GAO analysis of Healthcare Cost Report Information System data. | GAO-15-199
Note: The data reflect each hospital’s fiscal year and cover different ranges of months between October 2011 and September 2013.
As a group, PCHs tended to have a slightly higher occupancy rate than PPS teaching hospitals with CCCs but a substantially higher rate than PPS teaching hospitals without CCCs. In 2012, PCHs had a median occupancy rate of 82 percent, which was 4 percentage points higher than the median for PPS teaching hospitals with CCCs and 16 percentage points higher than the median for PPS teaching hospitals without CCCs. (See table 2.) The occupancy rates among the 10 PCHs varied considerably, with 2 of the 10 PCHs having rates below the median for PPS teaching hospitals with CCCs. While Dana-Farber Cancer Institute was 97 percent occupied during the year, Fox Chase Cancer Center had an occupancy rate of 62 percent.
Table 2: Summary Statistics for Occupancy Rates, by Hospital Type, Fiscal Year 2012
Hospital type 25th Median percentile 75th
Prospective payment system (PPS) teaching hospitals without comprehensive cancer centers (CCC) (N=938)
percentile
56.4% 66.0% 74.0% PPS teaching hospitals with CCCs (N=26) 75.1 77.8 83.3 PPS-exempt cancer hospitals (PCH) (N=10) 78.8 82.0 86.8
Source: GAO analysis of Healthcare Cost Report Information System data. | GAO-15-199
Note: The data reflect each hospital’s fiscal year and cover different ranges of months between October 2011 and September 2013.
PCHs Operated with Fewer Beds but at Higher Occupancy Rates than PPS Teaching Hospitals
Page 14 GAO-15-199 Medicare Cancer Hospitals
Additionally, Medicare cancer beneficiaries at PCHs generally had similar lengths of stay to those at PPS teaching hospitals with CCCs but slightly longer inpatient stays than cancer beneficiaries at PPS teaching hospitals without CCCs. In 2012, the average length of stay was 7.0 days for cancer beneficiaries at PCHs, 6.7 days for cancer beneficiaries at PPS teaching hospitals with CCCs, and 6.0 days for cancer beneficiaries at PPS teaching hospitals without CCCs. However, there was considerable variation across PCHs. In particular, cancer beneficiaries stayed an average of 4.9 days at Fox Chase Cancer Center—which also had the lowest occupancy rate—but 9.7 days at Roswell Park Cancer Institute.
See table 12 in appendix II for information on bed size, occupancy rates, and lengths of stay at each PCH.
Unlike payments to PPS teaching hospitals under the inpatient PPS, Medicare’s PCH inpatient payment methodology is based on reported reasonable costs subject to a ceiling, or upper limit, and thus lacks a strong incentive to manage expenses efficiently. Specifically, Medicare pays PCHs based on a cost per discharge, referred to as the target amount. For the PCH’s base year, this amount is determined by dividing total Medicare inpatient operating costs—what it costs the hospital to provide beneficiaries all allowable inpatient services, including proportions
Unlike PPS Teaching Hospitals, PCHs’ Medicare Payments Are Based on Reported Costs, Offering Little Incentive for Efficiency Medicare Inpatient Payments to PCHs Are Based on Reported Costs, Providing Little Incentive to Control the Cost of Care
Page 15 GAO-15-199 Medicare Cancer Hospitals
of overhead—by the number of Medicare discharges.21
PCHs can also receive add-on payments at the end of the cost reporting period under certain circumstances, but because such payments are tied to reported costs, they provide a weak incentive for cost management. If a PCH’s Medicare inpatient operating costs exceed 110 percent of its ceiling, it receives payment for its ceiling, plus a relief payment, but only a portion of the excess cost will be reimbursed to the hospital.
The target amount is updated annually for inflation to reflect changes in the prices of goods and services that facilities must buy to provide inpatient care. The ceiling is calculated by multiplying a PCH’s total Medicare discharges in a given year by its target amount. Each year, Medicare pays the lower of a PCH’s costs or its ceiling.
22 Conversely, if a PCH’s Medicare inpatient operating costs are less than its ceiling, it receives payment for its costs, plus a bonus payment.23
According to CMS, PCHs originally had base years in the late 1980s or 1990s, but in 2007, CMS agreed to rebase the PCHs.
Furthermore, a PCH can request an adjustment to its target amount for a specific year if its costs have exceeded its ceiling because of changes from the base year in types of patients or patient care services.
24
21Inpatient costs used to determine the target amount do not include capital costs or medical education costs. Although capital costs and medical education costs are not subject to a limit, they are added on to the hospital’s total payment and are referred to as pass-through costs. In addition, PCHs are not eligible for any payment adjustment programs applicable to PPS hospitals, such as the readmission reduction program and the value-based purchasing program.
One PCH—Seattle Cancer Care Alliance—did not request a rebasing and continues to be paid using a base year from the 1980s. By fiscal year 2012, its Medicare updated target amount per discharge was more than five times higher than that for all other PCHs. (See table 3.)
22The relief payment is calculated as the lesser of either (1) 50 percent of the inpatient operating costs that are in excess of 110 percent of the ceiling or (2) 10 percent of the ceiling. 23The bonus payment is calculated as the lesser of either (1) 15 percent of the difference between inpatient operating costs and the ceiling or (2) 2 percent of the ceiling. 24As a part of the rebasing process, CMS audited the fiscal year 2004 through 2006 cost reports for each PCH. A Medicare cost per discharge was calculated for each of those years and updated by the market basket for inflation to fiscal year 2007. The average cost of the three costs per discharge, updated, became the hospital’s new rebased target amount per discharge and was effective in the hospital’s fiscal year 2007.

Page 16 GAO-15-199 Medicare Cancer Hospitals
Table 3: Medicare Updated Target Amount per Discharge for Prospective Payment System (PPS)-Exempt Cancer Hospitals (PCH), Fiscal Year 2012
PCH Medicare updated target
amount per discharge City of Hope $24,841 Dana-Farber Cancer Institute 22,118 Fox Chase Cancer Center 15,244 MD Anderson Cancer Center 24,742 Memorial Sloan Kettering Cancer Center 19,191 Moffitt Cancer Center 17,596 The Ohio State University Comprehensive Cancer Center – James 20,131 Roswell Park Cancer Institute 18,528 Seattle Cancer Care Alliance 134,255 a Sylvester Comprehensive Cancer Center 19,084 University of Southern California Norris Comprehensive Cancer Center 21,823
Source: Centers for Medicare & Medicaid Services. | GAO-15-199
Note: The payment data reflect each hospital’s fiscal year and cover different ranges of months between October 2011 and September 2013. a
In contrast, Medicare reimburses most teaching hospitals—and most other hospitals generally—under the inpatient PPS, which pays a fixed amount for each beneficiary in a given diagnosis group rather than the actual costs incurred in providing the care. The inpatient PPS provides an incentive for hospitals to operate efficiently because hospitals are financially at risk for costs that exceed Medicare payments and can capture any cost savings relative to their payments. CMS calculates inpatient PPS payments through a series of adjustments applied to separate national base payment rates covering operating and capital expenses.
Because Seattle Cancer Care Alliance did not request to have its target amount per discharge rebased in 2007, its target amount is still based on costs from the 1980s, updated for inflation.
25
25Medicare sets the base payment rates for the operating and capital costs that reasonably efficient hospitals are expected to incur in providing covered inpatient services. Operating payments cover labor and supply costs and capital payments cover costs for depreciation, interest, rent, and property-related insurance and taxes. CMS updates these rates annually.
Specifically, the agency adjusts the base payment rates for patients in different Medicare severity diagnosis-related groups (MS-

Page 17 GAO-15-199 Medicare Cancer Hospitals
DRG), assuming that cases falling into a particular grouping address similar clinical problems that are expected to require similar amounts of hospital resources. In 2007, Medicare’s diagnosis-related groups were revised to account for severity of illness, thus enabling CMS to provide hospitals with higher payments for serving more severely ill beneficiaries and lower payments for treating less severally ill patients.26 CMS also applies an area wage index to account for geographic differences in labor costs. Finally, CMS determines whether supplemental PPS payments, such as payments for serving a disproportionate share of low-income patients or indirect medical education costs for teaching hospitals,27
and other types of special treatment are applicable.
Unlike Medicare outpatient payments to PPS teaching hospitals, the PCH payment is based on a combination of CMS-determined rates and PCH reported costs, providing little incentive for efficiency. Payments to PCHs for outpatient hospital services derive from the service-specific outpatient PPS payments that all PPS hospitals receive, plus an aggregate add-on adjustment. CMS sets outpatient PPS payments for individual services, most of which are determined using relative weights to factor in the resource requirements of each service, called ambulatory payment classifications (APC). Outpatient services are classified into APC groups based on both cost and clinical similarity.28
26Medicare categorizes all hospital inpatient care into MS-DRGs. These groupings are based on patients’ clinical conditions and treatment strategies. Clinical conditions are defined by both the patients’ discharge diagnoses, including the principal diagnosis—the main problem requiring inpatient care—and up to eight secondary diagnoses indicating other conditions that were present at admission (comorbidities) or developed during the hospital stay (complications). The treatment strategy—surgical or medical—is defined by the presence or absence of up to six procedures performed. The groupings are further subdivided by the nature of comorbidities or complications, if any. Each grouping has a numeric weight, which signifies the average cost of stays assigned to that grouping relative to the average cost of Medicare inpatient stays.
CMS establishes a base rate
27Hospitals may also receive supplemental high-cost outlier payments and payments for the use of certain new technology, as well as payment adjustments for transfers. In addition, PPS hospitals may receive additional payments through the hospital value-based purchasing program or reduced payments through the hospital readmission reduction program. While most supplemental payments are applied to both the operating and capital payments, the readmission reduction adjustment and the value-based purchasing adjustment are only applicable to the operating payment. 28Certain other services are paid differently and outpatient PPS outlier payments compensate hospitals for extraordinarily high-cost services.
For Outpatient Care, Medicare Provides Higher Reimbursement to PCHs That Report Above Average Costs Relative to Payment, Weakening Any Incentive for Efficiency
Page 18 GAO-15-199 Medicare Cancer Hospitals
for each APC group by multiplying the APC weight by a conversion factor, which is updated annually to reflect price inflation facing hospitals. Sixty percent of that rate is adjusted for geographic differences in wages.
In addition to the PPS payments, beginning in 2000, each PCH also received a payment adjustment under its hold-harmless status that protected it from financial losses due to the implementation of the outpatient PPS. PCHs received the full difference between the outpatient PPS amount and the pre-outpatient PPS cost-based reimbursement. CMS determined a PCH’s pre-outpatient PPS payment amount by multiplying the current year reported, or reasonable, costs by the hospital’s payment-to-cost ratio (PCR) from 1996. The hold-harmless payments, known as transitional outpatient payments, were then calculated as the difference between the current year PPS payments and the pre-outpatient PPS payment amount.
However, as of 2012, PCHs receive a different payment adjustment as long as they report a higher-than-average PCR. The Patient Protection and Affordable Care Act directed CMS to conduct a review of outpatient PCH costs to determine whether they are greater than costs for PPS hospitals and, if appropriate, to adjust payments to PCHs to reflect those higher costs.29 CMS found that PCHs were more costly than PPS hospitals with regard to APC groups.30
29Pub. L. No. 111-148, § 3138, 124 Stat. 119, 439 (codified at 42 U.S.C. § 1395l(t)(18)).
To address this, CMS amended its payment methodology to pay PCHs either based on a target PCR—the weighted average PCR of PPS hospitals for each year—or the transitional outpatient payment, whichever is higher. When a PCH’s current year PCR is lower than the target PCR, CMS provides an aggregate add-on payment at cost report settlement that makes the PCH’s PCR equal to the target PCR. This payment adjustment to PCHs must be budget neutral and offset through a corresponding adjustment to the annual conversion factor, which is applied to the rates paid to PPS hospitals. Upon finalizing this policy, CMS estimated that, on average, this payment adjustment would increase PCH payments by about 35 percent, ranging from roughly 16 percent to 45 percent for individual PCHs. For 2012, the target PCR
30Medicare Program: Hospital Outpatient Prospective Payment, Final Rule with comment period. 76 Fed. Reg. 74122, 74199-207, 74583 (Nov. 30, 2011) (currently codified at 42 C.F.R. § 419.43(i)(2013)).
Page 19 GAO-15-199 Medicare Cancer Hospitals
was 0.91, meaning that payments were adjusted so that PCHs received 91 percent of their reported costs.
In 2012, CMS paid PCHs 42.3 percent more per discharge, on average, than it would have typically paid PPS teaching hospitals in the same geographic area to treat cancer beneficiaries with the same level of clinical complexity.31
This appears contrary to the commonly held understanding that the Medicare program should be an efficient purchaser of health care services. The estimated PCH-to-PPS differences
31We used a regression model to predict what the typical Medicare payment per discharge for PCH beneficiaries would have been if they had been treated at PPS teaching hospitals in the same core based statistical area (CBSA). The average estimated payment per discharge had a margin of error of 1.0 percent at a 95 percent confidence level, with no individual CBSA margin of error exceeding 1.6 percent. The 42.3 percent overall payment difference had a margin of error at the 95 percent confidence level of plus or minus 1.5 percentage points.
We included PPS add-on payments, such as indirect medical education payments and disproportionate share payments, in our estimate of Medicare payments to local PPS teaching hospitals. In addition, our data are from the 2012 calendar year and various fiscal years, depending on the data source, with treatment dates ranging from calendar year 2011 through 2013.
Medicare Payments Were Greater for PCHs than for Local PPS Teaching Hospitals in 2012, but Medicare Profit Margins Were Generally Low for PCHs Medicare Inpatient Payments to PCHs Were Substantially Higher Than Those to Local PPS Teaching Hospitals for Cancer Patients with the Same Level of Complexity

Page 20 GAO-15-199 Medicare Cancer Hospitals
in Medicare payments varied greatly across PCHs.32 For instance, the largest percentage difference was in Houston, Texas, where the average Medicare payment for beneficiaries treated at MD Anderson Cancer Center was 90.9 percent greater than what Medicare would have paid a teaching hospital in the Houston area to treat cancer beneficiaries of comparable complexity. The smallest payment difference was in Philadelphia, Pennsylvania, where the average Medicare payment for beneficiaries treated at Fox Chase Cancer Center was 6.7 percent greater than what Medicare would have paid a teaching hospital in the Philadelphia area to treat cancer beneficiaries of the same complexity. (See table 4.) Overall, the difference between the amount Medicare paid PCHs and the estimated amount Medicare would have paid PPS hospitals for treating comparable cancer patients indicates that Medicare would have saved about $166 million in 2012.33
32Our analysis relies on MS-DRGs to adjust PPS teaching hospital payments for patient complexity. Therefore, some of the differences we found between the payments to PCHs and PPS teaching hospitals may be explained by potential inaccuracies in the PCHs’ reported MS-DRGs. 33We estimated this savings amount within a range of plus or minus $4 million at a 95 percent confidence interval. The savings estimate covered 9 of the 11 PCHs due to missing 2012 data for 2 PCHs. Seattle Cancer Care Alliance—which had the highest average Medicare payment per discharge ($59,892 per discharge)—did not report complete data to CMS for 2012. Therefore, we could not estimate comparable Medicare payments to local PPS teaching hospitals in the CBSA where this PCH is located. Also, as noted previously, University of Southern California Norris CCC did not provide inpatient services that year. Its inpatient facility has since become operational.
In addition, the savings estimate assumes that beneficiaries treated at PCHs would otherwise have been cared for at PPS teaching hospitals in the same locale as the PCH.
Page 21 GAO-15-199 Medicare Cancer Hospitals
Table 4: Comparison of Medicare Fee-for-Service Inpatient Payments to Prospective Payment System (PPS)-Exempt Cancer Hospitals (PCH) with Estimated Medicare Inpatient PPS Payments to Local Teaching Hospitals, 2012
PCHa
Location
Medicare inpatient payment per
discharge at PCH b
Estimated Medicare inpatient PPS payment per discharge to local teaching
hospitals for comparable cancer beneficiary
Percentage difference c
City of Hope Los Angeles-Long Beach-Glendale, CA $27,170 $18,376 47.9% Dana-Farber Cancer Institute Boston-Quincy, MA 20,772 19,274 7.8 Fox Chase Cancer Center Philadelphia, PA 13,279 12,440 6.7 MD Anderson Cancer Center Houston-Sugar Land-Baytown, TX 23,418 12,268 90.9 Memorial Sloan Kettering Cancer Center New York-White Plains-Wayne, NY-NJ 19,918 16,612 19.9 Moffitt Cancer Center Tampa-St. Petersburg-Clearwater, FL 15,821 14,521 9.0 The Ohio State University Comprehensive Cancer Center – James Columbus, OH 20,729 13,083 58.4 Roswell Park Cancer Institute Buffalo-Niagara Falls, NY 19,987 17,604 13.5 Sylvester Comprehensive Cancer Center Miami-Miami Beach-Kendall, FL 15,543 12,929 20.2 Average 20,686 14,540 42.3
Source: GAO analysis of Healthcare Cost Report Information System data and Medicare claims data. | GAO-15-199
Notes: The payment data for PCHs reflect each hospital’s fiscal year and cover different ranges of months between October 2011 and September 2013. The payment estimates for PPS hospitals reflect calendar year 2012 data. For comparability in determining PCH payments and estimated PPS payments, we excluded pass-through amounts (e.g., capital-related costs, direct medical education costs, and hospital bad debts), beneficiaries’ deductibles and coinsurance payments, and program payments under which Medicare liability was secondary to that of a primary payer (such as workmen’s compensation). Across hospitals in different locations, the differences in average per discharge payments can be attributed, in part, to differences in their mix of services and geographically related costs. aWe excluded University of Southern California Norris Comprehensive Cancer Center because its inpatient facility was closed during 2012. Also, we could not accurately compare Medicare inpatient payments to Seattle Cancer Care Alliance—which had the highest average Medicare payment per discharge ($59,892)—with estimated payments to local inpatient PPS hospitals because its Medicare claims data were incomplete. bThe location of each PCH and the PPS teaching hospitals used for comparison are defined by their core based statistical area (CBSA). cIn estimating these payments, we used regression analysis to model payment per discharge for Medicare beneficiaries who were treated for cancer at PPS teaching hospitals located in the same CBSAs as PCHs. We included each beneficiary's Medicare severity diagnosis-related group and the CBSA in which the hospital was located as independent variables. We used this model to predict what the typical Medicare payment per discharge for PCH beneficiaries would have been if they had been treated at PPS teaching hospitals in the same CBSA.

Page 22 GAO-15-199 Medicare Cancer Hospitals
Total Medicare inpatient payments for PCHs include relief or bonus payments, if the PCH qualifies. In fiscal year 2012, 4 of the 10 PCHs had total allowable inpatient operating costs that were greater than each PCH’s established payment ceiling. All 4 of those PCHs’ costs were greater than 110 percent of their ceiling, so they received a relief payment. PCH relief payments ranged from about $2.0 million (Roswell Park Cancer Institute) to about $7.5 million (Memorial Sloan Kettering Cancer Center). The remaining 6 PCHs had total allowable inpatient operating costs that were less than their respective established payment ceilings. These PCHs received bonus payments ranging from about $94,000 at Dana-Farber Cancer Institute to about $1.9 million at MD Anderson Cancer Center. (See table 5.)
Table 5: Medicare Fee-for-Service Relief or Bonus Payments to Prospective Payment System (PPS)-Exempt Cancer Hospitals (PCH), Fiscal Year 2012
PCHs 2012 amount Percentage of total 2012
Medicare payment PCHs that received relief payments a City of Hope $4,656,679 8.2% Memorial Sloan Kettering Cancer Center 7,542,355 4.5 The Ohio State University Comprehensive Cancer Center – James 2,347,577 3.5 Roswell Park Cancer Institute 1,986,643 8.5 PCHs that received bonus payments b Dana-Farber Cancer Institute 93,897 1.1 Fox Chase Cancer Center 463,404 1.9 MD Anderson Cancer Center 1,879,423 0.9 Moffitt Cancer Center 787,199 1.5 Seattle Cancer Care Alliance 346,361 4.7 Sylvester Comprehensive Cancer Center 139,957 2.4
Source: Healthcare Cost Report Information System data. | GAO-15-199
Note: The payment data reflect each hospital’s fiscal year and cover different ranges of months between October 2011 and September 2013. aMedicare pays a PCH a relief payment when its reported allowable inpatient operating costs are greater than 110 percent of its established payment ceiling. The relief payment is calculated as the lesser of either (1) 50 percent of the inpatient operating costs that are in excess of 110 percent of the ceiling or (2) 10 percent of the ceiling. b
Medicare pays a PCH a bonus payment when its reported inpatient operating costs are less than its established payment ceiling. The bonus payment is calculated as the lesser of either (1) 15 percent of the difference between inpatient operating costs and the ceiling or (2) 2 percent of the ceiling.

Page 23 GAO-15-199 Medicare Cancer Hospitals
In 2012, the outpatient setting accounted for the majority of Medicare payments for most PCHs. The median outpatient share of total Medicare payments at PCHs was 62.2 percent, and ranged from 93.0 percent at Dana-Farber Cancer Institute to 45.8 percent at The Ohio State University CCC – James. Medicare payment adjustments to PCHs resulted in overall reimbursements that were 37 percent higher, on average, than payments Medicare would have made to teaching hospitals paid under the outpatient PPS for the same set of services. The size of the payment adjustment varied by PCH, ranging from 13 percent at City of Hope to 51 percent at MD Anderson Cancer Center. For the majority of PCHs, Medicare increased payments by more than 25 percent. (See table 6.) We estimate that, if PCHs were paid for outpatient services in the same way as PPS teaching hospitals and did not receive payment adjustments—and forgone payment adjustment amounts had been returned to the Supplementary Medical Insurance Trust Fund rather than redistributed to PPS hospitals—then Medicare would have saved approximately $303 million in 2012.
Table 6: Medicare Fee-for-Service Aggregate Outpatient Payment Adjustments to Prospective Payment System (PPS)-Exempt Cancer Hospitals (PCH), Fiscal Year 2012
Payment adjustment
PCH Outpatient PPS payments
(in millions) Aggregate amount
(in millions) Percentage City of Hope $48.7 $6.2 12.8% Dana-Farber Cancer Institute 81.1 34.2 42.2 Fox Chase Cancer Center 34.6 7.3 21.0 MD Anderson Cancer Center 194.9 99.5 51.1 Memorial Sloan Kettering Cancer Center 200.6 89.7 44.7 Moffitt Cancer Center 77.9 17.3 22.3 The Ohio State University Comprehensive Cancer Center – James 43.9 15.0 34.2 Roswell Park Cancer Institute 28.3 5.1 18.1 Seattle Cancer Care Alliance 33.8 15.3 45.2 Sylvester Comprehensive Cancer Center 49.6 6.9 13.9 University of Southern California Norris Comprehensive Cancer Center 22.9 6.2 27.2 All PCHs 816.3 302.9 37.1
Source: GAO analysis of Healthcare Cost Report Information System data. | GAO-15-199
Note: The outpatient PPS payments include outlier payments. Numbers and percentages may not add to totals because of rounding. The payment data reflect each hospital’s fiscal year and cover different ranges of months between October 2011 and September 2013.
Aggregate Outpatient Adjustments Substantially Increased Medicare Payments to PCHs Relative to PPS Teaching Hospitals, Although the Percentage Varied Widely across PCHs
Page 24 GAO-15-199 Medicare Cancer Hospitals
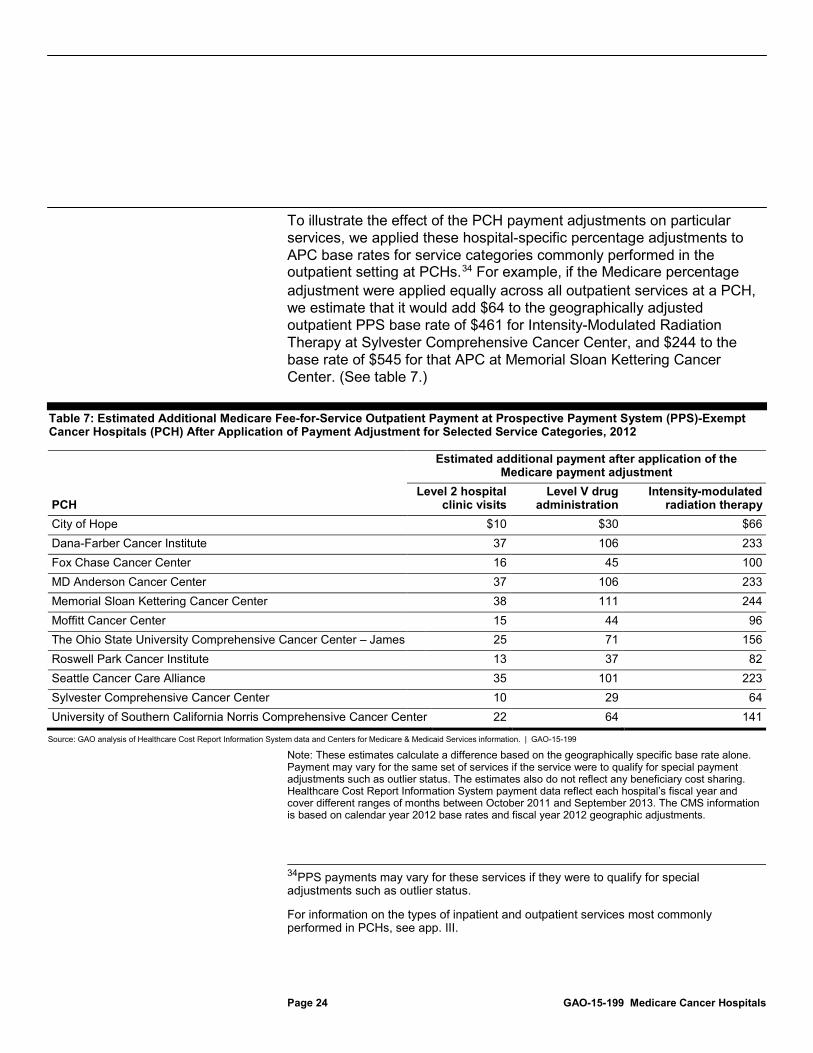
To illustrate the effect of the PCH payment adjustments on particular services, we applied these hospital-specific percentage adjustments to APC base rates for service categories commonly performed in the outpatient setting at PCHs.34
Table 7: Estimated Additional Medicare Fee-for-Service Outpatient Payment at Prospective Payment System (PPS)-Exempt Cancer Hospitals (PCH) After Application of Payment Adjustment for Selected Service Categories, 2012
For example, if the Medicare percentage adjustment were applied equally across all outpatient services at a PCH, we estimate that it would add $64 to the geographically adjusted outpatient PPS base rate of $461 for Intensity-Modulated Radiation Therapy at Sylvester Comprehensive Cancer Center, and $244 to the base rate of $545 for that APC at Memorial Sloan Kettering Cancer Center. (See table 7.)
Estimated additional payment after application of the Medicare payment adjustment
PCH Level 2 hospital
clinic visits Level V drug
administration Intensity-modulated
radiation therapy City of Hope $10 $30 $66 Dana-Farber Cancer Institute 37 106 233 Fox Chase Cancer Center 16 45 100 MD Anderson Cancer Center 37 106 233 Memorial Sloan Kettering Cancer Center 38 111 244 Moffitt Cancer Center 15 44 96 The Ohio State University Comprehensive Cancer Center – James 25 71 156 Roswell Park Cancer Institute 13 37 82 Seattle Cancer Care Alliance 35 101 223 Sylvester Comprehensive Cancer Center 10 29 64 University of Southern California Norris Comprehensive Cancer Center 22 64 141
Source: GAO analysis of Healthcare Cost Report Information System data and Centers for Medicare & Medicaid Services information. | GAO-15-199
Note: These estimates calculate a difference based on the geographically specific base rate alone. Payment may vary for the same set of services if the service were to qualify for special payment adjustments such as outlier status. The estimates also do not reflect any beneficiary cost sharing. Healthcare Cost Report Information System payment data reflect each hospital’s fiscal year and cover different ranges of months between October 2011 and September 2013. The CMS information is based on calendar year 2012 base rates and fiscal year 2012 geographic adjustments.
34PPS payments may vary for these services if they were to qualify for special adjustments such as outlier status.
For information on the types of inpatient and outpatient services most commonly performed in PCHs, see app. III.

Page 25 GAO-15-199 Medicare Cancer Hospitals
In fiscal year 2012, PCHs generally had a lower Medicare combined profit margin—which accounts for inpatient and outpatient services, but not necessarily total Medicare payments and costs—than PPS teaching hospitals.35 The median Medicare combined margin for PCHs was -9.9 percent, compared with -9.1 percent and -4.6 percent for PPS teaching hospitals with and without CCCs, respectively.36
The Alliance of Dedicated Cancer Centers, an organization that represents PCHs, contends that paying PCHs under Medicare’s PPSs, similar to PPS teaching hospitals, would put PCHs at a financial disadvantage because of their almost exclusive focus on treating cancer patients. It stated that PPS hospitals are better able to balance costs and payments because they treat patients with cancer and other diagnoses and provide a wider array of services. To examine whether an increased focus on treating cancer patients affects hospitals’ profitability, we analyzed the relationship at PPS teaching hospitals between the share of Medicare payments derived from treating cancer beneficiaries and Medicare profit margins. We found no association; that is, PPS teaching hospitals with larger proportions of Medicare payments for cancer patient care did not have lower Medicare margins than those with smaller proportions, indicating that the PPS or an alternative payment
All PCHs for which data were available had negative Medicare combined margins, ranging from -21.0 percent at City of Hope to -5.7 percent at Fox Chase Cancer Center. For providing outpatient services, the median Medicare margin at PCHs was -10.2 percent, which was similar to the median at PPS teaching hospitals without CCCs (-11.1 percent) and about twice as high as the median at PPS teaching hospitals with CCCs (-22.3 percent). All PCHs had negative Medicare outpatient margins, ranging from -13.4 percent to -9.9 percent. For providing inpatient care, the median Medicare profit margin was 1.1 percent for PCHs, compared with -3.0 percent and -2.2 percent for PPS teaching hospitals with and without CCCs, respectively. Medicare inpatient margins were negative for the four PCHs that received relief payments and positive for the six PCHs that received bonus payments.
35Medicare combined profit margins exclude graduate medical education and other payments and costs and are, therefore, different from total Medicare margins. 36The median Medicare combined margin for PPS teaching hospitals with and without CCCs also was negative in 2012, indicating that they were paid less than one dollar for every dollar they spent caring for a Medicare beneficiary.
As a Group, PCHs Had Lower Medicare Combined Margins but Higher All-Payer Margins Compared with PPS Teaching Hospitals
Page 26 GAO-15-199 Medicare Cancer Hospitals
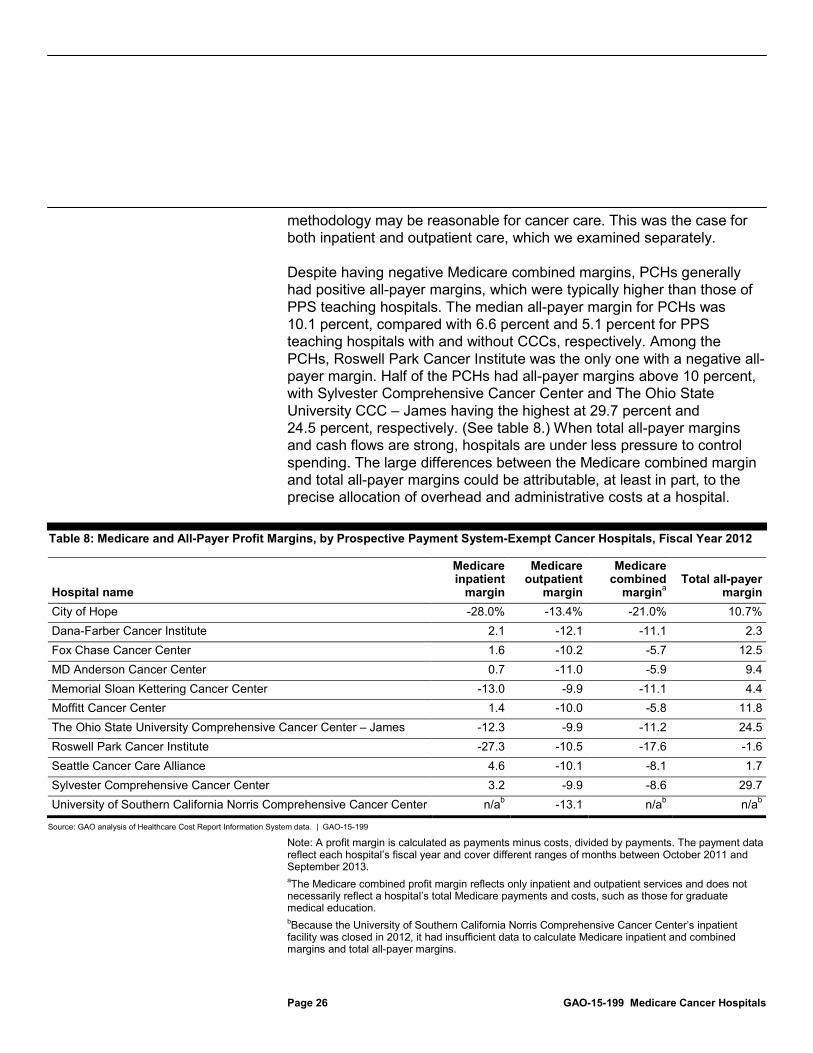
methodology may be reasonable for cancer care. This was the case for both inpatient and outpatient care, which we examined separately.
Despite having negative Medicare combined margins, PCHs generally had positive all-payer margins, which were typically higher than those of PPS teaching hospitals. The median all-payer margin for PCHs was 10.1 percent, compared with 6.6 percent and 5.1 percent for PPS teaching hospitals with and without CCCs, respectively. Among the PCHs, Roswell Park Cancer Institute was the only one with a negative all-payer margin. Half of the PCHs had all-payer margins above 10 percent, with Sylvester Comprehensive Cancer Center and The Ohio State University CCC – James having the highest at 29.7 percent and 24.5 percent, respectively. (See table 8.) When total all-payer margins and cash flows are strong, hospitals are under less pressure to control spending. The large differences between the Medicare combined margin and total all-payer margins could be attributable, at least in part, to the precise allocation of overhead and administrative costs at a hospital.
Table 8: Medicare and All-Payer Profit Margins, by Prospective Payment System-Exempt Cancer Hospitals, Fiscal Year 2012
Hospital name
Medicare inpatient
margin
Medicare outpatient
margin
Medicare combined
marginTotal all-payer
margin a City of Hope -28.0% -13.4% -21.0% 10.7% Dana-Farber Cancer Institute 2.1 -12.1 -11.1 2.3 Fox Chase Cancer Center 1.6 -10.2 -5.7 12.5 MD Anderson Cancer Center 0.7 -11.0 -5.9 9.4 Memorial Sloan Kettering Cancer Center -13.0 -9.9 -11.1 4.4 Moffitt Cancer Center 1.4 -10.0 -5.8 11.8 The Ohio State University Comprehensive Cancer Center – James -12.3 -9.9 -11.2 24.5 Roswell Park Cancer Institute -27.3 -10.5 -17.6 -1.6 Seattle Cancer Care Alliance 4.6 -10.1 -8.1 1.7 Sylvester Comprehensive Cancer Center 3.2 -9.9 -8.6 29.7 University of Southern California Norris Comprehensive Cancer Center n/a -13.1 b n/a n/ab
Source: GAO analysis of Healthcare Cost Report Information System data. | GAO-15-199
b
Note: A profit margin is calculated as payments minus costs, divided by payments. The payment data reflect each hospital’s fiscal year and cover different ranges of months between October 2011 and September 2013. aThe Medicare combined profit margin reflects only inpatient and outpatient services and does not necessarily reflect a hospital’s total Medicare payments and costs, such as those for graduate medical education. bBecause the University of Southern California Norris Comprehensive Cancer Center’s inpatient facility was closed in 2012, it had insufficient data to calculate Medicare inpatient and combined margins and total all-payer margins.

Page 27 GAO-15-199 Medicare Cancer Hospitals
The establishment of Medicare PPSs introduced better control over program spending and provided hospitals with an incentive for efficient resource use. Yet, for decades, as required by law, Medicare has paid PCHs differently than PPS hospitals in recognition of their specialized focus and concern that the PPS would be inadequate to cover their costs. This has remained the case even as the inpatient PPS methodology has been refined to better account for variation in the severity and complexity of beneficiaries in its payment calculations. Our work confirms that PCHs in 2012 almost exclusively admitted beneficiaries who had cancer. However, the beneficiaries at PCHs—both inpatient and outpatient—in 2012 generally had similar complexity and resource needs as cancer beneficiaries cared for at PPS teaching hospitals—a group of hospitals provided with payment incentives to be efficient. In addition, we found no association between the share of Medicare payment derived from treating cancer beneficiaries and Medicare profit margins, meaning that PPS teaching hospitals with larger proportions of Medicare payments for cancer patient care did not have lower Medicare margins than those with smaller proportions.
Because Medicare reimburses PCHs based on their reported costs, it provides little incentive for cost containment. For the most part, PCHs can garner greater Medicare revenue by increasing their costs. In 2012, Medicare spending was substantially higher for PCHs than the amount PPS teaching hospitals would have received caring for a similar set of cancer patients on an inpatient basis (about 42 percent) and an outpatient basis (about 37 percent). This difference in payments can be attributed to legislative requirements established decades ago that limit CMS’s ability to develop a payment mechanism for PCHs that contains incentives for efficiency. If, in 2012, PCH beneficiaries had received inpatient and outpatient services at nearby PPS teaching hospitals—and forgone outpatient payment adjustment amounts were returned to the Trust Fund rather than redistributed to PPS hospitals under current requirements—Medicare may have realized annual savings of almost $0.5 billion.37
37This savings estimate is composed of $166 million for inpatient services, which is estimated within a range of plus or minus $4 million at a 95 percent confidence level, and $303 million for outpatient services. The inpatient estimate did not include all PCHs due to missing data for 2012.
Until Medicare pays PCHs in a way that encourages efficiency, instead of paying largely on the basis of their reported costs, Medicare remains at risk for overspending.
Conclusion

Page 28 GAO-15-199 Medicare Cancer Hospitals
To help the Department of Health and Human Services better control spending and encourage efficient delivery of care, Congress should consider requiring Medicare to pay PCHs as it pays PPS teaching hospitals, or provide the Secretary with the authority to otherwise modify how Medicare pays PCHs. To generate cost savings from any reduction in outpatient payments to PCHs, Congress should also provide that all forgone outpatient payment adjustment amounts be returned to the Supplementary Medical Insurance Trust Fund.
The Department of Health and Human Services reviewed a draft of this report and provided technical comments, which we incorporated where appropriate. In addition, we provided two organizations an opportunity to review our draft because we discussed their member hospitals’ characteristics and payments in this report. The Association of American Medical Colleges, which represents major teaching hospitals, provided a technical comment, which we incorporated as appropriate. The Alliance of Dedicated Cancer Centers, which represents the 11 PCHs, provided written comments that we summarize below. The Alliance stated that it disagreed with many of our conclusions and our recommendation, but we stand by our results.
The Alliance questioned our methodology for determining differences in inpatient payments between hospital groups, suggesting that we should have simulated the payments PCHs would receive under the inpatient PPS. While we considered that approach, data limitations precluded such an analysis. Only a portion of inpatient payments—the PPS base payment rates for MS-DRGs—can be determined in a straightforward manner for services provided at PCHs. PPS payment adjustments—such as disproportionate share payments and indirect medical education payments—are not separately identified for PCHs but make up a substantial proportion of the inpatient PPS payments.38
38We reported in April 2013 that nearly all hospitals paid under the inpatient PPS in 2012 qualified for at least one of four types of payment adjustments we reviewed, and the majority qualified for multiple categories of adjustments. In addition, we reported that for an urban teaching hospital performing a heart surgery on a high-severity beneficiary, 35 percent of the hospital’s PPS payment was attributed to PPS payment adjustments. See GAO, Medicare: Legislative Modifications Have Resulted in Payment Adjustments for Most Hospitals,
Therefore, to better account for all components of inpatient payment, we chose to use regression analysis to predict payments to PPS teaching hospitals
GAO-13-334 (Washington, D.C.: Apr. 17, 2013).
Matter for Congressional Consideration
Agency and Third-Party Comments and Our Evaluation

Page 29 GAO-15-199 Medicare Cancer Hospitals
located in the same geographic area as each PCH to treat cancer beneficiaries with the same level of clinical complexity.
Additionally, the Alliance commented that comparing average risk scores to conclude that the health status of Medicare beneficiaries with cancer is similar at PCHs and PPS teaching hospitals is flawed. The Alliance stated that risk score data do not differentiate between severity levels of the cancer itself (that is, the stage or complexity of the disease). Risk scores are well recognized as a reasonable proxy of health status and are commonly used by CMS to predict beneficiaries’ health care expenditures. In developing the model used to calculate risk scores, CMS included severity levels for certain diseases, such as diabetes, but not for cancer, an indication that doing so would contribute little to the ability of the model to explain variation in health care spending. To provide additional support for our finding, we show that the relative case mix—which reflects resource use—of inpatient cancer beneficiaries at PCHs and PPS teaching hospitals were also comparable. Thus, we continue to believe that the methodology we used was reasonable.
The Alliance also stated that we did not address the reasoning behind the exemption—that PCHs are incompatible with the PPS because they serve cancer patients exclusively and Medicare pays poorly for cancer services relative to other conditions. As we report, when cancer hospitals were exempted from the inpatient PPS in 1983, it was believed that such hospitals would experience large payment reductions under the new system. At issue now is whether PCHs’ actual experiences demonstrate the unique circumstances that initially led to their PPS exemption. We note that the inpatient PPS methodology has changed over the last three decades to better account for variation in the severity and complexity of beneficiaries. The Alliance asserted, but did not provide evidence, that MS-DRGs used to pay PPS hospitals remain misvalued. We do not have evidence that cancer services are systematically undervalued while other conditions are systematically overvalued in the PPS. If Medicare PPS payments for cancer services were systematically undervalued, then Medicare profit margins would tend to be inversely related to the amount of cancer care they provide. Our analysis of 964 PPS teaching hospitals found no such relationship.
Regarding our discussion of margins, the Alliance contended that an analysis of all-payer profit margins is irrelevant to our study of Medicare payment policy and that we should have only examined Medicare profit margins. The Alliance maintained that hospitals’ profits from other payers and sources—including research, investments, and donations—should
Page 30 GAO-15-199 Medicare Cancer Hospitals
not subsidize losses from Medicare. However, we believe that a broad set of indicators—including all-payer margins—is needed to assess the effect of Medicare payments on PCHs’ financial viability. As we discuss in our report, because Medicare pays PCHs based on their reported costs and PCHs are able to allocate administrative costs across payers, PCHs have a payment incentive to make accounting choices that reflect high Medicare costs.39
In addition, the Alliance asserted that PCH hospitals would incur catastrophic losses if paid under the PPS. In the report, to assess this claim, we examined whether an increased focus on treating cancer patients affects hospitals’ profitability. We found that PPS inpatient and outpatient data showed no relationship between the share of Medicare payment derived from treating cancer beneficiaries and Medicare profit margins. If operating with the incentives for cost control provided under the inpatient and outpatient PPS, PCH margins would likely reflect both lower Medicare payments and lower costs.
Thus, we believe, it is problematic to examine Medicare margins in isolation.
Furthermore, the Alliance commented that we do not recognize that PCHs have reduced costs to Medicare by moving the locus of cancer care to the outpatient setting. Our report states that the majority of Medicare payments to PCHs were made for services delivered to outpatient beneficiaries and that the shift towards outpatient cancer care is not exclusive to PCHs. However, as we also note, in 2012, Medicare paid PCHs about 37 percent more, on average, for outpatient cancer services compared to amounts local PPS teaching hospitals providing similar services would have received. Were Congress to revise the PCH outpatient payment methodology to recoup this differential—and provide that all forgone amounts be returned to the Medicare Trust Fund—substantial savings would accrue to the program.
Finally, the Alliance stated that we do not address what it means to be an efficient provider of cancer care because we present no information on
39The Medicare Payment Advisory Commission, the organization that advises Congress on the adequacy of Medicare payment, has noted that there may be no “true” value for reported costs, which reflect accounting choices made by hospitals and other factors. See Medicare Payment Advisory Commission, Report to the Congress: Medicare Payment Policy (Washington, D.C.: March 2014), 44.

Page 31 GAO-15-199 Medicare Cancer Hospitals
PCH outcomes.40
A discussion of PCH outcomes, it says, is necessary when recommending a change in the payment system. Our report does not address whether individual PCHs are efficient or inefficient, but rather shows that the methodology Medicare uses to pay PCHs has weak incentives for managing costs efficiently. Moreover, Medicare’s support for pay-for-performance is based on rewarding individual hospitals, not categories of hospitals, for achieving high quality while minimizing costs. As to assessing payment policy absent information on outcomes, the Alliance specifically told us that the rationale for the exemption is not a function of the high quality of care provided.
As agreed with your office, unless you publicly announce the contents of this report earlier, we plan no further distribution of it until 30 days from its date. At that time, we will send copies to the Secretary of Health and Human Services. In addition, the report will be available at no charge on the GAO website at http://www.gao.gov.
If you or your staff have any questions about this report, please contact me at (202) 512-7114 or [email protected]. Contact points for our Offices of Congressional Relations and Public Affairs may be found on the last page of this report. GAO staff who made key contributions to this report are listed in appendix IV.
Sincerely yours,
James Cosgrove Director, Health Care
40During our study, the Alliance provided us with the results of its own study of 1998 to 2002 cancer survival rates, but these data did not meet our evidence standards. The Alliance also provided examples of peer-reviewed journal articles authored by PCH physicians. The journal articles were generally limited to an individual hospital or specific to a certain type of cancer. We could not conclude that the outcomes at PCHs are, as a whole, superior to that at PPS teaching hospitals.
Appendix I: Scope and Methodology
Page 32 GAO-15-199 Medicare Cancer Hospitals
This appendix describes our methodology for comparing the characteristics and Medicare payments between prospective payment system (PPS)-exempt cancer hospitals (PCH) and PPS teaching hospitals. It also describes our efforts to ensure the reliability of the data.
To make our comparisons, we first divided Medicare beneficiaries into two groups—beneficiaries with cancer and beneficiaries without cancer. The Centers for Medicare & Medicaid Services (CMS) provided us with a list of International Classification of Diseases, Ninth Revision, Clinical Modification, diagnosis codes that, if listed on a claim as a principal or secondary diagnosis, would indicate that the beneficiary had cancer. The list did not include diagnosis codes used to represent factors that influence health status, such as a family history or prior history of the disease. On the basis of discussions with CMS officials, we reviewed the list of diagnosis codes and excluded those where the diagnosis was benign in nature. Using the cancer diagnosis codes provided by CMS, we scanned calendar years 2011 and 2012 Medicare fee-for-service (FFS) claims data, the most recent 24-month period available, from the inpatient, outpatient, skilled nursing facility, and physician settings.1 If the beneficiary had at least one claim for inpatient or skilled nursing facility services or two claims for outpatient or physician services with a cancer diagnosis code, we considered the beneficiary to be a cancer beneficiary and associated claims were considered cancer-related.2
If the beneficiary did not meet the criteria, we considered the beneficiary to be a noncancer beneficiary, and associated claims were not considered to be cancer-related. Claims for a cancer beneficiary prior to the first instance of a cancer diagnosis were treated as noncancer claims.
1To examine inpatient claims and skilled nursing facility claims, we used the Medicare Provider and Analysis Review file, which contains information for all Medicare beneficiaries using hospital inpatient services, aggregated to encompass all services in a given hospital stay. 2This methodology is based on the algorithms developed for the Chronic Conditions Warehouse—a CMS research database—to determine Medicare beneficiaries with any of five specific types of cancer. We applied these algorithms, but used a broader list of cancer diagnosis codes provided by CMS to encompass all types of cancer.
Appendix I: Scope and Methodology
Identification of Cancer Beneficiaries

Appendix I: Scope and Methodology
Page 33 GAO-15-199 Medicare Cancer Hospitals
We compared PCHs, individually and as a group, to a group of 964 PPS teaching hospitals nationwide.3 We further examined a subgroup of PPS teaching hospitals comprising 26 hospitals with comprehensive cancer centers (CCC).4
To compare hospitals’ characteristics, we analyzed inpatient data from the Medicare Provider and Analysis Review file for calendar year 2012, 100 percent of the Standard Analytic File for outpatient claims for calendar year 2012, and additional hospital data from the Healthcare Cost Report Information System (HCRIS) for fiscal year 2012.
When analyzing hospital characteristics and inpatient payment data, we excluded the University of Southern California Norris Comprehensive Cancer Center, a PCH, because its inpatient facility was closed in 2012. However, this PCH was included in the outpatient payment analysis.
5
• applicable to all hospitals, such as the number of beds and occupancy rate;
We examined characteristics
• specific to Medicare, such as Medicare’s share of patient days; and
• related to cancer beneficiaries, such as the case mix for cancer beneficiaries and the share of admissions with a cancer diagnosis.
To compare Medicare inpatient payments for 2012 for PCH beneficiaries with what Medicare would have paid if they had been treated at PPS teaching hospitals, we had to estimate the latter due to limitations in the comparability of the data for the two types of hospitals. We first calculated
3We excluded certain PPS teaching hospitals from our analysis if they had extreme outlier values for key variables or poor data quality, and for other reasons. 4The National Institutes of Health’s National Cancer Institute designates CCCs. To qualify as a CCC, a cancer center must conduct laboratory, clinical, and population-based research, as well as research bridging these areas. It must also undertake outreach and education efforts in the community it serves. 5HCRIS is constructed by CMS based on the Medicare cost reports submitted by Medicare Administrative Contractors. Each hospital defines its own fiscal year—the only requirement is that the beginning date of the hospital fiscal year must fall within the federal fiscal year.
We report HCRIS data from fiscal year 2012 and claims data from calendar year 2012. The most recent full year of claims and HCRIS data available for all hospitals at the time of our analysis was 2012.
Comparison of Hospital Characteristics and Medicare Payments

Appendix I: Scope and Methodology
Page 34 GAO-15-199 Medicare Cancer Hospitals
the average Medicare payment per discharge at each PCH.6 We then compared these PCH average payments to our estimates of what the typical Medicare payment per discharge for PCH beneficiaries would have been if they had been treated at PPS teaching hospitals in the same geographic area. We used a regression analysis to estimate these payments. In particular, we modeled payment per discharge for Medicare beneficiaries who were treated for cancer at PPS teaching hospitals located in the same core based statistical area (CBSA) as PCHs. In our analysis, we included each beneficiary’s Medicare severity diagnosis-related group (MS-DRG) and the CBSA in which the hospital was located as independent variables.7
For comparability in determining estimated PPS payments and PCH payments, we excluded pass-through amounts (e.g., capital-related costs, direct medical education costs, and hospital bad debts), beneficiaries’ deductibles and coinsurance payments, and program payments under which Medicare liability was secondary to that of a primary payer (such as workmen’s compensation). To estimate the potential Medicare savings, we multiplied each PCH’s 2012 discharges by both its estimated average PPS payment per discharge and its actual payment per discharge, and compared the two results. We also calculated margins of error for our estimates at a 95 percent confidence level.
6Due to data limitations, we could not simulate what payments PCHs would receive under the inpatient PPS. Therefore, we instead determined the payment per discharge for Medicare beneficiaries who were treated for cancer at PPS teaching hospitals located in the same geographic area as PCHs. 7Unlike PPS hospitals, PCHs are not paid based on Medicare severity diagnosis-related groups (MS-DRG) and, therefore, do not have an incentive to record diagnoses precisely. Our analysis relies on MS-DRGs to adjust PPS teaching hospital payments for patient complexity. Therefore, some of the differences we found between the payments to PCHs and PPS teaching hospitals may be explained by inaccuracies in the PCHs’ reported MS-DRGs.
CBSAs consist of the county or counties associated with at least one core urban area with a population of at least 10,000, plus adjacent counties that have a high degree of social and economic integration with the core urban area as measured through commuting ties with the counties associated with the core urban area. The following are the 10 CBSAs with PCHs included in our analysis: Los Angeles-Long Beach-Glendale, CA; Boston-Quincy, MA; Philadelphia, PA; Houston-Sugar Land-Baytown, TX; New York-White Plains-Wayne, NY-NJ; Tampa-St. Petersburg-Clearwater, FL; Columbus, OH; Buffalo-Niagara Falls, NY; Seattle, WA; and Miami-Miami Beach-Kendall, FL.

Appendix I: Scope and Methodology
Page 35 GAO-15-199 Medicare Cancer Hospitals
To compare outpatient payments, we identified 2012 payments for outpatient services, as well as the 2012 payment adjustment, indicated in HCRIS. We then determined the overall percentage payment adjustment that resulted from the add-on payment that each PCH received for 2012. This represented the difference in Medicare payments between PCHs and local PPS teaching hospitals for the same set of outpatient services. For illustrative purposes, we applied the hospital-specific percentage adjustment to a set of Medicare services commonly performed at PCHs to estimate a service-specific dollar difference. To estimate potential savings to the Medicare program, we calculated the 2012 total adjustment add-on amount across all PCHs.
To compare profit margins between PCHs and PPS teaching hospitals, we calculated the difference between hospitals’ payments and costs, divided by their payments. In particular, we examined Medicare inpatient, outpatient, and combined margins, as well as total all-payer margins. We also analyzed the correlation between Medicare margins and the share of Medicare revenue derived from cancer patients—inpatient and outpatient—at PPS teaching hospitals.
We ensured the reliability of the Medicare claims data and HCRIS data used in this report by performing appropriate electronic data checks, reviewing relevant documentation, and interviewing officials and representatives knowledgeable about the data. We found the data were sufficiently reliable for the purpose of our analyses.
We conducted this performance audit from March 2014 through February 2015 in accordance with generally accepted government auditing standards. Those standards require that we plan and perform the audit to obtain sufficient, appropriate evidence to provide a reasonable basis for our findings and conclusions based on audit objectives. We believe that the evidence obtained provides a reasonable basis for our findings and conclusions based on our audit objectives.
Data Reliability and Audit Standards

Appendix II: Selected Characteristics of Prospective Payment System-Exempt Cancer Hospitals
Page 36 GAO-15-199 Medicare Cancer Hospitals
This appendix provides further detail on the characteristics of prospective payment system-exempt cancer hospitals (PCH).
Table 9: Share of Medicare Fee-for-Service Beneficiary Admissions Listing a Cancer Diagnosis, by Prospective Payment System-Exempt Cancer Hospital (PCH), Calendar Year 2012
PCH Percentage of admissions with cancer as a diagnosis
Percentage of admissions with cancer as a principal diagnosis
City of Hope 96.9 50.2 Dana-Farber Cancer Institute 99.4 45.7 Fox Chase Cancer Center 94.7 50.6 MD Anderson Cancer Center 97.3 52.0 Memorial Sloan Kettering Cancer Center 98.5 44.7 Moffitt Cancer Center 95.5 58.8 The Ohio State University Comprehensive Cancer Center – James 93.7 53.2 Roswell Park Cancer Institute 94.8 57.7 Seattle Cancer Care Alliance 100.0 32.3 Sylvester Comprehensive Cancer Center 94.8 59.5
Source: GAO analysis of Centers for Medicare & Medicaid Services data. | GAO-15-199
Table 10: Relative Case Mix and Risk Scores for Medicare Fee-for-Service Cancer Beneficiaries, by Prospective Payment System-Exempt Cancer Hospital (PCH), Calendar Year 2012
Average risk score of
Medicare cancer beneficiaries
PCH
Relative case mix of Medicare inpatient
cancer beneficiaries
Inpatient Outpatient City of Hope 1.9 2.7 2.4 Dana-Farber Cancer Institute 2.1 3.3 2.1 Fox Chase Cancer Center 1.6 2.6 2.3 MD Anderson Cancer Center 1.8 2.8 2.4 Memorial Sloan Kettering Cancer Center 1.7 2.6 2.1 Moffitt Cancer Center 2.2 2.5 2.4 The Ohio State University Comprehensive Cancer Center – James 2.0 2.5 2.3 Roswell Park Cancer Institute 2.4 2.4 2.3 Seattle Cancer Care Alliance N/A 4.3 2.2 Sylvester Comprehensive Cancer Center 1.7 2.6 2.2
Source: GAO analysis of Centers for Medicare & Medicaid Services data. | GAO-15-199
Note: A risk score is a measure of relative health status. A risk score above 1.0 indicates that a Medicare beneficiary was predicted to be sicker than the average beneficiary.
Appendix II: Selected Characteristics of Prospective Payment System-Exempt Cancer Hospitals

Appendix II: Selected Characteristics of Prospective Payment System-Exempt Cancer Hospitals
Page 37 GAO-15-199 Medicare Cancer Hospitals
Table 11: Distribution of Patient Days for Medicare Fee-for-Service (FFS), Medicaid FFS, and Other Payers, by Prospective Payment System-Exempt Cancer Hospital (PCH), Fiscal Year 2012
Distribution of patient days PCH Medicare FFS Medicaid FFS Other payer City of Hope 24.5% 21.4% 54.1% Dana-Farber Cancer Institute 27.6 3.3 69.1 Fox Chase Cancer Center 37.4 0.4 62.2 MD Anderson Cancer Center 30.9 2.0 67.1 Memorial Sloan Kettering Cancer Center 35.8 2.3 61.9 Moffitt Cancer Center 32.3 9.1 58.6 The Ohio State University Comprehensive Cancer Center – James 28.0 7.7 64.3 Roswell Park Cancer Institute 25.6 3.0 71.4 Seattle Cancer Care Alliance 19.6 8.0 72.4 Sylvester Comprehensive Cancer Center 16.9 12.0 71.1
Source: GAO analysis of Healthcare Cost Report Information System data. | GAO-15-199
Note: Other payers include private insurance and any other non-Medicare, non-Medicaid sources. The data reflect each hospital’s fiscal year and cover different ranges of months between October 2011 and September 2013.
Table 12: Selected Characteristics of Prospective Payment System-Exempt Cancer Hospitals (PCH), 2012
PCH Number of beds Occupancy rate
Average length of stay of Medicare cancer beneficiaries (days)
City of Hope 185 88.1% 8.3 Dana-Farber Cancer Institute 30 96.9 8.4 Fox Chase Cancer Center 100 61.7 4.9 MD Anderson Cancer Center 652 84.9 7.2 Memorial Sloan Kettering Cancer Center 470 86.8 6.9 Moffitt Cancer Center 206 78.8 6.5 The Ohio State University Comprehensive Cancer Center – James 239 79.9 6.4 Roswell Park Cancer Institute 133 80.3 9.7 Seattle Cancer Care Alliance 20 83.6 8.9 Sylvester Comprehensive Cancer Center 40 74.1 5.8
Source: GAO analysis of Healthcare Cost Report Information System data and Centers for Medicare & Medicaid Services data. | GAO-15-199
Note: The data for the number of beds and occupancy rate reflect each hospital’s fiscal year and cover different ranges of months between October 2011 and September 2013. The data for the average length of stay of Medicare cancer beneficiaries reflect the calendar year.
Appendix III: Types of Services Provided to Cancer and Noncancer Beneficiaries at PCHs
Page 38 GAO-15-199 Medicare Cancer Hospitals
This appendix provides further detail on the most common inpatient and outpatient services provided to cancer beneficiaries and noncancer beneficiaries treated at prospective payment system (PPS)-exempt cancer hospitals (PCH) in 2012.
In the inpatient setting, cancer beneficiaries accounted for 97.2 percent of all admissions at 10 PCHs in 2012. The highest volume Medicare severity diagnosis-related groups (MS-DRG) reported for cancer beneficiaries was chemotherapy for patients without a secondary diagnosis of acute leukemia, while the most common MS-DRG reported for noncancer beneficiaries was red blood cell disorders. (See table 13.) Most of the top MS-DRGs reported for cancer beneficiaries were coded in the middle of the three severity levels—complications and comorbidities, while most of the top MS-DRGs reported for noncancer beneficiaries all had the lowest severity level—no complications or comorbidities.
Appendix III: Types of Services Provided to Cancer and Noncancer Beneficiaries at PCHs

Appendix III: Types of Services Provided to Cancer and Noncancer Beneficiaries at PCHs
Page 39 GAO-15-199 Medicare Cancer Hospitals
Table 13: Most Common Medicare Severity Diagnosis-Related Groups (MS-DRG) for Inpatient Admissions at Prospective Payment System (PPS)-Exempt Cancer Hospitals (PCH), by Beneficiary Type, Calendar Year 2012
MS-DRG description Severity levelPercentage of
admissions a Cancer beneficiaries (N = 26,235 admissions) Chemotherapy without acute leukemia as secondary diagnosis
Complications and comorbidities
6.90%
Simple pneumonia and pleurisy Complications and comorbidities
2.26
Major chest procedures Complications and comorbidities
2.20
Major hematological/immunological diagnoses except sickle cell crisis and coagulation
Complications and comorbidities
1.80
Esophagitis, gastroentorological and miscellaneous digestive disorders
No complications or comorbidities
1.68
Noncancer beneficiaries (N = 743 admissions) Red blood cell disorders No complications
or comorbidities 6.46
Uterine and adnexa procedures for nonmalignancy
No complications or comorbidities
3.77
Thyroid, parathyroid, and thyroglossal procedures No complications or comorbidities
2.83
Uterine and adnexa procedures for nonmalignancy
Complications and comorbidities
2.83
Major chest procedures No complications or comorbidities
2.42
Source: GAO analysis of Medicare claims data. | GAO-15-199
Note: We excluded University of Southern California Norris Comprehensive Cancer Center because its inpatient facility was closed during 2012. Also, we could not include admissions from Seattle Cancer Care Alliance because all 130 of its MS-DRGs were uncategorized. a
In the outpatient setting, 92.1 percent of services at PCHs were provided to cancer beneficiaries in 2012. For beneficiaries seen as outpatients at PCHs, the most common types of services received were non-Medicare fee schedule lab tests and office visits—which together accounted for 44.9 percent and 47.7 percent of all services provided to cancer and
The MS-DRG system provides three levels of severity for each MS-DRG: (1) no complications or comorbidities, (2) complications and comorbidities, or (3) major complications and comorbidities.
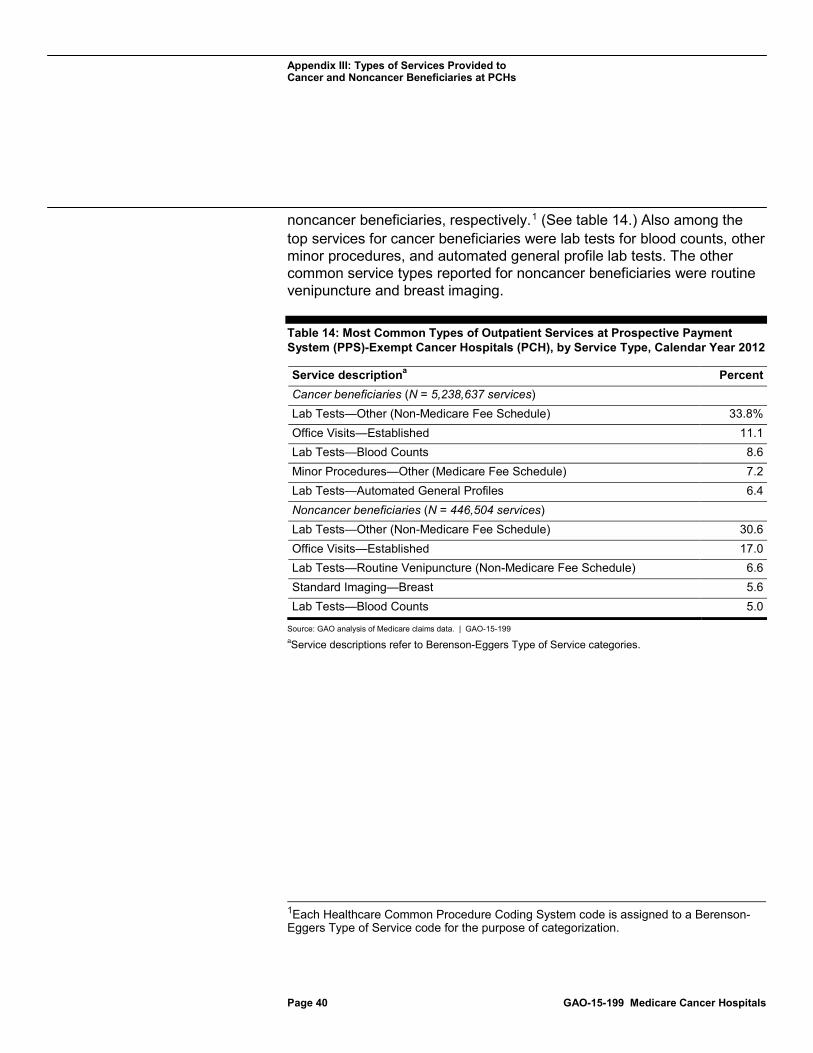
Appendix III: Types of Services Provided to Cancer and Noncancer Beneficiaries at PCHs
Page 40 GAO-15-199 Medicare Cancer Hospitals
noncancer beneficiaries, respectively.1
Table 14: Most Common Types of Outpatient Services at Prospective Payment System (PPS)-Exempt Cancer Hospitals (PCH), by Service Type, Calendar Year 2012
(See table 14.) Also among the top services for cancer beneficiaries were lab tests for blood counts, other minor procedures, and automated general profile lab tests. The other common service types reported for noncancer beneficiaries were routine venipuncture and breast imaging.
Service description Percent a Cancer beneficiaries (N = 5,238,637 services) Lab Tests—Other (Non-Medicare Fee Schedule) 33.8% Office Visits—Established 11.1 Lab Tests—Blood Counts 8.6 Minor Procedures—Other (Medicare Fee Schedule) 7.2 Lab Tests—Automated General Profiles 6.4 Noncancer beneficiaries (N = 446,504 services) Lab Tests—Other (Non-Medicare Fee Schedule) 30.6 Office Visits—Established 17.0 Lab Tests—Routine Venipuncture (Non-Medicare Fee Schedule) 6.6 Standard Imaging—Breast 5.6 Lab Tests—Blood Counts 5.0
Source: GAO analysis of Medicare claims data. | GAO-15-199 a
1Each Healthcare Common Procedure Coding System code is assigned to a Berenson-Eggers Type of Service code for the purpose of categorization.
Service descriptions refer to Berenson-Eggers Type of Service categories.

Appendix IV: GAO Contact and Staff Acknowledgments
Page 41 GAO-15-199 Medicare Cancer Hospitals
James Cosgrove, (202) 512-7114 or [email protected]
In addition to the contact named above, Rosamond Katz, Assistant Director; George Bogart; David Grossman; Richard Lipinski; Kate Nast Jones; Kathryn Richter; and Eric Wedum made key contributions to this report.
Appendix IV: GAO Contact and Staff Acknowledgments
GAO Contact
Staff Acknowledgments
(291190)

The Government Accountability Office, the audit, evaluation, and investigative arm of Congress, exists to support Congress in meeting its constitutional responsibilities and to help improve the performance and accountability of the federal government for the American people. GAO examines the use of public funds; evaluates federal programs and policies; and provides analyses, recommendations, and other assistance to help Congress make informed oversight, policy, and funding decisions. GAO’s commitment to good government is reflected in its core values of accountability, integrity, and reliability.
The fastest and easiest way to obtain copies of GAO documents at no cost is through GAO’s website (http://www.gao.gov). Each weekday afternoon, GAO posts on its website newly released reports, testimony, and correspondence. To have GAO e-mail you a list of newly posted products, go to http://www.gao.gov and select “E-mail Updates.”
The price of each GAO publication reflects GAO’s actual cost of production and distribution and depends on the number of pages in the publication and whether the publication is printed in color or black and white. Pricing and ordering information is posted on GAO’s website, http://www.gao.gov/ordering.htm.
Place orders by calling (202) 512-6000, toll free (866) 801-7077, or TDD (202) 512-2537.
Orders may be paid for using American Express, Discover Card, MasterCard, Visa, check, or money order. Call for additional information.
Connect with GAO on Facebook, Flickr, Twitter, and YouTube. Subscribe to our RSS Feeds or E-mail Updates. Listen to our Podcasts . Visit GAO on the web at www.gao.gov.
Contact:
Website: http://www.gao.gov/fraudnet/fraudnet.htm E-mail: [email protected] Automated answering system: (800) 424-5454 or (202) 512-7470
Katherine Siggerud, Managing Director, [email protected], (202) 512-4400, U.S. Government Accountability Office, 441 G Street NW, Room 7125, Washington, DC 20548
Chuck Young, Managing Director, [email protected], (202) 512-4800 U.S. Government Accountability Office, 441 G Street NW, Room 7149 Washington, DC 20548
GAO’s Mission
Obtaining Copies of GAO Reports and Testimony
Order by Phone
Connect with GAO
To Report Fraud, Waste, and Abuse in Federal Programs
Congressional Relations
Public Affairs
Please Print on Recycled Paper.