Embed Size (px)
Citation preview
SWJMC/2014(Rev.)
Subcommittee on Wages of Seafarers of the Joint Maritime Commission
Updating of the minimum monthly basic pay or wage figure for able seafarers: Seafarers’ Wages, Hours of Work and the Manning of Ships Recommendation, 1996 (No. 187); Maritime Labour Convention, 2006, Guideline B2.2.4 – Minimum monthly basic pay or wage figure for able seafarers (Geneva, 26–27 February 2014)
Sectoral Activities Department
Geneva, 2014

SWJMC/2014 INTERNATIONAL LABOUR ORGANIZATION Sectoral Activities Department
Subcommittee on Wages of Seafarers of the Joint Maritime Commission
Updating of the minimum monthly basic pay or wage figure for able seafarers: Seafarers’ Wages, Hours of Work and the Manning of Ships Recommendation, 1996 (No. 187); Maritime Labour Convention, 2006, Guideline B2.2.4 – Minimum monthly basic pay or wage figure for able seafarers (Geneva, 26–27 February 2014)
Geneva, 2014
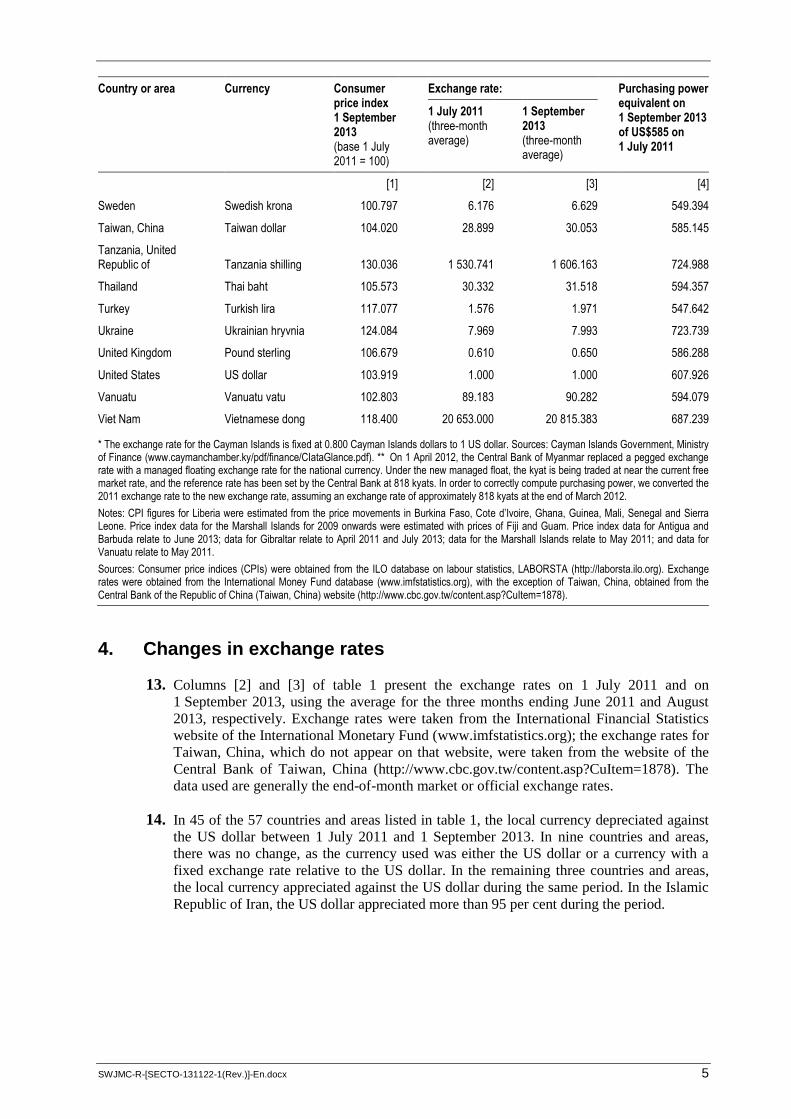
INTERNATIONAL LABOUR OFFICE, GENEVA

Copyright © International Labour Organization 2014
First edition 2014
Publications of the International Labour Office enjoy copyright under Protocol 2 of the Universal Copyright
Convention. Nevertheless, short excerpts from them may be reproduced without authorization, on condition that
the source is indicated. For rights of reproduction or translation, application should be made to ILO Publications
(Rights and Permissions), International Labour Office, CH-1211 Geneva 22, Switzerland. The International
Labour Office welcomes such applications.
Libraries, institutions and other users registered with reproduction rights organizations may make copies in
accordance with the licences issued to them for this purpose. Visit www.ifrro.org to find the reproduction rights
organization in your country.
Subcommittee on Wages of Seafarers of the Joint Maritime Commission: Updating of the minimum monthly basic
pay or wage figure for able seafarers: Seafarers’ Wages, Hours of Work and the Manning of Ships
Recommendation, 1996 (No. 187); Maritime Labour Convention, 2006, Guideline B2.2.4 – Minimum monthly
basic pay or wage figure for able seafarers: Joint Maritime Commission, Geneva, 26–27 February 2014/
International Labour Office, Sectoral Activities Department, Geneva, ILO, 2014.
ISBN 978-92-2-128229-7 (print)
ISBN 978-92-2-128230-3 (Web pdf)
Also available in French: Sous-commission sur les salaires des gens de mer de la Commission paritaire maritime,
Mise à jour du montant mensuel minimum du salaire ou de la solde de base des matelots qualifiés:
recommandation (nº 187) sur les salaires et la durée du travail des gens de mer et les effectifs des navires
(révisée), 1996; convention du travail maritime, 2006, principe directeur B2.2.4 – Montant mensuel minimum du
salaire ou de la solde de base des matelots qualifiés, Genève, 26-27 février 2014/Bureau international du Travail,
Département des activités sectorielles, Genève, BIT, 2014, ISBN 978-92-2-228229-6 (print), ISBN 978-92-2-
228230-2 (Web pdf); and in Spanish: Subcomisión sobre los Salarios de la Gente de Mar de la Comisión Paritaria
Marítima: Actualización del salario básico o remuneración mínima mensual para los marineros preferentes:
Recomendación sobre los salarios, las horas de trabajo a bordo y la dotación de los buques, 1996 (núm. 187);
Convenio sobre el trabajo marítimo, 2006, pauta B2.2.4 – Salario básico o remuneración mínima mensual
para los marineros preferentes (Ginebra, 26-27 de febrero de 2014)/Oficina Internacional del
Trabajo, Departamento de Actividades Sectoriales – Ginebra: OIT, 2014, ISBN 978-92-2-328229-5 (print),
ISBN 978-92-2-328230-1 (Web pdf).
minimum wage / wages / wage determination / seafarer / sea transport / ILO Convention / ILO Recommendation /
comment
13.07
ILO Cataloguing in Publication Data
The designations employed in ILO publications, which are in conformity with United Nations practice, and the
presentation of material therein do not imply the expression of any opinion whatsoever on the part of the
International Labour Office concerning the legal status of any country, area or territory or of its authorities, or
concerning the delimitation of its frontiers.
The responsibility for opinions expressed in signed articles, studies and other contributions rests solely with their
authors, and publication does not constitute an endorsement by the International Labour Office of the opinions
expressed in them.
Reference to names of firms and commercial products and processes does not imply their endorsement by the
International Labour Office, and any failure to mention a particular firm, commercial product or process is not a
sign of disapproval.
ILO publications and electronic products can be obtained through major booksellers or ILO local offices in many
countries, or direct from ILO Publications, International Labour Office, CH-1211 Geneva 22, Switzerland.
Catalogues or lists of new publications are available free of charge from the above address, or by email:
Visit our website: www.ilo.org/publns.
Printed by the International Labour Office, Geneva, Switzerland

SWJMC-R-[SECTO-131122-1(Rev.)]-En.docx v
Contents
Page
1. Introduction .......................................................................................................................... 1
2. Representative list of countries and areas ............................................................................. 2
3. Changes in consumer prices ................................................................................................. 3
4. Changes in exchange rates .................................................................................................... 5
5. Purchasing power of the US dollar on 1 September 2013 relative to
that on 1 July 2011 ............................................................................................................... 6
6. Change in the purchasing power of US$585 between 1 July 2011 and
1 September 2013 in selected countries and areas................................................................ 7
Tables
1. Changes in the purchasing power of the US dollar in selected countries and areas,
1 July 2011–1 September 2013 (2013 list of countries) ....................................................... 3
2. Countries and areas arranged in ascending order of purchasing power, with
corresponding weightings (2013 list of countries) ............................................................... 7
3. Revision of the minimum wage from 1970 to 2011 ............................................................. 9
Appendices
I. Relevant provisions of the Seafarers’ Wages, Hours of Work and
the Manning of Ships Recommendation, 1996 (No. 187) .................................................... 11
II. Relevant provisions of the Maritime Labour Convention, 2006:
Guideline B2.2.1(a) and Guideline B2.2.4 ........................................................................... 12
III. Resolution concerning the ILO minimum wage for able seamen, adopted at the
26th Session of the Joint Maritime Commission (October 1991) ........................................ 13
IV. Resolution concerning the ILO minimum basic wage for the able seafarer, adopted
by the Subcommittee on Wages of Seafarers of the Joint Maritime Commission
(April 2011) .......................................................................................................................... 15
V. Major maritime countries and areas (with more than 2 million gross tons in 2009)
and major suppliers of seafarers (with more than 10,000 seafarers in 2010) ....................... 16

SWJMC-R-[SECTO-131122-1(Rev.)]-En.docx 1
1. Introduction
1. The Governing Body of the International Labour Office, at its 317th Session
(March 2013), decided to convene a meeting of the Subcommittee on Wages of Seafarers
of the Joint Maritime Commission in 2014 to update the ILO minimum basic wage of able
seafarers. 1 At its 319th Session, it decided that this meeting would be held in Geneva from
26 to 27 February 2014. 2
2. The Subcommittee was established by the Governing Body at its 280th Session
(March 2001) to meet every two years for the purpose of updating the basic pay or wages
of able seafarers. According to Paragraph 10 of the Seafarers’ Wages, Hours of Work and
the Manning of Ships Recommendation, 1996 (No. 187), the basic pay or wages for a
calendar month of service for an able (seaman) seafarer should be no less than the amount
periodically set by the Joint Maritime Commission or another body authorized by the
Governing Body of the International Labour Office (see Appendix I).
3. The Maritime Labour Convention, 2006 (MLC, 2006), revises 37 existing maritime labour
Conventions and replaces 31 maritime labour Recommendations, including the Seafarers’
Wages, Hours of Work and the Manning of Ships Recommendation, 1996 (No. 187). The
provisions of Recommendation No. 187 have been incorporated in Guideline B2.2. More
specifically, Part IV, Paragraphs 9, 10 and 11 of Recommendation No. 187, containing the
provisions concerning the minimum monthly basic pay or wage figure for able seafarers,
have been replaced by Guideline B2.2.1(a) and Guideline B2.2.4 of the MLC, 2006 (see
Appendix II). It is important to note that no substantive changes to the provisions
concerning the minimum monthly basic pay or wage figure for able seafarers have been
made. The MLC, 2006, entered into force on 20 August 2013. With the entry into force of
the Convention, the relevant provisions of the MLC, 2006, concerning wages have
therefore become applicable. Consequently, any reference to the minimum wage figure
relates to the applicable provisions of the MLC, 2006.
4. The current methodology for updating the basic pay or wages of able seafarers is based on
that adopted by the Joint Maritime Commission at its 26th Session (October 1991). This
methodology recommends: (i) that the basic pay or wage be based on the list of countries
and areas that are representative of maritime nations (those with at least 2 million gross
tons of shipping) and of countries and areas which are major suppliers of seafarers (those
with at least 10,000 seafarers); (ii) that the formula utilize the average US dollar equivalent
exchange rate for the three most recent months in order to minimize the short-term effect
of drastic fluctuations in currency exchange rates; (iii) that the period of measurement of
the changes in consumer prices correspond to the full period of time between adjustments;
and (iv) that the formula include a weighting of one for countries and areas with fewer than
10,000 seafarers and of two for those with 10,000 or more (see Appendix III for the full
text of the resolution).
5. At its most recent meeting (Geneva, 26–27 April 2011), the Subcommittee on Wages of
Seafarers of the Joint Maritime Commission adopted a resolution concerning the ILO
minimum basic wage for the able seafarer (see Appendix IV for the full text), which, inter
alia:
1 GB.317/POL/5, para. 18, GB.317, Record of decisions.
2 GB.319/INF/1, GB.319, Record of decisions.

2 SWJMC-R-[SECTO-131122-1(Rev.)]-En.docx
– decided, regarding Paragraph 10 of Recommendation No. 187, to update the current
ILO minimum basic wage for an able seafarer of US$545 to US$555 as of 1 January
2012; US$568 as of 1 January 2013; and US$585 as of 31 December 2013;
– agreed that the amount of US$585 as of 1 July 2011 should be used as the basis for
recalculation purposes;
– recalled that the formula had produced a figure of US$710 as of 1 March 2011, and
that that figure should be considered when determining any future increase;
– acknowledged that the agreed minimum wage figure in no way prejudices collective
bargaining or the adoption of higher levels in other international wage-setting
mechanisms; and
– invited the Governing Body to convene a meeting of the Subcommittee in the first
half of 2014 and every two years thereafter and, where appropriate, for the
Subcommittee to report directly to the Governing Body.
6. According to the current methodology for calculating the basic pay of able seafarers, the
period of measurement of the change in consumer prices should be the full period of time
between adjustments, i.e. from July 2011 to 26 February 2014. At the time of writing this
report, however, updated data on exchange rates and price indices for the majority of
countries and areas were available only for the period from 1 July 2011 to
September 2013. At the meeting of the Subcommittee of the Joint Maritime Commission
in February 2014, the Office should be able to provide updated information on price
indices and exchange rates upon request.
2. Representative list of countries and areas
7. Since the Subcommittee’s decision at its 29th Session (January 2001), the list of
representative countries and areas is updated every time a meeting of the Subcommittee is
convened, to include all major maritime countries (i.e. those with more than 2 million tons
of shipping) and major suppliers of seafarers (i.e. those with more than 10,000 seafarers)
and to exclude those that no longer fulfil those requirements.
8. The most up-to-date information on the gross tonnage of the world’s merchant fleet can be
found in table 1A of Lloyd’s Register World Fleet Statistics 2012. It shows that, in 2012,
45 countries had over 2 million tons of shipping (see Appendix V) and accounted for
95.4 per cent of the world’s total tonnage.
9. The most up-to-date information on major suppliers of seafarers is for 2010 and is
published in Appendix C of the BIMCO/ISF Manpower Update 2010 (Warwick,
December 2010), 3 which provides comprehensive data on the worldwide demand for, and
supply of, qualified seafarers from each country and area. The figures for 2010 show that
34 countries supplied at least 10,000 seafarers (see Appendix V), together accounting for
73.3 per cent of the world’s total supply of seafarers.
3 This study, carried out for the Baltic and International Maritime Council and the International
Shipping Federation (BIMCO/ISF) by the Institute for Employment Research (University of
Warwick, United Kingdom), contained the best information on the worldwide supply of seafarers
available to the Office during the period when the report was prepared. The same source was used
for previous reports.

SWJMC-R-[SECTO-131122-1(Rev.)]-En.docx 3
10. Since the previous meeting of the Subcommittee on Wages of Seafarers in 2011, which
identified 53 countries and areas, there has been no change in the number of major
suppliers of seafarers, and four new countries (Islamic Republic of Iran, Saudi Arabia,
Spain and United Republic of Tanzania) have emerged as major maritime countries. In the
same period, no country left the list which was used in this report to update the basic
wages. The list comprises 57 countries and areas, of which 22 are both major suppliers of
seafarers and major maritime nations, 23 are only major maritime nations and 12 are only
major suppliers of seafarers (see table 1).
3. Changes in consumer prices
11. Column [1] of table 1 shows the changes that took place in consumer price indices (CPIs)
between 1 July 2011 and 1 September 2013, the period used in this report for adjustment.
CPI figures for the Marshall Islands and Liberia were estimated on the basis of the price
movements in other countries in the region. 4 Price indices for the last months of the period
had to be estimated for a number of countries, using the geometrical mean of the previous
three years; for three countries (the Russian Federation, Ukraine and Viet Nam), prices had
to be estimated for a period longer than a year.
12. Prices increased in all the countries and areas concerned over the period of adjustment. In
42 countries and areas, the increase was less than 10 per cent, while the rest experienced
inflation of over 10 per cent. Of these, five countries and areas had inflation of over 20 per
cent (one country had substantial inflation of over 60 per cent).
Table 1. Changes in the purchasing power of the US dollar in selected countries and areas, 1 July 2011–1 September 2013 (2013 list of countries)
Country or area Currency Consumer price index 1 September 2013 (base 1 July 2011 = 100)
Exchange rate: Purchasing power equivalent on 1 September 2013 of US$585 on 1 July 2011
1 July 2011 (three-month average)
1 September 2013 (three-month average)
[1] [2] [3] [4]
Antigua and Barbuda East Caribbean dollar 104.695 2.700 2.700 612.466
Bahamas Bahamian dollar 104.312 1.000 1.000 610.223
Belgium Euro 104.177 0.687 0.758 552.083
Bermuda Bermudian dollar 104.936 1.000 1.000 613.878
Brazil Brazilian real 112.411 1.584 2.292 454.402
Bulgaria Bulgarian lev 102.959 1.343 1.482 545.819
Cambodia Cambodian riel 105.333 4 074.333 4 056.683 618.878
Canada Canadian dollar 102.775 0.963 1.044 554.954
Cayman Islands * Cayman Islands dollar 103.000 0.800 0.800 602.553
Chile Chilean peso 105.119 466.160 508.467 563.782
China Chinese yuan 105.121 6.485 6.175 645.827
4 Price index data for Liberia were estimated with data from Burkina Faso, Cote d’Ivoire, Ghana,
Guinea, Mali, Senegal and Sierra Leone; data for the Marshall Islands for 2009 onwards were
estimated with data from Fiji and Guam.

4 SWJMC-R-[SECTO-131122-1(Rev.)]-En.docx
Country or area Currency Consumer price index 1 September 2013 (base 1 July 2011 = 100)
Exchange rate: Purchasing power equivalent on 1 September 2013 of US$585 on 1 July 2011
1 July 2011 (three-month average)
1 September 2013 (three-month average)
[1] [2] [3] [4]
Croatia Croatian kuna 105.253 5.092 5.686 551.411
Cyprus Euro 100.255 0.687 0.758 531.299
Denmark Danish krone 102.937 5.121 5.659 544.962
Egypt Egyptian pound 118.281 5.940 7.016 585.861
France Euro 103.066 0.687 0.758 546.198
Germany Euro 103.981 0.687 0.758 551.046
Gibraltar Pound sterling 107.401 0.610 0.650 590.254
Greece Euro 100.100 0.687 0.758 530.479
Honduras Honduran lempira 111.111 18.895 20.447 600.661
Hong Kong, China Hong Kong dollar 106.058 7.775 7.755 622.039
India Indian rupee 125.397 44.710 62.523 524.575
Indonesia Indonesian rupiah 111.900 8 569.333 9 955.700 563.458
Iran, Islamic Republic of Iranian rial 166.933 10 563.667 20 618.333 500.332
Isle of Man Pound sterling 105.552 0.610 0.650 580.094
Italy Euro 105.028 0.687 0.758 556.594
Japan Japanese yen 100.452 81.210 98.197 485.990
Korea, Republic of Korean won 104.011 10 722.800 1 120.767 582.422
Kuwait Kuwaiti dinar 103.545 0.274 0.284 583.725
Liberia Liberian dollar 115.160 72.667 75.983 644.285
Malaysia Malaysian ringgit 103.682 3.002 3.243 561.586
Malta Euro 102.894 0.687 0.758 545.286
Marshall Islands US dollar 106.712 1.000 1.000 624.268
Myanmar ** Myanmar kyat 107.870 788.430 972.015 511.853
Netherlands Euro 105.833 0.687 0.758 560.860
Norway Norwegian krone 102.475 5.340 6.024 531.380
Pakistan Pakistan rupee 120.304 85.518 101.840 590.984
Panama Panamanian balboa 110.773 1.000 1.000 648.020
Philippines Philippine peso 106.298 43.268 43.781 614.546
Poland Polish zloty 104.859 2.716 3.244 513.644
Romania Romanian leu 107.245 2.841 3.361 530.378
Russian Federation Russian rouble 119.097 27.882 32.949 589.587
Saudi Arabia Saudi Arabian riyal 101.507 3.750 3.750 593.815
Singapore Singapore dollar 108.403 1.230 1.272 613.381
Spain Euro 103.782 0.687 0.758 549.991
Sri Lanka Sri Lanka rupee 115.638 109.740 131.690 563.731
St Vincent and the Grenadines East Caribbean dollar 105.071 2.700 2.700 614.665
SWJMC-R-[SECTO-131122-1(Rev.)]-En.docx 5
Country or area Currency Consumer price index 1 September 2013 (base 1 July 2011 = 100)
Exchange rate: Purchasing power equivalent on 1 September 2013 of US$585 on 1 July 2011
1 July 2011 (three-month average)
1 September 2013 (three-month average)
[1] [2] [3] [4]
Sweden Swedish krona 100.797 6.176 6.629 549.394
Taiwan, China Taiwan dollar 104.020 28.899 30.053 585.145
Tanzania, United Republic of Tanzania shilling 130.036 1 530.741
1 606.163
724.988
Thailand Thai baht 105.573 30.332 31.518 594.357
Turkey Turkish lira 117.077 1.576 1.971 547.642
Ukraine Ukrainian hryvnia 124.084 7.969 7.993 723.739
United Kingdom Pound sterling 106.679 0.610 0.650 586.288
United States US dollar 103.919 1.000 1.000 607.926
Vanuatu Vanuatu vatu 102.803 89.183 90.282 594.079
Viet Nam Vietnamese dong 118.400 20 653.000 20 815.383 687.239
* The exchange rate for the Cayman Islands is fixed at 0.800 Cayman Islands dollars to 1 US dollar. Sources: Cayman Islands Government, Ministry of Finance (www.caymanchamber.ky/pdf/finance/CIataGlance.pdf). ** On 1 April 2012, the Central Bank of Myanmar replaced a pegged exchange rate with a managed floating exchange rate for the national currency. Under the new managed float, the kyat is being traded at near the current free market rate, and the reference rate has been set by the Central Bank at 818 kyats. In order to correctly compute purchasing power, we converted the 2011 exchange rate to the new exchange rate, assuming an exchange rate of approximately 818 kyats at the end of March 2012.
Notes: CPI figures for Liberia were estimated from the price movements in Burkina Faso, Cote d’Ivoire, Ghana, Guinea, Mali, Senegal and Sierra Leone. Price index data for the Marshall Islands for 2009 onwards were estimated with prices of Fiji and Guam. Price index data for Antigua and Barbuda relate to June 2013; data for Gibraltar relate to April 2011 and July 2013; data for the Marshall Islands relate to May 2011; and data for Vanuatu relate to May 2011.
Sources: Consumer price indices (CPIs) were obtained from the ILO database on labour statistics, LABORSTA (http://laborsta.ilo.org). Exchange rates were obtained from the International Money Fund database (www.imfstatistics.org), with the exception of Taiwan, China, obtained from the Central Bank of the Republic of China (Taiwan, China) website (http://www.cbc.gov.tw/content.asp?CuItem=1878).
4. Changes in exchange rates
13. Columns [2] and [3] of table 1 present the exchange rates on 1 July 2011 and on
1 September 2013, using the average for the three months ending June 2011 and August
2013, respectively. Exchange rates were taken from the International Financial Statistics
website of the International Monetary Fund (www.imfstatistics.org); the exchange rates for
Taiwan, China, which do not appear on that website, were taken from the website of the
Central Bank of Taiwan, China (http://www.cbc.gov.tw/content.asp?CuItem=1878). The
data used are generally the end-of-month market or official exchange rates.
14. In 45 of the 57 countries and areas listed in table 1, the local currency depreciated against
the US dollar between 1 July 2011 and 1 September 2013. In nine countries and areas,
there was no change, as the currency used was either the US dollar or a currency with a
fixed exchange rate relative to the US dollar. In the remaining three countries and areas,
the local currency appreciated against the US dollar during the same period. In the Islamic
Republic of Iran, the US dollar appreciated more than 95 per cent during the period.
6 SWJMC-R-[SECTO-131122-1(Rev.)]-En.docx
5. Purchasing power of the US dollar on 1 September 2013 relative to that on 1 July 2011
15. The last column of table 1 shows the number of US dollars needed in the 57 countries and
areas on 1 September 2013 to make the same purchases as US$585 on 1 July 2011. In each
case, the figure is obtained by converting US$585 to the local currency as at 1 July 2011
(using the average exchange rate for April–June 2011), adjusting for inflation between
1 July 2011 and 1 September 2013 (using the relative change in the CPI between June
2011 and August 2013), then reconverting the figure obtained to US dollars at the
1 September 2013 rate (using the average exchange rate for June–August 2013).
16. Taking France as an example:
1. Converting the US$585 into the local currency (euro) on 1 July 2011:
= US$585 x €0.687 5 per US$ (where 0.687 is the three-month average
exchange rate for April–June 2011) = €401.895
2. Adjusting this value for inflation between June 2011 and August 2013:
= €401.895 x 103.066/100 (where 103.066 is the CPI on 1 September
2013 percentage increase in prices during the
year) = €414.217
6
3. Reconverting to US dollars at the 1 September 2013 rate:
= €414.217/€0.758 per US$ (where 0.758 is the three-month average
exchange rate for June–August 2013) = US$546.460
7
17. In each country and area considered, the combined effect of changes in exchange rates and
of prices based on the purchasing power on 1 September 2013 in relation to that of
US$585 on 1 July 2011 varied according to the relative size of these two factors. Where
the deterioration in the exchange rate exceeded the change in consumer prices, fewer
US dollars were needed on 1 September 2013 to maintain the level of purchasing power of
1 July 2011. This was the case in 30 out of 57 countries and areas. In the other 27 countries
and areas, more dollars were needed on 1 September 2013 to maintain the purchasing
power of 1 July 2011. In nine out of these 27 countries, there was no change in the
exchange rate; therefore the increase in the US dollars required on 1 September 2013 was
due only to the increase in prices during the period. In three of these 27 countries, more
US dollars were required on 1 September 2013 to reach the same level of purchasing
power as on 1 July 2011 because of the combined impact of the increase in consumer
prices and the appreciation of the local currency against the US dollar. In the remaining
15 of these 27 countries, more US dollars were required on 1 September 2013 because the
increase in the consumer prices exceeded the deterioration in the exchange rate between
1 July 2011 and 1 September 2013.
5 Rounded to three decimal places.
6 ibid.
7 The small difference between this figure and that shown in table 1 is due to rounding.

SWJMC-R-[SECTO-131122-1(Rev.)]-En.docx 7
6. Change in the purchasing power of US$585 between 1 July 2011 and 1 September 2013 in selected countries and areas
18. In order to obtain the median value of the purchasing power in the selected countries,
table 2 arranges the figures indicated in table 1, column 4, in ascending order of purchasing
power, by using a weighting of one for countries and areas with less than 10,000 seafarers
and a weighting of two for those with 10,000 or more seafarers, as required by the 1991
resolution. The median purchasing power, with the cumulative weighting of 45.5,
corresponds most closely to that of Sri Lanka (US$563.731), pointing to an overall
decrease of 26.09 per cent over the median of US$710.81 reported in 2011.
19. This figure is lower than the one obtained at the April 2011 meeting (US$710.81). Prices
increased dramatically following the 2008–09 financial crisis; however, in recent years
there has been a decrease in general price levels.
Table 2. Countries and areas arranged in ascending order of purchasing power, with corresponding weightings (2013 list of countries)
Country or area Number of US$ on 1 September 2013 with the same purchasing power as US$585 on 1 July 2011
Weighting Cumulative weighting
Brazil 454.402 2 2
Japan 485.990 2 4
Iran, Islamic Republic of 500.332 1 5
Myanmar 511.853 2 7
Poland 513.644 2 9
India 524.575 2 11
Romania 530.378 2 13
Greece 530.479 2 15
Cyprus 531.299 1 16
Norway 531.380 2 18
Denmark 544.962 1 19
Malta 545.286 1 20
Bulgaria 545.819 2 22
France 546.198 2 24
Turkey 547.642 2 26
Sweden 549.394 2 28
Spain 549.991 1 29
Germany 551.046 2 31
Croatia 551.411 2 33
Belgium 552.083 1 34
Canada 554.954 2 36
Italy 556.594 2 38
Netherlands 560.860 1 39
Malaysia 561.586 2 41
Indonesia 563.458 2 43

8 SWJMC-R-[SECTO-131122-1(Rev.)]-En.docx
Country or area Number of US$ on 1 September 2013 with the same purchasing power as US$585 on 1 July 2011
Weighting Cumulative weighting
Sri Lanka 563.731 2 45
Chile 563.782 2 47
Isle of Man 580.094 1 48
Korea, Republic of 582.422 2 50
Kuwait 583.725 1 51
Taiwan, China 585.145 1 52
Egypt 585.861 2 54
United Kingdom 586.288 2 56
Russian Federation 589.587 2 58
Gibraltar 590.254 1 59
Pakistan 590.984 2 61
Saudi Arabia 593.815 1 62
Vanuatu 594.079 1 63
Thailand 594.357 2 65
Honduras 600.661 2 67
Cayman Islands 602.553 1 68
United States 607.926 2 70
Bahamas 610.223 1 71
Antigua and Barbuda 612.466 1 72
Singapore 613.381 1 73
Bermuda 613.878 1 74
Philippines 614.546 2 76
St Vincent and the Grenadines 614.665 1 77
Cambodia 618.878 2 79
Hong Kong, China 622.039 1 80
Marshall Islands 624.268 1 81
Liberia 644.285 1 82
China 645.827 2 84
Panama 648.020 2 86
Viet Nam 687.239 2 88
Ukraine 723.739 2 90
Tanzania, United Republic of 724.988 1 91
Median 563.731 91 45.5
20. On each occasion, the employer and worker members of the Joint Maritime Commission
have, after deliberation, agreed on a different figure from the median. Table 3 provides
details on these differences since 1970.

SWJMC-R-[SECTO-131122-1(Rev.)]-En.docx 9
Table 3. Revision of the minimum wage from 1970 to 2011
Year Median derived from the formula (US$)
Basic wage set by JMC (US$)
Change in JMC figure as percentage of the median
1970 84.91 100 17.70
1972 109.20 115 5.30
1976 178.82 187 4.60
1980 259.24 276 6.50
1984 232.75 276 18.60
1987 280.88 286 1.80
1991 352.00 356 1.10
1995 366.68 385 5.00
1996 408.23 435 6.60
2001 399.29 450 * 12.70
465 * 16.50
2003 500.38 500 0
2006 543.49 515; 530; 545 ** 0
2009 713.74 No agreement –
2011 710.81 555; 568; 585 *** –
Notes: * See paragraph 3 of the resolution adopted by the 29th Session of the JMC (2001). ** The minimum basic wage was updated to US$515 as of 1 January 2007, US$530 as of 1 January 2008 and US$545 as of 31 December 2008; US$545 was used as the basis for updating the minimum wage. *** The minimum basic wage was updated to US$555 as of 1 January 2012, US$568 as of 1 January 2013 and US$585 as of 31 December 2013; US$585 was used as the basis for updating the minimum wage.

SWJMC-R-[SECTO-131122-1(Rev.)]-En.docx 11
Appendix I
Relevant provisions of the Seafarers’ Wages, Hours of Work and the Manning of Ships Recommendation, 1996 (No. 187)
IV. Minimum monthly basic pay or wage figure for able seamen
9. For the purpose of this Part, the term “able seaman” means any seafarer who is deemed to
be competent to perform any duty which may be required of a rating serving in the deck department,
other than the duties of a leading or specialist rating, or any seafarer who is defined as an able
seaman in accordance with national laws, regulations or practice, or collective agreement.
10. The basic pay or wages for a calendar month of service for an able seaman should be no
less than the amount periodically set by the Joint Maritime Commission or another body authorized
by the Governing Body of the International Labour Office. Upon a decision of the Governing Body,
the Director-General of the ILO shall notify any revised amount to the Members of the International
Labour Organization. As of 1 January 1995, the amount set by the Joint Maritime Commission was
385 United States dollars.
11. Nothing in this Part should be deemed to prejudice arrangements agreed between
shipowners or their organizations and seafarers’ organizations with regard to the regulation of
standard minimum terms and conditions of employment, provided such terms and conditions are
recognized by the competent authority.

12 SWJMC-R-[SECTO-131122-1(Rev.)]-En.docx
Appendix II
Relevant provisions of the Maritime Labour Convention, 2006: Guideline B2.2.1(a) and Guideline B2.2.4
Guideline B2.2 – Wages
Guideline B2.2.1 – Specific definitions
1. For the purpose of this Guideline, the term:
(a) able seafarer means any seafarer who is deemed competent to perform any duty which may be
required of a rating serving in the deck department, other than the duties of a supervisory or
specialist rating, or who is defined as such by national laws, regulations or practice, or by
collective agreement;
...
Guideline B2.2.4 – Minimum monthly basic pay or wage figure for able seafarers
1. The basic pay or wages for a calendar month of service for an able seafarer should be no less than
the amount periodically set by the Joint Maritime Commission or another body authorized by the
Governing Body of the International Labour Office. Upon a decision of the Governing Body, the
Director-General shall notify any revised amount to the Members of the Organization.
2. Nothing in this Guideline should be deemed to prejudice arrangements agreed between shipowners
or their organizations and seafarers’ organizations with regard to the regulation of standard
minimum terms and conditions of employment, provided such terms and conditions are recognized
by the competent authority.

SWJMC-R-[SECTO-131122-1(Rev.)]-En.docx 13
Appendix III
Resolution concerning the ILO minimum wage for able seamen, adopted at the 26th Session of the Joint Maritime Commission (October 1991)
The Joint Maritime Commission of the International Labour Organisation,
Having met in Geneva, in its Twenty-Sixth Session, from 17 to 25 October 1991,
Considering the report prepared by the International Labour Office on Wages, Hours of Work
and Manning (Sea) Recommendation, 1958 (No. 109),
Considering also that criticism has been expressed on several previous occasions by the
seafarers and by the shipowners as to the formula which has been used to revise the minimum wage
figure contained in Recommendation No. 109,
Noting also that currency fluctuations have again rendered use of the current formula an even
more unreliable exercise,
Considers that the formula used to revise the minimum wage should be amended,
Requests therefore the Governing Body of the International Labour Office to take action on
the following proposals agreed by the Shipowner and Seafarer members of the Joint Maritime
Commission, with regard to a revised formula for dealing with the updating of the minimum wage
for able seamen:
Revised formula
The mechanism and procedure for the periodic revision of the minimum basic wage for able
seamen shall be revised:
(a) to provide a more representative list of 44 countries and areas including nations which have at
least 2 million gross tons of shipping or countries and areas which are major suppliers of
seafarers. The new list of countries and areas is:
Argentina France Korea, (Rep. of) Portugal
Australia Germany Liberia Romania
Bahamas Gibraltar Malaysia Saudi Arabia
Bangladesh Greece Malta Singapore
Belgium Hong Kong Myanmar Spain
Bermuda India Netherlands Sri Lanka
Brazil Indonesia Norway Turkey
Canada Iran Pakistan United Kingdom
China Israel Panama United States
Cyprus Italy Philippines USSR
Denmark Japan Poland Yugoslavia
(b) to minimise the short-term effect of drastic fluctuations in currency exchange rates. The
formula is to utilise an averaging of the three latest months of US dollar equivalent exchange
rates (e.g. for the 26th Session, March–May 1991 averaging);
(c) the formula is to measure the changes in consumer prices for a four-year period up to the
month of the most current data (e.g. for the 26th Session, where available, May 1987 shall be
the base month and May 1991 shall be the period of measurement). In the future, the period of
measurement shall equal the full period of time between adjustments;

14 SWJMC-R-[SECTO-131122-1(Rev.)]-En.docx
(d) the formula is to include a weighting on the basis of the total number of seafarers in different
countries, on a scale equal to one for countries with less than 10,000 seafarers, and two for
countries with 10,000 or more seafarers, the numbers to be determined by an ILO Office
survey;
(e) the issue of productivity should be addressed when the Joint Maritime Commission or the
bipartite wage committee meets and if by common reasoning the two parties have found
productivity increases have taken place since the last adjustment was made, a relevant
percentage should be agreed upon and added to the new wage figure calculated according to
the formula.
Periodic review
It is agreed that a small bipartite wage committee composed of six Shipowner representatives
and six Seafarer representatives will be convened every alternate year between sessions of the Joint
Maritime Commission for the purpose of updating the ILO minimum wage for able seamen in
accordance with the prescribed formula, it being understood that such a committee should not be
convened in the year before a Joint Maritime Commission session.
Updating of minimum wage figures
The current figures of US$286 and £176 sterling as of October 1987 shall be updated to
amounts equal to US$335 and £196 sterling as of October 1991 and US$356 and £208 sterling as of
25 October 1992. The base figure for recalculation purposes should be US$356 as of 25 October
1991, using the formula prescribed above.

SWJMC-R-[SECTO-131122-1(Rev.)]-En.docx 15
Appendix IV
Resolution concerning the ILO minimum basic wage for the able seafarer, adopted by the Subcommittee on Wages of Seafarers of the Joint Maritime Commission (April 2011)
The Subcommittee on Wages of Seafarers of the Joint Maritime Commission,
Having met in Geneva from 26 to 27 April 2011,
Having considered the report prepared by the International Labour Office on the updating of
the minimum basic wage for able seafarers,
Having noted that the Subcommittee on Wages of Seafarers at its meeting on 24 to
25 February 2006 agreed the minimum basic wage figure of US$545 as of 31 December 2008,
Recalling the Seafarers’ Wages, Hours of Work and the Manning of Ships Recommendation
1996 (No. 187), referred to below as the Recommendation, and Guideline B2.2 of the Maritime
Labour Convention, 2006:
1. Agrees that the economic situation of the maritime industry in major flag States and labour
supply States provides an indication of the necessity for updating the minimum basic wage
figure.
2. Recalls that the main aim of the minimum basic pay or wage figure for the able seafarer is to
provide an international safety net for the protection of, and to contribute to, decent work for
seafarers.
3. Recalls the relevant provisions of the code of the Maritime Labour Convention, 2006,
i.e. Guideline B2.2.4 and recalling the resolution concerning the ILO minimum wage for able
seamen, adopted at the 26th Session of the Joint Maritime Commission (October 1991).
4. Notes that the Recommendation states that the number of normal hours per week covered by
the minimum basic wage should not exceed 48 hours per week.
5. Notes that the agreed sum achieved at previous meetings has not always matched the figure
indicated by the formula since the process took into account other factors.
6. Recalls that the Subcommittee, at its previous meeting in 2009, could not agree on a revised
wage figure.
7. Notes that the current mechanism, including the formula, needs to be maintained until such
time as an alternative is agreed.
8. Reaffirms support for the role of the Joint Maritime Commission and its Subcommittee on
Wages of Seafarers and believes that its role and importance as the agenda-setting mechanism
for the maritime industry will increase.
9. Decides, regarding Paragraph 10 of the Recommendation, to update the current ILO minimum
basic wage for an able seafarer of US$545 to US$555 as of 1 January 2012; US$568 as of
1 January 2013; and US$585 as of 31 December 2013.
10. Agrees that the amount of US$585 as of 1 July 2011 should be used as the basis for
recalculation purposes.
11. Recalls that the formula produced a figure of US$710 as of 1 March 2011. This figure should
be considered when determining any future increase.
12. Acknowledges that the agreed minimum wage figure in no way prejudices collective
bargaining or the adoption of higher levels in other international wage-setting mechanisms.
13. Invites the Governing Body to convene a meeting of the Subcommittee in the first half of
2014 and every two years thereafter and, where appropriate, for the Subcommittee to report
directly to the Governing Body.

16 SWJMC-R-[SECTO-131122-1(Rev.)]-En.docx
Appendix V
Major maritime countries and areas (with more than 2 million gross tons in 2009) and major suppliers of seafarers (with more than 10,000 seafarers in 2010)
Number of seafarers, 2010
Millions of gross tons, 2012
Weighting
Antigua and Barbuda – 10 664 728 1
Bahamas – 52 424 297 1
Belgium – 4 118 011 1
Bermuda (UK) – 11 594 432 1
Brazil 10 601 2 344 493 2
Bulgaria 33 269 – 2
Cambodia 20 057 – 2
Canada 17 103 2 957 093 2
Cayman Islands (UK) – 3 318 094 1
Chile 15 107 – 2
China 141 807 40 612 372 2
Croatia 18 658 – 2
Cyprus – 20 038 519 1
Denmark – 11 562 293 1
Egypt 12 970 – 2
France 13 696 5 921 321 2
Germany 10 253 13 299 635 2
Gibraltar – 3 251 550 1
Greece 12 963 41 140 885 2
Honduras 19 580 – 2
Hong Kong, China – 78 299 096 1
India 62 673 9 364 181 2
Indonesia 77 727 11 670 513 2
Iran, Islamic Republic of – 2 843 547 1
Isle of Man (UK) – 14 203 373 1
Italy 20 950 18 510 425 2
Japan 28 605 18 527 485 2
Korea, Republic of 12 778 11 793 075 2
Kuwait – 2 430 947 1
Liberia – 126 017 230 1
Malaysia 35 000 7 585 934 2

SWJMC-R-[SECTO-131122-1(Rev.)]-En.docx 17
Number of seafarers, 2010
Millions of gross tons, 2012
Weighting
Malta – 44 168 107 1
Marshall Islands – 85 320 403 1
Myanmar 31 095 – 2
Netherlands – 7 470 999 1
Norway 23 382 16 527 559 2
Pakistan 12 168 – 2
Panama 12 390 218 663 214 2
Philippines 81 180 4 449 242 2
Poland 22 669 – 2
Romania 24 343 – 2
Russian Federation 65 000 7 690 066 2
Singapore – 60 317 803 1
Saudi Arabia – 2 187 028 1
Spain – 2 540 929 1
Sri Lanka 21 793 – 2
St Vincent and the Grenadines – 3 409 833 1
Sweden 10 923 2 853 626 2
Taiwan, China – 3 195 132 1
Tanzania, United Republic of – 3 863 047 1
Thailand 11 125 2 961 162 2
Turkey 87 743 6 476 420 2
Ukraine 38 172 – 2
United Kingdom 23 193 16 921 624 2
United States 38 454 11 335 569 2
Vanuatu – 2 477 190 1
Viet Nam 22 176 3 899 388 2
Total 964 439 1 031 221 870 91
World totals 1 316 604 1 081 204 742
Percentage 73.3 95.4
Note: Denmark, France, Norway and Spain: tonnage includes international registry; countries receive a weighting of two if they are a major supplier of seafarers, and of one if they are not.