Embed Size (px)
Citation preview
pts–0.5 pts–0.165.265.3Participation rate (%)
pts0.2 pts0.15.25.1Unemployment rate (%)
%4.816.4632.2615.8Unemployed persons ('000)
%0.2–15.411 444.011 459.5Employed persons ('000)
Seasonally Adjusted
pts–0.6 pts–0.165.265.3Participation rate (%)
pts0.2 pts0.05.25.2Unemployment rate (%)
%4.5–1.7625.0626.8Unemployed persons ('000)
%0.11.111 444.611 443.6Employed persons ('000)
Trend
Feb 11 toFeb 12
Jan 12 toFeb 12Feb 2012Jan 2012
K E Y F I G U R E S
T R E N D E S T I M A T E S ( M O N T H L Y C H A N G E )
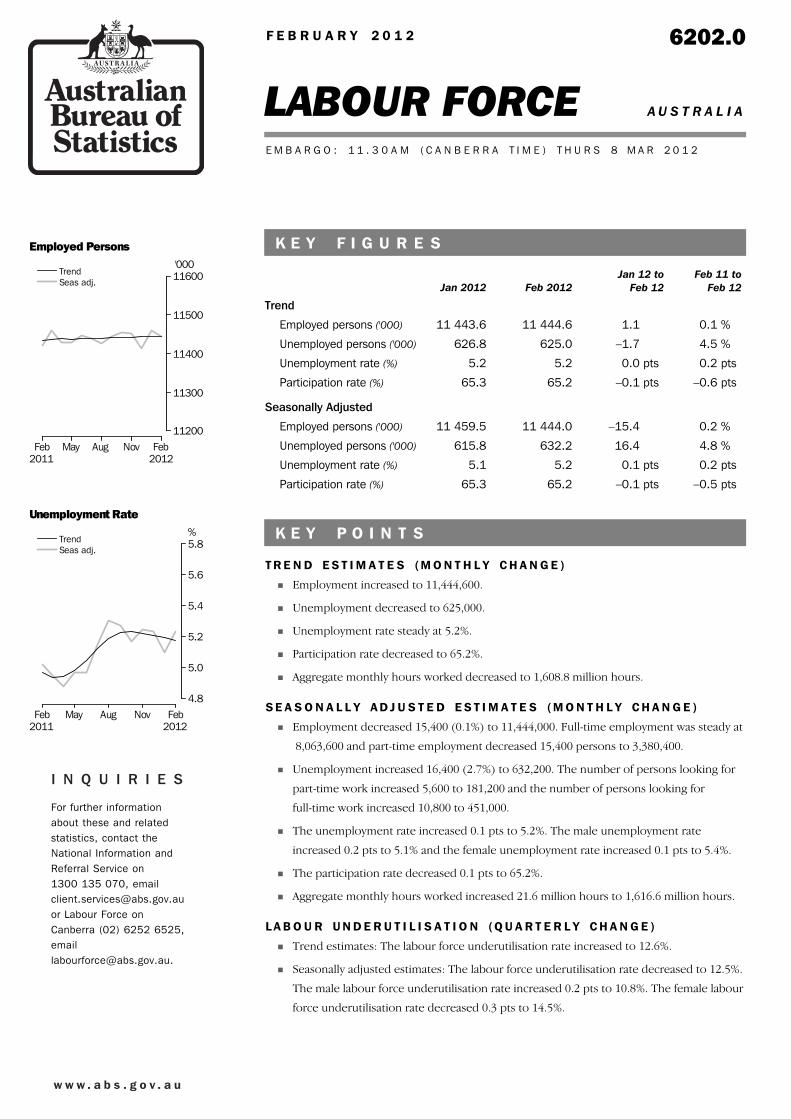
! Employment increased to 11,444,600.
! Unemployment decreased to 625,000.
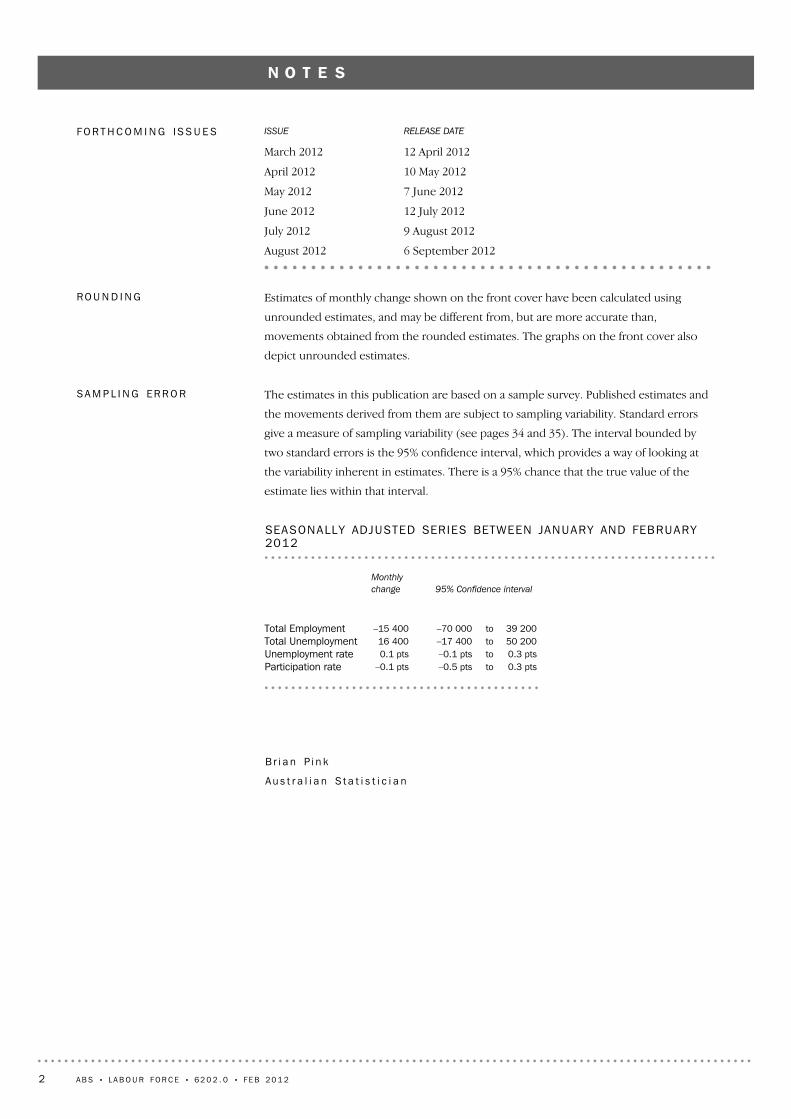
! Unemployment rate steady at 5.2%.
! Participation rate decreased to 65.2%.
! Aggregate monthly hours worked decreased to 1,608.8 million hours.
S E A S O N A L L Y A D J U S T E D E S T I M A T E S ( M O N T H L Y C H A N G E )
! Employment decreased 15,400 (0.1%) to 11,444,000. Full-time employment was steady at
8,063,600 and part-time employment decreased 15,400 persons to 3,380,400.
! Unemployment increased 16,400 (2.7%) to 632,200. The number of persons looking for
part-time work increased 5,600 to 181,200 and the number of persons looking for
full-time work increased 10,800 to 451,000.
! The unemployment rate increased 0.1 pts to 5.2%. The male unemployment rate
increased 0.2 pts to 5.1% and the female unemployment rate increased 0.1 pts to 5.4%.
! The participation rate decreased 0.1 pts to 65.2%.
! Aggregate monthly hours worked increased 21.6 million hours to 1,616.6 million hours.
L A B O U R U N D E R U T I L I S A T I O N ( Q U A R T E R L Y C H A N G E )
! Trend estimates: The labour force underutilisation rate increased to 12.6%.
! Seasonally adjusted estimates: The labour force underutilisation rate decreased to 12.5%.
The male labour force underutilisation rate increased 0.2 pts to 10.8%. The female labour
force underutilisation rate decreased 0.3 pts to 14.5%.
K E Y P O I N T S
E M B A R G O : 1 1 . 3 0 A M ( C A N B E R R A T I M E ) T H U R S 8 M A R 2 0 1 2
LABOUR FORCE A U S T R A L I A
6202.0F E B R U A R Y 2 0 1 2
For further informationabout these and relatedstatistics, contact theNational Information andReferral Service on1300 135 070, [email protected] Labour Force onCanberra (02) 6252 6525,[email protected].
Employed Persons
Feb2011
May Aug Nov Feb2012
'000
11200
11300
11400
11500
11600TrendSeas adj.
Unemployment Rate
Feb2011
May Aug Nov Feb2012
%
4.8
5.0
5.2
5.4
5.6
5.8TrendSeas adj.
I N Q U I R I E S
w w w . a b s . g o v . a u
6 September 2012August 2012
9 August 2012July 2012
12 July 2012June 2012
7 June 2012May 2012
10 May 2012April 2012
12 April 2012March 2012
RELEASE DATEISSUEFO R T H C O M I N G I S S U E S
B r i a n P i n k
Au s t r a l i a n S t a t i s t i c i a n
0.3 ptsto–0.5 pts–0.1 ptsParticipation rate0.3 ptsto–0.1 pts0.1 ptsUnemployment rate50 200to–17 40016 400Total Unemployment39 200to–70 000–15 400Total Employment
95% Confidence interval
Monthly
change
SEASONALLY ADJUSTED SERIES BETWEEN JANUARY AND FEBRUARY2012
The estimates in this publication are based on a sample survey. Published estimates and
the movements derived from them are subject to sampling variability. Standard errors
give a measure of sampling variability (see pages 34 and 35). The interval bounded by
two standard errors is the 95% confidence interval, which provides a way of looking at
the variability inherent in estimates. There is a 95% chance that the true value of the
estimate lies within that interval.
SA M P L I N G ER R O R
Estimates of monthly change shown on the front cover have been calculated using
unrounded estimates, and may be different from, but are more accurate than,
movements obtained from the rounded estimates. The graphs on the front cover also
depict unrounded estimates.
RO U N D I N G
2 A B S • L A B O U R FO R C E • 6 2 0 2 . 0 • F E B 2 0 1 2
N O T E S
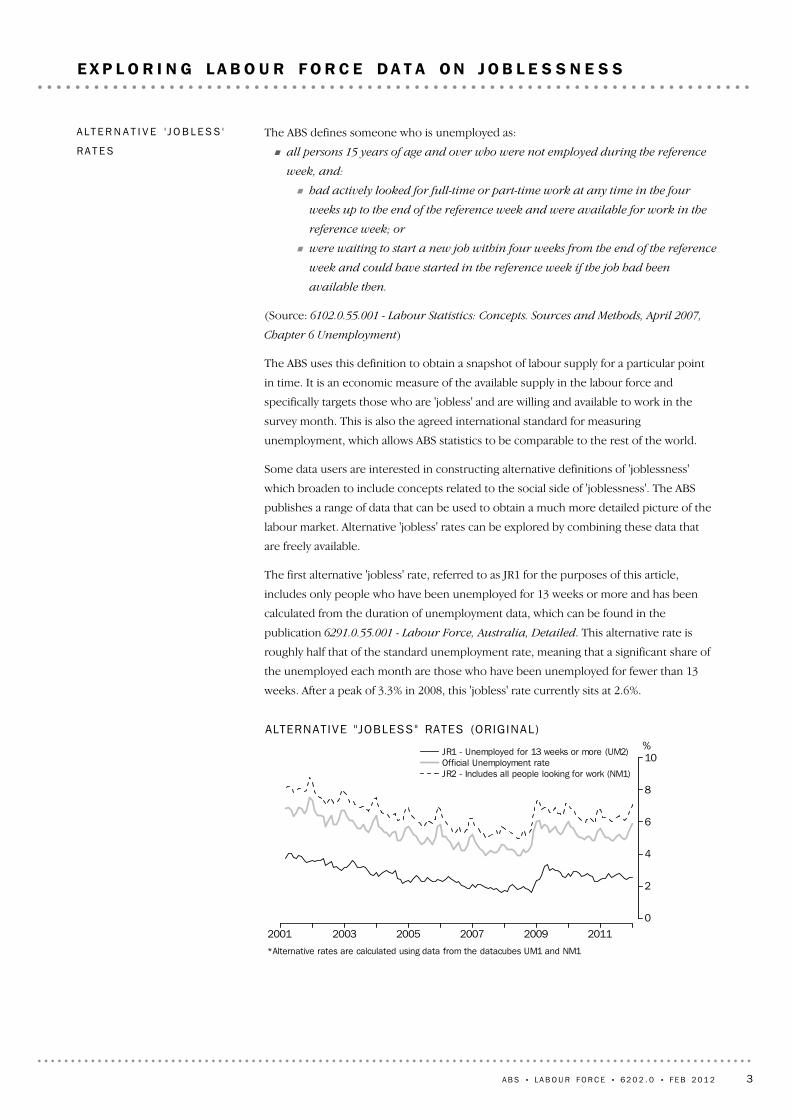
*Alternative rates are calculated using data from the datacubes UM1 and NM1
2001 2003 2005 2007 2009 2011
%
0
2
4
6
8
10JR1 - Unemployed for 13 weeks or more (UM2)Official Unemployment rateJR2 - Includes all people looking for work (NM1)
ALTERNAT IVE "JOBLESS" RATES (ORIG INAL)
The ABS defines someone who is unemployed as:
! all persons 15 years of age and over who were not employed during the reference
week, and:
! had actively looked for full-time or part-time work at any time in the four
weeks up to the end of the reference week and were available for work in the
reference week; or
! were waiting to start a new job within four weeks from the end of the reference
week and could have started in the reference week if the job had been
available then.
(Source: 6102.0.55.001 - Labour Statistics: Concepts. Sources and Methods, April 2007,
Chapter 6 Unemployment)
The ABS uses this definition to obtain a snapshot of labour supply for a particular point
in time. It is an economic measure of the available supply in the labour force and
specifically targets those who are 'jobless' and are willing and available to work in the
survey month. This is also the agreed international standard for measuring
unemployment, which allows ABS statistics to be comparable to the rest of the world.
Some data users are interested in constructing alternative definitions of 'joblessness'
which broaden to include concepts related to the social side of 'joblessness'. The ABS
publishes a range of data that can be used to obtain a much more detailed picture of the
labour market. Alternative 'jobless' rates can be explored by combining these data that
are freely available.
The first alternative 'jobless' rate, referred to as JR1 for the purposes of this article,
includes only people who have been unemployed for 13 weeks or more and has been
calculated from the duration of unemployment data, which can be found in the
publication 6291.0.55.001 - Labour Force, Australia, Detailed. This alternative rate is
roughly half that of the standard unemployment rate, meaning that a significant share of
the unemployed each month are those who have been unemployed for fewer than 13
weeks. After a peak of 3.3% in 2008, this 'jobless' rate currently sits at 2.6%.
AL T E R N A T I V E ' J O B L E S S '
RA T E S
A B S • L A B O U R FO R C E • 6 2 0 2 . 0 • F E B 2 0 1 2 3
E X P L O R I N G L A B O U R F O R C E D A T A O N J O B L E S S N E S S
1 to 5 hrs 6 to 15 hrs 16 to 35 hrsHours Usually Worked
'000
0
1000
2000
3000Want to work more hoursTotal
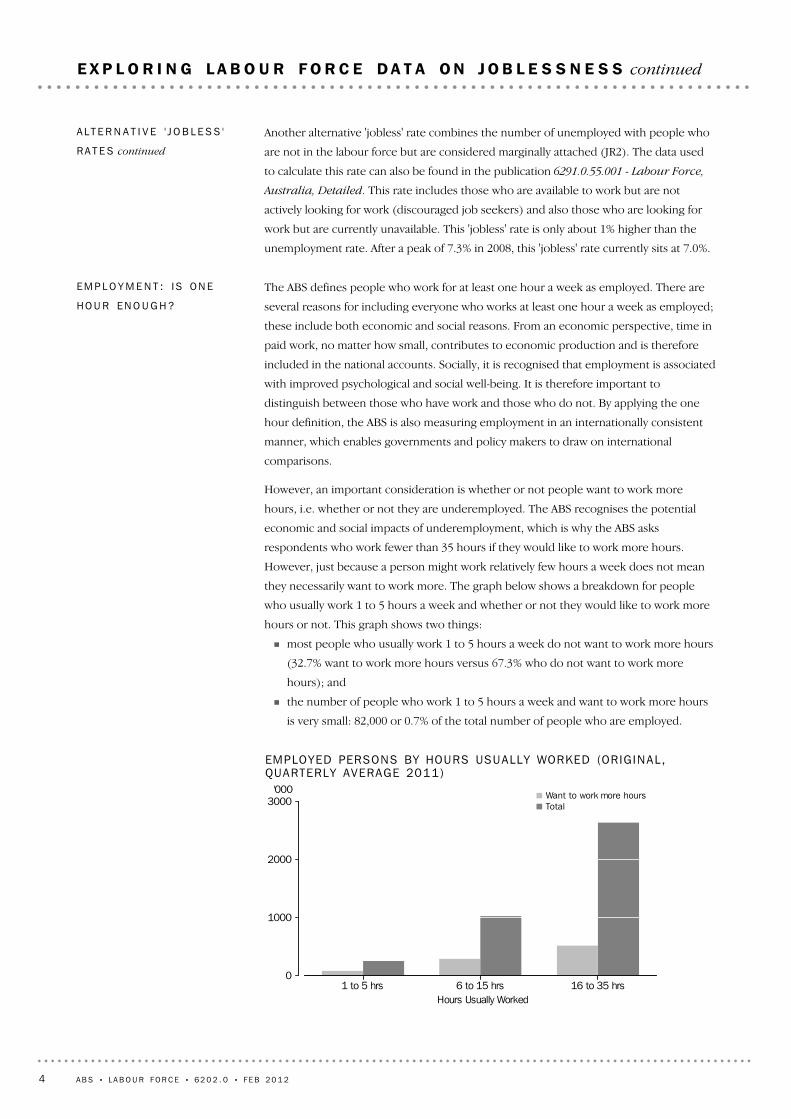
EMPLOYED PERSONS BY HOURS USUALLY WORKED (ORIGINAL ,QUARTERLY AVERAGE 2011)
The ABS defines people who work for at least one hour a week as employed. There are
several reasons for including everyone who works at least one hour a week as employed;
these include both economic and social reasons. From an economic perspective, time in
paid work, no matter how small, contributes to economic production and is therefore
included in the national accounts. Socially, it is recognised that employment is associated
with improved psychological and social well-being. It is therefore important to
distinguish between those who have work and those who do not. By applying the one
hour definition, the ABS is also measuring employment in an internationally consistent
manner, which enables governments and policy makers to draw on international
comparisons.
However, an important consideration is whether or not people want to work more
hours, i.e. whether or not they are underemployed. The ABS recognises the potential
economic and social impacts of underemployment, which is why the ABS asks
respondents who work fewer than 35 hours if they would like to work more hours.
However, just because a person might work relatively few hours a week does not mean
they necessarily want to work more. The graph below shows a breakdown for people
who usually work 1 to 5 hours a week and whether or not they would like to work more
hours or not. This graph shows two things:
! most people who usually work 1 to 5 hours a week do not want to work more hours
(32.7% want to work more hours versus 67.3% who do not want to work more
hours); and
! the number of people who work 1 to 5 hours a week and want to work more hours
is very small: 82,000 or 0.7% of the total number of people who are employed.
EM P L O Y M E N T : I S ON E
HO U R EN O U G H ?
Another alternative 'jobless' rate combines the number of unemployed with people who
are not in the labour force but are considered marginally attached (JR2). The data used
to calculate this rate can also be found in the publication 6291.0.55.001 - Labour Force,
Australia, Detailed. This rate includes those who are available to work but are not
actively looking for work (discouraged job seekers) and also those who are looking for
work but are currently unavailable. This 'jobless' rate is only about 1% higher than the
unemployment rate. After a peak of 7.3% in 2008, this 'jobless' rate currently sits at 7.0%.
AL T E R N A T I V E ' J O B L E S S '
RA T E S continued
4 A B S • L A B O U R FO R C E • 6 2 0 2 . 0 • F E B 2 0 1 2
E X P L O R I N G L A B O U R F O R C E D A T A O N J O B L E S S N E S S continued
These are just a few examples of how the data from the ABS can be used to get a more
detailed picture of labour supply in the Australian Labour Market. Other publications that
explore these topics in much more detail include:
! 6265.0 - Underemployed Workers, Australia
! 6222.0 - Job Search Experience, Australia
! 6105.0 - Australian Labour Market Statistics
For further information about Labour Force classifications and definitions see the article:
Understanding the Australian Labour Force using ABS Statistics on the 6202.0 Labour
Force, Australia website or the publication 6102.0.55.001 - Labour Statistics: Concepts,
Sources and Methods.
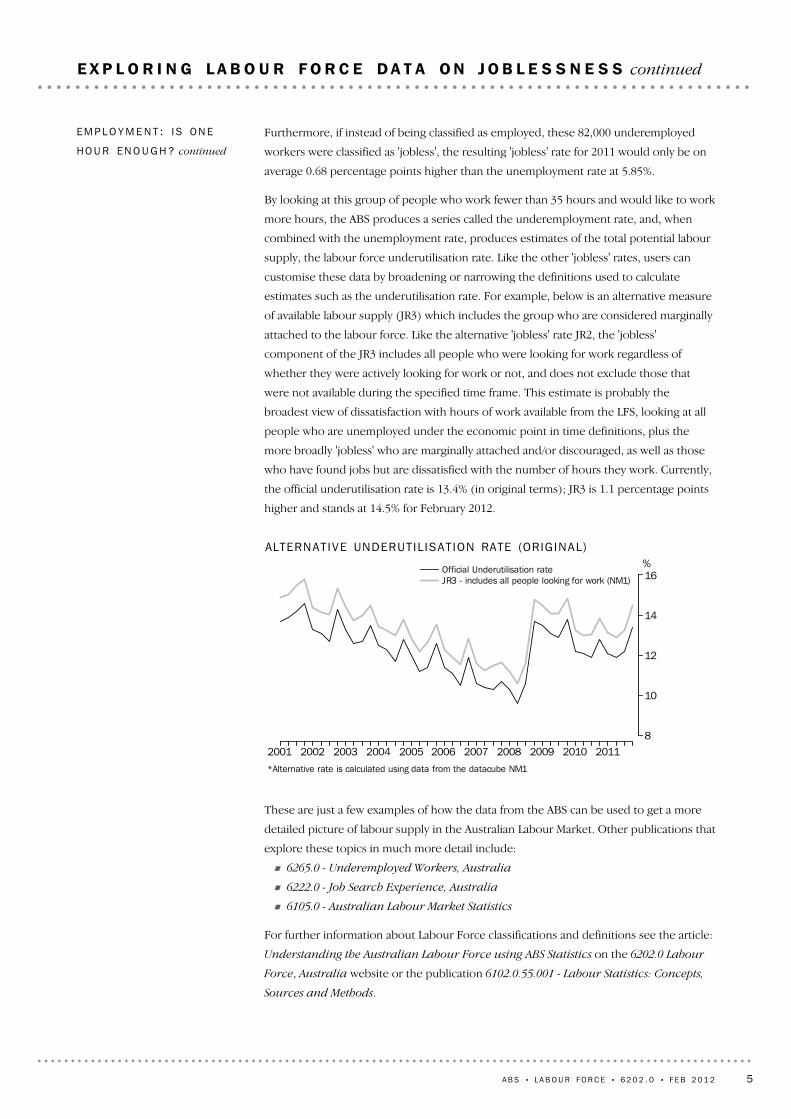
*Alternative rate is calculated using data from the datacube NM1
2001 2002 2003 2004 2005 2006 2007 2008 2009 2010 2011
%
8
10
12
14
16Official Underutilisation rateJR3 - includes all people looking for work (NM1)
ALTERNAT IVE UNDERUT IL ISAT ION RATE (ORIG INAL)
Furthermore, if instead of being classified as employed, these 82,000 underemployed
workers were classified as 'jobless', the resulting 'jobless' rate for 2011 would only be on
average 0.68 percentage points higher than the unemployment rate at 5.85%.
By looking at this group of people who work fewer than 35 hours and would like to work
more hours, the ABS produces a series called the underemployment rate, and, when
combined with the unemployment rate, produces estimates of the total potential labour
supply, the labour force underutilisation rate. Like the other 'jobless' rates, users can
customise these data by broadening or narrowing the definitions used to calculate
estimates such as the underutilisation rate. For example, below is an alternative measure
of available labour supply (JR3) which includes the group who are considered marginally
attached to the labour force. Like the alternative 'jobless' rate JR2, the 'jobless'
component of the JR3 includes all people who were looking for work regardless of
whether they were actively looking for work or not, and does not exclude those that
were not available during the specified time frame. This estimate is probably the
broadest view of dissatisfaction with hours of work available from the LFS, looking at all
people who are unemployed under the economic point in time definitions, plus the
more broadly 'jobless' who are marginally attached and/or discouraged, as well as those
who have found jobs but are dissatisfied with the number of hours they work. Currently,
the official underutilisation rate is 13.4% (in original terms); JR3 is 1.1 percentage points
higher and stands at 14.5% for February 2012.
EM P L O Y M E N T : I S ON E
HO U R EN O U G H ? continued
A B S • L A B O U R FO R C E • 6 2 0 2 . 0 • F E B 2 0 1 2 5
E X P L O R I N G L A B O U R F O R C E D A T A O N J O B L E S S N E S S continued
65.25.25.212 069.7625.0446.511 444.63 384.98 059.7February65.35.25.312 070.3626.8449.111 443.63 388.68 055.0January
2012
65.35.25.312 071.4628.6451.311 442.83 392.68 050.2December65.45.25.312 072.8630.5453.411 442.23 396.08 046.3November65.55.25.312 073.9632.1454.311 441.83 397.78 044.0October65.55.25.312 072.1631.3452.611 440.73 398.28 042.5September65.65.25.312 065.6626.3447.311 439.33 397.28 042.1August65.65.15.212 055.8617.5439.011 438.33 393.38 045.0July65.65.05.112 045.7607.9430.311 437.73 387.58 050.2June65.65.05.012 037.2600.0423.211 437.33 381.98 055.3May65.64.94.912 032.7594.9418.911 437.83 378.08 059.8April65.74.94.912 031.7594.3418.211 437.43 376.38 061.2March65.85.05.012 032.5598.2420.511 434.43 376.88 057.6February
201165.45.45.511 742.2630.3456.411 111.93 337.57 774.4February 201065.65.35.311 526.5606.8434.610 919.63 160.87 758.8February 2009
PE R S O N S
58.75.46.15 507.6296.2185.15 211.42 376.42 835.0February58.75.46.25 507.8295.6185.85 212.32 378.72 833.5January
2012
58.85.46.25 508.7294.9186.15 213.72 381.32 832.4December58.95.36.25 510.3294.2185.85 216.12 383.92 832.2November59.05.36.15 512.5293.8184.85 218.82 385.82 832.9October59.15.36.15 513.6293.7183.05 219.92 387.12 832.8September59.15.36.05 512.1293.5181.15 218.62 387.42 831.2August59.15.36.05 507.7292.8179.25 214.82 386.12 828.7July59.15.35.95 501.1291.8177.85 209.32 383.22 826.1June59.15.35.95 493.5290.5176.75 203.02 379.42 823.6May59.15.35.95 486.5288.9175.85 197.62 375.32 822.2April59.15.35.95 480.9288.6175.85 192.32 370.82 821.5March59.15.35.95 476.4289.9176.65 186.52 366.42 820.1February
201158.55.36.25 329.0283.8178.75 045.22 322.32 722.9February 201058.95.25.75 253.4273.3167.44 980.22 237.62 742.6February 2009
FE M A L E S
71.95.04.86 562.0328.8261.46 233.21 008.65 224.7February72.05.04.86 562.5331.2263.36 231.31 009.85 221.5January
2012
72.05.14.86 562.7333.6265.26 229.11 011.35 217.8December72.15.14.96 562.5336.4267.56 226.11 012.05 214.1November72.25.24.96 561.4338.4269.56 223.01 011.95 211.1October72.25.14.96 558.4337.6269.56 220.91 011.15 209.7September72.25.14.96 553.5332.8266.26 220.71 009.85 210.9August72.25.04.76 548.2324.7259.86 223.51 007.25 216.3July72.24.84.66 544.6316.1252.56 228.51 004.35 224.1June72.34.74.56 543.8309.5246.56 234.21 002.55 231.7May72.44.74.46 546.2306.0243.06 240.21 002.75 237.5April72.54.74.46 550.8305.7242.46 245.11 005.55 239.6March72.64.74.56 556.2308.3243.96 247.91 010.45 237.5February
201172.45.45.26 413.2346.5277.76 066.71 015.25 051.5February 201072.45.35.16 273.0333.6267.25 939.5923.35 016.2February 2009
MA L E S
%%%'000'000'000'000'000'000
Total
Looking
for f/t
workTotal
Looking
for f/t
workTotal
Part
time
Full
time
Participation
rate
UNEMPLOYMENTRATE
Labour force
UNEMPLOYEDEMPLOYED
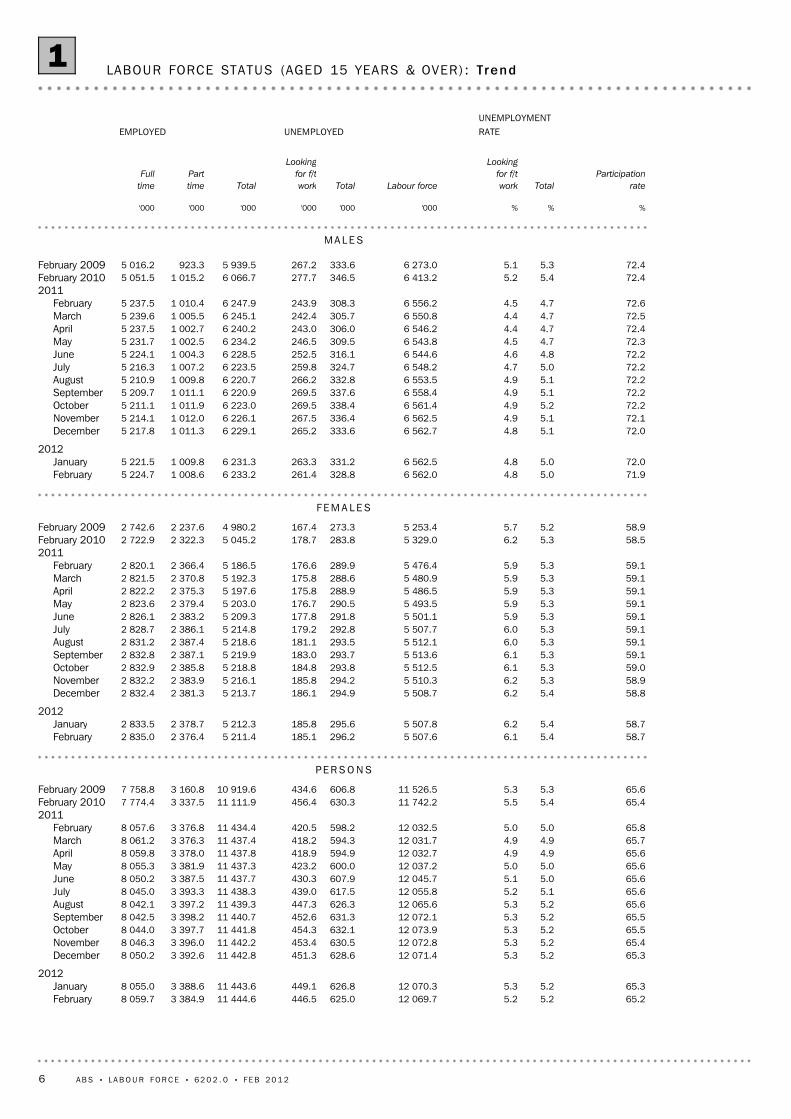
LABOUR FORCE STATUS (AGED 15 YEARS & OVER) : Trend1
6 A B S • L A B O U R FO R C E • 6 2 0 2 . 0 • F E B 2 0 1 2
65.25.25.312 076.2632.2451.011 444.03 380.48 063.6February65.35.15.212 075.3615.8440.211 459.53 395.88 063.7January
2012
65.25.25.312 043.2630.0451.111 413.33 364.98 048.4December65.55.25.312 085.0634.2451.811 450.83 425.38 025.6November65.55.25.412 078.5624.4459.911 454.23 391.08 063.2October65.65.35.312 079.5637.0453.811 442.43 402.78 039.7September65.65.35.412 065.9639.6459.511 426.33 394.58 031.8August65.65.15.112 060.7620.7435.011 440.03 393.58 046.6July65.65.05.012 044.4598.4420.811 446.03 372.58 073.4June65.55.05.012 026.2597.9424.711 428.33 407.78 020.6May65.54.94.912 013.4586.0418.111 427.43 380.98 046.5April65.84.94.912 056.3596.4417.111 459.93 355.28 104.6March65.75.04.912 025.0603.2418.811 421.73 356.48 065.3February
201165.35.35.511 741.8624.6454.511 117.23 357.67 759.6February 201065.75.35.511 548.7617.7450.410 931.03 179.47 751.6February 2009
PE R S O N S
58.75.46.15 515.1296.8183.55 218.32 374.82 843.6February58.85.36.05 510.4290.8180.15 219.72 390.62 829.1January
2012
58.65.56.45 491.7303.2192.85 188.62 356.22 832.4December58.95.46.25 513.4295.6185.85 217.82 396.02 821.8November59.05.16.15 512.2283.7186.15 228.52 389.22 839.3October59.25.46.05 526.3297.0181.85 229.42 389.02 840.4September59.05.36.15 506.6293.2182.35 213.42 389.32 824.1August59.15.45.95 510.5296.4177.25 214.12 381.32 832.8July59.15.35.85 505.2291.3173.45 213.92 373.72 840.3June59.05.46.25 486.2297.7183.75 188.52 392.42 796.0May59.05.05.85 476.2274.2174.35 202.02 383.02 819.0April59.35.45.95 498.8295.6177.85 203.22 358.52 844.8March59.05.25.75 465.5286.4170.75 179.12 363.22 815.9February
201158.55.36.25 323.9282.1178.75 041.82 337.42 704.4February 201059.25.46.25 277.5285.2180.74 992.42 251.82 740.5February 2009
FE M A L E S
71.95.14.96 561.1335.4267.56 225.71 005.65 220.1February72.05.04.76 564.9325.0260.16 239.81 005.25 234.6January
2012
71.95.04.76 551.5326.8258.36 224.71 008.65 216.0December72.25.24.96 571.6338.5266.06 233.01 029.25 203.8November72.25.25.06 566.4340.6273.96 225.71 001.85 223.9October72.15.25.06 553.1340.1272.06 213.11 013.75 199.3September72.35.35.16 559.3346.4277.26 212.91 005.25 207.7August72.25.04.76 550.2324.3257.86 225.91 012.25 213.7July72.24.74.56 539.1307.1247.46 232.0998.95 233.2June72.24.64.46 540.0300.2241.06 239.81 015.25 224.6May72.34.84.56 537.2311.7243.86 225.4997.95 227.6April72.64.64.46 557.5300.8239.36 256.7996.85 259.9March72.74.84.56 559.5316.8248.16 242.6993.35 249.4February
201172.45.35.26 417.9342.4275.86 075.41 020.25 055.2February 201072.45.35.16 271.2332.5269.75 938.6927.65 011.1February 2009
MA L E S
%%%'000'000'000'000'000'000
Total
Looking
for f/t
workTotal
Looking
for f/t
workTotal
Part
time
Full
time
Participation
rate
UNEMPLOYMENTRATE
Labour force
UNEMPLOYEDEMPLOYED
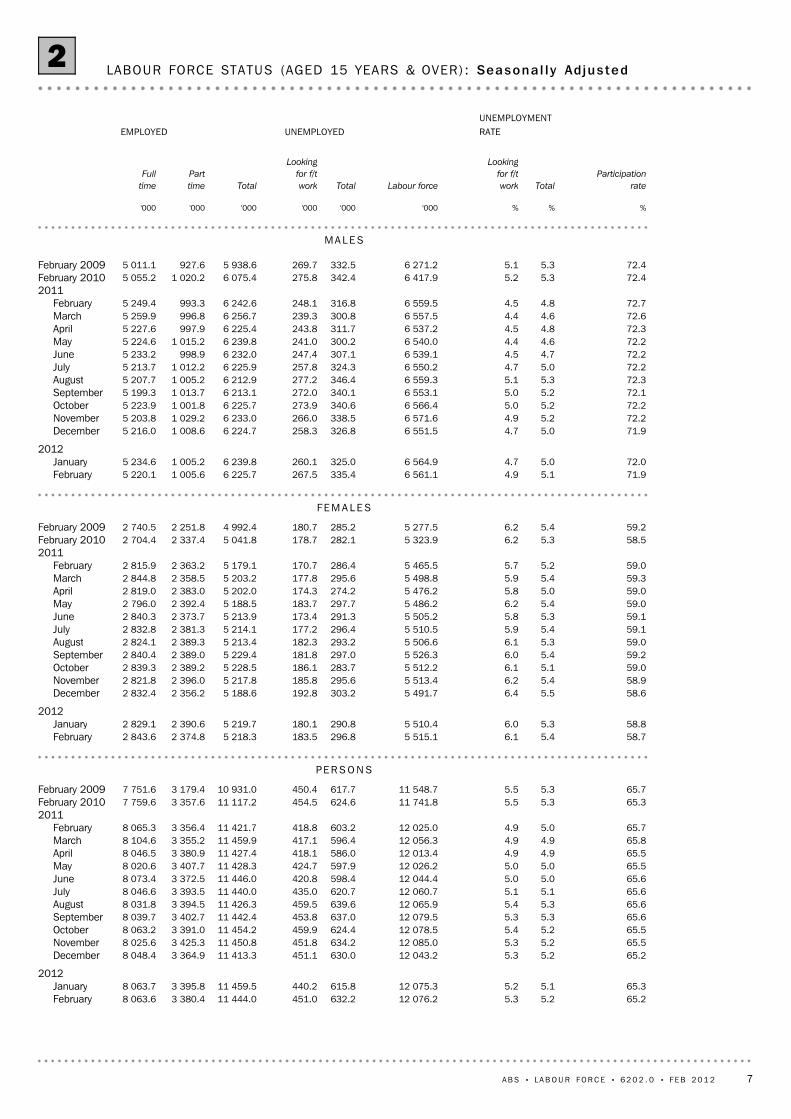
LABOUR FORCE STATUS (AGED 15 YEARS & OVER) : Seasona l l y Adjus ted2
A B S • L A B O U R FO R C E • 6 2 0 2 . 0 • F E B 2 0 1 2 7
65.55.95.818 518.46 398.112 120.3712.8501.911 407.53 305.78 101.8February64.85.55.718 499.96 504.511 995.4655.4481.811 340.03 296.88 043.2January
2012
65.85.05.118 481.46 314.912 166.5613.5435.811 553.03 380.88 172.1December65.24.95.018 460.46 432.412 028.0589.8427.311 438.33 401.08 037.3November65.55.05.218 439.36 361.512 077.8599.8443.111 478.03 455.38 022.6October66.05.25.218 418.36 257.312 161.0633.4442.811 527.53 376.18 151.4September65.05.15.218 402.66 448.211 954.4609.7432.811 344.73 392.77 952.0August65.44.84.818 386.76 364.112 022.6576.0408.511 446.63 387.28 059.4July65.54.84.918 370.96 345.612 025.4579.2415.311 446.23 426.08 020.2June65.65.05.118 351.36 321.412 030.0604.2433.511 425.83 440.37 985.5May65.65.05.018 331.56 314.912 016.6601.1425.011 415.43 413.18 002.3April66.05.35.118 311.86 222.812 089.0637.2434.511 451.93 390.38 061.5March66.05.65.418 292.96 223.612 069.3680.7466.211 388.63 284.58 104.0February
201165.66.06.117 969.66 181.611 788.0703.9506.411 084.13 286.27 797.9February 201066.06.06.117 579.35 978.911 600.3697.6503.710 902.73 111.37 791.4February 2009
PE R S O N S
58.96.16.79 388.23 858.75 529.5339.7205.05 189.82 342.62 847.2February58.05.66.69 378.83 939.05 439.8305.6199.35 134.22 316.52 817.6January
2012
59.25.46.39 369.33 818.25 551.1301.3194.55 249.82 364.12 885.7December58.75.05.99 357.93 862.55 495.3276.0178.25 219.32 385.62 833.7November59.04.95.99 346.33 830.95 515.5269.0177.05 246.42 435.62 810.9October59.75.35.79 334.93 763.35 571.6293.3176.85 278.32 372.12 906.1September58.55.15.79 326.23 866.95 459.3280.0169.35 179.42 392.82 786.5August58.95.05.59 317.53 829.95 487.6273.8164.25 213.92 370.32 843.5July59.15.15.69 308.83 804.65 504.2279.3167.25 224.92 404.42 820.5June59.15.46.19 298.63 807.65 491.1294.6182.55 196.42 408.12 788.3May59.05.26.09 288.43 812.55 475.8283.3177.45 192.52 404.42 788.1April59.55.86.29 278.23 756.05 522.3320.5187.85 201.72 378.62 823.1March59.16.06.49 268.23 786.65 481.5328.8191.55 152.72 331.12 821.6February
201158.76.16.99 105.03 763.65 341.3323.9201.45 017.52 304.42 713.0February 201059.46.26.98 913.23 615.35 298.0328.5205.64 969.42 216.52 753.0February 2009
FE M A L E S
72.25.75.39 130.12 539.46 590.8373.1296.96 217.7963.15 254.6February71.95.35.19 121.12 565.56 555.6349.7282.56 205.8980.25 225.6January
2012
72.64.74.49 112.12 496.76 615.4312.2241.36 303.21 016.75 286.4December71.84.84.69 102.62 569.96 532.7313.7249.16 219.01 015.45 203.6November72.25.04.99 092.92 530.66 562.3330.8266.16 231.51 019.85 211.8October72.55.24.89 083.42 494.06 589.4340.1265.96 249.31 004.05 245.2September71.65.14.99 076.42 581.36 495.0329.7263.56 165.3999.85 165.5August72.14.64.59 069.22 534.26 535.0302.3244.36 232.81 016.95 215.9July72.04.64.69 062.22 541.06 521.2299.9248.16 221.31 021.65 199.7June72.24.74.69 052.72 513.86 538.9309.5251.06 229.41 032.25 197.2May72.34.94.59 043.12 502.46 540.7317.8247.66 222.91 008.75 214.2April72.74.84.59 033.62 466.96 566.8316.7246.76 250.11 011.75 238.4March73.05.34.99 024.72 437.06 587.7351.9274.76 235.9953.45 282.4February
201172.75.95.78 864.62 418.06 446.6380.0305.06 066.6981.75 084.9February 201072.75.95.68 666.12 363.76 302.4369.1298.15 933.3894.85 038.5February 2009
MA L E S
%%%'000'000'000'000'000'000'000'000
Total
Looking
for f/t
workTotal
Looking
for f/t
workTotal
Part
time
Full
time
Participation
rate
UNEMPLOYMENTRATE
Civilian
population
aged 15
years
and over
Not in
labour
force
Labour
force
UNEMPLOYEDEMPLOYED
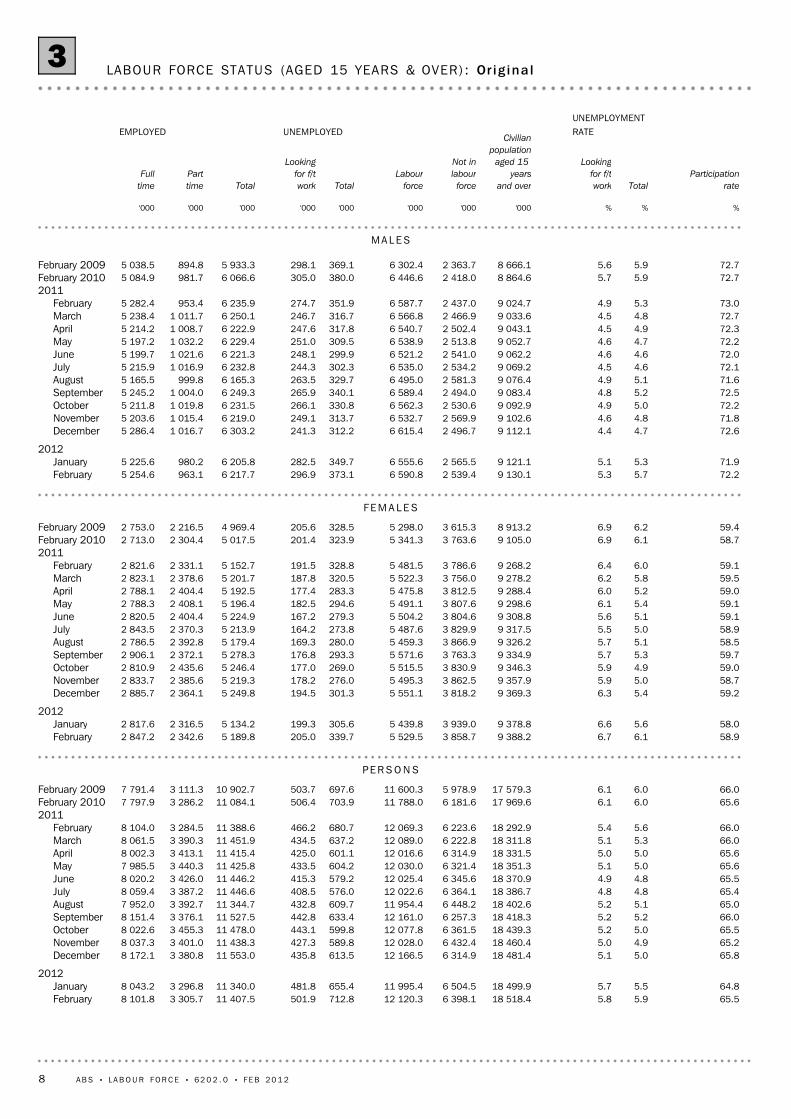
LABOUR FORCE STATUS (AGED 15 YEARS & OVER) : Or ig ina l3
8 A B S • L A B O U R FO R C E • 6 2 0 2 . 0 • F E B 2 0 1 2
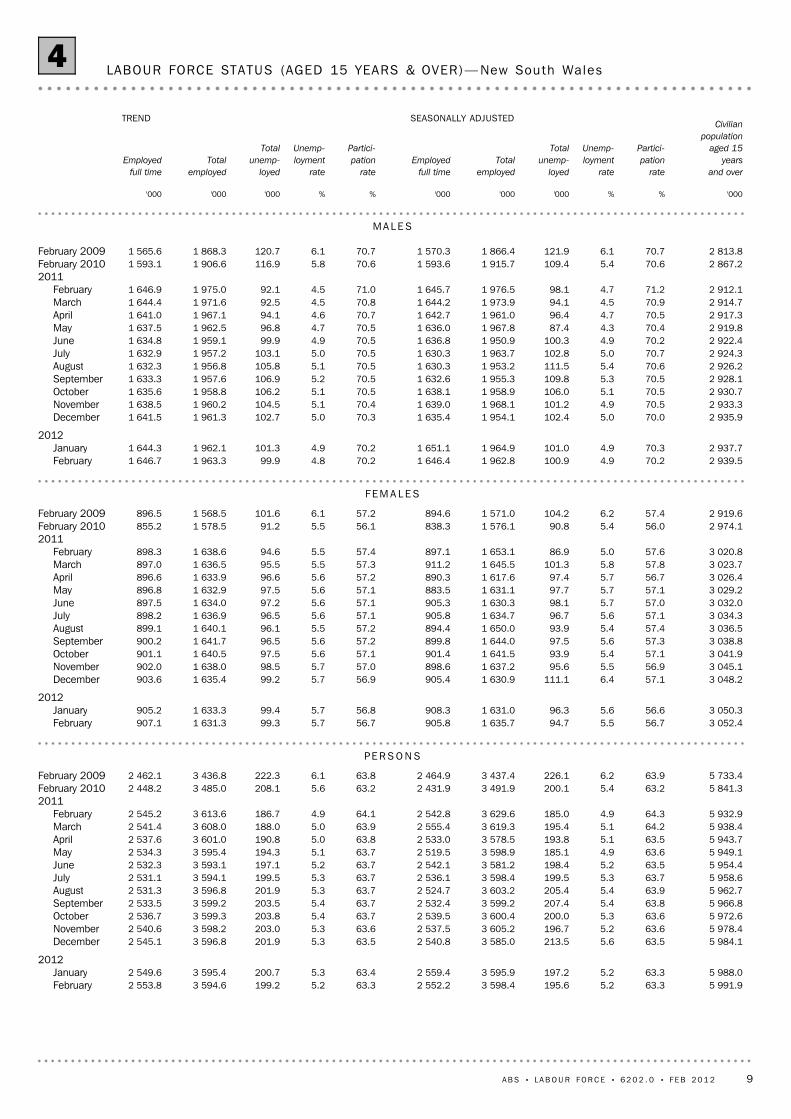
5 991.963.35.2195.63 598.42 552.263.35.2199.23 594.62 553.8February5 988.063.35.2197.23 595.92 559.463.45.3200.73 595.42 549.6January
2012
5 984.163.55.6213.53 585.02 540.863.55.3201.93 596.82 545.1December5 978.463.65.2196.73 605.22 537.563.65.3203.03 598.22 540.6November5 972.663.65.3200.03 600.42 539.563.75.4203.83 599.32 536.7October5 966.863.85.4207.43 599.22 532.463.75.4203.53 599.22 533.5September5 962.763.95.4205.43 603.22 524.763.75.3201.93 596.82 531.3August5 958.663.75.3199.53 598.42 536.163.75.3199.53 594.12 531.1July5 954.463.55.2198.43 581.22 542.163.75.2197.13 593.12 532.3June5 949.163.64.9185.13 598.92 519.563.75.1194.33 595.42 534.3May5 943.763.55.1193.83 578.52 533.063.85.0190.83 601.02 537.6April5 938.464.25.1195.43 619.32 555.463.95.0188.03 608.02 541.4March5 932.964.34.9185.03 629.62 542.864.14.9186.73 613.62 545.2February
20115 841.363.25.4200.13 491.92 431.963.25.6208.13 485.02 448.2February 20105 733.463.96.2226.13 437.42 464.963.86.1222.33 436.82 462.1February 2009
PE R S O N S
3 052.456.75.594.71 635.7905.856.75.799.31 631.3907.1February3 050.356.65.696.31 631.0908.356.85.799.41 633.3905.2January
2012
3 048.257.16.4111.11 630.9905.456.95.799.21 635.4903.6December3 045.156.95.595.61 637.2898.657.05.798.51 638.0902.0November3 041.957.15.493.91 641.5901.457.15.697.51 640.5901.1October3 038.857.35.697.51 644.0899.857.25.696.51 641.7900.2September3 036.557.45.493.91 650.0894.457.25.596.11 640.1899.1August3 034.357.15.696.71 634.7905.857.15.696.51 636.9898.2July3 032.057.05.798.11 630.3905.357.15.697.21 634.0897.5June3 029.257.15.797.71 631.1883.557.15.697.51 632.9896.8May3 026.456.75.797.41 617.6890.357.25.696.61 633.9896.6April3 023.757.85.8101.31 645.5911.257.35.595.51 636.5897.0March3 020.857.65.086.91 653.1897.157.45.594.61 638.6898.3February
20112 974.156.05.490.81 576.1838.356.15.591.21 578.5855.2February 20102 919.657.46.2104.21 571.0894.657.26.1101.61 568.5896.5February 2009
FE M A L E S
2 939.570.24.9100.91 962.81 646.470.24.899.91 963.31 646.7February2 937.770.34.9101.01 964.91 651.170.24.9101.31 962.11 644.3January
2012
2 935.970.05.0102.41 954.11 635.470.35.0102.71 961.31 641.5December2 933.370.54.9101.21 968.11 639.070.45.1104.51 960.21 638.5November2 930.770.55.1106.01 958.91 638.170.55.1106.21 958.81 635.6October2 928.170.55.3109.81 955.31 632.670.55.2106.91 957.61 633.3September2 926.270.65.4111.51 953.21 630.370.55.1105.81 956.81 632.3August2 924.370.75.0102.81 963.71 630.370.55.0103.11 957.21 632.9July2 922.470.24.9100.31 950.91 636.870.54.999.91 959.11 634.8June2 919.870.44.387.41 967.81 636.070.54.796.81 962.51 637.5May2 917.370.54.796.41 961.01 642.770.74.694.11 967.11 641.0April2 914.770.94.594.11 973.91 644.270.84.592.51 971.61 644.4March2 912.171.24.798.11 976.51 645.771.04.592.11 975.01 646.9February
20112 867.270.65.4109.41 915.71 593.670.65.8116.91 906.61 593.1February 20102 813.870.76.1121.91 866.41 570.370.76.1120.71 868.31 565.6February 2009
MA L E S
'000%%'000'000'000%%'000'000'000
Partici-
pation
rate
Unemp-
loyment
rate
Total
unemp-
loyed
Total
employed
Employed
full time
Partici-
pation
rate
Unemp-
loyment
rate
Total
unemp-
loyed
Total
employed
Employed
full time
Civilian
population
aged 15
years
and over
SEASONALLY ADJUSTEDTREND
LABOUR FORCE STATUS (AGED 15 YEARS & OVER)— New South Wales4
A B S • L A B O U R FO R C E • 6 2 0 2 . 0 • F E B 2 0 1 2 9
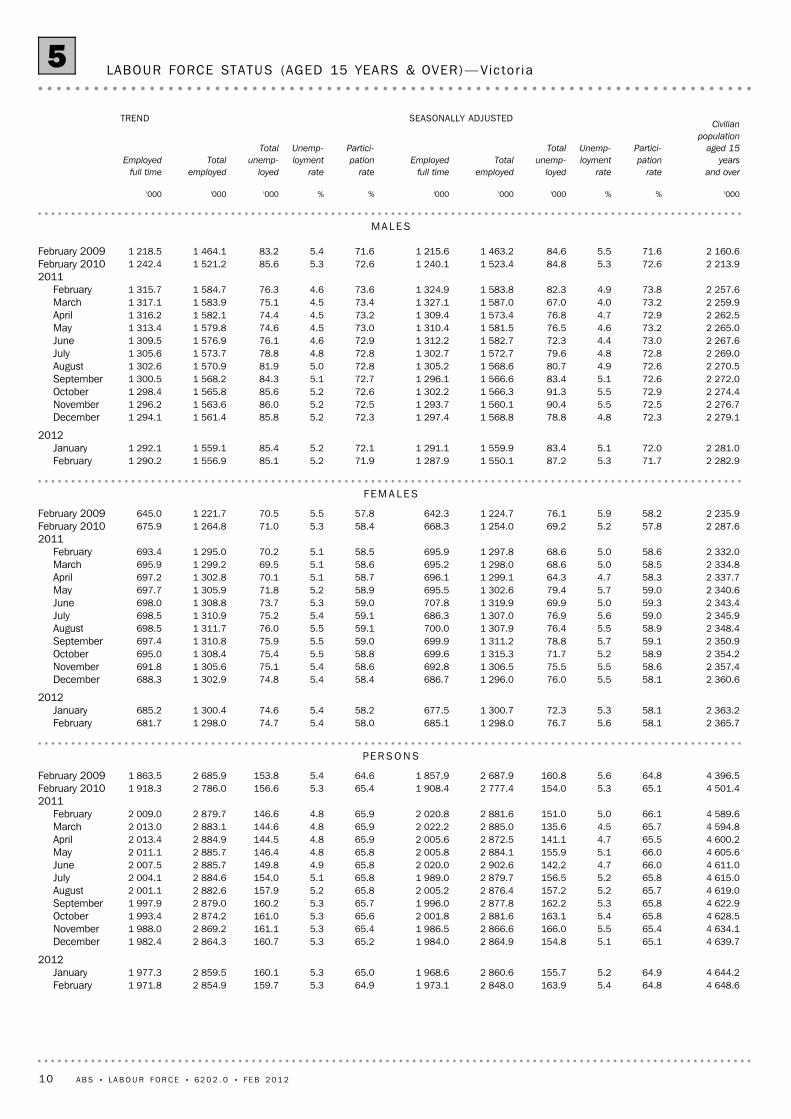
4 648.664.85.4163.92 848.01 973.164.95.3159.72 854.91 971.8February4 644.264.95.2155.72 860.61 968.665.05.3160.12 859.51 977.3January
2012
4 639.765.15.1154.82 864.91 984.065.25.3160.72 864.31 982.4December4 634.165.45.5166.02 866.61 986.565.45.3161.12 869.21 988.0November4 628.565.85.4163.12 881.62 001.865.65.3161.02 874.21 993.4October4 622.965.85.3162.22 877.81 996.065.75.3160.22 879.01 997.9September4 619.065.75.2157.22 876.42 005.265.85.2157.92 882.62 001.1August4 615.065.85.2156.52 879.71 989.065.85.1154.02 884.62 004.1July4 611.066.04.7142.22 902.62 020.065.84.9149.82 885.72 007.5June4 605.666.05.1155.92 884.12 005.865.84.8146.42 885.72 011.1May4 600.265.54.7141.12 872.52 005.665.94.8144.52 884.92 013.4April4 594.865.74.5135.62 885.02 022.265.94.8144.62 883.12 013.0March4 589.666.15.0151.02 881.62 020.865.94.8146.62 879.72 009.0February
20114 501.465.15.3154.02 777.41 908.465.45.3156.62 786.01 918.3February 20104 396.564.85.6160.82 687.91 857.964.65.4153.82 685.91 863.5February 2009
PE R S O N S
2 365.758.15.676.71 298.0685.158.05.474.71 298.0681.7February2 363.258.15.372.31 300.7677.558.25.474.61 300.4685.2January
2012
2 360.658.15.576.01 296.0686.758.45.474.81 302.9688.3December2 357.458.65.575.51 306.5692.858.65.475.11 305.6691.8November2 354.258.95.271.71 315.3699.658.85.575.41 308.4695.0October2 350.959.15.778.81 311.2699.959.05.575.91 310.8697.4September2 348.458.95.576.41 307.9700.059.15.576.01 311.7698.5August2 345.959.05.676.91 307.0686.359.15.475.21 310.9698.5July2 343.459.35.069.91 319.9707.859.05.373.71 308.8698.0June2 340.659.05.779.41 302.6695.558.95.271.81 305.9697.7May2 337.758.34.764.31 299.1696.158.75.170.11 302.8697.2April2 334.858.55.068.61 298.0695.258.65.169.51 299.2695.9March2 332.058.65.068.61 297.8695.958.55.170.21 295.0693.4February
20112 287.657.85.269.21 254.0668.358.45.371.01 264.8675.9February 20102 235.958.25.976.11 224.7642.357.85.570.51 221.7645.0February 2009
FE M A L E S
2 282.971.75.387.21 550.11 287.971.95.285.11 556.91 290.2February2 281.072.05.183.41 559.91 291.172.15.285.41 559.11 292.1January
2012
2 279.172.34.878.81 568.81 297.472.35.285.81 561.41 294.1December2 276.772.55.590.41 560.11 293.772.55.286.01 563.61 296.2November2 274.472.95.591.31 566.31 302.272.65.285.61 565.81 298.4October2 272.072.65.183.41 566.61 296.172.75.184.31 568.21 300.5September2 270.572.64.980.71 568.61 305.272.85.081.91 570.91 302.6August2 269.072.84.879.61 572.71 302.772.84.878.81 573.71 305.6July2 267.673.04.472.31 582.71 312.272.94.676.11 576.91 309.5June2 265.073.24.676.51 581.51 310.473.04.574.61 579.81 313.4May2 262.572.94.776.81 573.41 309.473.24.574.41 582.11 316.2April2 259.973.24.067.01 587.01 327.173.44.575.11 583.91 317.1March2 257.673.84.982.31 583.81 324.973.64.676.31 584.71 315.7February
20112 213.972.65.384.81 523.41 240.172.65.385.61 521.21 242.4February 20102 160.671.65.584.61 463.21 215.671.65.483.21 464.11 218.5February 2009
MA L E S
'000%%'000'000'000%%'000'000'000
Partici-
pation
rate
Unemp-
loyment
rate
Total
unemp-
loyed
Total
employed
Employed
full time
Partici-
pation
rate
Unemp-
loyment
rate
Total
unemp-
loyed
Total
employed
Employed
full time
Civilian
population
aged 15
years
and over
SEASONALLY ADJUSTEDTREND
LABOUR FORCE STATUS (AGED 15 YEARS & OVER)— Victo r ia5
10 A B S • L A B O U R FO R C E • 6 2 0 2 . 0 • F E B 2 0 1 2
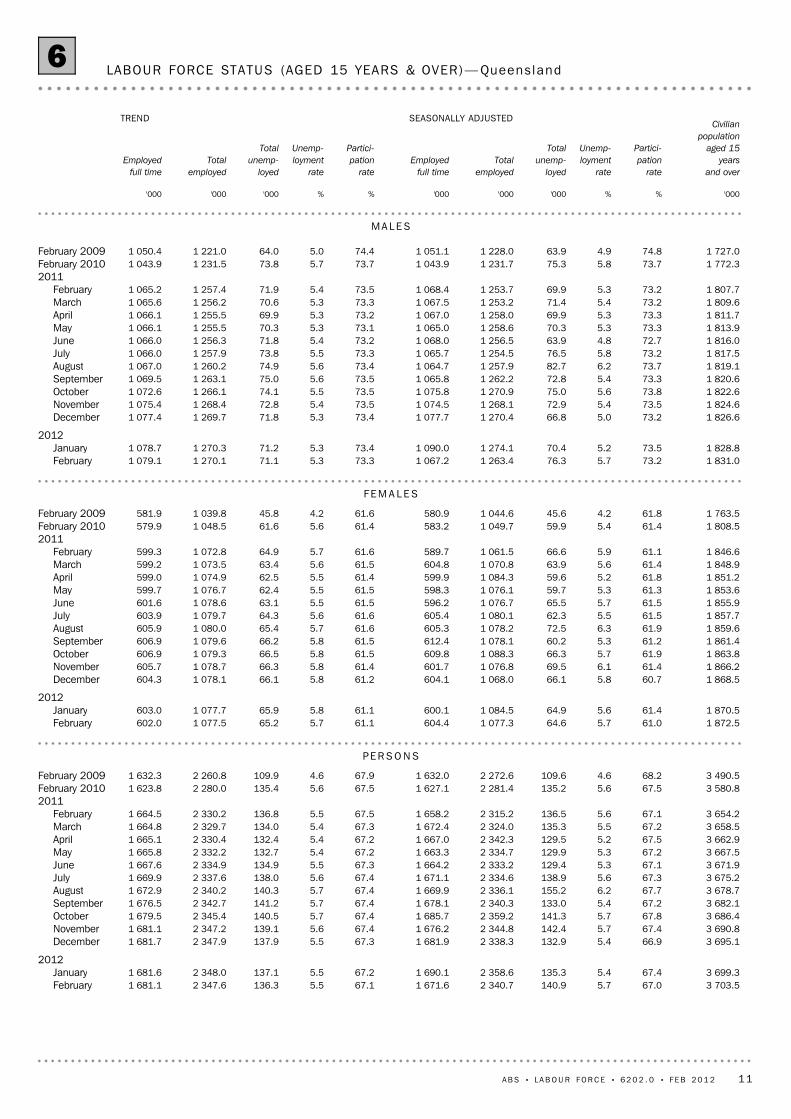
3 703.567.05.7140.92 340.71 671.667.15.5136.32 347.61 681.1February3 699.367.45.4135.32 358.61 690.167.25.5137.12 348.01 681.6January
2012
3 695.166.95.4132.92 338.31 681.967.35.5137.92 347.91 681.7December3 690.867.45.7142.42 344.81 676.267.45.6139.12 347.21 681.1November3 686.467.85.7141.32 359.21 685.767.45.7140.52 345.41 679.5October3 682.167.25.4133.02 340.31 678.167.45.7141.22 342.71 676.5September3 678.767.76.2155.22 336.11 669.967.45.7140.32 340.21 672.9August3 675.267.35.6138.92 334.61 671.167.45.6138.02 337.61 669.9July3 671.967.15.3129.42 333.21 664.267.35.5134.92 334.91 667.6June3 667.567.25.3129.92 334.71 663.367.25.4132.72 332.21 665.8May3 662.967.55.2129.52 342.31 667.067.25.4132.42 330.41 665.1April3 658.567.25.5135.32 324.01 672.467.35.4134.02 329.71 664.8March3 654.267.15.6136.52 315.21 658.267.55.5136.82 330.21 664.5February
20113 580.867.55.6135.22 281.41 627.167.55.6135.42 280.01 623.8February 20103 490.568.24.6109.62 272.61 632.067.94.6109.92 260.81 632.3February 2009
PE R S O N S
1 872.561.05.764.61 077.3604.461.15.765.21 077.5602.0February1 870.561.45.664.91 084.5600.161.15.865.91 077.7603.0January
2012
1 868.560.75.866.11 068.0604.161.25.866.11 078.1604.3December1 866.261.46.169.51 076.8601.761.45.866.31 078.7605.7November1 863.861.95.766.31 088.3609.861.55.866.51 079.3606.9October1 861.461.25.360.21 078.1612.461.55.866.21 079.6606.9September1 859.661.96.372.51 078.2605.361.65.765.41 080.0605.9August1 857.761.55.562.31 080.1605.461.65.664.31 079.7603.9July1 855.961.55.765.51 076.7596.261.55.563.11 078.6601.6June1 853.661.35.359.71 076.1598.361.55.562.41 076.7599.7May1 851.261.85.259.61 084.3599.961.45.562.51 074.9599.0April1 848.961.45.663.91 070.8604.861.55.663.41 073.5599.2March1 846.661.15.966.61 061.5589.761.65.764.91 072.8599.3February
20111 808.561.45.459.91 049.7583.261.45.661.61 048.5579.9February 20101 763.561.84.245.61 044.6580.961.64.245.81 039.8581.9February 2009
FE M A L E S
1 831.073.25.776.31 263.41 067.273.35.371.11 270.11 079.1February1 828.873.55.270.41 274.11 090.073.45.371.21 270.31 078.7January
2012
1 826.673.25.066.81 270.41 077.773.45.371.81 269.71 077.4December1 824.673.55.472.91 268.11 074.573.55.472.81 268.41 075.4November1 822.673.85.675.01 270.91 075.873.55.574.11 266.11 072.6October1 820.673.35.472.81 262.21 065.873.55.675.01 263.11 069.5September1 819.173.76.282.71 257.91 064.773.45.674.91 260.21 067.0August1 817.573.25.876.51 254.51 065.773.35.573.81 257.91 066.0July1 816.072.74.863.91 256.51 068.073.25.471.81 256.31 066.0June1 813.973.35.370.31 258.61 065.073.15.370.31 255.51 066.1May1 811.773.35.369.91 258.01 067.073.25.369.91 255.51 066.1April1 809.673.25.471.41 253.21 067.573.35.370.61 256.21 065.6March1 807.773.25.369.91 253.71 068.473.55.471.91 257.41 065.2February
20111 772.373.75.875.31 231.71 043.973.75.773.81 231.51 043.9February 20101 727.074.84.963.91 228.01 051.174.45.064.01 221.01 050.4February 2009
MA L E S
'000%%'000'000'000%%'000'000'000
Partici-
pation
rate
Unemp-
loyment
rate
Total
unemp-
loyed
Total
employed
Employed
full time
Partici-
pation
rate
Unemp-
loyment
rate
Total
unemp-
loyed
Total
employed
Employed
full time
Civilian
population
aged 15
years
and over
SEASONALLY ADJUSTEDTREND
LABOUR FORCE STATUS (AGED 15 YEARS & OVER)— Queens land6
A B S • L A B O U R FO R C E • 6 2 0 2 . 0 • F E B 2 0 1 2 11
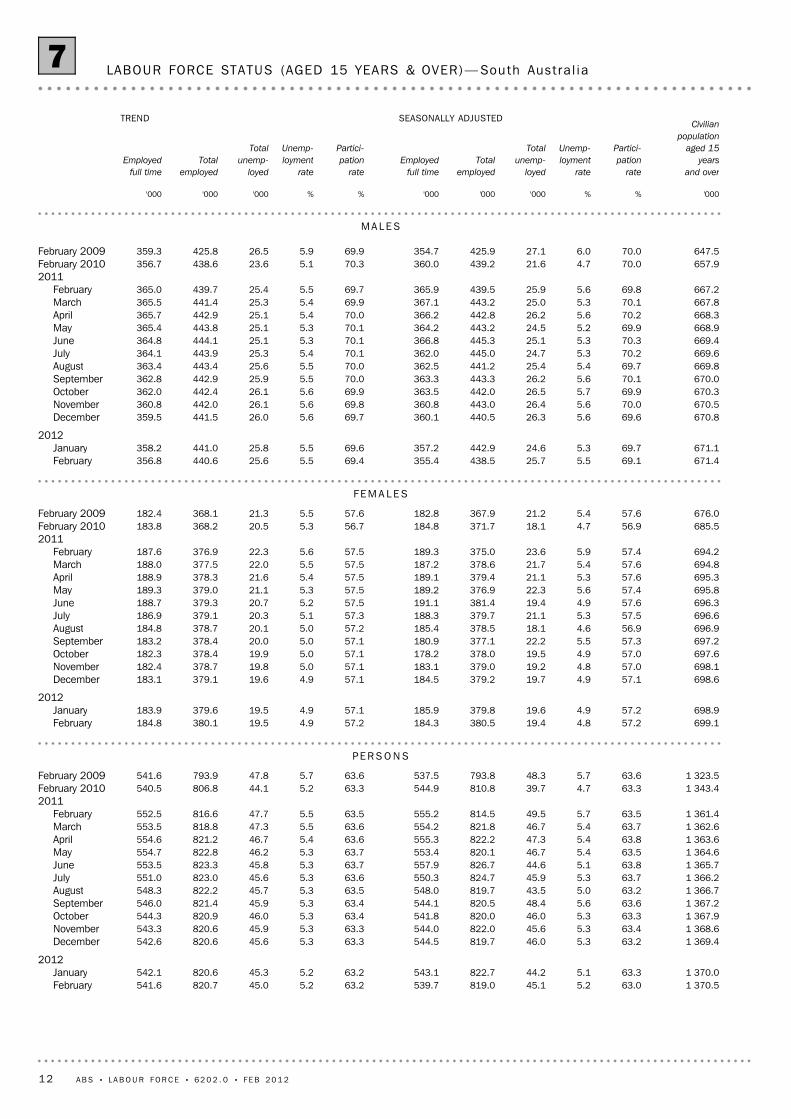
1 370.563.05.245.1819.0539.763.25.245.0820.7541.6February1 370.063.35.144.2822.7543.163.25.245.3820.6542.1January
2012
1 369.463.25.346.0819.7544.563.35.345.6820.6542.6December1 368.663.45.345.6822.0544.063.35.345.9820.6543.3November1 367.963.35.346.0820.0541.863.45.346.0820.9544.3October1 367.263.65.648.4820.5544.163.45.345.9821.4546.0September1 366.763.25.043.5819.7548.063.55.345.7822.2548.3August1 366.263.75.345.9824.7550.363.65.345.6823.0551.0July1 365.763.85.144.6826.7557.963.75.345.8823.3553.5June1 364.663.55.446.7820.1553.463.75.346.2822.8554.7May1 363.663.85.447.3822.2555.363.65.446.7821.2554.6April1 362.663.75.446.7821.8554.263.65.547.3818.8553.5March1 361.463.55.749.5814.5555.263.55.547.7816.6552.5February
20111 343.463.34.739.7810.8544.963.35.244.1806.8540.5February 20101 323.563.65.748.3793.8537.563.65.747.8793.9541.6February 2009
PE R S O N S
699.157.24.819.4380.5184.357.24.919.5380.1184.8February698.957.24.919.6379.8185.957.14.919.5379.6183.9January
2012
698.657.14.919.7379.2184.557.14.919.6379.1183.1December698.157.04.819.2379.0183.157.15.019.8378.7182.4November697.657.04.919.5378.0178.257.15.019.9378.4182.3October697.257.35.522.2377.1180.957.15.020.0378.4183.2September696.956.94.618.1378.5185.457.25.020.1378.7184.8August696.657.55.321.1379.7188.357.35.120.3379.1186.9July696.357.64.919.4381.4191.157.55.220.7379.3188.7June695.857.45.622.3376.9189.257.55.321.1379.0189.3May695.357.65.321.1379.4189.157.55.421.6378.3188.9April694.857.65.421.7378.6187.257.55.522.0377.5188.0March694.257.45.923.6375.0189.357.55.622.3376.9187.6February
2011685.556.94.718.1371.7184.856.75.320.5368.2183.8February 2010676.057.65.421.2367.9182.857.65.521.3368.1182.4February 2009
FE M A L E S
671.469.15.525.7438.5355.469.45.525.6440.6356.8February671.169.75.324.6442.9357.269.65.525.8441.0358.2January
2012
670.869.65.626.3440.5360.169.75.626.0441.5359.5December670.570.05.626.4443.0360.869.85.626.1442.0360.8November670.369.95.726.5442.0363.569.95.626.1442.4362.0October670.070.15.626.2443.3363.370.05.525.9442.9362.8September669.869.75.425.4441.2362.570.05.525.6443.4363.4August669.670.25.324.7445.0362.070.15.425.3443.9364.1July669.470.35.325.1445.3366.870.15.325.1444.1364.8June668.969.95.224.5443.2364.270.15.325.1443.8365.4May668.370.25.626.2442.8366.270.05.425.1442.9365.7April667.870.15.325.0443.2367.169.95.425.3441.4365.5March667.269.85.625.9439.5365.969.75.525.4439.7365.0February
2011657.970.04.721.6439.2360.070.35.123.6438.6356.7February 2010647.570.06.027.1425.9354.769.95.926.5425.8359.3February 2009
MA L E S
'000%%'000'000'000%%'000'000'000
Partici-
pation
rate
Unemp-
loyment
rate
Total
unemp-
loyed
Total
employed
Employed
full time
Partici-
pation
rate
Unemp-
loyment
rate
Total
unemp-
loyed
Total
employed
Employed
full time
Civilian
population
aged 15
years
and over
SEASONALLY ADJUSTEDTREND
LABOUR FORCE STATUS (AGED 15 YEARS & OVER)— South Aust ra l ia7
12 A B S • L A B O U R FO R C E • 6 2 0 2 . 0 • F E B 2 0 1 2
1 918.568.84.052.11 266.9912.268.64.153.41 261.3902.5February1 913.568.94.154.31 263.5895.968.54.154.11 255.8897.6January
2012
1 908.568.04.254.71 243.4891.668.34.254.51 250.2892.9December1 904.768.34.355.51 245.4886.468.24.254.81 244.8888.5November1 900.867.84.254.51 233.6880.168.24.254.91 240.7885.2October1 896.968.44.254.91 242.3890.468.24.254.81 238.5883.2September1 893.968.24.456.31 235.0876.568.34.254.51 238.4882.7August1 891.068.34.051.61 239.7885.168.44.254.11 238.7883.1July1 888.068.64.254.31 241.1885.468.44.253.91 237.7883.1June1 885.368.64.355.01 238.4880.268.44.254.01 234.8882.2May1 882.768.24.153.01 231.8881.268.34.254.21 231.0880.6April1 880.068.24.355.11 227.7884.868.24.354.61 227.3878.5March1 878.067.54.354.31 213.5870.768.24.355.21 224.8876.0February
20111 838.568.75.266.01 196.8841.468.34.961.91 193.7840.7February 20101 785.869.34.454.41 183.8842.869.34.151.21 186.6850.9February 2009
PE R S O N S
949.160.84.324.6552.7296.460.94.224.3552.6293.9February946.861.14.123.5555.1291.660.84.224.2551.1292.6January
2012
944.460.44.324.7545.8291.660.74.224.1549.6291.5December942.660.84.224.0549.3289.960.74.224.0548.1290.6November940.760.54.223.7545.1286.560.64.223.9546.7289.8October938.861.04.224.1548.5295.460.74.223.7545.8289.1September937.360.24.123.4541.3283.660.74.123.6545.7288.5August935.860.94.224.1546.2290.460.84.123.6545.4288.0July934.460.84.022.7545.6287.260.84.223.9544.2287.3June933.060.94.324.7543.7283.560.74.324.4541.7286.0May931.860.94.424.9542.4286.760.54.425.0538.5284.4April930.460.44.726.3536.1285.860.34.625.7535.3282.7March929.458.94.625.5522.0279.860.24.726.4532.8281.2February
2011910.460.65.329.1522.8270.660.25.329.1518.6271.0February 2010886.261.94.926.6521.7276.861.54.423.8520.7278.3February 2009
FE M A L E S
969.476.53.727.5714.2615.776.23.929.1708.7608.6February966.776.54.230.9708.4604.376.04.129.9704.7605.0January
2012
964.175.54.130.0697.6599.975.84.230.4700.5601.3December962.175.64.331.5696.0596.575.64.230.8696.7598.0November960.174.94.330.8688.5593.675.54.331.1693.9595.4October958.175.64.330.9693.8595.075.54.331.1692.7594.1September956.676.04.533.0693.7592.975.64.330.9692.7594.2August955.175.53.827.5693.5594.775.84.230.5693.3595.1July953.676.24.331.5695.5598.275.94.230.1693.5595.8June952.376.14.230.4694.7596.775.94.129.6693.1596.2May950.975.53.928.1689.5594.575.94.029.2692.5596.2April949.675.94.028.8691.6599.075.94.028.9692.1595.7March948.675.94.028.9691.5590.976.04.028.8692.0594.8February
2011928.176.65.236.9674.0570.776.34.632.9675.1569.7February 2010899.676.74.027.8662.1566.077.13.927.4666.0572.6February 2009
MA L E S
'000%%'000'000'000%%'000'000'000
Partici-
pation
rate
Unemp-
loyment
rate
Total
unemp-
loyed
Total
employed
Employed
full time
Partici-
pation
rate
Unemp-
loyment
rate
Total
unemp-
loyed
Total
employed
Employed
full time
Civilian
population
aged 15
years and
over
SEASONALLY ADJUSTEDTREND
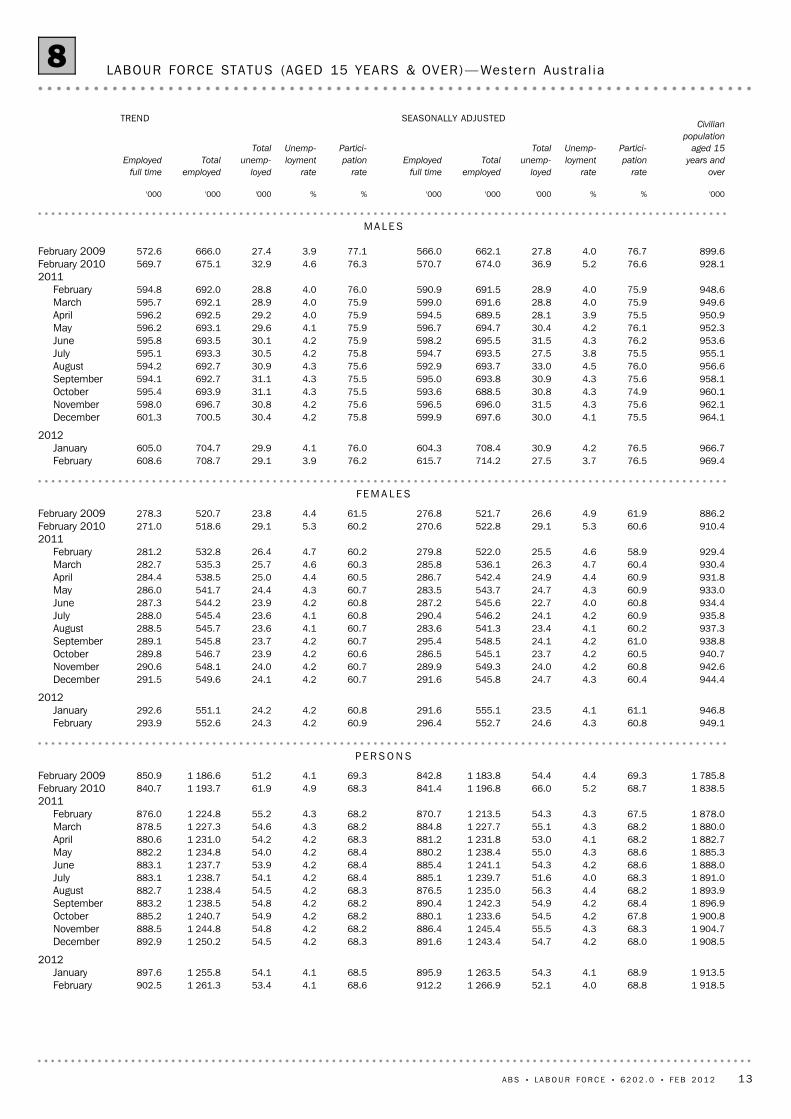
LABOUR FORCE STATUS (AGED 15 YEARS & OVER)— Western Aust ra l ia8
A B S • L A B O U R FO R C E • 6 2 0 2 . 0 • F E B 2 0 1 2 13
415.361.27.017.8236.6152.161.17.017.8235.8151.3February415.360.57.117.7233.4149.360.96.716.9236.1151.8January
2012
415.261.16.416.1237.7153.560.86.315.9236.5152.5December414.960.96.115.5237.1152.860.75.914.9236.9153.2November414.760.65.213.1238.3154.560.55.513.8237.2153.8October414.460.04.811.9236.6155.360.45.213.1237.2154.4September414.160.45.213.0237.0153.760.35.112.8237.0154.7August413.960.55.112.8237.6154.560.45.212.9237.0155.0July413.660.35.413.6235.8156.160.55.313.3237.1155.2June413.460.75.714.4236.6154.660.85.513.7237.6155.4May413.261.25.413.6239.3156.361.05.614.1238.1155.6April413.061.35.614.1239.1155.461.25.714.3238.5155.8March412.761.25.614.1238.7156.061.35.714.3238.6155.8February
2011408.761.66.416.1235.7153.660.95.714.3234.6154.4February 2010404.162.94.311.0243.1164.161.84.812.0237.8161.6February 2009
PE R S O N S
212.555.86.57.7110.850.855.96.37.5111.250.9February212.555.86.17.2111.350.255.86.17.2111.351.2January
2012
212.455.95.76.8112.051.955.75.76.8111.451.6December212.355.45.76.7111.051.755.55.46.3111.651.9November212.155.65.16.0112.053.355.45.05.9111.652.1October212.054.94.14.8111.552.855.34.85.7111.652.3September211.955.44.85.7111.650.755.34.85.7111.552.3August211.755.74.75.6112.352.055.35.05.8111.352.4July211.655.15.86.7110.053.455.45.26.1111.252.5June211.555.45.56.5110.852.855.65.46.4111.252.6May211.455.95.56.5111.652.455.85.66.7111.352.7April211.256.25.66.7112.052.956.05.86.8111.552.8March211.156.05.96.9111.352.756.15.86.9111.652.7February
2011209.157.06.17.2112.052.156.15.26.1111.152.8February 2010206.956.74.55.3112.157.355.55.15.8109.155.2February 2009
FE M A L E S
202.867.07.410.1125.8101.366.57.610.3124.6100.4February202.865.47.910.5122.299.266.47.39.8124.8100.6January
2012
202.866.66.99.3125.7101.566.26.89.2125.1100.9December202.766.66.58.8126.1101.166.16.48.5125.4101.3November202.565.95.37.1126.3101.165.95.97.9125.5101.7October202.465.35.47.1125.1102.665.75.67.4125.6102.1September202.365.65.57.4125.4103.065.65.47.1125.6102.4August202.265.65.57.2125.3102.565.75.37.1125.7102.6July202.065.75.16.8125.9102.765.95.47.2125.9102.7June201.966.25.97.9125.8101.866.25.57.3126.4102.8May201.866.85.37.2127.7103.966.55.57.4126.8102.8April201.766.75.57.4127.1102.666.75.67.5127.0103.0March201.666.75.37.2127.4103.266.75.67.5127.0103.1February
2011199.766.46.78.9123.7101.466.06.28.1123.5101.6February 2010197.269.44.25.7131.1106.868.44.66.2128.7106.3February 2009
MA L E S
'000%%'000'000'000%%'000'000'000
Partici-
pation
rate
Unemp-
loyment
rate
Total
unemp-
loyed
Total
employed
Employed
full time
Partici-
pation
rate
Unemp-
loyment
rate
Total
unemp-
loyed
Total
employed
Employed
full time
Civilian
population
aged 15
years
and over
SEASONALLY ADJUSTEDTREND
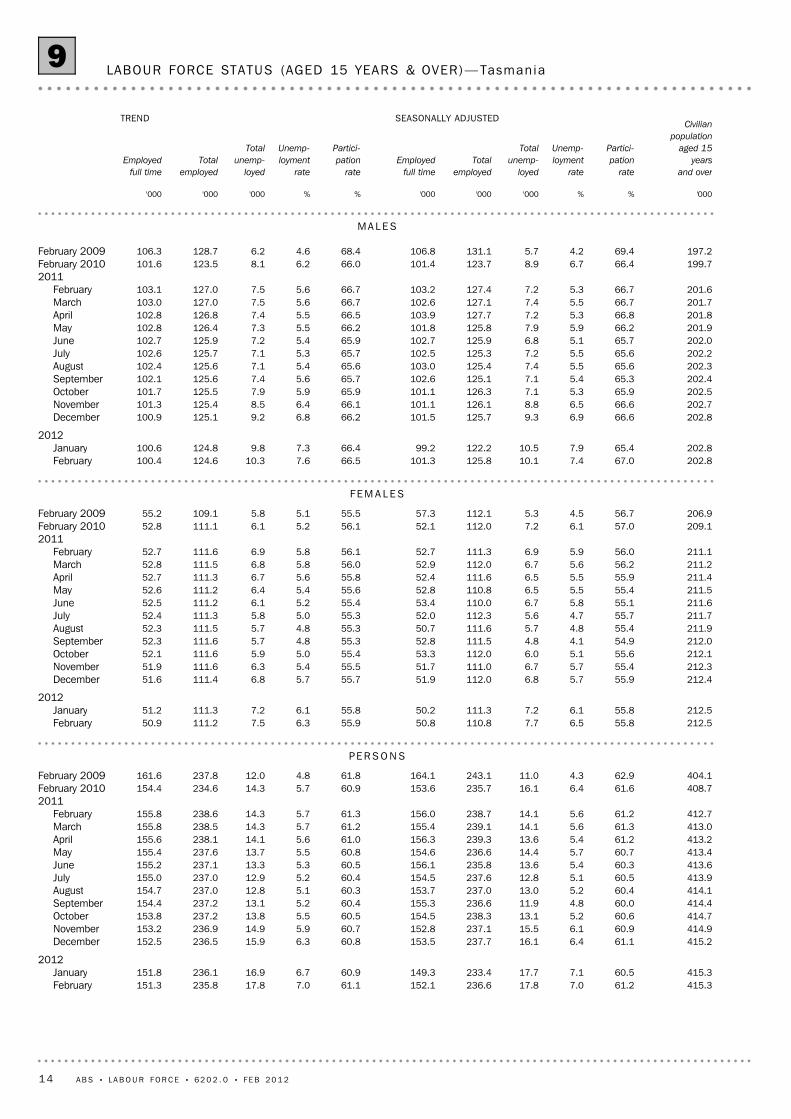
LABOUR FORCE STATUS (AGED 15 YEARS & OVER)— Tasman ia9
14 A B S • L A B O U R FO R C E • 6 2 0 2 . 0 • F E B 2 0 1 2
173.575.04.35.6124.6101.4February173.674.94.25.5124.5101.3January
2012
173.874.74.25.5124.2101.1December173.774.44.25.4123.8100.7November173.774.04.25.4123.2100.2October173.773.44.15.3122.399.4September173.872.74.15.2121.298.3August173.972.14.05.0120.397.4July174.071.83.94.8120.197.0June173.872.03.64.5120.697.1May173.672.33.34.1121.597.6April173.472.72.93.6122.498.2March173.272.82.53.2122.898.5February
2011169.673.13.34.1120.096.5February 2010165.174.24.04.9117.695.5February 2009
PE R S O N S
85.671.14.22.558.342.8February85.771.04.22.658.342.8January
2012
85.770.94.32.658.142.7December85.770.64.32.658.042.5November85.770.24.22.557.742.3October85.869.54.12.457.241.9September85.868.74.02.356.641.5August85.968.13.92.356.241.1July86.068.03.82.256.240.8June85.968.23.72.156.540.7May85.868.63.52.056.840.6April85.768.73.21.957.040.6March85.668.72.91.757.040.5February
201183.867.83.52.054.838.9February 201081.569.43.52.054.639.1February 2009
FE M A L E S
87.878.84.43.066.358.6February88.078.64.22.966.258.5January
2012
88.178.34.22.966.058.4December88.078.04.12.865.858.2November88.077.74.12.865.657.9October87.977.34.22.965.257.5September88.076.74.22.964.656.9August88.076.04.22.864.156.4July88.075.63.92.663.956.2June87.975.73.62.464.156.4May87.876.03.12.164.757.0April87.776.52.61.765.357.6March87.576.82.21.565.858.0February
201185.978.33.12.165.257.6February 201083.578.84.42.963.056.4February 2009
MA L E S
'000%%'000'000'000
Participation
rate
Unemployment
rate
Total
unemployed
Total
employed
Employed
full time
Civilian
population
aged 15
years
and over
TREND
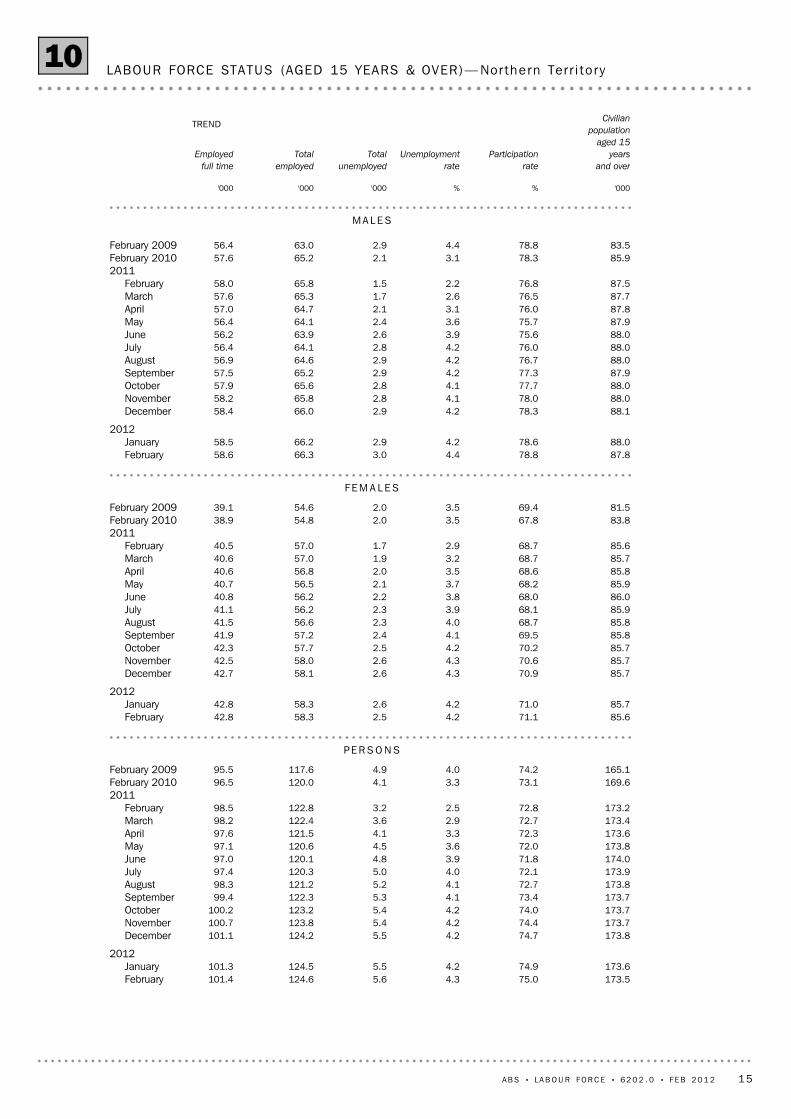
LABOUR FORCE STATUS (AGED 15 YEARS & OVER)— Northern Ter r i to ry10
A B S • L A B O U R FO R C E • 6 2 0 2 . 0 • F E B 2 0 1 2 15
296.572.33.67.7206.6152.6February296.172.33.67.8206.2152.5January
2012
295.672.23.77.9205.7152.5December295.272.23.88.0205.1152.7November294.772.23.88.1204.5153.2October294.372.23.98.3204.1153.6September293.672.34.08.4203.9153.9August293.072.54.08.5203.9154.1July292.372.73.98.4204.1154.0June292.072.83.98.2204.4153.9May291.672.93.77.9204.6153.9April291.373.03.67.7205.0154.0March290.973.13.57.5205.2153.9February
2011285.873.23.67.5201.8150.0February 2010280.472.42.75.5197.5149.2February 2009
PE R S O N S
151.368.23.33.499.763.7February151.168.23.43.599.563.9January
2012
150.968.13.53.699.164.0December150.668.03.63.698.764.1November150.367.83.63.798.364.4October150.167.73.73.797.964.5September149.867.83.73.797.764.4August149.467.93.63.797.864.0July149.168.13.63.797.963.5June149.068.23.53.698.063.0May148.868.33.53.598.162.6April148.768.43.43.498.262.6March148.568.53.33.498.462.7February
2011146.169.12.93.098.062.4February 2010143.668.02.62.595.161.2February 2009
FE M A L E S
145.276.63.84.2106.988.9February145.076.63.94.3106.788.6January
2012
144.776.63.94.3106.588.6December144.676.64.04.4106.488.6November144.476.74.04.5106.388.8October144.276.84.14.6106.289.1September143.977.04.24.7106.189.5August143.577.34.34.8106.290.0July143.277.54.34.7106.290.5June143.077.64.14.6106.491.0May142.877.74.04.4106.691.3April142.677.93.84.2106.891.4March142.477.93.74.1106.991.2February
2011139.877.64.24.5103.887.6February 2010136.877.02.93.0102.388.0February 2009
MA L E S
'000%%'000'000'000
Participation
rate
Unemployment
rate
Total
unemployed
Total
employed
Employed
full time
Civilian
population
aged 15
years
and over
TREND
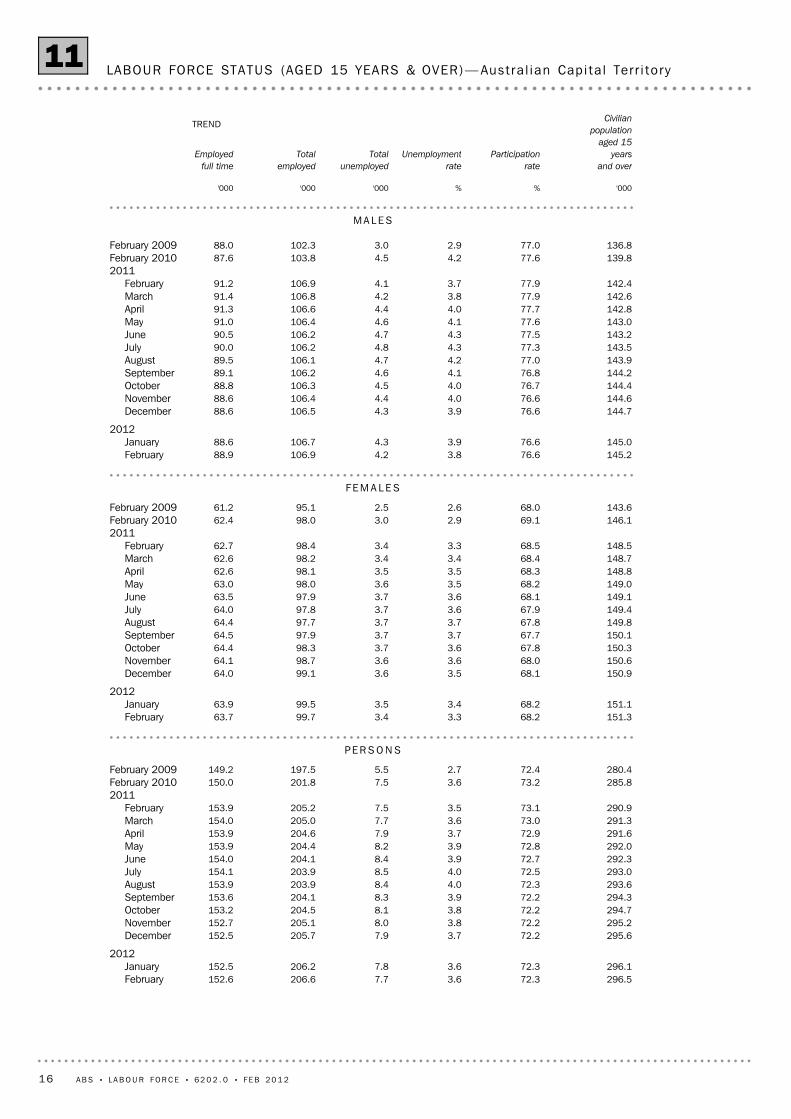
LABOUR FORCE STATUS (AGED 15 YEARS & OVER)— Aust ra l ian Cap i ta l Ter r i to ry11
16 A B S • L A B O U R FO R C E • 6 2 0 2 . 0 • F E B 2 0 1 2
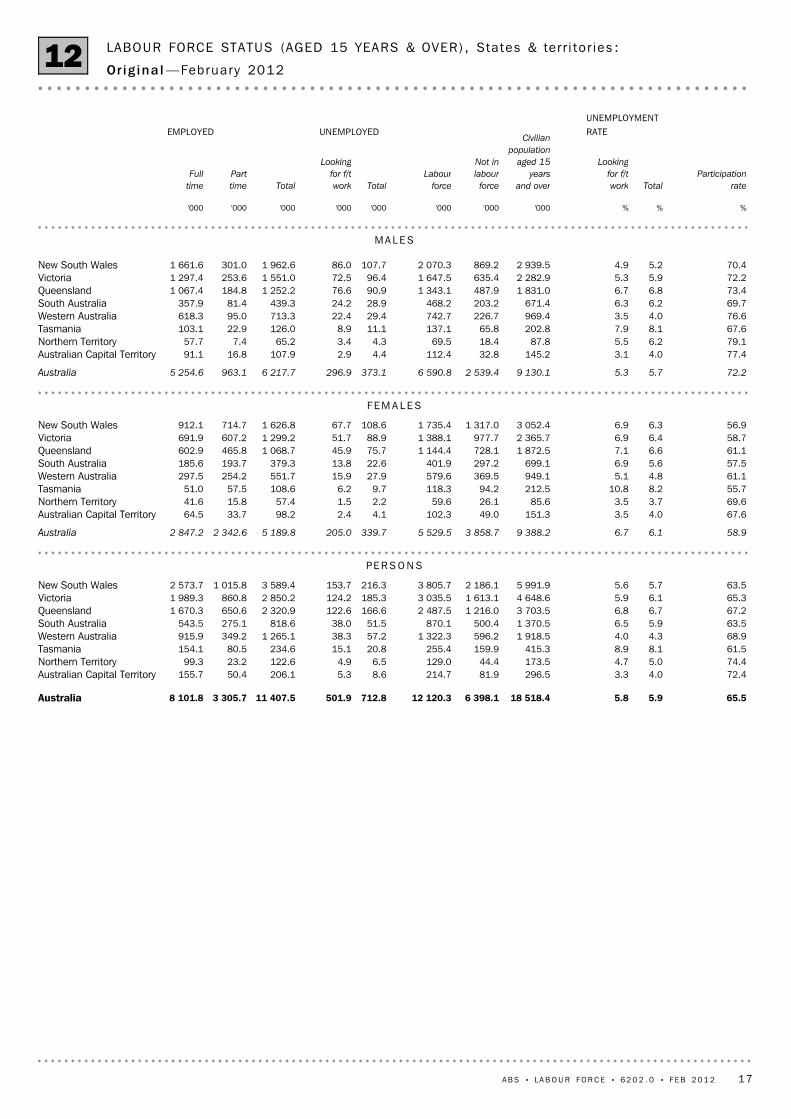
65.55.95.818 518.46 398.112 120.3712.8501.911 407.53 305.78 101.8Australia
72.44.03.3296.581.9214.78.65.3206.150.4155.7Australian Capital Territory74.45.04.7173.544.4129.06.54.9122.623.299.3Northern Territory61.58.18.9415.3159.9255.420.815.1234.680.5154.1Tasmania68.94.34.01 918.5596.21 322.357.238.31 265.1349.2915.9Western Australia63.55.96.51 370.5500.4870.151.538.0818.6275.1543.5South Australia67.26.76.83 703.51 216.02 487.5166.6122.62 320.9650.61 670.3Queensland65.36.15.94 648.61 613.13 035.5185.3124.22 850.2860.81 989.3Victoria63.55.75.65 991.92 186.13 805.7216.3153.73 589.41 015.82 573.7New South Wales
PE R S O N S
58.96.16.79 388.23 858.75 529.5339.7205.05 189.82 342.62 847.2Australia
67.64.03.5151.349.0102.34.12.498.233.764.5Australian Capital Territory69.63.73.585.626.159.62.21.557.415.841.6Northern Territory55.78.210.8212.594.2118.39.76.2108.657.551.0Tasmania61.14.85.1949.1369.5579.627.915.9551.7254.2297.5Western Australia57.55.66.9699.1297.2401.922.613.8379.3193.7185.6South Australia61.16.67.11 872.5728.11 144.475.745.91 068.7465.8602.9Queensland58.76.46.92 365.7977.71 388.188.951.71 299.2607.2691.9Victoria56.96.36.93 052.41 317.01 735.4108.667.71 626.8714.7912.1New South Wales
FE M A L E S
72.25.75.39 130.12 539.46 590.8373.1296.96 217.7963.15 254.6Australia
77.44.03.1145.232.8112.44.42.9107.916.891.1Australian Capital Territory79.16.25.587.818.469.54.33.465.27.457.7Northern Territory67.68.17.9202.865.8137.111.18.9126.022.9103.1Tasmania76.64.03.5969.4226.7742.729.422.4713.395.0618.3Western Australia69.76.26.3671.4203.2468.228.924.2439.381.4357.9South Australia73.46.86.71 831.0487.91 343.190.976.61 252.2184.81 067.4Queensland72.25.95.32 282.9635.41 647.596.472.51 551.0253.61 297.4Victoria70.45.24.92 939.5869.22 070.3107.786.01 962.6301.01 661.6New South Wales
MA L E S
%%%'000'000'000'000'000'000'000'000
Total
Looking
for f/t
workTotal
Looking
for f/t
workTotal
Part
time
Full
time
Participation
rate
UNEMPLOYMENTRATE
Civilian
population
aged 15
years
and over
Not in
labour
force
Labour
force
UNEMPLOYEDEMPLOYED
LABOUR FORCE STATUS (AGED 15 YEARS & OVER) , States & ter r i to r ies :
Or ig ina l —February 201212
A B S • L A B O U R FO R C E • 6 2 0 2 . 0 • F E B 2 0 1 2 17
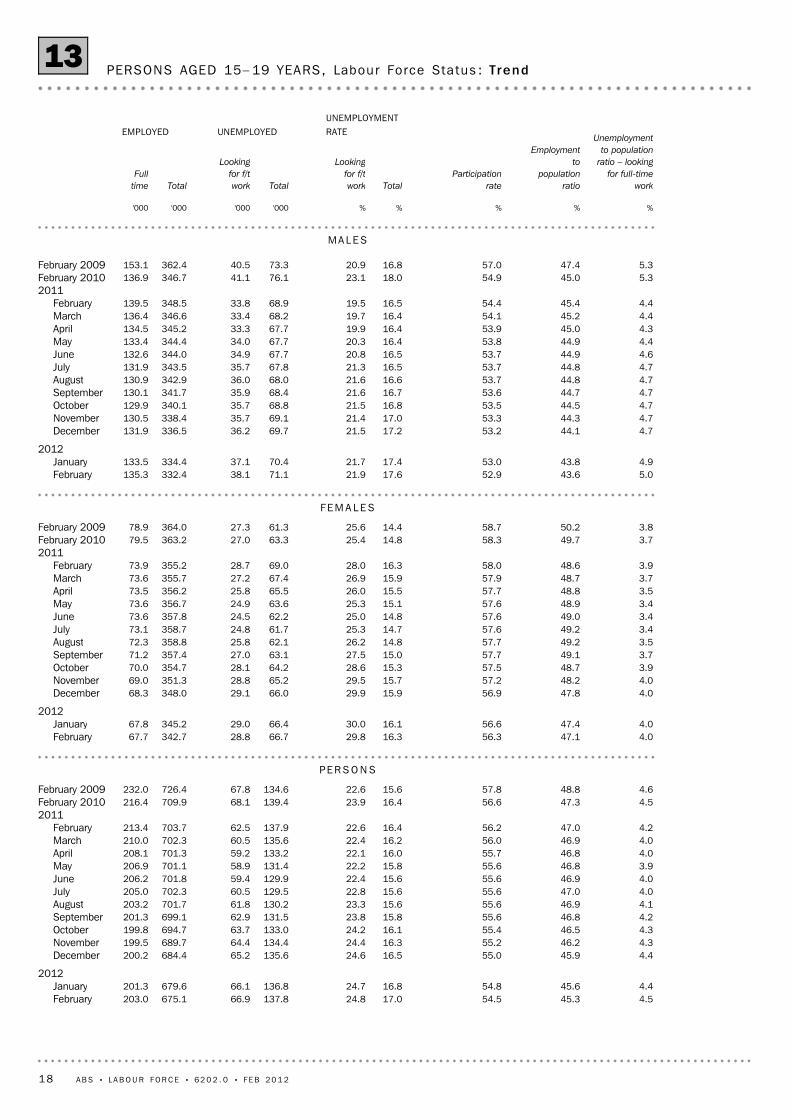
4.545.354.517.024.8137.866.9675.1203.0February4.445.654.816.824.7136.866.1679.6201.3January
2012
4.445.955.016.524.6135.665.2684.4200.2December4.346.255.216.324.4134.464.4689.7199.5November4.346.555.416.124.2133.063.7694.7199.8October4.246.855.615.823.8131.562.9699.1201.3September4.146.955.615.623.3130.261.8701.7203.2August4.047.055.615.622.8129.560.5702.3205.0July4.046.955.615.622.4129.959.4701.8206.2June3.946.855.615.822.2131.458.9701.1206.9May4.046.855.716.022.1133.259.2701.3208.1April4.046.956.016.222.4135.660.5702.3210.0March4.247.056.216.422.6137.962.5703.7213.4February
20114.547.356.616.423.9139.468.1709.9216.4February 20104.648.857.815.622.6134.667.8726.4232.0February 2009
PE R S O N S
4.047.156.316.329.866.728.8342.767.7February4.047.456.616.130.066.429.0345.267.8January
2012
4.047.856.915.929.966.029.1348.068.3December4.048.257.215.729.565.228.8351.369.0November3.948.757.515.328.664.228.1354.770.0October3.749.157.715.027.563.127.0357.471.2September3.549.257.714.826.262.125.8358.872.3August3.449.257.614.725.361.724.8358.773.1July3.449.057.614.825.062.224.5357.873.6June3.448.957.615.125.363.624.9356.773.6May3.548.857.715.526.065.525.8356.273.5April3.748.757.915.926.967.427.2355.773.6March3.948.658.016.328.069.028.7355.273.9February
20113.749.758.314.825.463.327.0363.279.5February 20103.850.258.714.425.661.327.3364.078.9February 2009
FE M A L E S
5.043.652.917.621.971.138.1332.4135.3February4.943.853.017.421.770.437.1334.4133.5January
2012
4.744.153.217.221.569.736.2336.5131.9December4.744.353.317.021.469.135.7338.4130.5November4.744.553.516.821.568.835.7340.1129.9October4.744.753.616.721.668.435.9341.7130.1September4.744.853.716.621.668.036.0342.9130.9August4.744.853.716.521.367.835.7343.5131.9July4.644.953.716.520.867.734.9344.0132.6June4.444.953.816.420.367.734.0344.4133.4May4.345.053.916.419.967.733.3345.2134.5April4.445.254.116.419.768.233.4346.6136.4March4.445.454.416.519.568.933.8348.5139.5February
20115.345.054.918.023.176.141.1346.7136.9February 20105.347.457.016.820.973.340.5362.4153.1February 2009
MA L E S
%%%%%'000'000'000'000
Total
Looking
for f/t
workTotal
Looking
for f/t
workTotal
Full
time
Unemployment
to population
ratio – looking
for full-time
work
Employment
to
population
ratio
Participation
rate
UNEMPLOYMENTRATEUNEMPLOYEDEMPLOYED
PERSONS AGED 15– 19 YEARS, Labour Force Status : Trend13
18 A B S • L A B O U R FO R C E • 6 2 0 2 . 0 • F E B 2 0 1 2
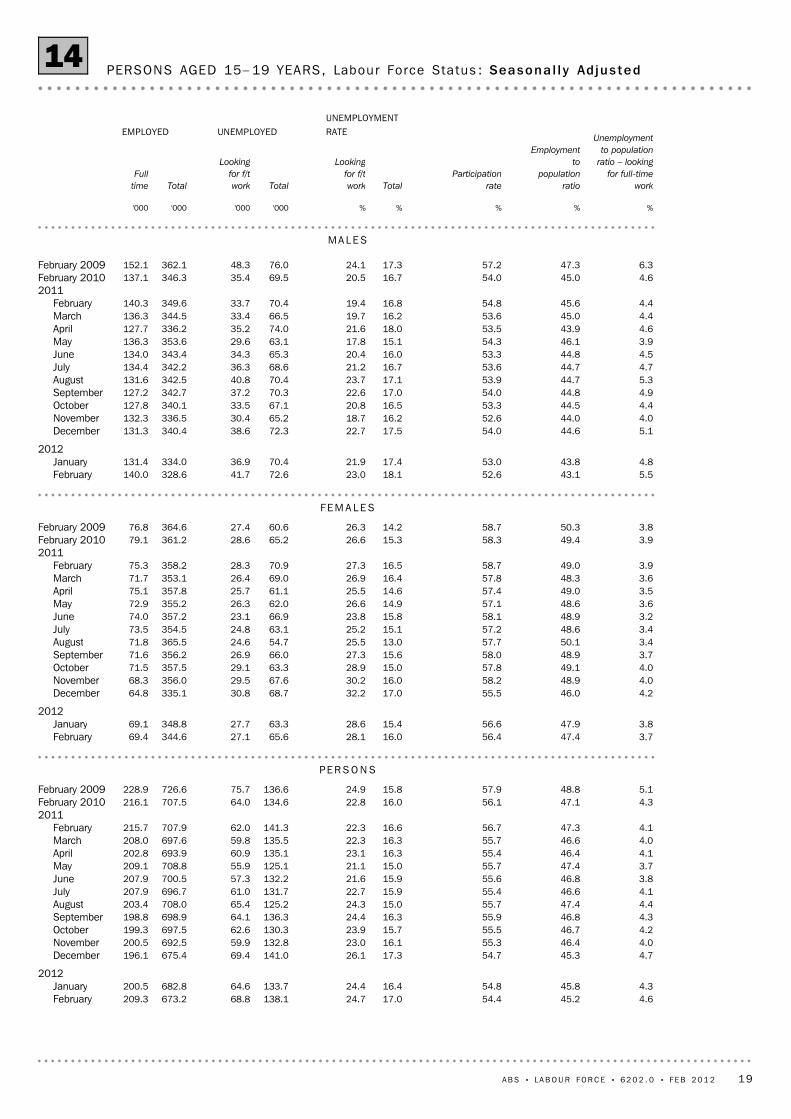
4.645.254.417.024.7138.168.8673.2209.3February4.345.854.816.424.4133.764.6682.8200.5January
2012
4.745.354.717.326.1141.069.4675.4196.1December4.046.455.316.123.0132.859.9692.5200.5November4.246.755.515.723.9130.362.6697.5199.3October4.346.855.916.324.4136.364.1698.9198.8September4.447.455.715.024.3125.265.4708.0203.4August4.146.655.415.922.7131.761.0696.7207.9July3.846.855.615.921.6132.257.3700.5207.9June3.747.455.715.021.1125.155.9708.8209.1May4.146.455.416.323.1135.160.9693.9202.8April4.046.655.716.322.3135.559.8697.6208.0March4.147.356.716.622.3141.362.0707.9215.7February
20114.347.156.116.022.8134.664.0707.5216.1February 20105.148.857.915.824.9136.675.7726.6228.9February 2009
PE R S O N S
3.747.456.416.028.165.627.1344.669.4February3.847.956.615.428.663.327.7348.869.1January
2012
4.246.055.517.032.268.730.8335.164.8December4.048.958.216.030.267.629.5356.068.3November4.049.157.815.028.963.329.1357.571.5October3.748.958.015.627.366.026.9356.271.6September3.450.157.713.025.554.724.6365.571.8August3.448.657.215.125.263.124.8354.573.5July3.248.958.115.823.866.923.1357.274.0June3.648.657.114.926.662.026.3355.272.9May3.549.057.414.625.561.125.7357.875.1April3.648.357.816.426.969.026.4353.171.7March3.949.058.716.527.370.928.3358.275.3February
20113.949.458.315.326.665.228.6361.279.1February 20103.850.358.714.226.360.627.4364.676.8February 2009
FE M A L E S
5.543.152.618.123.072.641.7328.6140.0February4.843.853.017.421.970.436.9334.0131.4January
2012
5.144.654.017.522.772.338.6340.4131.3December4.044.052.616.218.765.230.4336.5132.3November4.444.553.316.520.867.133.5340.1127.8October4.944.854.017.022.670.337.2342.7127.2September5.344.753.917.123.770.440.8342.5131.6August4.744.753.616.721.268.636.3342.2134.4July4.544.853.316.020.465.334.3343.4134.0June3.946.154.315.117.863.129.6353.6136.3May4.643.953.518.021.674.035.2336.2127.7April4.445.053.616.219.766.533.4344.5136.3March4.445.654.816.819.470.433.7349.6140.3February
20114.645.054.016.720.569.535.4346.3137.1February 20106.347.357.217.324.176.048.3362.1152.1February 2009
MA L E S
%%%%%'000'000'000'000
Total
Looking
for f/t
workTotal
Looking
for f/t
workTotal
Full
time
Unemployment
to population
ratio – looking
for full-time
work
Employment
to
population
ratio
Participation
rate
UNEMPLOYMENTRATEUNEMPLOYEDEMPLOYED
PERSONS AGED 15– 19 YEARS, Labour Force Status : Seasona l l y Ad jus ted14
A B S • L A B O U R FO R C E • 6 2 0 2 . 0 • F E B 2 0 1 2 19
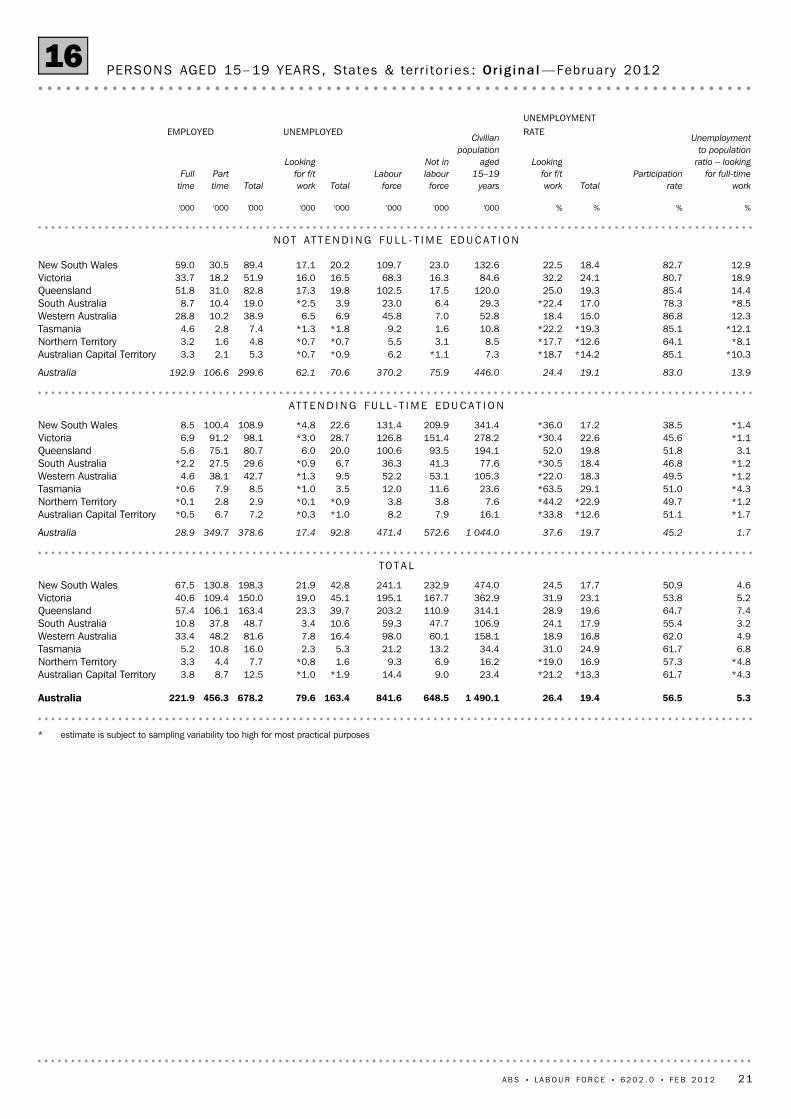
* estimate is subject to sampling variability too high for most practical purposes
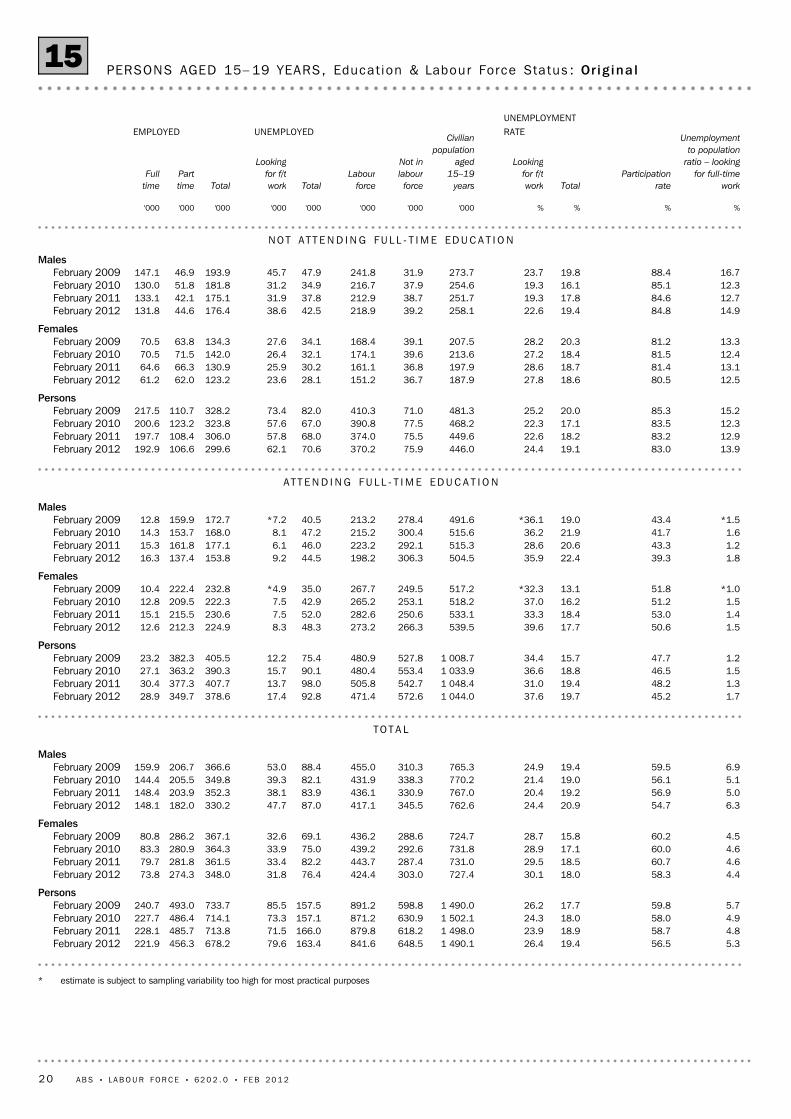
5.356.519.426.41 490.1648.5841.6163.479.6678.2456.3221.9February 20124.858.718.923.91 498.0618.2879.8166.071.5713.8485.7228.1February 20114.958.018.024.31 502.1630.9871.2157.173.3714.1486.4227.7February 20105.759.817.726.21 490.0598.8891.2157.585.5733.7493.0240.7February 2009
Persons
4.458.318.030.1727.4303.0424.476.431.8348.0274.373.8February 20124.660.718.529.5731.0287.4443.782.233.4361.5281.879.7February 20114.660.017.128.9731.8292.6439.275.033.9364.3280.983.3February 20104.560.215.828.7724.7288.6436.269.132.6367.1286.280.8February 2009
Females
6.354.720.924.4762.6345.5417.187.047.7330.2182.0148.1February 20125.056.919.220.4767.0330.9436.183.938.1352.3203.9148.4February 20115.156.119.021.4770.2338.3431.982.139.3349.8205.5144.4February 20106.959.519.424.9765.3310.3455.088.453.0366.6206.7159.9February 2009
Males
TO T A L
1.745.219.737.61 044.0572.6471.492.817.4378.6349.728.9February 20121.348.219.431.01 048.4542.7505.898.013.7407.7377.330.4February 20111.546.518.836.61 033.9553.4480.490.115.7390.3363.227.1February 20101.247.715.734.41 008.7527.8480.975.412.2405.5382.323.2February 2009
Persons
1.550.617.739.6539.5266.3273.248.38.3224.9212.312.6February 20121.453.018.433.3533.1250.6282.652.07.5230.6215.515.1February 20111.551.216.237.0518.2253.1265.242.97.5222.3209.512.8February 2010
*1.051.813.1*32.3517.2249.5267.735.0*4.9232.8222.410.4February 2009Females
1.839.322.435.9504.5306.3198.244.59.2153.8137.416.3February 20121.243.320.628.6515.3292.1223.246.06.1177.1161.815.3February 20111.641.721.936.2515.6300.4215.247.28.1168.0153.714.3February 2010
*1.543.419.0*36.1491.6278.4213.240.5*7.2172.7159.912.8February 2009Males
AT T E N D I N G FU L L - T I M E ED U C A T I O N
13.983.019.124.4446.075.9370.270.662.1299.6106.6192.9February 201212.983.218.222.6449.675.5374.068.057.8306.0108.4197.7February 201112.383.517.122.3468.277.5390.867.057.6323.8123.2200.6February 201015.285.320.025.2481.371.0410.382.073.4328.2110.7217.5February 2009
Persons
12.580.518.627.8187.936.7151.228.123.6123.262.061.2February 201213.181.418.728.6197.936.8161.130.225.9130.966.364.6February 201112.481.518.427.2213.639.6174.132.126.4142.071.570.5February 201013.381.220.328.2207.539.1168.434.127.6134.363.870.5February 2009
Females
14.984.819.422.6258.139.2218.942.538.6176.444.6131.8February 201212.784.617.819.3251.738.7212.937.831.9175.142.1133.1February 201112.385.116.119.3254.637.9216.734.931.2181.851.8130.0February 201016.788.419.823.7273.731.9241.847.945.7193.946.9147.1February 2009
Males
NO T AT T E N D I N G FU L L - T I M E ED U C A T I O N
%%%%'000'000'000'000'000'000'000'000
Total
Looking
for f/t
workTotal
Looking
for f/t
workTotal
Part
time
Full
time
Unemployment
to population
ratio – looking
for full-time
work
Participation
rate
UNEMPLOYMENTRATE
Civilian
population
aged
15–19
years
Not in
labour
force
Labour
force
UNEMPLOYEDEMPLOYED
PERSONS AGED 15– 19 YEARS, Educat ion & Labour Force Status : Or ig ina l15
20 A B S • L A B O U R FO R C E • 6 2 0 2 . 0 • F E B 2 0 1 2
* estimate is subject to sampling variability too high for most practical purposes
5.356.519.426.41 490.1648.5841.6163.479.6678.2456.3221.9Australia
*4.361.7*13.3*21.223.49.014.4*1.9*1.012.58.73.8Australian Capital Territory*4.857.316.9*19.016.26.99.31.6*0.87.74.43.3Northern Territory6.861.724.931.034.413.221.25.32.316.010.85.2Tasmania4.962.016.818.9158.160.198.016.47.881.648.233.4Western Australia3.255.417.924.1106.947.759.310.63.448.737.810.8South Australia7.464.719.628.9314.1110.9203.239.723.3163.4106.157.4Queensland5.253.823.131.9362.9167.7195.145.119.0150.0109.440.6Victoria4.650.917.724.5474.0232.9241.142.821.9198.3130.867.5New South Wales
TO T A L
1.745.219.737.61 044.0572.6471.492.817.4378.6349.728.9Australia
*1.751.1*12.6*33.816.17.98.2*1.0*0.37.26.7*0.5Australian Capital Territory*1.249.7*22.9*44.27.63.83.8*0.9*0.12.92.8*0.1Northern Territory*4.351.029.1*63.523.611.612.03.5*1.08.57.9*0.6Tasmania*1.249.518.3*22.0105.353.152.29.5*1.342.738.14.6Western Australia*1.246.818.4*30.577.641.336.36.7*0.929.627.5*2.2South Australia3.151.819.852.0194.193.5100.620.06.080.775.15.6Queensland
*1.145.622.6*30.4278.2151.4126.828.7*3.098.191.26.9Victoria*1.438.517.2*36.0341.4209.9131.422.6*4.8108.9100.48.5New South Wales
AT T E N D I N G FU L L - T I M E ED U C A T I O N
13.983.019.124.4446.075.9370.270.662.1299.6106.6192.9Australia
*10.385.1*14.2*18.77.3*1.16.2*0.9*0.75.32.13.3Australian Capital Territory*8.164.1*12.6*17.78.53.15.5*0.7*0.74.81.63.2Northern Territory
*12.185.1*19.3*22.210.81.69.2*1.8*1.37.42.84.6Tasmania12.386.815.018.452.87.045.86.96.538.910.228.8Western Australia*8.578.317.0*22.429.36.423.03.9*2.519.010.48.7South Australia14.485.419.325.0120.017.5102.519.817.382.831.051.8Queensland18.980.724.132.284.616.368.316.516.051.918.233.7Victoria12.982.718.422.5132.623.0109.720.217.189.430.559.0New South Wales
NO T AT T E N D I N G FU L L - T I M E ED U C A T I O N
%%%%'000'000'000'000'000'000'000'000
Total
Looking
for f/t
workTotal
Looking
for f/t
workTotal
Part
time
Full
time
Unemployment
to population
ratio – looking
for full-time
work
Participation
rate
UNEMPLOYMENTRATE
Civilian
population
aged
15–19
years
Not in
labour
force
Labour
force
UNEMPLOYEDEMPLOYED
PERSONS AGED 15– 19 YEARS, States & ter r i to r ies : Or ig ina l —February 201216
A B S • L A B O U R FO R C E • 6 2 0 2 . 0 • F E B 2 0 1 2 21
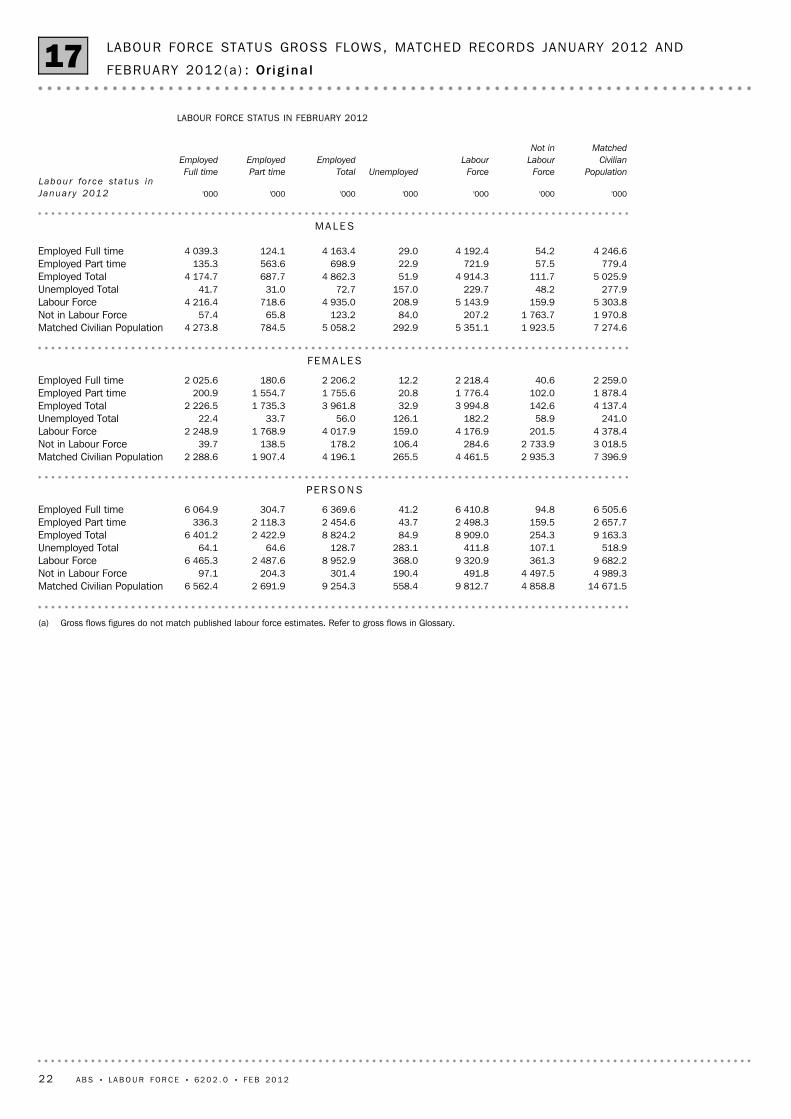
(a) Gross flows figures do not match published labour force estimates. Refer to gross flows in Glossary.
14 671.54 858.89 812.7558.49 254.32 691.96 562.4Matched Civilian Population4 989.34 497.5491.8190.4301.4204.397.1Not in Labour Force9 682.2361.39 320.9368.08 952.92 487.66 465.3Labour Force
518.9107.1411.8283.1128.764.664.1Unemployed Total9 163.3254.38 909.084.98 824.22 422.96 401.2Employed Total2 657.7159.52 498.343.72 454.62 118.3336.3Employed Part time6 505.694.86 410.841.26 369.6304.76 064.9Employed Full time
PE R S O N S
7 396.92 935.34 461.5265.54 196.11 907.42 288.6Matched Civilian Population3 018.52 733.9284.6106.4178.2138.539.7Not in Labour Force4 378.4201.54 176.9159.04 017.91 768.92 248.9Labour Force
241.058.9182.2126.156.033.722.4Unemployed Total4 137.4142.63 994.832.93 961.81 735.32 226.5Employed Total1 878.4102.01 776.420.81 755.61 554.7200.9Employed Part time2 259.040.62 218.412.22 206.2180.62 025.6Employed Full time
FE M A L E S
7 274.61 923.55 351.1292.95 058.2784.54 273.8Matched Civilian Population1 970.81 763.7207.284.0123.265.857.4Not in Labour Force5 303.8159.95 143.9208.94 935.0718.64 216.4Labour Force
277.948.2229.7157.072.731.041.7Unemployed Total5 025.9111.74 914.351.94 862.3687.74 174.7Employed Total
779.457.5721.922.9698.9563.6135.3Employed Part time4 246.654.24 192.429.04 163.4124.14 039.3Employed Full time
MA L E S
'000'000'000'000'000'000'000
Matched
Civilian
Population
Not in
Labour
Force
Labour
ForceUnemployed
Employed
Total
Employed
Part time
Employed
Full time
LABOUR FORCE STATUS IN FEBRUARY 2012
Labou r fo r ce sta tu s in
Janua r y 2012
LABOUR FORCE STATUS GROSS FLOWS, MATCHED RECORDS JANUARY 2012 AND
FEBRUARY 2012(a) : Or ig ina l17
22 A B S • L A B O U R FO R C E • 6 2 0 2 . 0 • F E B 2 0 1 2
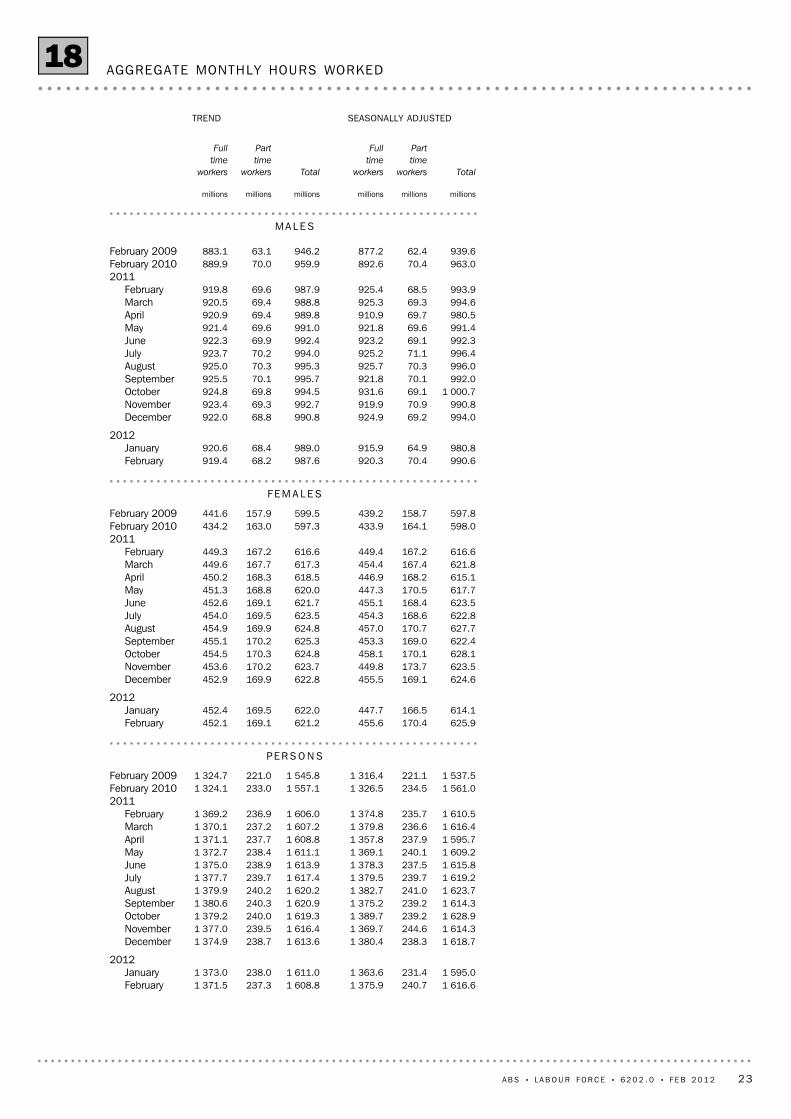
1 616.6240.71 375.91 608.8237.31 371.5February1 595.0231.41 363.61 611.0238.01 373.0January
2012
1 618.7238.31 380.41 613.6238.71 374.9December1 614.3244.61 369.71 616.4239.51 377.0November1 628.9239.21 389.71 619.3240.01 379.2October1 614.3239.21 375.21 620.9240.31 380.6September1 623.7241.01 382.71 620.2240.21 379.9August1 619.2239.71 379.51 617.4239.71 377.7July1 615.8237.51 378.31 613.9238.91 375.0June1 609.2240.11 369.11 611.1238.41 372.7May1 595.7237.91 357.81 608.8237.71 371.1April1 616.4236.61 379.81 607.2237.21 370.1March1 610.5235.71 374.81 606.0236.91 369.2February
20111 561.0234.51 326.51 557.1233.01 324.1February 20101 537.5221.11 316.41 545.8221.01 324.7February 2009
PE R S O N S
625.9170.4455.6621.2169.1452.1February614.1166.5447.7622.0169.5452.4January
2012
624.6169.1455.5622.8169.9452.9December623.5173.7449.8623.7170.2453.6November628.1170.1458.1624.8170.3454.5October622.4169.0453.3625.3170.2455.1September627.7170.7457.0624.8169.9454.9August622.8168.6454.3623.5169.5454.0July623.5168.4455.1621.7169.1452.6June617.7170.5447.3620.0168.8451.3May615.1168.2446.9618.5168.3450.2April621.8167.4454.4617.3167.7449.6March616.6167.2449.4616.6167.2449.3February
2011598.0164.1433.9597.3163.0434.2February 2010597.8158.7439.2599.5157.9441.6February 2009
FE M A L E S
990.670.4920.3987.668.2919.4February980.864.9915.9989.068.4920.6January
2012
994.069.2924.9990.868.8922.0December990.870.9919.9992.769.3923.4November
1 000.769.1931.6994.569.8924.8October992.070.1921.8995.770.1925.5September996.070.3925.7995.370.3925.0August996.471.1925.2994.070.2923.7July992.369.1923.2992.469.9922.3June991.469.6921.8991.069.6921.4May980.569.7910.9989.869.4920.9April994.669.3925.3988.869.4920.5March993.968.5925.4987.969.6919.8February
2011963.070.4892.6959.970.0889.9February 2010939.662.4877.2946.263.1883.1February 2009
MA L E S
millionsmillionsmillionsmillionsmillionsmillions
Total
Part
time
workers
Full
time
workersTotal
Part
time
workers
Full
time
workers
SEASONALLY ADJUSTEDTREND
AGGREGATE MONTHLY HOURS WORKED18
A B S • L A B O U R FO R C E • 6 2 0 2 . 0 • F E B 2 0 1 2 23
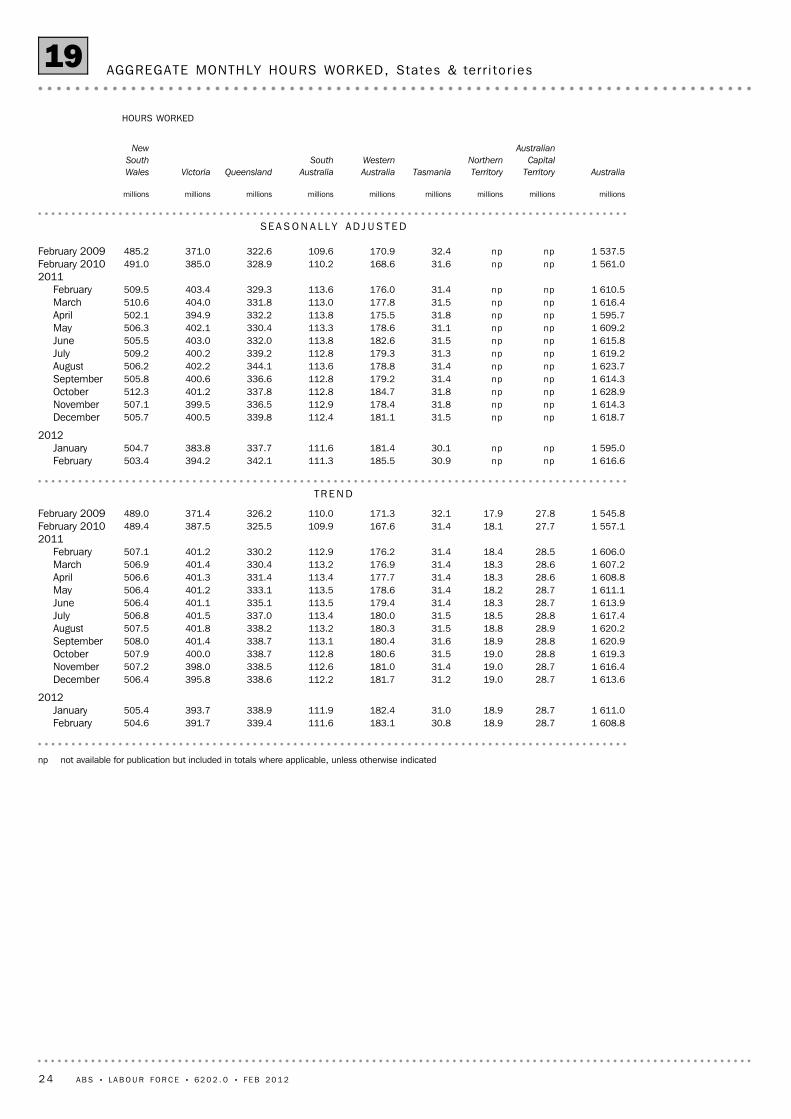
np not available for publication but included in totals where applicable, unless otherwise indicated
1 608.828.718.930.8183.1111.6339.4391.7504.6February1 611.028.718.931.0182.4111.9338.9393.7505.4January
2012
1 613.628.719.031.2181.7112.2338.6395.8506.4December1 616.428.719.031.4181.0112.6338.5398.0507.2November1 619.328.819.031.5180.6112.8338.7400.0507.9October1 620.928.818.931.6180.4113.1338.7401.4508.0September1 620.228.918.831.5180.3113.2338.2401.8507.5August1 617.428.818.531.5180.0113.4337.0401.5506.8July1 613.928.718.331.4179.4113.5335.1401.1506.4June1 611.128.718.231.4178.6113.5333.1401.2506.4May1 608.828.618.331.4177.7113.4331.4401.3506.6April1 607.228.618.331.4176.9113.2330.4401.4506.9March1 606.028.518.431.4176.2112.9330.2401.2507.1February
20111 557.127.718.131.4167.6109.9325.5387.5489.4February 20101 545.827.817.932.1171.3110.0326.2371.4489.0February 2009
TR E N D
1 616.6npnp30.9185.5111.3342.1394.2503.4February1 595.0npnp30.1181.4111.6337.7383.8504.7January
2012
1 618.7npnp31.5181.1112.4339.8400.5505.7December1 614.3npnp31.8178.4112.9336.5399.5507.1November1 628.9npnp31.8184.7112.8337.8401.2512.3October1 614.3npnp31.4179.2112.8336.6400.6505.8September1 623.7npnp31.4178.8113.6344.1402.2506.2August1 619.2npnp31.3179.3112.8339.2400.2509.2July1 615.8npnp31.5182.6113.8332.0403.0505.5June1 609.2npnp31.1178.6113.3330.4402.1506.3May1 595.7npnp31.8175.5113.8332.2394.9502.1April1 616.4npnp31.5177.8113.0331.8404.0510.6March1 610.5npnp31.4176.0113.6329.3403.4509.5February
20111 561.0npnp31.6168.6110.2328.9385.0491.0February 20101 537.5npnp32.4170.9109.6322.6371.0485.2February 2009
SE A S O N A L L Y AD J U S T E D
millionsmillionsmillionsmillionsmillionsmillionsmillionsmillionsmillions
Australia
Australian
Capital
Territory
Northern
TerritoryTasmania
Western
Australia
South
AustraliaQueenslandVictoria
New
South
Wales
HOURS WORKED
AGGREGATE MONTHLY HOURS WORKED, States & ter r i to r ies19
24 A B S • L A B O U R FO R C E • 6 2 0 2 . 0 • F E B 2 0 1 2
13.47.6916.412.57.3877.512.67.3876.9February2012
12.27.3873.512.67.3877.712.57.2868.2November11.96.8810.912.37.0842.512.37.1855.5August12.17.1850.412.27.1855.812.17.0842.9May12.87.2868.311.96.9830.212.17.0844.2February
2011
11.97.1846.112.37.1849.612.27.1848.9November12.17.2845.912.57.4875.112.37.2850.7August
201013.87.8924.512.87.5882.012.97.5873.9February 201013.77.6886.812.77.4847.312.47.2828.3February 200910.76.2695.89.95.9666.010.26.0672.9February 2008
PE R S O N S
15.89.6531.514.59.2506.214.79.3512.6February2012
14.59.5523.114.99.5519.714.79.3510.4November13.98.8479.614.59.1502.814.69.2506.2August14.38.9489.814.69.1495.914.59.1498.5May15.69.6523.814.49.1498.814.49.0492.3February
2011
14.18.9484.314.48.8480.614.59.0489.5November14.18.9477.014.79.2499.014.59.1489.9August
201016.110.1538.214.99.6512.014.99.6509.3February 201016.19.9526.014.99.5502.514.49.1479.4February 200913.18.0409.312.17.7392.212.57.9401.8February 2008
FE M A L E S
11.55.8384.810.85.7371.310.85.6364.3February2012
10.25.4350.310.65.5357.910.65.5357.8November10.25.1331.310.55.2339.710.45.3349.4August10.25.5360.610.25.5359.910.25.3344.4May10.65.2344.59.95.1331.410.25.4351.8February
2011
10.05.5361.810.55.6368.910.35.5359.5November10.45.7368.910.65.8376.110.55.6360.8August
201011.96.0386.411.15.8370.011.15.7364.6February 201011.65.7360.810.85.5344.810.75.6348.8February 2009
8.64.6286.68.14.5273.88.34.4271.1February 2008
MA L E S
%%'000%%'000%%'000
Labour
force under-
utilisation rate
Under-
employment
rate
Under-
employed
workers
Labour
force under-
utilisation rate
Under-
employment
rate
Under-
employed
workers
Labour
force under-
utilisation rate
Under-
employment
rate
Under-
employed
workers
ORIGINALSEASONALLY ADJUSTEDTREND
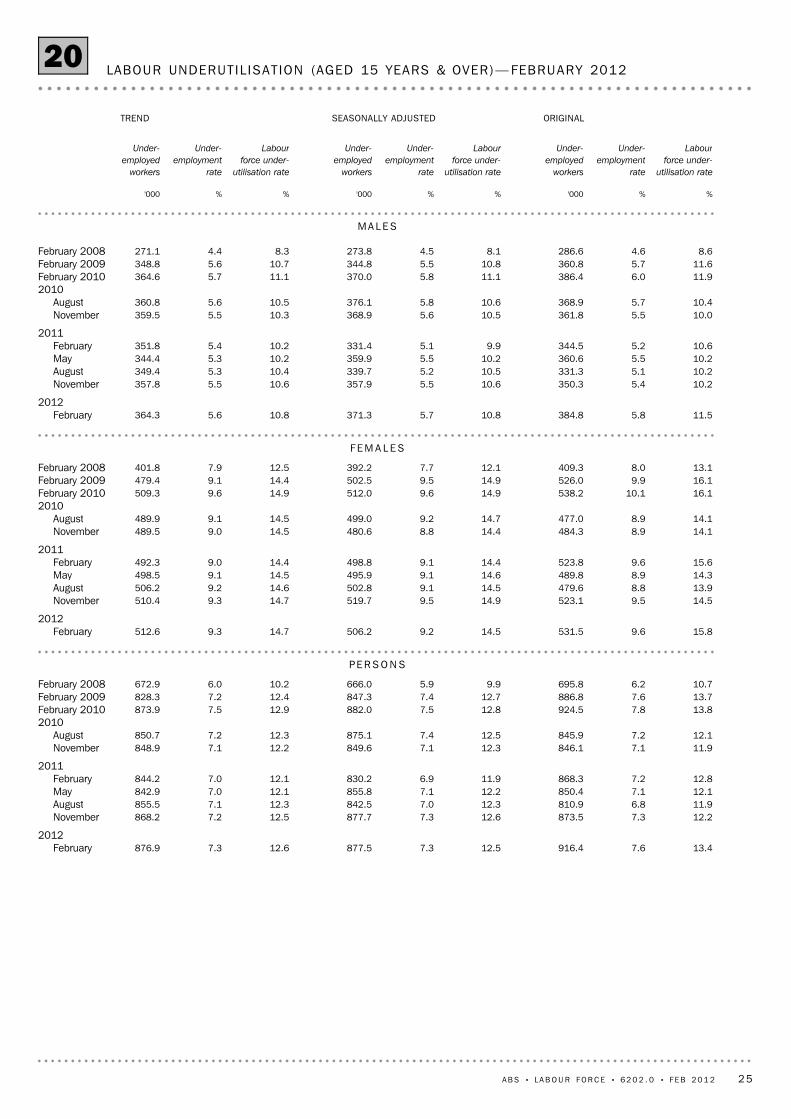
LABOUR UNDERUT IL ISAT ION (AGED 15 YEARS & OVER)— FEBRUARY 2012 20
A B S • L A B O U R FO R C E • 6 2 0 2 . 0 • F E B 2 0 1 2 25
13.47.6916.412.57.3877.512.67.3876.9Australia
9.35.411.58.75.010.78.64.810.2Australian Capital
Territory
9.64.65.98.64.25.48.94.45.7Northern Territory16.78.621.916.19.122.816.29.423.7Tasmania10.86.485.110.26.382.710.16.179.8Western Australia13.67.666.412.87.565.113.27.968.4South Australia14.88.1201.913.47.7190.213.57.6189.2Queensland13.87.7233.812.77.2217.312.56.9208.7Victoria13.37.6289.712.57.3275.512.77.5283.3New South Wales
PE R S O N S
15.89.6531.514.59.2506.214.79.3512.6Australia
10.16.06.29.25.65.89.65.75.8Australian Capital
Territory
9.76.03.68.35.03.09.25.13.1Northern Territory20.111.914.118.812.314.418.912.514.7Tasmania14.09.253.613.29.051.912.98.750.2Western Australia15.910.241.214.810.039.815.210.541.7South Australia16.710.1115.215.39.6109.315.69.6109.5Queensland16.29.8136.215.09.4129.314.79.1125.2Victoria15.69.3161.514.28.7150.214.89.3161.2New South Wales
FE M A L E S
11.55.8384.810.85.7371.310.85.6364.3Australia
8.74.75.38.24.44.97.73.94.3Australian Capital
Territory
9.53.42.38.93.42.48.73.72.6Northern Territory13.85.77.813.76.38.413.96.79.0Tasmania
8.24.331.67.84.230.87.94.029.6Western Australia11.65.425.311.15.525.311.45.726.7South Australia13.26.586.611.96.180.811.76.079.7Queensland11.85.997.610.85.487.910.75.183.5Victoria11.46.2128.211.06.1125.211.05.9122.1New South Wales
MA L E S
%%'000%%'000%%'000
Labour
force under-
utilisation rate
Under-
employment
rate
Under-
employed
workers
Labour
force under-
utilisation rate
Under-
employment
rate
Under-
employed
workers
Labour
force under-
utilisation rate
Under-
employment
rate
Under-
employed
workers
ORIGINALSEASONALLY ADJUSTEDTREND
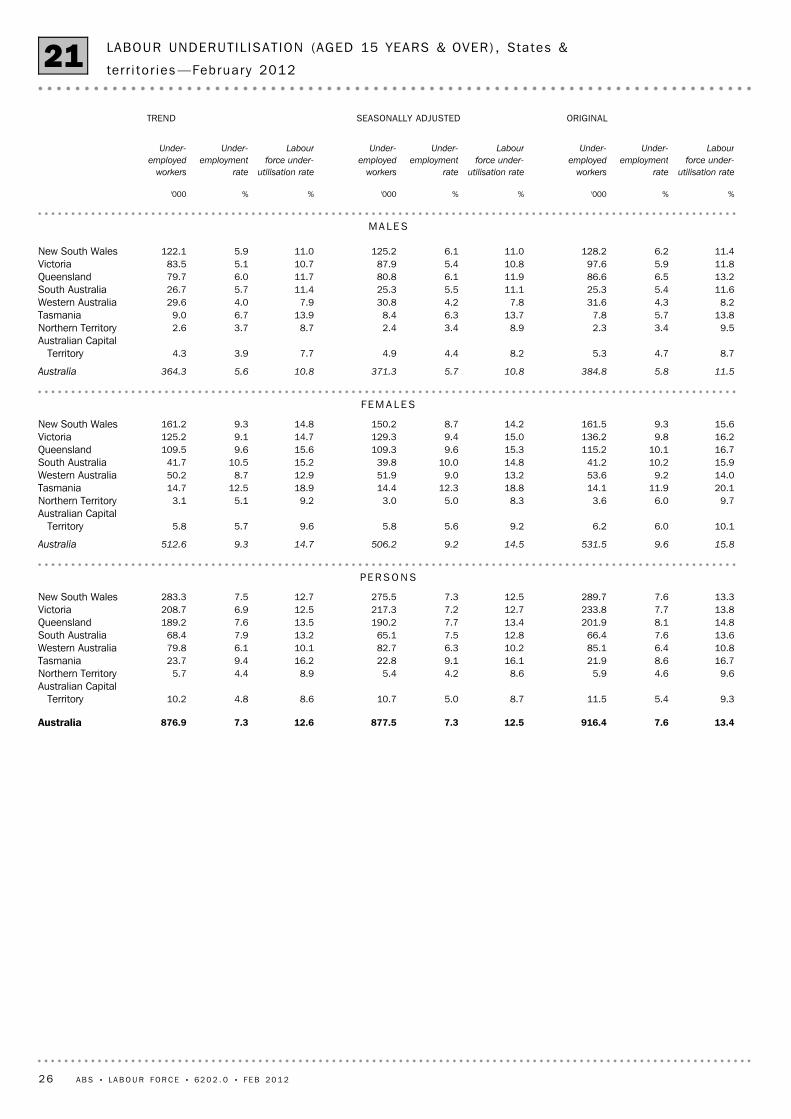
LABOUR UNDERUT IL ISAT ION (AGED 15 YEARS & OVER) , States &
ter r i to r ies —February 201221
26 A B S • L A B O U R FO R C E • 6 2 0 2 . 0 • F E B 2 0 1 2
EF F E C T OF NE W SE A S O N A L L Y AD J U S T E D ES T I M A T E S ON TR E N D ES T I M A T E S
5.25.25.2February5.25.25.2January
2012
5.25.25.2December5.25.25.2November
2011
(2) 5.1 i.e.
falls by 2.10%
(1) 5.3 i.e.
rises by 2.10%
WHAT IF NEXT MONTH'S SEASONALLYADJUSTED ESTIMATE IS:
Trend as
published
Aug2011
Oct Dec Feb2012
%
4.8
5.0
5.2
5.4
5.6Published trend12
UN E M P L O Y M E N T RA T E
11 436.311 451.611 444.6February11 439.211 447.411 443.6January
2012
11 441.611 444.111 442.8December11 442.711 441.811 442.2November
2011
(2) 11 416.6 i.e.
falls by 0.24%
(1) 11 471.5 i.e.
rises by 0.24%
WHAT IF NEXT MONTH'S SEASONALLYADJUSTED ESTIMATE IS:
Trend as
published
Aug2011
Oct Dec Feb2012
'000
11300
11375
11450
11525
11600Published trend12
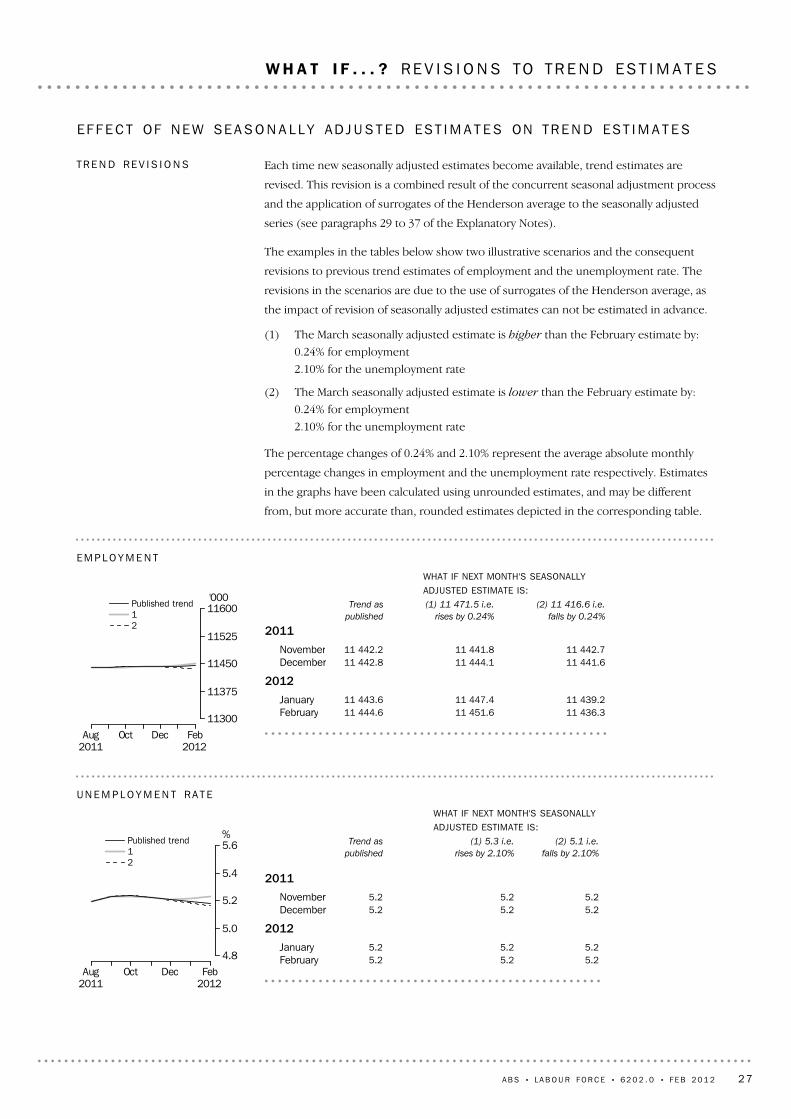
EM P L O Y M E N T
Each time new seasonally adjusted estimates become available, trend estimates are
revised. This revision is a combined result of the concurrent seasonal adjustment process
and the application of surrogates of the Henderson average to the seasonally adjusted
series (see paragraphs 29 to 37 of the Explanatory Notes).
The examples in the tables below show two illustrative scenarios and the consequent
revisions to previous trend estimates of employment and the unemployment rate. The
revisions in the scenarios are due to the use of surrogates of the Henderson average, as
the impact of revision of seasonally adjusted estimates can not be estimated in advance.
(1) The March seasonally adjusted estimate is higher than the February estimate by:
0.24% for employment
2.10% for the unemployment rate
(2) The March seasonally adjusted estimate is lower than the February estimate by:
0.24% for employment
2.10% for the unemployment rate
The percentage changes of 0.24% and 2.10% represent the average absolute monthly
percentage changes in employment and the unemployment rate respectively. Estimates
in the graphs have been calculated using unrounded estimates, and may be different
from, but more accurate than, rounded estimates depicted in the corresponding table.
TR E N D RE V I S I O N S
A B S • L A B O U R FO R C E • 6 2 0 2 . 0 • F E B 2 0 1 2 27
W H A T I F . . . ? RE V I S I O N S TO TR E N D ES T I M A T E S
9 In the Labour Force Survey, coverage rules are applied which aim to ensure that each
person is associated with only one dwelling, and hence has only one chance of selection.
The coverage rules are necessarily a balance between theoretical and operational
considerations. Nevertheless, the chance of a person being enumerated at two separate
dwellings in the survey is considered to be negligible.
CO V E R A G E
8 The Labour Force Survey includes all persons aged 15 years and over except
members of the permanent defence forces, certain diplomatic personnel of overseas
governments customarily excluded from census and estimated population counts,
overseas residents in Australia, and members of non-Australian defence forces (and their
dependants) stationed in Australia.
SC O P E OF SU R V E Y
3 The Labour Force Survey is based on a multi-stage area sample of private dwellings
(currently approximately 29,000 houses, flats, etc.) and a list sample of non-private
dwellings (hotels, motels, etc.), and covers approximately 0.33% of the civilian
population of Australia aged 15 years and over.
4 Information is obtained from the occupants of selected dwellings by specially trained
interviewers using computer-assisted interviewing.
5 Households selected for the Labour Force Survey are interviewed each month for
eight months, with one-eighth of the sample being replaced each month. The first
interview is conducted face-to-face. Subsequent interviews are conducted by telephone
(if acceptable to the respondent).
6 The interviews are generally conducted during the two weeks beginning on the
Sunday between the 5th and 11th of each month. The information obtained relates to
the week before the interview (i.e. the reference week). Each year, to deal with
operational difficulties involved with collecting and processing the Labour Force Survey
around the Christmas and New Year holiday period, interviews for December start four
weeks after November interviews start, and January interviews start five weeks after
December interviews start. As a result, January interviewing may commence as early as
the 7th or as late as the 13th, depending on the year. Occasionally, circumstances that
present significant operational difficulties for survey collection can result in a change to
the normal pattern for the start of interviewing.
7 Estimates from the Labour Force Survey are usually published first in this publication
32 days after the commencement of interviews for that month, with the exception of
estimates for each December which are usually published 39 days after the
commencement of interviews.
LA B O U R FO R C E SU R V E Y
2 The conceptual framework used in Australia’s Labour Force Survey aligns closely with
the standards and guidelines set out in Resolutions of International Conferences of
Labour Statisticians. Descriptions of the underlying concepts and structure of Australia's
labour force statistics, and the sources and methods used in compiling the estimates, are
presented in Labour Statistics: Concepts, Sources and Methods (cat. no. 6102.0.55.001)
which is available on the ABS website <http://www.abs.gov.au>.
CO N C E P T S , SO U R C E S AN D
ME T H O D S
1 This publication contains estimates of the civilian labour force derived from the
Labour Force Survey component of the Monthly Population Survey. The full time series
for estimates from this publication are also available electronically. More detailed
estimates are released one week after this publication in various electronic formats – see
Labour Force, Australia, Detailed – Electronic Delivery (cat. no. 6291.0.55.001) and
Labour Force, Australia, Detailed, Quarterly (cat. no. 6291.0.55.003).
I N T R O D U C T I O N
28 A B S • L A B O U R FO R C E • 6 2 0 2 . 0 • F E B 2 0 1 2
E X P L A N A T O R Y N O T E S
15 The estimation method used in the Labour Force Survey is Composite Estimation,
which was introduced in May 2007. Composite Estimation combines data collected in the
previous six months with current month's data to produce the current month's
estimates, thereby exploiting the high correlation between overlapping samples across
months in the Labour Force Survey. The Composite Estimator combines the previous
and current month's data by applying different factors according to length of time in the
survey. After these factors are applied, the seven months of data are weighted to align
with current month population benchmarks. For details see Information Paper:
Forthcoming Changes to Labour Force Statistics, 2007 (cat. no. 6292.0).
ES T I M A T I O N ME T H O D
10 The Labour Force Survey estimates are calculated in such a way as to add up to
independent estimates of the civilian population aged 15 years and over (population
benchmarks). These population benchmarks are projections of the most recently
released quarterly Estimated Resident Population (ERP) data. For information on the
methodology used to produce the ERP see Australian Demographic Statistics
(cat. no. 3101.0). To create the population benchmarks for the Labour Force Survey, the
most recently released quarterly ERP estimates are projected forward one quarter past
the period for which they are required. The projection is based on the historical pattern
of each population component - births, deaths, interstate migration and net overseas
migration (NOM). By projecting one quarter past that needed for the current population
benchmarks, demographic changes are smoothed in, thereby making them less
noticeable in the population benchmarks.
11 Commencing March 2010, the ERP series is revised twice-yearly in the March and
September quarter issues of Australian Demographic Statistics (cat. no. 3101.0). This
biannual revision cycle incorporates more up to date information available for NOM. The
revised ERP estimates are used to update the quarterly population projections used in
creating the Labour Force Survey population benchmarks.
12 Every five years, the ERP series are revised to incorporate additional information
available from the latest Census of Population and Housing (Census). Following the
incorporation of census information, the ERP series prior to the latest census are final
and subject to no further revision. Labour Force Survey population benchmarks, and the
estimates, are revised following this 5-yearly revision in the ERP. From the February 2009
issue of this publication, labour force estimates have been compiled using population
benchmarks based on the results of the 2006 Census. Revisions were made in the
February 2009 issue to historical labour force estimates from June 2001 to January 2009.
13 As noted, Labour Force Survey population benchmarks are derived from ABS' ERP
series. In the past, ABS has revised the Labour Force Survey population benchmarks
every five years in order to incorporate additional information from the latest Census.
However, in the July 2010 issue of this publication the Labour Force Survey population
benchmarks were revised back to July 2006 to accommodate earlier revisions to ERP.
14 From October 2010 onwards, the net overseas migration component of the Labour
Force Survey population benchmarks has been derived using assumptions that take into
account a range of available supplementary data sources and relevant information to
forecast population changes in the short-term. See articles in Labour Force, Australia
(cat. no. 6202.0) titled: Labour Force Survey Population Benchmarks in the September
2010 issue; and Changes in this issue in the October 2010 issue. In the future, the ABS
may occasionally rebenchmark and revise Labour Force Survey estimates to take account
of changes in ERP as additional information becomes available. Where revisions are
undertaken, these will be communicated in this publication.
PO P U L A T I O N BE N C H M A R K S
A B S • L A B O U R FO R C E • 6 2 0 2 . 0 • F E B 2 0 1 2 29
E X P L A N A T O R Y N O T E S continued
21 The current Labour Force Survey sample has been selected using information
collected in the 2006 Census of Population and Housing.
22 The majority of this sample was phased in over the period November 2007 to
June 2008, with one-eighth of this portion of the sample being introduced every month.
Such a pattern of implementation means that any changes to labour force estimates due
to differences between the two samples, or any other influences, were spread over the
eight months. The remainder of the sample (about 20% of the total), which covers less
settled areas and non-private dwellings was rotated in full for New South Wales, Western
Australia, Northern Territory and Australian Capital Territory in March 2008, and for
Victoria, Queensland, South Australia and Tasmania in April 2008.
LA B O U R FO R C E SU R V E Y
SA M P L E
16 From April 1986, the definition of employed persons was changed to include
persons who worked without pay between 1 and 14 hours per week in a family business
or on a farm (i.e. contributing family workers). For further information, see
paragraphs 22 and 23 of the Explanatory Notes in the February 2003 issue of Labour
Force, Australia (cat. no. 6203.0).
17 The ABS introduced telephone interviewing into the Labour Force Survey in
August 1996. Implementation was phased in for each new sample group from
August 1996 to February 1997. During the period of implementation, the new method
produced different estimates than would have been obtained under the old
methodology. The effect dissipated over the final months of implementation and was no
longer discernible from February 1997. The estimates for February 1997 and onwards are
directly comparable to estimates for periods prior to August 1996. For further details, see
the feature article in the June 1997 issue of Labour Force, Australia (cat. no. 6203.0).
18 From April 2001 the Labour Force Survey has been conducted using a redesigned
questionnaire containing additional data items and some minor definitional changes.
The definition of unemployed persons was changed to include all persons who were
waiting to start work and were available to start in the reference week. This change was
introduced in February 2004, when historical unit record data were revised from
April 2001 to January 2004. This revision created a small trend break at April 2001 in
unemployed persons and unemployment rate series. For further details, see Information
Paper: Forthcoming Changes to Labour Force Statistics (cat. no. 6292.0), released in
December 2003.
19 Core labour force series were revised in April 2001 for the period
April 1986 to March 2001 for the remaining definitional changes introduced with the
redesigned questionnaire, to reduce the impact of the changes on labour force series.
For further details, see Information Paper: Implementing the Redesigned Labour Force
Survey Questionnaire (cat. no. 6295.0) and Information Paper: Questionnaires Used in
the Labour Force Survey (cat. no. 6232.0).
20 In May 2007, an improved method of estimation, known as composite estimation,
was introduced into the Labour Force Survey. In introducing this change, the ABS
revised unit record data from April 2001 to April 2007 based on the new estimation
method. While estimates for periods prior to April 2001 are unrevised and were
compiled using a different estimation method, no trend break was identified in the
employed persons series. Also, no change was identified in the trend breaks in the
unemployed persons and unemployment rate series which arose with the introduction
of a redesigned survey form in April 2001 (as noted above in paragraph 18). For further
details, see Information Paper: Forthcoming Changes to Labour Force Statistics, 2007
(cat. no. 6292.0).
CO M P A R A B I L I T Y OF SE R I E S
30 A B S • L A B O U R FO R C E • 6 2 0 2 . 0 • F E B 2 0 1 2
E X P L A N A T O R Y N O T E S continued
29 Seasonal adjustment is a means of removing the estimated effects of normal
seasonal variation from the series so that the effects of other influences on the series can
be more clearly recognised. Seasonal adjustment does not aim to remove the irregular or
non-seasonal influences which may be present in any particular month. This means that
month-to-month movements of the seasonally adjusted estimates may not be reliable
indicators of trend behaviour.
30 The Labour Force Survey uses the concurrent seasonal adjustment method to
derive seasonal factors. Concurrent seasonal adjustment uses data up to the current
month to estimate seasonal factors for the current and all previous months. This process
can result in revisions each month to estimates for earlier periods. However, in most
instances, the only noticeable revisions will be to the seasonally adjusted estimates for
the previous month and one year prior to the current month.
SE A S O N A L AD J U S T M E N T AN D
TR E N D ES T I M A T I O N
25 Two types of error are possible in an estimate based on a sample survey: sampling
error and non-sampling error.
26 Sampling error occurs because a sample, rather than the entire population, is
surveyed. One measure of the likely difference resulting from not including all dwellings
in the survey is given by the standard error. There are about two chances in three that a
sample estimate will differ by less than one standard error from the figure that would
have been obtained if all dwellings had been included in the survey, and about nineteen
chances in twenty that the difference will be less than two standard errors. Standard
errors of key estimates for the latest month and of movements since the previous month
of these estimates are shown in the standard errors section of this publication. Standard
errors for other estimates and other movements may be calculated by using the
spreadsheet contained in Labour Force Survey Standard Errors, Data Cube
(cat. no. 6298.0.55.001) which is available free of charge on the ABS website
<http://www.abs.gov.au>.
27 Non-sampling error arises from inaccuracies in collecting, recording and processing
the data. Every effort is made to minimise reporting error by the careful design of
questionnaires, intensive training and supervision of interviewers, and efficient data
processing procedures. Non-sampling error also arises because information cannot be
obtained from all persons selected in the survey. The Labour Force Survey receives a
high level of co-operation from individuals in selected dwellings, with the average
response rate over the last year being 97%. See Glossary for definition of response rate.
28 Due to flooding in Queensland, operational difficulties were experienced in
conducting the Labour Force Survey in January 2011. While the disruption to survey
operations will have slightly reduced the quality of some Queensland estimates, the
impact on the estimates is not statistically significant for most series. However, a
noticeable impact on aggregate monthly hours worked was observed for Queensland
and a large extreme correction has been applied to stabilise the trend estimate. A similar
treatment has been applied to the Australian total series. See article in January 2011 issue
of Labour Force, Australia (cat. no. 6202.0) titled: Impact of the Floods on the Labour
Force Survey.
RE L I A B I L I T Y OF ES T I M A T E S
23 As one of a range of ABS savings initiatives for the 2008–09 financial year, there was
a 24% reduction in the LFS sample size for the period July 2008 to August 2009, relative
to the June 2008 sample size. The sample reduction was reversed from
September 2009 to December 2009, with December 2009 estimates being the first
produced under the fully reinstated sample.
24 For further details, see Information Paper: Labour Force Survey Sample Design
(cat. no. 6269.0).
LA B O U R FO R C E SU R V E Y
SA M P L E continued
A B S • L A B O U R FO R C E • 6 2 0 2 . 0 • F E B 2 0 1 2 31
E X P L A N A T O R Y N O T E S continued
38 Users may also wish to refer to the following publications:
! Labour Force Survey Standard Products and Data Item Guide (cat.no. 6103.0).
This publication is a reference guide for users of Labour Force Survey data standard
products.
RE L A T E D PU B L I C A T I O N S
31 The revision properties of the seasonally adjusted and trend estimates can be
improved by the use of Autoregressive Integrated Moving Average (ARIMA) modelling.
ARIMA modelling relies on the characteristics of the series being analysed to project
future period data. The projected values are temporary, intermediate values, that are
only used internally to improve the estimation of the seasonal factors. The projected data
do not affect the original estimates and are discarded at the end of the seasonal
adjustment process. The Labour Force Survey uses an ARIMA model for 95% of the
individual time series. The ARIMA model is assessed as part of the annual reanalysis. For
further details, see the feature article in the October 2004 issue of Australian Economic
Indicators (cat. no. 1350.0).
32 Seasonal adjustment is able to remove the effect of events which occur at the same
time in the survey every year. However, there are some events, like holidays, which are
not always at the same time in the survey cycle or which are not at the same time across
Australia. The effects of these types of events on Labour Force Survey estimates cannot in
all cases be removed, because the pattern of their effects cannot be determined.
However, two events for which adjustment is made in the seasonally adjusted series are
the January interview start date and the timing of Easter. For further details, see
Information Paper: Forthcoming Changes to Labour Force Statistics (cat. no. 6292.0)
released in December 2003.
33 While seasonal factors for the complete time series are estimated each month, they
will continue to be reviewed annually at a more detailed level to take into account each
additional year's original data. This annual review will not normally result in significant
changes to published estimates. The review is usually conducted in February each year
with the results released in the February issue of this publication.
34 The smoothing of seasonally adjusted series to produce 'trend' series reduces the
impact of the irregular component of the seasonally adjusted series. These trend
estimates are derived by applying a 13-term Henderson-weighted moving average to all
months except the last six. The last six monthly trend estimates are obtained by applying
surrogates of the Henderson average to the seasonally adjusted series. Trend estimates
are used to analyse the underlying behaviour of a series over time.
35 While this smoothing technique enables estimates to be produced for the latest
month, it does result in revisions in addition to those caused by the revision of
seasonally adjusted estimates. Generally, revisions due to the use of surrogates of the
Henderson average become smaller, and after three months have a negligible impact on
the series.
36 Trend estimates are published for the Northern Territory in table 10 and for the
Australian Capital Territory in table 11. Unadjusted series for the two Territories have
shown, historically, a high degree of variability, which can lead to considerable revisions
to the seasonally adjusted estimates each month when seasonal factors are estimated.
For this reason, seasonally adjusted estimates are not currently published for the two
Territories. In addition, caution should be exercised in the interpretation of trend
estimates for the two Territories, particularly for the three most recent months, where
revisions may be relatively large.
37 For further information, see A Guide to Interpreting Time Series – Monitoring
Trends (cat. no. 1349.0) or contact the Assistant Director, Time Series Analysis on
(02) 6252 6345 or email [email protected].
SE A S O N A L AD J U S T M E N T AN D
TR E N D ES T I M A T I O N continued
32 A B S • L A B O U R FO R C E • 6 2 0 2 . 0 • F E B 2 0 1 2
E X P L A N A T O R Y N O T E S continued
Technical and Further EducationTAFE
seasonally adjustedSeas adj.
percentage pointspts
part timep/t
Labour Force SurveyLFS
full timef/t
estimated resident populationERP
catalogue numbercat. no.
computer assisted interviewingCAI
Australian Bureau of StatisticsABS
percentage%
thousands'000
DefinitionSymbol
43 SYMBOLS AND ABBREVIATIONSSY M B O L S AN D
AB B R E V I A T I O N S
42 Estimates have been rounded and discrepancies may occur between sums of the
component items and totals. Estimates of movement shown in this publication are
obtained by taking the difference of unrounded estimates. The movement estimate is
then rounded. Where a discrepancy occurs between the reported movement and the
difference of the rounded estimates, the reported movement will be more accurate.
EF F E C T S OF RO U N D I N G
41 As well as the statistics included in this and related publications, the ABS may have
other relevant data available. Inquiries should be made to the Labour Force contact
officer on (02) 6252 6525, email [email protected] or to any ABS office.
DA T A AV A I L A B L E ON
RE Q U E S T
! Australian Labour Market Statistics (cat. no. 6105.0). This publication presents key
indicators of the labour market, articles on a range of labour market issues, and
information about the latest developments in the labour statistics program. For
further information about this publication, please contact Labour Market Statistics
on (02) 6252 7206.
39 ABS Information about the labour market can be found on the Topics @ a Glance
page on the ABS website <http://www.abs.gov.au>.
40 Information about current publications and other products released by the ABS is
available from the statistics page on the ABS website. The ABS also issues a daily release
advice on the website, Upcoming Product Releases, which details products to be
released in the week ahead.
RE L A T E D PU B L I C A T I O N S
continued
A B S • L A B O U R FO R C E • 6 2 0 2 . 0 • F E B 2 0 1 2 33
E X P L A N A T O R Y N O T E S continued
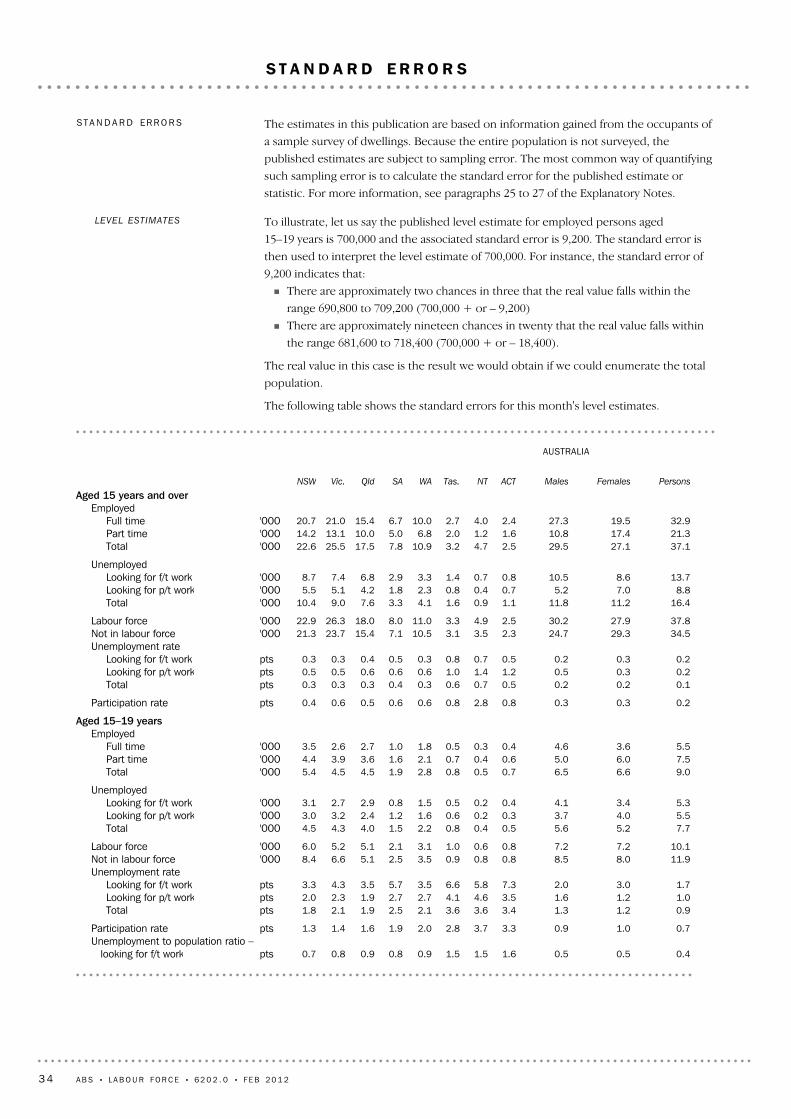
0.40.50.51.61.51.50.90.80.90.80.7ptsUnemployment to population ratio –
looking for f/t work
0.71.00.93.33.72.82.01.91.61.41.3ptsParticipation rate
0.91.21.33.43.63.62.12.51.92.11.8ptsTotal1.01.21.63.54.64.12.72.71.92.32.0ptsLooking for p/t work1.73.02.07.35.86.63.55.73.54.33.3ptsLooking for f/t work
Unemployment rate11.98.08.50.80.80.93.52.55.16.68.4'000Not in labour force10.17.27.20.80.61.03.12.15.15.26.0'000Labour force
7.75.25.60.50.40.82.21.54.04.34.5'000Total5.54.03.70.30.20.61.61.22.43.23.0'000Looking for p/t work5.33.44.10.40.20.51.50.82.92.73.1'000Looking for f/t work
Unemployed
9.06.66.50.70.50.82.81.94.54.55.4'000Total7.56.05.00.60.40.72.11.63.63.94.4'000Part time5.53.64.60.40.30.51.81.02.72.63.5'000Full time
EmployedAged 15–19 years
0.20.30.30.82.80.80.60.60.50.60.4ptsParticipation rate
0.10.20.20.50.70.60.30.40.30.30.3ptsTotal0.20.30.51.21.41.00.60.60.60.50.5ptsLooking for p/t work0.20.30.20.50.70.80.30.50.40.30.3ptsLooking for f/t work
Unemployment rate34.529.324.72.33.53.110.57.115.423.721.3'000Not in labour force37.827.930.22.54.93.311.08.018.026.322.9'000Labour force
16.411.211.81.10.91.64.13.37.69.010.4'000Total8.87.05.20.70.40.82.31.84.25.15.5'000Looking for p/t work
13.78.610.50.80.71.43.32.96.87.48.7'000Looking for f/t workUnemployed
37.127.129.52.54.73.210.97.817.525.522.6'000Total21.317.410.81.61.22.06.85.010.013.114.2'000Part time32.919.527.32.44.02.710.06.715.421.020.7'000Full time
EmployedAged 15 years and over
PersonsFemalesMales
AUSTRALIA
ACTNTTas.WASAQldVic.NSW
To illustrate, let us say the published level estimate for employed persons aged
15–19 years is 700,000 and the associated standard error is 9,200. The standard error is
then used to interpret the level estimate of 700,000. For instance, the standard error of
9,200 indicates that:
! There are approximately two chances in three that the real value falls within the
range 690,800 to 709,200 (700,000 + or – 9,200)
! There are approximately nineteen chances in twenty that the real value falls within
the range 681,600 to 718,400 (700,000 + or – 18,400).
The real value in this case is the result we would obtain if we could enumerate the total
population.
The following table shows the standard errors for this month's level estimates.
LEVEL ESTIMATES
The estimates in this publication are based on information gained from the occupants of
a sample survey of dwellings. Because the entire population is not surveyed, the
published estimates are subject to sampling error. The most common way of quantifying
such sampling error is to calculate the standard error for the published estimate or
statistic. For more information, see paragraphs 25 to 27 of the Explanatory Notes.
ST A N D A R D ER R O R S
34 A B S • L A B O U R FO R C E • 6 2 0 2 . 0 • F E B 2 0 1 2
S T A N D A R D E R R O R S
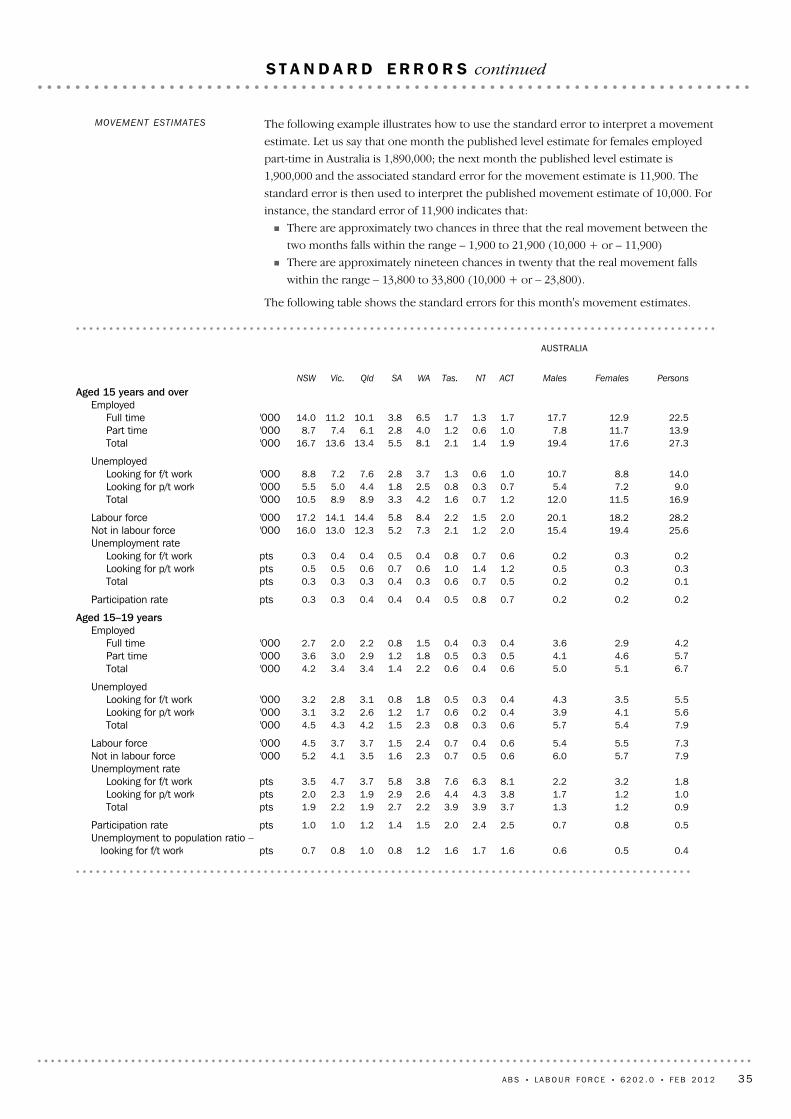
0.40.50.61.61.71.61.20.81.00.80.7ptsUnemployment to population ratio –
looking for f/t work
0.50.80.72.52.42.01.51.41.21.01.0ptsParticipation rate
0.91.21.33.73.93.92.22.71.92.21.9ptsTotal1.01.21.73.84.34.42.62.91.92.32.0ptsLooking for p/t work1.83.22.28.16.37.63.85.83.74.73.5ptsLooking for f/t work
Unemployment rate7.95.76.00.60.50.72.31.63.54.15.2'000Not in labour force7.35.55.40.60.40.72.41.53.73.74.5'000Labour force
7.95.45.70.60.30.82.31.54.24.34.5'000Total5.64.13.90.40.20.61.71.22.63.23.1'000Looking for p/t work5.53.54.30.40.30.51.80.83.12.83.2'000Looking for f/t work
Unemployed
6.75.15.00.60.40.62.21.43.43.44.2'000Total5.74.64.10.50.30.51.81.22.93.03.6'000Part time4.22.93.60.40.30.41.50.82.22.02.7'000Full time
EmployedAged 15–19 years
0.20.20.20.70.80.50.40.40.40.30.3ptsParticipation rate
0.10.20.20.50.70.60.30.40.30.30.3ptsTotal0.30.30.51.21.41.00.60.70.60.50.5ptsLooking for p/t work0.20.30.20.60.70.80.40.50.40.40.3ptsLooking for f/t work
Unemployment rate25.619.415.42.01.22.17.35.212.313.016.0'000Not in labour force28.218.220.12.01.52.28.45.814.414.117.2'000Labour force
16.911.512.01.20.71.64.23.38.98.910.5'000Total9.07.25.40.70.30.82.51.84.45.05.5'000Looking for p/t work
14.08.810.71.00.61.33.72.87.67.28.8'000Looking for f/t workUnemployed
27.317.619.41.91.42.18.15.513.413.616.7'000Total13.911.77.81.00.61.24.02.86.17.48.7'000Part time22.512.917.71.71.31.76.53.810.111.214.0'000Full time
EmployedAged 15 years and over
PersonsFemalesMales
AUSTRALIA
ACTNTTas.WASAQldVic.NSW
The following example illustrates how to use the standard error to interpret a movement
estimate. Let us say that one month the published level estimate for females employed
part-time in Australia is 1,890,000; the next month the published level estimate is
1,900,000 and the associated standard error for the movement estimate is 11,900. The
standard error is then used to interpret the published movement estimate of 10,000. For
instance, the standard error of 11,900 indicates that:
! There are approximately two chances in three that the real movement between the
two months falls within the range – 1,900 to 21,900 (10,000 + or – 11,900)
! There are approximately nineteen chances in twenty that the real movement falls
within the range – 13,800 to 33,800 (10,000 + or – 23,800).
The following table shows the standard errors for this month's movement estimates.
MOVEMENT ESTIMATES
A B S • L A B O U R FO R C E • 6 2 0 2 . 0 • F E B 2 0 1 2 35
S T A N D A R D E R R O R S continued
The estimation methodology used in the Labour Force Survey. Composite Estimationuses sample responses from nearby months as well as from the reference month toderive estimates for the reference month. This approach achieves gains in efficiency byexploiting the high similarity between the responses provided by the same respondent in
Composite Estimation
All usual residents of Australia aged 15 years and over except members of the permanentdefence forces, certain diplomatic personnel of overseas governments customarilyexcluded from census and estimated population counts, overseas residents in Australia,and members of non-Australian defence forces (and their dependants) stationed inAustralia.
Civilian population aged 15years and over
Persons aged 15–24 years enrolled full time at a TAFE college, university, or othereducational institution in the reference week, except those persons aged 15–19 yearswho were still attending school.
Attending tertiary educationalinstitution full time
Persons aged 15–19 years enrolled at secondary or high school in the reference week.Attending school
Persons aged 15–24 years enrolled at secondary or high school or enrolled as a full timestudent at a Technical and Further Education (TAFE) college, university, or othereducational institution in the reference week.
Attending full time education
Aggregate monthly hours worked measures the total number of actual hours worked byemployed persons in a calendar month. It differs from the actual hours worked estimates(and the usual hours worked estimates) since these refer only to the hours worked inthe reference week.
The methodology used to produce aggregate monthly hours worked means that theseare synthetic estimates. Seasonally adjusted and trend estimates of aggregate monthlyhours worked are available for the period July 1978 onwards.
Further information on the methodology used to produce the aggregate monthly hoursworked estimates is available on the ABS website in Information Paper: Expansion ofHours Worked Estimates from the Labour Force Survey (cat. no. 6290.0.55.001).
Actual and usual hours worked cannot be aggregated across time to produce eitherquarterly or annual estimates as they relate to only a single week in the month. Incontrast, aggregate monthly hours worked estimates are a true monthly measure, andmay be aggregated across time to produce both quarterly and annual estimates.
Aggregate monthly hoursworked
Actual hours of work refers to a specified reference period and includes:! hours actually worked during normal periods of work;! time spent in addition to hours worked during normal periods of work (including
overtime);! time spent at the place of work on activities such as the preparation of the workplace,
repairs and maintenance, preparation and cleaning of tools, and the preparation ofreceipts, time sheets and reports;
! time spent at the place of work waiting or standing by; and! time corresponding to short rest periods.
Excluded are:! hours paid for but not worked, such as paid annual leave, public holidays or paid sick
leave;! meal breaks; and! time spent on travel to and from work (excluding some self-employed).
For multiple job holders actual hours worked should equal the hours worked at all jobs.
Actual hours of work
Includes writing, telephoning or applying to an employer for work; answering anadvertisement for a job; checking noticeboards; being registered with Centrelink as ajobseeker; checking or registering with any other employment agency; advertising ortendering for work; and contacting friends or relatives.
Actively looking for work
36 A B S • L A B O U R FO R C E • 6 2 0 2 . 0 • F E B 2 0 1 2
G L O S S A R Y
For any group, persons who were employed or unemployed, as defined.Labour force
The matching of respondents who report in consecutive months enables analysis of thetransition of individuals between the different labour force status classifications, referredto as the matched sample. The transition counts between the different labour forcestatus classifications from one point in time to the next are commonly referred to asgross flows.
The figures presented in gross flows are presented in original terms only and do notalign with published labour force estimates. The gross flows figures are derived from thematched sample between consecutive months, which after taking account of the samplerotation and varying non-response in each month is approximately 80 percent of thesample.
Caution should be exercised when analysing these gross flows data due to:! the figures presented sum to approximately 80 percent of the population values as the
gross flows data are based on the matched sample only;! there is no adjustment applied to account for changes due to seasonal patterns
(referred to commonly as seasonal adjustment); and! the estimates of relative sizes of each transition class are subject to bias due to the
matched sample being a non-representative sample.
Gross flows
Employed persons who usually worked 35 hours or more a week (in all jobs) and thosewho, although usually working fewer than 35 hours a week, worked 35 hours or moreduring the reference week.
Full time workers
Flow estimates are a measure of activity over a given period. For example, aggregatemonthly hours worked is a measure of the total number of hours worked in a calendarmonth.
Flow estimates
Estimated resident population (ERP), is Australia's official measure of the population ofAustralia and is based on the concept of usual residence. It refers to all people,regardless of nationality, citizenship or legal status, who usually live in Australia, with theexception of foreign diplomatic personnel and their families. It includes usual residentswho are overseas for fewer than 12 months. It excludes overseas visitors who are inAustralia for fewer than 12 months. Refer to Australian Demographic Statistics(cat. no. 3101.0).
Estimated resident population(ERP)
For any group, the number of employed persons expressed as a percentage of thecivilian population in the same group.
Employment to populationratio
All persons aged 15 years and over who, during the reference week:! worked for one hour or more for pay, profit, commission or payment in kind in a job
or business, or on a farm (comprising employees, employers and own accountworkers); or
! worked for one hour or more without pay in a family business or on a farm(i.e. contributing family workers); or
! were employees who had a job but were not at work and were:! away from work for fewer than four weeks up to the end of the reference week; or
! away from work for more than four weeks up to the end of the reference week and
received pay for some or all of the four week period to the end of the reference
week; or
! away from work as a standard work or shift arrangement; or
! on strike or locked out; or
! on workers' compensation and expected to return to their job; or
! were employers or own account workers, who had a job, business or farm, but werenot at work.
Employed
previous months. For details see Information Paper: Forthcoming Changes to LabourForce Statistics, 2007 (cat. no. 6292.0).
A B S • L A B O U R FO R C E • 6 2 0 2 . 0 • F E B 2 0 1 2 37
G L O S S A R Y continued
Employed persons aged 15 years and over who want, and are available for, more hours ofwork than they currently have. They comprise:! persons employed part time who want to work more hours and are available to start
work with more hours, either in the reference week or in the four weeks subsequentto the survey; or
! persons employed full time who worked part time hours in the reference week foreconomic reasons (such as being stood down or insufficient work being available). Itis assumed that these people wanted to work full time in the reference week andwould have been available to do so.
Underemployed workers
The number of underemployed workers expressed as a percentage of the labour force.Underemployment rate
A smoothed seasonally adjusted series of estimates. See Explanatory Notes 34 to 37 formore detail.
Trend series
Stock estimates are a measure of certain attributes at a point in time and can be thoughtof as stocktakes. For example, the total number of employed persons is an account ofthe number of people who were considered employed in the Labour Force Surveyreference week.
Stock estimates
A time series of estimates with the estimated effects of normal seasonal variationremoved. See Explanatory Notes 29 to 33 for more detail.
Seasonally adjusted series
The number of fully responding dwellings expressed as a percentage of the total numberof dwellings excluding sample loss. Examples of sample loss include: dwellings where allpersons are out of scope and/or coverage; vacant dwellings; dwellings underconstruction; dwellings converted to non-dwellings; derelict dwellings; and demolisheddwellings.
Response rate
Employed persons who usually worked fewer than 35 hours a week (in all jobs) andeither did so during the reference week or were not at work during the reference week.
Part time workers
For any group, the labour force expressed as a percentage of the civilian population aged15 years and over in the same group.
Participation rate
Persons who were not in the categories employed or unemployed, as defined.Not in labour force
The non-market sector is an industry grouping comprising the following industries:Education and training; Public administration & safety; and Health care and socialassistance. Refer to Australian National Accounts: Concepts, Sources and Methods (cat. no. 5216.0).
Non-market Sector
The market sector is an industry grouping comprising the following industries:Agriculture, forestry and fishing; Mining; Manufacturing; Electricity, gas, water and wasteservices; Construction; Wholesale trade; Retail trade; Accommodation and food services;Transport, postal and warehousing; Information media and telecommunications; Financeand insurance services; Rental, hiring and real estate services; Professional, scientific andtechnical services; Administrative and support services; Arts and recreation services; andOther services. Refer to Australian National Accounts: Concepts, Sources and Methods(cat. no. 5216.0).
Market sector
The number of long-term unemployed persons, expressed as a percentage of the totalunemployed population.
Long-term unemploymentratio
The number of persons unemployed for 52 weeks or over.Long-term unemployed
The sum of the number of persons unemployed and the number of persons inunderemployment, expressed as a proportion of the labour force.
Labour force underutilisationrate
A classification of the civilian population aged 15 years and over into employed,unemployed or not in the labour force, as defined. The definitions conform closely tothe international standard definitions adopted by the International Conferences ofLabour Statisticians.
Labour force status
38 A B S • L A B O U R FO R C E • 6 2 0 2 . 0 • F E B 2 0 1 2
G L O S S A R Y continued
Usual hours of work refers to a typical period rather than to a specified reference period.The concept of usual hours applies both to persons at work and to persons temporarilyabsent from work, and is defined as the hours worked during a typical week or day.Actual hours worked (for a specific reference period) may differ from usual hoursworked due to illness, vacation, strike, overtime work, a change of job, or similarreasons.
Usual hours of work
For any group, the number of unemployed persons expressed as a percentage of thecivilian population in the same group.
Unemployment to populationratio
For any group, the number of unemployed persons expressed as a percentage of thelabour force in the same group.
Unemployment rate
Unemployed persons who:! actively looked for part time work only; or! were waiting to start a new part time job.
Unemployed looking for parttime work
Unemployed persons who:! actively looked for full time work; or! were waiting to start a new full time job.
Unemployed looking for fulltime work
Persons aged 15 years and over who were not employed during the reference week, and:! had actively looked for full time or part time work at any time in the four weeks up to
the end of the reference week and were available for work in the reference week; or! were waiting to start a new job within four weeks from the end of the reference week
and could have started in the reference week if the job had been available then.
Unemployed
A B S • L A B O U R FO R C E • 6 2 0 2 . 0 • F E B 2 0 1 2 39
G L O S S A R Y continued
www.abs.gov.auWEB ADDRESS
All statistics on the ABS website can be downloaded freeof charge.
F R E E A C C E S S T O S T A T I S T I C S
Client Services, ABS, GPO Box 796, Sydney NSW 2001POST
1300 135 211FAX
1300 135 070PHONE
Our consultants can help you access the full range ofinformation published by the ABS that is available free ofcharge from our website. Information tailored to yourneeds can also be requested as a 'user pays' service.Specialists are on hand to help you with analytical ormethodological advice.
I N F O R M A T I O N A N D R E F E R R A L S E R V I C E
www.abs.gov.au the ABS website is the best place fordata from our publications and information about the ABS.
INTERNET
F O R M O R E I N F O R M A T I O N . . .
© Commonwealth of Australia 2012Produced by the Australian Bureau of Statistics
62
02
.0
•
LA
BO
UR
F
OR
CE
, A
US
TR
AL
IA
•
Fe
br
ua
ry
20
12