Embed Size (px)
Citation preview
February 2012
MTA2012 Adopted Budget
February Financial Plan2012 – 2015
DJC
Metropolitan Transportation Authority
TABLE OF CONTENTS
I. Overview.................................................................................................................. I-1
II. MTA Consolidated 2012-2015 Financial Plan 2012: Where the Dollars come From and Where the Dollars Go……………….. II-1
2011-2015 Financial Plan: Statement of Operations……………………………... II-3
2011-2015 Reconciliation to December Plan………………………………………. II-8
Farebox Operating and Recovery Ratios…………………………………………… II-9
III. Major Assumptions 2011-2015 Projections Utilization (Revenue, Ridership, Vehicle Traffic…………………………………….. III-1
Subsidies………………………………………………………………………………... III-3
Debt Service……………………………………………………………………………. III-21
Debt Service Affordability Statement………………………………………………… III-26
Positions (Headcount)…………………………………………………………………. III-29
IV. Other MTA Consolidated Materials 2011-2015 Consolidated Statements of Operations
(Accrued (Non-Reimbursable and Reimbursable), Cash)………………………..... IV-1
Cash Conversion Detail……………………………………………………………….. IV-5
Year-to-Year Changes by Category………………………………………………...... IV-6
Non-Recurring Revenues and Savings, and MTA Reserves………………………. IV-7
Consolidated 12-Month Allocation – Financials, Overtime, and Positions……….. IV-9
V. MTA Capital Program Information 2012 Commitments Goal and 2012 Commitment Summary by Agency………… V-1
2012-2015 Completions by Agency………………………………………………….. V-16
Operating Impacts Exceeding $1 Million……………………………………………. V-33

VI. Agency Financial Plans and 12-Month Allocations Bridges and Tunnels…………………………………………………………………… VI-1
Capital Construction Company……………………………………………………..... VI-25
Long Island Bus………………………………………………………………………... VI-39
Long Island Rail Road………………………………………………………………… VI-51
Metro-North Railroad………………………………………………………………….. VI-79
MTA Headquarters and Inspector General………………………………………….. VI-107
First Mutual Transportation Assurance Co. (FMTAC)……………………………… VI-141
New York City Transit…………………………………………………………………. VI-151
MTA Bus Company……………………………………………………………………. VI-179
Staten Island Railroad………………………………………………………………… VI-207
VII. Appendix MTA Consolidated 2012 Budget Staff Summary…………………………………… VII-1
Chairman and Chief Executive Officer Certification………………………………... VII-11
VIII. Other The MTA Budget Process……………………………………………………………... VIII-1

l. Overview

OVERVIEW This document includes the 2012 Adopted Budget and the 2012-2015 Financial Plan. The purpose of the February Financial Plan is to incorporate Board approved actions and technical adjustments into the Agencies’ November Financial Plan budgets and forecasts, and to establish a 12-month allocation of the Adopted Budget. In order to highlight certain important items that are included within the November and December Financial Plans, the MTA lists them separately below-the-baseline. With Board approval secured, these items, also referred to as MTA Plan Adjustments, can be included within the MTA baseline and appropriately allocated to the Agencies. The December Plan also captured re-estimates of fuel and electric power expenses that were derived after Agency baseline forecasts were closed. As a result, they were not allocated to specific Agencies but rather were included within consolidated totals. These adjustments are now incorporated into Agency baseline forecasts. Unlike the July and November Plans, the February Plan does not include any new proposals. As such, the detailed explanations of the programs and assumptions supporting this Plan can be found in the November and December 2011 Financial Plan material, which are posted on the MTA website (www.mta.info). This document includes all relevant financial tables and reconciliations. It also contains schedules detailing the 12-month allocation of the 2012 Adopted Budget, which will be compared with actual results. Variances will be analyzed and reported to the Board committees on a monthly basis. The budget process gives the Agencies the opportunity to make technical adjustments to their budgets and forecasts which will result in improved reporting. This Plan reflects some technical adjustments including the impact of a revised Chart of Accounts. Effective 2012, the account structure has been adjusted to reflect the reclassification and renaming of certain accounts in order to improve reporting consistency among the Agencies. In order to maintain comparability with 2011 actual results for year-end reporting purposes, the 2011 account structure remains unchanged, however, years 2012-2015 reflect the new account structure. Each Agency has provided, within its own section, a table entitled “Reconciliation of the 2012 Final Proposed Budget to the 2012 Adopted Budget by Generic Category” that details the re-categorizations as well as all other technical adjustments occurring in 2012. For 2012 and beyond, the Plan excludes LI Bus from all budget forecasts of MTA revenue, expenses and subsidies. That service is now operated by a private contractor on behalf of Nassau County. MTA will seek reimbursement for costs beyond 2011 to finish the “wind-down” of MTA operations and future payments for employee and other liabilities from Nassau County based upon the terms of the Lease and Operating Agreement between the County and the MTA. The December Plan captured below-the-baseline reductions in New York State MMTOA subsidies and the lower Payroll Mobility Tax (PMT) subsidies that were included in

legislation passed in December 2011 (the “December Act.”) As part of that December legislation, the State included replacement funds to offset the estimated reduction in PMT revenues. These changes are now included within MTA baseline subsidy forecasts. The proposed 2013 fare and toll increase, which has yet to be acted on by the Board, remains below the line. As the 2013 budget process progresses, this and other proposals, as well as Agency targeted spending levels, will be assessed. The Preliminary 2013 Budget will be presented to the Board at the July 2012 meeting. The Final Proposed Budget for 2013 will be presented to the Board in November and submitted for adoption in December 2012. This process enables the public and elected officials to comment on the proposals before the anticipated Board action in December. The February Plan projects ending cash balances of $192 million in 2011, $1 million in 2012 and $80 million in 2013 with projected cash deficits of $137 million in 2014 and $204 million in 2015. These represent very minor changes from the December Board approved Plan and a reconciliation of the change can be found in Section II. The implementation of technical changes results in the need to increase the amount of the Unspecified Deficit Reduction to $40 million from $35 million. The following details how the February Plan captures MTA Plan Adjustments that were captured below-the-baseline in December: Agency Baselines now include the MTA Plan Adjustments listed below: MTA INITIATIVES (captured in baseline)
New MTA Efficiencies – MTA increased efficiency targets last July and in November significantly reduced the portion of those targets that remained unidentified. MTA will continue to implement and pursue new opportunities that will not just deliver existing services more efficiently, but will also create savings that can be reinvested for improved reliability and service to our customers. This MTA–wide initiative encompasses consolidations, improved management of IT systems and reduced costs for inventory purchases. As of this February Financial Plan, Agencies have incorporated $117 million in new efficiency savings into their baselines. By 2015, existing and new cost reduction initiatives will grow those efficiency savings in excess of $260 million annually.
An assessment of current Information Technology (IT) functions resulted in changes to operations in a number of IT areas yielding cost savings, primarily associated with the collection, deactivation, consolidation and standardization of IT equipment, services and applications. Some $7 million per year in savings were specifically linked to individual Agencies and are now included within their forecasts.
Three-Zeroes Salary/Wage Initiative – This Financial Plan assumes that labor settlements will include three years of “net zero” wage growth. Those wage

savings are in line with the contract agreements reached by the State and its two largest unions, the CSEA and PEF. For non-represented employees, 2011 became the third year without a cost-of-living adjustment increase. Savings incorporated into the baseline were $15 million in 2011, $26 million in 2012, $35 million in 2013, $83 million in 2014, and $95 million in 2015.
Accelerate 3 Zeroes – Additional salary/wage savings of $11 million in 2011, $25 million in 2012, $27 million in 2013, $24 million in 2014, and $15 million in 2015 are from the impact of the acceleration of the three-year “net zero” savings initiative.
MTA RE-ESTIMATES (captured in baseline) These updated forecasts were approved by the Board in December as below-the-baseline items and are now captured within the baseline of the February Financial Plan:
Continuing Energy Hedge Program – Consistent with Board approval, the MTA has set aside $100 million to collateralize fuel hedge agreements as a measure of protection should prices rise significantly above projections.
MTA changed its estimate of State operating aid to MTA from Metropolitan Mass Transportation Operating Assistance (“MMTOA”) by $87 million in 2012 based upon information provided by the State Division of the Budget. For 2013 through 2015, revised MMTOA estimates, when compared with the November Plan, are unfavorable by $58 million, $45 million and $47 million, respectively. The downward revisions are attributable to lower revenues, updated allocation projections and an increase in the amount that NYS will reserve (and therefore, not pay out) to hedge against economic risks.
MTA Aid – These taxes trended favorably most of 2011 and at the end of the year were running approximately $13 million favorable. Based on discussions with NYSDOB, $7 million of this favorable variance is expected to recur.
Payroll Mobility Tax (PMT) – In late 2011, Governor Cuomo signed into law the “December Act” that makes significant changes to the Payroll Mobility Tax. The provisions eliminated or reduced the payroll mobility tax imposed within the MTA Commuter Transportation District for certain taxpayers. It further expressly provides that any reductions in transit aid attributable to these reductions in the PMT “shall be offset through alternative sources that will be included in the state budget.” Consequently, the February Plan sustains net PMT subsidy levels.
POLICY ACTIONS (captured in baseline)
General Reserve – The Plan reflects the elimination of the remaining general reserve of $8 million in 2011, and lowers the reserve by $25 million to partially cover the MMTOA shortfall. Starting in 2013, the general reserve is resumed at

an amount equal to approximately one-percent (1%) of the baseline operating budget.
The following MTA Plan Adjustments remain below-the-baseline: FARE/TOLL INCREASES (below-the-baseline)
A key assumption in the Plan is the continuation of the Board policy that provides for modest bi-annual fare and toll increases designed to keep-up with normal inflationary growth.
2013 Increased Fare and Toll Yields – Remaining below-the-baseline is a 7.5% consolidated farebox and toll revenue yield increase proposed for implementation on January 1, 2013. This increase is estimated to yield an additional $449 million in 2013, $466 million in 2014, and $472 million in 2015 excluding yield increases for MTA Bus. The 7.5% farebox yield increase at MTA Bus is expected to generate additional revenue of $14 million from 2013 through 2015 over the duration of the Plan.
2015 Increased Fare and Toll Yields – Also remaining below-the-baseline is a 7.5% consolidated farebox and toll revenue yield increase proposed for implementation on January 1, 2015. This increase is estimated to yield an additional $494 million in 2015 excluding yield increases for MTA Bus. The 7.5% farebox yield increase at MTA Bus is expected to generate additional revenue of $15 million in 2015.
POLICY ACTIONS (below-the-baseline) The following policy action will remain below-the-baseline and is described below:
Unspecified Deficit Reduction – In order to eliminate the remaining 2012 shortfall and to offset the net subsidy reduction in the out-years, the MTA will implement $40 million in recurring deficit reduction measures that currently are unspecified. These measures will be identified in 2012 and incorporated into the July 2012 Financial Plan. This represents a $5 million annual increase from December necessary to retain budgetary balance.
MTA INITIATIVES (below-the-baseline)
The following MTA Initiative will remain below-the-baseline and are described below:
New MTA Efficiencies – Of the New MTA Efficiencies described earlier, some $23 million remains to be identified of the $140 million in efficiency savings established for 2012. Further consolidations, including Strategic Sourcing, are under review and will continue to occur throughout the year and contribute to meeting the out-year MTA Efficiency targets. Unidentified savings for 2013 -2015 are $84 million, $76 million and $70 million, respectively.

Metrocard Green Fee and Cost Savings – The MTA prints 170 million MetroCards each year at an annual cost of nearly $13 million. Many of these cards are used once and then discarded, often ending up as litter in the system. To overcome this waste by encouraging customers to re-use their MetroCards, MTA is implementing a $1.00 “green” fee for each new MetroCard bought in the subway system, where it is just as easy to refill a card as to get a new one. The estimated financial impact is a combination of additional revenue from the fee and lower costs from producing fewer cards. Furthermore, MTA is exploring a new fare payment system involving tap-n-go technology, which is also expected to generate savings.

[THIS PAGE INTENTIONALLY LEFT BLANK]

II. MTA Consolidated 2012-2015 Financial Plan

Farebox Revenue $5,050Toll Revenue 1,510Other Revenue 525Dedicated Taxes 4,414State & Local Subsidies 1,002
Total $12,501
Payroll $4,202 NYCT/SIR $6,729Overtime 460 MTABC 529Health & Welfare 1,297 HQ/FMTAC 363Pensions 1,303 LIRR 1,281Other Labor 181 MNR 1,043Non-Labor 2,942 B&T 406Debt Service 2,129 Debt Service 2,129
Total $12,515 MTA Reserve 100MTA Below-the-Line Adjustments 4 -63
Total $12,515
($ in millions) ($ in millions)
Expenses exclude Depreciation, OPEB obligation and Environmental Remediation.
1 The generic expense categories and totals include below-the-line adjustments that are not included in the baseline plan.2 LI Bus operations ceased on December 31, 2011.3 MTA Capital Construction is not included in the above charts, as its budget contains reimbursable expenses only.4 The below-the-line adjustments have not been allocated to specific Agencies as yet.
includes below-the-line adjustments includes below-the-line adjustments
By Revenue Source($ in millions)
Where the Dollars Go …
By Expense Category 1 By MTA Agency 2 3
Where the Dollars Come From …
MTA 2012 Adopted BudgetBaseline Expenses After Below-the-Line Adjustments 1
Non-Reimbursable
Farebox Revenue
41%
Toll Revenue
12%
Other Revenue
4%
Dedicated Taxes35%
State & Local Subsidies
8%
Payroll34%
Overtime4%
Health & Welfare
10%Pensions10%
Other Labor2%
Non-Labor24%
Debt Service17%
By Expense Category
NYCT/SIR54%
MTABC4%
HQ/FMTAC3%
LIRR10%
MNR8%
B&T3%
Debt Service17%
MTA Reserve/Other
1%
By MTA Agency

[THIS PAGE INTENTIONALLY LEFT BLANK]

Line
No.
7 Non-Reimbursable 2011 2012
8 2010 Final Adopted
9 Actual 1 Estimate Budget 2013 2014 2015 10 Operating Revenue11 Farebox Revenue $4,586 $4,991 $5,050 $5,122 $5,208 $5,28612 Toll Revenue 1,417 1,499 1,510 1,508 1,514 1,520 13 Other Revenue 491 496 525 551 589 630 14 Capital and Other Reimbursements 0 0 0 0 0 015 Total Operating Revenue $6,495 $6,986 $7,085 $7,181 $7,311 $7,437
16
17 Operating Expense
18 Labor Expenses:19 Payroll 1 $4,171 $4,184 $4,202 $4,208 $4,263 $4,36320 Overtime 1 443 519 460 455 457 46521 Health & Welfare 738 775 863 938 1,026 1,12222 OPEB Current Payment 356 390 435 484 530 58123 Pensions 1,030 1,090 1,303 1,316 1,366 1,42524 Other-Fringe Benefits 540 483 511 519 532 54725 Reimbursable Overhead (345) (329) (330) (312) (310) (303)26 Sub-total Labor Expenses $6,933 $7,113 $7,444 $7,609 $7,864 $8,20127
28 Non-Labor Expenses:
29 Electric Power $325 $337 $513 $570 $635 $70630 Fuel 190 246 276 291 293 30231 Insurance 10 15 23 33 46 5632 Claims 285 232 205 210 221 23333 Paratransit Service Contracts 380 356 404 468 550 63734 Maintenance and Other Operating Contracts 542 612 534 532 543 58235 Professional Service Contracts 203 187 270 265 269 27436 Materials & Supplies 511 524 491 512 528 58037 Other Business Expenses 190 170 154 158 160 16338 Sub-total Non-Labor Expenses $2,636 $2,680 $2,870 $3,039 $3,246 $3,53239
40 Other Expense Adjustments:41 Other ($18) $7 $36 $34 $35 $3542 General Reserve 0 0 100 130 135 14543 Sub-total Other Expense Adjustments ($18) $7 $136 $164 $170 $18044
45 Total Operating Expense before Non-Cash Liability Adj. $9,550 $9,800 $10,449 $10,813 $11,279 $11,913
46
47 Depreciation $1,981 $2,077 $2,179 $2,245 $2,325 $2,42048 OPEB Obligation 1,167 1,241 1,256 1,281 1,306 1,33849 Environmental Remediation 19 9 9 9 9 950
51 Total Operating Expense after Non-Cash Liability Adj. $12,717 $13,127 $13,893 $14,348 $14,919 $15,681
52
53 Net Deficit Before Subsidies and Debt Service ($6,222) ($6,141) ($6,808) ($7,167) ($7,609) ($8,245)
54
55 Conversion to Cash Basis: Non-Cash Liability Adjs. $3,166 $3,326 $3,444 $3,535 $3,640 $3,76856
57 Debt Service (excludes Service Contract Bonds) (1,781) (1,949) (2,129) (2,271) (2,418) (2,555)58
59 Total Operating Expense with Debt Service $11,332 $11,749 $12,578 $13,084 $13,698 $14,469
60
61 Dedicated Taxes and State/Local Subsidies $4,914 $5,258 $5,415 $5,717 $5,974 $6,19762
63 Net Deficit After Subsidies and Debt Service $77 $495 ($78) ($186) ($413) ($835)
64
65 Conversion to Cash Basis: GASB Account (67) (39) (57) (61) (64) (66)66 Conversion to Cash Basis: All Other 20 (423) (120) (268) (342) (399)
67
68 CASH BALANCE BEFORE PRIOR-YEAR CARRY-OVER $30 $32 ($254) ($515) ($819) ($1,300)
69 ADJUSTMENTS 0 0 63 594 602 1,096
70 PRIOR-YEAR CARRY-OVER 130 160 192 1 80 0
71 NET CASH BALANCE $160 $192 $1 $80 ($137) ($204)
1
METROPOLITAN TRANSPORTATION AUTHORITYFebruary Financial Plan 2012-2015
MTA Consolidated Statement Of Operations By Category($ in millions)
In order to establish consistency among Agencies when reporting overtime results, certain overtime-related expenses that had been captured within payroll (straight-time) were shifted to the overtime category beginning in 2011. However, the 2010 Actual results do not reflect the change. The result would have been a zero-sum shift of approximately $48 million from payroll to overtime, making the 2010 Actual for Overtime $491 million and Payroll $4,121 million.
Note: The February Plan also reflects the impact of a revised Chart of Accounts. Effective 2012, the account structure has been adjusted to reflect the reclassification and renaming of certain accounts in order to improve reporting consistency among the Agencies. With exception of MTAHQ, these revisions result in a zero-impact to the bottom line. See Agency sections for the Reconciliation to the November Forecast by Generic Category table for details.

Line
No. 2011 2012
7 2010 Final Adopted
8 Actual Estimate Budget 2013 2014 2015
9
10 Cash Balance Before Prior-Year Carry-over $30 $32 ($254) ($515) ($819) ($1,300)
11
12 Fare/Toll Increases:13 Fare/Toll Yields on 1/1/13: 7.5% 0 449 466 47214 Fare/Toll Yields on 1/1/15: 7.5% 0 0 0 494
15 Sub-Total $0 $449 $466 $96616
17 MTA Initiatives:18 New MTA Efficiencies 23 85 76 7019 MetroCard Green Fee and Cost Savings 0 20 20 20
20 Sub-Total $23 $105 $96 $9021
22 Policy Actions23 40 40 40 40
24 Sub-Total $40 $40 $40 $4025
26 TOTAL ADJUSTMENTS $63 $594 $602 $1,09627
28 Prior-Year Carry-Over 130 160 192 1 80 029
30 Net Cash Surplus/(Deficit) $160 $192 $1 $80 ($137) ($204)
Unspecified Deficit Reduction
($ in millions)
METROPOLITAN TRANSPORTATION AUTHORITYFebruary Financial Plan 2012-2015
Plan Adjustments

Line
No 2011 2012
7 2010 Final Adopted
8 Actual Estimate Budget 2013 2014 2015
9 Total Operating Revenue10 New York City Transit $3,602 $3,930 $4,030 $4,101 $4,190 $4,28111 Bridges and Tunnels 1,433 1,513 1,525 1,523 1,528 1,53412 Metro-North Railroad 574 611 633 656 681 70013 Long Island Rail Road 558 601 611 614 619 62514 MTA Bus Company 190 196 199 201 204 20615 MTA Headquarters 57 56 57 57 58 5916 Long Island Bus 45 48 0 0 0 017 Staten Island Railway 7 8 8 8 8 818 First Mutual Transportation Assurance Company 30 22 22 22 23 2319 Total $6,495 $6,986 $7,085 $7,181 $7,311 $7,437
2021 Total Operating Expenses before Non-Cash Liability Adjs. 1
22 New York City Transit $6,155 $6,249 $6,688 $6,950 $7,255 $7,67023 Bridges and Tunnels 383 378 406 415 445 47624 Metro-North Railroad 920 991 1,043 1,071 1,108 1,15225 Long Island Rail Road 1,131 1,187 1,281 1,302 1,371 1,45226 MTA Bus Company 501 518 529 534 549 58827 MTA Headquarters 308 322 337 347 356 37728 Long Island Bus 132 126 0 0 0 029 Staten Island Railway 38 34 41 40 41 4330 First Mutual Transportation Assurance Company 1 (12) (10) (11) (16) (25)31 Other (20) 7 136 164 170 18032 Total $9,550 $9,800 $10,449 $10,813 $11,279 $11,91333
34 Depreciation35 New York City Transit $1,290 $1,370 $1,445 $1,520 $1,595 $1,67036 Bridges and Tunnels 78 86 90 94 104 11237 Metro-North Railroad 219 215 236 241 245 25138 Long Island Rail Road 319 315 317 309 298 30739 MTA Bus Company 40 42 42 42 42 4240 MTA Headquarters 25 41 40 30 30 3041 Long Island Bus 0 0 0 0 0 042 Staten Island Railway 9 9 9 9 9 943 First Mutual Transportation Assurance Company 0 0 0 0 0 044 Total $1,981 $2,077 $2,179 $2,245 $2,325 $2,420
4546 Other Post Employment Benefits47 New York City Transit $881 $919 $930 $944 $963 $98048 Bridges and Tunnels 55 57 59 63 60 6649 Metro-North Railroad 46 56 60 61 62 6450 Long Island Rail Road 65 75 77 80 82 8451 MTA Bus Company 52 55 55 56 57 5852 MTA Headquarters 58 67 71 75 79 8453 Long Island Bus 9 9 0 0 0 054 Staten Island Railway 2 3 3 3 3 355 Total $1,167 $1,241 $1,256 $1,281 $1,306 $1,338
5657 Environmental Remediation58 New York City Transit $11 $0 $0 $0 $0 $059 Bridges and Tunnels 0 0 0 0 0 060 Metro-North Railroad 4 7 7 7 7 761 Long Island Rail Road (0) 2 2 2 2 262 MTA Bus Company 4 0 0 0 0 063 Staten Island Railway 0 0 0 0 0 064 Total $19 $9 $9 $9 $9 $9
6566 Net Operating Income/(Deficit)67 New York City Transit ($4,735) ($4,607) ($5,033) ($5,313) ($5,623) ($6,038)68 Bridges and Tunnels 917 993 970 951 918 88169 Metro-North Railroad (615) (658) (712) (724) (742) (774)70 Long Island Rail Road (957) (977) (1,066) (1,079) (1,134) (1,221)71 MTA Bus Company (408) (419) (427) (432) (445) (482)72 MTA Headquarters (334) (373) (391) (395) (407) (432)73 Long Island Bus (95) (87) 0 0 0 074 Staten Island Railway (42) (39) (45) (44) (45) (47)75 First Mutual Transportation Assurance Company 29 33 32 33 39 4976 Other 20 (7) (136) (164) (170) (180)
Total ($6,222) ($6,141) ($6,808) ($7,167) ($7,609) ($8,245)
Note: 1 Excludes Debt Service
Non-Reimbursable
METROPOLITAN TRANSPORTATION AUTHORITY
MTA Consolidated Accrued Statement of Operations By AgencyFebruary Financial Plan 2012-2015
($ in millions)

Line
No
7 Cash Receipts and Expenditures 2011 2012
8 2010 Final Adopted
9 Actual Estimate Budget 2013 2014 2015
10 Receipts
11 Farebox Revenue $4,613 $5,041 $5,085 $5,170 $5,250 $5,329
12 Other Operating Revenue 505 548 547 574 612 653
13 Capital and Other Reimbursements 1,427 1,287 1,685 1,393 1,390 1,397
14 Total Receipts $6,544 $6,877 $7,317 $7,137 $7,253 $7,379
15
16 Expenditures
17 Labor:
18 Payroll $4,567 $4,527 $4,632 $4,558 $4,617 $4,709
19 Overtime 543 602 535 525 529 536
20 Health and Welfare 752 855 891 969 1,059 1,157
21 OPEB Current Payment 347 377 419 467 512 561
22 Pensions 1,170 1,097 1,312 1,324 1,354 1,420
23 Other Fringe Benefits 579 581 613 611 624 640
25 Contribution to GASB Fund 67 39 57 61 64 66
26 Reimbursable Overhead 0 0 0 0 0 0
27 Total Labor Expenditures $8,026 $8,079 $8,460 $8,516 $8,759 $9,090
28
29 Non-Labor:
30 Electric Power $327 $363 $518 $565 $629 $698
31 Fuel 195 240 276 288 290 299
32 Insurance 10 33 28 38 53 64
33 Claims 210 216 178 184 195 203
34 Paratransit Service Contracts 386 368 402 466 548 635
35 Maintenance and Other Operating Contracts 551 600 537 496 498 520
36 Professional Service Contracts 202 199 275 275 281 282
37 Materials & Supplies 566 547 645 629 654 703
38 Other Business Expenditures 208 181 157 161 162 165
39 Total Non-Labor Expenditures $2,656 $2,747 $3,016 $3,102 $3,310 $3,568
40
41 Other Expenditure Adjustments:
42 Other $56 $66 $92 $99 $102 $114
43 General Reserve 0 0 100 130 135 145
44 Total Other Expenditure Adjustments $56 $66 $192 $229 $237 $259
45
46 Total Expenditures $10,738 $10,892 $11,668 $11,847 $12,307 $12,917
47
48 Net Cash Deficit Before Subsidies and Debt Service ($4,194) ($4,015) ($4,351) ($4,710) ($5,054) ($5,538)
49
50 Dedicated Taxes and State/Local Subsidies $5,396 $5,364 $5,589 $5,809 $5,966 $6,070
51 Debt Service (excludes Service Contract Bonds) (1,172) (1,316) (1,492) (1,613) (1,731) (1,833)
52
53 CASH BALANCE BEFORE PRIOR-YEAR CARRY-OVER $30 $32 ($254) ($515) ($819) ($1,300)
54 ADJUSTMENTS 0 0 63 594 602 1,096
55 PRIOR-YEAR CARRY-OVER 130 160 192 1 80 0
56 NET CASH BALANCE $160 $192 $1 $80 ($137) ($204)
Note: The February Plan also reflects the impact of a revised Chart of Accounts. Effective 2012, the account structure has been adjusted to reflect the reclassification and renaming of certain accounts in order to improve reporting consistency among the Agencies. With exception of MTAHQ, these revisions result in a zero-impact to the bottom line. See Agency sections for the Reconciliation to the November Forecast by Generic Category table for details.
($ in millions)
METROPOLITAN TRANSPORTATION AUTHORITY
MTA Consolidated Cash Receipts and ExpendituresFebruary Financial Plan 2012-2015
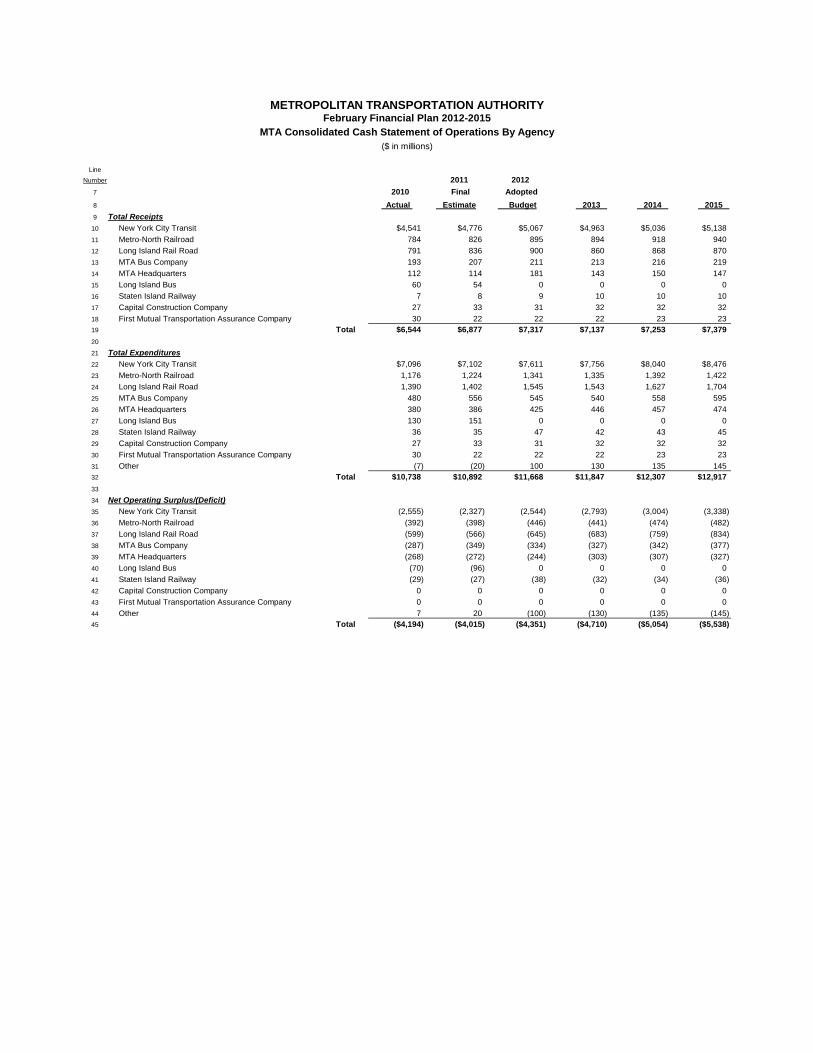
Line
Number 2011 2012
7 2010 Final Adopted
8 Actual Estimate Budget 2013 2014 2015
9 Total Receipts
10 New York City Transit $4,541 $4,776 $5,067 $4,963 $5,036 $5,138
11 Metro-North Railroad 784 826 895 894 918 940
12 Long Island Rail Road 791 836 900 860 868 870
13 MTA Bus Company 193 207 211 213 216 219
14 MTA Headquarters 112 114 181 143 150 147
15 Long Island Bus 60 54 0 0 0 0
16 Staten Island Railway 7 8 9 10 10 10
17 Capital Construction Company 27 33 31 32 32 32
18 First Mutual Transportation Assurance Company 30 22 22 22 23 2319 Total $6,544 $6,877 $7,317 $7,137 $7,253 $7,379
20
21 Total Expenditures
22 New York City Transit $7,096 $7,102 $7,611 $7,756 $8,040 $8,476
23 Metro-North Railroad 1,176 1,224 1,341 1,335 1,392 1,422
24 Long Island Rail Road 1,390 1,402 1,545 1,543 1,627 1,704
25 MTA Bus Company 480 556 545 540 558 595
26 MTA Headquarters 380 386 425 446 457 474
27 Long Island Bus 130 151 0 0 0 0
28 Staten Island Railway 36 35 47 42 43 45
29 Capital Construction Company 27 33 31 32 32 32
30 First Mutual Transportation Assurance Company 30 22 22 22 23 23
31 Other (7) (20) 100 130 135 14532 Total $10,738 $10,892 $11,668 $11,847 $12,307 $12,917
33
34 Net Operating Surplus/(Deficit)
35 New York City Transit (2,555) (2,327) (2,544) (2,793) (3,004) (3,338)
36 Metro-North Railroad (392) (398) (446) (441) (474) (482)
37 Long Island Rail Road (599) (566) (645) (683) (759) (834)
38 MTA Bus Company (287) (349) (334) (327) (342) (377)
39 MTA Headquarters (268) (272) (244) (303) (307) (327)
40 Long Island Bus (70) (96) 0 0 0 0
41 Staten Island Railway (29) (27) (38) (32) (34) (36)
42 Capital Construction Company 0 0 0 0 0 0
43 First Mutual Transportation Assurance Company 0 0 0 0 0 0
44 Other 7 20 (100) (130) (135) (145)45 Total ($4,194) ($4,015) ($4,351) ($4,710) ($5,054) ($5,538)
METROPOLITAN TRANSPORTATION AUTHORITYFebruary Financial Plan 2012-2015
MTA Consolidated Cash Statement of Operations By Agency($ in millions)

2011 2012 2013 2014 2015
$200 $1 $80 ($141) ($211)
Technical/Timing Adjustments (2) 7 (2) 2 1
Subsidy Adjustments (6) (4) (4) (2) 0
Unspecified Deficit Reduction 0 5 5 5 5
Prior-Year Carry-Over 0 (8) 0 (1) 0
$192 $1 $80 ($137) ($204)
METROPOLITAN TRANSPORTATION AUTHORITYFebruary Financial Plan 2012-2015
MTA Consolidated - February Financial Plan Compared with December Financial PlanCash Reconciliation
($ in millions)
Favorable/(Unfavorable)
DECEMBER FINANCIAL PLAN NET CASH SURPLUS/(DEFICIT)
FEBRUARY FINANCIAL PLAN NET CASH SURPLUS/(DEFICIT)

2011 Final
Estimate
2012 Adopted
Budget2013Plan
2014Plan
2015Plan
New York City Transit 39.9% 38.3% 37.1% 36.0% 34.6%Staten Island Railway 11.7% 10.7% 10.9% 10.7% 10.5%Long Island Rail Road 28.2% 28.9% 28.7% 28.0% 26.8%Metro-North Railroad 39.4% 38.6% 38.7% 38.8% 38.3%Long Island Bus 31.5% N/A N/A N/A N/ABus Company 30.5% 30.4% 30.4% 30.0% 28.5%
MTA Total Agency Average 37.6% 36.5% 35.7% 34.8% 33.6%
2011 Final
Estimate
2012 Adopted
Budget2013Plan
2014Plan
2015Plan
New York City Transit 59.4% 56.6% 55.1% 53.6% 51.4%Staten Island Railway 21.0% 18.1% 18.7% 18.2% 17.7%Long Island Rail Road 44.4% 44.8% 44.7% 42.9% 40.9%Metro-North Railroad 59.6% 58.4% 59.2% 59.4% 58.6%Long Island Bus 36.8% N/A N/A N/A N/ABus Company 36.7% 36.6% 36.5% 35.9% 33.8%
MTA Total Agency Average 55.7% 54.0% 53.0% 51.7% 49.7%
Farebox operating ratio focuses on Agency operating financial performance. It reflects the way MTA meets its statutory and bond-covenant budget-balancing requirements, and it excludes certain costs that are not subject to Agency control, but are provided centrally by MTA.
In the agenda materials for the Meeting of the Metro-North and Long Island Committees, the calculations of the farebox operating and recovery ratios for the LIRR and MNR use a revised methodology to put the railroads on a more comparable basis. Those statistics, which are included in the respective financial and ridership reports of both Agencies, differ from the statistics presented in this table.
METROPOLITAN TRANSPORTATION AUTHORITYFebruary Financial Plan 2012-2015
Baseline Farebox Recovery and Farebox Operating Ratios
FAREBOX RECOVERY RATIOS
FAREBOX OPERATING RATIOS
Farebox recovery ratio has a long-term focus. It includes costs that are not funded in the current year, except in an accounting-ledger sense, but are, in effect, passed on to future years. Those costs include depreciation and interest on long-term debt. Approximately 20% (and sometimes more) of MTA costs are not recovered in the current year from farebox revenues, other operating revenues or subsidies. That is why MTA operating statements generally show deficits. In addition, the recovery ratio allocates centralized MTA services to the Agencies, such as Security, the costs of the Inspector General, Civil Rights, Audit, Risk Management, Legal and Shared Services.

[THIS PAGE INTENTIONALLY LEFT BLANK]

III. Major Assumptions 2011-2015 Projections

2011 2012
Final Adopted
Estimate Budget 2013 2014 2015Fare Revenue
Long Island Bus 1 $45.105 $0.000 $0.000 $0.000 $0.000
Long Island Rail Road $567.454 $570.727 $575.234 $579.630 $584.163
Metro-North Railroad 2 $566.059 $588.964 $610.419 $633.428 $650.090
MTA Bus Company $177.351 $180.168 $181.879 $183.956 $185.964
New York City Transit 1,3 $3,557.795 $3,631.243 $3,676.509 $3,730.279 $3,781.867
Staten Island Railway $5.587 $5.726 $5.809 $5.904 $5.995
Total Farebox Revenue $4,919.352 $4,976.828 $5,049.850 $5,133.197 $5,208.079
Toll Revenue
Bridges & Tunnels $1,498.521 $1,510.495 $1,508.101 $1,513.687 $1,520.452
TOTAL: FARE & TOLL REVENUE $6,417.873 $6,487.323 $6,557.951 $6,646.884 $6,728.532
2011 2012
Final Adopted
Estimate Budget 2013 2014 2015Ridership
Long Island Bus 1 30.654 0.000 0.000 0.000 0.000
Long Island Rail Road 80.350 80.977 81.589 82.215 83.401
Metro-North Railroad 2 80.098 81.760 83.168 84.736 86.562
MTA Bus Company 116.963 118.840 119.757 120.879 121.937
New York City Transit 1 2,301.088 2,346.722 2,373.850 2,406.131 2,437.056
Staten Island Railway 4.566 4.658 4.716 4.781 4.843
Total Ridership 2,613.719 2,632.956 2,663.080 2,698.742 2,733.799
Traffic
Bridges & Tunnels 283.095 286.442 287.026 288.815 290.840
1
2
3
MTA Consolidated Utilization
MTA Agency Fare and Toll Revenue Projections, in millions
MTA Agency Ridership and Traffic, in millions
Excludes Paratransit Operations.
MNR baseline utilization figures are for East-of-Hudson service (Hudson, Harlem and New Haven Lines) only.
Excludes Fare Media Liability.

[THIS PAGE INTENTIONALLY LEFT BLANK]

2011 2012 Final Adopted
Estimate Budget 2013 2014 2015 Subsidies
Dedicated Taxes
Metropolitan Mass Transportation Operating Assist (MMTOA) $1,306.4 $1,332.8 $1,491.5 $1,577.9 $1,655.7Petroleum Business Tax (PBT) Receipts 621.2 630.8 634.1 635.8 637.5Mortgage Recording Tax (MRT) 251.1 277.5 326.3 362.0 359.5 MRT Transfer to Suburban Counties (2.5) (3.8) (5.4) (7.3) (6.3) Reimburse Agency Security Costs (10.0) (10.0) (10.0) (10.0) (10.0) Interest 4.2 4.3 4.5 4.7 4.9Urban Tax 353.0 395.7 425.3 470.8 498.6Investment Income 0.9 1.0 1.0 1.0 1.1
$2,524.4 $2,628.3 $2,867.3 $3,034.9 $3,141.2
New State Taxes and FeesPayroll Mobility Tax $1,415.3 $1,234.3 $1,240.9 $1,307.6 $1,376.7Payroll Mobility Tax Replacement Funds 0.0 250.0 310.0 310.0 310.0MTA Aid 303.3 301.1 305.6 310.0 314.6
$1,718.6 $1,785.4 $1,856.4 $1,927.7 $2,001.3
State and Local Subsidies
State Operating Assistance $190.9 $187.9 $187.9 $187.9 $187.9Local Operating Assistance 209.6 222.7 216.5 217.9 219.4Nassau County Subsidy 4.6 0.0 0.0 0.0 0.0CDOT Subsidy 100.4 99.6 101.2 100.7 103.0Station Maintenance 154.8 157.4 160.4 163.6 167.2AMTAP 5.6 0.0 0.0 0.0 0.0
$665.8 $667.7 $666.1 $670.2 $677.5
$4,908.8 $5,081.4 $5,389.8 $5,632.8 $5,820.0
City Subsidy for MTA Bus $349.0 $334.1 $327.2 $341.6 $376.8
$5,257.8 $5,415.5 $5,717.0 $5,974.4 $6,196.8
Inter-agency Subsidy TransactionsB&T Operating Surplus Transfer $495.8 $464.3 $434.6 $380.3 $320.0MTA Subsidy to Subsidiaries 20.5 (0.0) 0.0 0.0 0.0
$516.3 $464.3 $434.6 $380.3 $320.0
GROSS SUBSIDIES $5,774.1 $5,879.8 $6,151.7 $6,354.7 $6,516.8
Total Dedicated Taxes & State and Local Subsidies
Sub-total Dedicated Taxes & State and Local Subsidies
METROPOLITAN TRANSPORTATION AUTHORITYFebruary Financial Plan 2012-2015
Consolidated SubsidiesAccrual Basis
($ in millions)

2011 2012 Final Adopted
Estimate Budget 2013 2014 2015 Subsidies
Dedicated Taxes
Metropolitan Mass Transportation Operating Assist (MMTOA) $1,306.4 $1,332.8 $1,491.5 $1,577.9 $1,655.7Petroleum Business Tax (PBT) Receipts 620.4 630.5 634.0 635.6 637.5Mortgage Recording Tax (MRT) 248.0 273.3 323.0 362.2 359.4 MRT Transfer to Suburban Counties (2.7) (2.5) (3.8) (5.4) (7.3) Reimburse Agency Security Costs (10.0) (10.0) (10.0) (10.0) (10.0) MTA Bus Debt Service (24.9) (24.9) (24.9) (24.9) (24.9) Interest 4.2 4.3 4.5 4.7 4.9Urban Tax 358.0 393.4 421.4 468.7 494.5Investment Income 0.9 1.0 1.0 1.0 1.1
$2,500.4 $2,597.9 $2,836.6 $3,009.8 $3,110.9
New State Taxes and FeesPayroll Mobility Tax $1,415.3 $1,234.3 $1,240.9 $1,307.6 $1,376.7Payroll Mobility Tax Replacement Funds 0.0 250.0 310.0 310.0 310.0MTA Aid 303.3 301.1 305.6 310.0 314.6
$1,718.6 $1,785.4 $1,856.4 $1,927.7 $2,001.3
State and Local Subsidies
State Operating Assistance $190.9 $187.9 $187.9 $187.9 $187.9Local Operating Assistance 244.7 222.6 216.5 217.9 219.4Nassau County Subsidy 4.6 0.0 0.0 0.0 0.0CDOT Subsidy 100.4 99.6 101.2 100.7 103.0Station Maintenance 153.2 155.3 158.2 161.2 164.5AMTAP 5.6 0.0 0.0 0.0 0.0
$699.3 $665.5 $663.8 $667.7 $674.8
Other Subsidy AdjustmentsInteragency Loan ($269.0) $0.0 $0.0 $0.0 $0.0NYCT Charge Back of MTA Bus Debt Service (11.5) (11.5) (11.5) (11.5) (11.5)Forward Energy Contracts - 2011 (12 mth Contract) (104.3) 99.7 0.0 0.0 0.0Forward Energy Contracts - 2012 (12 mth Contract) 0.0 (100.0) 0.0 0.0 0.0MNR Repayment for 525 North Broadway (7.3) (2.4) (2.4) (2.4) (2.4)Repayment of Loan to Capital Financing Fund 0.0 (100.0) (100.0) (100.0) (100.0)Committed to Capital (21.4) (150.0) (200.0) (250.0) (300.0)
($413.5) ($264.3) ($313.9) ($363.9) ($413.9)
$4,504.8 $4,784.6 $5,042.9 $5,241.2 $5,373.1
City Subsidy for MTA Bus $338.7 $336.6 $328.4 $339.2 $370.9
$4,843.5 $5,121.2 $5,371.3 $5,580.4 $5,744.0
Inter-agency Subsidy Transactions
B&T Operating Surplus Transfer $499.7 $467.5 $437.6 $385.8 $326.0MTA Subsidy to Subsidiaries 20.5 (0.0) 0.0 0.0 0.0
$520.2 $467.5 $437.6 $385.8 $326.0
GROSS SUBSIDIES $5,363.7 $5,588.7 $5,808.9 $5,966.2 $6,070.1
Total Dedicated Taxes & State and Local Subsidies
Sub-total Dedicated Taxes & State and Local Subsidies
METROPOLITAN TRANSPORTATION AUTHORITYFebruary Financial Plan 2012-2015
Cash Basis
($ in millions)
Consolidated Subsidies

2011 2012 Final Adopted
Estimate Budget 2013 2014 2015 Subsidies
Dedicated TaxesMetropolitan Mass Transportation Operating Assist (MMTOA) $829.7 $887.5 $996.0 $1,045.7 $1,099.0Petroleum Business Tax (PBT) Receipts 527.3 536.0 538.9 540.3 541.9Mortgage Recording Tax (MRT) 0.0 0.0 0.0 0.0 0.0Urban Tax 358.0 393.4 421.4 468.7 494.5
$1,715.0 $1,816.8 $1,956.3 $2,054.7 $2,135.3
New State Taxes and FeesPayroll Mobility Tax 1,013.8 857.2 868.6 980.7 1,005.0Payroll Mobility Tax Replacement Funds 217.5 226.3 217.0 232.5 226.3MTA Aid 190.9 189.6 192.3 195.2 198.0
$1,422.3 $1,273.1 $1,277.9 $1,408.4 $1,429.3
State and Local Subsidies
State Operating Assistance $158.1 $158.1 $158.1 $158.1 $158.1Local Operating Assistance 193.7 159.0 159.0 159.0 159.0
$351.9 $317.1 $317.1 $317.1 $317.1
Other Subsidy AdjustmentsInter-Agency Loan ($269.0) $0.0 $0.0 $0.0 $0.0NYCT Charge Back of MTA Bus Debt Service (11.5) (11.5) (11.5) (11.5) (11.5)Forward Energy Contracts - 2011 (12 mth Contract) (69.9) 66.8 0.0 0.0 0.0Forward Energy Contracts - 2012 (12 mth Contract) 0.0 (67.0) 0.0 0.0 0.0Repayment of Loan to Capital Financing Fund 0.0 (69.0) (69.0) (69.0) (69.0)Committed to Capital (21.0) (105.0) (140.0) (175.0) (210.0)
($371.4) ($185.7) ($220.5) ($255.5) ($290.5)
$3,117.7 $3,221.3 $3,330.9 $3,524.6 $3,591.2
Inter-agency Subsidy Transactions
Bridges and Tunnels Operating Surplus Transfer $180.4 $172.9 $158.3 $132.3 $102.5
$180.4 $172.9 $158.3 $132.3 $102.5
GROSS SUBSIDIES $3,298.1 $3,394.2 $3,489.1 $3,656.9 $3,693.7
Total Dedicated Taxes & State and Local Subsidies
MTA New York City Transit Subsidy AllocationFebruary Financial Plan 2012-2015
Cash Basis($ in millions)

2011 2012 Final Adopted
Estimate Budget 2013 2014 2015 Subsidies
Dedicated TaxesMetropolitan Mass Transportation Operating Assist (MMTOA) $429.7 $442.3 $492.0 $528.6 $553.0Petroleum Business Tax (PBT) Receipts 93.1 94.6 95.1 95.3 95.6Investment Income 0.9 1.0 1.0 1.0 1.1
$523.7 $537.8 $588.2 $625.0 $649.7
New State Taxes and FeesPayroll Mobility Tax 151.5 317.1 372.3 326.9 371.7Payroll Mobility Tax Replacement Funds 32.5 83.7 93.0 77.5 83.7MTA Aid 112.4 111.6 113.2 114.9 116.6
$296.4 $512.3 $578.5 $519.3 $572.0
State and Local SubsidiesState Operating Assistance $29.3 $29.3 $29.3 $29.3 $29.3Local Operating Assistance 29.2 29.2 29.2 29.2 29.2CDOT Subsidy 100.4 99.6 101.2 100.7 103.0Station Maintenance 153.2 155.3 158.2 161.2 164.5
$312.0 $313.4 $317.9 $320.4 $326.0
Other Subsidy Adjustments
Forward Energy Contracts - 2011 (12 mth Contract) ($34.4) $32.9 $0.0 $0.0 $0.0Forward Energy Contracts - 2012 (12 mth Contract) $0.0 ($33.0) $0.0 $0.0 $0.0MNR Repayment for 525 North Broadway (7.3) (2.4) (2.4) (2.4) (2.4)Repayment of Loan to Capital Financing Fund 0.0 (31.0) (31.0) (31.0) (31.0)Committed to Capital (0.4) (45.0) (60.0) (75.0) (90.0)
($42.1) ($78.5) ($93.4) ($108.4) ($123.4)
$1,090.0 $1,285.1 $1,391.1 $1,356.2 $1,424.3
Inter-agency Subsidy Transactions
Bridges and Tunnels Operating Surplus Transfer $319.2 $294.6 $279.3 $253.5 $223.5
GROSS SUBSIDIES $1,409.2 $1,579.6 $1,670.4 $1,609.7 $1,647.8
Total Dedicated Taxes & State and Local Subsidies
MTA Commuter Railroad Subsidy AllocationFebruary Financial Plan 2012-2015
Cash Basis
($ in millions)

2011 2012 Final Adopted
Estimate Budget 2013 2014 2015 Subsidies
Dedicated TaxesMetropolitan Mass Transportation Operating Assist (MMTOA) $44.2 $0.0 $0.0 $0.0 $0.0
State and Local Subsidies
State Operating Assistance $3.0 $0.0 $0.0 $0.0 $0.0Nassau County Subsidy 4.6 0.0 0.0 0.0 0.0AMTAP 5.6 0.0 0.0 0.0 0.0
$13.2 $0.0 $0.0 $0.0 $0.0
$57.4 $0.0 $0.0 $0.0 $0.0
Inter-agency Subsidy Transactions
MTA Subsidy to Subsidiaries $20.5 $0.0 $0.0 $0.0 $0.0
GROSS SUBSIDIES $77.9 $0.0 $0.0 $0.0 $0.0
Note: LI Bus operations ceased on December 31, 2011.
MTA Long Island Bus Subsidy Allocation
Total Dedicated Taxes & State and Local Subsidies
February Financial Plan 2012-2015Cash Basis
($ in millions)

2011 2012 Final Adopted
Estimate Budget 2013 2014 2015 Subsidies
Dedicated TaxesMetropolitan Mass Transportation Operating Assist (MMTOA) $2.8 $3.0 $3.4 $3.6 $3.7
State and Local Subsidies
State Operating Assistance $0.5 $0.5 $0.5 $0.5 $0.5Local Operating Assistance 1 $21.7 $34.4 $28.3 $29.7 $31.2
$22.2 $35.0 $28.8 $30.3 $31.8
$25.1 $38.0 $32.2 $33.8 $35.5
Inter-agency Subsidy Transactions
MTA Subsidy to Subsidiaries ($0.0) ($0.0) $0.0 $0.0 $0.0
GROSS SUBSIDIES $25.1 $38.0 $32.2 $33.8 $35.5
1 Local Operating Assistance includes a subsidy from the City of New York to fund the Staten Island Railway deficit.
Total Dedicated Taxes & State and Local Subsidies
MTA Staten Island Railway Subsidy AllocationFebruary Financial Plan 2012-2015
Cash Basis
($ in millions)

2011 2012 Final Adopted
Estimate Budget 2013 2014 2015 Subsidies
Dedicated Taxes
Mortgage Recording Tax-1Net Receipts After Agency Transfers $162.1 $181.7 $212.7 $238.1 $237.0
Adjustments
MRT-2 Required to Balance $144.1 $138.1 $107.0 $89.9 $110.9
Net Funding of MTA Headquarters $306.3 $319.8 $319.7 $328.0 $347.9
Mortgage Recording Tax - 2
Net Receipts $85.9 $91.6 $110.3 $124.2 $122.4
Adjustments
Funding of General Reserve $0.0 ($100.0) ($130.0) ($135.0) ($145.0)Diversion of MRT to Suburban Counties (2.7) (2.5) (3.8) (5.4) (7.3)Carryover/Opening Balances/Interest 4.2 4.3 4.5 4.7 4.9Agency Security Costs from MRT (10.0) (10.0) (10.0) (10.0) (10.0)MTA Bus Debt Service (24.9) (24.9) (24.9) (24.9) (24.9)
Transfer to MRT-1 (144.1) (138.1) (107.0) (89.9) (110.9)
($177.5) ($271.2) ($271.3) ($260.6) ($293.2)
Unallocated MRT-2 Receipts ($91.6) ($179.6) ($161.0) ($136.4) ($170.8)
February Financial Plan 2012-2015Cash Basis
($ in millions)
MTA Headquarters Subsidy Allocation

2011 2012 Final Adopted
Estimate Budget 2013 2014 2015 Subsidies
City Subsidy to MTA Bus Company $338.7 $336.6 $328.4 $339.2 $370.9
February Financial Plan 2012-2015Cash Basis
($ in millions)
MTA Bus Company Subsidy Allocation

2011 2012 2013 2014 2015
Forecast of MMTOA Gross Receipts (SFY):
Sales Tax $774.3 $802.3 $832.3 $862.3 $892.3
PBT 129.0 137.0 138.0 139.0 140.0
Corporate Franchise 65.0 65.0 65.0 65.0 65.0
Corporate Surcharge 858.0 969.0 1,003.0 1,057.0 1,117.0
Total Gross Receipts Available for Allocation $1,826.3 $1,973.3 $2,038.3 $2,123.3 $2,214.3
Allocation of Total Gross Receipts to DownState:
Total Gross Receipts $1,826.3 $1,973.3 $2,038.3 $2,123.3 $2,214.3
Less: Upstate Share of PBT (58.1) (61.7) (62.1) (62.6) (63.0)
Less: Repay Negative Fund Balance 0.0 (45.0) 0.0 0.0 0.0
Less: New Fund Balance 0.0 (75.0) 0.0 0.0 0.0
Less: Upstate Share of Transmission 0.0 (21.5) (21.5) (21.5) (21.5)
Total Net DownState Share Available for Allocation $1,768.3 $1,770.2 $1,954.7 $2,039.3 $2,129.8
Less: 18-B Adjustment (189.5) (189.5) (189.5) (189.5) (189.5)
Adjusted Total Net DownState Share for Allocation $1,578.7 $1,580.6 $1,765.2 $1,849.7 $1,940.3
Allocation of Total Net DownState Share to NYCT/SIR:
NYCT/SIR Share 55.78% 59.00% 59.00% 59.00% 59.00%
From Total Net DownState Share $986.3 $1,044.4 $1,153.3 $1,203.2 $1,256.6
Less: 18-B Adjustment (153.9) (153.9) (153.9) (153.9) (153.9)
Adjusted Total Net DownState Share $832.5 $890.5 $999.4 $1,049.3 $1,102.7From Carryover 0.0 0.0 0.0 0.0 0.0
Total NYCT/SIR Share of Net DownState Share $832.5 $890.5 $999.4 $1,049.3 $1,102.7
Total SIR Share 2.8 3.0 3.4 3.6 3.7
Total NYCT Share of Net DownState Share $829.7 $887.5 $996.0 $1,045.7 $1,099.0
Allocation of Total Net DownState Share to MTA:
MTA Share 25.50% 26.18% 26.26% 26.96% 26.96%
From Total Net DownState Share $450.9 $463.5 $513.3 $549.8 $574.2
Less: 18-B Adjustment (21.2) (21.2) (21.2) (21.2) (21.2)Adjusted Total Net DownState Share $429.7 $442.3 $492.0 $528.6 $553.0
From Carryover 0.0 0.0 0.0 0.0 0.0
Total MTA Share of Net DownState Share $429.7 $442.3 $492.0 $528.6 $553.0
Allocation of Total Net DownState Share to LIB:
LI Bus Share 2.62% 0.00% 0.00% 0.00% 0.00%
From Total Net DownState Share $46.4 $0.0 $0.0 $0.0 $0.0
Less: Used for 18-B/other (2.1) 0.0 0.0 0.0 0.0
Adjusted Total Net DownState Share $44.2 $0.0 $0.0 $0.0 $0.0
From Carryover 0.0 0.0 0.0 0.0 0.0
Total LIB Share of Net DownState Share $44.2 $0.0 $0.0 $0.0 $0.0
FORECAST
MMTOA STATE DEDICATED TAXES
($ in millions)
February Financial Plan 2012-2015

2011 2012 2013 2014 2015
Total Net PBT Collections Available for Distribution $1,824.7 $1,854.5 $1,864.7 $1,869.5 $1,875.0
Distribution Shares:
MTA Total 34.0% 34.0% 34.0% 34.0% 34.0%Other Transit 3.0% 3.0% 3.0% 3.0% 3.0%
Highway Trust Fund 63.0% 63.0% 63.0% 63.0% 63.0%
General Fund 0.0% 0.0% 0.0% 0.0% 0.0%
Share Total 100.0% 100.0% 100.0% 100.0% 100.0%
Amount of Total Net Collections Available for the MTA:
MTA Total $620.4 $630.5 $634.0 $635.6 $637.5
Accrued
NYCT/SIR Share of MTA Total $528.1 $536.2 $539.0 $540.4 $541.9Commuter Railroad Share of MTA Total 93.2 94.6 95.1 95.4 95.6
MTA Total of Net Collections $621.2 $630.8 $634.1 $635.8 $637.5
Cash
NYCT/SIR Share of MTA Total $527.3 $536.0 $538.9 $540.3 $541.9Commuter Railroad Share of MTA Total 93.1 94.6 95.1 95.3 95.6
MTA Total of Net Collections $620.4 $630.5 $634.0 $635.6 $637.5
FORECAST
PETROLEUM BUSINESS TAX PROJECTIONSFebruary Financial Plan 2012-2015
($ in millions)

Summary of Mortgage Recording Tax ProjectionsFebruary Financial Plan 2012-2015
($ in millions)
Cash Basis
2011 2012 2013 2014 2015
Receipts Available for Transfer to NYCT and CRs:
Total Gross Receipts $162.1 $181.7 $212.7 $238.1 $237.0Less: MTAHQ Operating Deficit (306.3) (319.8) (319.7) (328.0) (347.9)
Receipts Available for Transfer ($144.1) ($138.1) ($107.0) ($89.9) ($110.9)Adjustments 0.0 0.0 0.0 0.0 0.0MRT-2 Required to Balance 144.1 138.1 107.0 89.9 110.9Adjusted Receipts Available for Transfer $0.0 $0.0 $0.0 $0.0 $0.0
Allocation of Net Receipts to NYCT/SIR Account:
Opening Balance $0.0 $0.0 $0.0 $0.0 $0.0
NYCT/SIR Share 55% 55% 55% 55% 55%From Current Year Net Receipts 0.0 0.0 0.0 0.0 0.0
Total NYCT/SIR Net Cash Share $0.0 $0.0 $0.0 $0.0 $0.0Total SIR Net Cash Share 0.0 0.0 0.0 0.0 0.0Total NYCT Net Cash Share $0.0 $0.0 $0.0 $0.0 $0.0
Allocation of Net Receipts to Commuter Railroad Account:
Opening Balance - CR/SHF $0.0 $0.0 $0.0 $0.0 $0.0Commuter Railroad Share 45% 45% 45% 45% 45%From Net Receipts 0.0 0.0 0.0 0.0 0.0
Total Commuter Railroad Net Cash Share $0.0 $0.0 $0.0 $0.0 $0.0
Receipts Available
Total Receipts to Corporate Account $85.9 $91.6 $110.3 $124.2 $122.4All Agency Security Pool (10.0) (10.0) (10.0) (10.0) (10.0)MTA Bus Debt Service (24.9) (24.9) (24.9) (24.9) (24.9)General Reserve 0.0 (100.0) (130.0) (135.0) (145.0)Investment Income 4.2 4.3 4.5 4.7 4.9
Total Receipts Available for Transfer $55.2 ($39.0) ($50.1) ($41.1) ($52.6)
Use of Total Receipts:
DORF Opening Balance $4.5 $4.5 $4.5 $4.5 $4.5Less: Transfer to MTA DORF Account (7.1) (6.9) (8.3) (9.9) (11.8)Less: Transfer to MTAHQ Funds (144.1) (138.1) (107.0) (89.9) (110.9)
Net Receipts Available ($91.6) ($179.6) ($161.0) ($136.4) ($170.8)
MORTGAGE RECORDING TAX #261-2
MORTGAGE RECORDING TAX #261-1
FORECAST

February Financial Plan 2012-2015MTA Bridges & Tunnels
Surplus Transfer($ in millions)
ACTUAL
2010 2011 2012 2013 2014 2015
Net Surplus/(Deficit) $1,049.467 $1,135.891 $1,119.607 $1,107.683 $1,083.762 $1,061.112
Deductions from Net Operating Income:
Investment Income $0.147 $0.126 $0.108 $0.162 $1.037 $2.534
Total Debt Service 592.893 612.275 619.352 638.397 667.572 703.482
Reserves 10.656 11.543 19.370 17.781 17.843 17.849
Capitalized Assets 14.340 14.353 14.548 14.762 15.003 15.258
GASB Reserves 2.322 1.787 1.927 1.932 1.966 2.017
Total Deductions from Net Operating Income $620.358 $640.085 $655.305 $673.034 $703.421 $741.139
Net Income Available for Transfer to MTA and NYCT $429.109 $495.806 $464.302 $434.650 $380.342 $319.973
Distribution of Funds to MTA:
Investment Income in Current Year $0.147 $0.126 $0.108 $0.162 $1.037 $2.534
Accrued Current Year Allocation 277.084 313.156 292.488 277.877 250.780 220.481
Total Accrued Amount Distributed to MTA $277.231 $313.282 $292.596 $278.039 $251.817 $223.015
Distribution of Funds to NYCT:
First $24 million of Surplus reserved for NYCT $24.000 $24.000 $24.000 $24.000 $24.000 $24.000
Additional Accrued Current Year Allocation 128.026 158.650 147.814 132.773 105.562 75.491
Total Accrued Amount Distributed to NYCT $152.026 $182.650 $171.814 $156.773 $129.562 $99.491
Actual Cash Transfer to MTA and NYCT:
From Current Year Surplus $265.776 $319.243 $294.555 $279.338 $253.490 $223.511
Investment Income in Prior Year 0.256 0.147 0.126 0.108 0.162 1.037
Total Cash Amount Distributed to MTA $266.032 $319.390 $294.681 $279.446 $253.652 $224.548
Total Cash Amount Distributed to NYCT $140.167 $180.367 $172.897 $158.277 $132.283 $102.498
FORECAST

February Financial Plan 2012-2015MTA Bridges & Tunnels
Surplus Transfer($ in millions)
ACTUAL
2010 2011 2012 2013 2014 2015
Debt Service Detail by Agency:
B&T Own Purpose Debt Service $179.535 $205.959 $227.252 $245.052 $273.964 $310.460
NYCT Transportation Debt Service 281.208 280.411 268.387 269.225 269.413 269.006
MTA Transportation Debt Service 132.150 125.905 123.713 124.120 124.195 124.016
Total Debt Service by Agency1 $592.893 $612.275 $619.352 $638.397 $667.572 $703.482
Total Accrued Amount for Transfer to MTA and NYCT:
Total Adjusted Net Income Available for Transfer $1,022.002 $1,108.081 $1,083.654 $1,073.047 $1,047.913 $1,023.455
Less: B&T Total Debt Service (179.535) (205.959) (227.252) (245.052) (273.964) (310.460)
Less: first $24 million reserved for NYCT (24.000) (24.000) (24.000) (24.000) (24.000) (24.000)
Remainder of Total Accrued Amount for Transfer $818.467 $878.122 $832.402 $803.995 $749.949 $688.994
Calculation of Actual Cash Transfer to MTA:
Distribution of Remainder to MTA
Fifty Percent of Total Accrued Amount for Transfer $409.234 $439.061 $416.201 $401.997 $374.975 $344.497
Less: MTA Total Debt Service (132.150) (125.905) (123.713) (124.120) (124.195) (124.016)
MTA's Accrued Current Year Allocation $277.084 $313.156 $292.488 $277.877 $250.780 $220.481
Cash Conversion of MTA's Accrued Amount
Current Year Amount $239.681 $281.841 $263.239 $250.089 $225.702 $198.433
Balance of Prior Year 26.095 37.402 31.316 29.249 27.788 25.078
Cash Transfer to MTA1 $265.776 $319.243 $294.555 $279.338 $253.490 $223.511
Calculation of Actual Cash Transfer to NYCT:
Distribution of Remainder to NYCT
Fifty Percent of Total Accrued Amount for Transfer $409.234 $439.061 $416.201 $401.997 $374.975 $344.497
Less: NYCT Total Debt Service (281.208) (280.411) (268.387) (269.225) (269.413) (269.006)
Plus: first $24 million reserved for NYCT 24.000 24.000 24.000 24.000 24.000 24.000
NYCT's Accrued Current Year Allocation $152.026 $182.650 $171.814 $156.773 $129.562 $99.491
Cash Conversion of NYCT's Accrued Amount
Current Year Amount $136.043 $164.385 $154.632 $141.095 $116.605 $89.542
Balance of Prior Year 4.124 15.982 18.265 17.181 15.677 12.956
Cash Transfer to NYCT $140.167 $180.367 $172.897 $158.277 $132.283 $102.498
FORECAST

Line
Number ACTUAL
9 2010 2011 2012 2013 2014 2015
10 Revenue Summary:
11
12 Farebox Revenue $43.8 $46.3 $0.0 $0.0 $0.0 $0.0
13 Other Revenue 1.6 1.7 0.0 0.0 0.0 0.0
14 State/Local Subsidies 60.1 57.4 0.0 0.0 0.0 0.0
15
16 Total Revenue Before MTA Subsidy $105.5 $105.4 $0.0 $0.0 $0.0 $0.0
17
18 Non-Reimbursable Expense Summary:
19
20 Labor Expenses $102.5 $101.1 $0.0 $0.0 $0.0 $0.0
21 Non-Labor Expenses 29.3 24.7 0.0 0.0 0.0 0.0
22 Depreciation 0.0 0.0 0.0 0.0 0.0 0.0
23 OPEB Obligation 9.0 9.0 0.0 0.0 0.0 0.0
24 Environmetal Remediation 0.0 0.0 0.0 0.0 0.0 0.0
25
26 Total Non-Reimbursable Expenses $140.8 $134.7 $0.0 $0.0 $0.0 $0.0
27
28 Total Net Revenue/(Deficit) ($35.3) ($29.3) $0.0 $0.0 $0.0 $0.0
29
30 Cash Adjustment Summary:
31
32 Operating Cash Adjustments $25.6 ($9.3) $0.0 $0.0 $0.0 $0.0
33 Subsidy Cash Adjustments 1.1 0.0 0.0 0.0 0.0 0.0
34
35 Total Cash Adjustment $26.7 ($9.3) $0.0 $0.0 $0.0 $0.0
36
37 Gross Cash Balance ($8.6) ($38.7) $0.0 $0.0 $0.0 $0.0
38
39 MTA Internal Subsidy 21.5 20.5 0.0 0.0 0.0 0.0
40
41 Net Cash Balance from Previous Year $5.3 $18.2 $0.0 $0.0 $0.0 $0.0
42
43
44 Baseline Net Cash Surplus/(Deficit) $18.2 $0.0 $0.0 $0.0 $0.0 $0.0
45
FORECAST
SUMMARY
MTA LONG ISLAND BUSMULTI-YEAR FINANCIAL PLAN
2012-2015
($ in millions)

Line
Number ACTUAL
9 2010 2011 2012 2013 2014 2015
10 Revenue Summary:
11
12 Farebox Revenue $5.0 $5.6 $5.7 $5.8 $5.9 $6.0
13 Other Revenue 2.2 2.1 2.1 2.1 2.1 2.1
14 State/City Subsidies 4.1 24.9 38.0 32.2 33.8 35.5
15
16 Total Revenue Before MTA Subsidy $11.3 $32.6 $45.8 $40.1 $41.8 $43.6
17
18 Non-Reimbursable Expense Summary:
19
20 Labor Expenses $28.7 $26.2 $29.1 $29.6 $30.2 $31.2
21 Non-Labor Expenses 9.5 8.1 11.4 10.1 11.2 12.0
22 Depreciation 9.1 9.0 9.0 9.0 9.0 9.0
23 OPEB Obligation 1.9 2.8 3.0 3.0 3.0 3.0
24 Environmental Remediation 0.2 0.0 0.0 0.0 0.0 0.0
25
26 Total Non-Reimbursable Expenses $49.4 $46.2 $52.5 $51.7 $53.4 $55.2
27
28
29 Total Net Revenue/(Deficit) ($38.1) ($13.6) ($6.7) ($11.6) ($11.6) ($11.6)
30
31 Cash Adjustment Summary:
32
33 Operating Cash Adjustments $13.0 $11.4 $6.8 $11.6 $11.6 $11.6
34 Subsidy Cash Adjustments (0.1) 0.1 0.0 0.0 0.0 0.0
35
36 Total Cash Adjustment $12.9 $11.6 $6.8 $11.6 $11.6 $11.6
37
38 Gross Cash Balance ($25.2) ($2.0) $0.0 $0.0 $0.0 $0.0
39
40 MTA Internal Subsidy 25.5 (0.0) (0.0) 0.0 0.0 0.0
41
42 Net Cash Balance from Previous Year $1.8 $2.0 $0.0 $0.0 $0.0 $0.0
43
44
45 Baseline Net Cash Surplus/(Deficit) $2.0 $0.0 $0.0 $0.0 $0.0 $0.0
46
47
48 Fare/Toll Increases:
49 Fare/Toll Yields on 1/1/13: 7.5% - - - 0.4 0.4 0.4 50 Fare/Toll Yields on 1/1/15: 7.5% - - - - - 0.5
51 $0.0 $0.0 $0.0 $0.4 $0.4 $0.9
52
53 TOTAL ADJUSTMENTS $0.0 $0.0 $0.0 $0.4 $0.4 $0.954
55 Net Cash Balance from Previous Year (Gap Actions only) - - - - 0.4 0.9
56
57 Net Cash Surplus/(Deficit) $2.0 $0.0 $0.0 $0.4 $0.9 $1.8
FORECAST
SUMMARY
MULTI-YEAR FINANCIAL PLAN2012-2015
($ in millions)
MTA STATEN ISLAND RAILWAY

Line
Number ACTUAL
9 2010 2011 2012 2013 2014 2015
10 Revenue Summary:
11
12 Farebox Revenue $168.0 $177.4 $180.2 $181.9 $184.0 $186.0
13 Other Revenue 21.6 18.8 19.0 19.4 19.8 20.2
14
15 Total Revenue Before MTA Subsidy $189.6 $196.2 $199.2 $201.3 $203.7 $206.1
16
17 Non-Reimbursable Expense Summary:
18
19 Labor Expenses $366.9 $373.9 $388.2 $394.7 $399.0 $422.9
20 Non-Labor Expenses 134.5 144.5 140.4 139.8 150.4 165.4
21 Depreciation 40.4 42.2 42.2 42.2 42.2 42.2
22 OPEB Obligation 51.6 54.6 55.4 56.3 56.9 57.7
23 Environmental Remediation 4.1 0.0 0.0 0.0 0.0 0.024
25 Total Non-Reimbursable Expenses $597.6 $615.3 $626.3 $633.0 $648.6 $688.1
26
27
28 Total Net Revenue/(Deficit) ($408.0) ($419.1) ($427.1) ($431.8) ($444.9) ($482.0)
29
30 Cash Adjustments $124.1 $74.1 $97.3 $109.9 $109.6 $111.5
31 GASB Cash Adjustments ($3.6) ($3.9) ($4.3) ($5.3) ($6.3) ($6.3)
32 Subsidy Cash Adjustments 0.0 0.0 0.0 0.0 0.0 0.033
34 Total Cash Adjustment $120.5 $70.2 $93.0 $104.5 $103.3 $105.2
35
36 Gross Cash Balance ($287.5) ($349.0) ($334.1) ($327.2) ($341.6) ($376.8)
37
38 City Subsidy
39 Accrued 287.5 349.0 334.1 327.2 341.6 376.8
40 Cash 241.7 338.7 336.6 328.4 339.2 370.9
41 Cash Flow Adjustments (45.8) (10.3) 2.5 1.1 (2.4) (5.9)42
43 Net Cash Balance from Previous Year $57.3 $11.6 $1.3 $3.8 $4.9 $2.6
44
45
46 Baseline Net Cash Surplus/(Deficit) $11.6 $1.3 $3.8 $4.9 $2.6 ($3.3)
47
48
49
50 Fare/Toll Increases:
51 Fare/Toll Yields on 1/1/13: 7.5% - - - 13.6 13.8 13.9 52 Fare/Toll Yields on 1/1/15: 7.5% - - - - - 15.0
53 Sub-Total $0.0 $0.0 $0.0 $13.6 $13.8 $28.9
54
55 MTA Initiatives:56 New MTA Efficiencies - 0.0 0.2 0.2 0.2 0.2
57 Sub-Total $0.0 $0.0 $0.2 $0.2 $0.2 $0.2
58
59 TOTAL ADJUSTMENTS $0.0 $0.0 $0.0 $13.6 $13.8 $28.9
60
61 Net Cash Balance from Previous Year (Gap Actions only) - - - - - - 62
63 Net Cash Surplus/(Deficit) $11.6 $1.3 $3.8 $4.9 $2.6 ($3.3)
($ in millions)
MTA BUS COMPANYSUMMARY
MULTI-YEAR FINANCIAL PLAN2012-2015
FORECAST

MTA New York City Transit February Financial Plan 2012 - 2015
Paratransit Operations($ in thousands)
2011 2012 2013 2014 2015
ADA Trips: 6,706,829 7,787,905 8,956,091 10,299,505 11,844,432
Pct Change from Previous Year 16.1% 15.0% 15.0% 15.0%
Revenue: Fares 14,647$ 17,003$ 19,573$ 22,529$ 25,928$ Urban Tax 23,530 26,379 28,355 31,387 33,241Sub-total $ 38,177 $ 43,382 $ 47,928 $ 53,916 $ 59,169 City Reimbursements 88,533 106,240 127,489 152,987 183,585Total Revenue $ 126,710 $ 149,622 $ 175,417 $ 206,903 $ 242,754
Expenses:Operating Expenses: Salaries& Benefits 14,761$ 16,173$ 16,173$ 16,173$ 16,173$ Rental & Miscellaneous 427,675 493,537 591,745 687,876 799,362Total Expenses 442,436$ 509,710$ 607,918$ 704,049$ 815,535$
Net Paratransit Surplus/(Deficit) $ (315,726) $ (360,088) $ (432,500) $ (497,145) $ (572,781)
Total Paratransit Reimbursement: 112,063$ 132,619$ 155,844$ 184,374$ 216,826$ Urban Tax 23,530$ 26,379$ 28,355$ 31,387$ 33,241$ City Reimbursements 88,533 106,240 127,489 152,987 183,585
Rental & Miscellaneous Expense:Paratransit Service Contracts
Carrier Services 324,535$ 366,526$ 425,459$ 502,355$ 583,557$
Command Center 24,182 27,362 30,919 34,938 39,480
Eligibility Certification 2,999 5,275 6,675 7,701 8,882
Other 4,327 5,030 5,030 5,031 5,031
Subtotal 356,043$ 404,193$ 468,083$ 550,025$ 636,950$
Other Than Personnel Service: Insurance 42,765 52,496 65,829 82,542 103,506 Fuel 24,240 27,621 33,766 38,628 44,675
Other 4,485 8,608 23,448 16,062 13,610 Subtotal 71,490$ 88,725$ 123,043$ 137,232$ 161,791$
Non-City Reimbursable OTPS: 142$ 619$ 619$ 619$ 621$
Total Rental & Miscellaneous Expense 427,675$ 493,537$ 591,745$ 687,876$ 799,362$
Annual Growth in Total Expenses 15.2% 19.3% 15.8% 15.8%
Paratransit Details
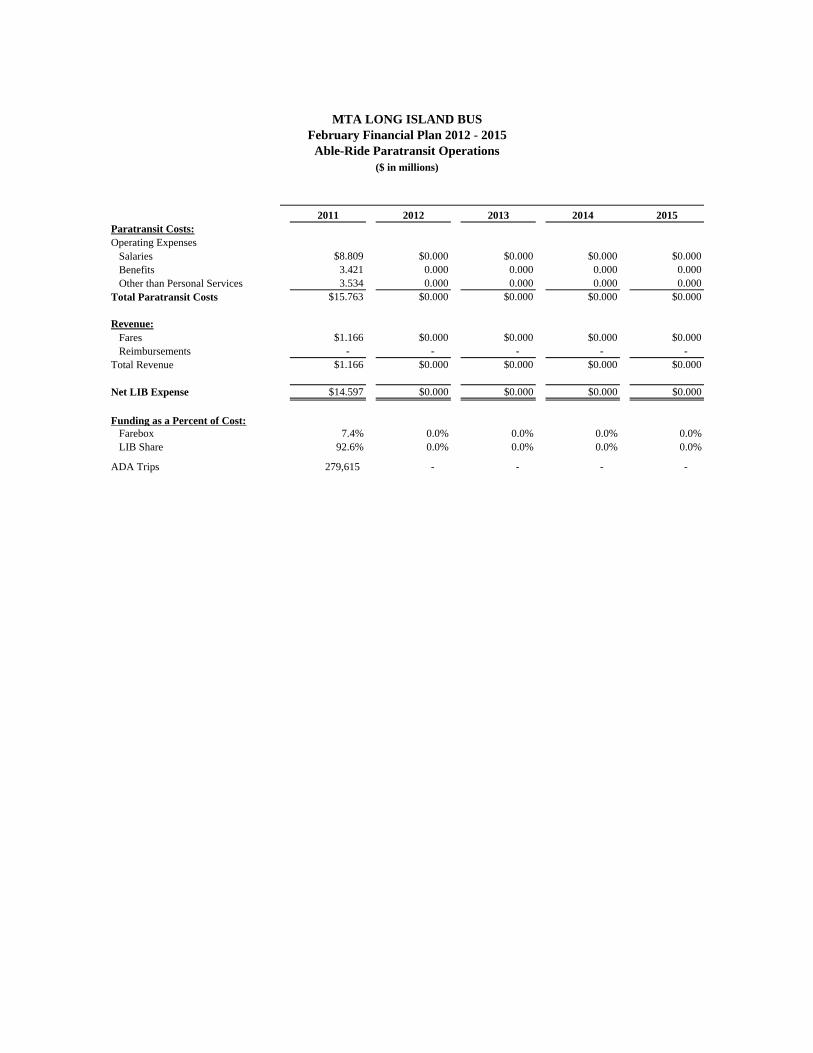
MTA LONG ISLAND BUS February Financial Plan 2012 - 2015
Able-Ride Paratransit Operations($ in millions)
2011 2012 2013 2014 2015Paratransit Costs:Operating Expenses Salaries $8.809 $0.000 $0.000 $0.000 $0.000 Benefits 3.421 0.000 0.000 0.000 0.000 Other than Personal Services 3.534 0.000 0.000 0.000 0.000Total Paratransit Costs $15.763 $0.000 $0.000 $0.000 $0.000
Revenue: Fares $1.166 $0.000 $0.000 $0.000 $0.000 Reimbursements - - - - - Total Revenue $1.166 $0.000 $0.000 $0.000 $0.000
Net LIB Expense $14.597 $0.000 $0.000 $0.000 $0.000
Funding as a Percent of Cost: Farebox 7.4% 0.0% 0.0% 0.0% 0.0% LIB Share 92.6% 0.0% 0.0% 0.0% 0.0%
ADA Trips 279,615 - - - -

Debt Service in the Financial Plan The following table reflects debt service projections for 2011 through 2015 associated with approved Capital Programs, including the two-year approved portion of the 2010-2014 Capital Programs. As approved by the Capital Program Review Board on June 2, 2010, the 2010-2014 Capital Programs finance capital expenditures associated with the first two years of commitments for transit, commuter railroads and bus projects. The TBTA 2010-2014 Capital Program finances capital expenditures associated with the full five years of commitments. The Summary of Total Debt Service table shows all MTA and TBTA debt service for this February 2012 Financial Plan (excluding State Service Contract and Convention Center debt service which is fully paid by New York State).
(1) Totals may not add due to rounding. The following is a summary of the key assumptions used to determine the debt service projections included in the financial plan. Debt Issuance Assumptions:
Forecasted Borrowing Schedule 2011 2012 2013 2014 2015 New Money Bonds 1($ in millions) 332 2,179 1,974 1,994 1,789 Assumed Fixed-Rates
Transportation Revenue Bonds 5.27% 5.59% 5.90% 6.17% 6.35% Dedicated Tax Fund Bonds 4.80% 5.09% 5.37% 5.62% 5.79% Triborough Bridge & Tunnel Authority 4.80% 5.09% 5.37% 5.62% 5.79% Assumed Variable Rates 4.00% 4.00% 4.00% 4.00% 4.00% Weighted Average Interest Rates 2 Transportation Revenue Bonds 5.15% 5.43% 5.71% 5.95% 6.12% Dedicated Tax Fund Bonds 4.72% 4.98% 5.23% 5.46% 5.61%
Triborough Bridge & Tunnel Authority 4.72% 4.98% 5.23% 5.46% 5.61%
1. Years 2011 to 2015 include assumed borrowing for existing approved Capital Programs. FY 2011 new money bonds are net of commercial paper.
2. Weighted Average of fixed and variable forecasted rates (see below for explanation).
Debt Service Forecast (in millions) (1)
Year December Plan
Debt ServiceFebruary Plan Debt Service
Difference Favorable/(Unfavorable)
2011 $1,949 $1,949 $0
2012 2,129 2,129 0
2013 2,271 2,271 0
2014 2,418 2,418 0
2015 2,555 2,555 0Total: $11,323 $11,323 $0

All debt is assumed to be issued as 30-year level debt, principal amortized over
the life of the bonds. Current fixed-rate estimates derived from prevailing Fair Market Yield Curves for
A- and AA- Transportation issuers using Bloomberg Information Service. Financial Plan years 2011–2015 derived by applying changes in U.S. Municipal Forward Curves to prevailing transportation curves (as of October 4, 2011).
Split of fixed-rate debt versus variable rate debt each year is 90% fixed and 10% variable.
New bond issues calculated interest rate at time of issuance use weighted average of fixed and variable assumptions (actual fixed-rates in table above assumed for fixed-rate bonds).
Cost of issuance is 2% of gross bonding amount. New money bonds for currently approved transit and commuter projects assume
a target split of 25% under the DTF credit and 75% under the Transportation credit, subject to satisfying the additional bonds test under the DTF Resolution. New money bonds for the two-year approved portion of the 2010-2014 Capital Program assumed to be issued under the Transportation credit.
All bonds issued to finance TBTA capital projects issued under the TBTA General Revenue Resolution.
Assumes $21.4 million of Pay-Go funding in FY 2011 and $165 million in FY 2012 and $100 million annually during FYs 2013-2015.
No reserve funds.

[THIS PAGE INTENTIONALLY LEFT BLANK]

Line ACTUALNumber 2010 2011 2012 2013 2014 2015
9 New York City Transit:1011 Budgeted Gross Debt Service for Existing Transportation Revenue Bonds $496.502 $572.126 $620.977 $618.629 $624.239 $624.14212 Debt Service on Additional Transportation Revenue Bonds Supporting Approved Capital Programs 0.000 0.000 59.584 127.368 181.083 229.80113 2 Broadway Certificates of Participation - NYCT Share 23.740 23.056 21.904 21.914 21.950 21.98414 Transportation Resolution Commercial Paper 1.752 6.570 21.988 21.988 21.988 21.98815 Budgeted Gross Debt Service for Existing Dedicated Tax Fund Bonds 293.737 305.041 325.665 327.238 326.013 328.08216 Debt Service on Additional Dedicated Tax Fund Bonds Supporting Approved Capital Programs 0.000 0.000 12.068 33.528 50.504 58.08717 Prepayment Effect on Transportation Revenue Bonds 0.000 0.000 0.000 0.000 0.000 0.000
17 Sub-Total MTA Paid Debt Service $815.732 $906.793 $1,062.187 $1,150.665 $1,225.777 $1,284.0841819 Budgeted Gross Debt Service for Existing TBTA (B&T) General Revenue Bonds $194.637 $199.952 $188.866 $190.178 $189.905 $189.90620 Budgeted Gross Debt Service for Existing TBTA (B&T) Subordinate Revenue Bonds 81.146 80.459 79.521 79.082 79.544 79.138
21 Sub-Total B&T Paid Debt Service $275.783 $280.411 $268.387 $269.260 $269.449 $269.0442223 Total NYCT Debt Service $1,091.514 $1,187.204 $1,330.574 $1,419.925 $1,495.226 $1,553.1282425 Commuter Railroads:2627 Budgeted Gross Debt Service for Existing Transportation Revenue Bonds $342.890 $380.539 $414.567 $413.000 $416.745 $416.68028 Debt Service on Additional Transportation Revenue Bonds Supporting Approved Capital Programs 0.000 0.000 16.666 51.010 90.362 132.82229 Transportation Resolution Commercial Paper 0.813 3.863 13.703 13.703 13.703 13.70330 Budgeted Gross Debt Service for Existing Dedicated Tax Fund Bonds 64.310 65.224 68.109 68.438 68.182 68.61431 Debt Service on Additional Dedicated Tax Fund Bonds Supporting Approved Capital Programs 0.000 0.000 0.000 0.000 0.000 0.00032 Prepayment Effect on Transportation Revenue Bonds 0.000 0.000 0.000 0.000 0.000 0.000
32 Sub-Total MTA Paid Debt Service $408.014 $449.627 $513.045 $546.151 $588.992 $631.8193334 Budgeted Gross Debt Service for Existing TBTA (B&T) General Revenue Bonds $87.119 $90.554 $88.775 $89.391 $89.263 $89.26435 Budgeted Gross Debt Service for Existing TBTA (B&T) Subordinate Revenue Bonds 35.652 35.350 34.938 34.745 34.948 34.770
36 Sub-Total B&T Paid Debt Service $122.771 $125.905 $123.713 $124.136 $124.211 $124.0333738 Total CRR Debt Service $530.785 $575.531 $636.758 $670.287 $713.203 $755.8523940 Bridges and Tunnels:4142 Budgeted Gross Debt Service for Existing TBTA (B&T) General Revenue Bonds $165.384 $175.447 $196.758 $198.124 $197.840 $197.84143 Budgeted Gross Debt Service for Existing TBTA (B&T) Subordinate Revenue Bonds 32.054 31.783 31.412 31.239 31.421 31.26144 Debt Service on Additional TBTA (B&T) General Revenue Bonds Supporting Approved Capital Prog 0.000 0.000 5.048 21.687 50.697 87.34945 2 Broadway Certificates of Participation - TBTA Share 3.357 3.261 3.098 3.099 3.104 3.1094647 Total B&T Debt Service $200.795 $210.491 $236.315 $254.148 $283.062 $319.5604849 MTA Bus:5051 Budgeted Gross Debt Service for Existing Transportation Revenue Bonds $14.008 $20.010 $16.273 $16.211 $16.358 $16.35652 Debt Service on Additional Transportation Revenue Bonds Supporting Approved Capital Programs 0.000 0.000 2.069 3.698 3.698 3.69853 Transportation Resolution Commercial Paper 0.386 0.276 0.309 0.309 0.309 0.3095455 Total MTA Bus Debt Service $14.393 $20.286 $18.651 $20.219 $20.366 $20.363
5657 Total MTA HQ Debt Service for 2 Broadway Certificates of Participation $3.257 $3.147 $3.005 $3.006 $3.011 $3.01658
FORECAST
METROPOLITAN TRANSPORTATION AUTHORITY
Summary of Total Budgeted Debt ServiceFebruary Financial Plan 2012-2015
($ in millions)
Page 1 of 2

Line ACTUALNumber 2010 2011 2012 2013 2014 2015
FORECAST
METROPOLITAN TRANSPORTATION AUTHORITY
Summary of Total Budgeted Debt ServiceFebruary Financial Plan 2012-2015
($ in millions)
59 MTA Total:60
61 Budgeted Gross Debt Service for Existing Transportation Revenue Bonds $853.400 $972.676 $1,051.817 $1,047.840 $1,057.343 $1,057.179
62 Budgeted Gross Debt Service for Existing Dedicated Tax Fund Bonds 358.047 370.265 393.774 395.675 394.195 396.696
63 Budgeted Gross Debt Service for Existing TBTA (B&T) General Revenue Bonds 447.139 465.953 474.398 477.693 477.008 477.011
64 Budgeted Gross Debt Service for Existing TBTA (B&T) Subordinate Revenue Bonds 148.852 147.593 145.872 145.066 145.914 145.168
65 2 Broadway Certificates of Participation 30.354 29.464 28.006 28.019 28.066 28.110
66 Transportation Resolution Commercial Paper 2.951 10.708 36.000 36.000 36.000 36.000
67 Debt Service on Additional Transportation Revenue Bonds Supporting Approved Capital Programs 0.000 0.000 78.319 182.076 275.142 366.320
68 Debt Service on Additional Dedicated Tax Fund Bonds Supporting Approved Capital Programs 0.000 0.000 12.068 33.528 50.504 58.087
69 Debt Service on Additional TBTA (B&T) General Revenue Bonds Supporting Approved Capital Prog 0.000 0.000 5.048 21.687 50.697 87.34970 Prepayment Effect on Transportation Revenue Bonds 0.000 0.000 0.000 0.000 0.000 0.00070
71 Total Debt Service $1,840.744 $1,996.660 $2,225.303 $2,367.585 $2,514.869 $2,651.9207273 MTA Investment Income by Resolution74
75 Investment Income from Transportation Debt Service Fund $0.000 $0.000 $0.000 ($0.154) ($0.167) ($0.178)
76 Investment Income from Dedicated Tax Fund Debt Service Fund 0.000 0.000 0.000 (0.054) (0.056) (0.057)
77 Investment Income from TBTA (B&T) General Revenue Debt Service Fund 0.000 0.000 0.000 (0.062) (0.066) (0.071)
78 Investment Income from TBTA (B&T) Subordinate Revenue Debt Service Fund 0.000 0.000 0.000 (0.018) (0.018) (0.018)
79 Investment Income from 2 Broadway Certificates of Participation Debt Service Fund 0.000 0.000 0.000 (0.004) (0.004) (0.004)8081 Total MTA Wide Investment Income $0.000 $0.000 $0.000 ($0.291) ($0.310) ($0.327)8283 MTA Wide Net Total84
85 Net Transportation Revenue Bonds Debt Service $853.400 $972.676 $1,130.136 $1,229.763 $1,332.319 $1,423.321
86 Transportation Resolution Commercial Paper 2.951 10.708 36.000 36.000 36.000 36.000
87 Net Dedicated Tax Fund Bonds Debt Service 358.047 370.265 405.842 429.150 444.643 454.727
88 Net TBTA (B&T) General Revenue Bonds Debt Service 447.139 465.953 479.446 499.317 527.639 564.290
89 Net TBTA (B&T) Subordinate Revenue Bonds Debt Service 148.852 147.593 145.872 145.048 145.896 145.150
90 Net 2 Broadway Certificates of Participation Debt Service 30.354 29.464 28.006 28.016 28.062 28.10691 Build America Bonds Interest Subsidy (59.525) (48.068) (96.135) (96.135) (96.135) (96.135)9293 Total MTA Wide Net Debt Service for Approved Capital Programs $1,781.220 $1,948.592 $2,129.168 $2,271.159 $2,418.423 $2,555.458
Page 2 of 2

METROPOLITAN TRANSPORTATION AUTHORITYFebruary Financial Plan 2012-2015
Revised Debt Affordability Statement (1)
$ in millions
Forecasted Debt Service and Borrowing Schedule Notes 2010 ACTL 2011 2012 2013 2014 2015
Combined MTA/TBTA Forecasted Debt Service Schedule 1, 2, 3 $1,750.9 $1,919.1 $2,101.2 $2,243.1 $2,390.4 $2,527.4
Forecasted New Money Bonds Issued 4 3,633.1 831.7 2,178.8 1,974.2 1,994.4 1,789.0
Forecasted Debt Service by Credit Notes 2010 2011 2012 2013 2014 2015
Transportation Revenue Bonds
Pledged Revenues 5 $9,718.0 $10,557.0 $10,734.6 $11,042.2 $11,310.8 $11,575.5
Debt Service 826.4 954.0 1,107.4 1,207.1 1,309.6 1,400.6
Debt Service as a % of Pledged Revenues 9% 9% 10% 11% 12% 12%
Dedicated Tax Fund Bonds
Pledged Revenues 6 $604.2 $620.4 $630.5 $634.0 $635.6 $637.5
Debt Service 333.0 356.1 377.5 400.8 416.3 426.4
Debt Service as a % of Pledged Revenues 55% 57% 60% 63% 65% 67%
Triborough Bridge and Tunnel Authority General Revenue Bonds
Pledged Revenues 7 $1,049.5 $1,135.9 $1,119.6 $1,107.7 $1,083.8 $1,061.1
Debt Service 442.7 461.4 470.4 490.3 518.6 555.2
Debt Service as a % of Total Pledged Revenues 42% 41% 42% 44% 48% 52%
Triborough Bridge and Tunnel Authority Subordinate Revenue Bonds
Pledged Revenues 8 $606.8 $674.5 $649.2 $617.4 $565.2 $505.9
Debt Service 148.9 147.6 145.9 145.0 145.9 145.2
Debt Service as a % of Total Pledged Revenues 25% 22% 22% 23% 26% 29%
Cumulative Debt Service (Excluding State Service Contract Bonds) Notes 2010 2011 2012 2013 2014 2015
Total Debt Service (2) $1,750.9 $1,919.1 $2,101.2 $2,243.1 $2,390.4 $2,527.4
Fare and Toll Revenues $6,003.4 $6,489.8 $6,560.5 $6,629.7 $6,721.6 $6,806.7Total Debt Service as a % of Fare and Toll Revenue 29% 30% 32% 34% 36% 37%
Operating Revenues and Subsidies $11,335.3 $12,243.8 $12,500.5 $12,898.2 $13,285.0 $13,633.5Total Debt Service as a % of Operating Revenues and Subsidies 15% 16% 17% 17% 18% 19%
Operating Revenues and Subsidies after Below the Line Adjustments $12,243.8 $12,500.5 $13,347.3 $13,751.1 $14,599.2Total Debt Service as a % of Operating Rev/Subsidies after BTL Adj. 16% 17% 17% 17% 17%
Non-reimbursable Expenses $12,716.9 $13,126.8 $13,892.8 $14,348.1 $14,919.4 $15,681.3Total Debt Service as % of Non-reimbursable Expenses 14% 15% 15% 16% 16% 16%
Non-reimbursable Expenses after Below the Line Adjustments $13,126.8 $13,916.1 $14,452.6 $15,015.5 $15,771.7Total Debt Service as a % of Non-Reimbursable Exp after BTL Adj. 15% 15% 16% 16% 16%
Notes on the following page are integral to this table.

Notes
1 Unhedged tax-exempt variable rate debt reflects actual rates through September 2011, and 4.00% for the remaining life of bonds.
2
3
4
5
6
7
8
9
Special Notes
(1)
(2)
Synthetic fixed-rate debt assumed at swap rate.
Total debt service excludes COPS lease payments. All debt service numbers reduced by expected investment income and Build America Bonds (BAB) subsidy.
New money bonds amortized as 30-year level debt. New debt issued assumed 90% fixed-rate and 10% variable rate. Actual 2010 issuance is included with the forecast and is reflective of new money bonds and notes.
Transportation Revenue Bonds pledged revenues consist generally of the following: fares and other miscellaneous revenues from the transit and commuter systems, including advertising, rental income and certain concession revenues (not including Grand Central and Penn Station); revenues from the distribution to the transit and commuter system of TBTA surplus; State and local general operating subsidies, including the new State taxes and fees; special tax-supported operating subsidies after the payment of debt service on the MTA Dedicated Tax Fund Bonds; New York City urban tax for transit; station maintenance and service reimbursements; and revenues from the investment of capital program funds. Pledged revenues secure Transportation Revenue Bonds before the payment of operating and maintenance expenses. Starting in 2006, revenues, expenses and debt service for MTA Bus have also been included.
Debt service associated with the approved portion of the 2010-2014 Capital Programs is included in the table above.
Dedicated Tax Fund pledged revenues as shown above consist generally of the following: petroleum business tax, motor fuel tax and motor vehicle fees deposited into the Dedicated Mass Transportation Trust Fund for the benefit of the MTA; in addition, while not reflected in the DTF pledged revenue figures above, the petrolium bussiness tax, district sales tax, franchaise taxes and temporary franchaise surcharges deposited into the Metropolitan Transporation Operating Assistance Account for the benefit of the MTA are also pledged. After the payment of debt service on the MTA Dedicated Tax Fund Bonds, these subsidies are available to pay debt service on the MTA Transporation Revenue Bonds, and then any remaining amounts are avaialable to be used to meet operating costs of the transit system, the commuter system, and SIRTOA.
Triborough Bridge and Tunnel Authority General Revenue Bond pledged revenues consist primarily of the tolls charged by TBTA on its seven bridges and two tunnels. Pledged revenues secure TBTA General Revenue Bonds after the payment of TBTA operating and maintenance expenses, including certain reserves.
Triborough Bridge and Tunnel Authority Subordinate Revenue Bonds pledged revenues consist primarily of the tolls charged by TBTA on its seven bridges and two tunnels, after the payment of debt service on the TBTA General Revenue Bonds.
Debt service schedules for each credit are attached as addendum hereto.
This is a revision to the Debt Affordability Schedule printed in the November Financial Plan 2012-2015. The previous schedule did not reflect the updated November Financial Plan Forecasted New Money Bonds Issued and Debt Service. Those numbers have been revised above.

Metropolitan Transportation Authority (including Triborough Bridge and Tunnel Authority)Total Budgeted Annual Debt ServiceAll Issuance to November 2011 ($ in millions)
Fiscal Year Existing DS Additional DS Combined Existing DS Additional DS Combined Existing DS Additional DS Combined Existing DS Additional DS Combined Existing DS Additional DS Combined
2011 954.0 - 954.0 356.1 - 356.1 461.4 - 461.4 147.6 - 147.6 1,919.1 - 1,919.1
2012 1,029.1 78.3 1,107.4 365.4 12.1 377.5 465.3 5.0 470.4 145.9 - 145.9 2,005.7 95.4 2,101.2
2013 1,025.1 182.1 1,207.2 367.3 33.5 400.8 468.6 21.7 490.3 145.1 - 145.1 2,006.1 237.3 2,243.4
2014 1,034.6 275.1 1,309.8 365.8 50.5 416.3 467.9 50.7 518.6 145.9 - 145.9 2,014.3 376.3 2,390.7
2015 1,034.5 366.3 1,400.8 368.3 58.1 426.4 467.9 87.3 555.3 145.2 - 145.2 2,015.9 511.8 2,527.7
2016 1,044.5 433.3 1,477.8 368.4 58.1 426.5 467.0 122.6 589.6 146.0 - 146.0 2,026.0 614.0 2,640.0
2017 1,047.1 454.8 1,501.8 368.6 58.1 426.6 468.9 150.0 618.9 148.3 - 148.3 2,032.8 662.9 2,695.7
2018 1,047.8 454.8 1,502.6 367.9 58.1 426.0 465.7 168.4 634.2 146.1 - 146.1 2,027.5 681.3 2,708.9
2019 1,048.8 454.8 1,503.6 362.2 58.1 420.3 461.5 178.6 640.1 145.8 - 145.8 2,018.3 691.5 2,709.9
2020 1,048.3 454.8 1,503.1 364.4 58.1 422.5 461.7 183.0 644.7 145.2 - 145.2 2,019.5 695.9 2,715.4
2021 1,049.2 454.8 1,504.0 363.2 58.1 421.3 458.8 184.6 643.4 145.9 - 145.9 2,017.1 697.5 2,714.6
2022 1,048.7 454.8 1,503.5 360.1 58.1 418.2 462.8 185.0 647.8 145.4 - 145.4 2,016.9 697.9 2,714.8
2023 1,059.3 454.8 1,514.1 363.0 58.1 421.1 456.4 185.0 641.4 146.1 - 146.1 2,024.9 697.9 2,722.8
2024 1,060.4 454.8 1,515.2 362.4 58.1 420.5 452.2 185.0 637.2 146.0 - 146.0 2,021.0 697.9 2,718.9
2025 1,066.9 454.8 1,521.7 362.2 58.1 420.3 452.4 185.0 637.4 146.0 - 146.0 2,027.4 697.9 2,725.3
2026 1,108.2 454.8 1,563.0 359.9 58.1 417.9 451.7 185.0 636.7 146.2 - 146.2 2,066.0 697.9 2,763.9
2027 1,095.8 454.8 1,550.6 352.9 58.1 411.0 454.7 185.0 639.8 146.2 - 146.2 2,049.7 697.9 2,747.6
2028 1,096.4 454.8 1,551.2 360.4 58.1 418.5 466.9 185.0 652.0 146.5 - 146.5 2,070.2 697.9 2,768.1
2029 1,096.4 454.8 1,551.2 360.2 58.1 418.3 465.9 185.0 650.9 146.4 - 146.4 2,068.9 697.9 2,766.8
2030 1,099.0 454.8 1,553.8 359.2 58.1 417.2 468.0 185.0 653.0 146.7 - 146.7 2,072.9 697.9 2,770.8
2031 1,122.6 454.8 1,577.4 356.5 58.1 414.6 484.8 185.0 669.8 140.8 - 140.8 2,104.7 697.9 2,802.6
2032 1,027.7 454.8 1,482.5 359.4 58.1 417.5 407.8 185.0 592.9 86.4 - 86.4 1,881.3 697.9 2,579.3
2033 725.8 454.8 1,180.6 333.7 58.1 391.8 193.1 185.0 378.2 - - - 1,252.7 697.9 1,950.6
2034 728.1 454.8 1,182.9 182.7 58.1 240.8 197.9 185.0 382.9 - - - 1,108.6 697.9 1,806.5
2035 702.9 454.8 1,157.7 131.3 58.1 189.3 227.9 185.0 413.0 - - - 1,062.1 697.9 1,760.0
2036 524.5 454.8 979.3 146.0 58.1 204.1 221.8 185.0 406.8 - - - 892.4 697.9 1,590.3
2037 511.5 454.8 966.3 334.1 58.1 392.2 222.8 185.0 407.9 - - - 1,068.4 697.9 1,766.4
2038 459.4 454.8 914.2 322.8 58.1 380.9 203.5 185.0 388.6 - - - 985.7 697.9 1,683.6
2039 390.8 454.8 845.6 271.3 58.1 329.4 62.8 185.0 247.8 - - - 724.9 697.9 1,422.9
2040 261.2 454.8 716.0 29.9 58.1 88.0 19.9 185.0 205.0 - - - 311.1 697.9 1,009.0
2041 78.6 468.7 547.3 - 58.1 58.1 - 185.0 185.0 - - - 78.6 711.8 790.4
2042 46.5 376.5 423.0 - 46.0 46.0 - 180.0 180.0 - - - 46.5 602.5 649.0
2043 46.5 272.7 319.3 - 24.6 24.6 - 163.4 163.4 - - - 46.5 460.6 507.2
2044 46.5 179.7 226.2 - 7.6 7.6 - 134.3 134.3 - - - 46.5 321.6 368.1
2045 46.5 88.5 135.0 - - - - 97.7 97.7 - - - 46.5 186.2 232.7
2046 45.2 21.5 66.7 - - - - 62.4 62.4 - - - 45.2 83.9 129.2
Notes: Does not include debt service for State Service Contract Bonds and Convention Center Bonds, which is paid by NY State. Also excludes COPS lease payments.
Includes interest budgeted for Transportation Revenue Commercial Paper.Forecasted Investment Income is not included above.Net of Build America Bonds subsidy. Debt Service associated with the approved portion of the 2010-2014 Capital Programs is included in the table above.
Addendum to MTA Debt Affordability Statement
MTA and TBTA Debt ServiceTransportation Revenue Resolution Dedicated Tax Fund Resolution TBTA General Revenue Resolution TBTA Subordinate Resolution

Category
2011 Final
Estimate
2012 Adopted Budget 2013 2014 2015
Baseline Total Positions 66,804 65,763 65,671 65,949 66,192 NYC Transit 45,715 45,599 45,468 45,536 45,506 Long Island Rail Road 6,480 6,508 6,525 6,712 6,857 Metro-North Railroad 6,235 6,319 6,366 6,400 6,414 Bridges & Tunnels 1,663 1,639 1,639 1,639 1,639 Headquarters 1,732 1,765 1,748 1,748 1,778 Long Island Bus 1,048 - - - - Staten Island Railway 266 267 267 267 267 Capital Construction Company 140 140 140 140 140 Bus Company 3,525 3,526 3,518 3,507 3,591
1,041 92 (278) (243) Non-Reimbursable 60,318 59,758 59,826 60,161 60,425 NYC Transit 40,819 41,071 41,153 41,278 41,262 Long Island Rail Road 5,849 5,940 5,904 6,091 6,243 Metro-North Railroad 5,589 5,709 5,756 5,790 5,804 Bridges & Tunnels 1,619 1,595 1,595 1,595 1,595 Headquarters 1,684 1,717 1,700 1,700 1,730 Long Island Bus 1,033 - - - - Staten Island Railway 263 264 264 264 264 Capital Construction Company - - - - - Bus Company 3,462 3,462 3,454 3,443 3,527
560 (68) (335) (264) Reimbursable 6,486 6,005 5,845 5,788 5,767 NYC Transit 4,896 4,528 4,315 4,258 4,244 Long Island Rail Road 631 568 621 621 614 Metro-North Railroad 646 610 610 610 610 Bridges & Tunnels 44 44 44 44 44 Headquarters 48 48 48 48 48 Long Island Bus 15 - - - - Staten Island Railway 3 3 3 3 3 Capital Construction Company 140 140 140 140 140 Bus Company 63 64 64 64 64
481 160 57 21 Total Full-Time 66,535 65,592 65,500 65,778 66,021 NYC Transit 45,561 45,444 45,313 45,381 45,351 Long Island Rail Road 6,480 6,508 6,525 6,712 6,857 Metro-North Railroad 6,234 6,318 6,365 6,399 6,413 Bridges & Tunnels 1,663 1,639 1,639 1,639 1,639 Headquarters 1,732 1,765 1,748 1,748 1,778 Long Island Bus 949 - - - - Staten Island Railway 266 267 267 267 267 Capital Construction Company 140 140 140 140 140 Bus Company 3,510 3,511 3,503 3,492 3,576
943 92 (278) (243) Total Full-Time-Equivalents 269 171 171 171 171 NYC Transit 154 155 155 155 155 Long Island Rail Road - - - - - Metro-North Railroad 1 1 1 1 1 Bridges & Tunnels - - - - - Headquarters - - - - - Long Island Bus 99 - - - - Staten Island Railway - - - - - Capital Construction Company - - - - - Bus Company 15 15 15 15 15
98 - - -
METROPOLITAN TRANSPORTATION AUTHORITY
Non-Reimbursable/Reimbursable and Full-Time/Full-Time EquivalentsTotal Baseline Positions by Agency
(1) Technical Adjustments include revised departmental headcount. However, the headcount revisions do not impact the bottom line totals approved at the December board meeting.
February Financial Plan 2012-2015

Function
2011 Final
Estimate
2012 Adopted Budget 2013 2014 2015
Administration 4,452 4,216 4,188 4,194 4,204 NYC Transit 1,987 1,806 1,795 1,788 1,787 Long Island Rail Road 634 636 636 642 652 Metro-North Railroad 495 509 508 508 505 Bridges & Tunnels 73 50 50 50 50 Headquarters 951 983 966 966 966 Long Island Bus 71 - - - - Staten Island Railway 22 21 21 21 21 Capital Construction Company 41 41 41 41 41 Bus Company 178 170 171 178 182
236 28 (6) (10) Operations 29,595 28,982 28,913 29,083 29,190 NYC Transit 21,581 21,635 21,552 21,551 21,548 Long Island Rail Road 2,086 2,099 2,096 2,253 2,346 Metro-North Railroad 2,087 2,128 2,145 2,159 2,176 Bridges & Tunnels 769 769 769 769 769 Headquarters - - - - - Long Island Bus 722 - - - - Staten Island Railway 95 91 91 91 91 Capital Construction Company - - - - - Bus Company 2,255 2,260 2,260 2,260 2,260
613 69 (170) (107) Maintenance 29,467 29,280 29,285 29,387 29,483 NYC Transit 20,422 20,436 20,399 20,475 20,449 Long Island Rail Road 3,643 3,660 3,680 3,704 3,746 Metro-North Railroad 3,556 3,585 3,616 3,636 3,636 Bridges & Tunnels 402 398 398 398 398 Headquarters - - - - - Long Island Bus 249 - - - - Staten Island Railway 149 155 155 155 155 Capital Construction Company - - - - - Bus Company 1,046 1,046 1,037 1,019 1,099
187 (5) (102) (96) Engineering/Capital 1,716 1,713 1,713 1,713 1,713 NYC Transit 1,218 1,218 1,218 1,218 1,218 Long Island Rail Road 117 113 113 113 113 Metro-North Railroad 97 97 97 97 97 Bridges & Tunnels 148 148 148 148 148 Headquarters - - - - - Long Island Bus 3 - - - - Staten Island Railway - - - - - Capital Construction Company 99 99 99 99 99 Bus Company 34 38 38 38 38
. 3 - - - Public Safety 1,574 1,572 1,572 1,572 1,602 NYC Transit 507 504 504 504 504 Long Island Rail Road - - - - - Metro-North Railroad - - - - - Bridges & Tunnels 271 274 274 274 274 Headquarters 781 782 782 782 812 Long Island Bus 3 - - - - Staten Island Railway - - - - - Capital Construction CompanyBus Company 12 12 12 12 12
2 - - (30)
Total Baseline Positions by Function and AgencyFebruary Financial Plan 2012-2015
METROPOLITAN TRANSPORTATION AUTHORITY
(1) Technical Adjustments include revised departmental headcount. However, the headcount revisions do not impact the bottom line totals approved at the December board meeting.

FUNCTION/OCCUPATIONAL GROUP
2011 Final
Estimate
2012 Adopted Budget 2013 2014 2015
Administration Managers/Supervisors 1,583 1,528 1,519 1,519 1,528 Professional, Technical, Clerical 2,701 2,515 2,496 2,495 2,492 Operational Hourlies 168 173 173 180 184
Total Administration 4,452 4,216 4,188 4,194 4,204 236 28 (6) (10)
Operations Managers/Supervisors 3,223 3,196 3,172 3,170 3,168 Professional, Technical, Clerical 1,151 1,116 1,115 1,115 1,115 Operational Hourlies 25,221 24,670 24,626 24,798 24,907
Total Operations 29,595 28,982 28,913 29,083 29,190 613 69 (170) (107)
Maintenance Managers/Supervisors 4,877 4,847 4,825 4,833 4,867 Professional, Technical, Clerical 2,401 2,387 2,364 2,355 2,351 Operational Hourlies 22,189 22,046 22,096 22,199 22,265
Total Maintenance 29,467 29,280 29,285 29,387 29,483 187 (5) (102) (96)
Engineering/Capital Managers/Supervisors 446 446 446 446 446 Professional, Technical, Clerical 1,268 1,265 1,265 1,265 1,265 Operational Hourlies 2 2 2 2 2
Total Engineering/Capital 1,716 1,713 1,713 1,713 1,713 3 - - -
Public Safety Managers/Supervisors 185 185 185 185 185 Professional, Technical, Clerical 138 139 139 139 139 Operational Hourlies 1,251 1,248 1,248 1,248 1,278
Total Public Safety 1,574 1,572 1,572 1,572 1,602 2 - - (30)
Baseline Total Positions Managers/Supervisors 10,314 10,202 10,147 10,153 10,194 Professional, Technical, Clerical 7,659 7,422 7,379 7,369 7,362 Operational Hourlies 48,831 48,139 48,145 48,427 48,636
Baseline Total Positions 66,804 65,763 65,671 65,949 66,192 1,041 92 (278) (243)
(1) Technical Adjustments include revised departmental headcount. However, the headcount revisions do not impact the bottom line totals approved at the
Metropolitan Transportation AuthorityFebruary Financial Plan 2012-2015
Total Positions by Function and Occupation

Category Change
2012-2011 Change
2013-2012 Change
2014-2013 Change
2015-2014
Baseline Total Positions 1,041 92 (278) (243) NYC Transit 116 131 (68) 30 Long Island Rail Road (28) (17) (187) (145) Metro-North Railroad (84) (47) (34) (14) Bridges & Tunnels 24 - - - Headquarters (33) 17 - (30) Long Island Bus 1,048 - - - Staten Island Railway (1) - - - Capital Construction Company - - - - Bus Company (1) 8 11 (84)
Non-Reimbursable 560 (68) (335) (264) NYC Transit (252) (82) (125) 16 Long Island Rail Road (91) 36 (187) (152) Metro-North Railroad (120) (47) (34) (14) Bridges & Tunnels 24 - - - Headquarters (33) 17 - (30) Long Island Bus 1,033 - - - Staten Island Railway (1) - - - Capital Construction Company - - - - Bus Company - 8 11 (84)
Reimbursable 481 160 57 21 NYC Transit 368 213 57 14 Long Island Rail Road 63 (53) - 7 Metro-North Railroad 36 - - - Bridges & Tunnels - - - - Headquarters - - - - Long Island Bus 15 - - - Staten Island Railway - - - - Capital Construction Company - - - - Bus Company (1) - - -
Total Full-Time 943 92 (278) (243) NYC Transit 117 131 (68) 30 Long Island Rail Road (28) (17) (187) (145) Metro-North Railroad (84) (47) (34) (14) Bridges & Tunnels 24 - - - Headquarters (33) 17 - (30) Long Island Bus 949 - - - Staten Island Railway (1) - - - Capital Construction Company - - - - Bus Company (1) 8 11 (84)
Total Full-Time Equivalents 98 - - - NYC Transit (1) - - - Long Island Rail Road - - - - Metro-North Railroad - - - - Bridges & Tunnels - - - - Headquarters - - - - Long Island Bus 99 - - - Staten Island Railway - - - - Capital Construction Company - - - - Bus Company - - - -
Non-Reimbursable/Reimbursable and Full-Time/Full-Time EquivalentsYear-to-Year Changes for Positions by Agency
February Financial Plan 2012-2015METROPOLITAN TRANSPORTATION AUTHORITY
Favorable/(Unfavorable)

FUNCTION Change
2012-2011 Change
2013-2012 Change
2014-2013 Change
2015-2014
Administration 236 28 (6) (10) NYC Transit 181 11 7 1 Long Island Rail Road (2) - (6) (10) Metro-North Railroad (14) 1 - 3 Bridges & Tunnels 23 - - - Headquarters (32) 17 - - Long Island Bus 71 - - - Staten Island Railway 1 - - - Capital Construction Company - - - - Bus Company 8 (1) (7) (4)
Operations 613 69 (170) (107) NYC Transit (54) 83 1 3 Long Island Rail Road (13) 3 (157) (93) Metro-North Railroad (41) (17) (14) (17) Bridges & Tunnels - - - - Headquarters - - - - Long Island Bus 722 - - - Staten Island Railway 4 - - - Capital Construction Company - - - - Bus Company (5) - - -
Maintenance 187 (5) (102) (96) NYC Transit (14) 37 (76) 26 Long Island Rail Road (17) (20) (24) (42) Metro-North Railroad (29) (31) (20) - Bridges & Tunnels 4 - - - Headquarters - - - - Long Island Bus 249 - - - Staten Island Railway (6) - - - Capital Construction Company - - - - Bus Company - 9 18 (80)
Engineering/Capital 3 - - - NYC Transit - - - - Long Island Rail Road 4 - - - Metro-North Railroad - - - - Bridges & Tunnels - - - - Headquarters - - - - Long Island Bus 3 - - - Staten Island Railway - - - - Capital Construction Company - - - - Bus Company (4) - - -
Public Safety 2 - - (30) NYC Transit 3 - - - Long Island Rail Road - - - - Metro-North Railroad - - - - Bridges & Tunnels (3) - - - Headquarters (1) - - (30) Long Island Bus 3 - - - Staten Island Railway - - - - Capital Construction Company - - - - Bus Company - - - -
METROPOLITAN TRANSPORTATION AUTHORITYFebruary Financial Plan 2012-2015
Year-to-Year Changes for Positions by Function and Agency
Favorable/(Unfavorable)

FUNCTION/OCCUPATIONAL GROUPChange
2012-2011Change
2013-2012Change
2014-2013Change
2015-2014
Administration Managers/Supervisors 55 9 - (9) Professional, Technical, Clerical 186 19 1 3 Operational Hourlies (5) - (7) (4)
Total Administration 236 28 (6) (10)
Operations Managers/Supervisors 27 24 2 2 Professional, Technical, Clerical 35 1 - - Operational Hourlies 551 44 (172) (109)
Total Operations 613 69 (170) (107)
Maintenance Managers/Supervisors 30 22 (8) (34) Professional, Technical, Clerical 14 23 9 4 Operational Hourlies 143 (50) (103) (66)
Total Maintenance 187 (5) (102) (96)
Engineering/Capital Managers/Supervisors - - - - Professional, Technical, Clerical 3 - - - Operational Hourlies - - - -
Total Engineering/Capital 3 - - -
Public Safety Managers/Supervisors - - - - Professional, Technical, Clerical (1) - - - Operational Hourlies 3 - - (30)
Total Public Safety 2 - - (30)
Baseline Total Positions Managers/Supervisors 112 55 (6) (41) Professional, Technical, Clerical 237 43 10 7 Operational Hourlies 692 (6) (282) (209)
Baseline Total Positions 1,041 92 (278) (243)
Metropolitan Transportation Authority
Favorable/(Unfavorable)
Year-to-Year Changes for Positions by Function and Occupational GroupFebruary Financial Plan 2012-2015

Category 2011 2012 2013 2014* 2015
Baseline Total Positions - - - - - NYC Transit - - - - - Long Island Rail Road - - - - - Metro-North Railroad - - - - - Bridges & Tunnels - - - - - Headquarters - - - - - Long Island Bus - - - - - Staten Island Railway - - - - - Capital Construction Company - - - - - Bus Company - - - - -
Non-Reimbursable - - - 1 - NYC Transit - - - - - Long Island Rail Road - - - 1 - Metro-North Railroad - - - - - Bridges & Tunnels - - - - - Headquarters - - - - - Long Island Bus - - - - - Staten Island Railway - - - - - Capital Construction Company - - - - - Bus Company - - - - -
Reimbursable - - - - - NYC Transit - - - - - Long Island Rail Road - - - - - Metro-North Railroad - - - - - Bridges & Tunnels - - - - - Headquarters - - - - - Long Island Bus - - - - - Staten Island Railway - - - - - Capital Construction Company - - - - - Bus Company - - - - -
Total Full-Time - - - - - NYC Transit - - - - - Long Island Rail Road - - - - - Metro-North Railroad - - - - - Bridges & Tunnels - - - - - Headquarters - - - - - Long Island Bus - - - - - Staten Island Railway - - - - - Capital Construction Company - - - - - Bus Company - - - - -
Total Full-Time-Equivalents - - - - - NYC Transit - - - - - Long Island Rail Road - - - - - Metro-North Railroad - - - - - Bridges & Tunnels - - - - - Headquarters - - - - - Long Island Bus - - - - - Staten Island Railway - - - - - Capital Construction Company - - - - - Bus Company - - - - -
* In 2014, the variance reflects a rounding correction, not a reduction in a non-reimbursable position.
METROPOLITAN TRANSPORTATION AUTHORITYFebruary Financial Plan 2012-2015
Baseline Change Between 2012 February Financial Plan vs. 2011 November Financial PlanNon-Reimbursable/Reimbursable and Full-Time/Full-Time Equivalents
By Agency
Favorable/(Unfavorable)

Function 2011 2012 2013 2014* 2015
Administration - 1 1 1 1 NYC Transit - - - - - Long Island Rail Road - - - - - Metro-North Railroad - - - - - Bridges & Tunnels - - - - - Headquarters - 1 1 1 1 Long Island Bus - - - - - Staten Island Railway - - - - - Capital Construction Company - - - - - Bus Company - - - - -
Operations - - - - - NYC Transit - - - - - Long Island Rail Road - - - - - Metro-North Railroad - - - - - Bridges & Tunnels - - - - - Headquarters - - - - - Long Island Bus - - - - - Staten Island Railway - - - - - Capital Construction Company - - - - - Bus Company - - - - -
Maintenance - - - - - NYC Transit - - - - - Long Island Rail Road - - - - - Metro-North Railroad - - - - - Bridges & Tunnels - - - - - Headquarters - - - - - Long Island Bus - - - - - Staten Island Railway - - - - - Capital Construction Company - - - - - Bus Company - - - - -
Engineering/Capital - - - - - NYC Transit - - - - - Long Island Rail Road - - - - - Metro-North Railroad - - - - - Bridges & Tunnels - - - - - Headquarters - - - - - Long Island Bus - - - - - Staten Island Railway - - - - - Capital Construction Company - - - - - Bus Company - - - - -
Public Safety - (1) (1) (1) (1) NYC Transit - - - - - Long Island Rail Road - - - - - Metro-North Railroad - - - - - Bridges & Tunnels - - - - - Headquarters - (1) (1) (1) (1) Long Island Bus - - - - - Staten Island Railway - - - - - Capital Construction Company - - - - - Bus Company - - - - -
Baseline Change Between 2012 February Financial Plan vs. 2011 November Financial PlanBy Function and Agency
Favorable/(Unfavorable)
METROPOLITAN TRANSPORTATION AUTHORITYFebruary Financial Plan 2012-2015

2011 2012 2013 2014 2015
Administration Managers/Supervisors - - - - - Professional, Technical, Clerical - 1 1 1 1 Operational Hourlies - - - - -
Total Administration - 1 1 1 1
Operations Managers/Supervisors (1) (1) (1) (1) (1) Professional, Technical, Clerical - - - - - Operational Hourlies 1 1 1 1 1
Total Operations - - - - -
Maintenance Managers/Supervisors - - - - - Professional, Technical, Clerical - - - - - Operational Hourlies - - - - -
Total Maintenance - - - - -
Engineering/Capital Managers/Supervisors - - - - - Professional, Technical, Clerical - - - - - Operational Hourlies - - - - -
Total Engineering/Capital - - - - -
Public Safety Managers/Supervisors - - - - - Professional, Technical, Clerical - (1) (1) (1) (1) Operational Hourlies - - - - -
Total Public Safety - (1) (1) (1) (1)
Baseline Total Positions Managers/Supervisors (1) (1) (1) (1) (1) Professional, Technical, Clerical - - - - - Operational Hourlies 1 1 1 1 1
Baseline Total Positions - - - - -
FUNCTION/OCCUPATIONAL GROUP
Metropolitan Transportation AuthorityFebruary Financial Plan 2012-2015
Agency Baseline Changes Between 2012 February Financial Plan vs. 2011 November Financial PlanBy Function and Occupational Group
Favorable/(Unfavorable)

[THIS PAGE INTENTIONALLY LEFT BLANK]

IV. Other MTA Consolidated Materials

Line
No
7 Reimbursable 2011 2012
8 2010 Final Adopted
9 Actual Estimate Budget 2013 2014 2015 10 Operating Revenue11 Farebox Revenue $0 $0 $0 $0 $0 $012 Toll Revenue 0 0 0 0 0 013 Other Revenue 0 0 0 0 0 014 Capital and Other Reimbursements 1,449 1,448 1,438 1,405 1,416 1,42815 Total Operating Revenue $1,449 $1,448 $1,438 $1,405 $1,416 $1,428
16
17 Operating Expense
18 Labor Expenses:
19 Payroll $528 $516 $518 $509 $509 $51620 Overtime 124 106 93 93 93 9521 Health & Welfare 47 51 56 61 65 7022 OPEB Current Payment 1 1 0 0 0 023 Pensions 49 50 51 52 54 5724 Other-Fringe Benefits 148 142 141 138 137 13925 Reimbursable Overhead 345 329 329 311 309 30326 Sub-total Labor Expenses $1,241 $1,194 $1,189 $1,165 $1,168 $1,17927
28 Non-Labor Expenses:
29 Electric Power $0 $0 $0 ($0) ($0) ($0)30 Fuel 0 0 0 0 0 031 Insurance 5 9 11 13 13 1332 Claims 0 0 0 0 0 033 Paratransit Service Contracts 1 0 0 0 0 034 Maintenance and Other Operating Contracts 86 88 64 55 56 5635 Professional Service Contracts 34 34 43 50 53 5036 Materials & Supplies 80 117 126 119 122 12437 Other Business Expenses 2 4 5 5 5 538 Sub-total Non-Labor Expenses $208 $253 $249 $241 $248 $24839
40 Other Expense Adjustments:
41 Other $0 $0 $0 $0 $0 $042 Sub-total Other Expense Adjustments $0 $0 $0 $0 $0 $043
44 Environmental Remediation 0 0 0 0 0 045
46 Total Operating Expense $1,449 $1,448 $1,438 $1,405 $1,416 $1,428
47
48 Baseline Surplus/(Deficit) $0 $0 $0 ($0) ($0) $0
Note: The February Plan also reflects the impact of a revised Chart of Accounts. Effective 2012, the account structure has been adjusted to reflect the reclassification and renaming of certain accounts in order to improve reporting consistency among the Agencies. With exception of MTAHQ, these revisions result in a zero-impact to the bottom line. See Agency sections for the Reconciliation to the November Forecast by Generic Category table for details.
($ in millions)
February Financial Plan 2012-2015MTA Consolidated Statement Of Operations By Category
METROPOLITAN TRANSPORTATION AUTHORITY

Line
Number
7 Non-Reimbursable / Reimbursable 2011 2012
8 2010 Final Adopted9 Actual Estimate Budget 2013 2014 2015 10 Operating Revenue11 Farebox Revenue $4,586 $4,991 $5,050 $5,122 $5,208 $5,28612 Toll Revenue 1,417 1,499 1,510 1,508 1,514 1,520 13 Other Revenue 491 496 525 551 589 630 14 Capital and Other Reimbursements 1,449 1,448 1,438 1,405 1,416 1,42815 Total Operating Revenue $7,944 $8,434 $8,523 $8,587 $8,727 $8,864
16
17 Operating Expense
18 Labor Expenses:
19 Payroll $4,699 $4,700 $4,720 $4,717 $4,772 $4,88020 Overtime 567 625 553 549 551 56021 Health & Welfare 785 826 918 999 1,091 1,19222 OPEB Current Payment 357 391 435 484 530 58123 Pensions 1,078 1,140 1,355 1,369 1,420 1,48224 Other-Fringe Benefits 688 625 652 657 669 68625 Reimbursable Overhead (0) (0) (0) (0) (0) (0)26 Sub-total Labor Expenses $8,174 $8,307 $8,633 $8,774 $9,032 $9,38127
28 Non-Labor Expenses:
29 Electric Power $325 $337 $514 $570 $635 $70630 Fuel 190 246 276 291 293 30231 Insurance 15 25 34 45 59 6932 Claims 286 232 205 210 221 23333 Paratransit Service Contracts 381 356 404 468 550 63734 Maintenance and Other Operating Contracts 627 700 597 587 599 63835 Professional Service Contracts 237 222 313 315 322 32436 Materials & Supplies 592 642 616 631 650 70437 Other Business Expenses 191 173 159 163 166 16938 Sub-total Non-Labor Expenses $2,844 $2,933 $3,118 $3,280 $3,494 $3,78039
40 Other Expense Adjustments:
41 Other ($18) $7 $36 $34 $35 $3542 General Reserve 0 0 100 130 135 14543 Sub-total Other Expense Adjustments ($18) $7 $136 $164 $170 $18044
45 Total Operating Expense before Non-Cash Liability Adjs. $11,000 $11,248 $11,887 $12,218 $12,696 $13,341
46
47 Depreciation $1,981 $2,077 $2,179 $2,245 $2,325 $2,42048 OPEB Obligation 1,167 1,241 1,256 1,281 1,306 1,33849 Environmental Remediation 19 9 9 9 9 950
51 Total Operating Expense $14,166 $14,575 $15,331 $15,754 $16,336 $17,109
52
53 Net Operating Deficit Before Subsidies and Debt Service ($6,222) ($6,141) ($6,808) ($7,167) ($7,609) ($8,245)
54
55 Conversion to Cash Basis: Non-Cash Liability Adjs. $3,166 $3,327 $3,444 $3,535 $3,640 $3,76856
57 Debt Service (excludes Service Contract Bonds) (1,781) (1,949) (2,129) (2,271) (2,418) (2,555)58
59 Total Operating Expense with Debt Service $12,781 $13,196 $14,016 $14,489 $15,114 $15,896
60
61 Dedicated Taxes and State/Local Subsidies $4,914 $5,258 $5,415 $5,717 $5,974 $6,197
62
63 Net Deficit After Subsidies and Debt Service $77 $495 ($78) ($186) ($413) ($835)
64
65 Conversion to Cash Basis: GASB Account (67) ($39) (57) (61) (64) (66)66 Conversion to Cash Basis: All Other 20 (423) (120) (268) (342) (399)67
68 CASH BALANCE BEFORE PRIOR-YEAR CARRY-OVER $30 $32 ($254) ($515) ($819) ($1,300)
69 ADJUSTMENTS 0 0 63 594 602 1,096
70 PRIOR-YEAR CARRY-OVER 130 160 192 1 80 0
71 NET CASH BALANCE $160 $192 $1 $80 ($137) ($204)
($ in millions)
February Financial Plan 2012-2015MTA Consolidated Statement Of Operations By Category
METROPOLITAN TRANSPORTATION AUTHORITY
Note: The February Plan also reflects the impact of a revised Chart of Accounts. Effective 2012, the account structure has been adjusted to reflect the reclassification and renaming of certain accounts in order to improve reporting consistency among the Agencies. With exception of MTAHQ, these revisions result in a zero-impact to the bottom line. See Agency sections for the Reconciliation to the November Forecast by Generic Category table for details.

NON-REIMBURSABLE OVERTIME Hours $ %
SCHEDULED:Direct Service 5,512,747 $191.289 41.6%
Programmed Maintenance 423,273 15.813 3.4%
Total Scheduled 5,936,020 $207.102 45.0%
UNSCHEDULED:Vacancy/Absentee Coverage 2,140,332 $83.364 18.1%
Weather Emergencies 329,080 13.466 2.9%
Maintenance 2,299,762 81.484 17.7%
Service Delays 1,085,484 34.690 7.5%
Tour Length 266,261 8.901 1.9%
Emergencies 267,671 8.448 1.8%
Safety/Security/Law Enforcement 214,713 9.487 2.1%
All Other 303,732 12.796 2.8%
Total Unscheduled 6,907,035 $252.635 55.0%
TOTAL NON-REIMBURSABLE OVERTIME: 12,843,055 $459.737 100.0%
REIMBURSABLE OVERTIME 2,636,160 $93.095
TOTAL OVERTIME 15,479,214 $552.833
*Note: Totals may differ due to rounding.
Total
METROPOLITAN TRANSPORTATION AUTHORITY2012 Adopted Budget
2012 Non-Reimbursable/Reimbursable Overtime ($ in millions)

Line
No
7 Cash Receipts and Expenditures 2011 2012
8 2010 Final Adopted
9 Actual Estimate Budget 2013 2014 2015
10 Receipts
11 Farebox Revenue $4,613 $5,041 $5,085 $5,170 $5,250 $5,329
12 Other Operating Revenue 505 548 547 574 612 653
13 Capital and Other Reimbursements 1,427 1,287 1,685 1,393 1,390 1,397
14 Total Receipts $6,544 $6,877 $7,317 $7,137 $7,253 $7,379
15
16 Expenditures
17 Labor:
18 Payroll $4,567 $4,527 $4,632 $4,558 $4,617 $4,709
19 Overtime 543 602 535 525 529 536
20 Health and Welfare 752 855 891 969 1,059 1,157
21 OPEB Current Payment 347 377 419 467 512 561
22 Pensions 1,170 1,097 1,312 1,324 1,354 1,420
23 Other Fringe Benefits 579 581 613 611 624 640
25 Contribution to GASB Fund 67 39 57 61 64 66
26 Reimbursable Overhead 0 0 0 0 0 0
27 Total Labor Expenditures $8,026 $8,079 $8,460 $8,516 $8,759 $9,090
28
29 Non-Labor:
30 Electric Power $327 $363 $518 $565 $629 $698
31 Fuel 195 240 276 288 290 299
32 Insurance 10 33 28 38 53 64
33 Claims 210 216 178 184 195 203
34 Paratransit Service Contracts 386 368 402 466 548 635
35 Maintenance and Other Operating Contracts 551 600 537 496 498 520
36 Professional Service Contracts 202 199 275 275 281 282
37 Materials & Supplies 566 547 645 629 654 703
38 Other Business Expenditures 208 181 157 161 162 165
39 Total Non-Labor Expenditures $2,656 $2,747 $3,016 $3,102 $3,310 $3,568
40
41 Other Expenditure Adjustments:
42 Other $56 $66 $92 $99 $102 $114
43 General Reserve 0 0 100 130 135 145
44 Total Other Expenditure Adjustments $56 $66 $192 $229 $237 $259
45
46 Total Expenditures $10,738 $10,892 $11,668 $11,847 $12,307 $12,917
47
48 Net Cash Deficit Before Subsidies and Debt Service ($4,194) ($4,015) ($4,351) ($4,710) ($5,054) ($5,538)
49
50 Dedicated Taxes and State/Local Subsidies $5,396 $5,364 $5,589 $5,809 $5,966 $6,070
51 Debt Service (excludes Service Contract Bonds) (1,172) (1,316) (1,492) (1,613) (1,731) (1,833)
52
53 CASH BALANCE BEFORE PRIOR-YEAR CARRY-OVER $30 $32 ($254) ($515) ($819) ($1,300)
54 ADJUSTMENTS 0 0 63 594 602 1,096
55 PRIOR-YEAR CARRY-OVER 130 160 192 1 80 0
56 NET CASH BALANCE $160 $192 $1 $80 ($137) ($204)
Note: The February Plan also reflects the impact of a revised Chart of Accounts. Effective 2012, the account structure has been adjusted to reflect the reclassification and renaming of certain accounts in order to improve reporting consistency among the Agencies. With exception of MTAHQ, these revisions result in a zero-impact to the bottom line. See Agency sections for the Reconciliation to the November Forecast by Generic Category table for details.
($ in millions)
METROPOLITAN TRANSPORTATION AUTHORITY
MTA Consolidated Cash Receipts and ExpendituresFebruary Financial Plan 2012-2015

2011 2012
2010 Final Adopted
Actual Estimate Budget 2013 2014 2015 Depreciation
New York City Transit $1,290 $1,370 $1,445 $1,520 $1,595 $1,670
Metro-North Railroad 219 215 236 241 245 251
Long Island Rail Road 319 315 317 309 298 307
MTA Bus Company 40 42 42 42 42 42
MTA Headquarters 25 41 40 30 30 30
Staten Island Railway 9 9 9 9 9 9
Bridges & Tunnels 78 86 90 94 104 112
Sub-Total 1,981 2,077 2,179 2,245 2,325 2,420
Other Post Employment Benefits
New York City Transit $881 $919 $930 $944 $963 $980
Metro-North Railroad 46 56 60 61 62 64
Long Island Rail Road 65 75 77 80 82 84
MTA Bus Company 52 55 55 56 57 58
MTA Headquarters 58 67 71 75 79 84
Bridges & Tunnels 55 57 59 63 60 66
Long Island Bus 9 9 0 0 0 0
Staten Island Railway 2 3 3 3 3 3
Sub-Total 1,167 1,241 1,256 1,281 1,306 1,338
Environmental Remediation
New York City Transit 11 0 0 0 0 0
Metro-North Railroad 4 7 7 7 7 7
Long Island Rail Road (0) 2 2 2 2 2
MTA Bus Company 4 0 0 0 0 0
Bridges & Tunnels 0 0 0 0 0 0
Staten Island Railway 0 0 0 0 0 0
Sub-Total 19 9 9 9 9 9
Operating
New York City Transit (2) (8) 115 56 61 51
Metro-North Railroad (45) (18) (36) (26) (47) (29)
Long Island Rail Road (25) 19 24 5 (7) (7)
MTA Bus Company 24 (27) (5) 6 4 5
MTA Headquarters (17) (7) (13) (13) (9) (8)
Long Island Bus 17 (18) 0 0 0 0
Staten Island Railway 2 (0) (5) (0) (0) (0)
First Mutual Transportation Assurance Company (29) (33) (32) (33) (39) (49)
Other 14 20 68 20 20 20
Sub-Total (61) (72) 115 15 (17) (17)
Subsidies
New York City Transit (26) (337) (192) (228) (260) (296)
Commuter Railroads 105 (36) (74) (90) (104) (119)
Headquarters (26) (28) (28) (27) (23) (26)
MTA Bus Company (46) (10) 2 1 (2) (6)
Long Island Bus 6 18 0 0 0 0
Staten Island Railway 2 2 0 0 0 0
Sub-Total 15 (390) (291) (343) (389) (447)
Total Cash Conversion $3,120 $2,864 $3,268 $3,207 $3,235 $3,304
METROPOLITAN TRANSPORTATION AUTHORITYFebruary Financial Plan 2012-2015
Cash Conversion Detail($ in millions)

Line
Number
9 Non-Reimbursable 2011 2012
10 2010 Final Change Adopted Change Change Change Change
11 Actual Estimate 2011 - 2010 Budget 2012 - 2011 2013 2013 - 2012 2014 2014 - 2013 2015 2015 - 2014
12 Operating Revenue
13 Farebox Revenue $4,586 $4,991 $405 $5,050 $59 $5,122 $72 $5,208 $86 $5,286 $78
14 Toll Revenue 1,417 1,499 81 1,510 12 1,508 (2) 1,514 6 1,520 7
15 Other Revenue 491 496 5 525 28 551 27 589 38 630 41
16 Capital and Other Reimbursements 0 0 0 0 0 0 0 0 0 0 017 Total Operating Revenue $6,495 $6,986 $491 $7,085 $99 $7,181 $96 $7,311 $130 $7,437 $12618
19 Operating Expense
20 Labor Expenses:21 Payroll $4,171 $4,184 ($13) $4,202 ($18) $4,208 ($6) $4,263 ($55) $4,363 ($100)22 Overtime 443 519 (76) 460 59 455 4 457 (2) 465 (8)23 Health & Welfare 738 775 (37) 863 (87) 938 (75) 1,026 (88) 1,122 (97)24 OPEB Current Payment 356 390 (34) 435 (45) 484 (49) 530 (47) 581 (51)25 Pensions 1,030 1,090 (60) 1,303 (213) 1,316 (13) 1,366 (49) 1,425 (60)26 Other-Fringe Benefits 540 483 57 511 (28) 519 (8) 532 (12) 547 (15)27 Reimbursable Overhead (345) (329) (16) (330) 1 (312) (18) (310) (2) (303) (7)28 Sub-total Labor Expenses $6,933 $7,113 ($180) $7,444 ($331) $7,609 ($165) $7,864 ($255) $8,201 ($337)29
30 Non-Labor Expenses:31 Electric Power $325 $337 ($12) $513 ($176) $570 ($56) $635 ($65) $706 ($71)32 Fuel 190 246 (56) 276 (30) 291 (15) 293 (2) 302 (9)33 Insurance 10 15 (6) 23 (8) 33 (10) 46 (13) 56 (10)34 Claims 285 232 54 205 27 210 (5) 221 (11) 233 (12)35 Paratransit Service Contracts 380 356 24 404 (48) 468 (64) 550 (82) 637 (87)36 Maintenance and Other Operating Contracts 542 612 (71) 534 78 532 2 543 (11) 582 (38)37 Professional Service Contracts 203 187 16 270 (83) 265 5 269 (4) 274 (5)38 Materials & Supplies 511 524 (13) 491 34 512 (21) 528 (16) 580 (52)39 Other Business Expenses 190 170 20 154 16 158 (4) 160 (2) 163 (3)40 Sub-total Non-Labor Expenses $2,636 $2,680 ($44) $2,870 ($189) $3,039 ($170) $3,246 ($206) $3,532 ($286)41
42 Other Expense Adjustments:43 Other ($18) $7 (25) $36 (29) $34 1 $35 (0) $35 (0)44 General Reserve 0 0 0 100 (100) 130 (30) 135 (5) 145 (10)45 Sub-total Other Expense Adjustments ($18) $7 ($25) $136 ($129) $164 ($29) $170 ($5) $180 ($10)47 Total Operating Expense before Non-Cash Liability Adjs. $9,550 $9,800 ($250) $10,449 ($649) $10,813 ($364) $11,279 ($467) $11,913 ($634)48
49 Depreciation 1,981 2,077 (96) 2,179 (102) 2,245 (66) 2,325 (79) 2,420 (96)50 OPEB Obligation 1,167 1,241 (74) 1,256 (15) 1,281 (25) 1,306 (25) 1,338 (32)51 Environmental Remediation 19 9 10 9 (0) 9 (0) 9 (0) 9 (0)52
53 Total Operating Expense $12,717 $13,127 ($410) $13,893 ($766) $14,348 ($455) $14,919 ($571) $15,681 ($762)
54
55 LessB&T Depreciation 78 86 (7.8) 90 (4.3) 94 (4.5) 104 (10.0) 112 (7.3)54
55 Net Operating Deficit Before Subsidies and Debt Service ($6,222) ($6,141) $81 ($6,808) ($667) ($7,167) ($359) ($7,609) ($442) ($8,245) ($636)56
57 Conversion to Cash Basis: Non-Cash Liability Adjs. $3,166 $3,326 ($160) $3,444 ($117) $3,535 ($92) $3,640 ($105) $3,768 ($128)58
59 Debt Service (excludes Service Contract Bonds) (1,781) (1,949) (167) (2,129) (181) (2,271) (142) (2,418) (147) (2,555) (137)60
61 Total Operating Expense with Debt Service $11,332 $11,749 ($417) $12,578 ($829) $13,084 ($506) $13,698 ($614) $14,469 ($771)62
63 Dedicated Taxes and State/Local Subsidies $4,914 $5,258 $344 $5,415 $158 $5,717 $302 $5,974 $257 $6,197 $22264
65 Net Deficit After Subsidies and Debt Service $77 $495 $418 ($78) ($573) ($186) ($108) ($413) ($227) ($835) ($422)66
67 Conversion to Cash Basis: GASB Account (67) (39) (28) (57) 17 (61) 4 (64) 3 (66) 2
68 Conversion to Cash Basis: All Other 20 (423) 443 (120) (303) (268) 148 (342) 74 (399) 57
69
70 CASH BALANCE BEFORE PRIOR YEAR CARRYOVER $30 $32 $3 ($254) ($287) ($515) ($260) ($819) ($304) ($1,300) ($481)
February Financial Plan 2012-2015METROPOLITAN TRANSPORTATION AUTHORITY
Changes Year-to-Year By CategoryFavorable/(Unfavorable)
($ in millions)

Explanation Explanation Explanation Explanation Explanation
Long Island Rail Road Air Rights ‐$ 3.0$ Through a formal RFP process, the MTA and LIRR have identified a property owner interested in purchasing real estate along the right of way
$ ‐ ‐$ ‐$
Long Island Rail Road 2011 Budget Reduction Program
2.9$ Non‐recurring Budget Reduction Program Savings in 2011.
$ ‐ $ ‐ ‐$ ‐$
MTA Headquarters 2011 BRP ‐ Operating/
Capital Project Reduction
1.1$ The Portable Radio Replacement project for all MTA Police was able to secure funding of $0.4 million from the Near Term Security Fund. The MTAPD C3 project utilized existing funding under the IESS Project umbrella of $0.7 million for computer equipment and configuration of the new equipment at the new C‐3 location.
‐$ $ ‐ ‐$ ‐$
New York City Transit 2011 Budget Reduction Program
12.0$ Non‐recurring Budget Reduction Program Savings in 2011.
‐$ $ ‐ ‐$ ‐$
Metro‐North Railroad 2011 Budget Reduction Program
2.7$ East of Hudson service, West of Hudson service, and payroll savings from hiring delays.
‐$ $ ‐ ‐$ ‐$
MTA Bus None ‐$ ‐$ $ ‐ ‐$ ‐$
Long Island Bus None ‐$ ‐$ $ ‐ ‐$ ‐$
Staten Island Railway None ‐$ ‐$ $ ‐ ‐$ ‐$
MTA Capital Construction None ‐$ ‐$ $ ‐ ‐$ ‐$
MTA 2011Tropical StormIrene Reimb.
‐$ 49.3$ Insurance/FEMA reimbursement for expenses incurred as a result of Tropical Storm Irene (August 2011).
$ ‐ ‐$ ‐$
Metropolitan Transportation Authority
2015 Plan
Non-Recurring Revenue and Savings
($ in millions)
February Financial Plan 2012-2015
2011 Final Estimate 2012 Adopted Budget 2013 Plan 2014 Plan

2011 2012 Final Adopted
Estimate Budget 2013 2014 2015
MTA General Reserve $0.0 $100.0 $130.0 $135.0 $145.0
GASB Fund Reserve $443.6 $502.4 $565.3 $631.3 $699.6
METROPOLITAN TRANSPORTATION AUTHORITYFebruary Financial Plan 2012-2015Operating Budget Reserves - Baseline
($ in millions)

NON-REIMBURSABLEJan Feb Mar Apr May Jun Jul Aug Sep Oct Nov Dec Total
Operating RevenueFarebox Revenue $396.7 $391.6 $427.7 $412.6 $433.0 $429.7 $430.7 $429.9 $415.3 $443.8 $420.3 $418.8 $5,050.1Toll Revenue 111.9 106.4 126.7 125.2 133.7 133.6 135.7 135.2 126.7 130.2 123.9 121.2 1,510.5 Other Operating Revenue 43.8 43.6 46.2 43.4 47.4 42.2 38.3 37.4 42.1 46.2 47.0 46.8 524.5 Capital and Other Reimbursements - - - - - - - - - - - - - Total Revenue $552.4 $541.7 $600.6 $581.2 $614.2 $605.6 $604.7 $602.5 $584.1 $620.1 $591.2 $586.8 $7,085.1
Operating Expenses
Labor:Payroll $359.7 $339.1 $347.7 $336.7 $359.0 $336.6 $354.4 $357.5 $333.0 $354.4 $359.3 $365.0 $4,202.3Overtime 39.3 38.8 37.0 37.9 38.9 36.6 39.4 38.1 36.5 39.5 38.4 39.4 459.7 Health and Welfare 71.8 70.8 71.0 70.1 70.8 70.6 72.6 73.3 72.0 72.7 73.0 74.0 862.5 OPEB Current Payment 35.1 34.9 37.0 34.8 34.8 37.0 35.9 36.0 38.0 35.8 35.9 39.4 434.6 Pensions 49.7 48.3 48.9 47.6 49.2 47.9 762.1 49.3 47.5 49.1 49.7 54.1 1,303.4 Other Fringe Benefits 45.5 42.0 42.2 41.4 44.5 41.6 45.4 43.4 40.9 41.9 41.1 41.0 510.8 Reimbursable Overhead (24.8) (24.8) (30.8) (27.2) (27.8) (31.5) (26.2) (26.2) (30.1) (26.6) (24.9) (28.9) (329.8) Total Labor Expenses $576.4 $549.1 $552.9 $541.3 $569.6 $538.7 $1,283.6 $571.3 $537.7 $566.8 $572.4 $584.0 $7,443.7
Non-Labor:Electric Power $42.6 $45.6 $40.8 $40.7 $39.8 $43.7 $46.1 $42.7 $45.1 $43.0 $42.0 $41.3 $513.5Fuel 24.5 23.7 25.6 25.1 23.6 21.9 20.9 21.1 20.8 22.2 22.3 24.4 276.2 Insurance 1.8 1.2 3.1 1.6 1.7 1.9 1.7 1.7 2.0 1.7 1.9 2.5 22.9 Claims 17.0 17.0 17.2 17.0 17.0 17.2 17.0 17.0 17.2 17.0 17.0 17.1 204.6 Paratransit Service Contracts 31.1 30.9 34.3 32.8 34.4 34.1 33.1 34.4 33.7 36.7 34.9 33.6 404.2 Maintenance and Other Operating Contracts 41.0 41.1 43.6 43.1 42.0 48.7 43.6 46.3 48.5 48.6 45.3 41.9 533.8 Professional Service Contracts 21.0 19.6 23.1 20.7 20.8 23.2 23.4 21.3 23.6 22.2 22.3 28.8 270.1 Materials & Supplies 39.4 43.2 39.1 38.8 38.7 38.6 42.3 42.8 43.0 42.8 42.9 39.4 490.7 Other Business Expenses 12.6 11.9 14.6 12.1 11.9 12.9 12.7 12.7 12.6 12.5 12.5 14.5 153.6 Total Non-Labor Expenses $231.1 $234.2 $241.4 $231.9 $230.0 $242.3 $240.9 $240.0 $246.4 $246.8 $241.2 $243.5 $2,869.6
Other Expenses Adjustments:Other 2.8 2.8 2.8 2.8 2.8 2.8 2.8 2.8 2.8 2.8 2.8 4.8 35.8 General Reserve - - - - - - - - - - - 100.0 100.0 Total Other Expense Adjustments $2.8 $2.8 $2.8 $2.8 $2.8 $2.8 $2.8 $2.8 $2.8 $2.8 $2.8 $104.8 $135.8
Total Expenses/Expenditures before Non-Cash Liability Adjs.
$810.3 $786.1 $797.1 $776.0 $802.4 $783.8 $1,527.3 $814.2 $786.9 $816.5 $816.4 $932.2 $10,449.1
Depreciation 174.8 175.8 176.8 178.5 179.5 180.5 182.0 183.0 184.0 186.9 187.9 189.4 2,179.0
OPEB Obligation 27.2 27.2 259.6 27.2 27.2 259.6 27.2 27.2 259.6 27.2 27.2 259.6 1,256.0
Environmental Remediation 0.2 0.2 1.8 0.2 0.2 1.8 0.2 0.2 1.8 0.2 0.2 1.8 8.7
Total Expenses $1,012.4 $989.2 $1,235.3 $981.9 $1,009.2 $1,225.8 $1,736.6 $1,024.5 $1,232.4 $1,030.7 $1,031.7 $1,383.1 $13,892.8
Net Operating Surplus/(Deficit) excluding Subsidies and Debt Service ($460.0) ($447.5) ($634.8) ($400.6) ($395.1) ($620.3) ($1,132.0) ($422.1) ($648.3) ($410.6) ($440.5) ($796.3) ($6,807.8)
Subsidies $259.1 $336.0 $327.6 $1,808.0 $260.5 $322.8 $358.6 $306.5 $264.3 $241.2 $284.0 $312.6 $5,081.4Debt Service 183.3 183.3 183.3 171.6 123.6 183.3 199.2 199.2 193.1 177.1 134.0 198.3 2,129.2
-- Differences are due to rounding.
METROPOLITAN TRANSPORTATION AUTHORITYFebruary Financial Plan - 2012 Adopted BudgetAccrual Statement of Operations by Category
($ in millions)

REIMBURSABLEJan Feb Mar Apr May Jun Jul Aug Sep Oct Nov Dec Total
RevenueFarebox Revenue $0.0 $0.0 $0.0 $0.0 $0.0 $0.0 $0.0 $0.0 $0.0 $0.0 $0.0 $0.0 $0.0Toll Revenue - - - - - - - - - - - - - Other Operating Revenue - - - - - - - - - - - - - Capital and Other Reimbursements 109.1 107.8 126.1 122.6 123.4 128.6 132.0 119.9 122.5 119.3 108.4 118.2 1,438.1 Total Revenue $109.1 $107.8 $126.1 $122.6 $123.4 $128.6 $132.0 $119.9 $122.5 $119.3 $108.4 $118.2 $1,438.1
ExpensesLabor:Payroll $40.5 $39.9 $46.3 $43.9 $45.5 $45.3 $42.8 $42.5 $43.7 $44.3 $40.6 $42.6 $518.0Overtime 6.6 6.6 8.3 8.4 8.1 8.9 7.5 7.8 8.8 7.5 7.1 7.5 93.1 Health and Welfare 4.2 4.1 4.5 5.0 5.1 4.8 4.9 4.8 4.7 5.0 4.4 4.2 55.8 OPEB Current Payment - - - - - - - - - - - - - Pensions 2.4 2.3 2.8 3.2 3.4 2.9 20.7 2.9 2.9 3.2 2.6 2.4 51.5 Other Fringe Benefits 10.8 10.9 12.9 12.4 12.1 12.7 11.3 11.4 12.4 11.7 10.9 11.9 141.5 Reimbursable Overhead 24.8 24.8 30.8 27.2 27.8 31.6 26.1 26.2 30.1 26.6 24.8 28.7 329.5 Total Labor Expenses $89.3 $88.5 $105.6 $100.1 $102.1 $106.2 $113.3 $95.7 $102.5 $98.3 $90.4 $97.3 $1,189.3
Non-Labor:Electric Power $0.0 $0.0 $0.0 $0.0 $0.0 $0.0 $0.0 $0.0 $0.0 $0.0 $0.0 $0.0 $0.3Fuel 0.0 0.0 0.0 0.0 0.0 0.0 0.0 0.0 0.0 0.0 0.0 0.0 0.0 Insurance 0.6 0.6 0.9 1.1 1.1 1.0 1.2 1.0 0.9 1.0 0.8 0.6 10.8 Claims - - - - - - - - - - - - - Paratransit Service Contracts - - - - - - - - - - - - - Maintenance and Other Operating Contracts 5.4 5.5 5.9 7.1 5.9 5.8 4.2 4.2 5.1 5.1 4.8 4.6 63.6 Professional Service Contracts 2.2 2.6 4.4 3.3 3.8 4.2 2.8 3.7 3.7 4.1 2.7 5.7 43.3 Materials & Supplies 11.2 10.2 10.8 10.5 9.9 10.9 9.8 14.7 9.7 9.6 9.0 9.3 125.5 Other Business Expenses 0.4 0.4 (1.5) 0.5 0.5 0.5 0.7 0.7 0.7 1.2 0.7 0.7 5.3 Total Non-Labor Expenses $19.9 $19.3 $20.5 $22.5 $21.3 $22.4 $18.7 $24.2 $20.0 $21.0 $18.0 $20.9 $248.7
Other Expenses Adjustments:Other $0.0 $0.0 $0.0 $0.0 $0.0 $0.0 $0.0 $0.0 $0.0 $0.0 $0.0 $0.0 $0.0Total Other Expense Adjustments $0.0 $0.0 $0.0 $0.0 $0.0 $0.0 $0.0 $0.0 $0.0 $0.0 $0.0 $0.0 $0.0
Total Expenses before Depreciation $109.1 $107.8 $126.1 $122.6 $123.4 $128.6 $132.0 $119.9 $122.5 $119.3 $108.4 $118.2 $1,438.1
Depreciation - - - - - - - - - - - - -
Total Expenses $109.1 $107.8 $126.1 $122.6 $123.4 $128.6 $132.0 $119.9 $122.5 $119.3 $108.4 $118.2 $1,438.1
Net Operating Surplus/(Deficit) excluding Subsidies and Debt Service ($0.0) $0.0 $0.0 $0.0 $0.0 $0.0 $0.0 $0.0 $0.0 $0.0 $0.0 ($0.0) ($0.0)
METROPOLITAN TRANSPORTATION AUTHORITYFebruary Financial Plan - 2012 Adopted BudgetAccrual Statement of Operations by Category
($ in millions)

NON-REIMBURSABLE / REIMBURSABLE
Jan Feb Mar Apr May Jun Jul Aug Sep Oct Nov Dec TotalRevenueFarebox Revenue $396.7 $391.6 $427.7 $412.6 $433.0 $429.7 $430.7 $429.9 $415.3 $443.8 $420.3 $418.8 $5,050.1Toll Revenue 111.9 106.4 126.7 125.2 133.7 133.6 135.7 135.2 126.7 130.2 123.9 121.2 1,510.5 Other Operating Revenue 43.8 43.6 46.2 43.4 47.4 42.2 38.3 37.4 42.1 46.2 47.0 46.8 524.5 Capital and Other Reimbursements 109.1 107.8 126.1 122.6 123.4 128.6 132.0 119.9 122.5 119.3 108.4 118.2 1,438.1 Total Revenue $661.6 $649.5 $726.7 $703.8 $737.6 $734.2 $736.7 $722.4 $706.6 $739.4 $699.6 $705.0 $8,523.1
Expenses
Labor:Payroll $400.3 $379.1 $394.0 $380.6 $404.6 $381.9 $397.1 $400.0 $376.7 $398.7 $399.9 $407.6 $4,720.3Overtime 45.9 45.4 45.3 46.3 47.0 45.5 46.9 45.9 45.3 47.0 45.5 46.9 552.8 Health and Welfare 76.0 74.8 75.5 75.0 75.9 75.3 77.5 78.1 76.7 77.7 77.4 78.2 918.3 OPEB Current Payment 35.1 34.9 37.0 34.8 34.8 37.0 35.9 36.0 38.0 35.8 35.9 39.4 434.6 Pensions 52.1 50.5 51.7 50.8 52.6 50.8 782.8 52.2 50.4 52.3 52.3 56.5 1,354.9 Other Fringe Benefits 56.3 52.9 55.1 53.7 56.6 54.3 56.8 54.7 53.2 53.6 52.0 52.9 652.3 Reimbursable Overhead 0.0 0.0 0.0 0.0 0.0 0.0 (0.1) (0.0) (0.1) (0.0) (0.1) (0.1) (0.3) Total Labor Expenses $665.6 $637.6 $658.5 $641.4 $671.6 $644.9 $1,396.9 $667.0 $640.2 $665.1 $662.9 $681.3 $8,633.0
Non-Labor:Electric Power $42.6 $45.6 $40.8 $40.8 $39.8 $43.8 $46.1 $42.7 $45.1 $43.1 $42.0 $41.4 $513.8Fuel 24.5 23.7 25.6 25.1 23.6 21.9 20.9 21.1 20.8 22.2 22.3 24.4 276.2 Insurance 2.4 1.8 3.9 2.7 2.8 3.0 2.9 2.7 2.9 2.7 2.7 3.1 33.7 Claims 17.0 17.0 17.2 17.0 17.0 17.2 17.0 17.0 17.2 17.0 17.0 17.1 204.6 Paratransit Service Contracts 31.1 30.9 34.3 32.8 34.4 34.1 33.1 34.4 33.7 36.7 34.9 33.6 404.2 Maintenance and Other Operating Contracts 46.4 46.7 49.5 50.2 47.9 54.5 47.8 50.5 53.5 53.7 50.1 46.5 597.3 Professional Service Contracts 23.2 22.2 27.5 24.0 24.7 27.4 26.2 25.1 27.3 26.3 25.0 34.5 313.4 Materials & Supplies 50.6 53.3 50.0 49.3 48.6 49.5 52.0 57.4 52.6 52.4 51.9 48.7 616.3 Other Business Expenses 13.0 12.3 13.1 12.6 12.4 13.4 13.4 13.3 13.3 13.7 13.2 15.2 158.9 Total Non-Labor Expenses $250.9 $253.5 $261.9 $254.4 $251.3 $264.7 $259.6 $264.3 $266.4 $267.8 $259.1 $264.4 $3,118.4
Other Expenses Adjustments:Other 2.8 2.8 2.8 2.8 2.8 2.8 2.8 2.8 2.8 2.8 2.8 4.8 35.8 General Reserve - - - - - - - - - - - 100.0 100.0 Total Other Expense Adjustments $2.8 $2.8 $2.8 $2.8 $2.8 $2.8 $2.8 $2.8 $2.8 $2.8 $2.8 $104.8 $135.8
Total Expenses/Expenditures before Depreciation & Other Post Employment Benefits
$919.4 $894.0 $923.2 $898.6 $925.8 $912.5 $1,659.3 $934.1 $909.4 $935.8 $924.8 $1,050.4 $11,887.2
Depreciation 174.8 175.8 176.8 178.5 179.5 180.5 182.0 183.0 184.0 186.9 187.9 189.4 2,179.0
OPEB Obligation 27.2 27.2 259.6 27.2 27.2 259.6 27.2 27.2 259.6 27.2 27.2 259.6 1,256.0
Environmental Remediation 0.2 0.2 1.8 0.2 0.2 1.8 0.2 0.2 1.8 0.2 0.2 1.8 8.7 Total Expenses $1,121.5 $1,097.1 $1,361.5 $1,104.4 $1,132.6 $1,354.5 $1,868.6 $1,144.4 $1,354.9 $1,150.0 $1,140.0 $1,501.3 $15,330.9
Net Operating Surplus/(Deficit) excluding Subsidies and Debt Service ($460.0) ($447.5) ($634.8) ($400.6) ($395.1) ($620.3) ($1,132.0) ($422.1) ($648.3) ($410.6) ($440.5) ($796.3) ($6,807.8)
Subsidies $259.1 $336.0 $327.6 $1,808.0 $260.5 $322.8 $358.6 $306.5 $264.3 $241.2 $284.0 $312.6 $5,081.4
Debt Service 183.3 183.3 183.3 171.6 123.6 183.3 199.2 199.2 193.1 177.1 134.0 198.3 2,129.2
-- Differences are due to rounding.
METROPOLITAN TRANSPORTATION AUTHORITYFebruary Financial Plan - 2012 Adopted BudgetAccrual Statement of Operations by Category
($ in millions)

METROPOLITAN TRANSPORTATION AUTHORITYFebruary Financial Plan - 2012 Adopted Budget
Overtime - Non-Reimbursable/Reimbursable Basis($ in millions)
NON-REIMBURSABLESCHEDULED:
Direct Service $16.7 $16.1 $15.4 $15.9 $16.4 $15.0 $15.5 $14.7 $15.4 $16.7 $16.9 $16.6 $191.3
Programmed Maintenance 1.3 1.2 1.5 1.4 1.2 1.3 1.3 1.3 1.4 1.4 1.3 1.3 15.8
Total Scheduled $18.0 $17.3 $16.9 $17.3 $17.6 $16.3 $16.8 $16.0 $16.8 $18.1 $18.2 $17.9 $207.1
UNSCHEDULED:
Vacancy/Absentee Coverage $6.1 $6.6 $6.2 $6.8 $6.9 $7.2 $8.1 $7.8 $6.7 $7.1 $6.7 $7.4 $83.4
Weather Emergencies 2.4 2.5 2.0 0.5 0.4 0.5 0.5 0.5 0.5 0.5 0.7 2.5 13.5
Maintenance 6.6 6.5 6.3 6.9 7.3 6.7 7.4 7.1 6.5 7.4 6.4 6.4 81.5
Service Delays 2.9 3.0 2.7 3.0 3.1 2.8 3.1 3.0 2.8 3.0 3.0 2.3 34.7
Tour Length 0.7 0.7 0.6 0.8 0.8 0.7 0.8 0.8 0.7 0.8 0.8 0.6 8.9
Emergencies 0.7 0.7 0.6 0.8 0.8 0.7 0.8 0.8 0.6 0.8 0.7 0.6 8.4
Safety/Security/Law Enforcement 0.8 0.7 0.8 0.7 0.8 0.8 0.8 0.9 0.8 0.8 0.8 0.7 9.5
All Other 1.0 1.0 0.9 1.1 1.1 1.0 1.1 1.1 1.1 1.1 1.2 1.0 12.8
Total Unscheduled $21.2 $21.5 $20.1 $20.6 $21.3 $20.3 $22.6 $22.1 $19.7 $21.5 $20.2 $21.5 $252.6
TOTAL NON-REIMBURSABLE OVERTIME: $39.3 $38.8 $37.0 $37.9 $38.9 $36.6 $39.4 $38.1 $36.5 $39.5 $38.4 $39.4 $459.7
REIMBURSABLE OVERTIME $6.6 $6.6 $8.3 $8.4 $8.1 $8.9 $7.5 $7.8 $8.8 $7.5 $7.1 $7.5 93.1
TOTAL NR & R OVERTIME $45.9 $45.4 $45.3 $46.3 $47.0 $45.5 $46.9 $45.9 $45.3 $47.0 $45.5 $46.9 $552.8
Jan Feb Mar Apr May Jun Jul Dec TotalAug Sep Oct Nov

Jan Feb Mar Apr May Jun Jul Aug Sep Oct Nov Dec Total
Accrued Subsidies:
Dedicated TaxesMMTOA(a) $0.0 $0.0 $0.0 $1,332.8 $0.0 $0.0 $0.0 $0.0 $0.0 $0.0 $0.0 $0.0 $1,332.8
Petroleum Business Tax 48.7 42.2 55.6 54.3 46.3 65.2 55.3 57.5 57.3 50.7 43.1 54.6 630.8 MRT(b) 1 (Gross) 15.1 15.1 15.1 15.1 15.1 15.1 15.1 15.1 15.1 15.1 15.1 17.7 184.3 MRT(b) 2 (Gross) 7.6 7.6 7.6 7.6 7.6 7.6 7.6 7.6 7.6 7.6 7.6 9.2 93.2 Other MRT(b) Adjustments - - (2.4) - - (2.4) - - (2.4) - - (2.4) (9.5)
Urban Tax 32.8 32.8 32.8 32.8 32.8 32.8 32.8 32.8 32.8 32.8 32.8 35.1 395.7
Investment Income - - 0.2 - - 0.2 - - 0.2 - - 0.2 1.0
$104.3 $97.8 $109.1 $1,442.7 $101.8 $118.6 $110.9 $113.1 $110.7 $106.3 $98.6 $114.5 $2,628.3
New State Taxes and Fees
Payroll Mobility Tax 131.1 215.0 120.4 77.7 137.4 59.2 69.0 122.8 57.7 63.9 114.4 65.7 1,234.3
Payroll Mobility Tax Replacement Funds - - - 50.0 - 50.0 - 50.0 - 50.0 50.0 - 250.0 MTA Aid(c) - - 75.3 - - 75.3 - - 75.3 - - 75.3 301.1
$131.1 $215.0 $195.7 $127.7 $137.4 $184.5 $69.0 $172.8 $133.0 $113.9 $164.4 $141.0 $1,785.4
State and Local Subsidies
NYS Operating Assistance - - - 187.9 - - - - - - - - 187.9
NYC and Local 18b:
New York City - - - 1.9 - - 158.7 - - - - 34.7 195.3
Nassau County - - - 11.6 - - - - - - - - 11.6
Suffolk County - - - 7.5 - - - - - - - - 7.5
Westchester County - - - 7.3 - - - - - - - - 7.3 Putnam County - - - 0.4 - - - - - - - - 0.4
Dutchess County - - - 0.4 - - - - - - - - 0.4
Orange County - - - 0.1 - - - - - - - - 0.1
Rockland County - - - 0.0 - - - - - - - - 0.0
Nassau County Subsidy to LIB - - - - - - - - - - - - 0.0
CDOT Subsidies 10.6 10.1 9.7 7.4 8.2 6.6 6.9 7.6 7.4 7.9 7.8 9.4 99.6
Station Maintenance 13.1 13.1 13.1 13.1 13.1 13.1 13.1 13.1 13.1 13.1 13.1 13.1 157.4
$23.8 $23.2 $22.8 $237.7 $21.3 $19.7 $178.7 $20.7 $20.6 $21.0 $20.9 $57.2 $667.7
Sub-total Dedicated Taxes & State and Local Subsidies $259.1 $336.0 $327.6 $1,808.0 $260.5 $322.8 $358.6 $306.5 $264.3 $241.2 $284.0 $312.6 $5,081.4
City Subsidy for MTA Bus 26.6 26.9 25.2 26.0 36.5 26.0 26.1 25.9 26.1 36.6 25.9 26.2 334.1
Total Dedicated Taxes & State and Local Subsidies $285.8 $362.9 $352.7 $1,834.1 $297.0 $348.9 $384.7 $332.5 $290.4 $277.8 $309.9 $338.8 $5,415.5
B&T Operating Surplus Transfer 28.3 24.3 39.5 43.4 50.3 43.6 52.0 49.0 37.7 45.8 40.2 10.2 464.3
Total Subsidies $314.1 $387.2 $392.3 $1,877.5 $347.3 $392.4 $436.6 $381.4 $328.0 $323.7 $350.1 $349.1 $5,879.8
Notes
(a) Metropolitan Mass Transportation Operating Assistance(b) Mortgage Recording Tax
Metropolitan Transportation AuthorityFebruary Financial Plan - 2012 Adopted Budget
Consolidated Subsidies - Accrued Basis($ in millions)

Jan Feb Mar Apr May Jun Jul Aug Sep Oct Nov Dec Total
Cash Subsidies:
Dedicated Taxes
MMTOA(a) $0.0 $0.0 $0.0 $0.0 $128.5 $117.0 $117.0 $128.5 $117.0 $160.8 $172.4 $391.6 $1,332.8
Petroleum Business Tax 54.3 48.7 42.2 55.6 54.3 46.3 65.2 55.3 57.5 57.3 50.7 43.1 630.5
MRT(b) 1 (Gross) 15.1 15.1 15.1 15.1 15.1 15.1 15.1 15.1 15.1 15.1 15.1 15.1 181.7
MRT(b) 2 (Gross) 7.6 7.6 7.6 7.6 7.6 7.6 7.6 7.6 7.6 7.6 7.6 7.6 91.6
Other MRT(b) Adjustments - - (1.3) - - (1.3) - - (1.3) - - (29.3) (33.1)
Urban Tax 32.8 32.8 32.8 32.8 32.8 32.8 32.8 32.8 32.8 32.8 32.8 32.8 393.4
Investment Income - - 0.2 - - 0.2 - - 0.2 - - 0.2 1.0
$109.8 $104.3 $96.8 $111.2 $238.4 $217.8 $237.8 $239.4 $229.0 $273.7 $278.7 $461.2 $2,597.9
New State Taxes and Fees
Payroll Mobility Tax 131.1 215.0 120.4 77.7 137.4 59.2 69.0 122.8 57.7 63.9 114.4 65.7 1,234.3
Payroll Mobility Tax Replacement Funds - - - 50.0 - 50.0 - 50.0 - 50.0 50.0 - 250.0
MTA Aid(c) - - 75.3 - - 75.3 - - 75.3 - - 75.3 301.1
$131.1 $215.0 $195.7 $127.7 $137.4 $184.5 $69.0 $172.8 $133.0 $113.9 $164.4 $141.0 $1,785.4
State and Local Subsidies
NYS Operating Assistance - - - - 47.0 - - 47.0 - - 47.0 47.0 187.9
NYC and Local 18b:
New York City - - 0.5 - - 0.5 124.5 - 0.5 - - 69.3 195.3
Nassau County - - 2.9 - - 2.9 - - 2.9 - - 2.9 11.6
Suffolk County - - 1.9 - - 1.9 - - 1.9 - - 1.9 7.5
Westchester County - - 1.8 - - 1.8 - - 1.8 - - 1.8 7.3
Putnam County - - 0.1 - - 0.1 - - 0.1 - - 0.1 0.4
Dutchess County - - 0.1 - - 0.1 - - 0.1 - - 0.1 0.4
Orange County - - 0.0 - - 0.0 - - 0.0 - - 0.0 0.1
Rockland County - - 0.0 - - 0.0 - - 0.0 - - 0.0 0.0
CDOT Subsidies 10.6 10.1 9.7 7.4 8.2 6.6 6.9 7.6 7.4 7.9 7.8 9.4 99.6
Station Maintenance - - - - - 75.0 - - 80.3 - - - 155.3
$10.6 $10.1 $17.0 $7.4 $55.1 $88.9 $131.4 $54.6 $95.1 $7.9 $54.8 $132.6 $665.5
Other Subsidy Adjustments
NYCT Charge Back of MTA Bus Debt Service - - - - - - - - (11.5) - - - (11.5)
Forward Energy Contracts - 2011 (12 mth Contract) - - - - - - - - - - - 99.7 99.7
Forward Energy Contracts - 2012 (12 mth Contract) - - - - - - - - - - - (100.0) (100.0)
MNR Repayment for 525 North Broadway - - - - - - - - - - - (2.4) (2.4)
Repayment of Loan to Capital Financing Fund - - - - - - - - - - - (100.0) (100.0)
Committed to Capital - - - - - - - - - - - (150.0) (150.0)
$0.0 $0.0 $0.0 $0.0 $0.0 $0.0 $0.0 $0.0 -$11.5 $0.0 $0.0 -$252.8 -$264.3
Sub-total Dedicated Taxes & State and Local Subsidies $251.6 $329.4 $309.5 $246.3 $430.9 $491.2 $438.1 $466.7 $445.6 $395.5 $497.9 $482.0 $4,784.6
City Subsidy to MTA Bus 26.9 25.2 26.0 36.5 26.0 26.1 25.9 26.1 36.6 25.9 26.2 29.1 336.6
Total Dedicated Taxes & State and Local Subsidies $278.5 $354.6 $335.5 $282.8 $456.9 $517.3 $464.1 $492.8 $482.2 $421.4 $524.0 $511.1 $5,121.2
Inter-agency Subsidy Transactions
B&T Operating Surplus Transfer - 75.1 21.9 35.6 39.1 45.2 39.2 46.8 44.1 33.9 41.3 45.4 467.5
Total Subsidies $278.5 $429.6 $357.4 $318.4 $496.0 $562.6 $503.3 $539.6 $526.3 $455.3 $565.3 $556.5 $5,588.7
Notes(a) Metropolitan Mass Transportation Operating Assistance(b) Mortgage Recording Tax(c) License, Vehicle Registration, Taxi and Auto Rental Fees
Metropolitan Transportation AuthorityFebruary Financial Plan - 2012 Adopted Budget
Consolidated Subsidies - Cash Basis($ in millions)

Jan Feb Mar Apr May Jun Jul Aug Sep Oct Nov Dec Total
Cash Subsidies:
Dedicated Taxes
MMTOA(a) $0.0 $0.0 $0.0 $0.0 $85.6 $77.9 $77.9 $85.6 $77.9 $107.1 $114.8 $260.8 $887.5
Petroleum Business Tax 46.1 41.4 35.9 47.3 46.1 39.3 55.4 47.0 48.9 48.7 43.1 36.6 536.0
MRT(b) 1 (Gross) - - - - - - - - - - - - -
MRT(b) 2 (Gross) - - - - - - - - - - - - -
Other MRT(b) Adjustments - - - - - - - - - - - - -
Urban Tax 32.8 32.8 32.8 32.8 32.8 32.8 32.8 32.8 32.8 32.8 32.8 32.8 393.4
Investment Income - - - - - - - - - - - - -
$78.9 $74.2 $68.7 $80.1 $164.5 $150.0 $166.1 $165.4 $159.6 $188.6 $190.7 $330.2 1,816.8
New State Taxes and Fees
Payroll Mobility Tax 95.7 157.0 87.9 56.7 100.3 43.2 50.3 89.6 42.1 46.6 83.5 47.9 901.0
Payroll Mobility Tax Replacement Funds 0.0 0.0 0.0 36.5 0.0 36.5 0.0 36.5 0.0 36.5 36.5 0.0 182.5
MTA Aid(c) - - 47.4 - - 47.4 - - 47.4 - - 47.4 189.6
$95.7 $157.0 $135.3 $93.2 $100.3 $127.1 $50.3 $126.1 $89.5 $83.1 $120.0 $95.3 1,273.1
State and Local Subsidies
NYS Operating Assistance - - - - 39.5 - - 39.5 - - 39.5 39.5 158.1
NYC and Local 18b:
New York City - - - - - - 124.0 - - - - 35.0 159.0
Nassau County - - - - - - - - - - - - -
Suffolk County - - - - - - - - - - - - -
Westchester County - - - - - - - - - - - - -
Putnam County - - - - - - - - - - - - -
Dutchess County - - - - - - - - - - - - -
Orange County - - - - - - - - - - - - -
Rockland County - - - - - - - - - - - - -
Nassau County Subsidy to LIB - - - - - - - - - - - - -
CDOT Subsidies - - - - - - - - - - - - -
Station Maintenance - - - - - - - - - - - - -
NYCT Charge Back of MTA Bus Debt Service - - - - - - - - (11.5) - - - (11.5)
Forward Energy Contracts - 2011 (12 mth Contract) - - - - - - - - - - - 66.8 66.8
Forward Energy Contracts - 2012 (12 mth Contract) - - - - - - - - - - - (67.0) (67.0)
Repayment of Loan to Capital Financing Fund - - - - - - - - - - - (69.0) (69.0)
Committed to Capital - - - - - - - - - - - (105.0) (105.0)
$0.0 $0.0 $0.0 $0.0 $39.5 $0.0 $124.0 $39.5 ($11.5) $0.0 $39.5 -$99.7 131.4
Total Dedicated Taxes & State and Local Subsidies $174.6 $231.2 $203.9 $173.3 $304.3 $277.1 $340.4 $331.0 $237.6 $271.7 $350.2 $325.8 3,221.3
Inter-agency Subsidy Transactions
B&T Operating Surplus Transfer - 26.5 6.4 13.3 15.0 18.1 15.1 18.9 17.5 12.4 16.1 13.7 172.9
Total Subsidies $174.6 $257.6 $210.3 $186.6 $319.4 $295.2 $355.5 $349.9 $255.1 $284.1 $366.3 $339.5 3,394.2
Notes(a) Metropolitan Mass Transportation Operating Assistance(b) Mortgage Recording Tax(c) License, Vehicle Registration, Taxi and Auto Rental Fees
($ in millions)
Metropolitan Transportation AuthorityFebruary Financial Plan - 2012 Adopted BudgetNew York City Transit Subsidies - Cash Basis

Jan Feb Mar Apr May Jun Jul Aug Sep Oct Nov Dec Total
Cash Subsidies:
Dedicated Taxes
MMTOA(a) $0.0 $0.0 $0.0 $0.0 $42.7 $38.8 $38.8 $42.7 $38.8 $53.4 $57.2 $130.0 $442.3
Petroleum Business Tax 8.1 7.3 6.3 8.3 8.1 6.9 9.8 8.3 8.6 8.6 7.6 6.5 94.6
MRT(b) 1 (Gross) - - - - - - - - - - - - -
MRT(b) 2 (Gross) - - - - - - - - - - - - -
Other MRT(b) Adjustments - - - - - - - - - - - - -
Urban Tax - - - - - - - - - - - - -
Investment Income - - 0.2 - - 0.2 - - 0.2 - - 0.2 1.0
$8.1 $7.3 $6.6 $8.3 $50.8 $46.0 $48.6 $51.0 $47.7 $62.0 $64.8 $136.7 $537.8
New State Taxes and Fees
Payroll Mobility Tax 35.4 58.1 32.5 21.0 37.1 16.0 18.6 33.1 15.6 17.3 30.9 17.7 333.3
Payroll Mobility Tax Replacement Funds - - - 13.5 - 13.5 - 13.5 - 13.5 13.5 - 67.5
MTA Aid(c) - - 27.9 27.9 27.9 27.9 111.6
$35.4 $58.1 $60.4 $34.5 $37.1 $57.4 $18.6 $46.6 $43.5 $30.8 $44.4 $45.6 $512.3
State and Local Subsidies
NYS Operating Assistance - - - - 7.3 - - 7.3 - - 7.3 7.3 29.3
NYC and Local 18b:
New York City - - 0.5 - - 0.5 - - 0.5 - - 0.5 1.9
Nassau County - - 2.9 - - 2.9 - - 2.9 2.9 11.6
Suffolk County - - 1.9 - - 1.9 - - 1.9 - - 1.9 7.5
Westchester County - - 1.8 - - 1.8 - - 1.8 - - 1.8 7.3
Putnam County - - 0.1 - - 0.1 - - 0.1 - - 0.1 0.4
Dutchess County - - 0.1 - - 0.1 - - 0.1 - - 0.1 0.4
Orange County - - 0.0 - - 0.0 - - 0.0 - - 0.0 0.1
Rockland County - - 0.0 - 0.0 - - 0.0 - - 0.0 0.0
CDOT Subsidies 10.6 10.1 9.7 7.4 8.2 6.6 6.9 7.6 7.4 7.9 7.8 9.4 99.6
Station Maintenance - - - - - 75.0 - - 80.3 - - - 155.3
Forward Energy Contracts - 2011 (12 mth Contract) - - - - - - - - - - - 32.9 32.9
Forward Energy Contracts - 2012 (12 mth Contract) - - - - - - - - - - - (33.0) (33.0)
MNR Repayment for 525 North Broadway - - - - - - - - - - - (2.4) (2.4)
Repayment of Loan to Capital Financing Fund - - - - - - - - - - - (31.0) (31.0)
Committed to Capital - - - - - - - - - - - (45.0) (45.0)
$10.6 $10.1 $17.0 $7.4 $15.5 $88.9 $6.9 $14.9 $95.1 $7.9 $15.1 ($54.5) $234.9
Total Dedicated Taxes & State and Local Subsidies $54.2 $75.5 $84.0 $50.2 $103.4 $192.3 $74.1 $112.5 $186.2 $100.6 $124.3 $127.8 $1,285.1
Inter-agency Subsidy Transactions
B&T Operating Surplus Transfer - 48.6 15.5 22.3 24.1 27.1 24.1 27.9 26.6 21.5 25.2 31.8 294.6
Total Subsidies $54.2 $124.0 $99.5 $72.5 $127.4 $219.4 $98.2 $140.4 $212.8 $122.1 $149.5 $159.6 $1,579.6
Notes(a) Metropolitan Mass Transportation Operating Assistance(b) Mortgage Recording Tax(c) License, Vehicle Registration, Taxi and Auto Rental Fees
($ in millions)
Metropolitan Transportation AuthorityFebruary Financial Plan - 2012 Adopted Budget
Commuter Railroads Subsidies - Cash Basis

Jan Feb Mar Apr May Jun Jul Aug Sep Oct Nov Dec Total
Cash Subsidies:
Dedicated Taxes
MMTOA(a) $0.0 $0.0 $0.0 $0.0 $0.3 $0.3 $0.3 $0.3 $0.3 $0.4 $0.4 $0.9 $3.0
Petroleum Business Tax - - - - - - - - - - - - -
MRT(b) 1 (Gross) - - - - - - - - - - - - -
MRT(b) 2 (Gross) - - - - - - - - - - - - -
Other MRT(b) Adjustments - - - - - - - - - - - - -
Urban Tax - - - - - - - - - - - - -
Investment Income - - - - - - - - - - - - -
$0.0 $0.0 $0.0 $0.0 $0.3 $0.3 $0.3 $0.3 $0.3 $0.4 $0.4 $0.9 $3.0
State and Local Subsidies
NYS Operating Assistance - - - - 0.1 - - 0.1 - - 0.1 0.1 0.5
NYC and Local 18b:
New York City - - - - - - 0.5 - - - - 33.9 34.4
Nassau County - - - - - - - - - - - - -
Suffolk County - - - - - - - - - - - - -
Westchester County - - - - - - - - - - - - -
Putnam County - - - - - - - - - - - - -
Dutchess County - - - - - - - - - - - - -
Orange County - - - - - - - - - - - - -
Rockland County - - - - - - - - - - - - -
CDOT Subsidies - - - - - - - - - - - - -
Station Maintenance - - - - - - - - - - - - -
$0.0 $0.0 $0.0 $0.0 $0.1 $0.0 $0.5 $0.1 $0.0 $0.0 $0.1 $34.0 $35.0
Total Dedicated Taxes & State and Local Subsidies $0.0 $0.0 $0.0 $0.0 $0.4 $0.3 $0.8 $0.4 $0.3 $0.4 $0.5 $34.9 $38.0
B&T Operating Surplus Transfer - - - - - - - - - - - - -
Total Subsidies $0.0 $0.0 $0.0 $0.0 $0.4 $0.3 $0.8 $0.4 $0.3 $0.4 $0.5 $34.9 $38.0
Notes(a) Metropolitan Mass Transportation Operating Assistance(b) Mortgage Recording Tax
($ in millions)
Metropolitan Transportation AuthorityFebruary Financial Plan - 2012 Adopted BudgetStaten Island Railway Subsidies - Cash Basis

Jan Feb Mar Apr May Jun Jul Aug Sep Oct Nov Dec Total
Cash Subsidies:
Dedicated Taxes
MMTOA(a) $0.0 $0.0 $0.0 $0.0 $0.0 $0.0 $0.0 $0.0 $0.0 $0.0 $0.0 $0.0 $0.0
Petroleum Business Tax - - - - - - - - - - - - -
MRT(b) 1 (Gross) 15.1 15.1 15.1 15.1 15.1 15.1 15.1 15.1 15.1 15.1 15.1 15.1 181.7
MRT(b) 2 (Gross) 7.6 7.6 7.6 7.6 7.6 7.6 7.6 7.6 7.6 7.6 7.6 7.6 91.6
Other MRT(b) Adjustments - - (1.3) - - (1.3) - - (1.3) - - (29.3) (33.1)
Urban Tax - - - - - - - - - - - - -
Investment Income - - - - - - - - - - - - -
22.8 $22.8 $21.5 $22.8 $22.8 $21.5 $22.8 $22.8 $21.5 $22.8 $22.8 ($6.5) $240.3
State and Local Subsidies
NYS Operating Assistance - - - - - - - - - - - - -
NYC and Local 18b:
New York City - - - - - - - - - - - - -
Nassau County - - - - - - - - - - - - -
Suffolk County - - - - - - - - - - - - -
Westchester County - - - - - - - - - - - - -
Putnam County - - - - - - - - - - - - -
Dutchess County - - - - - - - - - - - - -
Orange County - - - - - - - - - - - - -
Rockland County - - - - - - - - - - - - -
CDOT Subsidies - - - - - - - - - - - - -
Station Maintenance - - - - - - - - - - - - -
$0.0 $0.0 $0.0 $0.0 $0.0 $0.0 $0.0 $0.0 $0.0 $0.0 $0.0 $0.0 $0.0
Total Dedicated Taxes & State and Local Subsidies 22.8 $22.8 $21.5 $22.8 $22.8 $21.5 $22.8 $22.8 $21.5 $22.8 $22.8 ($6.5) $240.3
B&T Operating Surplus Transfer - - - - - - - - - - - - -
Total Subsidies 22.8 $22.8 $21.5 $22.8 $22.8 $21.5 $22.8 $22.8 $21.5 $22.8 $22.8 ($6.5) $240.3
Notes(a) Metropolitan Mass Transportation Operating Assistance(b) Mortgage Recording Tax
($ in millions)
Metropolitan Transportation AuthorityFebruary Financial Plan - 2012 Adopted Budget
MTA Headquarters Subsidies - Cash Basis

Jan Feb Mar Apr May Jun Jul Aug Sep Oct Nov Dec Total
City Subsidy to MTA Bus $26.9 $25.2 $26.0 $36.5 $26.0 $26.1 $25.9 $26.1 $36.6 $25.9 $26.2 $29.1 $336.6
($ in millions)
Metropolitan Transportation AuthorityFebruary Financial Plan - 2012 Adopted Budget
MTA Bus Company Subsidies - Cash Basis

Jan Feb Mar Apr May Jun Jul Aug Sep Oct Nov Dec Total
Debt Service:
MTA Transportation RevenueTransit 51.679 51.679 51.679 51.679 34.350 51.679 61.610 61.610 61.610 62.393 44.557 61.379 645.904Commuter 34.501 34.501 34.501 34.501 22.932 34.501 37.279 37.279 37.279 37.802 25.895 37.125 408.095Bus Company 1.354 1.354 1.354 1.354 0.900 1.354 1.699 1.699 1.699 1.720 1.252 1.693 17.434
87.534 87.534 87.534 87.534 58.183 87.534 100.588 100.588 100.588 101.915 71.704 100.197 1071.433
Commercial PaperTransit 1.832 1.832 1.832 1.832 1.832 1.832 1.832 1.832 1.832 1.832 1.832 1.832 21.988Commuter 1.142 1.142 1.142 1.142 1.142 1.142 1.142 1.142 1.142 1.142 1.142 1.142 13.703Bus Company 0.026 0.026 0.026 0.026 0.026 0.026 0.026 0.026 0.026 0.026 0.026 0.026 0.309
3.000 3.000 3.000 3.000 3.000 3.000 3.000 3.000 3.000 3.000 3.000 3.000 36.000
TBTA General ResolutionTransit 15.760 15.760 15.760 15.760 15.760 15.760 15.760 15.760 15.760 15.760 15.681 15.587 188.866Commuter 7.408 7.408 7.408 7.408 7.408 7.408 7.408 7.408 7.408 7.408 7.371 7.327 88.775TBTA 16.418 16.418 16.418 16.418 11.887 16.418 17.260 17.260 17.260 17.260 12.646 17.080 192.742
39.586 39.586 39.586 39.586 35.054 39.586 40.427 40.427 40.427 40.427 35.698 39.994 470.383
TBTA SubordinateTransit 6.633 6.633 6.633 6.633 6.633 6.633 6.633 6.633 6.633 6.633 6.608 6.584 79.521Commuter 2.914 2.914 2.914 2.914 2.914 2.914 2.914 2.914 2.914 2.914 2.903 2.893 34.938TBTA 2.620 2.620 2.620 2.620 2.620 2.620 2.620 2.620 2.620 2.620 2.610 2.601 31.412
12.167 12.167 12.167 12.167 12.167 12.167 12.167 12.167 12.167 12.167 12.122 12.078 145.872
Dedicated Tax FundTransit 31.972 31.972 31.972 22.341 10.610 31.972 33.984 33.984 28.926 14.612 7.941 33.985 314.272Commuter 6.687 6.687 6.687 4.672 2.219 6.687 6.687 6.687 5.629 2.635 1.240 6.687 63.202
38.659 38.659 38.659 27.014 12.829 38.659 40.670 40.670 34.555 17.247 9.181 40.672 377.474
2 Broadway COPsTransit 1.825 1.825 1.825 1.825 1.825 1.825 1.825 1.825 1.825 1.825 1.825 1.825 21.904TBTA 0.258 0.258 0.258 0.258 0.258 0.258 0.258 0.258 0.258 0.258 0.258 0.258 3.098Headquarters 0.250 0.250 0.250 0.250 0.250 0.250 0.250 0.250 0.250 0.250 0.250 0.250 3.005
2.334 2.334 2.334 2.334 2.334 2.334 2.334 2.334 2.334 2.334 2.334 2.334 28.006
Total Debt Service 183.280 183.280 183.280 171.635 123.567 183.280 199.186 199.186 193.070 177.090 134.039 198.274 2,129.168
Notes:(1) Budgeted debt service is calculated as resolution required funding from available pledged revenues into debt service accounts. Actual Payments to bondholders are made when due and do not conform to this schedule.(2) Debt service is allocated between Transit, Commuter, MTA Bus, and TBTA categories based on actual spending of bond proceeds for approved capital projects. Allocation of 2 Broadway COPs is based on occupancy.(3) Totals may not add due to rounding.
METROPOLITAN TRANSPORTATION AUTHORITYFebruary 2012 Financial Plan - 2012 Debt Service Allocation Forecast
Debt Service($ in millions)

Jan Feb Mar Apr May Jun Jul Aug Sep Oct Nov DecCATEGORY/AGENCY
METROPOLITAN TRANSPORTATION AUTHORITYFebruary Financial Plan - 2012 Adopted Budget
Total Positions by Category and Agency
Baseline Total Positions 66,069 66,055 66,103 65,939 65,993 66,024 65,828 65,819 65,879 65,752 65,750 65,763
NYC Transit 45,891 45,891 45,914 45,717 45,769 45,764 45,612 45,612 45,685 45,577 45,575 45,599
Long Island Rail Road 6,538 6,520 6,537 6,552 6,567 6,586 6,541 6,534 6,516 6,517 6,518 6,508
Metro-North Railroad 6,279 6,279 6,284 6,300 6,295 6,310 6,310 6,308 6,313 6,320 6,319 6,319
Bridges & Tunnels 1,666 1,666 1,666 1,666 1,666 1,666 1,666 1,666 1,666 1,639 1,639 1,639
Headquarters 1,765 1,765 1,765 1,765 1,765 1,765 1,765 1,765 1,765 1,765 1,765 1,765
Staten Island Railway 272 272 272 272 268 268 268 268 268 268 268 267
Capital Construction Company 123 127 130 132 134 136 140 140 140 140 140 140
Bus Company 3,535 3,535 3,535 3,535 3,529 3,529 3,526 3,526 3,526 3,526 3,526 3,526
Non-Reimbursable 59,976 59,946 59,651 59,339 59,419 59,447 59,432 59,385 59,523 59,434 59,569 59,758
NYC Transit 41,220 41,220 41,231 41,065 41,128 41,123 41,071 41,071 41,160 41,082 41,082 41,071
Long Island Rail Road 5,933 5,921 5,687 5,662 5,714 5,753 5,759 5,708 5,739 5,706 5,803 5,940
Metro-North Railroad 5,747 5,729 5,657 5,536 5,511 5,505 5,536 5,540 5,558 5,607 5,645 5,709
Bridges & Tunnels 1,622 1,622 1,622 1,622 1,622 1,622 1,622 1,622 1,622 1,595 1,595 1,595
Headquarters 1,717 1,717 1,717 1,717 1,717 1,717 1,717 1,717 1,717 1,717 1,717 1,717
Staten Island Railway 269 269 269 269 265 265 265 265 265 265 265 264
Capital Construction Company - - - - - - - - - - - -
Bus Company 3,468 3,468 3,468 3,468 3,462 3,462 3,462 3,462 3,462 3,462 3,462 3,462
Reimbursable 6,093 6,109 6,452 6,600 6,574 6,577 6,396 6,434 6,356 6,318 6,181 6,005
NYC Transit 4,671 4,671 4,683 4,652 4,641 4,641 4,541 4,541 4,525 4,495 4,493 4,528
Long Island Rail Road 605 599 850 890 853 833 782 826 777 811 715 568
Metro-North Railroad 532 550 627 764 784 805 774 768 755 713 674 610
Bridges & Tunnels 44 44 44 44 44 44 44 44 44 44 44 44
Headquarters 48 48 48 48 48 48 48 48 48 48 48 48
Staten Island Railway 3 3 3 3 3 3 3 3 3 3 3 3
Capital Construction Company 123 127 130 132 134 136 140 140 140 140 140 140
Bus Company 67 67 67 67 67 67 64 64 64 64 64 64

Jan Feb Mar Apr May Jun Jul Aug Sep Oct Nov DecCATEGORY/AGENCY
METROPOLITAN TRANSPORTATION AUTHORITYFebruary Financial Plan - 2012 Adopted Budget
Total Positions by Category and Agency
Total Full-Time 65,899 65,885 65,933 65,769 65,823 65,854 65,657 65,648 65,708 65,581 65,579 65,592
NYC Transit 45,737 45,737 45,760 45,563 45,615 45,610 45,457 45,457 45,530 45,422 45,420 45,444
Long Island Rail Road 6,538 6,520 6,537 6,552 6,567 6,586 6,541 6,534 6,516 6,517 6,518 6,508
Metro-North Railroad 6,278 6,278 6,283 6,299 6,294 6,309 6,309 6,307 6,312 6,319 6,318 6,318
Bridges & Tunnels 1,666 1,666 1,666 1,666 1,666 1,666 1,666 1,666 1,666 1,639 1,639 1,639
Headquarters 1,765 1,765 1,765 1,765 1,765 1,765 1,765 1,765 1,765 1,765 1,765 1,765
Staten Island Railway 272 272 272 272 268 268 268 268 268 268 268 267
Capital Construction Company 123 127 130 132 134 136 140 140 140 140 140 140
Bus Company 3,520 3,520 3,520 3,520 3,514 3,514 3,511 3,511 3,511 3,511 3,511 3,511
Total Full-Time-Equivalents 170 170 170 170 170 170 171 171 171 171 171 171
NYC Transit 154 154 154 154 154 154 155 155 155 155 155 155
Long Island Rail Road - - - - - - - - - - - -
Metro-North Railroad 1 1 1 1 1 1 1 1 1 1 1 1
Bridges & Tunnels - - - - - - - - - - - -
Headquarters - - - - - - - - - - - -
Staten Island Railway - - - - - - - - - - - -
Capital Construction Company - - - - - - - - - - - -
Bus Company 15 15 15 15 15 15 15 15 15 15 15 15

Jan Feb Mar Apr May Jun Jul Aug Sep Oct Nov Dec
Administration 4,408 4,412 4,416 4,241 4,235 4,236 4,237 4,237 4,237 4,215 4,216 4,216
NYC Transit 1,982 1,982 1,982 1,807 1,807 1,807 1,805 1,805 1,805 1,805 1,805 1,806
Long Island Rail Road 631 631 633 633 632 633 634 634 634 635 636 636
Metro-North Railroad 509 509 509 509 509 509 509 509 509 509 509 509
Bridges & Tunnels 73 73 73 73 73 73 73 73 73 50 50 50
Headquarters 983 983 983 983 983 983 983 983 983 983 983 983
Staten Island Railway 22 22 22 22 22 22 22 22 22 22 22 21
Capital Construction Company 32 36 38 38 39 39 41 41 41 41 41 41
Bus Company 176 176 176 176 170 170 170 170 170 170 170 170
Operations 28,993 28,993 29,020 29,011 29,085 29,112 28,986 28,984 29,063 28,972 28,958 28,982
NYC Transit 21,646 21,646 21,668 21,647 21,702 21,714 21,608 21,608 21,697 21,601 21,601 21,635
Long Island Rail Road 2,121 2,121 2,121 2,117 2,134 2,146 2,129 2,129 2,117 2,122 2,109 2,099
Metro-North Railroad 2,099 2,099 2,104 2,120 2,126 2,129 2,129 2,127 2,129 2,129 2,128 2,128
Bridges & Tunnels 769 769 769 769 769 769 769 769 769 769 769 769
Headquarters - - - - - - - - - - - -
Staten Island Railway 95 95 95 95 91 91 91 91 91 91 91 91
Capital Construction Company - - - - - - - - - - - -
Bus Company 2,263 2,263 2,263 2,263 2,263 2,263 2,260 2,260 2,260 2,260 2,260 2,260
Maintenance 29,392 29,374 29,390 29,408 29,393 29,394 29,321 29,314 29,295 29,281 29,292 29,280
NYC Transit 20,541 20,541 20,542 20,541 20,538 20,521 20,477 20,477 20,461 20,449 20,447 20,436
Long Island Rail Road 3,674 3,656 3,671 3,690 3,689 3,695 3,666 3,659 3,653 3,648 3,661 3,660
Metro-North Railroad 3,574 3,574 3,574 3,574 3,563 3,575 3,575 3,575 3,578 3,585 3,585 3,585
Bridges & Tunnels 402 402 402 402 402 402 402 402 402 398 398 398
Headquarters - - - - - - - - - - - -
Staten Island Railway 155 155 155 155 155 155 155 155 155 155 155 155
Capital Construction Company - - - - - - - - - - - -
Bus Company 1,046 1,046 1,046 1,046 1,046 1,046 1,046 1,046 1,046 1,046 1,046 1,046
CATEGORY/AGENCY
METROPOLITAN TRANSPORTATION AUTHORITYFebruary Financial Plan - 2012 Adopted Budget
Total Positions by Category and Agency

Jan Feb Mar Apr May Jun Jul Aug Sep Oct Nov DecCATEGORY/AGENCY
METROPOLITAN TRANSPORTATION AUTHORITYFebruary Financial Plan - 2012 Adopted Budget
Total Positions by Category and Agency
Engineering/Capital 1,704 1,704 1,705 1,707 1,708 1,710 1,712 1,712 1,712 1,712 1,712 1,713
NYC Transit 1,218 1,218 1,218 1,218 1,218 1,218 1,218 1,218 1,218 1,218 1,218 1,218
Long Island Rail Road 112 112 112 112 112 112 112 112 112 112 112 113
Metro-North Railroad 97 97 97 97 97 97 97 97 97 97 97 97
Bridges & Tunnels 148 148 148 148 148 148 148 148 148 148 148 148
Headquarters - - - - - - - - - - - -
Staten Island Railway - - - - - - - - - - - -
Capital Construction Company 91 91 92 94 95 97 99 99 99 99 99 99
Bus Company 38 38 38 38 38 38 38 38 38 38 38 38
Public Safety 1,572 1,572 1,572 1,572 1,572 1,572 1,572 1,572 1,572 1,572 1,572 1,572
NYC Transit 504 504 504 504 504 504 504 504 504 504 504 504
Long Island Rail Road - - - - - - - - - - - -
Metro-North Railroad - - - - - - - - - - - -
Bridges & Tunnels 274 274 274 274 274 274 274 274 274 274 274 274
Headquarters 782 782 782 782 782 782 782 782 782 782 782 782
Staten Island Railway - - - - - - - - - - - -
Capital Construction Company - - - - - - - - - - - -
Bus Company 12 12 12 12 12 12 12 12 12 12 12 12

FUNCTION/OCCUPATION Jan Feb Mar Apr May Jun Jul Aug Sep Oct Nov Dec
Administration 4,408 4,412 4,416 4,241 4,235 4,236 4,237 4,237 4,237 4,215 4,216 4,216
Managers/Supervisors 1,562 1,562 1,564 1,534 1,534 1,535 1,535 1,535 1,535 1,528 1,529 1,529
Professional, Technical, Clerical 2,672 2,676 2,678 2,534 2,528 2,528 2,529 2,529 2,529 2,514 2,514 2,514
Operational Hourlies 174 174 174 173 173 173 173 173 173 173 173 173
Operations 28,993 28,993 29,020 29,011 29,085 29,112 28,986 28,984 29,063 28,972 28,958 28,982
Managers/Supervisors 3,191 3,191 3,191 3,191 3,190 3,191 3,188 3,188 3,187 3,187 3,187 3,195
Professional, Technical, Clerical 1,121 1,121 1,121 1,117 1,120 1,127 1,127 1,127 1,120 1,116 1,115 1,116
Operational Hourlies 24,681 24,681 24,708 24,703 24,775 24,794 24,671 24,669 24,756 24,669 24,656 24,671
Maintenance 29,392 29,374 29,390 29,408 29,393 29,394 29,321 29,314 29,295 29,281 29,292 29,280
Managers/Supervisors 4,732 4,729 4,746 4,746 4,745 4,742 4,720 4,726 4,725 4,724 4,716 4,847
Professional, Technical, Clerical 2,407 2,407 2,404 2,404 2,397 2,401 2,396 2,396 2,396 2,395 2,393 2,387
Operational Hourlies 22,253 22,238 22,240 22,258 22,251 22,251 22,205 22,192 22,174 22,162 22,183 22,046
Engineering/Capital 1,704 1,704 1,705 1,707 1,708 1,710 1,712 1,712 1,712 1,712 1,712 1,713
Managers/Supervisors 446 446 446 446 446 446 446 446 446 446 446 447
Professional, Technical, Clerical 1,256 1,256 1,257 1,259 1,260 1,262 1,264 1,264 1,264 1,264 1,264 1,264
Operational Hourlies 2 2 2 2 2 2 2 2 2 2 2 2
Public Safety 1,572 1,572 1,572 1,572 1,572 1,572 1,572 1,572 1,572 1,572 1,572 1,572
Managers/Supervisors 185 185 185 185 185 185 185 185 185 185 185 185
Professional, Technical, Clerical 139 139 139 139 139 139 139 139 139 139 139 139
Operational Hourlies 1,248 1,248 1,248 1,248 1,248 1,248 1,248 1,248 1,248 1,248 1,248 1,248
Baseline Total Positions 66,069 66,055 66,103 65,939 65,993 66,024 65,828 65,819 65,879 65,752 65,750 65,763
Managers/Supervisors 10,116 10,113 10,132 10,102 10,100 10,099 10,074 10,080 10,078 10,070 10,063 10,203
Professional, Technical, Clerical 7,595 7,599 7,599 7,453 7,444 7,457 7,455 7,455 7,448 7,428 7,425 7,420
Operational Hourlies 48,358 48,343 48,372 48,384 48,449 48,468 48,299 48,284 48,353 48,254 48,262 48,140
METROPOLITAN TRANSPORTATION AUTHORITYFebruary Financial Plan - 2012 Adopted Budget
Total Positions by Function and Occupation

[THIS PAGE INTENTIONALLY LEFT BLANK]

V. MTA Capital Program Information

NYCT2012 Commitments GoalAll $ in millions
ACEP Project Description 2012 Commitments
2005-2009
T50302/18 Purchase 90 Standard Buses 52.42$ T50302/21 Purchase 60 Express Buses 38.26
Element Total 90.68
T50904/14 Cathodic Protection Manhole Relocation At Queensbridge Park 0.25 Element Total 0.25
T51204/08 BRT: Traffic Signal Priority Hardware 4.63 T51204/08 BRT Traffic Signal Priority Hardware 0.07 T51204/23 Chassis Wash Lift Replace: Castleton Depot [Mentor] 0.55 T51204/24 Chassis Wash Lift Replacement: East New York Depot [Mentor] 0.55
Element Total 5.80
T51605/21 Concrete Batch Plant Inspection 1.15 T51605/24 Concrete Cylinder Testing 0.66
Element Total 1.81
2010-2014
S60701/02 Lemon Creek Culvert Bridge 7.40 Element Total 7.40
T60101/02 Purchase 300 B Division Cars - R179 637.64 Element Total 637.64
T60302/06 Purchase 90 Articulated Buses 70.63 T60302/07 Purchase 99 Express Buses 72.75 T60302/09 Purchase 425 Standard Buses 321.48 T60302/10 Purchase 89 Express Buses 65.76 T60302/14 Purchase 97 Express Buses 74.53 T60302/16 Purchase 71 Standard Buses 55.85 T60302/18 Replace Integrated Farebox Unit (IFU) Components, Phase 2 21.94 T60302/22 Purchase 104 Standard Buses 72.68 T60302/23 Bus Cameras: 2010-2014 Purchases 24.83
Element Total 780.45
T60404/02 Purchase Automated Farecard Access System (AFAS) Units 2.31 T60404/05 Smart Card Implementation, Phase 1 10.00
Element Total 12.31
T60407/04 Replace 11 Hydraulic Elevators 44.62 Element Total 44.62
T60412 Station Ventilators: Ph3 - 7 Loc / Canarsie & 6 Av Lines 3.51 T60412 Station Component Investments: 4 Locations / Eastern Parkway 0.76 T60412/06 Station Components: Pelham Bay Park / Pelham 9.10 T60412/07 Station Renewal: Buhre Avenue / Pelham 20.61

NYCT2012 Commitments GoalAll $ in millions
ACEP Project Description 2012 Commitments
T60412/08 Station Renewal: Middletown Road / Pelham 19.55 T60412/09 Station Renewal: Zerega Avenue / Pelham 19.58 T60412/10 Station Renewal: Castle Hill Avenue / Pelham 20.31 T60412/22 Brick Arch Repair: 168 Street & 181 Street / Broadway-7th Av 37.96 T60412/24 Station Painting At Component Locations, Phase 1 9.49 T60412/25 Station Renewal: Central Avenue / Myrtle 11.08 T60412/26 Station Renewal: Seneca Avenue / Myrtle 6.84 T60412/27 Station Renewal: Forest Avenue / Myrtle 6.71 T60412/28 Station Renewal: Knickerbocker Avenue / Myrtle 10.33 T60412/29 Station Renewal: Fresh Pond Road / Myrtle 6.87 T60412/30 Station Walls-Tile Repl: Borough Hall / Lexington 2.64 T60412/31 Station Renewal: 104 Street / Liberty 17.62 T60412/31 Station Renewal: 104 Street / Liberty 0.92 T60412/32 Station Renewal: Ozone Park-lefferts Boulevard / Liberty 6.75 T60412/32 Station Renewal: Ozone Park-lefferts Boulevard / Liberty 0.93 T60412/33 Station Renewal: 111 Street / Liberty 16.83 T60412/33 Station Renewal: 111 Street / Liberty 0.88 T60412/34 Station Renewal: Rockaway Boulevard / Liberty 17.24 T60412/34 Station Renewal: Rockaway Boulevard / Liberty 0.96 T60412/35 Station Renewal: 88 Street / Liberty 17.31 T60412/35 Station Renewal: 88 Street / Liberty 0.87 T60412/36 Station Renewal: 80 Street / Liberty 16.96 T60412/36 Station Renewal: 80 Street / Liberty 0.91 T60412/60 Station Components: 6 Stations / Jamaica 21.91 T60412/60 Station Components: 6 Stations / Jamaica 2.02 T60412/61 Station Components: 5 Stations / Brighton 8.85 T60412/64 Station Component Investments: 3 Locations / Astoria 0.57 T60412/67 Station Components: 149 Street-grand Concourse / Jerome 6.44 T60412/68 Station Components: 149 Street-grand Concourse / WPR 8.85
Element Total 332.15
T60413/04 Platform Gap Retrofit Phase 1 - 14 Stations 0.19 T60413/06 ADA: Kingsbridge Rd / Concourse 28.76 T60413/07 ADA: 68 St-Hunter College / Lexington 66.27 T60413/07 ADA: 68 St-Hunter College / Lexington 0.96 T60413/09 ADA: Hunts Point Av / Pelham 28.17 T60413/12 ADA: Ozone Park-Lefferts Blvd / Liberty 31.77 T60413/12 ADA: Ozone Park-lefferts Blvd / Liberty 3.36
Element Total 159.48

NYCT2012 Commitments GoalAll $ in millions
ACEP Project Description 2012 Commitments
T60414/04 Scrubber Room Drainage - 4 Locations 0.48 T60414/05 Access Improvements: Grand Central / Lex 0.52 T60414/07 Station Signage 0.47
Element Total 1.47
T60502/07 Mainline Track Replacement - 2012 Support Costs 2.36 T60502/08 Track Force Account - 2012 35.00 T60502/09 Continuous Welded Rail - 2012 5.69 T60502/10 Mainline Track Replacement - 2013 1.01 T60502/24 Mainline Track Replacement 2012 At Broadway 2.55 T60502/25 Mainline Track Replacement 2012 At Brighton 7.64 T60502/26 Mainline Track Replacement 2012 At N/o Dekalb 5.54 T60502/27 Mainline Track Replacement 2012 At Atlantic Avenue 5.36 T60502/28 Mainline Track Replacement 2012 At S/o Court Street 2.26 T60502/29 Mainline Track Replacement 2012 At West End 3.18 T60502/30 Mainline Track Replacement 2012 At Sea Beach 1.01 T60502/31 Mainline Track Replacement 2012 At N/o Pacific Street 4.03 T60502/32 Mainline Track Replacement 2012 At Jamaica 7.88 T60502/33 Mainline Track Replacement 2012 At Myrtle Avenue 15.97 T60502/34 Mainline Track Replacement 2012 At 168 Street/ 8 Avenue 1.62 T60502/35 Mainline Track Replacement 2012 At Cranberry Tube / 8 Avenue 8.52 T60502/36 Mainline Track Replacement 2012 At 6th Avenue 14.72 T60502/37 Mainline Track Replacement 2012 At Concourse 15.13 T60502/38 Mainline Track Replacement 2012 At Queens Blvd 9.09 T60502/39 Mainline Track Replacement 2012 At Canarsie 1.15 T60502/40 Mainline Track Replacement 2012 At Rockaway 9.16 T60502/41 Mainline Track Replacement 2012 At Broadway-7th Avenue 7.04 T60502/42 Mainline Track Replacement 2012 At Flushing 30.16 T60502/43 Mainline Track Replacement 2012 At Eastern Parkway 2.17 T60502/44 Mainline Track Replacement 2012 At Lenox-white Plains Rd 7.56 T60502/45 Mainline Track Replacement 2012 At Jerome Ave 4.90 T60502/46 Mainline Track Replacement 2012 At Pelham 1.57 T60502/47 Mainline Track Replacement 2012 At Lexington Avenue 8.50 T60502/48 Mainline Track Replacement 2012 At White Plains Road 9.95
Element Total 230.72
T60503/03 Mainline Track Switches - 2012 Support Costs 8.01 T60503/04 Mainline Track Switches- 2013 1.69 T60503/09 Mainline Track Switches - 2012 At West End 7.06 T60503/10 Mainline Track Switches - 2012 At Queens Blvd 5.54

NYCT2012 Commitments GoalAll $ in millions
ACEP Project Description 2012 Commitments
T60503/11 Mainline Track Switches - 2012 At Broadway-7th Avenue 5.29 T60503/12 Mainline Track Switches - 2012 At Eastern Parkway 3.57 T60503/13 Mainline Track Switches - 2012 At Lexington Avenue 6.31 T60503/14 Mainline Track Switches - 2012 At White Plain Road 9.30
Element Total 46.77
T60602/03 Tunnel Lighting Rehabilitation: 36 St To Jackson-roosevelt / QBL 1.35 T60603/03 Vent Plant: Mulry Square / 8av & Bw7 108.50 T60603/05 Replace Vent Controls: 26 Locations 0.82 T60603/05 Replace Vent Controls: 26 Locations 0.82
Element Total 111.48
T60604/03 Pumps: 4 Locations / Pelham-Jerome-Lenox 0.89 Element Total 0.89
T60703/02 Rehab Emergency Exits: 75 Locs 18.00 T60703/06 Demolition Of Abandoned Structures - Various 14.07 T60703/06 Demolition Of Abandoned Structures - Various 0.93 T60703/09 Line Structure Overcoating: Portal - East 180 Street / White Plains 33.67 T60703/13 Structure Repairs / Dyre Avenue Line 8.99 T60703/13 Structure Repairs / Dyre Avenue Line 0.32 T60703/14 Line Structure Overcoating: Bway Junction - Cypress Hills / Jamaica 25.88
Element Total 101.86
T60803/10 Signal Systems: 2 Interlockings: Union Turnpike & 71 Av 362.69 T60803/13 Signal Systems: Dyre Avenue Line Signals 245.12 T60803/13 Dyre Avenue Line Signals 6.18 T60803/14 Signal Systems: Roosevelt Interlocking / Queens Blvd 110.72 T60803/15 34th St Interlocking / 6th Avenue 2.98 T60803/16 West 4 St Interlocking / 6th Avenue 5.60 T60803/22 Duct Rehabilitation & Negative Cable: Steinway Tube/flushing 46.46
Element Total 779.75
T60806/01 Fiber Optic Cable Replacement: Phase 1 13.90 T60806/01 Fiber Optic Cable Replacement: Phase 1 1.10 T60806/03 PRS: Time Domain Interference Solution 10.15 T60806/04 PA/CIS at 43 Stations: Install Cable 55.56 T60806/07 Copper Cable Upgrade/replacement Phase 2 8.89 T60806/08 VHF Radio System Upgrade 210.71 T60806/09 Comm Room HVAC Ph 2: 7 Stations / Brooklyn 20.00 T60806/13 Antenna Cable Upgrade/replacement Ph 1 15.58 T60806/13 Antenna Cable Upgrade/Replacement Ph 1 0.85 T60806/15 Copper Cable Upgrade/replacement Phase 3 0.62

NYCT2012 Commitments GoalAll $ in millions
ACEP Project Description 2012 Commitments
T60806/15 Copper Cable Upgrade/replacement Phase 3 0.46 Element Total 337.83
T60902/03 Substation Hatchways: 8 Locs 10.63 T60902/04 Cabling: Central Substation / 6th Av - Phase 2 1.00 T60902/05 Substation Roof And Enclosure 15.64 T60902/05 Substation Roof And Enclosure [design Only] 1.26
Element Total 28.52
T60904/04 CBH 74 Havermeyer & 74A Bridge / Jamaica 22.20 T60904/04 CBH 74 Havermeyer & 74A Bridge / Jamaica 0.84 T60904/06 CBH 146 Prospect Park / Brighton 6.34 T60904/06 CBH 146 Prospect Park / Brighton 0.40
Element Total 29.78
T61004/04 207 St Maintenance Shop: Dc Power Upgrade 15.67 T61004/04 207 St Maintenance Shop: Dc Power Upgrade 0.82 T61004/07 DCE Shop Component Priority Repairs Ph 2 1.13 T61004/07 DCE Shop Component Priority Repairs Ph 2 1.13 T61004/13 Yard Track - 2012 3.06 T61004/19 Yard Switches - 2012 4.71
Element Total 26.52
T61204/03 Bus Radio System Interim Upgrade 8.76 T61204/05 IVN For 5 Depots 2.60 T61204/06 3 Bus Washers At Manhattanville Depot 6.38 T61204/06 7 Bus Washers at Kb, Gh, Cs 5.91 T61204/09 Tank Upgrades: 2 Depots 1.97 T61204/10 HVAC Upgrades - 4 Depots (locker Rooms) 1.14 T61204/18 Bus Lane Enforcement Cameras, Phase 1 2.70
Element Total 29.46
T61302/05 Purchase 118 Non-Rev Vehicles: 2012-2013 13.94 T61602/03 Capital Revolving Fund - 2012 5.00
Element Total 18.94
T61604/03 Enterprise Securty Network Infrastructure 10.39 Element Total 10.39
T61605/07 Engineering Services: 2012 3.60 T61605/09 Scope Development: 2012 Scope Development 10.00
Element Total 13.60
T61606/04 Asbestos Disposal 2.52 T61606/05 Sprinkler & Alarm Systems: Phase 1 - 5 Locations 17.6T61606/05 Sprinkler & Alarm Systems: Phase 2 9.15

NYCT2012 Commitments GoalAll $ in millions
ACEP Project Description 2012 Commitments
T61606/06 Fire Alarm: 207 Street Overhaul Shop 10.51 T61606/06 Fire Alarm: 207 Street Overhaul Shop 0.49 T61606/07 Groundwater And Soil Remediation (2011) 6.50 T61606/08 Groundwater And Soil Remediation Consultant (2011) 6.00
Element Total 12.50
T61607/02 Information Technology: Jay Street Systems Phase 1 1.90 T61607/03 RTO Master Tower Hardening 4.34 T61607/06 Maspeth Warehouse Repairs 8.60 T61607/06 Maspeth Warehouse Repairs 0.32 T61607/07 Perimeter Hardening: RCC, PCC & 130 Livingston 11.51 T61607/13 Employee Facilities at 207 Street / 8th Avenue 8.66 T61607/17 Livingston Plaza: Elevators, Roof, Facade 0.31 T61607/17 Livingston Plaza: Elevators, Roof, Facade 0.47
Element Total 36.10
Total 2012 Commitments 3,889.17$

MTA Long Island Rail Road2012 Commitment SummaryAll $ in Millions
ACEP Project Description 2012 Commitments
2005-2009L5020425 JCC BUILDING FITOUT - PHASE 2 $0.35L5020427 NEW ATLANTIC TERMINAL ELEVATOR $2.40L502042D NEW ELEVATORS-QUEENS VILLAGE STATION $0.59L502042E NEW ELEVATORS-FLUSHING MAIN STREET $0.57
Element Total $3.91L50206VD PS CUSTOMER SERVICE OFFICE $0.03
Element Total $0.03L50301E1 TRACK EQUIPMENT $1.64
Element Total $1.64L50401B8 QUEENS BLVD BRIDGE $0.80
Element Total $0.80L50601Y1 PORT WASHINGTON YARD - DESIGN $1.52L50601Y3 JAMAICA STATION BUILDING REHAB $6.83
Element Total $8.34L50699YY BABYLON TRAIN WASH $0.23
Element Total $0.23L509048A ELECTRIC SUBSTATIONS REMEDIATION $1.05L509048H HOLBAN YARD $0.10L50904OP PROGRAM DEVELOPMENT $0.77
Element Total $1.922010-2014
L60204UB MASSAPEQUA STATION PLATFORM REPLACEMENT $0.50L60204UH ELEVATOR REPLACEMENT PROGRAM $0.74
Element Total $1.24L60206VL PENN STATION HVAC $0.05
Element Total $0.05L60301TC 2012 ANNUAL TRACK PROGRAM $51.80L60301TF CONSTRUCTION EQUIPMENT $2.20L60301TG ATLANTIC BRANCH 1/2 TIES $1.73L60301TH MERRICK/BELLMORE DIRECT FIXATION $17.29L60301TL ROW-FENCING $1.60L60301TM ERT TUNNEL REHABILITATION $25.00
Element Total $99.62L60304TU JAMAICA CAPACITY IMPROVEMENTS $19.02L60304TV MASSAPEQUA POCKET TRACK $1.60
Element Total $20.62L60401BB BRIDGE PROGRAM $14.60L60401BD CONSTRUCT 150TH ST-JAMAICA & BRDWY/PW $2.50L60401BE CONSTRUCT 3 MONTAUK BRANCH BRIDGES $0.58L60401BF ATLANTIC AVENUE VIADUCT - PHASE 2B $1.13L60401BH WOODHAVEN BLVD. BRIDGE $7.93
Element Total $26.74L60501L1 FIBER OPTIC NETWORK $10.00L60501L4 IMPROVED RADIO COVERAGE INITIATIVE $2.30L60501L6 PENN STATION RADIO RETROFIT/ERT ANTENNA $0.12

MTA Long Island Rail Road2012 Commitment SummaryAll $ in Millions
ACEP Project Description 2012 Commitments
L60501L7 ATLANTIC AVE TUNNEL CABLE REPLACEMENT $0.05Element Total $12.47
L60502LA POSITIVE TRAIN CONTROL $0.36Element Total $0.36
L60601YA SHOP RECONFIG & RCM INFRASTRUCTURE $0.73L60601YB HILLSIDE FACILITY BLDG REHAB (ROOF) $4.90L60601YC HILLSIDE MAINTENANCE FACILITY $1.86L60601YN NEW MID SUFFOLK ELECTRIC YARD $0.08
Element Total $7.56L60604YT REHAB OF EMPLOYEE FACILITIES $1.66
Element Total $1.66L60701AA 2010-2014 SUBSTATION REPLACEMENT $23.09L60701AJ ATLANTIC AVE TUNNEL LIGHTING $6.53
Element Total $29.62L60904NA PROGRAM ADMIN $24.83L60904NC INSURANCE $0.10L60904ND INDEPENDENT ENGINEER $0.90
Element Total $25.83
Long Island Rail Road 2012 Commitment Total $242.64

MTA Metro-North Railroad2012 Commitment SummaryAll $ in Millions
ACEP Project Description 2012 Commitments
2000-2004M4020313 North White Plains Parking - EIS/EA/Prelim Design $0.30
Element Total $0.302005-2009
M5010112 Rolling Stock Signals (PTC) $3.26Element Total $3.26
M5020108 GCT Water Conveyance Utilities Improvements $0.46Element Total $0.46
M5020209 Bronx Stations/Capacity Improvements $5.57M5020210 Smart Cards $2.78
Element Total $8.35M5050101 Substation Bridge 23 $5.45
Element Total $5.45M5080109 Customer and Employee Communications Projects $2.03
Element Total $2.032010-2014
M6010102 M-8 New Haven Line Purchase $17.36Element Total $17.36
M6020101 GCT Trainshed/Tunnel Structure $4.04M6020102 Park Avenue Tunnel Renewal $7.50M6020106 GCT Elevator Rehab Phase 4 $1.50M6020108 GCT Utilities $2.13
Element Total $15.17M6020201 Poughkeepsie Station Building $1.00M6020203 Harlem Line Station Renewal $2.30M6020204 Station Building Rehabilitation/Net Lease $0.26M6020206 New Haven Line Station Phase II $32.73M6020207 Smart Card Improvements $4.38M6020208 Customer Communications/Connectivity Improvements $5.37
Element Total $46.04M6020302 Strategic Facilities $2.45
Element Total $2.45M6030102 Turnouts - Mainline/High Speed $27.43M6030103 GCT Turnouts/Switch Renewal $3.50M6030104 Turnouts - Yards/Sidings $0.59M6030106 Cyclical Repl. Insulated Joint $0.48M6030107 Rock Slope Remediation $5.00M6030108 Drainage and Undercutting Program $9.78M6030109 Rebuild Retaining Walls $3.60M6030112 2012 Cyclical Track Program $13.00
Element Total $63.38M6030206 Remove Obsolete Facilities $0.04M6030209 Employee Welfare and Storage Facility $0.60M6030210 Replace/Repair Undergrade Bridges Program $14.38M6030211 Harlem River Lift Bridge Cable $9.55M6030213 Catenary Painting/Rehabilitate Catenary Structures $3.50M6030214 Park Avenue Viaduct Direct Fixation $1.80
Element Total $29.87M6030301 West of Hudson Track Program $6.45

MTA Metro-North Railroad2012 Commitment SummaryAll $ in Millions
ACEP Project Description 2012 Commitments
M6030302 West of Hudson Improvements $0.75M6030303 Moodna/Woodbury Viaduct $3.36M6030304 Otisville Tunnel Renewal $3.00M6030305 West of Hudson Replace/Renew Undergrade Bridges $1.80
Element Total $15.35M6040101 Positive Train Control $38.65M6040102 West of Hudson Signal Improvements $64.96M6040103 Replace Fiber/Communication & Signals Cables $3.69M6040104 Replace Field code System - Mott Haven $0.63M6040105 Crossing Upgrades - Phase 2 $0.79M6040106 Centralized Train Control/SCADA Intrusion Testing $0.70M6040108 Design/Replace Harlem and Hudson Track Relays $0.68M6040111 PBX Equipment Upgrade $1.37M6040116 Radio Frequency Rebanding $0.51
Element Total $111.98M6050101 Substation Bridge 23 - Construction $26.81M6050102 Renewal Harlem & Hudson Substations - Construction $2.90M6050103 Harlem & Hudson Lines Power Improvements $26.25M6050104 Replace Motors Alternators $1.00M6050107 Harlem River Lift Bridge Breaker Houses/Controls $13.60M6050109 Replace 3rd Rail Brackets - Park Avenue Tunnel $0.91
Element Total $71.47M6060101 Harmon Shop Improvements $8.93
Element Total $8.93M6080106 Program Administration $9.00M6080107 Program Scope Development $2.32
Element Total $11.32
Metro-North Railroad 2012 Commitment Total $413.17

MTA Bus2012 Commitments GoalAll $ in millions
Project Description2012
Commiments
2005-2009U5030205 $12.55U5030219 $4.00U5030210 $2.83U5030220 $1.68U5030204 $7.73U5030202 $3.00U5030218 $7.50U5030220 $1.50
Element Total $40.782010-2014U6030215 $2.20
U6030205 $3.30
Element Total $5.50
2012 Commitments Goal $46.28
Fuel Tanks and Bus Wash: Eastchester Depot
New Boilers and A/C: JFK Depot
Security Upgrade: Eastchester and LaGuardia
Security Upgrade: College Point DepotService Vehicles
Bus Wash: JFK and Baisley ParkBus Cameras on 79 CNG Buses
College Point Storage Building
Chassis Wash and Oil Water Separator: JFK
Emergency Generators: 6 Depots
ACEP

2012 Commitments GoalAll $ in millions
ACEP Project Description 2012 Commitments
2000-2004D405BB43 Rehab Battery Parking Garage $3.98
Element Total $3.982005-2009
D505QM01 Service & FE Building Rehab $2.30Element Total $2.30
2010-2014D601BB28 Rehab. Walls, Roadway, Firelines, Ceiling Repair $4.11
Element Total $4.11D601BW14 Miscellaneous Structural Rehabilitation $0.05D601BW84 Cable Investigation / Monitoring $0.05D601BW97 Concrete Anchorage Repairs $9.81
Element Total $9.91D601HH07 Structural Rehabilitation - Phase I $1.08
Element Total $1.08D601MP16 Miscellaneous Steel Repairs $2.25
Element Total $2.25D601QM40 Tunnel Wall and Ceiling Repairs and Leak Control $5.22
Element Total $5.22D601RK19 Seismic and Wind Study $5.00D601RK23 Miscellaneous Rehab - Manhattan Approach Ramps $9.06D601RK76 Miscellaneous Structural Repair $0.55
Element Total $14.61D601VN35 Steel Repair & Concrete Rehab. & Drainage Systems $2.69
Element Total $2.69D602BB54 Replacement Brooklyn Plaza Structural Slab $2.34
Element Total $2.34D602HH88 Replace Upper & Lower Level Plazas and Southbound Approach $9.41
Element Total $9.41D602MP21 Rehabilitate Rockaway Point Blvd Overpass $1.11
Element Total $1.11D602RK65 Deck Replacement - Bronx/Manhattan Ramps/TollPlaza $15.86D602RK73 Deck Replacement- RFK MQ Ramp $71.26
Element Total $87.11D602TN49 Suspended Span Replacement - Phase A $11.68
Element Total $11.68D602VN80 Replace Upper Level Suspended Span $332.88D602VN84 Widening of Belt Parkway Ramps $0.05
Element Total $332.93D604QM30 Tunnel Ventilation Building Electrical Upgrade $64.41D604QM81 Controls / Communication System $0.05
Element Total $64.46D604VN87 Substation #1 Rehabilitation $0.95
Element Total $0.95D605AW12 Hazardous Materials Abatement $0.40
Element Total $0.40D605BB21 Service Building Rehabilitation $0.54
MTA Bridges & Tunnels

2012 Commitments GoalAll $ in millions
ACEP Project Description 2012 Commitments
MTA Bridges & Tunnels
D605BB43 Miscellaneous Repairs at BPG $0.75Element Total $1.29
D606AW18 Protective Liability Insurance $0.24D606AW21 Program Administration $3.21D606AW28 Scope Development $1.20
Element Total $4.65D607MP21 Paint - Rockaway Point Overpass $0.02
Element Total $0.02D607VN80 Paint - Upper Level Superstructure $16.10
Element Total $16.10
MTA Bridges and Tunnels 2012 Commitment Total $578.59

2012 Commitment Goals
Project ID (ACEP) Project Description 2012 Commiments2000-2004
G4140203 Penn Stn LIRR/NYCT Sec/Harden $0.31G4140401 Cisco Video Upgrade $0.45G4140401 Consolidated Training $0.90G4140501 Lenel Enterprise Work $1.30
Element Total $2.962005-2009
G5100104 Cntract 6: SAS Systems $325.19G5100197 SAS Owner Controlled Insurance $1.40
Element Total $326.59
G5110112 Construction: Core&Shell (Site P)$103.48
Element Total $103.48
G5140207 08TSG Atlantic Ave Perim Prot $11.27
G5140208 09ARRA TSG Penn Station FLS (Design) $1.92Element Total $13.19
G5140305 GCT Lexington Avenue Bollards $0.35
Element Total $0.35
2010-2014
G6100101 2B/C: Shell/Finishes/MEP 96 St $439.26
Element Total $439.26
Total MTA Bus 2012 Commitment Goals $885.83
MTA Capital Construction
All $ in Millions

ACEP Project Description 2012 Commiments
2005-2009
N5100104 K-9 Facility (Construction) 10.5N5100109 Public Safety Radio (30% Design) 0.5
Element Total 11.05
MTA Police Department 2012 Commitment Total $11.05
MTA Police Department2012 Commitment SummaryAll $ in Millions

MTA NYCT2012 ‐ 2015 Completions $ in millions
ACEP Project Description CompletionsProject Allocations
T30411/9K Station Rehabilitation:149 St-Grand Concourse / Jerome Design Jan-12 $2.65
T30411/9L Station Rehabilitation:149 St-Grand Concourse/White Plains Design Jan-12 $1.59
T40806/T1 Communications Cable And Equipment:TIS Command Center At RCC Jan-12 $1.30
T50703/39 Line Structure Overcoating:Portal - 27 Street / Astoria & Flushing Jan-12 $14.20
T40806/T1 Communications Cable And Equipment:Cable: Network Management (CNMMS) Jan-12 $10.83
T60502/23 Mainline Track Rehabilitation:Mainline Track Replacement at Clark St Tube Jan-12 $10.11
T51004/03 Shop Equipment And Machinery:207 St OH Shop: Cranes And Equipment Jan-12 $2.59
T60502/19 Mainline Track Rehabilitation:Mainline Track Replacement at 8th Avenue Jan-12 $16.58
T60502/06 Welded Rail:Continuous Welded Rail - 2011 Jan-12 $6.57
T60302/20 New Buses:90 Standard Diesel Buses - Daimler Pilot Jan-12 $44.77
T61004/18 Yard Switches:Yard Switches - 2011 Jan-12 $2.03
T60302/03 New Buses:90 Express Buses Feb-12 $55.46
T50404/05 MetroCard Vending Machine Replacement: Bill Handler Upgrade Feb-12 $3.25
T51204/19 Depot Rehabilitation:Jamaica Depot Roof Repairs, Phase 1 (Mentor) Feb-12 $0.92
T50404/01 Fare Control Modernization:Smart Card Cabling: 32 Pilot Stations Feb-12 $4.64
T50803/17 Fire Protection:Signal Room Fire Suppression, Phase 1 Feb-12 $18.09
T51604/02 Computer Hardware & Communications:HP Server Consolidation/Replacement Feb-12 $5.20
T60412/55 Station Component Investments:2 Street Stairs: Rockaway Avenue / New Lots [Mentor] Feb-12 $0.83
T50806/16 Station Communication Rooms:HVAC Comm Rooms: 5 Locations Feb-12 $6.67
T60302/21 New Buses:90 Standard Diesel Buses - New Flyer Pilot Feb-12 $44.23
T50411/60 Station Rehabilitation:Far Rockaway-Mott Avenue/ Far Rockaway Feb-12 $11.31
T50411/63 Station Rehabilitation:Beach 105 Street / Rockaway Feb-12 $18.29
T50411/62 Station Rehabilitation:Beach 98 Street / Rockaway Feb-12 $20.20
T50806/08 Antenna Cable Replacement:Antenna Cable Replacement Phase II (Wrap Up) Feb-12 $3.00
T50413/17 Station Accessibility (ADA):Mott Avenue: Far Rockaway Line Feb-12 $10.67
T60503/07 Mainline Track Switches:Mainline Track Switches at Jamaica Feb-12 $4.36
T50411/61 Station Rehabilitation:Beach 90 Street / Rockaway Feb-12 $19.38
T50703/29 Line Structure Overcoating:27 Street - 41 Avenue / Astoria & Flushing Mar-12 $13.80
T51204/20 Depot Rehabilitation:Jamaica Depot Roof Repair, Phase 2 [Mentor] Mar-12 $0.97
T40411/2D Station Rehabilitation:Intermodal: Gun Hill Road / White Plains Road Mar-12 $6.77
T60412/57 Station Component Investments:2 Street Stairs: New Lots Avenue / New Lots [Mentor] Mar-12 $0.85
T60302/04 New Paratransit Vehicles:15 Paratransit Vehicles - Ramp-based prototype (CNG) Mar-12 $0.93
T51604/03 Misc: Human Resources/Customer Services:Automated Telephone Travel Information Mar-12 $2.84
T30902/FE Substations (IRT-BMT):Neg Return System At Joralmon/Willow Mar-12 $4.20
T41302/O4 Work Train & Special Equipment:36 CWR Flatcars & 18 Flatcars Mar-12 $15.11
T51607/26 Consolidated Employee Facilities:Subways:East 180th Street / White Plains Road Mar-12 $6.54
T50806/01Communications Cable And Equipment:ATM Network System: B Division - 253 Stations OPTION Mar-12 $210.63
T40806/P2 Public Address/Customer Info Systems:PA/CIS, Phase 2: 156 Stations (IRT) Mar-12 $200.19
T50803/20 Communication-Based Train Control:CBTC Canarsie: Automatic Signal Removals Mar-12 $5.08
T50803/24 Signal Systems:Alstom Relay Replacement Mar-12 $10.82
T50803/19 Communication-Based Train Control:CBTC Canarsie: Equip 64 R-160 Cars Mar-12 $61.37
T50411/74 Station Rehabilitation:East 180 Street / White Plains Road Mar-12 $49.65
T60904/10 Power Distribution Facilities:Joralemon/Willow Duct Replacement Mar-12 $4.07
T50806/04Communications Cable And Equipment:Copper Cable Replacement: Steinway Tube - Phase 1 Mar-12 $4.49
T60806/18 Communications Cable And Equipment:Copper Cable Repl: Steinway Tube Phase 2 Mar-12 $9.95

MTA NYCT2012 ‐ 2015 Completions $ in millions
ACEP Project Description CompletionsProject Allocations
T40409/PW Public Address/Customer Info Systems:PA/CIS Wrap-Up (TIS) Mar-12 $2.07
T40806/D2Communications Cable And Equipment:ATM Network System: B Division - 253 Stations BASE Mar-12 $91.67
T51605/06 Materiel:Concrete Batch Plant Inspection Mar-12 $1.49
T50302/27 New Buses:90 Standard Low-floor CNG Buses Mar-12 $45.96
T50413/19 Station Accessibility (ADA):ADA: E 180 Street / White Plains Road Mar-12 $10.43
T60503/02 Mainline Track Switches:29 Mainline Switches - 2011 Mar-12 $37.13
T50414/21 Station Component Investments:Station Ventilator Rehab: 149 Street-Grand Conc / Jerome Mar-12 $3.61
T61605/08 Capital Program Management:Construction Support Reserve 2010 Mar-12 $2.33
T50414/21 Station Component Investments:Station Ventilator Rehab: 149 Street-Grand Conc LL / WPR Mar-12 $1.84
T51605/08 Capital Program Management:Concrete Cylinder Testing (2006) Mar-12 $0.63
T50599/01 Maintenance Of Way:Third Rail Heater Control System Mar-12 $2.00
T60502/27 Mainline Track Rehabilitation:Mainline Track Replacement 2012 at Atlantic Avenue Apr-12 $5.36
T50499/05 Station Rehabilitation:25 Avenue / West End Line Apr-12 $10.60
T50806/15 Public Address/Customer Info Systems:PA/CIS: 44 Stns: Install Cable & Equip Apr-12 $24.27
T50499/09 Station Rehabilitation:Fort Hamilton Parkway / West End Apr-12 $23.88
T50414/21 Station Component Investments:181 Street Ceiling / Broadway-7th Ave EMERGENCY FIX Apr-12 $7.02
T50499/12 Misc: Stations:Station Work: 50 Street / West End Apr-12 $9.71
T50799/01 Elevated Structure Rehabilitation:Bay 50 Street - 63 Street / West End Apr-12 $41.48
T50799/02 Elevated Structure Rehabilitation:63 Street - 9 Avenue / WST Apr-12 $17.30
T50499/08 Station Accessibility (ADA):ADA: Bay Parkway / West End Apr-12 $14.23
T50499/01 Station Rehabilitation:71 Street / West End Apr-12 $10.23
T50499/13 Misc: Stations:Station Work: 55 Street / West End Apr-12 $9.85
T50499/03 Station Rehabilitation:18 Avenue / West End Apr-12 $10.07
T50499/04 Station Rehabilitation:20 Avenue / West End Apr-12 $9.60
T50499/10 Station Rehabilitation:62 Street / West End Apr-12 $21.24
T50499/07 Station Rehabilitation:Bay Parkway / West End Apr-12 $23.60
T50499/11 Station Rehabilitation:9 Avenue / West End Apr-12 $23.36
T60412/56 Station Component Investments:3 Street Stairs: Saratoga Avenue/New Lots [Mentor] Apr-12 $1.15
T51605/01 Capital Program Management:MTA-Indep Engineering Consultant 2009-2010 Apr-12 $8.27
T50499/06 Station Rehabilitation:Bay 50 Street / West End Apr-12 $9.80
T50499/02 Station Rehabilitation:79 Street / West End Apr-12 $10.17
T60502/34 Mainline Track Rehabilitation:Mainline Track Replacement 2012 at 168 Street/ 8 Avenue May-12 $1.62
T60412/37 Station Renewal:Hunters Point Avenue / Flushing May-12 $10.47
T60502/30 Mainline Track Rehabilitation:Mainline Track Replacement 2012 at Sea Beach May-12 $1.01
S50701/11 SIR: Passenger Stations:St George Terminal: Floor Repair/Repl May-12 $6.24
T51199/02 Yard Rehabilitation:Yard Fencing: 5 Locations May-12 $21.47
S40701/15 SIR: Passenger Stations:Station Security Initiatives May-12 $18.35
T50499/14 Station Accessibility (ADA):Induction Loops: 642 Booths May-12 $13.37
T60904/02 Power Distribution Facilities:CBH #292/293 Albermarle Rd / Nostrand Jun-12 $6.25
T60503/11 Mainline Track Switches:Mainline Track Switches - 2012 at Broadway-7th Avenue Jun-12 $5.29
T60502/31 Mainline Track Rehabilitation:Mainline Track Replacement 2012 at N/O Pacific Street Jun-12 $4.03
T60502/41 Mainline Track Rehabilitation:Mainline Track Replacement 2012 at Broadway-7th Avenue Jun-12 $7.04
T41404/2R Facilities: Police:District Office 23: Canopy Reconstruction - Mentoring Jun-12 $0.93
T51602/02 Capital Revolving Fund:Capital Revolving Fund - 2009 Jun-12 $5.00

MTA NYCT2012 ‐ 2015 Completions $ in millions
ACEP Project Description CompletionsProject Allocations
T60414/10 Station Accessibility (ADA):Platforms: 45 Rd-Court House Sq/Flushing Jun-12 $18.40
T50414/07 Platform, Roof & Canopy Replacement:Repair Canopies: 5 Stns / Bway-7th Ave Jun-12 $14.14
T60412/71 Station Component Investments:Station Painting at Component Locations: 207 St / BW7 Jun-12 $0.51
T60412/11 Station Normal Replacement:Dyckman Street / Broadway-7th Ave Jun-12 $46.93
T50414/21 Station Component Investments:Street Stairs: 2 Locations / Broadway-7th Ave Jun-12 $8.05
T50414/21 Station Component Investments:Platform Edge: 5 Locations / Broadway-7th Ave Jun-12 $12.07
T50411/55 Station Rehabilitation:Beach 67 Street / Far Rockaway Jun-12 $22.07
T50411/56 Station Rehabilitation:Beach 60 Street / Far Rockaway Jun-12 $18.16
T50411/59 Station Rehabilitation:Beach 25 Street / Far Rockaway Jun-12 $18.44
T50411/57 Station Rehabilitation:Beach 44 Street / Far Rockaway Jun-12 $17.95
T60502/04 Mainline Track Rehabilitation:Mainline Track Replacement - 2011 Jun-12 $108.52
T60502/17 Mainline Track Rehabilitation:Mainline Track Replacement at Jamaica Jun-12 $11.68
T50302/12 New Buses:Bus Cameras for 90 Articulated Buses Jun-12 $2.42
T50411/58 Station Rehabilitation:Beach 36 Street / Far Rockaway Jun-12 $16.91
T31302/RG Work Train & Special Equipment:1 Rail Grinder Jun-12 $11.73
T30806/BS Employee Facilities-Rapid Transit:Upgrade RTO Radio Base Stations to Fiber Optics Jun-12 $15.59
T60503/08 Mainline Track Switches:Mainline Track Switches at 238th Street Jun-12 $8.51
T50414/02 Intermodal/Transfer Facilities:Broadway-Lafayette-Bleecker Transfer Jun-12 $81.52
T50302/27 New Buses:Bus Cameras for 90 Standard Low-floor CNG Buses Jun-12 $4.25
T60604/02 Water Conditions Remedy:Deep Wells: Crosstown Ph 2: Rehabilitate Jun-12 $11.47
S50701/12 SIR: Line Equipment:Signl Sys Mod: St.George-Tottnvil/Wrap-Up Jun-12 $1.19
T40807/01 Rapid Transit Operations:Backup Command Center Jun-12 $22.84
T50806/16 Station Communication Rooms:HVAC Comm Romms: 2 Locs Jun-12 $0.92
T51606/09 Groundwater And Soil Remediation:Consultant Srvcs: UST & Remediation 2008 Jun-12 $7.37
T50413/02 Station Accessibility (ADA):Broadway-Lafayette-Bleecker St Complex Jun-12 $18.14
T60806/06 Communications - RTO:RTO: Portable Radio Unit Replacement Jun-12 $7.21
T50302/18 New Buses:Turbine Bus Pilot TERMINATED Jun-12 $54.70
T50411/08 Station Rehabilitation:Bleecker Street / Lexington Jun-12 $33.65
T50703/17 Line Structure Overcoating:Portal To EOL / Pelham Jun-12 $28.16
T50806/16 Station Communication Rooms:Comm Room HVAC: 6 Locs (On-Call) Jun-12 $4.21
T60412/66 Station Component Investments:Street Stairs: Longwood Avenue/Pelham [Mentor] Jul-12 $0.93
T60412/58 Station Component Investments:3 Street Stairs: Sutter Av-Rutland Rd/New Lots [Mentor] Jul-12 $0.94
T60412/12 Station Rehabilitation:Smith-9 Streets / Prospect Park Line Jul-12 $32.31
T60412/01 Station Component Investments:4 Avenue / Culver Jul-12 $11.87
T51607/36 Roofing Repair & Replacement:DOS Roof Replacement Phase 2 Jul-12 $19.66
T61204/18 Misc: Bus Projects:Bus Lane Enforcement Cameras, Phase 1 Aug-12 $2.70
T61004/05 Car Maintenance Shops:East New York Maintenance Shop: Ventilation Improvements Aug-12 $5.61
T61604/02 Computer Hardware & Communications:Enterprise-Wide SAN/Disaster Recovery Phase 1 Aug-12 $6.37
T60502/24 Mainline Track Rehabilitation:Mainline Track Replacement 2012 at Broadway Aug-12 $2.55
T30803/CN Mainline Track Rehabilitation:CBTC Canarsie: I/H Track Wrap-Up Aug-12 $0.41
T60502/46 Mainline Track Rehabilitation:Mainline Track Replacement 2012 at Pelham Aug-12 $1.57
T60602/02 Tunnel Lighting Rehabilitation:4 Avenue - Church Av Local Tracks / Culver Aug-12 $31.83
T41203/FG New Depots & Facilities:Charleston-Storm Water Sewer Aug-12 $14.92
T50404/03 Fare Control Modernization:Replac High Production Encoding Machines Aug-12 $5.24
T61204/05 Depot Equipment And Machinery:IVN For 5 Depots Sep-12 $2.60
T50699/01 Ventilation Facilities:Vent Plant: Jackson Avenue / Queens Sep-12 $83.66

MTA NYCT2012 ‐ 2015 Completions $ in millions
ACEP Project Description CompletionsProject Allocations
T60502/38 Mainline Track Rehabilitation:Mainline Track Replacement 2012 at Queens Blvd Sep-12 $9.09
T60502/32 Mainline Track Rehabilitation:Mainline Track Replacement 2012 at Jamaica Sep-12 $7.88
T61004/03 Car Maintenance Shops:207 Street Overhaul Shop: Heating Plant Sep-12 $15.70
T51204/11 Depot Rehabilitation:Bus Lifts At Various Locations Sep-12 $8.80
T51204/22 Depot Equipment And Machinery:Chassis Wash Repl 2 Lifts: Fresh Pond Depot [Mentor] Sep-12 $0.97
T50904/03 Control And Battery Cable:Replace Cable: 4 Substation Control Zones Sep-12 $48.81
T60412/62 Station Component Investments:Platform Stairs: 182-183 Streets / Concourse Sep-12 $1.58
T50999/01 Substations (IND):Jay St Substation: DC Feeders / CBH #579 Sep-12 $34.59
T60502/29 Mainline Track Rehabilitation:Mainline Track Replacement 2012 at West End Oct-12 $3.18
T60503/09 Mainline Track Switches:Mainline Track Switches - 2012 at West End Oct-12 $7.06
T60412/59 Station Component Investments:Street Stairs: Longwood Avenue/Pelham [Mentor] Oct-12 $1.26
T60412/62 Station Component Investments:Street Stairs: Fordham Road / Concourse [Mentor] Oct-12 $1.31
T60412/63 Station Component Investments:Station Components: 138 Street- 3 Av / Pelham (Mentor) Oct-12 $1.43
T60502/47 Mainline Track Rehabilitation:Mainline Track Replacement 2012 at Lexington Avenue Oct-12 $8.50
T60503/13 Mainline Track Switches:Mainline Track Switches - 2012 at Lexington Avenue Oct-12 $6.31
T60503/10 Mainline Track Switches:Mainline Track Switches - 2012 at Queens Blvd Oct-12 $5.54
T60502/26 Mainline Track Rehabilitation:Mainline Track Replacement 2012 at N/O Dekalb Oct-12 $5.54
T50803/25 Signal Systems:Times Square - n/o Hunters Pt / Flushing WRAP-UP Oct-12 $4.02
T50602/15 Tunnel Lighting Rehabilitation:7 Av And 47-50 Sts To Lex Av / QBL Oct-12 $11.99
T50602/16 Tunnel Lighting Rehabilitation:Removals: Lex Av-Queens Plz / 53 St Tube Oct-12 $2.82
T60302/05 New Buses:171 Standard Low-floor CNG Buses Oct-12 $87.13
T50703/35 Elevated Structure Rehabilitation:Stillwell Avenue Terminal: Place Switch 977 in Service Oct-12 $2.10
T50803/14 Signal Systems:Interlockings: Lexington Av, 5 Av / Queens Blvd Oct-12 $142.57
T60502/44 Mainline Track Rehabilitation:Mainline Track Replacement 2012 at Lenox-White Plains Rd Nov-12 $7.56
T60803/04 Signal Systems:Replace Solid State Signal Equipment - 5 Locs Nov-12 $6.90
T60502/35Mainline Track Rehabilitation:Mainline Track Replacement 2012 at Cranberry Tube / 8 Avenue Nov-12 $8.52
T51606/10 Asbestos Abatement:Asbestos Waste Disposal I/Q Nov-12 $0.84
T60502/33 Mainline Track Rehabilitation:Mainline Track Replacement 2012 at Myrtle Avenue Nov-12 $15.97
T51204/07 Depot Rehabilitation:Lifts: Stengel/Manhattanville Nov-12 $5.70
T51204/16 Depot Rehabilitation:Priority Repairs: Jamaica Depot Nov-12 $4.12
T60904/10 Substations (IND):Cabling: Central Substation / 6th Av - Phase 1 Nov-12 $10.00
T51302/04 Rubber-Tired Vehicles:Replace Rubber Tire Vehicles - 2008-2009 Nov-12 $7.49
T61204/02 Misc: Bus Projects:BRT - Bus Rapid Transit 2010-2011 Dec-12 $10.00
T60502/25 Mainline Track Rehabilitation:Mainline Track Replacement 2012 at Brighton Dec-12 $7.64
T50902/16 Substations (IND):Greeley Substation / 6th Avenue Dec-12 $30.81
T60502/45 Mainline Track Rehabilitation:Mainline Track Replacement 2012 at Jerome Ave Dec-12 $4.90
T60502/42 Mainline Track Rehabilitation:Mainline Track Replacement 2012 at Flushing Dec-12 $30.16
T60502/36 Mainline Track Rehabilitation:Mainline Track Replacement 2012 at 6th Avenue Dec-12 $14.72
T60412 Station Component Investments:Station Ventilators: Ph3 - 7 Loc / Canarsie & 6 Av Lines Dec-12 $3.51
T60902/01 Substation Enclosures (IRT-BMT):Substation Enclosures: 5 Locations Dec-12 $16.64
T61004/13 Yard Track Rehabilitation:Yard Track - 2012 Dec-12 $3.14
T61004/19 Yard Switches:Yard Switches - 2012 Dec-12 $4.98
T51204/24 Chassis Wash Lift Replacement: East New York Depot [Mentor] Dec-12 $0.55
T51204/23 Depot Equipment And Machinery:Chassis Wash Lift Replace: Castleton Depot [Mentor] Dec-12 $0.55

MTA NYCT2012 ‐ 2015 Completions $ in millions
ACEP Project Description CompletionsProject Allocations
T41204/01 Radio & Data Communication:AVLM: Paratransit - 2,273 Veh Dec-12 $37.28
T50302/12 New Buses:Intelligent Vehicle Network (IVN) at 4 Depots Dec-12 $2.12
T61605/04 Capital Program Management:Independent Eng'g Consultant 2010-2014 Dec-12 $19.48
T60414/01 Station Signage:Station Signage Dec-12 $3.93
T50904/02 Power Distribution Facilities:Duct Reconstruction: Ryders - Front St / 8th Avenue (Phase2) Dec-12 $21.36
T60502/09 Welded Rail:Continuous Welded Rail - 2012 Dec-12 $5.69
T60503/03 Mainline Track Switches:29 Mainline Switches - 2012: Design and EFA Dec-12 $9.62
T60502/07 Mainline Track Rehabilitation:Mainline Track Replacement - 2012: Design and EFA Dec-12 $3.33
T60502/08 Mainline Track Rehabilitation:Track Force Account - 2012 Dec-12 $35.00
T40803/CI Mainline Track Rehabilitation:SSI Bergen: I/H Track Wrap-Up Dec-12 $1.80
T60503/12 Mainline Track Switches:Mainline Track Switches - 2012 at Eastern Parkway Jan-13 $3.57
T60502/28 Mainline Track Rehabilitation:Mainline Track Replacement 2012 at S/O Court Street Jan-13 $2.26
T60502/43 Mainline Track Rehabilitation:Mainline Track Replacement 2012 at Eastern Parkway Jan-13 $2.17
T60502/48 Mainline Track Rehabilitation:Mainline Track Replacement 2012 at White Plains Road Jan-13 $9.95
T60503/14 Mainline Track Switches:Mainline Track Switches - 2012 at White Plain Road Jan-13 $9.30
T60502/40 Mainline Track Rehabilitation:Mainline Track Replacement 2012 at Rockaway Jan-13 $9.16
T60502/37 Mainline Track Rehabilitation:Mainline Track Replacement 2012 at Concourse Jan-13 $15.13
T60502/39 Mainline Track Rehabilitation:Mainline Track Replacement 2012 at Canarsie Jan-13 $1.15
T51606/02 Groundwater And Soil Remediation:Groundwater And Soil Remediation (2005) Jan-13 $6.99
T51606/04 Fire Protection:Fire Alarm: 130 Livingston & Power Ctr Jan-13 $15.55
T61004/02 Car Maintenance Shops:207 St OH: Electrical Jan-13 $21.25
T51204/16 Depot Rehabilitation:Priority Repairs: Flatbush Depot Feb-13 $5.82
T51203/07 Depot Rehabilitation:ENY Depot Rehab Feb-13 $17.19
T51204/16 Depot Rehabilitation:Priority Repairs: Ulmer Depot Feb-13 $8.89
T51204/16 Depot Rehabilitation:Priority Repairs: Jamaica Depot (Terminated I/H Work) Feb-13 $0.90
T50803/12 Signal Systems:Interlocking: 4th Ave / Culver Feb-13 $118.26
T40404/M4 Fare Control Modernization:AFC Replacement, Phase 1: Station Controllers Feb-13 $7.53
T50703/07 Elevated Structure Rehabilitation:Culver Viaduct Rehabilitation - Phase 2 Feb-13 $151.41
T61607/21 Facilities: Distribution:Replace Roofing System at Maspeth Office Building [Mentor] Mar-13 $0.20
T60302/23 Bus Component Systems:Bus Cameras - 2010-14 Purchases Mar-13 $24.83
T50904/06 Power Distribution Facilities:Neg Cable Repl: Rockaway & Far Rockaway Mar-13 $13.12
T51302/10 Rubber-Tired Vehicles:Diesel Part. Filters: Non-Rev Fleet, Ph1 Mar-13 $4.97
T40803/CI Signal Systems:SSI: Bergen St Interlocking / Prospect Park WRAP-UP Mar-13 $1.42
T61607/13 Consolidated Employee Facilities:Subways:207 Street / 8th Avenue Mar-13 $8.78
T60412/30 Station Component Investments:Station Walls-Tile Repl: Borough Hall / Lexington Apr-13 $2.84
T60703/05 Elevated Structure Rehabilitation:Cypress Hills - 130 Street / Jamaica Apr-13 $19.15
T60703/18 Line Structure Overcoating:Cypress Hills - 130 Street / Jamaica Apr-13 $20.04
T61606/02 Asbestos Abatement:Asbestos Abatement I/Q May-13 $8.30
T60902/02 Substations (IND):Modernize 10 Street Substation / Culver May-13 $20.63
T60703/03 Elevated Structure Rehabilitation:Culver Viaduct Rehabilitation Phase 3 - Underside May-13 $50.64
T61302/03 Work Train & Special Equipment:8 Auger-Type Snowthrowers May-13 $8.98
T60902/03 Misc: Power:Substation Hatchways: Phase 2 - 2 Loc CONSTRUCTION ONLY May-13 $3.81
T60302/06 New Buses:90 Articulated Buses Jun-13 $78.08
T61204/09 Misc: Bus Projects:Tank Upgrades: 2 Depots Jun-13 $2.60
T60407/01 Escalator Replacement:3 Escalators - Southern Manhattan Jun-13 $14.48

MTA NYCT2012 ‐ 2015 Completions $ in millions
ACEP Project Description CompletionsProject Allocations
S60701/02 SIR: Structures:Rehabilitation of 8 Bridges Jun-13 $20.64
T60302/02 New Buses:328 Articulated Buses Jun-13 $251.94
T60414/03 Misc: Stations:Water Condition Remedy (2011) Jun-13 $3.77
T60502/21 Mainline Track Rehabilitation:Mainline Track Replacement at Dyre Av Jun-13 $1.08
T60703/01 Water Conditions Remedy:Flood Mitigation and Relieving Platform Rehab / 148 St Yard Jun-13 $26.22
T51204/13 Depot Equipment And Machinery:Depot Equipment 2009 Jun-13 $9.88
T51203/06 New Depots & Facilities:Clara Hale Depot: Reconstruction Jul-13 $253.02
T60904/01 Power Distribution Facilities:New Duct Bank: 141 St - 148 St / Lenox Jul-13 $22.20
T61606/03 Asbestos Abatement:IQ Asbestos/Lead Air Monitoring (2010) Jul-13 $7.52
T61607/07 Security:Perimeter Hardening: RCC, PCC & 130 Livingston Jul-13 $12.00
T50806/08 Communication Equipment: Police:PRS: TDI & Coverage (Pilot) Jul-13 $10.00
T60806/03 Communication Equipment: Police:PRS:Time Domain Interference Solution Jul-13 $10.15
T60412/24 Station Component Investments:Station Painting at Component Locations, Phase 1 Aug-13 $9.49
T50414/03 Intermodal/Transfer Facilities:Myrtle-Wyckoff Intermdl Facl -Signal Wrk Aug-13 $0.68
S60701/02 SIR: Structures:Lemon Creek Culvert Bridge Aug-13 $8.14
T61004/06 Car Maintenance Shops:Power Centers 2&3: CI OH Shop Aug-13 $8.13
T61204/03 Radio & Data Communication:Bus Radio System Interim Upgrade Aug-13 $0.56
S60701/01 SIR: Passenger Stations:Station Structural Repairs, 8 Locations Sep-13 $14.97
T61607/03 Maintenance Of Way:RTO Master Tower Hardening Sep-13 $4.60
T61607/06 Facilities: Distribution:Maspeth Warehouse Repairs Sep-13 $9.57
T51302/03 Work Train & Special Equipment:2 Ballast Regulators Sep-13 $7.74
T60412/61 Station Component Investments:Station Components: 5 Stations / Brighton Oct-13 $9.93
T60413/01 Station Accessibility (ADA):ADA: Forest Hills - 71 Av / Queens Blvd Oct-13 $24.70
T60413/09 Station Accessibility (ADA):ADA: Hunts Point Av / Pelham Oct-13 $30.91
T50902/12 Misc: Power:Substation Hatchways: 6 Locations CONSTRUCTION ONLY Oct-13 $6.10
T60803/01 Signal Systems:AC to DC Line Relay Conversion / Fulton PILOT Nov-13 $10.00
T61004/20 Yard Switches:Yard Switches - 2013 Dec-13 $5.22
T61004/14 Yard Track Rehabilitation:Yard Track - 2013 Dec-13 $3.29
T60502/10 Mainline Track Rehabilitation:Mainline Track Replacement - 2013 Dec-13 $196.14
T60502/11 Mainline Track Rehabilitation:Track Force Account - 2013 Dec-13 $35.00
T60503/04 Mainline Track Switches:29 Mainline Switches - 2013 Dec-13 $48.89
T60502/12 Welded Rail:Continuous Welded Rail - 2013 Dec-13 $5.96
T60302/07 New Buses:99 Express Buses Dec-13 $73.00
T60302/12 New Buses:100 Articulated Buses Dec-13 $91.33
T60302/15 New Buses:156 Articulated Buses Dec-13 $165.76
T60703/04 Elevated Structure Rehabilitation:Viaduct Structure Rehab: Rockaway & Far Rockaway Dec-13 $42.09
T60412/67 Station Component Investments:149 Street-Grand Concourse / Jerome Dec-13 $7.17
T60412/68 Station Component Investments:Stn Components: 149 Street-Grand Concourse / WPR Dec-13 $9.63
T60703/07 Line Structure Overcoating:Rockaway Boulevard - Hammels Wye / Rockaway Dec-13 $4.48
T50302/21 New Buses:60 Express Buses Dec-13 $38.26
T51204/05 Misc: Bus Projects:Real Time Customer Information, Phase 1 Dec-13 $30.69
T41204/P2 Depot Rehabilitation:Paving: 3 Locations Dec-13 $3.13
T60404/01 Fare Control Modernization:MVM Electronics Replacement Phase 1 Jan-14 $10.00
T60412/25 Station Renewal:Central Avenue / Myrtle Jan-14 $13.40
T60412/26 Station Renewal:Seneca Avenue / Myrtle Jan-14 $8.06
T60412/28 Station Renewal:Knickerbocker Avenue / Myrtle Jan-14 $12.24
T60412/27 Station Renewal:Forest Avenue / Myrtle Jan-14 $7.92

MTA NYCT2012 ‐ 2015 Completions $ in millions
ACEP Project Description CompletionsProject Allocations
T60412/29 Station Renewal:Fresh Pond Road / Myrtle Jan-14 $8.22
T60413/12 Station Accessibility (ADA):ADA: Ozone Park-Lefferts Blvd / Liberty Jan-14 $35.84
T60413/08 Station Accessibility (ADA):ADA: Utica Av / Fulton Line Feb-14 $16.95
T60904/06 Power Distribution Facilities:CBH 146 Prospect Park / Brighton Feb-14 $7.10
T60404/02 Purchase Automated Farecard Access System (AFAS) Units Feb-14 $2.31
T61204/06 Bus Washers:3 Bus Washers at Manhattanville Depot Mar-14 $0.26
T61606/05 Fire Protection:Sprinkler & Alarm Systems: Phase 1 - 5 Locations Mar-14 $20.01
T50803/07 Signal Systems:Signal Key-By Circuit Mod: Phase 2 Mar-14 $26.76
T60902/03 Misc: Power:Substation Hatchways: 8 Locs Mar-14 $10.63
T60803/01 Maintenance Of Way:Signal Control Modifications Phase 4 Mar-14 $15.48
T60412/32 Station Renewal:Ozone Park-Lefferts Boulevard / Liberty Apr-14 $8.20
T60412/33 Station Renewal:111 Street / Liberty Apr-14 $18.83
T60412/34 Station Renewal:Rockaway Boulevard / Liberty Apr-14 $19.31
T60412/31 Station Renewal:104 Street / Liberty Apr-14 $19.69
T60412/35 Station Renewal:88 Street / Liberty Apr-14 $19.30
T60412/36 Station Renewal:80 Street / Liberty Apr-14 $18.98
T60703/14 Line Structure Overcoating:Bway Junction - Cypress Hills / Jamaica Apr-14 $26.68
T60302/18 Fare Control Modernization:Replace Integrated Farebox Unit (IFU) Components, Phase 2 Apr-14 $21.94
T60803/07 Rapid Transit Operations:Station Time (ST) Improvements, Ph 2 / LEX May-14 $29.67
T51302/05 Work Train & Special Equipment:19 Diesel Locomotives May-14 $72.37
T41302/P4 Work Train & Special Equipment:Purchase 9 Diesel-Electric Locomotives May-14 $31.04
T60413/06 Station Accessibility (ADA):ADA: Kingsbridge Rd / Concourse May-14 $32.03
T61204/06 Bus Washers:7 Bus Washers KB, GH, CS Jun-14 $22.26
T60302/09 New Buses:425 Standard Buses Jun-14 $321.48
T60302/16 New Buses:71 Standard Buses Jun-14 $55.85
T60302/22 New Buses:104 Standard Buses Jun-14 $72.93
T60302/10 New Buses:89 Express Buses Jun-14 $65.76
T60302/14 New Buses:97 Express Buses Jun-14 $74.53
T60412/24 Station Component Investments:Station Painting at Component Locations, Phase 2 Jun-14 $15.00
T61605/02 Capital Program Management:Boring Services: Manhattan & Bronx Jun-14 $1.85
T61605/01 Capital Program Management:Boring Services: Bklyn, Qns, SI Jun-14 $1.54
T61605/03 Capital Program Management:Test Pits Contract Jun-14 $2.60
T60413/13 Station Accessibility (ADA):Dyckman Street / Broardway-7th Avenue Jul-14 $0.90
T61607/16 Depot Rehabilitation:8 AFC (Keene) Employee Office Upgrades @ 5 Depots Aug-14 $3.00
T60803/03 Signal Systems:Church Ave Interlocking & Automatics / Culver Aug-14 $210.61
T60703 Subway Tunnel Rehabilitation:122 St &135 St Portal Repairs / Broadway-7th Avenue Aug-14 $0.79
T61606/06 Fire Protection:Fire Alarm: 207 Street Overhaul Shop Aug-14 $11.00
T51602/04 Owner-Controlled Insurance Program:2006-2009 Owner-Controlled Insurance Aug-14 $132.35
T60806/01 Communications Cable And Equipment:Fiber Optic Cable Replacement: Phase 1 Sep-14 $15.00
T60407/04 Elevator Replacement:Replace 11 Hydraulic Elevators Oct-14 $49.91
T60407/03 Escalator Replacement:2 Escalators Roosevelt Av / QBL Oct-14 $15.48
T60412/22Station Component Investments:Brick Arch Repair: 168 Street & 181 Street / Broadway-7th Av Oct-14 $40.10
T60703/11 Water Conditions Remedy:Alleviate Flooding At 6 Locs: Manhattan Oct-14 $48.69
T61606/05 Fire Protection:Sprinkler & Alarm Systems: Phase 2 Nov-14 $10.00
T61004/04 Car Maintenance Shops:207 St Maintenance Shop: DC Power Upgrade Nov-14 $19.70
T60703/13 Line Structure Rehabilitation:Structure Repairs / Dyre Avenue Line Nov-14 $10.00
S60701/03 SIR: Track:St. George Interlocking - Phase 1 Nov-14 $15.00

MTA NYCT2012 ‐ 2015 Completions $ in millions
ACEP Project Description CompletionsProject Allocations
T60703/15 Line Structure Overcoating:Dyckman Street - 215 Street / Broadway-7th Avenue Nov-14 $18.89
T60806/04 Public Address/Customer Info Systems:PA/CIS: 43 Stations: Install Cable Nov-14 $55.56
T61004/21 Yard Switches:Yard Switches - 2014 Dec-14 $5.46
T60502/16 Welded Rail:Continuous Welded Rail - 2014 Dec-14 $1.86
T60502/13 Mainline Track Rehabilitation:Mainline Track Replacement - 2014 Dec-14 $205.41
T60502/14 Mainline Track Rehabilitation:Track Force Account - 2014 Dec-14 $35.00
T61004/15 Yard Track Rehabilitation:Yard Track - 2014 Dec-14 $3.45
T60503/05 Mainline Track Switches:29 Mainline Switches - 2014 Dec-14 $51.20
T60904/04 Power Distribution Facilities:CBH 74 Havermeyer & 74A Bridge / Jamaica Dec-14 $24.24
T60803/08 Maintenance Of Way:Stop Cable Repl Ph4: Various Locations Dec-14 $22.80
T60414/02 Station Rehabilitation:Station Entrance Railings Dec-14 $4.02
T41204/HU New Depots & Facilities:AVL: 126 St Depot - Pilot 2 Dec-14 $7.97
T60412/60 Station Component Investments:Station Components: 6 Stations / Jamaica Dec-14 $24.66
T61607/10 Consolidated Employee Facilities:Subways:West 4 Street / 6th Avenue Dec-14 $4.13
T61607/15 Consolidated Employee Facilities:Subways:9 Locations / Crosstown Dec-14 $7.51
T60703/02 Line Structure Rehabilitation:Rehab Emergency Exits: 75 Locs Dec-14 $18.00
T61607/09 Roofing Repair & Replacement:DOS Roof Replacement Phase 3 Jan-15 $13.68
T61204/16 Bus Washers:8 Bus Washers Jan-15 $19.40
T61605/13 Capital Program Management:Boring Services: Manhattan & Bronx Jan-15 $2.03
T60904/08 Power Distribution Facilities:Negative Cables: 4th Avenue - Phase 2 Jan-15 $5.00
T61605/14 Capital Program Management:Boring Services: Bklyn, Qns & SI Jan-15 $1.69
T60803/02 Maintenance Of Way:Messenger Cable Brackets / Brighton Jan-15 $1.47
T60414/07 Station Signage:Station Signage Jan-15 $4.83
T60703/20 Elevated Structure Rehabilitation:Trackway Stabilization / Franklin Shuttle Jan-15 $29.53
T50904/14 Misc: Power:Cathodic Protection Manhole Relocation at Queensbridge Park Jan-15 $3.50
T60803/22 Subway Tunnel Rehabilitation:Duct Reconstruction: Steinway Tube / Flushing Jan-15 $32.23
T60803/22 Maintenance Of Way:Duct Rehabilitation & Negative Cable: Steinway Tube/Flushing Jan-15 $46.46
T61204/08 Misc: Bus Projects:Paint Application System: Fresh Pond & Zerega Jan-15 $1.70
T40404/M6 Fare Control Modernization:AFC System Wrap-Up Feb-15 $8.10
T61204/10 Depot Equipment And Machinery:HVAC Upgrades - 4 Depots (Locker Rooms) Mar-15 $15.27
T61604/03 Computer Hardware & Communications:Enterprise Securty Network Infrastructure Mar-15 $10.39
T61607/05 Consolidated Employee Facilities:Subways:RTO Fac: Chambers St / Nassau Loop Mar-15 $7.07
T51605/21 Materiel:Concrete Batch Plant Inspection Mar-15 $1.21
T51605/24 Capital Program Management:Concrete Cylinder Testing Mar-15 $0.72
T60413/04 Station Accessibility (ADA):ADA: Platform Gap Retrofit Phase 1 - 14 Stations Apr-15 $5.51
T61204/01 Misc: Bus Projects:Paint Booth Air Systems 6 Loc Apr-15 $10.00
T61607/17 Facilities:Livingston Plaza: Elevators, Roof, Facade Apr-15 $23.56
T60806/09 Station Communication Rooms:Comm Room HVAC Ph 2: 7 Stations / Brooklyn Apr-15 $20.00
T61004/09 Yard Lighting:Yard Lighting: (Jerome, Pelham) Apr-15 $15.07
T60407/05 Elevator Replacement:10 Hydraulic Elevators May-15 $61.13
T60413/04 Station Accessibility (ADA):ADA: Platform Gap Retrofit Phase 2 - 14 Stations May-15 $5.86
T60806/02 Communications Cable And Equipment:Application Cutover to SONET Phase 1 May-15 $7.50
T50902/17 Substation Equipment (IND):Repl DC Feeder Systems At 4 IND Substns May-15 $0.39
T61203/02 Depot Rehabilitation:In-House Mini-Rehabs At 3 Locations Jun-15 $27.80
T61204/21 Misc: Bus Projects:New DOB Facility At St George Terminal Jun-15 $4.20
T61606/08 Groundwater And Soil Remediation:Consult: UST & Remed (2011) Jun-15 $6.00
T61606/07 Groundwater And Soil Remediation:Groundwater & Soil Remed - 2011 Jun-15 $6.50
T60806/19 Station Communication Rooms:Communication Room Waterproofing Jun-15 $16.00

MTA NYCT2012 ‐ 2015 Completions $ in millions
ACEP Project Description CompletionsProject Allocations
T60414/04 Misc: Stations:Scrubber Room Drainage - 4 Locations Jun-15 $4.52
T60703/09 Line Structure Overcoating:Portal - East 180 Street / White Plains Jul-15 $37.56
T60413/11 Station Accessibility (ADA):ADA Phase 2: 57 Street - 7 Avenue / Broadway Jul-15 $38.77
T50803/23 Communication-Based Train Control:CBTC Test Track Pilot/ Culver Line Jul-15 $16.01
T60413/10 Station Accessibility (ADA):ADA: 23 Street / Lexington Jul-15 $30.18
T60803/11 Communication-Based Train Control:CBTC Test Track, Phase 2 / Culver Jul-15 $84.90
T61602/01 Capital Revolving Fund:Capital Revolving Fund - 2010 Aug-15 $5.00
T60414/05 Misc: Stations:Access Improvements: Grand Central / LEX Aug-15 $20.43
T60603/03 Ventilation Facilities:Vent Plant: Mulry Square / 8AV & BW7 Aug-15 $118.96
T61302/01 Rubber-Tired Vehicles:Purchase 110 Non-Revenue Vehicles - 2011 Aug-15 $13.20
T61302/05 Rubber-Tired Vehicles:Purchase 118 Non-Rev Vehicles: 2012-13 Orders Sep-15 $13.94
T61606/01 Asbestos Abatement:Asbestos Abatement: Priority 7 Sep-15 $5.00
T50806/15 Public Address/Customer Info Systems:PA/CIS: 44 Stns: Furn & Install Cabinets Sep-15 $9.76
T60806/04 Public Address/Customer Info Systems:PA/CIS: 43 Stns: Furnish-Install Cabinets Sep-15 $10.40
T61204/20 Misc: Bus Projects:Jamaica Bus Terminal Reconfiguration Oct-15 $3.40
T60703/19 Line Structure Overcoating:Broadway Junction - New Lots Avenue / CNR Nov-15 $25.73
T61004/16 Yard Track Rehabilitation:Yard Track - 2015 Dec-15 $0.06
T61004/22 Yard Switches:Yard Switches - 2015 Dec-15 $0.65
T60502/15 Mainline Track Rehabilitation:Mainline Track Replacement - 2015 Dec-15 $2.00
T60503/06 Mainline Track Switches:Mainline Switch Replacement 2015 Dec-15 $2.90
T60806/02 Communications Cable And Equipment:Application Cutover to SONET Phase 2 Dec-15 $15.00
T60412/09 Station Renewal:Zerega Avenue / Pelham Dec-15 $21.97
T60412/07 Station Renewal:Buhre Avenue / Pelham Dec-15 $23.58
T60412/10 Station Renewal:Castle Hill Avenue / Pelham Dec-15 $22.49
T60412/08 Station Renewal:Middletown Road / Pelham Dec-15 $21.62
T60806/13 Antenna Cable Replacement:Antenna Cable Upgrade/Replacement Ph 1 Dec-15 $16.42
T60806/03 Communication Equipment: Police:Police Radio Wrap-Up Dec-15 $17.87
T61607/04 Consolidated Employee Facilities:Subways:Employee Facility: Jay St / Fulton Dec-15 $12.32
T60412/06 Station Component Investments:Pelham Bay Park / Pelham Dec-15 $10.16

MTA Long Island Rail Road2012 ‐ 2015 Completions $ in millions
ACEP Project Description CompletionsProject
AllocationsL50101M3 M-9 SPECIFICATION DEVELOPMENT Feb-12 $2.75L50206VB PENN STA - THIRD RAIL & SIGNAL Apr-12 $9.23L50206VJ STATION MASTERS OFFICE DESIGN Aug-12 $1.26L50501S7 FIBER OPTIC NETWORK May-12 $70.12L506016Y Life Cycle Maintenance Shop Mar-12 $46.48L50699YY BABYLON TRAIN WASH Jun-12 $24.40L50701PH Rockville Centre Substation May-12 $56.92L60301TC 2012 ANNUAL TRACK PROGRAM Dec-12 $51.80L60701AE THIRD RAIL SYSTEM-2000 MCM CABLE May-12 $2.50L302092L MOYNIHAN STATION STUDY (ESDC) Jan-13 $2.00L404024Y EAST RIVER TUNNEL VENTILATION Jan-13 $89.75L30209EC LITTLE NECK STATION PLATFORM IMPROVEMENTS Feb-13 $1.30L50401BA GREAT NECK IMPROVEMENTS - DESIGN Mar-13 $2.88L50206VC PENN STA - EMP FAC YARDS /BLDG/ESCALATOR Mar-13 $2.18L60601YA SHOP RECONFIG & RCM INFRASTRUCTURE Mar-13 $10.40L5020428 FOREST HILL STATION-RAMP Mar-13 $2.00L50501S6 Improved Radio Coverage Infrastructure Apr-13 $15.29L40703C1 F CIRCUIT BREAKER HOUSE - "F" TOWER Apr-13 $7.15N40905FT LOCUST MANOR STATION IMPROVEMENTS Apr-13 $0.65L60301TH MERRICK/BELLMORE DIRECT FIXATION Apr-13 $34.00L60402BP EAST RIVER TUNNEL FIRE & LIFE SAFETY Jun-13 $16.60L50601Y3 JAMAICA STATION BUILDING REHAB Jun-13 $9.00L509048K MORRIS PARK ENVIRONMENTAL STUDY Jul-13 $8.59L502042D NEW ELEVATORS-QUEENS VILLAGE STATION Aug-13 $8.45L50401B8 QUEENS BLVD BRIDGE REHABILITATION Aug-13 $23.09L60401BE CONSTRUCT 3 MONTAUK BRANCH BRIDGES Aug-13 $22.39L60601YB HILLSIDE FACILITY ROOF RENEWAL Aug-13 $6.00L509048D RICHMOND HILL YARD ENVIRON REMEDIATION Sep-13 $0.99L509048C LIC YARD ENVIRON REMEDIATION Oct-13 $1.23L60301TD 2013 ANNUAL TRACK PROGRAM Dec-13 $59.50L60401BH WOODHAVEN BLVD. BRIDGE Jan-14 $11.00L50101M4 PROTECT & WORK LOCO SPEC DEVELOPMENT Jan-14 $2.80L60301TF CONSTRUCTION EQUIPMENT Mar-14 $4.92L60601YC HILLSIDE MAINTENANCE FACILITY Mar-14 $2.81L60701AF THIRD RAIL SYSTEM-DISCONNECT SWITCHES Apr-14 $1.00L5020427 NEW ATLANTIC TERMINAL ELEVATOR May-14 $3.40L60701AN THIRD RAIL FEEDER CABLE UPGRADE May-14 $2.50L60701AL POWER POLE REPLACEMENT Jun-14 $3.00L509048B YAPHANK LANDFILL ENVIRON REMEDIATION Jul-14 $2.20L60701AH Composite Third Rail Dec-14 $10.90L60701AK SIGNAL POWER LINE REPLACEMENT Dec-14 $2.81L60301TE 2014 ANNUAL TRACK PROGRAM Dec-14 $57.10L509048A ELECTRIC SUBSTATIONS ENVIRON REMEDIATION Jan-15 $10.23L60401BD 150TH STREET - JAMAICA & BROADWAY /PT WASH Jan-15 $29.70L60501L3 COMMUNICATION POLE/COPPER PLANT REPLACEMENT Jan-15 $7.00L50601Y1 PT. WASHINGTON YARD RECONFIGURATION - DESIGN Jan-15 $2.00L60604YT EMPLOYEE FACILITIES RENEWAL Jan-15 $10.00L60701AC SIGNAL POWER MOTOR GENERATOR REPLACEMENT Feb-15 $2.00L60701AD SUBSTATION PILOT WIRE & RELAY REPLACEMENT Feb-15 $2.00L60301TJ ROW-CULVERTS Apr-15 $2.50L60301TK ROW-DRAINAGE CONTROL Apr-15 $3.50L60301TN ROW-TRACK STABILITY /RETAINING WALLS Apr-15 $1.10L50701AB SUBSTATION BATTERY REPLACEMENT May-15 $0.80

MTA Long Island Rail Road2012 ‐ 2015 Completions $ in millions
ACEP Project Description CompletionsProject
AllocationsL60701AP NEGATIVE REACTOR UPGRADE May-15 $4.00L60304TX SECOND TRACK FARMINGDALE TO RONKONKOMA DESIGN May-15 $30.00L60701AG THIRD RAIL SYSTEM - PROTECTION BOARD Jun-15 $9.20L60301TL ROW-FENCING Jun-15 $8.00L60304TW GREAT NECK POCKET TRACK EXTENSION Jun-15 $26.10L50402VA EAST RIVER TUNNEL FIRE & LIFE SAFETY Jun-15 $116.30L502042E NEW ELEVATORS-FLUSHING MAIN STREET Jul-15 $8.45L60204UB MASSAPEQUA STATION PLATFORM REPLACEMENT Aug-15 $20.30L60301TF CONSTRUCTION EQUIPMENT Oct-15 $7.00L50502SM PTC DESIGN Dec-15 $9.50

MTA Metro-North Railroad 2012-2015 Completions $ in millions
Project ID Project Description CompletionProject
AllocationM5020303 Cortlandt Pkg. & Access Improvements Feb-12 $34.76M5020110 GCT Trainshed Block Restoration Feb-12 $2.50M5020207 Station & Platform Info Signs Feb-12 $1.00M5010111 West of Hudson Locomotives -4 Mar-12 $8.60M5050108 Harlem And Hudson Lines Power Improvements Mar-12 $8.96M5050102 Tagging Relays - Harlem & Hudson Lines Mar-12 $12.68M5029901 Tarrytown Station Improvement May-12 $36.51M4040107 Optimize Signal Relay Circuits May-12 $2.61M6030111 2011 Cyclical Track Program Jun-12 $13.00M5020102 GCT Leaks Remediation Oct-12 $2.40M5020202 Croton Harmon/Peekskill Improvements Oct-12 $15.45M5040111 C&S Cable Repl GCT-Mott Haven Dec-12 $4.20M5010107 M8 Cars; 120 Cars Acceptance (05-09 /10-14 Programs) Dec-12 $57.60M6010102 M8 Cars; 120 Cars Acceptance (05-09 /10-14 Programs) Dec-12 $47.92M6040113 Rolling Stock Radios and PA Equipment Dec-12 $0.25M6040116 Radio Frequency Rebanding Dec-12 $3.68M5020108 GCT Water Conveyance Utilities Dec-12 $3.53M5020211 System-Wide Vending Machines Dec-12 $0.57M6040105 Crossing Upgrades - Phase 2 Dec-12 $1.00M504-01-07 Signal System Replacement Jan-13 $31.02M508-01-12 WHRTAS Phase II Study Feb-13 $4.01M604-01-14 Radio Base Station Replacement Feb-13 $0.75M603-01-12 2012 Cyclical Track Program Apr-13 $13.00M603-03-03 Moodna/Woodbury Viaduct Apr-13 $10.00M503-02-01 Replace/Repair Undergrade Bridges Jun-13 $26.39M604-01-11 PBX Equipment Upgrade Apr-13 $2.93M603-01-09 Rebuild Retaining Walls Aug-13 $5.00M502-02-06 Station Building Rehabilitation Oct-13 $11.31M603-03-04 Otisville Tunnel Renewal Oct-13 $3.00M603-02-14 Park Avenue Viaduct Direct Fixation Nov-13 $1.80M604-01-04 Replace Field code System - Mott Haven Nov-13 $1.76M402-01-10 GCT Biltmore Rm Connection-Design Dec-13 $1.40M307-01-06 Penn Station Access Dec-13 $6.62M502-02-09 Bronx Stations/Capacity Improvements Dec-13 $13.48M508-01-09 Customer and Employee Communications Projects Dec-13 $8.96M602-02-02 Fordham Station Improvements Dec-13 $13.00M603-01-08 Drainage and Undercutting Program Dec-13 $10.00M603-02-13 Catenary Painting/Rehabilitate Catenary Structures Dec-13 $4.00M604-01-03 Replace Fiber/Communication & Signals Cables Dec-13 $8.79M604-01-06 Centralized Train Control/SCADA Intrusion Testing Jan-14 $0.73M605-01-01 Substation Bridge 23 - Construction Mar-14 $32.81M603-01-13 2013 Cyclical Track Program Apr-14 $13.60M604-01-12 Mobile/Portable Radios Apr-14 $0.18M601-01-02 M-8 New Haven Line Purchase(Balance 2013-2014) May-14 $197.85M602-01-02 Park Avenue Tunnel Renewal May-14 $7.50M602-02-06 New Haven Line Station Phase II May-14 $34.85M503-02-06 Overhead Bridge Program-East of Hudson (MNR Share) Sep-14 $6.00M603-02-11 Harlem River Lift Bridge Cable Sep-14 $10.50M605-01-07 Harlem River Lift Bridge Breaker Houses/Controls Sep-14 $13.60M606-01-04 Port Jervis Yard Expansion Nov-14 $7.30M502-02-10 Smart Cards Dec-14 $2.78M602-01-07 GCT Platform Improvements Dec-14 $3.10M602-01-09 GCT Customer Communications Dec-14 $2.04
MNR 10‐14 Completions Page 12 of 17

MTA Metro-North Railroad 2012-2015 Completions $ in millions
Project ID Project Description CompletionProject
AllocationM602-02-07 Smart Card Improvements Dec-14 $9.08M603-01-06 Cyclical Repl. Insulated Joint Dec-14 $2.50M603-02-05 Bridge Walkways Installation Dec-14 $1.87M603-02-09 Employee Welfare and Storage Facility Dec-14 $10.00M603-02-12 Overhead Bridge Program - E of H Dec-14 $17.10M603-03-01 West of Hudson Track Program Dec-14 $21.18M603-03-02 West of Hudson Improvements Dec-14 $3.79M604-01-08 Design/Replace Harlem and Hudson Track Relays Dec-14 $1.21M605-01-05 Replace Substation Batteries Dec-14 $1.00M605-01-08 Replace 3rd Rail Sectionalizing Switches Dec-14 $1.26M605-01-09 Replace 3rd Rail Brackets - Park Avenue Tunnel Dec-14 $5.60M608-01-06 Program Administration Dec-14 $42.22M608-01-07 Program Scope Development Dec-14 $11.77M505-01-11 Renewal Harlem & Hudson Substations - Construction Jan-15 $11.10M605-01-02 Renewal Harlem & Hudson Substations - Construction Jan-15 $8.00M605-01-03 Harlem & Hudson Lines Power Improvements Jan-15 $35.74M602-02-01 Poughkeepsie Station Building Feb-15 $6.00M602-03-01 Parking Renewal Mar-15 $2.50M402-03-13 North White Plains Parking - EIS/EA/Prelim Design Apr-15 $6.30M603-01-14 2014 Cyclical Track Program Apr-15 $14.28M603-02-03 Right of Way Fencing Apr-15 $0.75M603-01-03 GCT Turnouts/Switch Renewal May-15 $13.63M603-02-02 Rehab Culverts/Railtop Culvert May-15 $3.63M603-03-05 West of Hudson Replace/Renew Undergrade Bridges May-15 $11.91M603-02-10 Replace/Repair Undergrade Bridges Program Jun-15 $36.50M602-03-02 Strategic Facilities Jun-15 $45.50M608-01-03 Railroad Protective Liability Jun-15 $4.15M608-01-04 Independent Engineer Jun-15 $6.73M602-01-04 GCT Trainshed Track Structure Jul-15 $3.00M603-01-05 M o f W Equipment/RS Jul-15 $6.30M602-01-08 GCT Utilities Aug-15 $27.39M608-01-01 Systemwide Lead/Asbestos Abatement Aug-15 $5.00M608-01-02 Environmental Remediation Aug-15 $2.00M602-02-03 Harlem Line Station Renewal Sep-15 $26.78M602-02-04 Station Building Rehabilitation/Net Lease Sep-15 $4.95M606-01-02 Wassaic Yard Expansion-D/C Sep-15 $3.00M601-01-03 Shuttle/Switcher Locomotives Oct-15 $13.10M501-01-12 Rolling Stock Signals (PTC) Dec-15 $5.32M504-01-18 Positive Train Control (PTC) Dec-15 $9.87M508-01-14 PTC Scope Development Dec-15 $4.00M604-01-01 Positive Train Control Dec-15 $187.08M503-02-18 Systemwide Flood Control Dec-15 $3.17M603-01-04 Turnouts - Yards/Sidings Dec-15 $4.41M603-02-01 Replace Timbers Undergrade Bridges Dec-15 $3.68M603-02-04 DC Substation/Signal House Dec-15 $1.75M603-02-06 Remove Obsolete Facilities Dec-15 $3.00M604-01-02 West of Hudson Signal Improvements Dec-15 $67.60M604-01-07 Refurbish/Replace Electrical Switch Machine Dec-15 $0.50M604-01-09 Replace High Cycle Relays Dec-15 $0.63M605-01-04 Replace Motors Alternators Dec-15 $8.00M606-01-03 Other Shops/Yards Renewal Dec-15 $24.10
MNR 10‐14 Completions Page 13 of 17

MTA Bridges and Tunnels2012-2015 Completions $ in millions
Project ID Project DescriptionComple
tion Project AllocationD503AW48 2nd Generation E-Zpass In-Lane Feb-12 $5.11D502VN84 Widening of Belt Parkway Ramps Feb-12 $4.33D501TN87 Anchorage and Tower Protection Sep-12 $11.81D503VN03 Toll Plaza Improvements: Removal of Toll Booths and Utility Relocation Mar-12 $13.80D607TN87 Paint - Bronx and Queens Tower Fender Systems May-12 $8.31D503AW37 Operation Centers TS Systems Sep-12 $3.28D602TN49 Suspended Span Replacement - Phase A Sep-12 $96.80D502BW89 Elevated & On Grade (Bx) Appr. Oct-12 $212.27D607VN88 Tower Painting - Below Roadway Level Oct-12 $30.36D501BW97 Concrete Anchorage Repairs Dec-12 $9.24D502VN80 Rehab Decks on Suspended Spans Dec-12 $52.82D601CB09 Substructure & Underwater Work Feb-13 $20.11D402BB28 Rehab Tunnel Walls Rdway & Drainage Mar-13 $76.68D501TN85 Suspended Span Cable Rewrap Jul-13 $40.43D607TN85 Steel Repairs - Suspended Span Jul-13 $6.24D506AW28 Scope Development Aug-13 $5.53D602HH10 Upper Level Sidewalk / Curb Stringers Sep-13 $42.00D607HH10 Paint - Curb Stringers Sep-13 $0.81
D604BW15 Installation of New Necklace Lighting System and Acoustic Monitoring System Dec-13 $10.67D601HH07 Structural Rehabilitation - Phase I Dec-13 $8.58D602TN82 Rehabilitate Orthotropic Deck - Phase B Jan-14 $25.37D607TN82 Paint - Bronx and Queens Approach Spans Jan-14 $46.24D503HH85 Upper Level Toll Plaza Deck Feb-14 $5.66D601BW07 Tower and Pier Fender Protection Mar-14 $3.12D601MP16 Miscellaneous Steel Repairs Mar-14 $2.51D602RK73 Deck Replacement- RFK MQ Ramp Sep-14 $75.96D603AW36 Installation of CCTV / Fiber Optic Cable Jun-14 $12.10D601BW97 Concrete Anchorage Repairs Jul-14 $10.75D604QM81 Controls / Communication System Aug-14 $4.31D405BB43 Rehab Battery Parking Garage Sep-14 $45.77D604BB45 Replace Electrical Switchgear & Equipment Sep-14 $56.74D601HH89 Skewbacks Retrofit Oct-14 $5.73D601MP06 Substructure & Underwater Scour Protection Oct-14 $17.10D607AW95 Miscellaneous Agency Wide Painting Dec-14 $6.33D601BW84 Cable Investigation / Monitoring Dec-14 $9.24D601VN35 Steel Repair & Concrete Rehab. & Drainage Systems Dec-14 $19.09D607VN35 Paint - Brooklyn&Staten Island Lower Level Ramps Dec-14 $19.61D602BW89 Deck Replacement - Elevated and On Grade Approach Jan-15 $166.06D601TN60 Anchorage Dehumidification Apr-15 $3.30D601TN52 Miscellaneous Structural Rehabilitation Jun-15 $22.04D505QM01 Service & FE Building Rehab Jun-15 $13.32D602VN03 Toll Plaza Improvements: Eastbound Ramps and Mainline Rehabilitation Jul-15 $73.58D604VN87 Substation #1 Rehabilitation Sep-15 $16.63D603AW54 Regional Integration Nov-15 $3.12D602MP21 Rehabilitate Rockaway Point Blvd Overpass Nov-15 $7.61D607MP21 Paint - Rockaway Point Overpass Nov-15 $1.09D603AW35 Weather Information Systems Dec-15 $1.24D603AW50 Wireless Communications Dec-15 $2.40D604AW80 Advanced Traveler Infomation Systems Dec-15 $19.38D605BB21 Service Building Rehabilitation Dec-15 $4.43D605BB43 Miscellaneous Repairs at BPG Dec-15 $6.27D501BW84 Cable and Anchorage Investigation Dec-15 $8.18D602HH88 Replace Upper & Lower Level Plazas and Southbound Approach Dec-15 $49.44D601VN34 Verrazano-Narrows Bridge Main Cable Testing Dec-15 $5.36
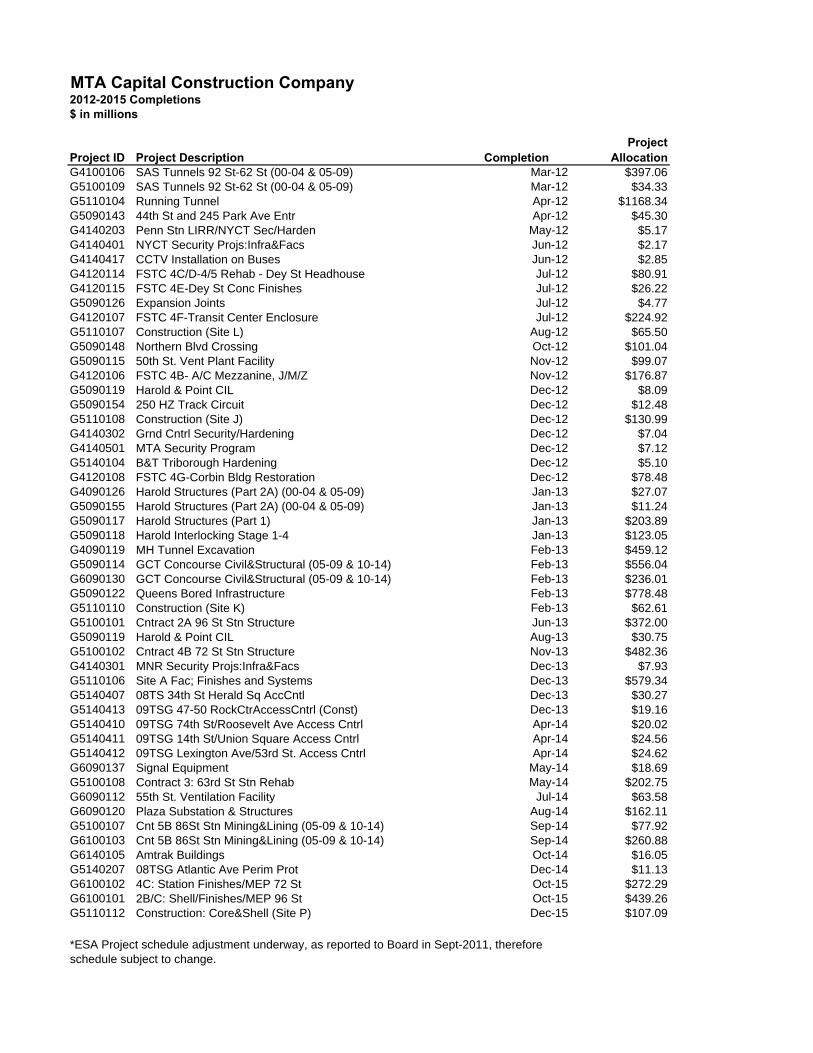
MTA Capital Construction Company2012-2015 Completions $ in millions
Project ID Project Description CompletionProject
AllocationG4100106 SAS Tunnels 92 St-62 St (00-04 & 05-09) Mar-12 $397.06G5100109 SAS Tunnels 92 St-62 St (00-04 & 05-09) Mar-12 $34.33G5110104 Running Tunnel Apr-12 $1168.34G5090143 44th St and 245 Park Ave Entr Apr-12 $45.30G4140203 Penn Stn LIRR/NYCT Sec/Harden May-12 $5.17G4140401 NYCT Security Projs:Infra&Facs Jun-12 $2.17G4140417 CCTV Installation on Buses Jun-12 $2.85G4120114 FSTC 4C/D-4/5 Rehab - Dey St Headhouse Jul-12 $80.91G4120115 FSTC 4E-Dey St Conc Finishes Jul-12 $26.22G5090126 Expansion Joints Jul-12 $4.77G4120107 FSTC 4F-Transit Center Enclosure Jul-12 $224.92G5110107 Construction (Site L) Aug-12 $65.50G5090148 Northern Blvd Crossing Oct-12 $101.04G5090115 50th St. Vent Plant Facility Nov-12 $99.07G4120106 FSTC 4B- A/C Mezzanine, J/M/Z Nov-12 $176.87G5090119 Harold & Point CIL Dec-12 $8.09G5090154 250 HZ Track Circuit Dec-12 $12.48G5110108 Construction (Site J) Dec-12 $130.99G4140302 Grnd Cntrl Security/Hardening Dec-12 $7.04G4140501 MTA Security Program Dec-12 $7.12G5140104 B&T Triborough Hardening Dec-12 $5.10G4120108 FSTC 4G-Corbin Bldg Restoration Dec-12 $78.48G4090126 Harold Structures (Part 2A) (00-04 & 05-09) Jan-13 $27.07G5090155 Harold Structures (Part 2A) (00-04 & 05-09) Jan-13 $11.24G5090117 Harold Structures (Part 1) Jan-13 $203.89G5090118 Harold Interlocking Stage 1-4 Jan-13 $123.05G4090119 MH Tunnel Excavation Feb-13 $459.12G5090114 GCT Concourse Civil&Structural (05-09 & 10-14) Feb-13 $556.04G6090130 GCT Concourse Civil&Structural (05-09 & 10-14) Feb-13 $236.01G5090122 Queens Bored Infrastructure Feb-13 $778.48G5110110 Construction (Site K) Feb-13 $62.61G5100101 Cntract 2A 96 St Stn Structure Jun-13 $372.00G5090119 Harold & Point CIL Aug-13 $30.75G5100102 Cntract 4B 72 St Stn Structure Nov-13 $482.36G4140301 MNR Security Projs:Infra&Facs Dec-13 $7.93G5110106 Site A Fac; Finishes and Systems Dec-13 $579.34G5140407 08TS 34th St Herald Sq AccCntl Dec-13 $30.27G5140413 09TSG 47-50 RockCtrAccessCntrl (Const) Dec-13 $19.16G5140410 09TSG 74th St/Roosevelt Ave Access Cntrl Apr-14 $20.02G5140411 09TSG 14th St/Union Square Access Cntrl Apr-14 $24.56G5140412 09TSG Lexington Ave/53rd St. Access Cntrl Apr-14 $24.62G6090137 Signal Equipment May-14 $18.69G5100108 Contract 3: 63rd St Stn Rehab May-14 $202.75G6090112 55th St. Ventilation Facility Jul-14 $63.58G6090120 Plaza Substation & Structures Aug-14 $162.11G5100107 Cnt 5B 86St Stn Mining&Lining (05-09 & 10-14) Sep-14 $77.92G6100103 Cnt 5B 86St Stn Mining&Lining (05-09 & 10-14) Sep-14 $260.88G6140105 Amtrak Buildings Oct-14 $16.05G5140207 08TSG Atlantic Ave Perim Prot Dec-14 $11.13G6100102 4C: Station Finishes/MEP 72 St Oct-15 $272.29G6100101 2B/C: Shell/Finishes/MEP 96 St Oct-15 $439.26G5110112 Construction: Core&Shell (Site P) Dec-15 $107.09
*ESA Project schedule adjustment underway, as reported to Board in Sept-2011, therefore schedule subject to change.

MTA Bus2012 ‐ 2015 Completions $ in millions
ACEP Project Description Completions Project AllocationsU5030205 Fuel Tanks and Bus Wash: Eastchester Depot Jul-12 $12.55
U5030220 New Boilers and A/C: JFK Depot Nov-12 $1.68
U5030217 Fire Protection: LaGuardia and Baisley Park Feb-13 $4.61
U5030202 College Point Storage Building Mar-13 $3.00
U5030210 Security Upgrade: College Point Depot May-13 $2.83
U5030218 Security Upgrade: Eastchester and LaGuardia May-13 $7.50
U5030209 Upgrade Parking Lot: JFK and Baisley Park May-13 $9.76
U6030205 Bus Wash: JFK and Baisley Park Sep-13 $3.30
U5030220 Chassis Wash and Oil Water Separator: JFK Dec-13 $1.50
U5030219 Service Vehicles Jan-14 $4.00
U6030215 Bus Cameras on 79 CNG Buses tbd $2.20
U5030204 Emergency Generators: 6 Depots tbd $7.73
U4030214 45 CNG Buses Jan-12 $23.69
U5030212 New Roof and Ventilation System at Baisley Park Apr-12 $8.50
U5030211 New Roof and Ventilation System at Far Rockaway May-12 $6.93
U5030213 New Roof and Ventilation System at Eastchester May-12 $3.64
U5030204 Power Upgrade at JFK May-12 $1.61
U4030299 Replace Depot AFC computer systems May-12 $1.08
U5030203 New Roof and Ventilation System at LaGuardia Jun-12 $7.01
U5030204 Power Upgrade at Baisley Park Jun-12 $1.72
U5030217 Fire Protection at JFK Jun-12 $4.02
U5030220 Replace Chassis Wash at Spring Creek Jul-12 $0.84
U5030220 Replace Chassis Wash at College Point Jul-12 $0.72
U5030215 New Bus Wash at LaGuardia Jul-12 $2.39
U4030213 Bus Cameras on 45 CNG Buses Jul-12 $1.39
U5030209 Upgrade Parking Lot: JFK and Baisley Park Sep-12 $9.76
U5030220 Replace Steel Doors: Spring Creek and College Point Sep-12 $1.01
U6030215 79 CNG Buses Oct-12 $40.25
U5030217 Fire Protection: LaGuardia and Baisley Park Nov-12 $4.61
U5030220 New Boiler and A/C at JFK Nov-12 $1.68
U5030214 New Roof and Ventilation Systsem at JFK Dec-12 $9.54

MTA Police Department2012-2015 Completions $ in millions
Project ID Project Description Completion Project AllocationN5100104 K-9 Facility Dec-13 $9.65

OPERATING IMPACTS EXCEEDING $1 MILLION FOR CAPITAL PROJECTS REACHING BENEFICIAL USE 2012-2015
NEW YORK CITY TRANSIT CAPITAL PROJECTS Project: Mother Clara Hale Depot Reconstruction This is a reconstruction of a bus depot to create a modern facility and increase vehicle handling capacity. The new multi-story depot will replace a single-story structure dating from the 1890’s. Impacts began in 2011 ($1.5 million), with full impacts in late 2013 ($2.7 million). Project: Enterprise Security Network Infrastructure This will install unified threat management network security hardware at all the nodes on the new IP-based enterprise data network. The security hardware will protect mission-critical applications like ATS (Automatic Train Supervision), CBTC (Computer based Train Control), PA/CIS (Public address and Customer Information System) which are planned to be migrated to new network. Full impacts will start in 2014 ($2.7 million). Project: 7 West Extension This project will extend the Flushing Line (7) southwest from 42 St & 8th Ave to a new station at 34 St & 11th Ave. The construction includes new running tunnel and associated right-of-way equipment; vent plants; and a new terminal station with elevators, escalators, HVAC, and other modern station finishes. Full impacts will start in 2014 ($12 million). Project: Fulton St Transit Center Complex This is a reconfiguration and reconstruction of an existing complex of subway stations. There is an additional underground connecting concourse extending west to the Cortland St Broadway line station, and the design for a new entry pavilion at Fulton and Broadway is still being determined. The complex is being renewed in phases. The renewed complex will be larger and have new escalators and elevators. Full impacts begin in 2014 ($6.4 million). Project: Public Address/Customer Information Screens – 156 IRT Stations Total impacts begin in 2009, reflecting 20 positions ($2.6 million). Impacts appear in two areas. The TIS area includes vendor software maintenance and resources to support the active directory of the PA/CIS application ($1.2 million). The Electronics Maintenance Division (EMD) includes $1.4 million to maintain assets associated with the enhanced public address system. Project: Charleston Depot Annex This is a new bus depot. 72 positions are added, reflecting the fixed overhead of operating a depot. Beginning in 2009, 10 of the positions include security guards, who will provide 24 x 7 coverage. Initial operating impacts begin in 2008 ($1.2 million), but full impacts have begun in 2011, totaling about $6.4 million annually.

Project: R188 Subway Car Purchase This is the base portion of the purchase of R188 subway cars. This purchase of 23 cars, in conjunction with the later option for 123 cars, is to grow the A-Division fleet in anticipation of beginning CBTC on the Flushing Line. Additional new cars to the fleet have additional maintenance, energy, and personnel costs. Total impacts are expected to begin in 2013, with an annual cost estimated to be $1.2 million. Project: Public Address/ Customer Information – 87 Stations This project will install public address speakers and visual information delivered by Customer Information Screens at 87 stations and 2 pilot stations. Impacts will begin in 2014, when the majority of the equipment would be installed or shortly thereafter. An annual total impact of $5.5 million is expected. LONG ISLAND RAIL ROAD CAPITAL PROJECTS Project: East Side Access This project will expand LIRR service into Grand Central Terminal. The construction includes new tunnel and track along with related right-of-way equipment, vent plants, substations, and a new terminal station with elevators, escalators, and HVAC. The project also includes 236 new rail cars and will introduce an expanded train service plan to support 2018 Opening Day, impacts will begin before 2018. Project: Positive Train Control This project is for the installation of a Positive Train Control (PTC) system for the LIRR. PTC is mandated by the Federal Rail Safety Improvement Act of 2008 for commuter railroads such as the LIRR with an implementation deadline of December 15, 2015. It is an integrated command, control, communication, and geographic information system designed to prevent train-to-train collisions, over-speed derailments, incursions into established work zone limits, and the movement of a train through a switch left in the wrong position. PTC is comprised of five core elements: On-Board Equipment, a Wireless Communication Network, Central Servers, a Dispatching System, and Wayside Equipment. The full operating budget impact has not been identified. However, because of the assets and equipment that will need to be operated and maintained, it is expected that PTC will have an OBI of at least $1 million a year. Partial impacts will begin in 2015 with full impacts realized starting in 2016. METRO-NORTH RAILROAD CAPITAL PROJECTS Project: M-8 New Haven Line Purchase [May 2014] This project is for the design, manufacture, test and delivery of the new New Haven Line M8 EMU Cars. The first one hundred cars will be utilized to supplement the existing fleet to fill out trains and reduce standees. The base contract for 210 cars and the first

option for 90 additional cars were awarded on August 21, 2006. Two additional options 42 and 38 cars respectively. A change order was executed for 25 Single Cars for a total of 405 cars. As of the end of December 2011, 60 Cars have been conditionally accepted and were placed into revenue service. Anticipated steady-state Operating Budget Impact of approximately $3m (NYS portion) once all 405 cars are in service. Project: Customer Communication/Connectivity Improvements [December 2014] Under this project, an updated public address system and real-time information will be provided to Metro-North customers at East of Hudson stations. Departure time and destination, status, and track number will be displayed. Connectivity will be provided at each station to support the new real-time train information/public address system, upgrade ticket office workstations, and allow capability for remote CCTV and elevator monitoring/control. Project currently in scoping phase and any potential Operating Budget Impacts are currently unknown, however they could potentially exceed $1m. Project: Positive Train Control [December 2015] Installation of a Positive Train Control (PTC) system is mandated by the Federal Rail Safety Improvement Act of 2008. Commuter railroads such as Metro-North have until December 15, 2015 to implement a PTC system. PTC is an integrated command, control, communication, and geographic information system designed to prevent train-to-train collisions, over-speed derailments, incursions into established work zone limits, and the movement of a train through a switch left in the wrong position. It is comprised of five core elements: On-Board Equipment, a Wireless Communication Network, Central Servers, a Dispatching System, and Wayside Equipment. The full operating budget impact has not been identified. However, because of the assets and equipment that will need to be operated and maintained, it is expected that PTC will have an Operating Budget Impact of at least $1 million a year. Partial impacts will begin in 2015 with full impacts realized starting in 2016. Project: West of Hudson Signal Improvements [December 2015] The purpose of this project is to install a new 100 Hz Cab Signal system replacing existing antiquated signal system for the West of Hudson Port Jervis Line between Suffern, NY (MP 31.3) and Sparrowbush, NY (MP 89.9). This system will be consistent with NORAC (Northeast Operating Rules Advisory Committee) and NJT (New Jersey Transit) operating rules. This project will extend existing cab signal system from NJT territory (south of Suffern) into MNR territory up to the division post at MP 89.9. This line consists of nine interlockings and four highway grade crossings. MNR rolling stock operated by NJT is already equipped with cab signal system due to its operation south of Suffern. PTC equipment for West of Hudson will be procured as options on New Jersey Transit PTC contract. Similarly to the Positive Train Control project (above), the West of Hudson Signal Improvements project could potentially have an annual Operating Budget Impact of greater than $1m due to the assets and equipment that will need to be operated and maintained.

MTA CAPITAL CONSTRUCTION COMPANY CAPITAL PROJECTS There are no capital projects entering beneficial use in 2012-2015 that have an impact on the MTACC’s operating budget over $1 million. MTA BUS COMPANY CAPITAL PROJECTS There are no capital projects entering beneficial use in 2012-2015 that have an impact on the MTA BUS’s operating budget over $1 million. BRIDGES AND TUNNELS CAPITAL PROJECTS Project: Anchorage and Tower Improvements at the Throgs Neck Bridge Best Value Analysis of the 2010-2014 Capital Program resulted in the incorporation of the Major Maintenance Project TNM-338, miscellaneous steel repairs to the tower bases and removal and replacement of concrete encasements, into this Capital Project. The work being capitalized is similar to the work being performed under the capital project, economies of scale are achieved by performing this work under one contract and the work complies with capital eligibility requirements. The major work of this project is structural steel work water for anchorage and tower protection. Impacts reflecting reductions to the major maintenance costs are reflected in 2010 and 2011 ($3.9 million and $2.3 million respectively). These reductions have already been incorporated into the July 2010 Financial Plan. Project: QMT Maintenance Facility Best Value Analysis of the 2010-2014 Capital Program resulted in the incorporation of the Major Maintenance Project QMM-332, Borden Avenue Environmental Remediation, into this Capital Project. The work being capitalized complies with capital eligibility requirements and is a GASB #49 reportable remediation. In addition, economies of scale are achieved by performing this work under one contract. Impacts reflecting reductions to the major maintenance costs are reflected in 2010 and 2011 ($0.1 million and $1.1 million respectively). These reductions have already been incorporated into the Financial Plan. MTA POLICE DEPARTMENT CAPITAL PROJECTS There are no capital projects entering beneficial use in 2012-2015 that have an impact on the MTAPD’s operating budget over $1 million.

VI. Agency Financial Plans and 12-Month Allocations

Bridges and Tunnels

MTA BRIDGES AND TUNNELS FEBRUARY FINANCIAL PLAN FOR 2012-2015
2011 FINAL ESTIMATE AND 2012 ADOPTED BUDGET
In accordance with MTA-approved budget procedures, the following information presents MTA Bridges and Tunnels' 2011 Final Estimate, 2012 Adopted Budget and the Financial Plan for 2012-2015. The Adopted Budget reflects the inclusion of MTA Adjustments that were presented in the November Financial Plan, which were adopted by the Board in December 2011, as well as other technical adjustments. These adjustments are presented on the attached reconciliations from the November Financial Plan and are described below:
The 3 Zeroes Salary/Wage Initiative has been fully incorporated into Bridges and
Tunnels financial plan, which produces savings of over $0.9 million annually from non-represented positions throughout the entire plan period, and 1.5 million and $2.9 million in 2014 and 2015 respectively from represented positions;
The impact of the Accelerated 3 Year-Net Zero Salary/Wage Initiative for
represented positions generates additional savings of $1.9 million in 2011, $6.7 million in 2012, $7.2 million in 2013, $5.2 million in 2014 and $3.9 million in 2015;
New MTA Efficiencies have been achieved through Bridges and Tunnels'
participation in MTA's IT Streams, Consolidations & Communications program, with subsequent cost savings totaling $0.1 million in 2011, $0.4 million in 2012, and $0.3 million annually thereafter;
Energy adjustments resulting from revised rate forecasts for heating fuel, diesel
and natural gas generate cost reductions of $0.1 million in 2011 and $0.6 million thereafter;
Effective 2012, the non-labor account structure of the MTA standard chart of
accounts has been adjusted to reflect the reclassification and renaming of certain accounts in order to improve account reporting consistency among the Agencies. These changes, which affect most non-labor accounts presented on the attached tables, result in no net-impact to the bottom line. In order to maintain comparability with 2011 actual results for year-end reporting purposes, the 2011 account structure remains unchanged.
This submission also includes schedules detailing the monthly allocation of financial, headcount, and utilization data based on the 2012 Adopted Budget for the purpose of reporting actual results on a monthly basis to the Board.

Positions Dollars Positions Dollars Positions Dollars Positions Dollars Positions Dollars
2011 November Financial Plan: Baseline Surplus/(Deficit) 1,619 $1,132.915 1,595 $1,111.095 1,595 $1,098.621 1,595 $1,075.163 1,595 $1,052.528
Technical Adjustments: $0.000 $0.000 $0.000 $0.000 $0.000
Sub-Total Technical Adjustments 0 $0.000 0 $0.000 0 $0.000 0 $0.000 0 $0.000
MTA Plan Adjustments:
Labor 3 Zeroes Salary/Wage Initiative $0.902 $0.894 $0.924 $2.469 $3.829Accelerate 3 Zeroes 1.852 6.681 7.236 5.228 3.886
New MTA Efficiencies 0.097 0.369 0.335 0.335 0.302 Energy/Other Reimbursements 0.124 0.567 0.567 0.567 0.567
Sub-Total MTA Plan Adjustments 0 $2.975 0 $8.511 0 $9.062 0 $8.599 0 $8.584
2012 February Financial Plan: Baseline Surplus/(Deficit) 1,619 1,135.891$ 1,595 1,119.607$ 1,595 1,107.683$ 1,595 1,083.762$ 1,595 1,061.112$
MTA BRIDGES & TUNNELS
2015
February Financial Plan 2012 - 2015Reconciliation to the November Plan (Accrual) Non-Reimbursable
($ in millions)
Favorable/(Unfavorable)2011 2012 2013 2014

Positions Dollars Positions Dollars Positions Dollars Positions Dollars Positions Dollars
2011 November Financial Plan: Baseline Surplus/(Deficit) 44 $0.000 44 $0.000 44 $0.000 44 $0.000 44 $0.000
Technical Adjustments:
Sub-Total Technical Adjustments 0 $0.000 0 $0.000 0 $0.000 0 $0.000 0 $0.000
MTA Plan Adjustments:
Labor: 3 Zeroes Salary/Wage Initiative - - - - - - - - - -
Accelerate 3 Zeroes - - - - - - - - - -
New MTA Efficiencies - - - - - - - - - -
Energy/Other Reimbursements - - - - - - - - - -
Sub-Total MTA Plan Adjustments 0 $0.000 0 $0.000 0 $0.000 0 $0.000 0 $0.000
Total Adjustments 0 $0.000 0 $0.000 0 $0.000 0 $0.000 0 $0.000
Total Revenue offset 0 $0.000 $0.000 $0.000 $0.000 $0.000
2012 February Financial Plan: Baseline Surplus/(Deficit)
44 $0.000 44 $0.000 44 $0.000 44 $0.000 44 $0.000
MTA BRIDGES & TUNNELSFebruary Financial Plan 2012-2015
Reconciliation to the November Plan (Accrual) Reimbursable($ in millions)
Favorable/(Unfavorable)2011 2012 2013 2014 2015

Final New February Proposed MTA Energy/ New All Adopted
Budget Labor Efficiencies Other Reimb. COA Other Budget
RevenueFarebox Revenue $0.000 $0.000 $0.000 $0.000 $0.000 $0.000 $0.000Vehicle Toll Revenue 1,510.495 0.000 0.000 0.000 0.000 0.000 1,510.495Other Operating Revenue 14.664 0.000 0.000 0.000 0.000 0.000 14.664Capital and Other Reimbursements 0.000 0.000 0.000 0.000 0.000 0.000 0.000Investment Income 0.108 0.000 0.000 0.000 0.000 0.000 0.108Total Revenue $1,525.267 $0.000 $0.000 $0.000 $0.000 $0.000 $1,525.267
ExpensesLabor:Payroll $129.428 ($5.322) $0.000 $0.000 $0.000 $0.000 $124.106Overtime 21.510 (0.970) 0.000 0.000 0.000 0.000 20.540Health and Welfare 24.530 0.000 0.000 0.000 0.000 0.000 24.530OPEB Current Payment 15.553 0.000 0.000 0.000 0.000 0.000 15.553Pensions 32.319 (0.648) 0.000 0.000 0.000 0.000 31.671Other Fringe Benefits 15.716 (0.636) 0.000 0.000 0.000 0.000 15.080Reimbursable Overhead (5.116) 0.000 0.000 0.000 0.000 0.000 (5.116)Total Labor Expenses $233.940 ($7.575) $0.000 $0.000 $0.000 $0.000 $226.365
Non-Labor:Electric Power $0.000 $0.000 $0.000 $0.000 $8.428 $0.000 $8.428Fuel 0.000 0.000 0.000 (0.567) 3.503 0.000 2.936Insurance 7.460 0.000 0.000 0.000 0.000 0.000 7.460Claims 0.000 0.000 0.000 0.000 0.000 0.000 0.000Paratransit Service Contracts 0.000 0.000 0.000 0.000 0.000 0.000 0.000Maintenance and Other Operating Contracts 121.390 0.000 (0.113) 0.000 (17.305) 0.000 103.972Professional Service Contracts 20.448 0.000 (0.256) 0.000 5.742 0.000 25.934Materials & Supplies 27.216 0.000 0.000 0.000 (22.992) 0.000 4.224Other Business Expenses 3.718 0.000 0.000 0.000 22.624 0.000 26.342Total Non-Labor Expenses $180.232 $0.000 ($0.369) ($0.567) $0.000 $0.000 $179.296
Other Expense Adjustments:Other $0.000 $0.000 $0.000 $0.000 $0.000 $0.000 $0.000Total Other Expense Adjustments $0.000 $0.000 $0.000 $0.000 $0.000 $0.000 $0.000
Total Expenses before Non-Cash Liability Adjustments $414.171 ($7.575) ($0.369) ($0.567) $0.000 $0.000 $405.660
Depreciation $89.928 $0.000 $0.000 $0.000 $0.000 $0.000 $89.928OPEB Obligation 59.475 0.000 0.000 0.000 0.000 0.000 59.475Environmental Remediation 0.000 0.000 0.000 0.000 0.000 0.000 0.000
Total Expenses after Non-Cash Liability Adjustments $563.574 ($7.575) ($0.369) ($0.567) $0.000 $0.000 $555.063
Less: Depreciation $89.928 $0.000 $0.000 $0.000 $0.000 $0.000 $89.928Less: OPEB Obligation 59.475 0.000 0.000 0.000 0.000 0.000 59.475
Total Expenses $414.171 ($7.575) ($0.369) ($0.567) $0.000 $0.000 $405.660
Baseline Income/(Deficit) $1,111.095 $7.575 $0.369 $0.567 $0.000 $0.000 $1,119.607
-- Differences are due to rounding.
NON-REIMBURSABLE
2012
MTA Plan Adjustments
MTA BRIDGES AND TUNNELS2012 February Adopted Budget
Reconciliation to the 2012 Final Proposed Budget vs. 2012 Adopted Budget by Generic Category (Accrual) ($ in millions)

Final New February Proposed MTA Energy/ New All Adopted
Budget Labor Efficiencies Other Reimb. COA Other Budget
RevenueFarebox Revenue $0.000 $0.000 $0.000 $0.000 $0.000 $0.000 $0.000Vehicle Toll Revenue 0.000 0.000 0.000 0.000 0.000 0.000 0.000Other Operating Revenue 0.000 0.000 0.000 0.000 0.000 0.000 0.000Capital and Other Reimbursements 14.051 0.000 0.000 0.000 0.000 0.000 14.051Investment Income 0.000 0.000 0.000 0.000 0.000 0.000 0.000Total Revenue $14.051 $0.000 $0.000 $0.000 $0.000 $0.000 $14.051
ExpensesLabor:Payroll $5.577 $0.000 $0.000 $0.000 $0.000 $0.000 $5.577Overtime 0.202 0.000 0.000 0.000 0.000 0.000 0.202Health and Welfare 1.115 0.000 0.000 0.000 0.000 0.000 1.115OPEB Current Payment 0.000 0.000 0.000 0.000 0.000 0.000 0.000Pensions 1.366 0.000 0.000 0.000 0.000 0.000 1.366Other Fringe Benefits 0.675 0.000 0.000 0.000 0.000 0.000 0.675Reimbursable Overhead 5.116 0.000 0.000 0.000 0.000 0.000 5.116Total Labor Expenses $14.051 $0.000 $0.000 $0.000 $0.000 $0.000 $14.051
Non-Labor:Electric Power $0.000 $0.000 $0.000 $0.000 $0.000 $0.000 $0.000Fuel 0.000 0.000 0.000 0.000 0.000 0.000 0.000Insurance 0.000 0.000 0.000 0.000 0.000 0.000 0.000Claims 0.000 0.000 0.000 0.000 0.000 0.000 0.000Paratransit Service Contracts 0.000 0.000 0.000 0.000 0.000 0.000 0.000Maintenance and Other Operating Contracts 0.000 0.000 0.000 0.000 0.000 0.000 0.000Professional Service Contracts 0.000 0.000 0.000 0.000 0.000 0.000 0.000Materials & Supplies 0.000 0.000 0.000 0.000 0.000 0.000 0.000Other Business Expenses 0.000 0.000 0.000 0.000 0.000 0.000 0.000Total Non-Labor Expenses $0.000 $0.000 $0.000 $0.000 $0.000 $0.000 $0.000
Other Expense Adjustments:Other $0.000 $0.000 $0.000 $0.000 $0.000 $0.000 $0.000Total Other Expense Adjustments $0.000 $0.000 $0.000 $0.000 $0.000 $0.000 $0.000
Total Expenses before Non-Cash Liability Adjustments $14.051 $0.000 $0.000 $0.000 $0.000 $0.000 $14.051
Depreciation $0.000 $0.000 $0.000 $0.000 $0.000 $0.000 $0.000OPEB Obligation 0.000 0.000 0.000 0.000 0.000 0.000 0.000Environmental Remediation 0.000 0.000 0.000 0.000 0.000 0.000 0.000
Total Expenses after Non-Cash Liability Adjustments $14.051 $0.000 $0.000 $0.000 $0.000 $0.000 $14.051
Less: Depreciation $0.000 $0.000 $0.000 $0.000 $0.000 $0.000 $0.000Less: OPEB Obligation 0.000 0.000 0.000 0.000 0.000 0.000 0.000
Total Expenses $14.051 $0.000 $0.000 $0.000 $0.000 $0.000 $14.051
Baseline Income/(Deficit) $0.000 $0.000 $0.000 $0.000 $0.000 $0.000 $0.000
-- Differences are due to rounding.
REIMBURSABLE
2012
MTA Plan Adjustments
MTA BRIDGES AND TUNNELS2012 February Adopted Budget
Reconciliation to the 2012 Final Proposed Budget vs. 2012 Adopted Budget by Generic Category (Accrual) ($ in millions)

Final New February Proposed MTA Energy/ New All Adopted
Budget Labor Efficiencies Other Reimb. COA Other Budget
RevenueFarebox Revenue $0.000 $0.000 $0.000 $0.000 $0.000 $0.000 $0.000Vehicle Toll Revenue 1,510.495 0.000 0.000 0.000 0.000 0.000 1,510.495Other Operating Revenue 14.664 0.000 0.000 0.000 0.000 0.000 14.664Capital and Other Reimbursements 14.051 0.000 0.000 0.000 0.000 0.000 14.051Investment Income 0.108 0.000 0.000 0.000 0.000 0.000 0.108Total Revenue $1,539.318 $0.000 $0.000 $0.000 $0.000 $0.000 $1,539.318
ExpensesLabor:Payroll $135.005 (5.322) 0.000 0.000 0.000 0.000 $129.683Overtime 21.712 (0.970) 0.000 0.000 0.000 0.000 20.742Health and Welfare 25.645 0.000 0.000 0.000 0.000 0.000 25.645OPEB Current Payment 15.553 0.000 0.000 0.000 0.000 0.000 15.553Pensions 33.685 (0.648) 0.000 0.000 0.000 0.000 33.037Other Fringe Benefits 16.391 (0.636) 0.000 0.000 0.000 0.000 15.755Reimbursable Overhead 0.000 0.000 0.000 0.000 0.000 0.000 0.000Total Labor Expenses $247.991 ($7.575) $0.000 $0.000 $0.000 $0.000 $240.416
Non-Labor:Electric Power $0.000 $0.000 $0.000 $0.000 $8.428 $0.000 $8.428Fuel 0.000 0.000 0.000 (0.567) 3.503 0.000 2.936Insurance 7.460 0.000 0.000 0.000 0.000 0.000 7.460Claims 0.000 0.000 0.000 0.000 0.000 0.000 0.000Paratransit Service Contracts 0.000 0.000 0.000 0.000 0.000 0.000 0.000Maintenance and Other Operating Contracts 121.390 0.000 (0.113) 0.000 (17.305) 0.000 103.972Professional Service Contracts 20.448 0.000 (0.256) 0.000 5.742 0.000 25.934Materials & Supplies 27.216 0.000 0.000 0.000 (22.992) 0.000 4.224Other Business Expenses 3.718 0.000 0.000 0.000 22.624 0.000 26.342Total Non-Labor Expenses $180.232 $0.000 ($0.369) ($0.567) $0.000 $0.000 $179.296
Other Expense Adjustments:Other $0.000 $0.000 $0.000 $0.000 $0.000 $0.000 $0.000Total Other Expense Adjustments $0.000 $0.000 $0.000 $0.000 $0.000 $0.000 $0.000
Total Expenses before Non-Cash Liability Adjustments $428.222 ($7.575) ($0.369) ($0.567) $0.000 $0.000 $419.711
Depreciation $89.928 $0.000 $0.000 $0.000 $0.000 $0.000 $89.928OPEB Obligation 59.475 0.000 0.000 0.000 0.000 0.000 59.475Environmental Remediation 0.000 0.000 0.000 0.000 0.000 0.000 0.000
Total Expenses after Non-Cash Liability Adjustments $577.625 ($7.575) ($0.369) ($0.567) $0.000 $0.000 $569.114
Less: Depreciation $89.928 $0.000 $0.000 $0.000 $0.000 $0.000 $89.928Less: OPEB Obligation 59.475 0.000 0.000 0.000 0.000 0.000 59.475
Total Expenses $428.222 ($7.575) ($0.369) ($0.567) $0.000 $0.000 $419.711
Baseline Income/(Deficit) $1,111.095 $7.575 $0.369 $0.567 $0.000 $0.000 $1,119.607
-- Differences are due to rounding.
NON-REIMBURSABLE/REIMBURSABLE (Page 1 of 2)
2012
MTA Plan Adjustments
MTA BRIDGES AND TUNNELS2012 February Adopted Budget
Reconciliation to the 2012 Final Proposed Budget vs. 2012 Adopted Budget by Generic Category (Accrual) ($ in millions)
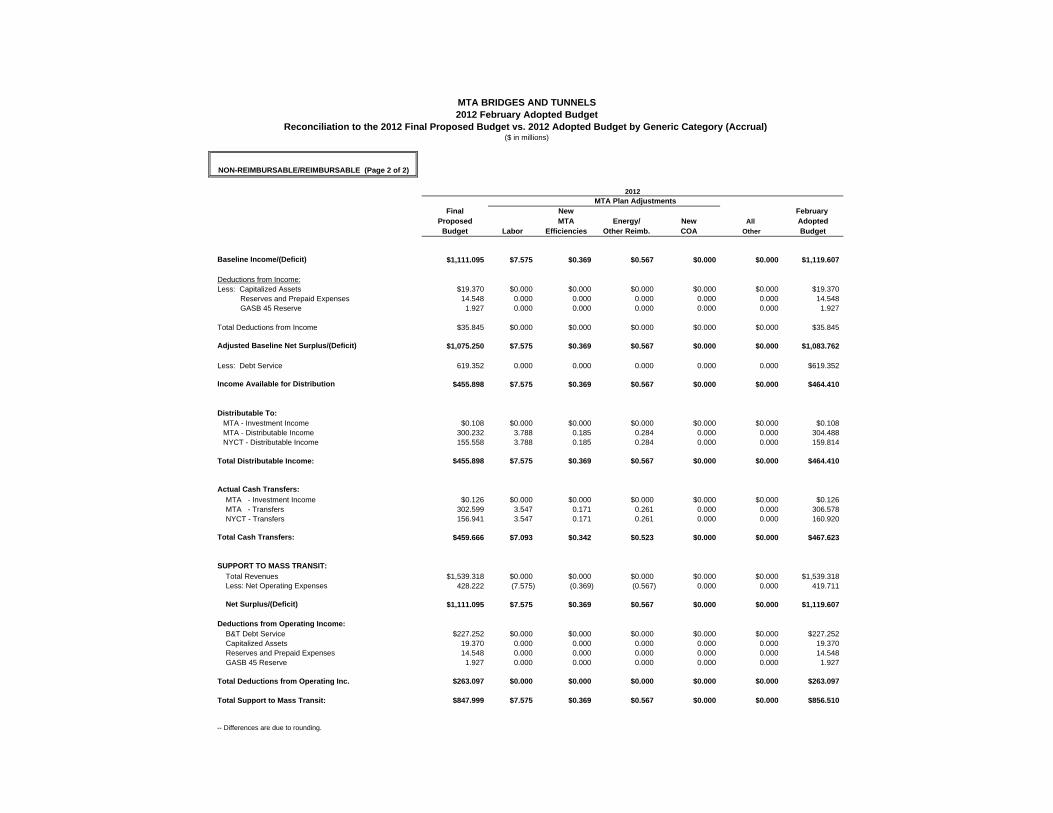
Final New February Proposed MTA Energy/ New All Adopted
Budget Labor Efficiencies Other Reimb. COA Other Budget
Baseline Income/(Deficit) $1,111.095 $7.575 $0.369 $0.567 $0.000 $0.000 $1,119.607
Deductions from Income:Less: Capitalized Assets $19.370 $0.000 $0.000 $0.000 $0.000 $0.000 $19.370 Reserves and Prepaid Expenses 14.548 0.000 0.000 0.000 0.000 0.000 14.548 GASB 45 Reserve 1.927 0.000 0.000 0.000 0.000 0.000 1.927
Total Deductions from Income $35.845 $0.000 $0.000 $0.000 $0.000 $0.000 $35.845
Adjusted Baseline Net Surplus/(Deficit) $1,075.250 $7.575 $0.369 $0.567 $0.000 $0.000 $1,083.762
Less: Debt Service 619.352 0.000 0.000 0.000 0.000 0.000 $619.352
Income Available for Distribution $455.898 $7.575 $0.369 $0.567 $0.000 $0.000 $464.410
Distributable To:MTA - Investment Income $0.108 $0.000 $0.000 $0.000 $0.000 $0.000 $0.108MTA - Distributable Income 300.232 3.788 0.185 0.284 0.000 0.000 304.488NYCT - Distributable Income 155.558 3.788 0.185 0.284 0.000 0.000 159.814
0.000Total Distributable Income: $455.898 $7.575 $0.369 $0.567 $0.000 $0.000 $464.410
Actual Cash Transfers:
MTA - Investment Income $0.126 $0.000 $0.000 $0.000 $0.000 $0.000 $0.126 MTA - Transfers 302.599 3.547 0.171 0.261 0.000 0.000 306.578 NYCT - Transfers 156.941 3.547 0.171 0.261 0.000 0.000 160.920
$0.000Total Cash Transfers: $459.666 $7.093 $0.342 $0.523 $0.000 $0.000 $467.623
SUPPORT TO MASS TRANSIT:
Total Revenues $1,539.318 $0.000 $0.000 $0.000 $0.000 $0.000 $1,539.318 Less: Net Operating Expenses 428.222 (7.575) (0.369) (0.567) 0.000 0.000 419.711
Net Surplus/(Deficit) $1,111.095 $7.575 $0.369 $0.567 $0.000 $0.000 $1,119.607
Deductions from Operating Income: B&T Debt Service $227.252 $0.000 $0.000 $0.000 $0.000 $0.000 $227.252 Capitalized Assets 19.370 0.000 0.000 0.000 0.000 0.000 19.370 Reserves and Prepaid Expenses 14.548 0.000 0.000 0.000 0.000 0.000 14.548 GASB 45 Reserve 1.927 0.000 0.000 0.000 0.000 0.000 1.927
Total Deductions from Operating Inc. $263.097 $0.000 $0.000 $0.000 $0.000 $0.000 $263.097
Total Support to Mass Transit: $847.999 $7.575 $0.369 $0.567 $0.000 $0.000 $856.510
-- Differences are due to rounding.
MTA Plan Adjustments
MTA BRIDGES AND TUNNELS2012 February Adopted Budget
Reconciliation to the 2012 Final Proposed Budget vs. 2012 Adopted Budget by Generic Category (Accrual) ($ in millions)
NON-REIMBURSABLE/REIMBURSABLE (Page 2 of 2)
2012

NON-REIMBURSABLE
2011 2012
Final Adopted
Estimate* Budget 2013 2014 2015
Operating Revenue
Farebox Revenue $0.000 $0.000 $0.000 $0.000 $0.000
Vehicle Toll Revenue 1,498.521 1,510.495 1,508.101 1,513.687 1,520.452
Other Operating Revenue 14.749 14.664 14.445 14.091 13.944
Capital and Other Reimbursements 0.000 0.0 0.000 0.000 0.000
Investment Income 0.126 0.108 0.162 1.037 2.534
Total Revenue $1,513.396 $1,525.267 $1,522.708 $1,528.815 $1,536.930
Operating Expenses
Labor:
Payroll $118.371 $124.106 $123.673 $126.593 129.899
Overtime 19.729 20.540 20.481 20.822 21.243
Health and Welfare 22.111 24.530 26.194 28.511 31.006
OPEB Current Payment 14.126 15.553 16.548 17.922 19.409
Pensions 26.430 31.671 31.404 34.659 37.115
Other Fringe Benefits 15.267 15.080 15.300 15.781 16.415
Reimbursable Overhead (5.329) (5.116) (5.114) (5.095) (5.145)
Total Labor Expenses $210.706 $226.365 $228.486 $239.192 $249.943
Non-Labor:
Electric Power $0.000 $8.428 $9.648 $11.247 $13.278
Fuel 0.000 2.936 3.066 3.058 3.087
Insurance 6.878 7.460 8.169 8.949 9.806
Claims 0.000 0.000 0.000 0.000 0.000
Paratransit Service Contracts 0.000 0.000 0.000 0.000 0.000
Maintenance and Other Operating Contracts 116.397 104.007 108.069 123.876 139.694
Professional Service Contracts 18.399 26.067 26.555 27.014 27.587
Materials & Supplies 22.078 4.220 4.258 4.349 4.446
Other Business Expenses 3.047 26.178 26.774 27.368 27.977
Total Non-Labor Expenses $166.799 $179.296 $186.539 $205.861 $225.875
Other Expense Adjustments:
Other $0.000 $0.000 $0.000 $0.000 $0.000
Total Other Expense Adjustments $0.000 $0.000 $0.000 $0.000 $0.000
Total Expenses Before Depreciation and GASB Adjs. $377.505 $405.660 $415.025 $445.053 $475.818
Add: Depreciation 85.618 89.928 94.429 104.389 111.667
Add: OPEB Obligation 57.310 59.475 62.579 60.125 66.240
Add: Environmental Remediation 0.000 0.000 0.000 0.000 0.000
Total Expenses After Depreciation and GASB Adjs. $520.433 $555.063 $572.033 $609.567 $653.725
Less: Depreciation 85.618 89.928 94.429 104.389 111.667
Less: OPEB Obligation 57.310 59.475 62.579 60.125 66.240
Less: Environmental Remediation 0.000 0.000 0.000 0.000 0.000
Total Expenses $377.505 $405.660 $415.025 $445.053 $475.818
Baseline Income/(Deficit) $1,135.891 $1,119.607 $1,107.683 $1,083.762 $1,061.112
* Effective 2012, the non-labor account structure of the MTA standard chart of accounts has been adjusted to reflect the reclassification and renaming of certain accounts in order to improve account reporting consistency among the Agencies. These changes, which affect most non-labor accounts presented on the attached tables, result in no net-impact to the bottom line. In order to maintain comparability with 2011 actual results for year-end reporting purposes, the 2011 account structure remains unchanged.
February Financial Plan 2012-2015Accrual Statement of Operations by Category
($ in millions)
MTA BRIDGES & TUNNELS

REIMBURSABLE
2011 2012
Final Adopted
Estimate* Budget 2013 2014 2015
Revenue
Farebox Revenue $0.000 $0.000 $0.000 $0.000 $0.000
Vehicle Toll Revenue 0.000 0.000 0.000 0.000 0.000
Other Operating Revenue 0.000 0.000 0.000 0.000 0.000
Capital and Other Reimbursements 13.997 14.051 14.194 14.261 14.494
Investment Income 0.000 0.000 0.000 0.000 0.000
Total Revenue $13.997 $14.051 $14.194 $14.261 $14.494
Expenses
Labor:
Payroll $5.588 $5.577 $5.566 $5.522 $5.522
Overtime 0.134 0.202 0.158 0.115 0.100
Health and Welfare 1.006 1.115 1.202 1.276 1.358
OPEB Current Payment 0.000 0.000 0.000 0.000 0.000
Pensions 1.241 1.366 1.475 1.574 1.679
Other Fringe Benefits 0.699 0.675 0.679 0.679 0.690
Reimbursable Overhead $5.329 $5.116 $5.114 $5.095 $5.145
Total Labor Expenses $13.997 $14.051 $14.194 $14.261 $14.494
Non-Labor:
Electric Power $0.000 $0.000 $0.000 $0.000 $0.000
Fuel 0.000 0.000 0.000 0.000 0.000
Insurance 0.000 0.000 0.000 0.000 0.000
Claims 0.000 0.000 0.000 0.000 0.000
Paratransit Service Contracts 0.000 0.000 0.000 0.000 0.000
Maintenance and Other Operating Contracts 0.000 0.000 0.000 0.000 0.000
Professional Service Contracts 0.000 0.000 0.000 0.000 0.000
Materials & Supplies 0.000 0.000 0.000 0.000 0.000
Other Business Expenses 0.000 0.000 0.000 0.000 0.000
Total Non-Labor Expenses $0.000 $0.000 $0.000 $0.000 $0.000
Other Expense Adjustments:
Other
Total Other Expense Adjustments $0.000 $0.000 $0.000 $0.000 $0.000
Total Expenses Before Depreciation $13.997 $14.051 $14.194 $14.261 $14.494
Add: Depreciation $0.000 $0.000 $0.000 $0.000 $0.000
Total Expenses After Depreciation $13.997 $14.051 $14.194 $14.261 $14.494
Less: Depreciation $0.000 $0.000 $0.000 $0.000 $0.000
Total Expenses $13.997 $14.051 $14.194 $14.261 $14.494
Baseline Income/(Deficit) $0.000 $0.000 $0.000 $0.000 $0.000
* Effective 2012, the non-labor account structure of the MTA standard chart of accounts has been adjusted to reflect the reclassification and renaming of certain accounts in order to improve account reporting consistency among the Agencies. These changes, which affect most non-labor accounts presented on the attached tables, result in no net-impact to the bottom line. In order to maintain comparability with 2011 actual results for year-end reporting purposes, the 2011 account structure remains unchanged.
MTA BRIDGES & TUNNELSFebruary Financial Plan 2012-2015
Accrual Statement of Operations by Category
($ in millions)

NON-REIMBURSABLE / REIMBURSABLEPage 1 of 2
2011 2012
Final Adopted
Estimate* Budget 2013 2014 2015
Revenue
Farebox Revenue $0.000 $0.000 $0.000 $0.000 $0.000
Vehicle Toll Revenue 1,498.521 1,510.495 1,508.101 1,513.687 1,520.452
Other Operating Revenue 14.749 14.664 14.445 14.091 13.944
Capital and Other Reimbursements 13.997 14.051 14.194 14.261 14.494
Investment Income 0.126 0.108 0.162 1.037 2.534
Total Revenue $1,527.393 $1,539.318 $1,536.902 $1,543.076 $1,551.424
Expenses
Labor:
Payroll $123.959 $129.683 $129.239 $132.115 $135.421
Overtime 19.863 20.742 20.639 20.937 21.343
Health and Welfare 23.117 25.645 27.396 29.787 32.364
OPEB Current Payment 14.126 15.553 16.548 17.922 19.409
Pensions 27.671 33.037 32.879 36.233 38.794
Other Fringe Benefits 15.966 15.755 15.979 16.460 17.105
Reimbursable Overhead 0.000 0.000 0.000 0.000 0.000
Total Labor Expenses $224.703 $240.416 $242.680 $253.453 $264.437
Non-Labor:
Electric Power $0.000 $8.428 $9.648 $11.247 $13.278
Fuel 0.000 2.936 3.066 3.058 3.087
Insurance 6.878 7.460 8.169 8.949 9.806
Claims 0.000 0.000 0.000 0.000 0.000
Paratransit Service Contracts 0.000 0.000 0.000 0.000 0.000
Maintenance and Other Operating Contracts 116.397 104.007 108.069 123.876 139.694
Professional Service Contracts 18.399 26.067 26.555 27.014 27.587
Materials & Supplies 22.078 4.220 4.258 4.349 4.446
Other Business Expenses 3.047 26.178 26.774 27.368 27.977
Total Non-Labor Expenses $166.799 $179.296 $186.539 $205.861 $225.875
Other Expense Adjustments:
Other $0.000 $0.000 $0.000 $0.000 $0.000
Total Other Expense Adjustments $0.000 $0.000 $0.000 $0.000 $0.000
Total Expenses Before Depreciation and GASB Adjs. $391.502 $419.711 $429.219 $459.314 $490.312
Add: Depreciation 85.618 89.928 94.429 104.389 111.667
Add: OPEB Obligation 57.310 59.475 62.579 60.125 66.240
Add: Environmental Remediation 0.000 0.000 0.000 0.000 0.000
Total Expenses After Depreciation and GASB Adjs. $534.430 $569.114 $586.227 $623.828 $668.219
Less: Depreciation 85.618 89.928 94.429 104.389 111.667
Less: OPEB Obligation 57.310 59.475 62.579 60.125 66.240
Less: Environmental Remediation 0.000 0.000 0.000 0.000 0.000
Total Expenses $391.502 $419.711 $429.219 $459.314 $490.312
Baseline Income/(Deficit) $1,135.891 $1,119.607 $1,107.683 $1,083.762 $1,061.112
Accrual Statement of Operations by CategoryFebruary Financial Plan 2012-2015
MTA BRIDGES & TUNNELS
* Effective 2012, the non-labor account structure of the MTA standard chart of accounts has been adjusted to reflect the reclassification and renaming of certain accounts in order to improve account reporting consistency among the Agencies. These changes, which affect most non-labor accounts presented on the attached tables, result in no net-impact to the bottom line. In order to maintain comparability with 2011 actual results for year-end reporting purposes, the 2011 account structure remains unchanged.
($ in millions)

NON-REIMBURSABLE / REIMBURSABLEPage 2 of 2
2011 2012
Final Adopted
Estimate* Budget 2013 2014 2015
Baseline Income/(Deficit) $1,135.891 $1,119.607 $1,107.683 $1,083.762 $1,061.112
Deductions from Income:
Less: Capitalized Assets $11.543 $19.370 $17.781 $17.843 $17.849
Reserves 14.353 14.548 14.762 15.003 15.258
GASB Reserves 1.787 1.927 1.932 1.966 2.017
Adjusted Baseline Net Income/(Deficit) $1,108.207 $1,083.762 $1,073.209 $1,048.950 $1,025.989
Less: Debt Service $612.275 $619.352 $638.397 $667.572 $703.482
Income Available for Distribution $495.932 $464.410 $434.812 $381.379 $322.507
Distributable To:
MTA - Investment Income $0.126 $0.108 $0.162 $1.037 $2.534
MTA - Distributable Income 313.156 292.488 277.877 250.780 220.481
NYCT - Distributable Income 182.650 171.814 156.773 129.562 99.491
Total Distributable Income: $495.932 $464.410 $434.812 $381.379 $322.507
Actual Cash Transfers:
MTA - Investment Income $0.147 $0.126 $0.108 $0.162 $1.037
MTA - Transfers 319.243 294.555 279.338 253.490 223.511
NYCT - Transfers 180.367 172.897 158.277 132.283 102.498
Total Cash Transfers: $499.757 $467.578 $437.723 $385.934 $327.047
SUPPORT TO MASS TRANSIT:
Total Revenues $1,527.393 $1,539.318 $1,536.902 $1,543.076 $1,551.424
Less: Net Operating Expenses 391.502 419.711 429.219 459.314 490.312
Baseline Net Operating Income: $1,135.891 $1,119.607 $1,107.683 $1,083.762 $1,061.112
Deductions from Operating Income:
B&T Debt Service $205.959 $227.252 $245.052 $273.964 $310.460
Capitalized Assets 11.543 19.370 17.781 17.843 17.849
Reserves 14.353 14.548 14.762 15.003 15.258
GASB Reserves 1.787 1.927 1.932 1.966 2.017
Total Deductions from Operating Income: $233.642 $263.097 $279.526 $308.776 $345.584
Total Support to Mass Transit: $902.248 $856.510 $828.157 $774.986 $715.528
February Financial Plan 2012-2015Accrual Statement of Operations by Category
* Effective 2012, the non-labor account structure of the MTA standard chart of accounts has been adjusted to reflect the reclassification and renaming of certain accounts in order to improve account reporting consistency among the Agencies. These changes, which affect most non-labor accounts presented on the attached tables, result in no net-impact to the bottom line. In order to maintain comparability with 2011 actual results for year-end reporting purposes, the 2011 account structure remains unchanged.
($ in millions)
MTA BRIDGES & TUNNELS

NON-REIMBURSABLE OVERTIME Hours $ %
SCHEDULED:Direct Service - Operations & Maintenance 52,780 $2.770 13.5%
Programmed Maintenance 0.0%
Total Scheduled 52,780 $2.770 13.5%
UNSCHEDULED:Operations & Maintenance:
Vacancy/Absentee Coverage 159,649 $8.762 42.7%
Weather Emergencies 19,048 1.043 5.1%
Maintenance 22,918 1.253 6.1%
Service Delays 11,241 0.590 2.9%
Emergencies 2,207 0.121 0.6%
Tour Length 690 0.037 0.2%
Safety/Security/Law Enforcement 44,634 2.427 11.8%
All Other Operations & Maintenance 28,767 1.600 7.8%
All Other Departments 1.937 9.4%
Total Unscheduled 289,155 $17.770 86.5%
TOTAL NON-REIMBURSABLE OVERTIME: 341,935 $20.540 100.0%
REIMBURSABLE OVERTIME 3,360 $0.202
TOTAL OVERTIME 345,295 $20.742
MTA Bridges and Tunnels2012 Adopted Budget
2012 Non-Reimbursable/Reimbursable Overtime
Total($ in millions)

2011Final
Estimate
2012AdoptedBudget 2013 2014 2015
TRAFFIC VOLUME
Baseline Total Traffic Volume 283.095 286.442 287.026 288.815 290.840
TOLL REVENUE
Baseline Total Toll Revenue $1,498.521 $1,510.495 $1,508.101 $1,513.687 $1,520.452
MTA BRIDGES AND TUNNELSFebruary Financial Plan 2012-2015
Traffic Volume/ (Utilization)(in millions)

2011 Final
Estimate
2012 Adopted Budget 2013 2014 2015
AdministrationExecutive 2 2 2 2 2Law 7 7 7 7 7
CFO (1)27 18 18 18 18
Labor Relations 5 5 5 5 5
Staff Services (2)31 17 17 17 17
EEO 1 1 1 1 1Total Administration 73 50 50 50 50
OperationsRevenue Management 41 41 41 41 41Operations (Non-Security) 728 728 728 728 728
Total Operations 769 769 769 769 769
MaintenanceMaintenance 168 168 168 168 168Operations - Maintainers 170 170 170 170 170Technology 56 52 52 52 52Internal Security - Tech Svcs 8 8 8 8 8
Total Maintenance 402 398 398 398 398
Engineering/CapitalEngineering & Construction 128 128 128 128 128Health & Safety 8 8 8 8 8Planning & Budget Capital 12 12 12 12 12
Total Engineering/Capital 148 148 148 148 148
Public SafetyOperations (Security) 233 236 236 236 236Internal Security - Operations 38 38 38 38 38
Total Public Safety 271 274 274 274 274
Total Baseline Positions 1,663 1,639 1,639 1,639 1,639
Non-Reimbursable 1,619 1,595 1,595 1,595 1,595Reimbursable 44 44 44 44 44
Total Full-Time 1,663 1,639 1,639 1,639 1,639Total Full-Time Equivalents - - - - -
(1) includes Accounts Payable, Accounting, Payroll and Operating Budget staff.(2) includes Human Resources and Administration staff.
FUNCTION/DEPARTMENT
MTA BRIDGES & TUNNELSFebruary Financial Plan 2012-2015
Total Positions by Function and DepartmentNon-Reimbursable/Reimbursable and Full-Time/Full-Time Equivalents

FUNCTION/OCCUPATIONAL GROUP
2011Final
Estimate
2012 Adopted Budget 2013 2014 2015
Administration Managers/Supervisors 29 21 21 21 21 Professional, Technical, Clerical 44 29 29 29 29 Operational Hourlies - - - - -
Total Administration 73 50 50 50 50
Operations Managers/Supervisors 50 48 48 48 48 Professional, Technical, Clerical 41 42 42 42 42
Operational Hourlies(1) 678 679 679 679 679 Total Operations 769 769 769 769 769
Maintenance Managers/Supervisors 33 31 31 31 31 Professional, Technical, Clerical 56 54 54 54 54
Operational Hourlies(2) 313 313 313 313 313 Total Maintenance 402 398 398 398 398
Engineering/Capital Managers/Supervisors 31 31 31 31 31 Professional, Technical, Clerical 117 117 117 117 117 Operational Hourlies - - - - -
Total Engineering/Capital 148 148 148 148 148
Public Safety Managers/Supervisors 9 9 9 9 9 Professional, Technical, Clerical 28 28 28 28 28
Operational Hourlies(3) 234 237 237 237 237 Total Public Safety 271 274 274 274 274
Total Baseline Positions Managers/Supervisors 152 140 140 140 140 Professional, Technical, Clerical 286 270 270 270 270 Operational Hourlies 1,225 1,229 1,229 1,229 1,229
Total Baseline Positions 1,663 1,639 1,639 1,639 1,639
(1) Represents Bridge and Tunnel Officers, Sergeants and Lieutenants. These positions are paid annually, not hourly.(2) Represents maintenance personnel. These positions are paid annually, not hourly.(3) Represents Bridge and Tunnel Officers, Sergeants and Lieutenants performing public safety. These positions are paid annually, not hourly.
MTA BRIDGES AND TUNNELSFebruary Financial Plan 2012-2015
Total Positions by Function and Occupation

NON-REIMBURSABLE
Jan Feb Mar Apr May Jun Jul Aug Sep Oct Nov Dec Total
Operating Revenue
Farebox Revenue $0.000 $0.000 $0.000 $0.000 $0.000 $0.000 $0.000 $0.000 $0.000 $0.000 $0.000 $0.000 $0.000
VehicleToll Revenue 111.898 106.411 126.693 125.239 133.743 133.612 135.742 135.151 126.715 130.161 123.933 121.197 1,510.495
Other Operating Revenue 1.147 1.109 1.267 1.133 1.523 1.145 1.228 1.237 1.233 1.248 1.205 1.189 14.664
Capital and Other Reimbursements 0.000 0.000 0.000 0.000 0.000 0.000 0.000 0.000 0.000 0.000 0.000 0.000 0.000
Investment Income 0.009 0.009 0.009 0.009 0.009 0.009 0.009 0.009 0.009 0.009 0.009 0.009 0.108Total Revenue $113.054 $107.529 $127.969 $126.381 $135.275 $134.766 $136.979 $136.397 $127.958 $131.418 $125.146 $122.395 $1,525.267
Operating Expenses
Labor:
Payroll $10.353 $9.502 $10.169 $9.853 $10.183 $9.923 $10.444 $10.258 $9.870 $10.041 $9.715 $13.797 $124.106
Overtime 1.962 2.151 1.860 1.697 1.775 1.646 1.633 1.609 1.538 1.477 1.476 1.716 20.540
Health and Welfare 2.193 2.193 2.193 2.193 2.193 2.193 2.193 2.193 2.193 2.193 2.193 0.403 24.530
OPEB Current Payment 1.342 1.290 1.294 1.324 1.297 1.298 1.279 1.270 1.291 1.285 1.297 1.286 15.553
Pensions 2.259 2.259 2.259 2.259 2.259 2.259 2.336 2.336 2.336 2.336 2.336 6.436 31.671
Other Fringe Benefits 1.977 0.833 1.809 0.827 0.854 1.779 0.861 0.848 1.769 0.825 0.804 1.893 15.080
Reimbursable Overhead (0.426) (0.426) (0.426) (0.426) (0.426) (0.426) (0.426) (0.426) (0.426) (0.426) (0.426) (0.426) (5.116)Total Labor Expenses $19.660 $17.803 $19.158 $17.727 $18.134 $18.673 $18.320 $18.087 $18.572 $17.731 $17.394 $25.105 $226.365
Non-Labor:
Electric Power $0.702 $0.702 $0.702 $0.702 $0.702 $0.702 $0.702 $0.702 $0.702 $0.702 $0.702 $0.702 $8.428
Fuel 0.342 0.320 0.444 0.221 0.168 0.230 0.059 0.089 0.137 0.180 0.204 0.543 2.936
Insurance 0.582 0.582 0.582 0.582 0.582 0.582 0.582 0.582 0.582 0.582 0.582 1.061 7.460
Claims 0.000 0.000 0.000 0.000 0.000 0.000 0.000 0.000 0.000 0.000 0.000 0.000 0.000
Paratransit Service Contracts 0.000 0.000 0.000 0.000 0.000 0.000 0.000 0.000 0.000 0.000 0.000 0.000 0.000
Maintenance and Other Operating Contracts 4.917 5.428 8.411 4.938 6.874 11.649 6.500 9.035 11.028 7.710 7.315 20.202 104.007
Professional Service Contracts 1.950 1.950 2.303 1.950 1.950 2.303 1.950 1.950 2.303 1.950 1.950 3.555 26.067
Materials & Supplies 0.347 0.347 0.350 0.347 0.347 0.347 0.347 0.347 0.347 0.347 0.347 0.399 4.220
Other Business Expenses 1.799 1.663 2.041 2.029 1.795 2.278 2.117 2.182 2.177 1.921 1.967 4.208 26.178Total Non-Labor Expenses $10.640 $10.992 $14.832 $10.770 $12.418 $18.091 $12.257 $14.887 $17.276 $13.393 $13.068 $30.672 $179.296
Other Expenses Adjustments:
Other $0.000 $0.000 $0.000 $0.000 $0.000 $0.000 $0.000 $0.000 $0.000 $0.000 $0.000 $0.000 $0.000Total Other Expense Adjustments $0.000 $0.000 $0.000 $0.000 $0.000 $0.000 $0.000 $0.000 $0.000 $0.000 $0.000 $0.000 $0.000
Total Expenses before Depreciation & GASB Adjs. $30.300 $28.795 $33.991 $28.496 $30.552 $36.764 $30.576 $32.974 $35.848 $31.124 $30.462 $55.776 $405.660
Add: Depreciation 7.494 7.494 7.494 7.494 7.494 7.494 7.494 7.494 7.494 7.494 7.494 7.494 89.928
Add: OPEB Obligation 4.956 4.956 4.956 4.956 4.956 4.956 4.956 4.956 4.956 4.956 4.956 4.956 59.475
Total Expenses/Expenditures $42.750 $41.246 $46.441 $40.947 $43.002 $49.214 $43.027 $45.425 $48.298 $43.574 $42.912 $68.227 $555.063
Less: Depreciation (7.494) (7.494) (7.494) (7.494) (7.494) (7.494) (7.494) (7.494) (7.494) (7.494) (7.494) (7.494) (89.928)
Less: OPEB Obligation (4.956) (4.956) (4.956) (4.956) (4.956) (4.956) (4.956) (4.956) (4.956) (4.956) (4.956) (4.956) (59.475)
Total Expenses $30.300 $28.795 $33.991 $28.496 $30.552 $36.764 $30.576 $32.974 $35.848 $31.124 $30.462 $55.776 $405.660
Net Income/(Deficit) $82.754 $78.733 $93.978 $97.885 $104.723 $98.002 $106.403 $103.422 $92.110 $100.294 $94.684 $66.619 $1,119.607
MTA BRIDGES AND TUNNELSFebruary Financial Plan - 2012 Adopted BudgetAccrual Statement of Operations by Category
($ in millions)

REIMBURSABLE
Jan Feb Mar Apr May Jun Jul Aug Sep Oct Nov Dec Total
Revenue
Farebox Revenue $0.000 $0.000 $0.000 $0.000 $0.000 $0.000 $0.000 $0.000 $0.000 $0.000 $0.000 $0.000 $0.000
Vehicle Toll Revenue 0.000 0.000 0.000 0.000 0.000 0.000 0.000 0.000 0.000 0.000 0.000 0.000 0.000
Other Operating Revenue 0.000 0.000 0.000 0.000 0.000 0.000 0.000 0.000 0.000 0.000 0.000 0.000 0.000
Capital and Other Reimbursements 1.171 1.171 1.171 1.171 1.171 1.171 1.171 1.171 1.171 1.171 1.171 1.171 14.051
Investment Income 0.000 0.000 0.000 0.000 0.000 0.000 0.000 0.000 0.000 0.000 0.000 0.000 0.000Total Revenue $1.171 $1.171 $1.171 $1.171 $1.171 $1.171 $1.171 $1.171 $1.171 $1.171 $1.171 $1.171 $14.051
Expenses
Labor:
Payroll $0.465 $0.465 $0.465 $0.465 $0.465 $0.465 $0.465 $0.465 $0.465 $0.465 $0.465 $0.465 $5.577
Overtime 0.017 0.017 0.017 0.017 0.017 0.017 0.017 0.017 0.017 0.017 0.017 0.017 0.202
Health and Welfare 0.093 0.093 0.093 0.093 0.093 0.093 0.093 0.093 0.093 0.093 0.093 0.093 1.115
OPEB Current Payment 0.000 0.000 0.000 0.000 0.000 0.000 0.000 0.000 0.000 0.000 0.000 0.000 0.000
Pensions 0.114 0.114 0.114 0.114 0.114 0.114 0.114 0.114 0.114 0.114 0.114 0.114 1.366
Other Fringe Benefits 0.056 0.056 0.056 0.056 0.056 0.056 0.056 0.056 0.056 0.056 0.056 0.056 0.675
Reimbursable Overhead 0.426 0.426 0.426 0.426 0.426 0.426 0.426 0.426 0.426 0.426 0.426 0.426 5.116Total Labor Expenses $1.171 $1.171 $1.171 $1.171 $1.171 $1.171 $1.171 $1.171 $1.171 $1.171 $1.171 $1.171 $14.051
Non-Labor:
Electric Power $0.000 $0.000 $0.000 $0.000 $0.000 $0.000 $0.000 $0.000 $0.000 $0.000 $0.000 $0.000 $0.000
Fuel 0.000 0.000 0.000 0.000 0.000 0.000 0.000 0.000 0.000 0.000 0.000 0.000 0.000
Insurance 0.000 0.000 0.000 0.000 0.000 0.000 0.000 0.000 0.000 0.000 0.000 0.000 0.000
Claims 0.000 0.000 0.000 0.000 0.000 0.000 0.000 0.000 0.000 0.000 0.000 0.000 0.000
Paratransit Service Contracts 0.000 0.000 0.000 0.000 0.000 0.000 0.000 0.000 0.000 0.000 0.000 0.000 0.000
Maintenance and Other Operating Contracts 0.000 0.000 0.000 0.000 0.000 0.000 0.000 0.000 0.000 0.000 0.000 0.000 0.000
Professional Service Contracts 0.000 0.000 0.000 0.000 0.000 0.000 0.000 0.000 0.000 0.000 0.000 0.000 0.000
Materials & Supplies 0.000 0.000 0.000 0.000 0.000 0.000 0.000 0.000 0.000 0.000 0.000 0.000 0.000
Other Business Expenses 0.000 0.000 0.000 0.000 0.000 0.000 0.000 0.000 0.000 0.000 0.000 0.000 0.000Total Non-Labor Expenses $0.000 $0.000 $0.000 $0.000 $0.000 $0.000 $0.000 $0.000 $0.000 $0.000 $0.000 $0.000 $0.000
Other Expenses Adjustments:
Other $0.000 $0.000 $0.000 $0.000 $0.000 $0.000 $0.000 $0.000 $0.000 $0.000 $0.000 $0.000 $0.000Total Other Expense Adjustments $0.000 $0.000 $0.000 $0.000 $0.000 $0.000 $0.000 $0.000 $0.000 $0.000 $0.000 $0.000 $0.000
Total Expenses before Non-Cash Liability Adjs. $1.171 $1.171 $1.171 $1.171 $1.171 $1.171 $1.171 $1.171 $1.171 $1.171 $1.171 $1.171 $14.051
Depreciation 0.000 0.000 0.000 0.000 0.000 0.000 0.000 0.000 0.000 0.000 0.000 0.000 0.000
OPEB Obligation 0.000 0.000 0.000 0.000 0.000 0.000 0.000 0.000 0.000 0.000 0.000 0.000 0.000
Total Expenses $1.171 $1.171 $1.171 $1.171 $1.171 $1.171 $1.171 $1.171 $1.171 $1.171 $1.171 $1.171 $14.051
Depreciation 0.000 0.000 0.000 0.000 0.000 0.000 0.000 0.000 0.000 0.000 0.000 0.000 0.000
OPEB Obligation 0.000 0.000 0.000 0.000 0.000 0.000 0.000 0.000 0.000 0.000 0.000 0.000 0.000
Total Expenses $1.171 $1.171 $1.171 $1.171 $1.171 $1.171 $1.171 $1.171 $1.171 $1.171 $1.171 $1.171 $14.051
Net Income/(Deficit) $0.000 $0.000 $0.000 $0.000 $0.000 $0.000 $0.000 $0.000 $0.000 $0.000 $0.000 $0.000 $0.000
February Financial Plan - 2012 Adopted BudgetAccrual Statement of Operations by Category
($ in millions)
MTA BRIDGES AND TUNNELS

NON-REIMBURSABLE/ REIMBURSABLE
(Page 1 of 2)Jan Feb Mar Apr May Jun Jul Aug Sep Oct Nov Dec Total
Revenue
Farebox Revenue $0.000 $0.000 $0.000 $0.000 $0.000 $0.000 $0.000 $0.000 $0.000 $0.000 $0.000 $0.000 $0.000
Vehicle Toll Revenue 111.898 106.411 126.693 125.239 133.743 133.612 135.742 135.151 126.715 130.161 123.933 121.197 1,510.495
Other Operating Revenue 1.147 1.109 1.267 1.133 1.523 1.145 1.228 1.237 1.233 1.248 1.205 1.189 14.664Capital and Other Reimbursements 1.171 1.171 1.171 1.171 1.171 1.171 1.171 1.171 1.171 1.171 1.171 1.171 14.051Investment Income 0.009 0.009 0.009 0.009 0.009 0.009 0.009 0.009 0.009 0.009 0.009 0.009 0.108Total Revenue $114.225 $108.700 $129.140 $127.552 $136.446 $135.936 $138.150 $137.568 $129.128 $132.589 $126.317 $123.566 $1,539.318
Expenses
Labor:
Payroll $10.817 $9.967 $10.633 $10.317 $10.647 $10.388 $10.908 $10.723 $10.335 $10.505 $10.180 $14.261 $129.683
Overtime 1.979 2.168 1.877 1.714 1.792 1.663 1.650 1.626 1.555 1.494 1.492 1.733 20.742
Health and Welfare 2.286 2.286 2.286 2.286 2.286 2.286 2.286 2.286 2.286 2.286 2.286 0.496 25.645
OPEB Current Payment 1.342 1.290 1.294 1.324 1.297 1.298 1.279 1.270 1.291 1.285 1.297 1.286 15.553
Pensions 2.373 2.373 2.373 2.373 2.373 2.373 2.450 2.450 2.450 2.450 2.450 6.550 33.037
Other Fringe Benefits 2.033 0.890 1.865 0.884 0.910 1.836 0.918 0.904 1.825 0.881 0.860 1.949 15.755
Reimbursable Overhead 0.000 0.000 0.000 0.000 0.000 0.000 0.000 0.000 0.000 0.000 0.000 0.000 0.000Total Labor Expenses $20.831 $18.974 $20.329 $18.898 $19.305 $19.844 $19.491 $19.258 $19.743 $18.902 $18.565 $26.276 $240.416
Non-Labor:
Electric Power $0.702 $0.702 $0.702 $0.702 $0.702 $0.702 $0.702 $0.702 $0.702 $0.702 $0.702 $0.702 $8.428
Fuel 0.342 0.320 0.444 0.221 0.168 0.230 0.059 0.089 0.137 0.180 0.204 0.543 2.936
Insurance 0.582 0.582 0.582 0.582 0.582 0.582 0.582 0.582 0.582 0.582 0.582 1.061 7.460
Claims 0.000 0.000 0.000 0.000 0.000 0.000 0.000 0.000 0.000 0.000 0.000 0.000 0.000
Paratransit Service Contracts 0.000 0.000 0.000 0.000 0.000 0.000 0.000 0.000 0.000 0.000 0.000 0.000 0.000
Maintenance and Other Operating Contracts 4.917 5.428 8.411 4.938 6.874 11.649 6.500 9.035 11.028 7.710 7.315 20.202 104.007
Professional Service Contracts 1.950 1.950 2.303 1.950 1.950 2.303 1.950 1.950 2.303 1.950 1.950 3.555 26.067
Materials & Supplies 0.347 0.347 0.350 0.347 0.347 0.347 0.347 0.347 0.347 0.347 0.347 0.399 4.220
Other Business Expenses 1.799 1.663 2.041 2.029 1.795 2.278 2.117 2.182 2.177 1.921 1.967 4.208 26.178Total Non-Labor Expenses $10.640 $10.992 $14.832 $10.770 $12.418 $18.091 $12.257 $14.887 $17.276 $13.393 $13.068 $30.672 $179.296
Other Expenses Adjustments:
Other $0.000 $0.000 $0.000 $0.000 $0.000 $0.000 $0.000 $0.000 $0.000 $0.000 $0.000 $0.000 $0.000Total Other Expense Adjustments $0.000 $0.000 $0.000 $0.000 $0.000 $0.000 $0.000 $0.000 $0.000 $0.000 $0.000 $0.000 $0.000
Total Expenses before Non-Cash Liability Adjs. $31.471 $29.966 $35.162 $29.667 $31.723 $37.935 $31.747 $34.145 $37.019 $32.295 $31.633 $56.947 $419.711
Add: Depreciation 7.494 7.494 7.494 7.494 7.494 7.494 7.494 7.494 7.494 7.494 7.494 7.494 89.928
Add: OPEB Obligation 4.956 4.956 4.956 4.956 4.956 4.956 4.956 4.956 4.956 4.956 4.956 4.956 59.475
Total Expenses $43.921 $42.417 $47.612 $42.118 $44.173 $50.385 $44.198 $46.596 $49.469 $44.745 $44.083 $69.398 $569.114
Less: Depreciation (7.494) (7.494) (7.494) (7.494) (7.494) (7.494) (7.494) (7.494) (7.494) (7.494) (7.494) (7.494) (89.928)
Less: OPEB Obligation (4.956) (4.956) (4.956) (4.956) (4.956) (4.956) (4.956) (4.956) (4.956) (4.956) (4.956) (4.956) (59.475)
Total Expenses $31.471 $29.966 $35.162 $29.667 $31.723 $37.935 $31.747 $34.145 $37.019 $32.295 $31.633 $56.947 $419.711
Net Income/(Deficit) $82.754 $78.733 $93.978 $97.885 $104.723 $98.002 $106.403 $103.422 $92.110 $100.294 $94.684 $66.619 $1,119.607
($ in millions)
MTA BRIDGES AND TUNNELSFebruary Financial Plan - 2012 Adopted BudgetAccrual Statement of Operations by Category

NON-REIMBURSABLE/ REIMBURSABLE
(Page 2 of 2)
Jan Feb Mar Apr May Jun Jul Aug Sep Oct Nov Dec Total
Baseline Net Income/(Deficit) $82.754 $78.733 $93.978 $97.885 $104.723 $98.002 $106.403 $103.422 $92.110 $100.294 $94.684 $66.619 $1,119.607
Deductions from Income:
Less: Capitalized Assets $1.614 $1.614 $1.614 $1.614 $1.614 $1.614 $1.614 $1.614 $1.614 $1.614 $1.614 $1.614 $19.370
Reserves 1.212 1.212 1.212 1.212 1.212 1.212 1.212 1.212 1.212 1.212 1.212 1.212 14.548
GASB Reserve 0.000 0.000 0.000 0.000 0.000 0.000 0.000 0.000 0.000 0.000 0.000 1.927 1.927
Adjusted Baseline Net Income/(Deficit) $79.927 $75.907 $91.152 $95.058 $101.896 $95.175 $103.576 $100.596 $89.283 $97.468 $91.858 $61.865 $1,083.762
Less: Debt Service 51.613 51.613 51.613 51.613 51.613 51.613 51.613 51.613 51.613 51.613 51.613 51.613 619.352
Income Available for Distribution $28.314 $24.294 $39.539 $43.445 $50.284 $43.563 $51.964 $48.983 $37.670 $45.855 $40.245 $10.253 $464.410
Distributable To:
MTA - Investment Income $0.009 $0.009 $0.009 $0.009 $0.009 $0.009 $0.009 $0.009 $0.009 $0.009 $0.009 $0.009 $0.108
MTA - Distributable Income 19.181 17.171 24.793 26.746 30.165 26.805 31.005 29.515 23.859 27.951 25.146 10.150 292.488
NYCT - Distributable Income 9.125 7.115 14.737 16.690 20.109 16.749 20.949 19.459 13.803 17.895 15.090 0.094 171.814
Total Distributable Income: $28.314 $24.294 $39.539 $43.445 $50.284 $43.563 $51.964 $48.983 $37.670 $45.855 $40.245 $10.253 $464.410
Cash Transfers:
MTA - Investment Income $0.000 $0.126 $0.000 $0.000 $0.000 $0.000 $0.000 $0.000 $0.000 $0.000 $0.000 $0.000 $0.126
MTA - Transfers 0.000 48.578 15.454 22.314 24.072 27.149 24.125 27.905 26.564 21.473 25.156 31.767 294.555
NYCT - Transfers 0.000 26.477 6.403 13.263 15.021 18.098 15.074 18.854 17.513 12.422 16.105 13.665 172.897
Total Cash Transfers: $0.000 $75.181 $21.857 $35.577 $39.093 $45.247 $39.198 $46.759 $44.076 $33.895 $41.261 $45.432 $467.578
SUPPORT TO MASS TRANSIT:
Total Revenues $114.225 $108.700 $129.140 $127.552 $136.446 $135.936 $138.150 $137.568 $129.128 $132.589 $126.317 $123.566 $1,539.318
Less: Net Operating Expenses 31.471 29.966 35.162 29.667 31.723 37.935 31.747 34.145 37.019 32.295 31.633 56.947 419.711
Net Operating Income: $82.754 $78.733 $93.978 $97.885 $104.723 $98.002 $106.403 $103.422 $92.110 $100.294 $94.684 $66.619 $1,119.607
Deductions from Operating Income:
B&T Debt Service $18.938 $18.938 $18.938 $18.938 $18.938 $18.938 $18.938 $18.938 $18.938 $18.938 $18.938 $18.938 $227.252
Capitalized Assets 1.614 1.614 1.614 1.614 1.614 1.614 1.614 1.614 1.614 1.614 1.614 1.614 19.370
Reserves 1.212 1.212 1.212 1.212 1.212 1.212 1.212 1.212 1.212 1.212 1.212 1.212 14.548
GASB Reserve 0.000 0.000 0.000 0.000 0.000 0.000 0.000 0.000 0.000 0.000 0.000 1.927 1.927
Total Deductions from Operating Income $21.764 $21.764 $21.764 $21.764 $21.764 $21.764 $21.764 $21.764 $21.764 $21.764 $21.764 $23.691 $263.097
Total Support to Mass Transit: $60.989 $56.969 $72.214 $76.120 $82.959 $76.238 $84.639 $81.658 $70.345 $78.530 $72.920 $42.928 $856.510
MTA BRIDGES AND TUNNELSFebruary Financial Plan - 2012 Adopted BudgetAccrual Statement of Operations by Category
($ in millions)

MTA Bridges TunnelsFebruary Financial Plan - 2012 Adopted Budget
Overtime - Non-Reimbursable/Reimbursable Basis($ in millions)
NON-REIMBURSABLE Jan$ $ $ $ $ $ $ $ $ $ $ $ $
OPERATIONS & MAINTENANCESCHEDULED:
Direct Service - Operations & Maintenance $0.231 $0.231 $0.231 $0.231 $0.231 $0.231 $0.231 $0.231 $0.231 $0.231 $0.231 $0.231 $2.770
Programmed Maintenance
Total Scheduled $0.231 $0.231 $0.231 $0.231 $0.231 $0.231 $0.231 $0.231 $0.231 $0.231 $0.231 $0.231 $2.770
UNSCHEDULED:Operations & Maintenance:
Vacancy/Absentee Coverage $0.845 $0.968 $0.844 $0.757 $0.790 $0.725 $0.687 $0.682 $0.591 $0.574 $0.568 $0.732 $8.762
Weather Emergencies 0.275 0.312 0.183 0.021 0.000 0.000 0.000 0.000 0.000 0.000 0.054 0.198 1.043
Maintenance 0.085 0.093 0.088 0.113 0.114 0.116 0.117 0.116 0.118 0.119 0.084 0.091 1.253
Service Delays 0.073 0.058 0.046 0.051 0.072 0.045 0.056 0.038 0.043 0.034 0.039 0.033 0.590
Emergencies 0.009 0.012 0.008 0.013 0.015 0.010 0.013 0.012 0.007 0.007 0.005 0.009 0.121
Tour Length 0.004 0.004 0.003 0.003 0.003 0.003 0.003 0.003 0.002 0.002 0.002 0.003 0.037
Safety/Security/Law Enforcement 0.187 0.198 0.202 0.195 0.203 0.208 0.212 0.216 0.207 0.215 0.202 0.182 2.427
All Other Operations & Maintenance 0.075 0.081 0.081 0.151 0.180 0.151 0.156 0.156 0.189 0.152 0.146 0.081 1.600
All Other Departments 0.180 0.194 0.174 0.161 0.167 0.158 0.157 0.155 0.149 0.143 0.144 0.156 1.937
Total Unscheduled 1.731 1.920 1.630 1.466 1.544 1.415 1.402 1.378 1.308 1.246 1.245 1.486 17.770
TOTAL NON-REIMBURSABLE OVERTIME: $1.962 $2.151 $1.860 $1.697 $1.775 $1.646 $1.633 $1.609 $1.538 $1.477 $1.476 $1.717 $20.540
REIMBURSABLE OVERTIME 0.017 0.017 0.017 0.017 0.017 0.017 0.017 0.017 0.017 0.017 0.017 0.017 0.202
TOTAL NR & R OVERTIME $1.979 $2.168 $1.877 $1.714 $1.792 $1.663 $1.650 $1.626 $1.555 $1.494 $1.493 $1.733 $20.742
Numbers may not add due to rounding
Aug Sep Oct Nov Dec TotalFeb Mar Apr May Jun Jul

Jan Feb Mar Apr May Jun Jul Aug Sep Oct Nov Dec Total
Traffic Volume 21.224 20.181 23.998 23.722 25.333 25.372 25.663 25.549 24.014 24.812 23.545 23.028 286.442
Toll Revenue $111.898 $106.411 $126.693 $125.239 $133.743 $133.612 $135.742 $135.151 $126.715 $130.161 $123.933 $121.197 $1,510.495
MTA BRIDGES AND TUNNELSFebruary Financial Plan - 2012 Adopted Budget
Traffic Volume /(Utilization)(in millions)

Jan Feb Mar Apr May Jun Jul Aug Sep Oct Nov DecAdministration
Executive 2 2 2 2 2 2 2 2 2 2 2 2Law 7 7 7 7 7 7 7 7 7 7 7 7CFO (1) 27 27 27 27 27 27 27 27 27 18 18 18Labor Relations 5 5 5 5 5 5 5 5 5 5 5 5Staff Services (2) 31 31 31 31 31 31 31 31 31 17 17 17EEO 1 1 1 1 1 1 1 1 1 1 1 1
Total Administration 73 73 73 73 73 73 73 73 73 50 50 50
OperationsRevenue Management 41 41 41 41 41 41 41 41 41 41 41 41Operations (Non-Security) 728 728 728 728 728 728 728 728 728 728 728 728
Total Operations 769 769 769 769 769 769 769 769 769 769 769 769
MaintenanceMaintenance 168 168 168 168 168 168 168 168 168 168 168 168Operations - Maintainers 170 170 170 170 170 170 170 170 170 170 170 170Technology 56 56 56 56 56 56 56 56 56 52 52 52Internal Security - Tech Svcs 8 8 8 8 8 8 8 8 8 8 8 8
Total Maintenance 402 402 402 402 402 402 402 402 402 398 398 398
Engineering/CapitalEngineering & Construction 128 128 128 128 128 128 128 128 128 128 128 128Health & Safety 8 8 8 8 8 8 8 8 8 8 8 8Planning & Budget Capital 12 12 12 12 12 12 12 12 12 12 12 12
Total Engineering/Capital 148 148 148 148 148 148 148 148 148 148 148 148
Public SafetyOperations (Security) 236 236 236 236 236 236 236 236 236 236 236 236Internal Security - Operations 38 38 38 38 38 38 38 38 38 38 38 38
Total Public Safety 274 274 274 274 274 274 274 274 274 274 274 274
Total Positions 1,666 1,666 1,666 1,666 1,666 1,666 1,666 1,666 1,666 1,639 1,639 1,639
Non-Reimbursable 1,622 1,622 1,622 1,622 1,622 1,622 1,622 1,622 1,622 1,595 1,595 1,595Reimbursable 44 44 44 44 44 44 44 44 44 44 44 44
Total Full-Time 1,666 1,666 1,666 1,666 1,666 1,666 1,666 1,666 1,666 1,639 1,639 1,639Total Full-Time Equivalents - - - - - - - - - - - -
(1) Includes Capital Accounting, General Accounting, Payroll and Operating Budget staff.(2) Includes Human Resources and Administration staff.
MTA BRIDGES & TUNNELSFebruary Financial Plan - 2012 Adopted Budget
Total Positions by Function and DepartmentNon-Reimbursable/Reimbursable and Full-time/Full-time Equivalents
FUNCTION/DEPARTMENT

FUNCTION/OCCUPATION Jan Feb Mar Apr May Jun Jul Aug Sep Oct Nov Dec
Administration Managers/Supervisors 29 29 29 29 29 29 29 29 29 21 21 21 Professional, Technical, Clerical 44 44 44 44 44 44 44 44 44 29 29 29 Operational Hourlies - - - - - - - - - - - -
Total Administration 73 73 73 73 73 73 73 73 73 50 50 50
Operations Managers/Supervisors 48 48 48 48 48 48 48 48 48 48 48 48 Professional, Technical, Clerical 42 42 42 42 42 42 42 42 42 42 42 42 Operational Hourlies(1) 679 679 679 679 679 679 679 679 679 679 679 679
Total Operations 769 769 769 769 769 769 769 769 769 769 769 769
Maintenance Managers/Supervisors 33 33 33 33 33 33 33 33 33 31 31 31 Professional, Technical, Clerical 56 56 56 56 56 56 56 56 56 54 54 54 Operational Hourlies(2) 313 313 313 313 313 313 313 313 313 313 313 313
Total Maintenance 402 402 402 402 402 402 402 402 402 398 398 398
Engineering/Capital Managers/Supervisors 31 31 31 31 31 31 31 31 31 31 31 31 Professional, Technical, Clerical 117 117 117 117 117 117 117 117 117 117 117 117 Operational Hourlies - - - - - - - - - - - -
Total Engineering/Capital 148 148 148 148 148 148 148 148 148 148 148 148
Public Safety Managers/Supervisors 9 9 9 9 9 9 9 9 9 9 9 9 Professional, Technical, Clerical 28 28 28 28 28 28 28 28 28 28 28 28 Operational Hourlies(3) 237 237 237 237 237 237 237 237 237 237 237 237
Total Public Safety 274 274 274 274 274 274 274 274 274 274 274 274
Total Positions Managers/Supervisors 150 150 150 150 150 150 150 150 150 140 140 140 Professional, Technical, Clerical 287 287 287 287 287 287 287 287 287 270 270 270 Operational Hourlies 1,229 1,229 1,229 1,229 1,229 1,229 1,229 1,229 1,229 1,229 1,229 1,229
Total Positions 1,666 1,666 1,666 1,666 1,666 1,666 1,666 1,666 1,666 1,639 1,639 1,639
(1) Represents Bridge and Tunnel Officers, Sergeants and Lieutenants. These positions are paid annually, not hourly.(2) Represents Maintenance personnel. These positions are paid annually, not hourly.(3) Represents Bridge and Tunnel Officers, Sergeants and Lieutenants performing public safety. These positions are paid annually, not hourly.
MTA BRIDGES AND TUNNELSFebruary Financial Plan - 2012 Adopted Budget
Total Positions by Function and Occupation

[THIS PAGE INTENTIONALLY LEFT BLANK]

Capital Construction Company

MTA CAPITAL CONSTRUCTION FEBRUARY FINANCIAL PLAN FOR 2012-2015
2011 FINAL ESTIMATE AND 2012 ADOPTED BUDGET In accordance with MTA approved budget procedures, the following information presents MTA Capital Construction’s 2011 Final Estimate, 2012 Adopted Budget and the Financial Plan for 2012-2015. The Adopted Budget reflects the inclusion of MTA Adjustments that were presented in the November Financial Plan, which was adopted by the Board in December 2011, as well as other technical adjustments. These adjustments, which are fully reimbursable, are presented on the attached reconciliations from the November Financial Plan and are described below:
Adjusted labor inflation assumptions reflect 2.20% in 2012, 1.97% in 2013, 1.91% in 2014, and 1.85% in 2015.
Effective 2012, the non-labor account structure of the MTA standard chart of accounts has been adjusted to reflect the reclassification and renaming of certain accounts in order to improve account reporting consistency among the Agencies. These changes, which affect most non-labor accounts presented on the attached tables, result in no net-impact to the bottom line. In order to maintain comparability with 2011 actual results for year-end reporting purposes, the 2011 account structure remains unchanged.
This submission also includes schedules detailing the monthly allocation of financial, headcount and utilization data based on the 2012 Adopted Budget for the purpose of reporting actual results on a monthly basis to the Board.

Positions Dollars Positions Dollars Positions Dollars Positions Dollars Positions Dollars
2011 November Financial Plan: Baseline Surplus/(Deficit) 140 $0.000 140 $0.000 140 $0.000 140 $0.000 140 $0.000
Technical Adjustments:Wage Inflator Adjustments 0.000 0.004 0.042 0.079 0.097
Sub-Total Technical Adjustments 0 $0.000 0 $0.004 0 $0.042 0 $0.079 0 $0.097
MTA Plan Adjustments:
Labor: 3 Zeros Salary/Wage Initiative Accelerate 3 Zeros New MTA EfficienciesEnergy/Other Reimbursements
Sub-Total MTA Plan Adjustments 0 $0.000 0 $0.000 0 $0.000 0 $0.000 0 $0.000
Total Adjustments 0 $0.000 0 $0.004 0 $0.042 0 $0.079 0 $0.097
Total Revenue offset 0 $0.000 0 ($0.004) 0 ($0.042) 0 ($0.079) 0 ($0.097)
2012 February Financial Plan: Baseline Surplus/(Deficit) 140 $0.000 140 $0.000 140 $0.000 140 $0.000 140 $0.000
MTA CAPITAL CONSTRUCTIONFebruary Financial Plan 2012 - 2015
Reconciliation to the November Plan (Accrual) Reimbursable($ in millions)
Favorable/(Unfavorable)2011 2012 2013 2014 2015

Positions Dollars Positions Dollars Positions Dollars Positions Dollars Positions Dollars
2011 November Financial Plan: Baseline Surplus/(Deficit) 140 $0.000 140 $0.000 140 $0.000 140 $0.000 140 $0.000
Technical Adjustments:Wage Inflator Adjustments 0.000 0.004 0.042 0.079 0.097
Sub-Total Technical Adjustments 0 $0.000 0 $0.004 0 $0.042 0 $0.079 0 $0.097
MTA Plan Adjustments:
Labor: 3 Zeros Salary/Wage Initiative Accelerate 3 Zeros New MTA EfficienciesEnergy/Other Reimbursements
Sub-Total MTA Plan Adjustments 0 $0.000 0 $0.000 0 $0.000 0 $0.000 0 $0.000
Total Adjustments 0 $0.000 0 $0.004 0 $0.042 0 $0.079 0 $0.097
Total Revenue offset 0 $0.000 0 ($0.004) 0 ($0.042) 0 ($0.079) 0 ($0.097)
2012 February Financial Plan: Baseline Surplus/(Deficit) 140 $0.000 140 $0.000 140 $0.000 140 $0.000 140 $0.000
2015
MTA CAPITAL CONSTRUCTIONFebruary Financial Plan 2012 - 2015
Reconciliation to the November Plan (Cash) ($ in millions)
Favorable/(Unfavorable)2011 2012 2013 2014

REIMBURSABLE Final February Proposed New MTA Energy/ New All Adopted
Budget Labor Efficiencies Other Reimb. COA Other Budget
Revenue
Fare Revenue $0.000 $0.000
Toll Revenue
Other Operating Revenue
Capital and Other Reimbursements 30.998 (0.005) 30.993
Total Revenue $30.998 ($0.005) $0.000 $0.000 $0.000 $0.000 $30.993
Expenses
Labor:
Payroll $15.054 ($0.002) $15.052
Overtime
Health and Welfare 2.787 2.787
OPEB Current Payment
Pensions 2.648 (0.001) 2.647
Other Fringe Benefits 5.299 (0.001) 5.298
Reimbursable Overhead
Total Labor Expenses $25.788 ($0.005) $0.000 $0.000 $0.000 $0.000 $25.783
Non-Labor:
Electric Power $0.000 $0.000 $0.000 0.000 0.000 0.000 $0.000
Fuel 0.000 0.000 0.000 0.000 0.000 0.000 0.000
Insurance 0.186 0.186
Claims
Paratransit Service Contracts
Maintenance and Other Operating Contracts
Professional Service Contracts 4.481 4.481
Materials & Supplies 0.043 0.043
Other Business Expenses 0.500 0.500
Total Non-Labor Expenses $5.210 $0.000 $0.000 $0.000 $0.000 $0.000 $5.210
Other Expense Adjustments:
Other $0.000 $0.000
Total Other Expense Adjustments $0.000 $0.000 $0.000 $0.000 $0.000 $0.000 $0.000
Total Expenses before Depreciation $30.998 ($0.005) $0.000 $0.000 $0.000 $0.000 $30.993
Depreciation $0.000 $0.000
Total Expenses $30.998 ($0.005) $0.000 $0.000 $0.000 $0.000 $30.993
Net Surplus/(Deficit) $0.000 $0.000 $0.000 $0.000 $0.000 $0.000 $0.000
MTA Capital Construction
2012 February Adopted Budget
Reconciliation to the 2012 Final Proposed Budget vs. 2012 Adopted Budget by Generic Category (Accrual and Cash)
($ in millions)
2012
MTA Plan Adjustments

CASH RECEIPTS AND EXPENDITURES Final February Proposed New MTA Energy/ New All Adopted
Budget Labor Efficiencies Other Reimb. COA Other Budget
Receipts
Fare Revenue $0.000 $0.000
Toll Revenue
Other Operating Revenue:
Capital and Other Reimbursements 30.998 (0.005) 30.993
Total Receipts $30.998 ($0.005) $0.000 $0.000 $0.000 $0.000 $30.993
Expenditures
Labor:
Payroll $15.054 ($0.002) $15.052
Overtime
Health and Welfare 2.787 2.787
OPEB Current Payment
Pensions 2.648 (0.001) 2.647
Other Fringe Benefits 5.299 (0.001) 5.298
Reimbursable Overhead
Total Labor Expenditures $25.788 ($0.005) $0.000 $0.000 $0.000 $0.000 $25.783
Non-Labor:
Electric Power $0.000 $0.000 $0.000 $0.000 $0.000 $0.000 $0.000
Fuel 0.000 0.000 0.000 0.000 0.000 0.000 0.000
Insurance 0.186 0.186
Claims
Paratransit Service Contracts
Maintenance and Other Operating Contracts
Professional Service Contracts 4.481 4.481
Materials & Supplies 0.043 0.043
Other Business Expenditures 0.500 0.500
Total Non-Labor Expenditures $5.210 $0.000 $0.000 $0.000 $0.000 $0.000 $5.210
Other Expenditure Adjustments:
Other - Restricted Cash Adjustment $0.000 $0.000
Total Other Expenditure Adjustments $0.000 $0.000 $0.000 $0.000 $0.000 $0.000 $0.000
Total Expenditures $30.998 ($0.005) $0.000 $0.000 $0.000 $0.000 $30.993
Net Cash Deficit $0.000 $0.000 $0.000 $0.000 $0.000 $0.000 $0.000
MTA Capital Construction
2012 February Adopted Budget
Reconciliation to the 2012 Final Proposed Budget vs. 2012 Adopted Budget by Generic Category (Accrual and Cash)
($ in millions)
2012
MTA Plan Adjustments

REIMBURSABLE2011 2012Final Adopted
Estimate* Budget 2013 2014 2015
Revenue
Fare Revenue $0.000 $0.000 $0.000 $0.000 $0.000
Toll Revenue
Other Operating Revenue
Capital and Other Reimbursements 32.823 30.993 31.767 32.493 32.386
Total Revenue $32.823 $30.993 $31.767 $32.493 $32.386
Expenses
Labor:
Payroll $15.455 $15.052 $15.363 $15.661 $15.955
Overtime
Health and Welfare 2.682 2.787 2.901 3.184 3.433
OPEB Current Payment
Pensions 2.216 2.647 2.735 2.833 2.924
Other Fringe Benefits 5.211 5.298 5.461 5.540 5.664
Reimbursable Overhead
Total Labor Expenses $25.564 $25.783 $26.461 $27.217 $27.976
Non-Labor:
Electric Power $0.000 $0.000 $0.000 $0.000 $0.000
Fuel - - - - -
Insurance 0.300 0.186 0.204 0.225 0.247
Claims
Paratransit Service Contracts
Maintenance and Other Operating Contracts
Professional Service Contracts 5.275 4.481 4.549 4.488 3.588
Materials & Supplies 0.043 0.043 0.044 0.045 0.046
Other Business Expenses 1.642 0.500 0.509 0.519 0.530
Total Non-Labor Expenses $7.259 $5.210 $5.306 $5.276 $4.410
Other Expense Adjustments:
Other $0.000 $0.000 $0.000 $0.000 $0.000
Total Other Expense Adjustments $0.000 $0.000 $0.000 $0.000 $0.000
Total Expenses Before Depreciation $32.823 $30.993 $31.767 $32.493 $32.386
Depreciation $0.000 $0.000 $0.000 $0.000 $0.000
Total Expenses $32.823 $30.993 $31.767 $32.493 $32.386
Baseline Surplus/(Deficit) $0.000 $0.000 $0.000 $0.000 $0.000
MTA CAPITAL CONSTRUCTIONFebruary Financial Plan 2012 - 2015
Accrual Statement of Operations by Category($ in millions)
*Effective 2012, the non-labor account structure of the MTA standard chart of accounts has been adjusted to reflect the reclassification and renaming of certain accounts in order to improve account reporting consistency among the Agencies. These changes, which affect most non-labor accounts presented on the attached tables, result in no net-impact to the bottom line. In order to maintain comparability with 2011 actual results for year-end reporting purposes, the 2011 account structure remains unchanged.

CASH RECEIPTS AND EXPENDITURES
2011 2012
Final Adopted
Estimate* Budget 2013 2014 2015
Receipts
Farebox Revenue $0.000 $0.000 $0.000 $0.000 $0.000
Toll Revenue
Other Operating Revenue
Capital and Other Reimbursements 32.823 30.993 31.767 32.493 32.386
Total Receipts $32.823 $30.993 $31.767 $32.493 $32.386
Expenditures
Labor:
Payroll $15.455 $15.052 $15.363 $15.661 $15.955
Overtime
Health and Welfare 2.682 2.787 2.901 3.184 3.433
OPEB Current Payment
Pensions 2.216 2.647 2.735 2.833 2.924
Other Fringe Benefits 5.211 5.298 5.461 5.540 5.664
Reimbursable Overhead
Total Labor Expenditures $25.564 $25.783 $26.461 $27.217 $27.976
Non-Labor:
Electric Power $0.000 $0.000 $0.000 $0.000 $0.000
Fuel - - - - -
Insurance 0.300 0.186 0.204 0.225 0.247
Claims
Paratransit Service Contracts
Maintenance and Other Operating Contracts
Professional Service Contracts 5.275 4.481 4.549 4.488 3.588
Materials & Supplies 0.043 0.043 0.044 0.045 0.046
Other Business Expenditures 1.642 0.500 0.509 0.519 0.530
Total Non-Labor Expenditures $7.259 $5.210 $5.306 $5.276 $4.410
Other Expenditure Adjustments:
Other - Restricted Cash Adjustment $0.000 $0.000 $0.000 $0.000 $0.000
Total Other Expenditure Adjustments $0.000 $0.000 $0.000 $0.000 $0.000
Total Expenditures $32.823 $30.993 $31.767 $32.493 $32.386
Baseline Cash Surplus/(Deficit) $0.000 $0.000 $0.000 $0.000 $0.000
MTA CAPITAL CONSTRUCTIONFebruary Financial Plan 2012 - 2015
Cash Receipts & Expenditures($ in millions)
*Effective 2012, the non-labor account structure of the MTA standard chart of accounts has been adjusted to reflect the reclassification and renaming of certain accounts in order to improve account reporting consistency among the Agencies. These changes, which affect most non-labor accounts presented on the attached tables, result in no net-impact to the bottom line. In order to maintain comparability with 2011 actual results for year-end reporting purposes, the 2011 account structure remains unchanged.

CASH FLOW ADJUSTMENTS
2011 2012
Final Adopted
Estimate* Budget 2013 2014 2015
Receipts
Fare Revenue $0.000 $0.000 $0.000 $0.000 $0.000
Toll Revenue
Other Operating Revenue
Capital and Other Reimbursements - - - - -
Total Receipt Adjustments $0.000 $0.000 $0.000 $0.000 $0.000
Expenditures
Labor:
Payroll $0.000 $0.000 $0.000 $0.000 $0.000
Overtime
Health and Welfare - - - - -
OPEB Current Payment
Pensions - - - - -
Other Fringe Benefits - - - - -
Reimbursable Overhead Total Labor Expenditures $0.000 $0.000 $0.000 $0.000 $0.000
Non-Labor:
Electric Power $0.000 $0.000 $0.000 $0.000 $0.000
Fuel - - - - -
Insurance - - - - -
Claims
Paratransit Service Contracts
Maintenance and Other Operating Contracts
Professional Service Contracts - - - - -
Materials & Supplies - - - - -
Other Business Expenditures - - - - - Total Non-Labor Expenditures $0.000 $0.000 $0.000 $0.000 $0.000
Other Expenditures Adjustments:
Other $0.000 $0.000 $0.000 $0.000 $0.000Total Other Expenditures Adjustments $0.000 $0.000 $0.000 $0.000 $0.000
Baseline Total Cash Conversion Adjustments $0.000 $0.000 $0.000 $0.000 $0.000
MTA CAPITAL CONSTRUCTIONFebruary Financial Plan 2012 - 2015
*Effective 2012, the non-labor account structure of the MTA standard chart of accounts has been adjusted to reflect the reclassification and renaming of certain accounts in order to improve account reporting consistency among the Agencies. These changes, which affect most non-labor accounts presented on the attached tables, result in no net-impact to the bottom line. In order to maintain comparability with 2011 actual results for year-end reporting purposes, the 2011 account structure remains unchanged.
Cash Conversion (Cash Flow Adjustments)($ in millions)

2011 2012Final Adopted
Estimate Budget 2013 2014 2015
AdministrationMTACC 41 41 41 41 41
Engineering/CapitalMTACC 14 14 14 14 14
East Side Access 23 23 23 23 23
Second Avenue Subway 18 18 18 18 18
Security Program 14 14 14 14 14
Lower Manhattan Projects 18 18 18 18 18
7 Line Extension 12 12 12 12 12
Total Engineering/Capital 99 99 99 99 99
Total Baseline Positions 140 140 140 140 140
Non-Reimbursable - - - - -
Reimbursable 140 140 140 140 140
Total Full-Time 140 140 140 140 140
Total Full-Time Equivalents - - - - -
MTA CAPITAL CONSTRUCTIONFebruary Financial Plan 2012 - 2015
Non-Reimbursable/Reimbursable and Full-Time/Full-Time Equivalents
Function/Department
Total Positions by Function and Department

2011 2012
Final Adopted
Estimate Budget 2013 2014 2015
Administration Managers/Supervisors Professional, Technical, Clerical 41 41 41 41 41 Operational Hourlies
Total Administration 41 41 41 41 41
Operations Managers/Supervisors Professional, Technical, Clerical Operational Hourlies
Total Operations - - - - -
Maintenance Managers/Supervisors Professional, Technical, Clerical Operational Hourlies
Total Maintenance - - - - -
Engineering/Capital Managers/Supervisors Professional, Technical, Clerical 99 99 99 99 99 Operational Hourlies
Total Engineering/Capital 99 99 99 99 99
Public Safety Managers/Supervisors Professional, Technical, Clerical Operational Hourlies
Total Public Safety - - - - -
Total Managers/Supervisors Professional, Technical, Clerical 140 140 140 140 140 Operational Hourlies
Baseline Total Positions 140 140 140 140 140
Function/Occupational Group
MTA CAPITAL CONSTRUCTIONFebruary Financial Plan 2012 - 2015
Total Positions by Function and Occupation

REIMBURSABLE
Jan Feb Mar Apr May Jun Jul Aug Sep Oct Nov Dec Total
Operating Revenue
Farebox Revenue $0.000 $0.000 $0.000 $0.000 $0.000 $0.000 $0.000 $0.000 $0.000 $0.000 $0.000 $0.000 $0.000
Toll Revenue
Other Operating Revenue
Capital and Other Reimbursements 2.142 2.216 2.244 3.206 2.301 2.341 2.729 2.564 3.556 2.559 2.560 2.577 30.993 Total Revenue $2.142 $2.216 $2.244 $3.206 $2.301 $2.341 $2.729 $2.564 $3.556 $2.559 $2.560 $2.577 $30.993
Operating Expenses
Labor:
Payroll $1.007 $1.049 $1.067 $1.627 $1.103 $1.124 $1.244 $1.245 $1.832 $1.250 $1.252 $1.250 $15.052
Overtime
Health and Welfare 0.186 0.194 0.197 0.305 0.204 0.207 0.230 0.230 0.343 0.231 0.231 0.231 2.787
OPEB Current Payment
Pensions 0.177 0.184 0.188 0.287 0.194 0.198 0.219 0.219 0.323 0.220 0.220 0.220 2.647
Other Fringe Benefits 0.355 0.370 0.376 0.573 0.389 0.396 0.438 0.439 0.644 0.439 0.439 0.440 5.298
Reimbursable Overhead Total Labor Expenses $1.725 $1.797 $1.827 $2.792 $1.889 $1.926 $2.131 $2.133 $3.141 $2.140 $2.142 $2.141 $25.783
Non-Labor:
Electric Power $0.000 $0.000 $0.000 $0.000 $0.000 $0.000 $0.000 $0.000 $0.000 $0.000 $0.000 $0.000 $0.000
Fuel - - - - - - - - - - - - -
Insurance - - - - - - 0.186 - - - - - 0.186
Claims
Paratransit Service Contracts
Maintenance and Other Operating Contracts
Professional Service Contracts 0.372 0.374 0.372 0.367 0.367 0.371 0.367 0.386 0.367 0.374 0.372 0.392 4.481
Materials & Supplies 0.004 0.004 0.004 0.004 0.004 0.004 0.004 0.004 0.004 0.004 0.004 0.004 0.043
Other Business Expenses 0.041 0.041 0.041 0.043 0.041 0.041 0.042 0.042 0.044 0.042 0.042 0.042 0.500Total Non-Labor Expenses $0.417 $0.419 $0.417 $0.414 $0.412 $0.416 $0.598 $0.431 $0.414 $0.419 $0.417 $0.437 $5.210
Other Expenses Adjustments:
Other $0.000 $0.000 $0.000 $0.000 $0.000 $0.000 $0.000 $0.000 $0.000 $0.000 $0.000 $0.000 $0.000Total Other Expense Adjustments $0.000 $0.000 $0.000 $0.000 $0.000 $0.000 $0.000 $0.000 $0.000 $0.000 $0.000 $0.000 $0.000
Total Expenses before Non-Cash Liability Adjs. $2.142 $2.216 $2.244 $3.206 $2.301 $2.341 $2.729 $2.564 $3.556 $2.559 $2.560 $2.577 $30.993
Depreciation $0.000 $0.000 $0.000 $0.000 $0.000 $0.000 $0.000 $0.000 $0.000 $0.000 $0.000 $0.000 $0.000
Total Expenses $2.142 $2.216 $2.244 $3.206 $2.301 $2.341 $2.729 $2.564 $3.556 $2.559 $2.560 $2.577 $30.993
Net Surplus/(Deficit) $0.000 $0.000 $0.000 $0.000 $0.000 $0.000 $0.000 $0.000 $0.000 $0.000 $0.000 $0.000 $0.000
MTA CAPITAL CONSTRUCTIONFebruary Financial Plan - 2012 Adopted Budget
Accrual Statement of Operations by Category
($ in millions)

CASH RECEIPTS AND EXPENDITURES
Jan Feb Mar Apr May Jun Jul Aug Sep Oct Nov Dec Total
Receipts
Farebox Revenue $0.000 $0.000 $0.000 $0.000 $0.000 $0.000 $0.000 $0.000 $0.000 $0.000 $0.000 $0.000 $0.000
Toll Revenue
Other Operating Revenue
Capital and Other Reimbursements 2.142 2.216 2.244 3.206 2.301 2.341 2.729 2.564 3.556 2.559 2.560 2.577 30.993Total Receipts $2.142 $2.216 $2.244 $3.206 $2.301 $2.341 $2.729 $2.564 $3.556 $2.559 $2.560 $2.577 $30.993
Expenditures
Labor:
Payroll $1.007 $1.049 $1.067 $1.627 $1.103 $1.124 $1.244 $1.245 $1.832 $1.250 $1.252 $1.250 $15.052
Overtime
Health and Welfare 0.186 0.194 0.197 0.305 0.204 0.207 0.230 0.230 0.343 0.231 0.231 0.231 2.787
OPEB Current Payment
Pensions 0.177 0.184 0.188 0.287 0.194 0.198 0.219 0.219 0.323 0.220 0.220 0.220 2.647
Other Fringe Benefits 0.355 0.370 0.376 0.573 0.389 0.396 0.438 0.439 0.644 0.439 0.439 0.440 5.298
Reimbursable Overhead Total Labor Expenditures $1.725 $1.797 $1.827 $2.792 $1.889 $1.926 $2.131 $2.133 $3.141 $2.140 $2.142 $2.141 $25.783
Non-Labor:
Electric Power $0.000 $0.000 $0.000 $0.000 $0.000 $0.000 $0.000 $0.000 $0.000 $0.000 $0.000 $0.000 $0.000
Fuel - - - - - - - - - - - - -
Insurance - - - - - - 0.186 - - - - - 0.186
Claims
Paratransit Service Contracts
Maintenance and Other Operating Contracts
Professional Service Contracts 0.372 0.374 0.372 0.367 0.367 0.371 0.367 0.386 0.367 0.374 0.372 0.392 4.481
Materials & Supplies 0.004 0.004 0.004 0.004 0.004 0.004 0.004 0.004 0.004 0.004 0.004 0.004 0.043
Other Business Expenses 0.041 0.041 0.041 0.043 0.041 0.041 0.042 0.042 0.044 0.042 0.042 0.042 0.500 Total Non-Labor Expenditures $0.417 $0.419 $0.417 $0.414 $0.412 $0.416 $0.598 $0.431 $0.414 $0.419 $0.417 $0.437 $5.210
Other Expenditure Adjustments:
Other - Restricted Cash Adjustment $0.000 $0.000 $0.000 $0.000 $0.000 $0.000 $0.000 $0.000 $0.000 $0.000 $0.000 $0.000 $0.000Total Other Expenditure Adjustments $0.000 $0.000 $0.000 $0.000 $0.000 $0.000 $0.000 $0.000 $0.000 $0.000 $0.000 $0.000 $0.000
Total Expenditures $2.142 $2.216 $2.244 $3.206 $2.301 $2.341 $2.729 $2.564 $3.556 $2.559 $2.560 $2.577 $30.993
Net Cash Deficit $0.000 $0.000 $0.000 $0.000 $0.000 $0.000 $0.000 $0.000 $0.000 $0.000 $0.000 $0.000 $0.000
MTA CAPITAL CONSTRUCTION
Cash Receipts & ExpendituresFebruary Financial Plan - 2012 Adopted Budget
($ in millions)

CASH FLOW ADJUSTMENTS
Jan Feb Mar Apr May Jun Jul Aug Sep Oct Nov Dec Total
Receipts
Farebox Revenue $0.000 $0.000 $0.000 $0.000 $0.000 $0.000 $0.000 $0.000 $0.000 $0.000 $0.000 $0.000 $0.000
Toll Revenue
Other Operating Revenue
Capital and Other Reimbursements - - - - - - - - - - - - - Total Receipts $0.000 $0.000 $0.000 $0.000 $0.000 $0.000 $0.000 $0.000 $0.000 $0.000 $0.000 $0.000 $0.000
Expenditures
Labor:
Payroll $0.000 $0.000 $0.000 $0.000 $0.000 $0.000 $0.000 $0.000 $0.000 $0.000 $0.000 $0.000 $0.000
Overtime
Health and Welfare - - - - - - - - - - - - -
OPEB Current Payment
Pensions - - - - - - - - - - - - -
Other Fringe Benefits - - - - - - - - - - - - -
Reimbursable Overhead Total Labor Expenditures $0.000 $0.000 $0.000 $0.000 $0.000 $0.000 $0.000 $0.000 $0.000 $0.000 $0.000 $0.000 $0.000
Non-Labor:
Electric Power $0.000 $0.000 $0.000 $0.000 $0.000 $0.000 $0.000 $0.000 $0.000 $0.000 $0.000 $0.000 $0.000
Fuel - - - - - - - - - - - - -
Insurance - - - - - - - - - - - - -
Claims
Paratransit Service Contracts
Maintenance and Other Operating Contracts
Professional Service Contracts - - - - - - - - - - - - -
Materials & Supplies - - - - - - - - - - - - -
Other Business Expenditures - - - - - - - - - - - - - Total Non-Labor Expenditures $0.000 $0.000 $0.000 $0.000 $0.000 $0.000 $0.000 $0.000 $0.000 $0.000 $0.000 $0.000 $0.000
Other Expenditures Adjustments:
Other $0.000 $0.000 $0.000 $0.000 $0.000 $0.000 $0.000 $0.000 $0.000 $0.000 $0.000 $0.000 $0.000Total Other Expenditures Adjustments $0.000 $0.000 $0.000 $0.000 $0.000 $0.000 $0.000 $0.000 $0.000 $0.000 $0.000 $0.000 $0.000
Total Cash Conversion Adjustments before Non-Cash Liability Adjs. $0.000 $0.000 $0.000 $0.000 $0.000 $0.000 $0.000 $0.000 $0.000 $0.000 $0.000 $0.000 $0.000
Depreciation Adjustment $0.000 $0.000 $0.000 $0.000 $0.000 $0.000 $0.000 $0.000 $0.000 $0.000 $0.000 $0.000 $0.000
Total Cash Conversion Adjustments $0.000 $0.000 $0.000 $0.000 $0.000 $0.000 $0.000 $0.000 $0.000 $0.000 $0.000 $0.000 $0.000
Cash Conversion (Cash Flow Adjustments)February Financial Plan - 2012 Adopted Budget
MTA CAPITAL CONSTRUCTION
($ in millions)

Jan Feb Mar Apr May Jun Jul Aug Sep Oct Nov Dec
AdministrationMTACC 32 36 38 38 39 39 41 41 41 41 41 41
Engineering/CapitalMTACC 14 14 14 14 14 14 14 14 14 14 14 14East Side Access 22 22 22 22 23 23 23 23 23 23 23 23Second Avenue Subway 16 16 17 17 17 18 18 18 18 18 18 18Security Program 11 11 11 12 12 13 14 14 14 14 14 14Lower Manhattan Projects 17 17 17 17 17 17 18 18 18 18 18 187 Line Extension 11 11 11 12 12 12 12 12 12 12 12 12
Total Engineering/Capital 91 91 92 94 95 97 99 99 99 99 99 99
Total Positions 123 127 130 132 134 136 140 140 140 140 140 140
Non-Reimbursable - - - - - - - - - - - - Reimbursable 123 127 130 132 134 136 140 140 140 140 140 140
Full-Time 123 127 130 132 134 136 140 140 140 140 140 140Full-Time Equivalents - - - - - - - - - - - -
FUNCTION/DEPARTMENT
MTA CAPITAL CONSTRUCTIONFebruary Financial Plan - 2012 Adopted Budget
Total Positions by Function and DepartmentNon-Reimbursable/Reimbursable and Full-Time/Full-Time Equivalents

FUNCTION/OCCUPATION Jan Feb Mar Apr May Jun Jul Aug Sep Oct Nov Dec
Administration Managers/Supervisors Professional, Technical, Clerical 32 36 38 38 39 39 41 41 41 41 41 41 Operational Hourlies
Total Administration 32 36 38 38 39 39 41 41 41 41 41 41
Operations Managers/Supervisors Professional, Technical, Clerical Operational Hourlies
Total Operations - - - - - - - - - - - -
Maintenance Managers/Supervisors Professional, Technical, Clerical Operational Hourlies
Total Maintenance - - - - - - - - - - - -
Engineering/Capital Managers/Supervisors Professional, Technical, Clerical 91 91 92 94 95 97 99 99 99 99 99 99 Operational Hourlies
Total Engineering/Capital 91 91 92 94 95 97 99 99 99 99 99 99
Public Safety Managers/Supervisors Professional, Technical, Clerical Operational Hourlies
Total Public Safety - - - - - - - - - - - -
Total Positions Managers/Supervisors Professional, Technical, Clerical 123 127 130 132 134 136 140 140 140 140 140 140 Operational Hourlies
Total Positions 123 127 130 132 134 136 140 140 140 140 140 140
MTA CAPITAL CONSTRUCTIONFebruary Financial Plan - 2012 Adopted Budget
Total Positions by Function and Occupation

[THIS PAGE INTENTIONALLY LEFT BLANK]

Long Island Bus

MTA LONG ISLAND BUS FEBRUARY FINANCIAL PLAN FOR 2012-2015
2011 FINAL ESTIMATE In accordance with MTA-approved budget procedures, the following information presents MTA Long Island Bus’ 2011 Final Estimate. The 2011 Final Estimate reflects the inclusion of MTA Adjustments that were presented in the November Financial Plan, which was adopted by the Board in December 2011. These adjustments are presented on the attached reconciliation from the November Financial Plan and are described below:
Fuel has decreased by $0.878 million due to the decline of revenue vehicle CNG price.
The impact of a third year wage freeze in 2011 for non-represented
employees is expected to reduce labor cost by $0.237 million in 2011.
Accelerated zero savings initiative for represented employees is expected to reduce labor cost by $1.018 million in 2011.
The Lease and Operating Agreement between Nassau County and LI Bus was terminated effective December 31, 2011. Nassau County contracted with a private operator to provide bus and paratransit service in the County commencing January 1, 2012. The February Financial Plan therefore reflects financial information through December 31, 2011 for Long Island Bus operations.

Positions Dollars Positions Dollars Positions Dollars Positions Dollars Positions Dollars
2011 November Financial Plan: Baseline Net Surplus/(Deficit) 1,033 ($88.866) 0 $0.000 0 $0.000 0 $0.000 0 $0.000
Technical Adjustments:
Sub-Total Technical Adjustments 0 $0.000 0 $0.000 0 $0.000 0 $0.000 0 $0.000
MTA Plan Adjustments:
Labor: 3 Zeros Salary/Wage Initiative 0.237$ Accelerate 3 Zeros 1.018 New MTA EfficienciesEnergy/Other Reimbursements 0.878
Sub-Total MTA Plan Adjustments 0 $2.133 0 $0.000 0 $0.000 0 $0.000 0 $0.000
2012 February Financial Plan: Baseline Net Surplus/(Deficit) 1,033 (86.733)$ 0 $0.000 0 $0.000 0 $0.000 0 $0.000
MTA LONG ISLAND BUS
2015
February Financial Plan 2012 - 2015Reconciliation to the November Plan (Accrual) Non-Reimbursable
($ in millions)
Favorable/(Unfavorable)2011 2012 2013 2014

Positions Dollars Positions Dollars Positions Dollars Positions Dollars Positions Dollars
2011 November Financial Plan: Baseline Net Surplus/(Deficit) 15 $0.000 0 $0.000 0 $0.000 0 $0.000 0 $0.000
Technical Adjustments:
Sub-Total Technical Adjustments 0 $0.000 0 $0.000 0 $0.000 0 $0.000 0 $0.000
MTA Plan Adjustments
Labor: 3 Zeros Salary/Wage Initiative Accelerate 3 Zeros New MTA EfficienciesEnergy/Other Reimbursements
Sub-Total MTA Plan Adjustments 0 $0.000 0 $0.000 0 $0.000 0 $0.000 0 $0.000
2012 February Financial Plan: Baseline Net Surplus/(Deficit) 15 $0.000 0 $0.000 0 $0.000 0 $0.000 0 $0.000
MTA LONG ISLAND BUS February Financial Plan 2012 - 2015
Reconciliation to the November Plan (Accrual) Reimbursable($ in millions)
Favorable/(Unfavorable)2011 2012 2013 2014 2015

Positions Dollars Positions Dollars Positions Dollars Positions Dollars Positions Dollars
2011 November Financial Plan: Baseline Net Surplus/(Deficit) 1,048 ($98.213) 0 $0.000 0 $0.000 0 $0.000 0 $0.000
Technical Adjustments:
Sub-Total Technical Adjustments 0 $0.000 0 $0.000 0 $0.000 0 $0.000 0 $0.000
MTA Plan Adjustments:
Labor: 3 Zeros Salary/Wage Initiative 0.237$ Accelerate 3 Zeros 1.018 New MTA EfficienciesEnergy/Other Reimbursements 0.878
Sub-Total MTA Plan Adjustments 0 $2.133 0 $0.000 0 $0.000 0 $0.000 0 $0.000
2012 February Financial Plan: Baseline Net Surplus/(Deficit) 1,048 (96.080)$ 0 $0.000 0 $0.000 0 $0.000 0 $0.000
MTA LONG ISLAND BUS February Financial Plan 2012 - 2015
Reconciliation to the November Plan - (Cash)($ in millions)
Favorable/(Unfavorable)2011 2012 2013 2014 2015

NON-REIMBURSABLE 2011 2012
Final Adopted
Estimate Budget 2013 2014 2015
Operating Revenue
Farebox Revenue $46.271 $0.000 $0.000 $0.000 $0.000
Toll Revenue -
Other Operating Revenue 1.716
Capital and Other Reimbursements -
Total Revenue $47.987 $0.000 $0.000 $0.000 $0.000
Operating Expenses
Labor:
Payroll $60.054 $0.000 $0.000 $0.000 $0.000
Overtime 9.833
Health and Welfare 15.414
OPEB Current Payment 0.824
Pensions 8.197
Other Fringe Benefits 6.780
Reimbursable Overhead -
Total Labor Expenses $101.102 $0.000 $0.000 $0.000 $0.000
Non-Labor:
Electric Power $0.000 $0.000 $0.000 $0.000 $0.000
Fuel $9.575 $0.000 $0.000 $0.000 $0.000
Insurance 0.610
Claims 3.733
Paratransit Service Contracts -
Maintenance and Other Operating Contracts 7.870
Professional Service Contracts 1.601
Materials & Supplies 1.081
Other Business Expenses 0.189
Total Non-Labor Expenses $24.658 $0.000 $0.000 $0.000 $0.000
Other Expenses Adjustments:
Other
Total Other Expense Adjustments $0.000 $0.000 $0.000 $0.000 $0.000
Total Expenses before Depreciation $125.760 $0.000 $0.000 $0.000 $0.000
Depreciation $0.000 $0.000 $0.000 $0.000 $0.000
OPEB Obligation 8.960
Environmental Remediation -
Total Expenses $134.720 $0.000 $0.000 $0.000 $0.000
Baseline Surplus/(Deficit) ($86.733) $0.000 $0.000 $0.000 $0.000
MTA LONG ISLAND BUS February Financial Plan 2012 - 2015
Accrual Statement of Operations by Category
($ in millions)

REIMBURSABLE2011 2012Final Adopted
Estimate Budget 2013 2014 2015
Revenue
Farebox Revenue $0.000 $0.000 $0.000 $0.000 $0.000
Toll Revenue -
Other Operating Revenue -
Capital and Other Reimbursements 9.033
Total Revenue $9.033 $0.000 $0.000 $0.000 $0.000
Expenses
Labor:
Payroll $1.030 $0.000 $0.000 $0.000 $0.000
Overtime -
Health and Welfare 0.402
OPEB Current Payment 1.286
Pensions 0.116
Other Fringe Benefits 0.199
Reimbursable Overhead -
Total Labor Expenses $3.033 $0.000 $0.000 $0.000 $0.000
Non-Labor:
Electric Power $0.000 $0.000 $0.000 $0.000 $0.000
Fuel $0.000 $0.000 $0.000 $0.000 $0.000
Insurance -
Claims -
Paratransit Service Contracts -
Maintenance and Other Operating Contracts -
Professional Service Contracts -
Materials & Supplies 6.000
Other Business Expenses -
Total Non-Labor Expenses $6.000 $0.000 $0.000 $0.000 $0.000
Other Expenses Adjustments:
Other $0.000 $0.000 $0.000 $0.000 $0.000
Total Other Expense Adjustments $0.000 $0.000 $0.000 $0.000 $0.000
Total Expenses before Depreciation $9.033 $0.000 $0.000 $0.000 $0.000
Depreciation $0.000 $0.000 $0.000 $0.000 $0.000
Total Expenses $9.033 $0.000 $0.000 $0.000 $0.000
Baseline Surplus/(Deficit) $0.000 $0.000 $0.000 $0.000 $0.000
MTA LONG ISLAND BUS February Financial Plan 2012 - 2015
Accrual Statement of Operations by Category($ in millions)

NON-REIMBURSABLE / REIMBURSABLE2011 2012Final Adopted
Estimate Budget 2013 2014 2015
Revenue
Farebox Revenue $46.271 $0.000 $0.000 $0.000 $0.000
Toll Revenue - - - - -
Other Operating Revenue 1.716 - - - -
Capital and Other Reimbursements 9.033 - - - -
Total Revenue $57.020 $0.000 $0.000 $0.000 $0.000
Expenses
Labor:
Payroll $61.084 $0.000 $0.000 $0.000 $0.000
Overtime 9.833 - - - -
Health and Welfare 15.816 - - - -
OPEB Current Payment 2.111 - - - -
Pensions 8.313 - - - -
Other Fringe Benefits 6.979 - - - -
Reimbursable Overhead - - - - -
Total Labor Expenses $104.135 $0.000 $0.000 $0.000 $0.000
Non-Labor:
Electric Power $0.000 $0.000 $0.000 $0.000 $0.000
Fuel $9.575 $0.000 $0.000 $0.000 $0.000
Insurance 0.610 - - - -
Claims 3.733 - - - -
Paratransit Service Contracts - - - - -
Maintenance and Other Operating Contracts 7.870 - - - -
Professional Service Contracts 1.601 - - - -
Materials & Supplies 7.081 - - - -
Other Business Expenses 0.189 - - - -
Total Non-Labor Expenses $30.658 $0.000 $0.000 $0.000 $0.000
Other Expenses Adjustments:
Other $0.000 $0.000 $0.000 $0.000 $0.000
Total Other Expense Adjustments $0.000 $0.000 $0.000 $0.000 $0.000
Total Expenses before Depreciation $134.794 $0.000 $0.000 $0.000 $0.000
Depreciation $0.000 $0.000 $0.000 $0.000 $0.000
OPEB Obligation 8.960 - - - -
Environmental Remediation - - - - -
Total Expenses $143.754 $0.000 $0.000 $0.000 $0.000
Baseline Surplus/(Deficit) ($86.733) $0.000 $0.000 $0.000 $0.000
MTA LONG ISLAND BUS February Financial Plan 2012 - 2015
Accrual Statement of Operations by Category($ in millions)

CASH RECEIPTS AND EXPENDITURES2011 2012Final Adopted
Estimate Budget 2013 2014 2015
Receipts
Farebox Revenue $46.160 $0.000 $0.000 $0.000 $0.000
Vehicle Toll Revenue -
Other Operating Revenue 1.666
Capital and Other Reimbursements 6.621
Total Receipts $54.447 $0.000 $0.000 $0.000 $0.000
Expenditures
Labor:
Payroll $63.937 $0.000 $0.000 $0.000 $0.000
Overtime 9.795
Health and Welfare 15.749
OPEB Current Payment 2.111
Pensions 13.509
Other Fringe Benefits 6.935
GASB Account 0.338
Reimbursable Overhead -
Total Labor Expenditures $112.374 $0.000 $0.000 $0.000 $0.000
Non-Labor:
Electric Power $0.000 $0.000 $0.000 $0.000 $0.000
Fuel $9.274 $0.000 $0.000 $0.000 $0.000
Insurance 1.208
Claims 9.344
Paratransit Service Contracts -
Maintenance and Other Operating Contracts 11.687
Professional Service Contracts 1.507
Materials & Supplies 4.972
Other Business Expenses 0.161
Total Non-Labor Expenses $38.152 $0.000 $0.000 $0.000 $0.000
Other Expenditure Adjustments:
Other $0.000 $0.000 $0.000 $0.000 $0.000
Total Other Expenditure Adjustments $0.000 $0.000 $0.000 $0.000 $0.000
Total Expenditures $150.527 $0.000 $0.000 $0.000 $0.000
Baseline Cash Surplus/(Deficit) ($96.080) $0.000 $0.000 $0.000 $0.000
MTA LONG ISLAND BUS February Financial Plan 2012 - 2015
Cash Receipts & Expenditures($ in millions)

CASH FLOW ADJUSTMENTS
2011 2012
Final AdoptedEstimate Budget 2013 2014 2015
Receipts
Farebox Revenue ($0.111) $0.000 $0.000 $0.000 $0.000
Vehicle Toll Revenue - - - - -
Other Operating Revenue (0.050) - - - -
Capital and Other Reimbursements (2.412) - - - - Total Receipts ($2.573) $0.000 $0.000 $0.000 $0.000
Expenditures
Labor:
Payroll ($2.853) $0.000 $0.000 $0.000 $0.000
Overtime 0.038 - - - -
Health and Welfare 0.066 - - - -
OPEB Current Payment 0.000 - - - -
Pensions (5.196) - - - -
Other Fringe Benefits 0.044 - - - -
GASB Account (0.338) - - - -
Reimbursable Overhead - - - - - Total Labor Expenditures ($8.239) $0.000 $0.000 $0.000 $0.000
Non-Labor:
Electric Power $0.000 $0.000 $0.000 $0.000 $0.000
Fuel $0.301 $0.000 $0.000 $0.000 $0.000
Insurance (0.598) - - - -
Claims (5.611) - - - -
Paratransit Service Contracts - - - - -
Maintenance and Other Operating Contracts (3.817) - - - -
Professional Service Contracts 0.094 - - - -
Materials & Supplies 2.109 - - - -
Other Business Expenditures 0.028 - - - -
Total Non-Labor Expenses ($7.494) $0.000 $0.000 $0.000 $0.000
Other Expenditures Adjustments:
Other $0.000 $0.000 $0.000 $0.000 $0.000
Total Other Expenditures Adjustments $0.000 $0.000 $0.000 $0.000 $0.000
Total Cash Conversion Adjustments before Depreciation ($18.306) $0.000 $0.000 $0.000 $0.000
Depreciation Adjustment $0.000 $0.000 $0.000 $0.000 $0.000
OPEB Obligation 8.960 - - - -
Environmental Remediation - - - - -
Baseline Total Cash Conversion Adjustments ($9.346) $0.000 $0.000 $0.000 $0.000
Cash Conversion (Cash Flow Adjustments)($ in millions)
MTA LONG ISLAND BUS February Financial Plan 2012 - 2015
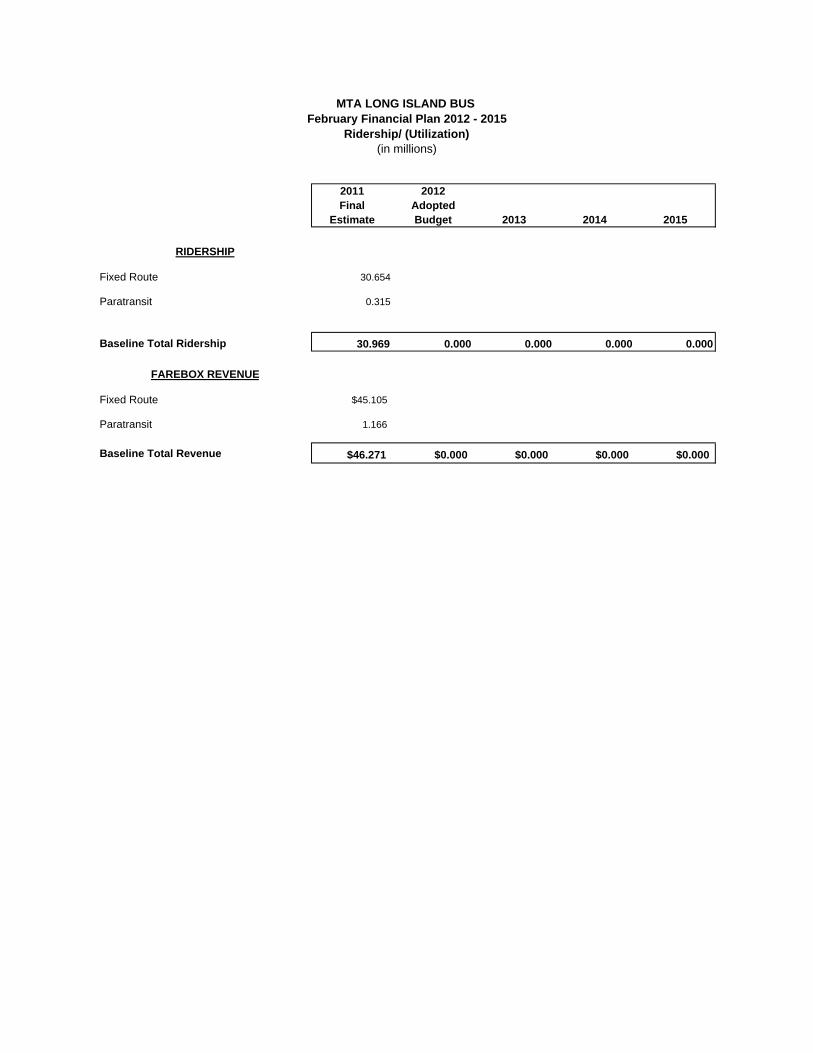
2011 2012Final Adopted
Estimate Budget 2013 2014 2015
RIDERSHIP
Fixed Route 30.654
Paratransit 0.315
Baseline Total Ridership 30.969 0.000 0.000 0.000 0.000
FAREBOX REVENUE
Fixed Route $45.105
Paratransit 1.166
Baseline Total Revenue $46.271 $0.000 $0.000 $0.000 $0.000
February Financial Plan 2012 - 2015MTA LONG ISLAND BUS
Ridership/ (Utilization)(in millions)

2011Final
Estimate
2012 Adopted Budget 2013 2014 2015
AdministrationOffice of the EVP 0Human Resources 3Office of Management and Budget 6Technology & Information Services 17Materiel 12Controller 10Office of the President 2System Safety Administration 3Law 9Corporate Communications 3Labor Relations 1Non-Departmental 5
Total Administration 71 0 0 0 0
OperationsBuses (Fixed Route) 531Buses (Paratransit) 142Office of the Executive Vice President, Regional 0Safety & Training 5Road Operations 19Transportation Support 14Operations Planning 5Revenue Control 6
Total Operations 722 0 0 0 0
MaintenanceBuses (Fixed Route) 183Buses (Paratransit) 12Maintenance Support/CMF 21Facilities 15Supply Logistics 18
Total Maintenance 249 0 0 0 0
Engineering/CapitalCapital Program Management 3
Public SafetySecurity 3
Baseline Total Positions 1,048 0 0 0 0
Non-Reimbursable 1,033 - - - - Reimbursable 15
Total Full-Time 949 - - - - Total Full-Time Equivalents 99
FUNCTION/DEPARTMENT
MTA LONG ISLAND BUS February Financial Plan 2012 - 2015
Total Positions by Function and DepartmentNon-Reimbursable/Reimbursable and Full-Time/Full Time Equivalents

FUNCTION/OCCUPATIONAL GROUP
2011Final
Estimate
2012 Adopted Budget 2013 2014 2015
Administration Managers/Supervisors 29 Professional, Technical, Clerical 37 Operational Hourlies 5
Total Administration 71 - - - -
Operations Managers/Supervisors 61 Professional, Technical, Clerical 38 Operational Hourlies 623
Total Operations 722 - - - -
Maintenance Managers/Supervisors 38 Professional, Technical, Clerical 2 Operational Hourlies 209
Total Maintenance 249 - - - -
Engineering/Capital Managers/Supervisors 2 Professional, Technical, Clerical 1 Operational Hourlies -
Total Engineering/Capital 3 - - - -
Public Safety Managers/Supervisors 1 Professional, Technical, Clerical - Operational Hourlies 2
Total Public Safety 3 - - - -
Total Positions Managers/Supervisors 131 - - - - Professional, Technical, Clerical 78 - - - - Operational Hourlies 839 - - - -
Total Baseline Positions 1,048 - - - -
MTA LONG ISLAND BUS February Financial Plan 2012 - 2015
Total Positions by Function and Occupation

Long Island Rail Road

MTA LONG ISLAND RAIL ROAD FEBRUARY FINANCIAL PLAN FOR 2012-2015
2011 FINAL ESTIMATE AND 2012 ADOPTED BUDGET
The following information presents MTA Long Island Rail Road’s 2011 Final Estimate, 2012 Adopted Budget and the Financial Plan for 2012-2015. The Adopted Budget reflects the inclusion of below-the-line adjustments that were presented in the November Financial Plan, which was adopted by the Board in December 2011, as well as other technical adjustments
These adjustments are presented on the attached reconciliations from the November Financial Plan and are described below: Elimination of a 2011 forecasted non-represented wage assumption that resulted in annual
non-reimbursable savings of approximately $1.6 million. Net-Zero Labor Initiative with the assumption that each new labor contract will not impose
any additional financial burden on the LIRR for three consecutive years in total. 2011 and 2012 are adjusted from the November Financial Plan to include the third year. Non-reimbursable savings in 2012 are projected to be $7.0 million growing to $12.8 million in 2015.
New MTA IT Efficiencies totaling $0.4 million in 2011 and approximately $0.5 million 2012 -
2015.
Energy adjustments for Traction and Propulsion Power, Diesel Fuel and Natural Gas resulting in savings of $0.3 million in 2011 and increased expenses of approximately $(0.2) million in 2012 – 2014 and ($0.3) million in 2015.
Technical adjustments primarily consist of changes to the Force Account Insurance rate.
Effective 2012, the non-labor account structure of the MTA standard chart of accounts has
been adjusted to reflect the reclassification and renaming of certain accounts in order to improve account reporting consistency among the Agencies. These changes, which affect most non-labor accounts presented on the attached tables, result in no net-impact to the bottom line. In order to maintain comparability with 2011 actual results for year-end reporting purposes, the 2011 account structure remains unchanged.
This submission also includes schedules detailing the monthly allocation of financial, headcount and utilization data based on the 2012 Adopted Budget for the purpose of reporting actual results on a monthly basis to the Board.

Positions Dollars Positions Dollars Positions Dollars Positions Dollars Positions Dollars
2011 November Financial Plan: Baseline Net Surplus/(Deficit) 5,849 ($979.640) 5,940 ($1,072.903) 5,904 ($1,091.651) 6,092 ($1,146.759) 6,243 ($1,234.007)
Technical Adjustments:Miscellaneous adjustments $0.003 $0.003 $0.007 1 $0.010 $0.008
Sub-Total Technical Adjustments 0 $0.003 0 $0.003 0 $0.007 1 $0.010 0 $0.008
MTA Plan Adjustments:
Labor: 3 Zeros Salary/Wage Initiative $1.586 $7.012 $12.283 $12.566 $12.798
New MTA Efficiencies 0.413 0.455 0.502 0.494 0.459Energy 0.265 (0.155) (0.187) (0.225) (0.256)
Sub-Total MTA Plan Adjustments 0 $2.264 0 $7.312 0 $12.598 0 $12.835 0 $13.001
2012 February Financial Plan: Baseline Net Surplus/(Deficit) 5,849 ($977.373) 5,940 ($1,065.588) 5,904 ($1,079.046) 6,091 ($1,133.914) 6,243 ($1,220.998)
MTA LONG ISLAND RAIL ROAD
2015
February Financial Plan 2012 - 2015Reconciliation to the November Plan (Accrual) Non-Reimbursable
($ in millions)
Favorable/(Unfavorable)2011 2012 2013 2014

Positions Dollars Positions Dollars Positions Dollars Positions Dollars Positions Dollars
2011 November Financial Plan: Baseline Net Surplus/(Deficit) 631 $0.000 568 $0.000 621 $0.000 621 $0.000 614 $0.000
Technical Adjustments:Force Account Insurance (rate change from 16% to 13%) $1.189Misc. Other ($0.001) ($0.001) $0.001
Sub-Total Technical Adjustments 0 $0.000 0 $1.188 0 $0.000 0 ($0.001) 0 $0.001
MTA Plan Adjustments
Labor:3 Zeros Salary/Wage Initiative $0.506 $2.272 $3.931 $4.002 $4.048
Sub-Total MTA Plan Adjustments 0 $0.506 0 $2.272 0 $3.931 0 $4.002 0 $4.048
Total Revenue offset ($0.506) ($3.460) ($3.931) ($4.001) ($4.049)
2012 February Financial Plan: Baseline Net Surplus/(Deficit) 631 $0.000 568 $0.000 621 $0.000 621 $0.000 614 $0.000
MTA LONG ISLAND RAIL ROADFebruary Financial Plan 2012 - 2015
Reconciliation to the November Plan (Accrual) Reimbursable($ in millions)
Favorable/(Unfavorable)2011 2012 2013 2014 2015

Positions Dollars Positions Dollars Positions Dollars Positions Dollars Positions Dollars
2011 November Financial Plan: Baseline Net Surplus/(Deficit) 6,480 ($569.166) 6,508 ($652.610) 6,525 ($695.779) 6,713 ($771.590) 6,857 ($847.393)
Technical Adjustments:Miscellaneous adjustments $0.003 $0.003 $0.007 $0.010 $0.008Insurance Timing (0.004) 0.004
Sub-Total Technical Adjustments 0 ($0.001) 0 $0.007 0 $0.007 0 $0.010 0 $0.008
MTA Plan Adjustments:
Labor:3 Zeros Salary/Wage Initiative $1.586 $7.095 $12.393 $12.603 $13.076
New MTA Efficiencies 0.413 0.455 0.502 0.494 0.459Energy 0.265 (0.155) (0.187) (0.225) (0.256)
Sub-Total MTA Plan Adjustments 0 $2.264 0 $7.395 0 $12.708 0 $12.872 0 $13.279
2012 February Financial Plan: Baseline Net Surplus/(Deficit) 6,480 ($566.903) 6,508 ($645.208) 6,525 ($683.064) 6,713 ($758.708) 6,857 ($834.106)
MTA LONG ISLAND RAIL ROADFebruary Financial Plan 2012 - 2015
Reconciliation to the November Plan - (Cash)($ in millions)
Favorable/(Unfavorable)2011 2012 2013 2014 2015

NON-REIMBURSABLE Final New February Proposed MTA Energy/ New All Adopted
Budget Labor Efficiencies Other Reimb. COA Other Budget
Revenue
Farebox Revenue $570.727 $0.000 $0.000 $0.000 $0.000 $0.000 $570.727Vehicle Toll Revenue
Other Operating Revenue 40.695 40.695Capital & Other Reimbursements:
Total Capital and Other Reimbursements 0.000Total Revenue $611.422 $0.000 $0.000 $0.000 $0.000 $0.000 $611.422
Expenses
Labor:
Payroll $424.369 ($6.584) $0.000 $0.000 $0.000 $0.148 $417.933Overtime 73.961 (0.850) (0.040) 73.071Health and Welfare 93.058 0.169 0.074 93.301OPEB Current Payment 60.940 - 60.940Pensions 198.078 0.255 (0.831) 197.502Other Fringe Benefits 92.726 (0.462) 12.709 0.089 105.062Reimbursable Overhead (29.961) 0.424 0.868 (28.669)Total Labor Expenses $913.171 ($7.048) $0.000 $0.000 $12.709 $0.307 $919.139
Non-Labor:
Electric Power $90.811 $0.000 $0.000 $0.997 $13.664 $0.000 $105.472Fuel 25.416 0.000 0.000 (0.779) 2.787 0.000 27.424Insurance 16.204 16.204Claims 16.110 (12.710) 3.401Paratransit Service Contracts 0.000Maintenance and Other Operating Contracts 76.709 0.029 (0.195) (0.063) (17.808) 0.013 58.685Professional Service Contracts 21.891 0.005 (0.075) 12.010 0.002 33.833Materials & Supplies 116.010 0.030 (0.185) (13.687) (0.328) 101.840Other Business Expenses 11.693 (0.028) 0.000 3.036 14.701Total Non-Labor Expenses $374.844 $0.036 ($0.455) 0.155 (12.709) (0.313) 361.559
Other Expense Adjustments:
Other
Total Other Expense Adjustments $0.000 $0.000 $0.000 0.000 0.000 0.000 0.000
Total Expenses before Non-Cash Liability Adjustments $1,288.015 ($7.012) ($0.455) $0.155 $0.000 ($0.006) 1,280.698
Depreciation $317.060 $317.060OPEB Obligation 77.250 77.250Environmental Remediation 2.000 2.000
Total Expenses $1,684.325 $0.000 $0.000 $0.000 $0.000 $0.000 $1,677.008
Baseline Surplus/(Deficit) ($1,072.903) $0.000 $0.000 0.000 0.000 0.000 (1,065.586)
Cash Conversion Adjustments:
Depreciation $317.060 $317.060Operating/Capital (8.489) (8.489)Other Cash Adjustments 111.722 0.087 0.000 0.000 (0.000) 0.000 111.809Total Cash Conversion Adjustments $420.293 $0.087 $0.000 $0.000 ($0.000) $0.000 $420.380
Net Cash Surplus/(Deficit) ($652.610) $0.087 $0.000 $0.000 ($0.000) $0.000 ($645.206)
-- Differences are due to rounding.
MTA LONG ISLAND RAIL ROAD2012 February Adopted Budget
Reconciliation to the 2012 Final Proposed Budget vs. 2012 Adopted Budget by Generic Category (Accrual and Cash)($ in millions)
2012MTA Plan Adjustments

REIMBURSABLEFinal New February
Proposed MTA Energy/ New All Adopted
Budget Labor Efficiencies Other Reimb. COA Other Budget
Revenue
Farebox Revenue $0.000 $0.000 $0.000 $0.000 $0.000 $0.000 $0.000Vehicle Toll Revenue 0.000 0.000 0.000 0.000 0.000 0.000 0.000
Total Capital and Other Reimbursements 214.960 (2.272) 0.000 0.000 0.001 (1.189) 211.500Total Revenue $214.960 ($2.272) $0.000 $0.000 $0.001 ($1.189) $211.500
Expenses
Labor:
Payroll $72.666 ($1.005) ($0.001) ($0.112) $71.548Overtime 9.663 (0.096) 0.001 9.568Health and Welfare 12.517 (0.169) (0.074) 12.274OPEB Current Payment 0.000 0.000Pensions 18.010 (0.255) 0.831 18.586Other Fringe Benefits 15.075 (0.203) (0.089) 14.783Reimbursable Overhead 29.961 (0.424) (0.868) 28.669Total Labor Expenses $157.892 ($2.152) $0.000 $0.000 ($0.001) ($0.312) $155.427
Non-Labor:
Electric Power $0.000 $0.000 $0.000 $0.000 $0.000 $0.000 $0.000Fuel 0.000 0.000 0.000 0.000 0.000 0.000 0.000Insurance 6.225 (0.053) (1.189) 4.983Claims 0.000 0.000Paratransit Service Contracts 0.000 0.000Maintenance and Other Operating Contracts 9.351 (0.029) (0.215) (0.013) 9.094Professional Service Contracts 1.573 (0.006) 1.185 (0.003) 2.749Materials & Supplies 39.839 (0.030) (0.968) 0.328 39.169Other Business Expenses 0.080 (0.002) (0.000) 0.078Total Non-Labor Expenses $57.068 ($0.120) $0.000 $0.000 $0.002 ($0.877) $56.073
Other Expense Adjustments:
Other 0.000 0.000 0.000 0.000 0.000 0.000 0.000Total Other Expense Adjustments $0.000 $0.000 $0.000 $0.000 $0.000 $0.000 $0.000
Total Expenses before Depreciation $214.960 ($2.272) $0.000 $0.000 $0.001 ($1.189) $211.500
Depreciation $0.000 $0.000 $0.000 $0.000 $0.000 $0.000 $0.000
Total Expenses $214.960 ($2.272) $0.000 $0.000 $0.001 ($1.189) $211.500
Baseline Surplus/(Deficit) $0.000 $0.000 $0.000 $0.000 $0.000 $0.000 $0.000
Cash Conversion Adjustments:
Depreciation $0.000 $0.000 $0.000 $0.000 $0.000 $0.000 $0.000Operating/Capital 0.000 0.000 0.000 0.000 0.000 0.000 0.000Other Cash Adjustments 0.000 0.000 0.000 0.000 0.000 0.000 0.000Total Cash Conversion Adjustments $0.000 $0.000 $0.000 $0.000 $0.000 $0.000 $0.000
Net Cash Surplus/(Deficit) $0.000 $0.000 $0.000 $0.000 $0.000 $0.000 $0.000
-- Differences are due to rounding.
MTA LONG ISLAND RAIL ROAD2012 February Adopted Budget
Reconciliation to the 2012 Final Proposed Budget vs. 2012 Adopted Budget by Generic Category (Accrual and Cash)($ in millions)
2012MTA Plan Adjustments

NON-REIMBURSABLE/REIMBURSABLE Final New February
Proposed MTA Energy/ New All Adopted
Budget Labor Efficiencies Other Reimb. COA Other Budget
Revenue
Farebox Revenue $570.727 $570.727Vehicle Toll Revenue
Other Operating Revenue 40.695 40.695Total Capital and Other Reimbursements 214.960 (3.461) 0.000 0.000 0.001 0.000 211.500Total Revenue $826.382 ($3.461) $0.000 $0.000 $0.001 $0.000 $822.922
Expenses
Labor:
Payroll 497.035 (7.593) 0.039 489.481Overtime 83.624 (0.946) (0.039) 82.639Health and Welfare 105.575 105.575OPEB Current Payment 60.940 60.940Pensions 216.088 216.088Other Fringe Benefits 107.801 (0.665) 12.709 119.845Reimbursable Overhead 0.000 0.000Total Labor Expenses $1,071.063 ($9.204) $0.000 $0.000 $12.709 $0.000 $1,074.568
Non-Labor:
Electric Power $90.811 $0.000 $0.000 $0.997 $13.664 $0.000 $105.472Fuel 25.416 0.000 0.000 (0.779) 2.787 0.000 27.424Insurance 22.429 (0.053) (1.189) 21.187Claims 16.110 (12.709) 3.401Paratransit Service Contracts 0.000 0.000Maintenance and Other Operating Contracts 86.060 (0.195) (0.063) (18.022) 67.779Professional Service Contracts 23.464 (0.075) 13.194 (0.002) 36.581Materials & Supplies 155.849 (0.185) (14.656) 141.009Other Business Expenses 11.773 (0.030) 0.000 3.035 14.778Total Non-Labor Expenses $431.912 ($0.083) ($0.455) $0.155 ($12.706) ($1.191) $417.632
Other Expense Adjustments:
Other 0.000 0.000 0.000 0.000 0.000 0.000 0.000Total Other Expense Adjustments $0.000 $0.000 $0.000 $0.000 $0.000 $0.000 $0.000
Total Expenses before Non-Cash Liability Adjustments $1,502.975 ($9.287) ($0.455) $0.155 $0.003 ($1.191) $1,492.200
Depreciation $317.060 $317.060OPEB Obligation 77.250 77.250Environmental Remediation 2.000 2.000
Total Expenses $1,899.285 ($9.287) ($0.455) $0.155 $0.003 ($1.191) $1,888.510
Baseline Surplus/(Deficit) ($1,072.903) $5.826 $0.455 ($0.155) ($0.002) $1.191 ($1,065.588)
Cash Conversion Adjustments:
Depreciation $317.060 $317.060Operating/Capital (8.489) (8.489)Other Cash Adjustments 111.722 0.087 111.809Total Cash Conversion Adjustments $420.293 $0.087 $0.000 $0.000 $0.000 $0.000 $420.380
Net Cash Surplus/(Deficit) ($652.610) $5.913 $0.455 ($0.155) ($0.002) $1.191 ($645.208)
-- Differences are due to rounding.
MTA LONG ISLAND RAIL ROAD2012 February Adopted Budget
Reconciliation to the 2012 Final Proposed Budget vs. 2012 Adopted Budget by Generic Category (Accrual and Cash)($ in millions)
2012MTA Plan Adjustments

CASH RECEIPTS & EXPENDITURESFinal New February
Proposed MTA Energy/ New All Adopted
Budget Labor Efficiencies Other Reimb. COA Other Budget
Receipts
Farebox Revenue $599.727 $0.000 $0.000 $0.000 $0.000 $0.000 $599.727Vehicle Toll Revenue 0.000 0.000 0.000 0.000 0.000 0.000Other Operating Revenue 52.110 (0.073) 0.000 0.000 0.000 0.000 52.037Total Capital and Other Reimbursements 251.616 (3.388) 0.000 0.000 0.001 0.000 248.229Total Receipts $903.453 ($3.461) $0.000 $0.000 $0.001 $0.000 $899.993
Expenditures
Labor:
Payroll $494.774 ($7.593) $0.000 $0.000 $0.000 $0.039 $487.220Overtime 83.624 (0.946) 0.000 0.000 0.000 (0.039) 82.639Health and Welfare 105.575 0.000 0.000 0.000 0.000 0.000 105.575OPEB Current Payment 60.940 0.000 0.000 0.000 0.000 0.000 60.940Pensions 216.088 0.000 0.000 0.000 0.000 0.000 216.088Other Fringe Benefits 107.801 (0.665) 0.000 0.000 15.127 0.000 122.263GASB Account 8.087 (0.083) 0.000 0.000 0.000 0.000 8.004Reimbursable Overhead 0.000 0.000 0.000 0.000 0.000 0.000 0.000Total Labor Expenditures $1,076.889 ($9.287) $0.000 $0.000 $15.127 $0.000 $1,082.729
Non-Labor:
Electric Power $100.419 $0.000 $0.000 $0.997 $14.608 $0.000 $116.024Fuel 27.416 0.000 0.000 (0.779) 3.276 0.000 29.913Insurance 20.986 (0.057) 0.000 0.000 0.000 (1.189) 19.740Claims 18.259 0.000 0.000 0.000 (15.127) 0.000 3.132Paratransit Service Contracts 0.000 0.000 0.000 0.000 0.000 0.000 0.000Maintenance and Other Operating Contracts 96.360 0.000 (0.195) (0.063) (19.386) 0.000 76.715Professional Service Contracts 20.464 0.000 (0.075) 0.000 13.613 (0.002) 34.000Materials & Supplies 154.915 0.000 (0.185) 0.000 (15.144) 0.000 139.587Other Business Expenditures 11.355 (0.030) 0.000 (0.000) 3.035 0.000 14.360Total Non-Labor Expenditures $450.174 ($0.087) ($0.455) $0.155 ($15.124) ($1.191) $433.472
Other Expenditure Adjustments:
Other 29.000 0.000 0.000 0.000 0.000 0.000 29.000Total Other Expenditure Adjustments $29.000 $0.000 $0.000 $0.000 $0.000 $0.000 $29.000
Total Expenditures $1,556.063 ($9.374) ($0.455) $0.155 $0.003 ($1.191) $1,545.201
Baseline Cash Deficit ($652.610) $5.913 $0.455 ($0.155) ($0.002) $1.191 ($645.208)
Opening Cash Balance $0.005 $0.005Cash Timing and Availability Adjustment 0.000 0.000Closing Cash Balance $0.005 $0.000 $0.000 $0.000 $0.000 $0.000 $0.005
-- Differences are due to rounding.
MTA LONG ISLAND RAIL ROAD2012 February Adopted Budget
Reconciliation to the 2012 Final Proposed Budget vs. 2012 Adopted Budget by Generic Category (Accrual and Cash)($ in millions)
2012MTA Plan Adjustments

CASH FLOW ADJUSTMENTSFinal New February
Proposed MTA Energy/ New All Adopted
Budget Labor Efficiencies Other Reimb. COA Other Budget
Receipts
Farebox Revenue $29.000 $0.000 $0.000 $0.000 $0.000 $0.000 $29.000Vehicle Toll Revenue
Other Operating Revenue 11.415 (0.073) 0.000 0.000 0.000 0.000 11.342Total Capital and Other Reimbursements 36.656 0.073 0.000 0.000 0.000 0.000 36.729Total Receipt Adjustments $77.071 $0.000 $0.000 $0.000 $0.000 $0.000 $77.071
Expenditures
Labor:
Payroll $2.261 $0.000 $0.000 $0.000 $0.000 $0.000 $2.261Overtime 0.000 0.000 0.000 0.000 0.000 0.000 0.000Health and Welfare 0.000 0.000 0.000 0.000 0.000 0.000 0.000OPEB Current Payment 0.000 0.000 0.000 0.000 0.000 0.000 0.000Pensions 0.000 0.000 0.000 0.000 0.000 0.000 0.000Other Fringe Benefits 0.000 0.000 0.000 0.000 (2.418) 0.000 (2.418)GASB Account (8.087) 0.083 0.000 0.000 0.000 0.000 (8.004)Reimbursable Overhead 0.000 0.000 0.000 0.000 0.000 0.000 0.000Total Labor Expenditures ($5.826) $0.083 $0.000 $0.000 ($2.418) $0.000 ($8.161)
Non-Labor:
Electric Power ($9.608) $0.000 $0.000 $0.000 ($0.944) $0.000 ($10.552)Fuel (2.000) 0.000 0.000 0.000 (0.489) 0.000 (2.489)Insurance 1.443 0.004 0.000 0.000 0.000 0.000 1.447Claims (2.149) 0.000 0.000 0.000 2.418 0.000 0.269Paratransit Service Contracts 0.000 0.000 0.000 0.000 0.000 0.000 0.000Maintenance and Other Operating Contracts (10.300) 0.000 0.000 0.000 1.364 0.000 (8.936)Professional Service Contracts 3.000 0.000 0.000 0.000 (0.419) 0.000 2.581Materials & Supplies 0.934 0.000 0.000 0.000 0.488 0.000 1.422Other Business Expenditures 0.418 0.000 0.000 0.000 0.000 0.000 0.418Total Non-Labor Expenditures ($18.262) $0.004 $0.000 $0.000 $2.418 $0.000 ($15.840)
Other Expenditure Adjustments:
Other (29.000) 0.000 0.000 0.000 0.000 0.000 (29.000)Total Other Expenditure Adjustments ($29.000) $0.000 $0.000 $0.000 $0.000 $0.000 ($29.000)
Total Expenditure Adjustments ($53.088) $0.087 $0.000 $0.000 ($0.000) $0.000 ($53.001)
Total Cash Conversion Adjustments before
Non-Cash Liability Adjs. $23.983 $0.087 $0.000 $0.000 ($0.000) $0.000 $24.070
Depreciation Adjustment $317.060 $0.000 $0.000 $0.000 $0.000 $0.000 $317.060OPEB Obligation 77.250 0.000 0.000 0.000 0.000 0.000 77.250Environmental Remediation 2.000 0.000 0.000 0.000 0.000 0.000 2.000
Total Cash Conversion Adjustments $420.293 $0.087 $0.000 $0.000 ($0.000) $0.000 $420.380
-- Differences are due to rounding.
MTA LONG ISLAND RAIL ROAD2012 February Adopted Budget
Reconciliation to the 2012 Final Proposed Budget vs. 2012 Adopted Budget by Generic Category (Accrual and Cash)($ in millions)
2012MTA Plan Adjustments

NON-REIMBURSABLE 2011 2012
Final Adopted
Estimate* Budget 2013 2014 2015
Operating Revenue
Farebox Revenue $567.454 $570.727 $575.234 $579.630 $584.163
Toll Revenue - - - - -
Other Operating Revenue 34.030 40.695 38.367 39.613 40.349
Capital and Other Reimbursements - - - - -
Total Revenue $601.484 $611.422 $613.601 $619.243 $624.512
Operating Expenses
Labor:
Payroll $412.411 $417.933 $416.969 $437.936 $459.151
Overtime 81.830 73.071 71.588 72.932 74.028
Health and Welfare 83.409 93.301 98.441 110.032 122.138
OPEB Current Payment 55.394 60.940 65.312 71.212 77.623
Pensions 157.887 197.502 198.800 199.855 207.430
Other Fringe Benefits 89.247 105.062 106.080 111.569 116.955
Reimbursable Overhead (25.930) (28.669) (20.952) (19.906) (14.089)
Total Labor Expenses $854.248 $919.140 $936.238 $983.630 $1,043.236
Non-Labor:
Electric Power $83.815 $105.472 $114.416 $125.971 $139.760
Fuel 23.741 27.424 28.363 28.057 28.097
Insurance 15.034 16.204 17.472 18.879 20.431
Claims 15.810 3.401 3.401 3.456 3.513
Paratransit Service Contracts - - - - -
Maintenance and Other Operating Contracts 72.473 58.685 56.868 59.129 61.490
Professional Service Contracts 17.923 33.833 26.086 26.757 27.569
Materials & Supplies 94.310 101.840 103.497 109.187 111.620
Other Business Expenses 9.566 14.701 15.459 15.852 16.195
Total Non-Labor Expenses $332.672 $361.560 $365.562 $387.288 $408.675
Other Expenses Adjustments:
Other $0.000 $0.000 $0.000 $0.000 $0.000
Total Other Expense Adjustments $0.000 $0.000 $0.000 $0.000 $0.000
Total Expenses before Depreciation and GASB Adjs. $1,186.920 $1,280.700 $1,301.800 $1,370.918 $1,451.911
Depreciation $314.997 $317.060 $309.279 $298.284 $307.186
OPEB Obligation 74.940 77.250 79.568 81.955 84.413
Environmental Remediation 2.000 2.000 2.000 2.000 2.000
Total Expenses $1,578.857 $1,677.010 $1,692.647 $1,753.157 $1,845.510
Baseline Surplus/(Deficit) ($977.373) ($1,065.588) ($1,079.046) ($1,133.914) ($1,220.998)
Cash Conversion Adjustments
Depreciation $314.997 $317.060 $309.279 $298.284 $307.186
Operating/Capital (3.428) (8.489) (8.580) (9.765) (10.032)
Other Cash Adjustment 98.901 111.809 95.283 86.687 89.738
Total Cash Conversion Adjustments $410.470 $420.380 $395.982 $375.206 $386.892
Net Surplus/(Deficit) ($566.903) ($645.208) ($683.064) ($758.708) ($834.106)
MTA LONG ISLAND RAIL ROADFebruary Financial Plan 2012 - 2015
Accrual Statement of Operations by Category
($ in millions)
*Effective 2012, the non-labor account structure of the MTA standard chart of accounts has been adjusted to reflect the reclassification and renaming of certain accounts in order to improve account reporting consistency among the Agencies. These changes, which affect most non-labor accounts presented on the attached tables, result in no net-impact to the bottom line. In order to maintain comparability with 2011 actual results for year-end reporting purposes, the 2011 account structure remains unchanged.

REIMBURSABLE2011 2012Final Adopted
Estimate* Budget 2013 2014 2015
Revenue
Farebox Revenue $0.000 $0.000 $0.000 $0.000 $0.000
Toll Revenue - - - - -
Other Operating Revenue - - - - -
Capital and Other Reimbursements 204.810 211.500 218.416 221.920 218.728 Total Revenue $204.810 $211.500 $218.416 $221.920 $218.728
Expenses
Labor:
Payroll $67.588 $71.548 $78.907 $80.411 $81.402
Overtime 10.426 9.568 11.069 11.151 11.364
Health and Welfare 11.720 12.274 13.825 14.075 14.256
OPEB Current Payment - - - - -
Pensions 20.750 18.586 19.182 19.529 19.779
Other Fringe Benefits 13.920 14.783 16.650 16.951 17.169
Reimbursable Overhead 25.930 28.669 20.952 19.906 14.089 Total Labor Expenses $150.334 $155.428 $160.585 $162.023 $158.059
Non-Labor:
Electric Power $0.159 $0.000 $0.000 $0.000 $0.000
Fuel - - - - -
Insurance 5.122 4.983 6.931 7.063 7.124
Claims - - - - -
Paratransit Service Contracts - - - - -
Maintenance and Other Operating Contracts 10.789 9.094 9.253 9.422 9.581
Professional Service Contracts 1.864 2.748 0.943 0.904 0.883
Materials & Supplies 36.182 39.169 40.616 42.418 42.990
Other Business Expenses 0.106 0.078 0.088 0.090 0.091 Total Non-Labor Expenses $54.222 $56.072 $57.831 $59.897 $60.669
Other Expenses Adjustments:
Other $0.000 $0.000 $0.000 $0.000 $0.000Total Other Expense Adjustments $0.000 $0.000 $0.000 $0.000 $0.000
Total Expenses before Depreciation $204.556 $211.500 $218.416 $221.920 $218.728
Depreciation $0.000 $0.000 $0.000 $0.000 $0.000
Environmental Remediation 0.254 0.000 0.000 0.000 0.000
Total Expenses $204.810 $211.500 $218.416 $221.920 $218.728
Baseline Surplus/(Deficit) $0.000 $0.000 $0.000 $0.000 $0.000
MTA LONG ISLAND RAIL ROADFebruary Financial Plan 2012 - 2015
Accrual Statement of Operations by Category($ in millions)
*Effective 2012, the non-labor account structure of the MTA standard chart of accounts has been adjusted to reflect the reclassification and renaming of certain accounts in order to improve account reporting consistency among the Agencies. These changes, which affect most non-labor accounts presented on the attached tables, result in no net-impact to the bottom line. In order to maintain comparability with 2011 actual results for year-end reporting purposes, the 2011 account structure remains unchanged.

NON-REIMBURSABLE / REIMBURSABLE2011 2012Final Adopted
Estimate* Budget 2013 2014 2015
Revenue
Farebox Revenue $567.454 $570.727 $575.234 $579.630 $584.163
Toll Revenue - - - - -
Other Operating Revenue 34.030 40.695 38.367 39.613 40.349
Capital and Other Reimbursements 204.810 211.500 218.416 221.920 218.728 Total Revenue $806.294 $822.922 $832.017 $841.163 $843.240
Expenses
Labor:
Payroll $479.999 $489.481 $495.876 $518.347 $540.553
Overtime 92.256 82.639 82.657 84.083 85.392
Health and Welfare 95.129 105.575 112.266 124.107 136.394
OPEB Current Payment 55.394 60.940 65.312 71.212 77.623
Pensions 178.637 216.088 217.982 219.384 227.209
Other Fringe Benefits 103.167 119.845 122.730 128.520 134.124
Reimbursable Overhead - - - - - Total Labor Expenses $1,004.582 $1,074.568 $1,096.823 $1,145.653 $1,201.295
Non-Labor:
Electric Power $83.974 $105.472 $114.416 $125.971 $139.760
Fuel 23.741 27.424 28.363 28.057 28.097
Insurance 20.156 21.187 24.403 25.942 27.555
Claims 15.810 3.401 3.401 3.456 3.513
Paratransit Service Contracts - - - - -
Maintenance and Other Operating Contracts 83.262 67.779 66.121 68.551 71.071
Professional Service Contracts 19.787 36.581 27.029 27.661 28.452
Materials & Supplies 130.492 141.009 144.113 151.605 154.610
Other Business Expenses 9.672 14.779 15.547 15.942 16.286 Total Non-Labor Expenses $386.894 $417.632 $423.393 $447.185 $469.344
Other Expenses Adjustments:
Other $0.000 $0.000 $0.000 $0.000 $0.000Total Gap Closing Actions $0.000 $0.000 $0.000 $0.000 $0.000
Total Expenses before Depreciation and GASB Adjs. $1,391.476 $1,492.200 $1,520.216 $1,592.838 $1,670.639
Depreciation $314.997 $317.060 $309.279 $298.284 $307.186
OPEB Obligation 74.940 77.250 79.568 81.955 84.413
Environmental Remediation 2.254 2.000 2.000 2.000 2.000
Total Expenses $1,783.667 $1,888.510 $1,911.063 $1,975.077 $2,064.238
Baseline Surplus/(Deficit) ($977.373) ($1,065.588) ($1,079.046) ($1,133.914) ($1,220.998)
Cash Conversion Adjustments
Depreciation $314.997 $317.060 $309.279 $298.284 $307.186
Operating/Capital (3.428) (8.489) (8.580) (9.765) (10.032)
Other Cash Adjustment 98.901 111.809 95.283 86.687 89.738
Net Surplus/(Deficit) ($566.903) ($645.208) ($683.064) ($758.708) ($834.106)
*Effective 2012, the non-labor account structure of the MTA standard chart of accounts has been adjusted to reflect the reclassification and renaming of certain accounts in order to improve account reporting consistency among the Agencies. These changes, which affect most non-labor accounts presented on the attached tables, result in no net-impact to the bottom line. In order to maintain comparability with 2011 actual results for year-end reporting purposes, the 2011 account structure remains unchanged.
MTA LONG ISLAND RAIL ROADFebruary Financial Plan 2012 - 2015
Accrual Statement of Operations by Category($ in millions)

CASH RECEIPTS AND EXPENDITURES2011 2012Final Adopted
Estimate* Budget 2013 2014 2015
Receipts
Farebox Revenue $598.173 $599.727 $605.234 $609.630 $614.163
Vehicle Toll Revenue - - - - -
Other Operating Revenue 77.357 52.037 49.926 51.213 52.098
Capital and Other Reimbursements 160.399 248.228 204.940 207.114 203.506 Total Receipts $835.929 $899.992 $860.100 $867.957 $869.767
Expenditures
Labor:
Payroll $475.117 $487.220 $493.592 $515.994 $538.130
Overtime 94.064 82.639 82.657 84.083 85.392
Health and Welfare 95.129 105.575 112.266 124.107 136.394
OPEB Current Payment 55.394 60.940 65.312 71.212 77.623
Pensions 178.637 216.088 217.982 219.384 227.209
Other Fringe Benefits 103.305 122.263 122.148 127.924 133.515
GASB Account 7.233 8.003 8.892 9.790 10.770
Reimbursable Overhead - 0.000 0.000 0.000 0.000Total Labor Expenditures $1,008.879 $1,082.728 $1,102.849 $1,152.494 $1,209.033
Non-Labor:
Electric Power $107.051 $116.024 $117.199 $128.940 $142.928
Fuel 21.741 29.913 28.363 28.057 28.097
Insurance 21.372 19.740 23.929 26.516 27.019
Claims 13.233 3.132 2.132 2.181 2.231
Paratransit Service Contracts - - - - -
Maintenance and Other Operating Contracts 75.394 76.715 66.421 68.851 71.371
Professional Service Contracts 17.944 34.000 24.029 24.511 25.145
Materials & Supplies 98.460 139.587 133.113 149.605 152.210
Other Business Expenses 9.097 14.361 15.129 15.510 15.839 Total Non-Labor Expenses $364.292 $433.472 $410.315 $444.171 $464.840
Other Expenditure Adjustments:
Other $29.000 $29.000 $30.000 $30.000 $30.000
Total Other Expenditure Adjustments $29.000 $29.000 $30.000 $30.000 $30.000
Total Expenditures $1,402.171 $1,545.200 $1,543.164 $1,626.665 $1,703.873
Cash Timing and Availability Adjustment (0.661)
Net Cash Deficit ($566.903) ($645.208) ($683.064) ($758.708) ($834.106)
MTA LONG ISLAND RAIL ROADFebruary Financial Plan 2012 - 2015
Cash Receipts & Expenditures($ in millions)
* Effective 2012, the non-labor account structure of the MTA standard chart of accounts has been adjusted to reflect the reclassification and renaming of certain accounts in order to improve account reporting consistency among the Agencies. These changes, which affect most non-labor accounts presented on the attached tables, result in no net-impact to the bottom line. In order to maintain comparability with 2011 actual results for year-end reporting purposes, the 2011 account structure remains unchanged.

CASH FLOW ADJUSTMENTS
2011 2012Final Adopted
Estimate* Budget 2013 2014 2015
Receipts
Farebox Revenue $30.719 $29.000 $30.000 $30.000 $30.000
Vehicle Toll Revenue - - - - -
Other Operating Revenue 43.327 11.342 11.559 11.600 11.749
Capital and Other Reimbursements (44.411) 36.728 (13.476) (14.806) (15.222) Total Receipts $29.635 $77.070 $28.083 $26.794 $26.527
Expenditures
Labor:
Payroll $4.882 $2.261 $2.284 $2.353 $2.423
Overtime (1.808) - - - -
Health and Welfare - - - - -
OPEB Current Payment - - - - -
Pensions - - - - -
Other Fringe Benefits (0.138) (2.418) 0.582 0.596 0.609
GASB Account (7.233) (8.003) (8.892) (9.790) (10.770)
Reimbursable Overhead - - - - - Total Labor Expenditures ($4.297) ($8.160) ($6.026) ($6.841) ($7.738)
Non-Labor:
Electric Power ($23.077) ($10.552) ($2.783) ($2.969) ($3.168)
Fuel 2.000 (2.489) - - -
Insurance (1.216) 1.447 0.474 (0.574) 0.536
Claims 2.577 0.269 1.269 1.275 1.282
Paratransit Service Contracts - - - - -
Maintenance and Other Operating Contracts 7.868 (8.936) (0.300) (0.300) (0.300)
Professional Service Contracts 1.843 2.581 3.000 3.150 3.307
Materials & Supplies 32.032 1.422 11.000 2.000 2.400
Other Business Expenditures 0.575 0.418 0.418 0.432 0.447 Total Non-Labor Expenses $22.602 ($15.840) $13.078 $3.014 $4.504
Other Expenditures Adjustments:
Other ($29.000) ($29.000) ($30.000) ($30.000) ($30.000)
Total Other Expenditures Adjustments ($29.000) ($29.000) ($30.000) ($30.000) ($30.000)
Total Cash Conversion Adjustments before Depreciation and GASB Adjs.
$18.940 $24.070 $5.135 ($7.033) ($6.707)
Depreciation Adjustment $314.997 $317.060 $309.279 $298.284 $307.186
OPEB Obligation 74.940 77.250 79.568 81.955 84.413
Environmental Remediation 2.254 2.000 2.000 2.000 2.000
Cash Timing and Availability Adjustment (0.661) - - - -
Total Cash Conversion Adjustments $410.470 $420.380 $395.982 $375.206 $386.892
Cash Conversion (Cash Flow Adjustments)($ in millions)
*Effective 2012, the non-labor account structure of the MTA standard chart of accounts has been adjusted to reflect the reclassification and renaming of certain accounts in order to improve account reporting consistency among the Agencies. These changes, which affect most non-labor accounts presented on the attached tables, result in no net-impact to the bottom line. In order to maintain comparability with 2011 actual results for year-end reporting purposes, the 2011 account structure remains unchanged.
MTA LONG ISLAND RAIL ROADFebruary Financial Plan 2012 - 2015

MTA LONG ISLAND RAIL ROAD2012 Adopted Budget
2012 Non-Reimbursable/Reimbursable Overtime($ in millions)
NON-REIMBURSABLE OVERTIME Hours $ %
SCHEDULED:
Direct Service 505,834 $24.225 33.2%
Programmed Maintenance 26,654 1.226 1.7%
Total Scheduled 532,488 $25.451 34.8%
UNSCHEDULED:Vacancy/Absentee Coverage 488,948 $22.278 30.5%
Weather Emergencies 59,209 2.818 3.9%
Maintenance 464,335 21.470 29.4%
Service Delays
Emergencies 6,500 0.299 0.4%
Tour Length
Safety/Security/Law Enforcement
All Other 17,789 0.755 1.0%
Total Unscheduled 1,036,780 $47.620 65.2%
TOTAL NON-REIMBURSABLE OVERTIME: 1,569,268 $73.071 100.0%
REIMBURSABLE OVERTIME 189,137 $9.568
TOTAL OVERTIME 1,758,405 $82.639
Total

2011 2012Final Adopted
Estimate Budget 2013 2014 2015
RIDERSHIP
Monthly 45.092 45.642 45.968 46.342 46.712Weekly 1.605 1.611 1.624 1.637 1.649
Total Commutation 46.698 47.252 47.592 47.979 48.362
One-Way Full Fare 7.493 7.518 7.576 7.637 7.697
One-Way Off Peak 17.109 17.166 17.299 17.438 17.575
All Other 9.050 9.041 9.123 9.162 9.227
Total Non Commutation 33.652 33.724 33.998 34.236 34.499
Total Ridership 80.350 80.977 81.589 82.215 82.861
FAREBOX REVENUE
Passenger Revenue $567.454 $570.727 $575.234 $579.630 $584.163
Total Revenue $567.454 $570.727 $575.234 $579.630 $584.163
February Financial Plan 2012 - 2015MTA LONG ISLAND RAIL ROAD
Ridership/ (Utilization)(in millions)

2011Final
Estimate
2012 Adopted Budget 2013 2014 2015
AdministrationExecutive VP 2 2 2 2 2Labor Relations 10 10 10 10 10Procurement & Logistics (excl. Stores) 84 82 82 82 82Human Resources 76 32 32 38 48Sr VP Administration 2 2 2 2 2Strategic Investments 39 43 43 43 43President 4 4 4 4 4VP & CFO/Pensions 9 9 9 9 9Information Technology 160 160 160 160 160Controller 41 41 41 41 41Management and Budget 18 18 18 18 18Process Re-Engineering 6 6 6 6 6VP - East Side Access & Special Projects 26 26 26 26 26Market Dev. & Public Affairs 61 61 61 61 61Gen. Counsel & Secretary 30 30 30 30 30Diversity Management 2 2 2 2 2System Safety/Training 20 64 64 64 64Security 5 5 5 5 5Sr VP Operations/Oper. S/A & Serv. Planning 39 39 39 39 39
Total Administration 634 636 636 642 652
OperationsTrain Operations 1,792 1,814 1,811 1,968 2,060Customer Services 294 285 285 285 286
Total Operations 2,086 2,099 2,096 2,253 2,346
MaintenanceEngineering 1,591 1,555 1,594 1,613 1,631Equipment 1,958 2,012 1,993 1,998 2,022Procurement (Stores) 94 93 93 93 93
Total Maintenance 3,643 3,660 3,680 3,704 3,746
Engineering/CapitalDepartment of Project Management 117 113 113 113 113
Total Engineering/Capital 117 113 113 113 113
Total Baseline Positions 6,480 6,508 6,525 6,712 6,857
Non-Reimbursable 5,849 5,940 5,904 6,091 6,243Reimbursable 631 568 621 621 614
Total Full-Time 6,480 6,508 6,525 6,712 6,857 Total Full-Time Equivalents
NOTE: In 2014, total non-reimbursable positions of 6,091 reflects a rounding correction.
FUNCTION/DEPARTMENT
MTA LONG ISLAND RAIL ROADFebruary Financial Plan 2012 - 2015
Total Positions by Function and DepartmentNon-Reimbursable/Reimbursable and Full-Time/Full-Time Equivalents

FUNCTION/OCCUPATIONAL GROUP
2011Final
Estimate
2012 Adopted Budget 2013 2014 2015
Administration Managers/Supervisors 326 332 332 338 348 Professional, Technical, Clerical 308 304 304 304 304 Operational Hourlies - - - - -
Total Administration 634 636 636 642 652
Operations Managers/Supervisors 299 304 304 303 304 Professional, Technical, Clerical 159 151 151 151 151 Operational Hourlies 1,628 1,644 1,641 1,799 1,891
Total Operations 2,086 2,099 2,096 2,253 2,346
Maintenance Managers/Supervisors 682 688 689 693 729 Professional, Technical, Clerical 256 260 262 262 264 Operational Hourlies 2,705 2,712 2,729 2,749 2,753
Total Maintenance 3,643 3,660 3,680 3,704 3,746
Engineering/Capital Managers/Supervisors 97 95 95 95 95 Professional, Technical, Clerical 20 18 18 18 18 Operational Hourlies - - - - -
Total Engineering/Capital 117 113 113 113 113
Public Safety Managers/Supervisors - - - - - Professional, Technical, Clerical - - - - - Operational Hourlies - - - - -
Total Public Safety - - - - -
Total Positions Managers/Supervisors 1,404 1,419 1,420 1,429 1,476 Professional, Technical, Clerical 743 733 735 735 737 Operational Hourlies 4,333 4,356 4,370 4,548 4,644
Total Baseline Positions 6,480 6,508 6,525 6,712 6,857
MTA LONG ISLAND RAIL ROADFebruary Financial Plan 2012 - 2015
Total Positions by Function and Occupation

NON-REIMBURSABLEJan Feb Mar Apr May Jun Jul Aug Sep Oct Nov Dec Total
Operating RevenueFarebox Revenue $44.174 $42.674 $46.134 $46.434 $47.691 $50.068 $51.589 $49.949 $48.423 $47.667 $47.377 $48.547 $570.727Vehicle Toll Revenue - - - - - - - - - - - - - Other Operating Revenue 2.891 2.937 3.701 3.029 3.984 3.055 3.213 3.256 2.883 2.831 3.153 5.762 40.695 Capital and Other Reimbursements - - - - - - - - - - - - - Total Revenue $47.065 $45.611 $49.835 $49.463 $51.675 $53.123 $54.802 $53.205 $51.306 $50.498 $50.530 $54.309 $611.422
Operating ExpensesLabor:Payroll $35.509 $34.716 $35.357 $33.092 $34.369 $34.142 $33.824 $37.433 $33.215 $34.817 $36.061 $35.398 $417.933Overtime 6.240 6.466 4.700 5.611 6.087 5.298 7.146 5.640 5.714 6.613 6.345 7.211 73.071Health and Welfare 7.978 8.031 7.763 7.637 7.518 7.833 7.630 7.771 7.775 7.554 7.882 7.929 93.301OPEB Current Payment 5.078 5.078 5.078 5.078 5.078 5.078 5.078 5.078 5.078 5.078 5.078 5.082 60.940Pensions 16.764 16.878 16.436 16.212 16.005 16.446 16.231 16.456 16.498 16.162 16.657 16.757 197.502Other Fringe Benefits 9.728 9.317 8.877 8.842 10.015 9.091 10.347 9.011 8.392 8.099 6.946 6.397 105.062Reimbursable Overhead (1.881) (1.691) (2.426) (2.799) (3.144) (2.410) (2.767) (2.392) (2.324) (2.883) (2.059) (1.893) (28.669)Total Labor Expenses $79.416 $78.795 $75.785 $73.673 $75.928 $75.478 $77.489 $78.997 $74.348 $75.440 $76.910 $76.881 $919.140
Non-Labor:Electric Power $9.114 $9.154 $8.182 $7.983 $8.574 $9.340 $9.633 $9.045 $8.419 $8.644 $9.055 $8.329 $105.472Fuel 2.188 1.975 2.198 2.166 2.369 2.398 2.428 2.508 2.367 2.370 2.280 2.179 27.424Insurance 1.309 1.309 1.321 1.321 1.359 1.359 1.360 1.360 1.360 1.360 1.387 1.399 16.204Claims 0.283 0.283 0.283 0.283 0.283 0.283 0.283 0.283 0.283 0.283 0.283 0.288 3.401Paratransit Service Contracts - - - - - - - - - - - - 0.000Maintenance and Other Operating Contracts 5.112 5.233 4.963 4.794 4.801 4.733 4.880 4.845 4.864 4.533 4.992 4.935 58.685Professional Service Contracts 2.213 2.848 2.932 2.786 2.786 2.940 2.788 2.789 2.916 2.781 2.787 3.267 33.833Materials & Supplies 8.380 8.402 8.398 8.411 8.373 8.459 8.493 8.932 8.478 8.463 8.521 8.530 101.840Other Business Expenses 1.276 1.141 1.256 1.191 1.216 1.315 1.267 1.331 1.267 1.251 1.245 0.945 14.701Total Non-Labor Expenses $29.875 $30.345 $29.533 $28.935 $29.761 $30.827 $31.132 $31.093 $29.954 $29.685 $30.550 $29.872 $361.560
Other Expenses Adjustments:Other - Total Other Expense Adjustments $0.000 $0.000 $0.000 $0.000 $0.000 $0.000 $0.000 $0.000 $0.000 $0.000 $0.000 $0.000 $0.000
Total Expenses before Non-Cash Liability Adjs. $109.291 $109.140 $105.318 $102.608 $105.689 $106.305 $108.621 $110.090 $104.302 $105.125 $107.460 $106.753 $1,280.700
Depreciation $26.422 $26.422 $26.422 $26.422 $26.422 $26.422 $26.422 $26.422 $26.422 $26.422 $26.422 $26.418 $317.060OPEB Obligation 6.438 6.438 6.438 6.438 6.438 6.438 6.438 6.438 6.438 6.438 6.438 6.432 77.250Environmental Remediation 0.167 0.167 0.167 0.167 0.167 0.167 0.167 0.167 0.167 0.167 0.167 0.163 2.000
Total Expenses $142.318 $142.167 $138.345 $135.635 $138.716 $139.332 $141.648 $143.117 $137.329 $138.152 $140.487 $139.766 $1,677.010
Net Surplus/(Deficit) ($95.253) ($96.556) ($88.510) ($86.172) ($87.041) ($86.209) ($86.846) ($89.912) ($86.023) ($87.654) ($89.957) ($85.457) ($1,065.588)
Cash Conversion Adjustments:Depreciation $26.422 $26.422 $26.422 $26.422 $26.422 $26.422 $26.422 $26.422 $26.422 $26.422 $26.422 $26.418 $317.060Operating Capital (0.544) (0.780) (0.578) (0.618) (0.618) (1.707) (0.544) (0.544) (0.544) (0.670) (0.670) (0.672) (8.489)Other Cash Adjustments 7.338 9.189 (3.170) 2.120 (3.488) 4.611 14.320 8.674 12.954 13.110 19.597 26.553 111.808Total Cash Conversion Adjustments $33.216 $34.831 $22.674 $27.924 $22.316 $29.326 $40.198 $34.552 $38.832 $38.862 $45.349 $52.299 $420.379
Baseline Net Cash Surplus/(Deficit) ($62.037) ($61.725) ($65.836) ($58.248) ($64.725) ($56.883) ($46.648) ($55.360) ($47.191) ($48.792) ($44.608) ($33.158) ($645.209)
MTA LONG ISLAND RAIL ROAD
Accrual Statement of Operations by CategoryFebruary Financial Plan - 2012 Adopted Budget
($ in millions)

REIMBURSABLEJan Feb Mar Apr May Jun Jul Aug Sep Oct Nov Dec Total
RevenueFarebox Revenue $0.000 $0.000 $0.000 $0.000 $0.000 $0.000 $0.000 $0.000 $0.000 $0.000 $0.000 $0.000 $0.000Vehicle Toll Revenue - - - - - - - - - - - - - Other Operating Revenue - - - - - - - - - - - - - Capital and Other Reimbursements 14.003 13.213 18.016 20.424 22.070 18.986 19.631 17.722 17.256 20.508 15.568 14.103 211.500 Total Revenue $14.003 $13.213 $18.016 $20.424 $22.070 $18.986 $19.631 $17.722 $17.256 $20.508 $15.568 $14.103 $211.500
ExpensesLabor:Payroll $4.958 $4.482 $6.031 $6.438 $7.592 $5.952 $6.969 $5.915 $5.666 $7.218 $5.224 $5.104 $71.548Overtime 0.432 0.415 0.796 1.560 1.155 0.876 0.725 0.871 0.992 0.767 0.678 0.301 $9.568Health and Welfare 0.823 0.747 1.037 1.184 1.321 1.031 1.173 1.024 0.997 1.219 0.892 0.826 $12.274OPEB Current Payment - - - - - - - - - - - - $0.000Pensions 1.244 1.129 1.571 1.795 2.003 1.562 1.776 1.551 1.510 1.846 1.350 1.249 $18.586Other Fringe Benefits 0.991 0.899 1.248 1.426 1.591 1.241 1.413 1.233 1.200 1.468 1.075 0.998 $14.783Reimbursable Overhead 1.881 1.691 2.426 2.799 3.144 2.410 2.767 2.392 2.324 2.883 2.059 1.893 $28.669Total Labor Expenses $10.329 $9.363 $13.109 $15.202 $16.806 $13.072 $14.823 $12.986 $12.689 $15.401 $11.278 $10.371 $155.428
Non-Labor:Electric Power $0.000 $0.000 $0.000 $0.000 $0.000 $0.000 $0.000 $0.000 $0.000 $0.000 $0.000 $0.000 $0.000Fuel - - - - - - - - - - - - 0.000Insurance 0.271 0.240 0.453 0.543 0.576 0.442 0.484 0.435 0.420 0.507 0.342 0.270 4.983Claims - - - - - - - - - - - - 0.000Paratransit Service Contracts - - - - - - - - - - - - 0.000Maintenance and Other Operating Contracts 0.565 0.511 0.801 0.909 0.959 0.892 0.858 0.776 0.748 0.881 0.646 0.548 9.094Professional Service Contracts 0.214 0.212 0.234 0.240 0.244 0.232 0.236 0.232 0.229 0.239 0.222 0.214 2.748Materials & Supplies 2.619 2.882 3.412 3.522 3.477 4.341 3.223 3.286 3.164 3.472 3.074 2.697 39.169Other Business Expenses 0.005 0.005 0.007 0.008 0.008 0.007 0.007 0.007 0.006 0.008 0.006 0.004 0.078Total Non-Labor Expenses $3.674 $3.850 $4.907 $5.222 $5.264 $5.914 $4.808 $4.736 $4.567 $5.107 $4.290 $3.733 $56.072
Other Adjustments:Other 0.000Total Other Adjustments $0.000 $0.000 $0.000 $0.000 $0.000 $0.000 $0.000 $0.000 $0.000 $0.000 $0.000 $0.000 $0.000
Total Expenses before Non-Cash Liability Adjs. $14.003 $13.213 $18.016 $20.424 $22.070 $18.986 $19.631 $17.722 $17.256 $20.508 $15.568 $14.103 $211.500
Depreciation $0.000 $0.000 $0.000 $0.000 $0.000 $0.000 $0.000 $0.000 $0.000 $0.000 $0.000 $0.000 $0.000OPEB Obligation 0.000
Total Expenses $14.003 $13.213 $18.016 $20.424 $22.070 $18.986 $19.631 $17.722 $17.256 $20.508 $15.568 $14.103 $211.500
Baseline Net Surplus/(Deficit) $0.000 $0.000 $0.000 $0.000 $0.000 $0.000 $0.000 $0.000 $0.000 $0.000 $0.000 ($0.000) $0.000
Accrual Statement of Operations by Category($ in millions)
MTA LONG ISLAND RAIL ROADFebruary Financial Plan - 2012 Adopted Budget

NON-REIMBURSABLE / REIMBURSABLEJan Feb Mar Apr May Jun Jul Aug Sep Oct Nov Dec Total
RevenueFarebox Revenue $44.174 $42.674 $46.134 $46.434 $47.691 $50.068 $51.589 $49.949 $48.423 $47.667 $47.377 $48.547 $570.727Vehicle Toll Revenue - - - - - - - - - - - - - Other Operating Revenue 2.891 2.937 3.701 3.029 3.984 3.055 3.213 3.256 2.883 2.831 3.153 5.762 40.695 Capital and Other Reimbursements 14.003 13.213 18.016 20.424 22.070 18.986 19.631 17.722 17.256 20.508 15.568 14.103 211.500 Total Revenue $61.068 $58.824 $67.851 $69.887 $73.745 $72.109 $74.433 $70.927 $68.562 $71.006 $66.098 $68.412 $822.922
ExpensesLabor:Payroll $40.467 $39.198 $41.388 $39.530 $41.961 $40.094 $40.793 $43.348 $38.881 $42.035 $41.285 $40.501 $489.481Overtime 6.672 6.881 5.496 7.171 7.242 6.174 7.871 6.511 6.706 7.380 7.023 7.512 82.639 Health and Welfare 8.801 8.778 8.800 8.821 8.839 8.864 8.803 8.795 8.772 8.773 8.774 8.755 105.575 OPEB Current Payment 5.078 5.078 5.078 5.078 5.078 5.078 5.078 5.078 5.078 5.078 5.078 5.082 60.940 Pensions 18.008 18.007 18.007 18.007 18.008 18.008 18.007 18.007 18.008 18.008 18.007 18.006 216.088 Other Fringe Benefits 10.719 10.216 10.125 10.268 11.606 10.332 11.760 10.244 9.592 9.567 8.021 7.395 119.845 Reimbursable Overhead - - - - - - - - - - - (0.000) (0.000) Total Labor Expenses $89.745 $88.158 $88.894 $88.875 $92.734 $88.550 $92.312 $91.983 $87.037 $90.841 $88.188 $87.251 $1,074.568
Non-Labor:Electric Power $9.114 $9.154 $8.182 $7.983 $8.574 $9.340 $9.633 $9.045 $8.418 $8.645 $9.055 $8.329 $105.472Fuel 2.188 1.975 2.197 2.166 2.369 2.398 2.428 2.508 2.367 2.370 2.279 2.179 27.424 Insurance 1.580 1.549 1.774 1.864 1.935 1.801 1.844 1.795 1.780 1.867 1.729 1.669 21.187 Claims 0.283 0.283 0.283 0.283 0.283 0.283 0.283 0.283 0.283 0.283 0.283 0.288 3.401 Paratransit Service Contracts - - - - - - - - - - - - - Maintenance and Other Operating Contracts 5.677 5.744 5.764 5.703 5.760 5.625 5.738 5.621 5.612 5.414 5.638 5.483 67.779 Professional Service Contracts 2.427 3.060 3.166 3.026 3.030 3.172 3.024 3.021 3.145 3.020 3.009 3.481 36.581 Materials & Supplies 10.999 11.284 11.810 11.933 11.850 12.800 11.716 12.218 11.642 11.935 11.595 11.227 141.009 Other Business Expenses 1.281 1.146 1.263 1.199 1.224 1.322 1.274 1.338 1.273 1.259 1.251 0.949 14.779 Total Non-Labor Expenses $33.549 $34.195 $34.439 $34.157 $35.025 $36.741 $35.940 $35.829 $34.520 $34.793 $34.839 $33.605 $417.632
Other Expenses Adjustments:Other $0.000 $0.000 $0.000 $0.000 $0.000 $0.000 $0.000 $0.000 $0.000 $0.000 $0.000 $0.000 $0.000Total Other Expense Adjustments $0.000 $0.000 $0.000 $0.000 $0.000 $0.000 $0.000 $0.000 $0.000 $0.000 $0.000 $0.000 $0.000
Total Expenses before Non-Cash Liability Adjs. $123.294 $122.353 $123.333 $123.032 $127.759 $125.291 $128.252 $127.812 $121.557 $125.634 $123.027 $120.855 $1,492.199
Depreciation $26.422 $26.422 $26.422 $26.422 $26.422 $26.422 $26.422 $26.422 $26.422 $26.422 $26.422 $26.418 $317.060OPEB Obligation 6.438 6.438 6.438 6.438 6.438 6.438 6.438 6.438 6.438 6.438 6.438 6.432 77.250 Environmental Remediation 0.167 0.167 0.167 0.167 0.167 0.167 0.167 0.167 0.167 0.167 0.167 0.163 2.000
Total Expenses $156.321 $155.380 $156.360 $156.059 $160.786 $158.318 $161.279 $160.839 $154.584 $158.661 $156.054 $153.868 $1,888.509
Net Surplus/(Deficit) ($95.253) ($96.556) ($88.509) ($86.172) ($87.041) ($86.209) ($86.846) ($89.912) ($86.022) ($87.655) ($89.956) ($85.456) ($1,065.587)
Cash Conversion Adjustments:Depreciation $26.422 $26.422 $26.422 $26.422 $26.422 $26.422 $26.422 $26.422 $26.422 $26.422 $26.422 $26.418 $317.060Operating Capital (0.544) (0.780) (0.578) (0.618) (0.618) (1.707) (0.544) (0.544) (0.544) (0.670) (0.670) (0.672) (8.489)Other Cash Adjustments 7.338 9.189 (3.170) 2.120 (3.488) 4.611 14.320 8.674 12.954 13.110 19.597 26.553 111.808Total Cash Conversion Adjustments $33.216 $34.831 $22.674 $27.924 $22.316 $29.326 $40.198 $34.552 $38.832 $38.862 $45.349 $52.299 $420.379
Net Cash Surplus/(Deficit) ($62.037) ($61.725) ($65.835) ($58.248) ($64.725) ($56.883) ($46.648) ($55.360) ($47.190) ($48.793) ($44.607) ($33.157) ($645.208)
MTA LONG ISLAND RAIL ROADFebruary Financial Plan - 2012 Adopted BudgetAccrual Statement of Operations by Category
($ in millions)

CASH RECEIPTS AND EXPENDITURESJan Feb Mar Apr May Jun Jul Aug Sep Oct Nov Dec Total
ReceiptsFarebox Revenue $46.591 $45.091 $48.550 $48.851 $50.108 $52.485 $54.005 $52.366 $50.839 $50.083 $49.794 $50.964 $599.727Vehicle Toll Revenue - - - - - - - - - - - - - Other Operating Revenue 3.845 3.858 4.622 3.951 4.990 3.977 4.212 4.170 3.796 3.821 4.060 6.735 52.037Capital and Other Reimbursements 16.535 16.643 17.384 17.491 16.616 20.414 19.407 21.139 18.056 18.731 30.172 35.640 248.228Total Receipts $66.971 $65.592 $70.556 $70.293 $71.714 $76.876 $77.624 $77.675 $72.691 $72.635 $84.026 $93.339 $899.992
ExpendituresLabor:Payroll $36.672 $37.616 $45.486 $36.966 $43.873 $40.219 $37.619 $46.609 $37.728 $38.488 $45.261 $40.683 $487.220Overtime 6.672 6.880 6.295 6.671 6.942 6.175 7.072 7.312 6.706 7.080 7.323 7.511 82.639Health and Welfare 8.800 8.777 8.799 8.820 8.839 8.863 8.803 8.795 8.771 8.772 8.775 8.761 105.575OPEB Current Payment 5.078 5.078 5.078 5.078 5.078 5.078 5.078 5.078 5.078 5.078 5.078 5.082 60.940Pensions 18.007 18.007 18.007 18.007 18.007 18.007 18.007 18.007 18.007 18.007 18.007 18.011 216.088Other Fringe Benefits 10.886 10.244 12.060 11.096 10.036 12.456 10.637 11.573 9.191 8.744 8.976 6.364 122.263GASB Account 0.000 0.000 0.000 0.000 0.000 0.000 0.000 0.000 0.000 0.000 0.000 8.003 8.003Reimbursable Overhead 0.000 0.000 0.000 0.000 0.000 0.000 0.000 0.000 0.000 0.000 0.000 0.000 0.000Total Labor Expenditures $86.115 $86.602 $95.725 $86.638 $92.775 $90.798 $87.216 $97.374 $85.481 $86.169 $93.420 $94.415 $1,082.728
Non-Labor:Electric Power $10.088 $10.429 $9.931 $9.732 $10.324 $11.090 $9.850 $9.262 $8.636 $8.862 $9.272 $8.548 $116.024Fuel 2.569 2.356 2.579 2.547 2.851 2.879 2.428 2.508 2.367 2.370 2.279 2.180 29.913Insurance 4.519 2.125 0.464 1.570 2.473 0.442 2.230 1.407 0.420 1.586 2.239 0.265 19.740Claims 0.344 0.344 0.344 0.344 0.344 0.344 0.178 0.178 0.178 0.178 0.178 0.178 3.132Paratransit Service Contracts 0.000 0.000 0.000 0.000 0.000 0.000 0.000 0.000 0.000 0.000 0.000 0.000 0.000Maintenance and Other Operating Contracts 6.702 7.268 7.289 7.228 7.286 7.286 5.763 5.645 5.637 5.438 5.663 5.510 76.715Professional Service Contracts 2.944 2.576 2.683 3.543 2.466 2.589 3.440 2.438 2.562 3.437 2.426 2.896 34.000Materials & Supplies 12.063 12.095 13.745 13.366 14.296 14.634 9.489 10.522 10.947 9.730 9.535 9.165 139.587Other Business Expenditures 1.247 1.105 1.214 1.156 1.207 1.280 1.261 1.284 1.236 1.241 1.204 0.926 14.361Total Non-Labor Expenditures $40.476 $38.298 $38.249 $39.486 $41.247 $40.544 $34.639 $33.244 $31.983 $32.842 $32.796 $29.668 $433.472
Other Adjustments:Other $2.417 $2.417 $2.417 $2.417 $2.417 $2.417 $2.417 $2.417 $2.417 $2.417 $2.417 $2.413 $29.000
Total Other Expenditure Adjustments $2.417 $2.417 $2.417 $2.417 $2.417 $2.417 $2.417 $2.417 $2.417 $2.417 $2.417 $2.413 $29.000
Total Expenditures $129.008 $127.317 $136.391 $128.541 $136.439 $133.759 $124.272 $133.035 $119.881 $121.428 $128.633 $126.496 $1,545.200
Cash Timing and Availability Adjustments - - - - - - - - - - - - -
Baseline Net Cash Deficit ($62.037) ($61.725) ($65.835) ($58.248) ($64.725) ($56.883) ($46.648) ($55.360) ($47.190) ($48.793) ($44.607) ($33.157) ($645.208)
Cash Receipts & Expenditures($ in millions)
February Financial Plan - 2012 Adopted BudgetMTA LONG ISLAND RAIL ROAD

CASH FLOW ADJUSTMENTSJan Feb Mar Apr May Jun Jul Aug Sep Oct Nov Dec Total
ReceiptsFarebox Revenue $2.417 $2.417 $2.416 $2.417 $2.417 $2.417 $2.416 $2.417 $2.416 $2.416 $2.417 $2.417 $29.000Vehicle Toll Revenue 0.000 0.000 0.000 0.000 0.000 0.000 0.000 0.000 0.000 0.000 0.000 0.000 0.000Other Operating Revenue 0.954 0.921 0.921 0.922 1.006 0.922 0.999 0.914 0.913 0.990 0.907 0.973 11.342Capital and Other Reimbursements 2.532 3.430 (0.632) (2.933) (5.454) 1.428 (0.224) 3.417 0.800 (1.777) 14.604 21.537 36.728Total Receipts $5.903 $6.768 $2.705 $0.406 ($2.031) $4.767 $3.191 $6.748 $4.129 $1.629 $17.928 $24.927 $77.070
ExpendituresLabor:Payroll $3.795 $1.582 ($4.098) $2.564 ($1.912) ($0.125) $3.174 ($3.261) $1.153 $3.547 ($3.976) ($0.182) $2.261Overtime 0.000 0.001 (0.799) 0.500 0.300 (0.001) 0.799 (0.801) 0.000 0.300 (0.300) 0.001 0.000Health and Welfare 0.001 0.001 0.001 0.001 0.000 0.001 0.000 0.000 0.001 0.001 (0.001) (0.006) 0.000OPEB Current Payment 0.000 0.000 0.000 0.000 0.000 0.000 0.000 0.000 0.000 0.000 0.000 0.000 0.000Pensions 0.001 0.000 0.000 0.000 0.001 0.001 0.000 0.000 0.001 0.001 0.000 (0.005) 0.000Other Fringe Benefits (0.167) (0.028) (1.935) (0.828) 1.570 (2.124) 1.123 (1.329) 0.401 0.823 (0.955) 1.031 (2.418)GASB Account 0.000 0.000 0.000 0.000 0.000 0.000 0.000 0.000 0.000 0.000 0.000 (8.003) (8.003)Reimbursable Overhead 0.000 0.000 0.000 0.000 0.000 0.000 0.000 0.000 0.000 0.000 0.000 (0.000) (0.000)Total Labor Expenditures $3.630 $1.556 ($6.831) $2.237 ($0.041) ($2.248) $5.096 ($5.391) $1.556 $4.672 ($5.232) ($7.164) ($8.160)
Non-Labor:Electric Power ($0.974) ($1.275) ($1.749) ($1.749) ($1.750) ($1.750) ($0.217) ($0.217) ($0.218) ($0.217) ($0.217) ($0.219) ($10.552)Fuel (0.381) (0.381) (0.382) (0.381) (0.482) (0.481) 0.000 0.000 0.000 0.000 0.000 (0.001) (2.489)Insurance (2.939) (0.576) 1.310 0.294 (0.538) 1.359 (0.386) 0.388 1.360 0.281 (0.510) 1.404 1.447Claims (0.061) (0.061) (0.061) (0.061) (0.061) (0.061) 0.105 0.105 0.105 0.105 0.105 0.110 0.269Paratransit Service Contracts 0.000 0.000 0.000 0.000 0.000 0.000 0.000 0.000 0.000 0.000 0.000 0.000 0.000Maintenance and Other Operating Contracts (1.025) (1.524) (1.525) (1.525) (1.526) (1.661) (0.025) (0.024) (0.025) (0.024) (0.025) (0.027) (8.936)Professional Service Contracts (0.517) 0.484 0.483 (0.517) 0.564 0.583 (0.416) 0.583 0.583 (0.417) 0.583 0.585 2.581Materials & Supplies (1.064) (0.811) (1.935) (1.433) (2.446) (1.834) 2.227 1.696 0.695 2.205 2.060 2.062 1.422Other Business Expenditures 0.034 0.041 0.049 0.043 0.017 0.042 0.013 0.054 0.037 0.018 0.047 0.023 0.418Total Non-Labor Expenditures ($6.927) ($4.103) ($3.810) ($5.329) ($6.222) ($3.803) $1.301 $2.585 $2.537 $1.951 $2.043 $3.937 ($15.840)
Other Adjustments:Other ($2.417) ($2.417) ($2.417) ($2.417) ($2.417) ($2.417) ($2.417) ($2.417) ($2.417) ($2.417) ($2.417) ($2.413) ($29.000)Total Other Expenditures Adjustments ($2.417) ($2.417) ($2.417) ($2.417) ($2.417) ($2.417) ($2.417) ($2.417) ($2.417) ($2.417) ($2.417) ($2.413) ($29.000)
Total Cash Conversion Adjustments before Non-Cash Liability Adjs.
$0.189 $1.804 ($10.353) ($5.103) ($10.711) ($3.701) $7.171 $1.525 $5.805 $5.835 $12.322 $19.286 $24.069
Depreciation Adjustment $26.422 $26.422 $26.422 $26.422 $26.422 $26.422 $26.422 $26.422 $26.422 $26.422 $26.422 $26.418 $317.060OPEB Obligation 6.438 6.438 6.438 6.438 6.438 6.438 6.438 6.438 6.438 6.438 6.438 6.432 77.250Environmental Remediation 0.167 0.167 0.167 0.167 0.167 0.167 0.167 0.167 0.167 0.167 0.167 0.163 2.000
Baseline Total Cash Conversion Adjustments $33.216 $34.831 $22.674 $27.924 $22.316 $29.326 $40.198 $34.552 $38.832 $38.862 $45.349 $52.299 $420.379
February Financial Plan - 2012 Adopted BudgetMTA LONG ISLAND RAIL ROAD
($ in millions)Cash Conversion (Cash Flow Adjustments)

MTA LONG ISLAND RAIL ROADFebruary Financial Plan - 2012 Adopted Budget
Overtime - Non-Reimbursable/Reimbursable Basis($ in millions)
NON-REIMBURSABLESCHEDULED:
Direct Service $2.535 $2.654 $1.299 $2.065 $2.074 $1.290 $2.071 $1.225 $1.906 $2.285 $2.645 $2.175 $24.225
Programmed Maintenance 0.090 0.075 0.143 0.143 0.107 0.084 0.089 0.075 0.112 0.125 0.101 0.084 1.226
Total Scheduled $2.625 $2.729 $1.442 $2.207 $2.181 $1.374 $2.160 $1.300 $2.018 $2.410 $2.747 $2.258 $25.451
UNSCHEDULED:
Vacancy/Absentee Coverage $1.235 $1.467 $1.220 $1.608 $1.671 $1.953 $2.725 $2.367 $1.850 $1.995 $1.792 $2.394 $22.278
Weather Emergencies 0.577 0.574 0.374 0.080 0.086 0.080 0.086 0.080 0.080 0.086 0.162 0.554 2.818
Maintenance 1.706 1.604 1.572 1.625 2.052 1.801 2.089 1.811 1.685 2.035 1.562 1.928 21.470
Emergencies 0.029 0.023 0.023 0.023 0.029 0.023 0.029 0.023 0.023 0.029 0.023 0.023 0.299
Safety/Security/Law Enforcement 0.000
All Other 0.063 0.063 0.063 0.063 0.063 0.063 0.063 0.063 0.063 0.063 0.063 0.063 0.755
Total Unscheduled $3.610 $3.731 $3.251 $3.399 $3.900 $3.920 $4.991 $4.345 $3.701 $4.207 $3.602 $4.962 $47.620
TOTAL NON-REIMBURSABLE OVERTIME $6.235 $6.460 $4.694 $5.606 $6.082 $5.293 $7.151 $5.645 $5.719 $6.617 $6.349 $7.221 $73.071
REIMBURSABLE OVERTIME $0.437 $0.421 $0.802 $1.565 $1.160 $0.882 $0.721 $0.867 $0.987 $0.763 $0.674 $0.290 $9.568
TOTAL NR & R Overtime $6.672 $6.881 $5.495 $7.171 $7.242 $6.175 $7.872 $6.512 $6.706 $7.380 $7.023 $7.510 $82.639
Jan Feb Mar Apr May Jun TotalJul Aug Sep Oct Nov Dec

MTA LONG ISLAND RAIL ROADFebruary Financial Plan - 2012 Adopted Budget
Ridership/Utilization(in millions)
Jan Feb Mar Apr May Jun Jul Aug Sep Oct Nov Dec TotalRIDERSHIP
Monthly 3.632 3.629 4.051 3.824 3.985 3.862 3.683 3.860 3.508 4.256 3.736 3.615 45.642Weekly 0.122 0.114 0.127 0.130 0.123 0.143 0.165 0.192 0.135 0.135 0.100 0.123 1.611Total Commutation 3.754 3.743 4.178 3.955 4.108 4.006 3.848 4.052 3.644 4.391 3.836 3.738 47.252
One-Way Full Fare 0.548 0.515 0.600 0.607 0.646 0.679 0.711 0.707 0.654 0.643 0.595 0.611 7.518One-Way Off-Peak 1.261 1.117 1.302 1.350 1.451 1.517 1.681 1.659 1.486 1.362 1.429 1.550 17.166All Other 0.642 0.616 0.707 0.745 0.762 0.824 0.881 0.800 0.758 0.742 0.746 0.818 9.041Total Non-Commutation 2.451 2.248 2.609 2.703 2.859 3.020 3.273 3.165 2.898 2.748 2.770 2.979 33.724
Total Ridership 6.205 5.991 6.788 6.657 6.967 7.025 7.121 7.217 6.542 7.139 6.607 6.717 80.977
FAREBOX REVENUE
Passenger Revenue $44.174 $42.674 $46.134 $46.434 $47.691 $50.068 $51.589 $49.949 $48.423 $47.667 $47.377 $48.547 $570.727Total Revenue $44.174 $42.674 $46.134 $46.434 $47.691 $50.068 $51.589 $49.949 $48.423 $47.667 $47.377 $48.547 $570.727

Jan Feb Mar Apr May Jun Jul Aug Sep Oct Nov DecAdministration
Executive VP 2 2 3 2 2 3 2 2 2 2 2 2Labor Relations 10 10 10 10 10 10 10 10 10 10 10 10Procurement & Logistics (excl. Stores) 82 82 82 82 82 82 82 82 82 82 82 82Human Resources 32 32 32 33 32 32 32 32 32 32 32 32Sr VP Administration 2 2 2 2 2 2 2 2 2 2 2 2Strategic Investments 38 38 39 39 39 39 41 41 41 42 43 43President 4 4 4 4 4 4 4 4 4 4 4 4VP & CFO/Pensions 9 9 9 9 9 9 9 9 9 9 9 9Information Technology 160 160 160 160 160 160 160 160 160 160 160 160Controller 41 41 41 41 41 41 41 41 41 41 41 41Management and Budget 18 18 18 18 18 18 18 18 18 18 18 18Process Re-Engineering 6 6 6 6 6 6 6 6 6 6 6 6VP - East Side Access & Special Projects 26 26 26 26 26 26 26 26 26 26 26 26Market Dev. & Public Affairs 61 61 61 61 61 61 61 61 61 61 61 61Gen. Counsel & Secretary 30 30 30 30 30 30 30 30 30 30 30 30Diversity Management 2 2 2 2 2 2 2 2 2 2 2 2System Safety/Training 64 64 64 64 64 64 64 64 64 64 64 64Security 5 5 5 5 5 5 5 5 5 5 5 5Sr VP Operations/Oper. S/A & Serv. Planning 39 39 39 39 39 39 39 39 39 39 39 39
Total Administration 631 631 633 633 632 633 634 634 634 635 636 636
OperationsTrain Operations 1,831 1,831 1,831 1,832 1,847 1,851 1,834 1,834 1,830 1,837 1,824 1,814Customer Services 290 290 290 285 287 295 295 295 287 285 285 285
Total Operations 2,121 2,121 2,121 2,117 2,134 2,146 2,129 2,129 2,117 2,122 2,109 2,099
MaintenanceEngineering 1,551 1,533 1,548 1,567 1,554 1,560 1,559 1,552 1,553 1,552 1,556 1,555Equipment 2,029 2,029 2,029 2,029 2,041 2,041 2,014 2,014 2,007 2,003 2,012 2,012Procurement (Stores) 94 94 94 94 94 94 93 93 93 93 93 93
Total Maintenance 3,674 3,656 3,671 3,690 3,689 3,695 3,666 3,659 3,653 3,648 3,661 3,660
Engineering/CapitalDepartment of Project Management 112 112 112 112 112 112 112 112 112 112 112 113
Total Engineering/Capital 112 112 112 112 112 112 112 112 112 112 112 113
Total Positions 6,538 6,520 6,537 6,552 6,567 6,586 6,541 6,534 6,516 6,517 6,518 6,508
Non-Reimbursable 5,933 5,921 5,687 5,662 5,714 5,753 5,759 5,708 5,739 5,706 5,803 5,940Reimbursable 605 599 850 890 853 833 782 826 777 811 715 568
Total Full-Time 6,538 6,520 6,537 6,552 6,567 6,586 6,541 6,534 6,516 6,517 6,518 6,508Total Full-Time-Equivalents
*Reflects Authorized positions
FUNCTION/DEPARTMENT
MTA LONG ISLAND RAIL ROADFebruary Financial Plan - 2012 Adopted Budget
Total Positions by Function and DepartmentNon-Reimbursable/Reimbursable and Full-Time/Full-Time Equivalents

FUNCTION/OCCUPATION Jan Feb Mar Apr May Jun Jul Aug Sep Oct Nov Dec
Administration Managers/Supervisors 327 327 329 328 328 329 330 330 330 331 332 332 Professional, Technical, Clerical 304 304 304 305 304 304 304 304 304 304 304 304 Operational Hourlies - - - - - - - - - - - -
Total Administration 631 631 633 633 632 633 634 634 634 635 636 636
Operations Managers/Supervisors 304 304 304 304 304 305 305 305 304 304 304 304 Professional, Technical, Clerical 157 157 157 153 156 163 163 163 156 152 151 151 Operational Hourlies 1,660 1,660 1,660 1,660 1,674 1,678 1,661 1,661 1,657 1,666 1,654 1,644
Total Operations 2,121 2,121 2,121 2,117 2,134 2,146 2,129 2,129 2,117 2,122 2,109 2,099
Maintenance Managers/Supervisors 687 684 700 700 700 697 690 696 697 698 690 688 Professional, Technical, Clerical 261 261 261 261 261 261 260 260 260 260 260 260 Operational Hourlies 2,726 2,711 2,710 2,729 2,728 2,737 2,716 2,703 2,696 2,690 2,711 2,712
Total Maintenance 3,674 3,656 3,671 3,690 3,689 3,695 3,666 3,659 3,653 3,648 3,661 3,660
Engineering/Capital Managers/Supervisors 94 94 94 94 94 94 94 94 94 94 94 95 Professional, Technical, Clerical 18 18 18 18 18 18 18 18 18 18 18 18 Operational Hourlies - - - - - - - - - - - -
Total Engineering/Capital 112 112 112 112 112 112 112 112 112 112 112 113
Public Safety Managers/Supervisors - - - - - - - - - - - - Professional, Technical, Clerical - - - - - - - - - - - - Operational Hourlies - - - - - - - - - - - -
Total Public Safety - - - - - - - - - - - -
Total Positions Managers/Supervisors 1,412 1,409 1,427 1,426 1,426 1,425 1,419 1,425 1,425 1,427 1,420 1,419 Professional, Technical, Clerical 740 740 740 737 739 746 745 745 738 734 733 733 Operational Hourlies 4,386 4,371 4,370 4,389 4,402 4,415 4,377 4,364 4,353 4,356 4,365 4,356
Total Positions 6,538 6,520 6,537 6,552 6,567 6,586 6,541 6,534 6,516 6,517 6,518 6,508
*Reflects Authorized positions
MTA LONG ISLAND RAIL ROADFebruary Financial Plan - 2012 Adopted Budget
Total Positions by Function and Occupation

[THIS PAGE INTENTIONALLY LEFT BLANK]

Metro-North Railroad
MTA METRO-NORTH RAILROAD FEBRUARY FINANCIAL PLAN FOR 2012-2015
2011 FINAL ESTIMATE AND 2012 ADOPTED BUDGET
In accordance with MTA-approved budget procedures, the following information presents MTA Metro-North Railroad’s 2011 Final Estimate, 2012 Adopted Budget and the Financial Plan for 2012-2015. The Adopted Budget reflects the inclusion of MTA Adjustments that were presented in the November Financial Plan, which were adopted by the Board in December 2011, as well as other technical adjustments. These adjustments, along with technical adjustments now included in the February Financial Plan, are presented on the attached reconciliations from the November Financial Plan and are described below:
Annual cost efficiencies of $0.3 million in 2011, $1.1 million in 2012 - 2014, and $1.5 million in 2015 associated with the MTA review of information technology functions.
Inclusion of 3 Zeroes Salary/Wage Initiative by extending the two consecutive years of
no-wage growth for represented and non-represented employees to a third year has resulted in savings of $2.7 million in 2011, $7.4 million in 2012, $13.5 million in 2013, $13.7 million in 2014, and $14.1 million in 2015.
Energy cost adjustments anticipate a decrease in diesel fuel prices starting in 2011 for
the Revenue and Non Revenue equipment fleets ($1.7 million annually) and an annual increase in Traction and Propulsion power starting in 2012 ($1.3 million).
Changes in Overhead Recovery adjustments reflect Port Jervis Line reconstruction
project costs in 2011 and 2012 and the refinement of Overhead recovery rates in 2012-2015.
Rescheduling of approximately $2.0 million in Operating Capital project costs from 2011
to 2012.
Timing differences in capital project reimbursements reflect 2011 Port Jervis Line reconstruction costs paid in 2012 ($16.3 million).
Effective 2012, the non-labor account structure of the MTA standard chart of accounts
has been adjusted to reflect the reclassification and renaming of certain accounts in order to improve account reporting consistency among the Agencies. These changes, which affect most non-labor accounts presented on the attached tables, result in no net-impact to the bottom line. In order to maintain comparability with 2011 actual results for year-end reporting purposes, the 2011 account structure remains unchanged.
This submission also includes schedules detailing the monthly allocation of financial, headcount and utilization data based on the 2012 Adopted Budget for the purpose of reporting actual results on a monthly basis to the Board.

Positions Dollars Positions Dollars Positions Dollars Positions Dollars Positions Dollars
2011 November Financial Plan: Baseline Surplus/(Deficit) 5,589 ($662.591) 5,709 ($720.164) 5,756 ($736.852) 5,790 ($754.776) 5,804 ($787.946)
Technical Adjustments:Overhead Recovery - $1.383 - ($1.188) - ($1.996) - ($2.035) - ($2.073)
Sub-Total Technical Adjustments - $1.383 - ($1.188) - ($1.996) - ($2.035) - ($2.073)
MTA Plan Adjustments:
Labor3 Zeroes Salary/Wage Initiative Rep Empl. - $0.000 - $4.920 - $10.916 - $11.129 - $11.425
Non Represented Wage Freeze - 2.732 - 2.490 - 2.536 - 2.569 - 2.636
New MTA Efficiencies - 0.290 - 1.076 - 1.081 - 1.102 - 1.493Energy/Other Reimbursements - 0.433 - 0.381 - 0.352 - 0.305 - 0.265
Sub-Total MTA Plan Adjustments - $3.455 - $8.868 - $14.884 - $15.106 - $15.819
2012 February Financial Plan: Baseline Surplus/(Deficit) 5,589 ($657.753) 5,709 ($712.484) 5,756 ($723.963) 5,790 ($741.705) 5,804 ($774.200)
MTA METRO-NORTH RAILROADFebruary Financial Plan 2012 - 2015
Reconciliation to the November Plan (Accrual) Non-Reimbursable($ in millions)
Favorable/(Unfavorable)2011 2012 2013 2014 2015

Positions Dollars Positions Dollars Positions Dollars Positions Dollars Positions Dollars
2011 November Financial Plan: Baseline Surplus/(Deficit) 646 $0.000 610 $0.000 610 $0.000 610 $0.000 610 $0.000
Technical Adjustments:Project Cost Refinements - Disbursements - $0.000 - ($5.072) - ($5.225) - ($5.397) - ($5.582)Overhead Rate Adjustment/Correction - Disbursements - 0.000 - 1.741 - 1.824 - 1.859 - 1.894 Sub-Total Technical Adjustments - 0.000 - ($3.331) - ($3.401) - ($3.538) - ($3.688)
MTA Plan Adjustments:
Labor3 Zeros Salary/Wage Initiative - Disbursements - ($0.170) - $0.000 - $0.000 - $0.000 - $0.000
Sub-Total MTA Plan Adjustments 0 ($0.170) 0 $0.000 0 $0.000 0 $0.000 0 $0.000
Total Adjustments 0 ($0.170) 0 ($3.331) 0 ($3.401) 0 ($3.538) 0 ($3.688)
Total Revenue offset 0 $0.170 0 $3.331 0 $3.401 0 $3.538 0 $3.688
2012 February Financial Plan: Baseline Surplus/(Deficit) 646 $0.000 610 $0.000 610 $0.000 610 $0.000 610 $0.000
MTA METRO NORTH RAILROADFebruary Financial Plan 2012 - 2015
Reconciliation to the November Plan (Accrual) Reimbursable($ in millions)
Favorable/(Unfavorable)2011 2012 2013 2014 2015

Positions Dollars Positions Dollars Positions Dollars Positions Dollars Positions Dollars
2011 November Financial Plan: Baseline Cash Surplus/(Deficit) 6,235 ($388.527) 6,319 ($467.957) 6,366 ($456.321) 6,400 ($488.713) 6,414 ($497.664)
Technical Adjustments:Overhead Recovery - $1.383 - ($1.188) - ($0.002) - ($0.018) - $0.045Operating Capital - 1.945 - (2.178) - 0.000 - 0.000 - 0.000Timing difference in Capital Project Reimbursements - (16.142) - 16.304 - 0.000 - 0.000 - 0.000
Sub-Total Technical Adjustments - ($12.814) - $12.938 - ($0.002) - ($0.018) - $0.045
MTA Plan Adjustments:
Labor 3 Zeroes Salary/Wage Initiative Rep Empl. - $.000 - $4.920 - $10.916 - $11.129 - $11.425
Non Represented Wage Freeze - 2.732 - 2.490 - 2.536 - 2.569 - 2.636
New MTA Efficiencies - 0.290 - 1.076 - 1.081 - 1.102 - 1.493Energy/Other Reimbursements - 0.433 - 0.381 - 0.352 - 0.305 - 0.265
Sub-Total MTA Plan Adjustments - $3.455 - $8.868 - $14.884 - $15.106 - $15.819
2012 February Financial Plan: Cash Baseline Surplus/(Deficit) 6,235 ($397.886) 6,319 ($446.151) 6,366 ($441.439) 6,400 ($473.625) 6,414 ($481.800)
MTA METRO-NORTH RAILROADFebruary Financial Plan 2012 - 2015
Reconciliation to the November Plan - (Cash)($ in millions)
Favorable/(Unfavorable)2011 2012 2013 2014 2015

NON-REIMBURSABLE Final New February Proposed MTA Energy/ New All Adopted
Budget Labor Efficiencies Other Reimb. COA Other Budget
RevenueFarebox Revenue $588.964 $0.000 $0.000 $0.000 $0.000 $0.000 $588.964Port Jervis Line Reconstruction 0.000 0.000 0.000 0.000 0.000 0.000 0.000Vehicle Toll Revenue 0.000 0.000 0.000 0.000 0.000 0.000Other Operating Revenue 43.902 0.000 0.000 0.000 0.000 0.000 43.902Capital & Other Reimbursements: MTA 0.000 0.000 0.000 0.000 0.000 0.000 0.000 CDOT 0.000 0.000 0.000 0.000 0.000 0.000 0.000 Other 0.000 0.000 0.000 0.000 0.000 0.000 0.000
Total Capital and Other Reimbursements 0.000 0.000 0.000 0.000 0.000 0.000 0.000Total Revenue $632.866 $0.000 $0.000 $0.000 $0.000 $0.000 $632.866
ExpensesLabor:Payroll $411.421 ($5.028) $0.000 $0.000 $0.000 $0.000 $406.393Overtime 54.394 (0.539) 0.000 0.000 0.000 0.000 53.855Health and Welfare 91.818 0.000 0.000 0.000 0.000 0.000 91.818OPEB Current Payment 16.000 0.000 0.000 0.000 0.000 0.000 16.000Pensions 67.247 (0.853) 0.000 0.000 0.000 0.000 66.394Other Fringe Benefits 83.628 (0.990) 0.000 0.000 12.328 0.000 94.965Reimbursable Overhead (42.939) 0.000 0.000 0.000 0.000 1.188 (41.751)Total Labor Expenses $681.569 ($7.410) $0.000 $0.000 $12.328 $1.188 $687.674
Non-Labor:Electric Power $71.518 $0.000 $0.000 $1.302 $11.828 $0.000 $84.648Fuel 25.908 0.000 0.000 (1.683) 4.004 0.000 28.229Insurance 10.893 0.000 0.000 0.000 0.000 0.000 10.893Claims 12.000 0.000 0.000 0.000 (11.515) 0.000 0.485Paratransit Service Contracts 0.000 0.000 0.000 0.000 0.000 0.000Maintenance and Other Operating Contracts 109.042 0.000 (1.030) 0.000 (3.178) 0.000 104.834Professional Service Contracts 37.828 0.000 0.000 0.000 (10.969) 0.000 26.859Materials & Supplies 86.277 0.000 (0.046) 0.000 (12.899) 0.000 73.332Other Business Expenses 15.260 0.000 0.000 0.000 10.401 0.000 25.661Total Non-Labor Expenses $368.726 $0.000 ($1.076) (0.381) (12.328) 0.000 354.941
Other Expense Adjustments:OtherTotal Other Expense Adjustments $0.000 $0.000 $0.000 0.000 0.000 0.000 0.000
Total Expenses before Non-Cash Liability Adjustments $1,050.295 ($7.410) ($1.076) ($0.381) ($0.000) $1.188 1,042.615
Depreciation $236.015 $0.000 $0.000 $0.000 $0.000 $0.000 $236.015OPEB Obligation 59.997 0.000 0.000 0.000 0.000 0.000 59.997Environmental Remediation 6.723 0.000 0.000 0.000 0.000 0.000 6.723
Total Expenses $1,353.030 ($7.410) ($1.076) ($0.381) ($0.000) $1.188 $1,345.350
Baseline Surplus/(Deficit) ($720.164) $7.410 $1.076 0.381 0.000 (1.188) (712.484)
Cash Conversion Adjustments:Depreciation $236.015 $0.000 $0.000 $0.000 $0.000 $0.000 $236.015Operating/Capital (19.977) 0.000 0.000 0.000 0.000 (0.478) (20.455)Other Cash Adjustments 36.169 0.000 0.000 0.000 0.000 14.604 50.773Total Cash Conversion Adjustments $252.207 $0.000 $0.000 $0.000 $0.000 $14.126 $266.333
Net Cash Surplus/(Deficit) ($467.957) $7.410 $1.076 $0.381 $0.000 $12.938 ($446.151)
-- Differences are due to rounding.
MTA METRO-NORTH RAILROAD2012 February Adopted Budget
Reconciliation to the 2012 Final Proposed Budget vs. 2012 Adopted Budget by Generic Category (Accrual and Cash) ($ in millions)
2012MTA Plan Adjustments

REIMBURSABLEFinal New February
Proposed MTA Energy/ New All AdoptedBudget Labor Efficiencies Other Reimb. COA Other Budget
RevenueFarebox Revenue $0.000 $0.000 $0.000 $0.000 $0.000 $0.000 $0.000Port Jervis Line Reconstruction 10.211 0.000 0.000 0.000 0.000 (10.211) 0.000Vehicle Toll Revenue 0.000 0.000 0.000 0.000 0.000 0.000 0.000Other Operating Revenue 0.000 0.000 0.000 0.000 0.000 0.000 0.000Capital & Other Reimbursements: MTA 119.767 0.000 0.000 0.000 0.000 10.455 130.222 CDOT 66.846 0.000 0.000 0.000 0.000 3.416 70.262 Other 14.135 0.000 0.000 0.000 0.000 (0.329) 13.806
Total Capital and Other Reimbursements 200.748 0.000 0.000 0.000 0.000 13.542 214.290Capital and Other Reimbursements 0.000Total Revenue $210.959 $0.000 $0.000 $0.000 $0.000 $3.331 $214.290
ExpensesLabor:Payroll $46.176 $0.000 $0.000 $0.000 $0.000 $0.975 $47.151Overtime 17.750 0.000 0.000 0.000 0.000 0.306 18.056Health and Welfare 13.651 0.000 0.000 0.000 0.000 0.265 13.916OPEB Current Payment 0.000 0.000 0.000 0.000 0.000 0.000 0.000Pensions 9.151 0.000 0.000 0.000 0.000 0.187 9.338Other Fringe Benefits 10.742 0.000 0.000 0.000 0.000 0.215 10.957Reimbursable Overhead 42.646 0.000 0.000 0.000 0.000 (1.186) 41.460Total Labor Expenses $140.116 $0.000 $0.000 $0.000 $0.000 $0.762 $140.878
Non-Labor:Electric Power $0.000 $0.000 $0.000 $0.000 $0.000 $0.000 $0.000Fuel 0.000 0.000 0.000 0.000 0.000 0.000 0.000Insurance 5.241 0.000 0.000 0.000 0.000 0.249 5.490Claims 0.000 0.000 0.000 0.000 0.000 0.000Paratransit Service Contracts 0.000 0.000 0.000 0.000 0.000 0.000Maintenance and Other Operating Contracts 12.972 0.000 0.000 0.000 0.000 8.326 21.298Professional Service Contracts 5.195 0.000 0.000 0.000 0.000 1.363 6.558Materials & Supplies 36.681 0.000 0.000 0.000 (2.473) 2.843 37.050Other Business Expenses 0.543 0.000 0.000 0.000 2.473 3.016Total Non-Labor Expenses $60.632 $0.000 $0.000 $0.000 $0.000 $12.781 $73.412
Other Expense Adjustments:Port Jervis Line Reconstruction $10.211 $0.000 $0.000 $0.000 $0.000 ($10.211) $0.000Total Other Expense Adjustments $10.211 $0.000 $0.000 $0.000 $0.000 ($10.211) $0.000
Total Expenses before Depreciation $210.959 $0.000 $0.000 $0.000 $0.000 $3.332 $214.290
Depreciation $0.000 $0.000 $0.000 $0.000 $0.000 $0.000 $0.000
Total Expenses $210.959 $0.000 $0.000 $0.000 $0.000 $3.332 $214.290
Baseline Surplus/(Deficit) ($0.000) $0.000 $0.000 $0.000 $0.000 ($0.000) $0.000
Cash Conversion Adjustments:Depreciation $0.000 $0.000 $0.000 $0.000 $0.000 $0.000 $0.000Operating/Capital 0.000 0.000 0.000 0.000 0.000 0.000 0.000Other Cash Adjustments 0.000 0.000 0.000 0.000 0.000 0.000 0.000Total Cash Conversion Adjustments $0.000 $0.000 $0.000 $0.000 $0.000 $0.000 $0.000
Net Cash Surplus/(Deficit) ($0.000) $0.000 $0.000 $0.000 $0.000 ($0.000) $0.000
-- Differences are due to rounding.
MTA METRO-NORTH RAILROAD2012 February Adopted Budget
Reconciliation to the 2012 Final Proposed Budget vs. 2012 Adopted Budget by Generic Category (Accrual and Cash) ($ in millions)
2012MTA Plan Adjustments

NON-REIMBURSABLE/REIMBURSABLE Final New February
Proposed MTA Energy/ New All AdoptedBudget Labor Efficiencies Other Reimb. COA Other Budget
RevenueFarebox Revenue $588.964 $0.000 $0.000 $0.000 $0.000 $0.000 $588.964Port Jervis Line Reconstruction 10.211 0.000 0.000 0.000 0.000 (10.211) 0.000Vehicle Toll Revenue 0.000 0.000 0.000 0.000 0.000 0.000 0.000Other Operating Revenue 43.902 0.000 0.000 0.000 0.000 0.000 43.902Capital & Other Reimbursements: MTA 119.766 0.000 0.000 0.000 0.000 10.455 130.221 CDOT 66.846 0.000 0.000 0.000 0.000 3.416 70.262 Other 14.135 0.000 0.000 0.000 0.000 (0.329) 13.806Total Capital and Other Reimbursements 200.747 0.000 0.000 0.000 0.000 13.542 214.289Total Revenue $843.824 $0.000 $0.000 $0.000 $0.000 $3.331 $847.155
ExpensesLabor:Payroll $457.597 ($5.028) $0.000 $0.000 $0.000 $0.975 $453.544Overtime 72.144 (0.539) 0.000 0.000 0.000 0.306 71.911Health and Welfare 105.469 0.000 0.000 0.000 0.000 0.265 105.734OPEB Current Payment 16.000 0.000 0.000 0.000 0.000 0.000 16.000Pensions 76.398 (0.853) 0.000 0.000 0.000 0.187 75.733Other Fringe Benefits 94.370 (0.990) 0.000 0.000 12.328 0.215 105.922Reimbursable Overhead (0.293) 0.000 0.000 0.000 0.000 0.001 (0.292)Total Labor Expenses $821.685 ($7.410) $0.000 $0.000 $12.328 $1.949 $828.552
Non-Labor:Electric Power $71.518 $0.000 $0.000 $1.302 $11.828 $0.000 $84.648Fuel 25.908 0.000 0.000 (1.683) 4.004 0.000 28.229Insurance 16.134 0.000 0.000 0.000 0.000 0.249 16.383Claims 12.000 0.000 0.000 0.000 (11.515) 0.000 0.485Paratransit Service Contracts 0.000 0.000 0.000 0.000 0.000 0.000 0.000Maintenance and Other Operating Contracts 122.014 0.000 (1.030) 0.000 (3.178) 8.326 126.132Professional Service Contracts 43.023 0.000 0.000 0.000 (10.969) 1.363 33.417Materials & Supplies 122.957 0.000 (0.046) 0.000 (15.372) 2.843 110.382Other Business Expenses 15.803 0.000 0.000 0.000 12.874 0.000 28.677Total Non-Labor Expenses $429.357 $0.000 ($1.076) ($0.381) ($12.328) $12.781 $428.353
Other Expense Adjustments:Port Jervis Line Reconstruction $10.211 $0.000 $0.000 $0.000 $0.000 ($10.211) $0.000Total Other Expense Adjustments $10.211 $0.000 $0.000 $0.000 $0.000 ($10.211) $0.000
Total Expenses before Non-Cash Liability Adjustments $1,261.253 ($7.410) ($1.076) ($0.381) ($0.000) $4.519 $1,256.905
Depreciation $236.015 $0.000 $0.000 $0.000 $0.000 $0.000 $236.015OPEB Obligation 59.997 0.000 0.000 0.000 0.000 0.000 59.997Environmental Remediation 6.723 0.000 0.000 0.000 0.000 0.000 6.723
Total Expenses $1,563.988 ($7.410) ($1.076) ($0.381) ($0.000) $4.519 $1,559.640
Baseline Surplus/(Deficit) ($720.164) $7.410 $1.076 $0.381 $0.000 ($1.188) ($712.484)
Cash Conversion Adjustments:Depreciation $236.015 $0.000 $0.000 $0.000 $0.000 $0.000 $236.015Operating/Capital (19.977) 0.000 0.000 0.000 0.000 (0.478) (20.455)Other Cash Adjustments 36.169 0.000 0.000 0.000 0.000 14.604 50.773Total Cash Conversion Adjustments $252.207 $0.000 $0.000 $0.000 $0.000 $14.126 $266.333
Net Cash Surplus/(Deficit) ($467.957) $7.410 $1.076 $0.381 $0.000 $12.938 ($446.151)
-- Differences are due to rounding.
MTA METRO-NORTH RAILROAD2012 February Adopted Budget
Reconciliation to the 2012 Final Proposed Budget vs. 2012 Adopted Budget by Generic Category (Accrual and Cash) ($ in millions)
2012MTA Plan Adjustments

CASH RECIEPTS & EXPENDITURESFinal New February
Proposed MTA Energy/ New All AdoptedBudget Labor Efficiencies Other Reimb. COA Other Budget
ReceiptsFarebox Revenue $613.063 $0.000 $0.000 $0.000 $0.000 ($16.386) $596.677Port Jervis Line Reconstruction 10.211 0.000 0.000 0.000 0.000 (10.211) 0.000Vehicle Toll Revenue 0.000 0.000 0.000 0.000 0.000 0.000Other Operating Revenue 68.421 0.000 0.000 0.000 0.000 0.225 68.646Capital & Other Reimbursements: MTA 120.134 0.000 0.000 0.000 0.000 26.719 146.853 CDOT 67.121 0.000 0.000 0.000 0.000 3.376 70.497 Other 12.737 0.000 0.000 0.000 0.000 (0.248) 12.489Total Capital and Other Reimbursements 199.992 0.000 0.000 0.000 0.000 29.847 229.839Total Receipts $891.687 $0.000 $0.000 $0.000 $0.000 $3.475 $895.162
ExpendituresLabor:Payroll $460.571 ($5.028) $0.000 $0.000 $0.000 $1.310 $456.853Overtime 72.861 (0.539) 0.000 0.000 0.000 0.306 72.628Health and Welfare 108.257 0.000 0.000 0.000 0.000 0.265 108.522OPEB Current Payment 16.000 0.000 0.000 0.000 0.000 0.000 16.000Pensions 76.508 (0.853) 0.000 0.000 0.000 0.188 75.843Other Fringe Benefits 95.514 (0.990) 0.000 0.000 12.328 0.214 107.066GASB Account 8.746 0.000 8.746Reimbursable Overhead 0.000 0.000 0.000 0.000 0.000 0.000Total Labor Expenditures $838.457 ($7.410) $0.000 $0.000 $12.328 $2.283 $845.658
Non-Labor:Electric Power $71.518 $0.000 $0.000 $1.302 $11.828 $1.864 $86.512Fuel 25.908 0.000 0.000 (1.683) 4.004 0.000 28.229Insurance 15.935 0.000 0.000 0.000 0.000 0.249 16.184Claims 12.146 0.000 0.000 0.000 (11.515) 0.000 0.631Paratransit Service Contracts 0.000 0.000 0.000 0.000 0.000 0.000 0.000Maintenance and Other Operating Contracts 163.242 0.000 (1.030) 0.000 (3.178) (5.815) 153.219Professional Service Contracts 44.058 0.000 0.000 0.000 (10.969) 1.413 34.502Materials & Supplies 137.281 0.000 (0.046) 0.000 (15.372) 0.677 122.540Other Business Expenditures 40.888 0.000 0.000 0.000 12.874 0.076 53.838Total Non-Labor Expenditures $510.976 $0.000 ($1.076) ($0.381) ($12.328) ($1.536) $495.655
Other Expenditure Adjustments:Port Jervis Line Reconstruction $10.211 $0.000 $0.000 $0.000 $0.000 ($10.211) $0.000Cash Timing and Availability Adjustment 0.000 0.000 0.000 0.000 0.000 0.000 0.000Total Other Expenditure Adjustments $10.211 $0.000 $0.000 $0.000 $0.000 ($10.211) $0.000
Total Expenditures $1,359.644 ($7.410) ($1.076) ($0.381) ($0.000) ($9.464) $1,341.313
Baseline Cash Deficit ($467.957) $7.410 $1.076 $0.381 $0.000 $12.939 ($446.151)
SubsidiesMTA ($366.018) $5.572 $0.799 $0.272 $12.850 ($346.525)CDOT (101.939) 1.838 0.277 0.109 0.089 (99.626)Total Subsidies ($467.957) $7.410 $1.076 $0.381 $0.000 $12.939 ($446.151)
Opening Cash Balance $0.000 $0.000 $0.000 $0.000 $0.000 $0.000 $0.000Cash Timing and Availability Adjustment 0.000 0.000 0.000 0.000 0.000 0.000 0.000Closing Cash Balance $0.000 $0.000 $0.000 $0.000 $0.000 $0.000 $0.000
-- Differences are due to rounding.
MTA METRO-NORTH RAILROAD2012 February Adopted Budget
Reconciliation to the 2012 Final Proposed Budget vs. 2012 Adopted Budget by Generic Category (Accrual and Cash) ($ in millions)
2012MTA Plan Adjustments

CASH FLOW ADJUSTMENTSFinal New February
Proposed MTA Energy/ New All AdoptedBudget Labor Efficiencies Other Reimb. COA Other Budget
ReceiptsFarebox Revenue $24.099 $0.000 $0.000 $0.000 $0.000 ($16.386) $7.713Port Jervis Line Reconstruction 0.000 0.000 0.000 0.000 0.000 0.000 0.000Vehicle Toll Revenue 0.000 0.000 0.000 0.000 0.000 0.000 0.000Other Operating Revenue 24.519 0.000 0.000 0.000 0.000 0.225 24.744Capital & Other Reimbursements: MTA 0.368 0.000 0.000 0.000 0.000 16.264 16.632 CDOT 0.275 0.000 0.000 0.000 0.000 (0.040) 0.235 Other (1.398) 0.000 0.000 0.000 0.000 0.081 (1.317)Total Capital and Other Reimbursements (0.755) 0.000 0.000 0.000 0.000 16.305 15.550Total Receipt Adjustments $47.863 $0.000 $0.000 $0.000 $0.000 $0.144 $48.007
ExpendituresLabor:Payroll ($2.974) $0.000 $0.000 $0.000 $0.000 ($0.335) ($3.309)Overtime (0.717) 0.000 0.000 0.000 0.000 0.000 (0.717)Health and Welfare (2.788) 0.000 0.000 0.000 0.000 (0.000) (2.788)OPEB Current Payment 0.000 0.000 0.000 0.000 0.000 0.000 0.000Pensions (0.110) 0.000 0.000 0.000 0.000 (0.001) (0.110)Other Fringe Benefits (1.144) 0.000 0.000 0.000 0.000 0.001 (1.144)GASB Account (8.746) 0.000 0.000 0.000 0.000 0.000 (8.746)Reimbursable Overhead (0.293) 0.000 0.000 0.000 0.000 0.001 (0.292)Total Labor Expenditures ($16.772) $0.000 $0.000 $0.000 $0.000 ($0.334) ($17.106)
Non-Labor:Electric Power $0.000 $0.000 $0.000 $0.000 $0.000 ($1.864) ($1.864)Fuel 0.000 0.000 0.000 0.000 0.000 0.000 0.000Insurance 0.199 0.000 0.000 0.000 0.000 (0.000) 0.199Claims (0.146) 0.000 0.000 0.000 0.000 0.000 (0.146)Paratransit Service Contracts 0.000 0.000 0.000 0.000 0.000 0.000 0.000Maintenance and Other Operating Contracts (41.228) 0.000 0.000 0.000 0.000 14.141 (27.087)Professional Service Contracts (1.035) 0.000 0.000 0.000 0.000 (0.050) (1.085)Materials & Supplies (14.324) 0.000 0.000 0.000 0.000 2.166 (12.158)Other Business Expenditures (25.085) 0.000 0.000 0.000 0.000 (0.076) (25.161)Total Non-Labor Expenditures ($81.619) $0.000 $0.000 $0.000 $0.000 $14.317 ($67.302)
Other Expenditure Adjustments:Port Jervis Line Reconstruction $0.000 $0.000 $0.000 $0.000 $0.000 $0.000 $0.000Total Other Expenditure Adjustments $0.000 $0.000 $0.000 $0.000 $0.000 $0.000 $0.000
Total Expenditure Adjustments ($98.391) $0.000 $0.000 $0.000 $0.000 $13.983 ($84.408)
Total Cash Conversion Adjustments beforeNon-Cash Liability Adjs. ($50.528) $0.000 $0.000 $0.000 $0.000 $14.127 ($36.402)
Depreciation Adjustment $236.015 $0.000 $0.000 $0.000 $0.000 $0.000 $236.015OPEB Obligation 59.997 0.000 0.000 0.000 0.000 0.000 59.997Environmental Remediation 6.723 0.000 0.000 0.000 0.000 0.000 6.723
Total Cash Conversion Adjustments $252.207 $0.000 $0.000 $0.000 $0.000 $14.127 $266.333
-- Differences are due to rounding.
MTA METRO-NORTH RAILROAD2012 February Adopted Budget
Reconciliation to the 2012 Final Proposed Budget vs. 2012 Adopted Budget by Generic Category (Accrual and Cash) ($ in millions)
2012MTA Plan Adjustments

NON-REIMBURSABLE
2011 2012
Final Adopted
Estimate* Budget 2013 2014 2015
Operating Revenue
Farebox Revenue $566.059 $588.964 $610.419 $633.428 $650.090
Other Operating Revenue 45.157 43.902 45.600 47.978 49.733
MNR - MTA 0.000 0.000 0.000 0.000 0.000
MNR - CDOT 0.000 0.000 0.000 0.000 0.000
MNR - Other 0.000 0.000 0.000 0.000 0.000
Capital and Other Reimbursements
Total Revenue $611.217 $632.866 $656.019 $681.406 $699.823
Operating Expenses
Labor:
Payroll $389.175 $406.393 $411.050 $420.623 $429.630
Overtime 58.161 53.855 54.039 55.088 56.124
Health and Welfare 78.922 91.818 104.989 114.202 124.927
OPEB Current Payment 15.250 16.000 17.000 18.000 18.500
Pensions 53.233 66.394 66.990 65.327 69.074
Other Fringe Benefits 80.081 94.965 96.181 98.377 100.746
Reimbursable Overhead (38.448) (41.751) (41.485) (42.288) (43.084)
Total Labor Expenses $636.374 $687.674 $708.764 $729.330 $755.917
Non-Labor:
Electric Power $62.725 $84.648 $95.355 $106.058 $118.315
Fuel 23.564 28.229 29.812 29.655 30.019
Insurance 10.249 10.893 11.979 13.189 14.522
Claims 11.001 0.485 0.485 0.460 0.460
Paratransit Service Contracts
Maintenance and Other Operating Contracts 108.869 104.834 97.983 95.269 95.194
Professional Service Contracts 34.705 26.859 26.644 27.193 27.763
Materials & Supplies 87.748 73.332 73.973 79.207 82.065
Other Business Expenses 16.255 25.661 26.398 27.738 28.076
Total Non-Labor $355.116 $354.941 $362.629 $378.769 $396.414
Other Expenses Adjustments:
Other
Total Other Expense Adjustments $0.000 $0.000 $0.000 $0.000 $0.000
Total Expenses before Depreciation and GASB Adjs. $991.490 $1,042.615 $1,071.393 $1,108.099 $1,152.331
Depreciation $214.677 $236.015 $240.523 $245.478 $250.633
OPEB Obligation 56.275 59.997 61.143 62.402 63.713
Environmental Remediation 6.527 6.723 6.925 7.132 7.346
Total Expenses $1,268.969 $1,345.350 $1,379.983 $1,423.112 $1,474.023
Baseline Surplus/(Deficit) ($657.753) ($712.484) ($723.964) ($741.705) ($774.200)
Cash Conversion Adjustments:
Depreciation $214.677 $236.015 $240.523 $245.478 $250.633Operating Capital (8.524) (20.455) (17.000) (17.000) (17.000)Other Cash Adjustments 53.713 50.773 59.002 39.601 58.767Total Cash Conversion Adjustments $259.866 $266.333 $282.525 $268.079 $292.400
Baseline Cash Surplus/(Deficit) ($397.887) ($446.151) ($441.439) ($473.626) ($481.799)
* Effective 2012, the non-labor account structure of the MTA standard chart of accounts has been adjusted to reflect the reclassification and renaming of certain accounts in order to improve account reporting consistency among the Agencies. These changes, which affect most non-labor accounts presented on the attached tables, result in no net-impact to the bottom line. In order to maintain comparability with 2011 actual results for year-end reporting purposes, the 2011 account structure remains unchanged.
MTA METRO-NORTH RAILROADFebruary Financial Plan 2012 - 2015
Accrual Statement of Operations by Category
($ in millions)

REIMBURSABLE
2011 2012
Final Adopted
Estimate* Budget 2013 2014 2015
Revenue
Farebox Revenue $0.000 $0.000 $0.000 $0.000 $0.000
Other Operating Revenue 0.000 0.000 0.000 0.000 0.000
MNR - MTA 104.719 130.221 124.090 127.495 131.602
MNR - CDOT 84.564 70.262 64.208 63.643 63.301
MNR - Other 16.774 13.807 14.021 14.338 14.718
Capital and Other Reimbursements 206.057 214.290 202.318 205.476 209.622
Total Revenue $206.057 $214.290 $202.318 $205.476 $209.622
Expenses
Labor:
Payroll $43.940 $47.150 $46.792 $47.694 $48.585
Overtime 16.403 18.056 17.909 18.257 18.600
Health and Welfare 11.112 13.916 15.354 16.661 18.091
OPEB Current Payment
Pensions 5.694 9.339 9.249 9.003 9.513
Other Fringe Benefits 10.526 10.957 10.916 11.165 11.444
Reimbursable Overhead 38.445 41.460 41.198 41.996 42.786
Total Labor $126.120 $140.877 $141.417 $144.776 $149.020
Non-Labor:
Electric Power $0.000 $0.000 $0.000 $0.000 $0.000
Fuel 0.000 0.000 0.000 0.000 0.000
Insurance 3.913 5.490 5.509 5.615 5.720
Claims 0.000 0.000 0.000 0.000 0.000
Paratransit Service Contracts 0.000 0.000 0.000 0.000 0.000
Maintenance and Other Operating Contracts 45.774 21.298 12.442 12.698 12.965
Professional Service Contracts 6.071 6.558 8.212 6.059 3.863
Materials & Supplies 24.559 37.052 31.665 33.191 34.851
Other Business Expenses (0.379) 3.016 3.073 3.137 3.202
Total Non-Labor $79.938 $73.413 $60.901 $60.700 $60.602
Other Adjustments:
Other 0.000 0.000 0.000 0.000 0.000
Total Other Adjustments $0.000 $0.000 $0.000 $0.000 $0.000
Total Expenses before Depreciation $206.057 $214.290 $202.318 $205.476 $209.622
Depreciation $0.000 $0.000 $0.000 $0.000 $0.000
Total Expenses $206.057 $214.290 $202.318 $205.476 $209.622
Baseline Surplus/(Deficit) $0.000 $0.000 $0.000 $0.000 $0.000
Accrual Statement of Operations by Category
($ in millions)
* Effective 2012, the non-labor account structure of the MTA standard chart of accounts has been adjusted to reflect the reclassification and renaming of certain accounts in order to improve account reporting consistency among the Agencies. These changes, which affect most non-labor accounts presented on the attached tables, result in no net-impact to the bottom line. In order to maintain comparability with 2011 actual results for year-end reporting purposes, the 2011 account structure remains unchanged.
MTA METRO NORTH RAILROADFebruary Financial Plan 2012 - 2015

NON-REIMBURSABLE / REIMBURSABLE
2011 2012
Final Adopted
Estimate* Budget 2013 2014 2015
Revenue
Farebox Revenue $566.059 $588.964 $610.419 $633.428 $650.090
Other Operating Revenue 45.157 43.902 45.600 47.978 49.733
MNR - MTA 104.719 130.221 124.090 127.495 131.602
MNR - CDOT 84.564 70.262 64.208 63.643 63.301
MNR - Other 16.774 13.807 14.021 14.338 14.718
Capital and Other Reimbursements 206.057 214.290 202.318 205.476 209.622
Total Revenue $817.274 $847.156 $858.338 $886.882 $909.445
Expenses
Labor:
Payroll $433.115 $453.543 $457.842 $468.317 $478.215
Overtime 74.564 71.911 71.948 73.345 74.724
Health and Welfare 90.034 105.734 120.342 130.864 143.018
OPEB Current Payment 15.250 16.000 17.000 18.000 18.500
Pensions 58.927 75.733 76.239 74.330 78.587
Other Fringe Benefits 90.608 105.922 107.097 109.542 112.191
Reimbursable Overhead (0.003) (0.291) (0.287) (0.292) (0.298)
Total Labor $762.494 $828.552 $850.181 $874.106 $904.937
Non-Labor:
Electric Power $62.725 $84.648 $95.355 $106.058 $118.315
Fuel 23.564 28.229 29.812 29.655 30.019
Insurance 14.162 16.383 17.488 18.804 20.242
Claims 11.001 0.485 0.485 0.460 0.460
Paratransit Service Contracts 0.000 0.000 0.000 0.000 0.000
Maintenance and Other Operating Contracts 154.643 126.132 110.425 107.967 108.159
Professional Service Contracts 40.776 33.417 34.856 33.252 31.626
Materials & Supplies 112.307 110.384 105.638 112.398 116.916
Other Business Expenses 15.876 28.677 29.471 30.874 31.278
Total Non-Labor $435.054 $428.354 $423.529 $439.469 $457.016
Other Adjustments:
Other 0.000 0.000 0.000 0.000 0.000
Total Other Adjustments $0.000 $0.000 $0.000 $0.000 $0.000
Total Expenses before Depreciation and GASB Adjs. $1,197.548 $1,256.905 $1,273.711 $1,313.575 $1,361.952
Depreciation $214.677 $236.015 $240.523 $245.478 $250.633
OPEB Obligation 56.275 59.997 61.143 62.402 63.713
Environmental Remediation 6.527 6.723 6.925 7.132 7.346
Total Expenses $1,475.027 $1,559.640 $1,582.301 $1,628.587 $1,683.645
Baseline Surplus/(Deficit) ($657.753) ($712.484) ($723.964) ($741.705) ($774.200)
Cash Conversion Adjustments:
Depreciation $214.677 $236.015 $240.523 $245.478 $250.633Operating Capital ($8.524) ($20.455) ($17.000) ($17.000) ($17.000)Other Cash Adjustments $53.713 $50.773 $59.002 $39.601 $58.767Total Cash Conversion Adjustments $259.866 $266.333 $282.525 $268.079 $292.400
Baseline Cash Surplus/(Deficit) ($397.887) ($446.151) ($441.439) ($473.626) ($481.799)
MTA METRO NORTH RAILROADFebruary Financial Plan 2012 - 2015
Accrual Statement of Operations by Category
($ in millions)
* Effective 2012, the non-labor account structure of the MTA standard chart of accounts has been adjusted to reflect the reclassification and renaming of certain accounts in order to improve account reporting consistency among the Agencies. These changes, which affect most non-labor accounts presented on the attached tables, result in no net-impact to the bottom line. In order to maintain comparability with 2011 actual results for year-end reporting purposes, the 2011 account structure remains unchanged.

CASH RECEIPTS AND EXPENDITURES
2011 2012
Final Adopted
Estimate* Budget 2013 2014 2015
Receipts
Farebox Revenue $573.494 $596.677 $618.369 $641.528 $658.590
Other Operating Revenue 68.040 68.646 70.420 72.612 74.432
MNR - MTA 77.805 146.853 126.624 125.798 129.267
MNR - CDOT 84.949 70.497 64.460 63.731 63.403
MNR - Other 22.200 12.489 13.966 14.244 14.608
Capital and Other Reimbursements 184.954 229.839 205.050 203.773 207.278
Total Revenue $826.488 $895.162 $893.839 $917.913 $940.300
Expenditures
Labor:
Payroll $431.408 $456.853 $457.377 $475.701 $476.784
Overtime 74.506 72.628 71.667 75.123 74.425
Health and Welfare 93.322 108.522 124.094 134.943 147.176
OPEB Current Payment 15.250 16.000 17.000 18.000 18.500
Pensions 59.043 75.843 76.344 74.434 78.696
Other Fringe Benefits 90.475 107.066 107.419 111.310 111.792
GASB Account 0.000 8.746 9.607 10.512 11.229
Reimbursable Overhead 0.000 0.000 0.000 0.000 0.000
Total Labor $764.004 $845.658 $863.508 $900.023 $918.602
Non-Labor:
Electric Power $62.725 $86.512 $97.548 $108.302 $120.611
Fuel 23.564 28.229 29.812 29.655 30.019
Insurance 14.330 16.184 17.274 19.772 20.017
Claims 11.147 0.631 0.631 0.606 0.606
Paratransit Service Contracts 0.000 0.000 0.000 0.000 0.000
Maintenance and Other Operating Contracts 168.335 153.219 119.460 122.304 121.815
Professional Service Contracts 41.940 34.502 35.633 34.018 32.380
Materials & Supplies 113.333 122.540 116.868 120.840 121.312
Other Business Expenditures 24.996 53.838 54.544 56.018 56.738
Total Non-Labor $460.370 $495.655 $471.770 $491.515 $503.498
Other Adjustments:
Other $0.000 $0.000 $0.000 $0.000 $0.000
Cash Timing and Availability Adjustment 0.000 0.000 0.000 0.000 0.000
Total Other Adjustments $0.000 $0.000 $0.000 $0.000 $0.000
Total Expenditures $1,224.374 $1,341.313 $1,335.278 $1,391.538 $1,422.100
Baseline Cash Surplus/(Deficit) ($397.886) ($446.151) ($441.439) ($473.625) ($481.800)
Subsidies
MTA ($297.499) ($346.525) ($340.194) ($372.911) ($378.798)
CDOT ($100.387) ($99.626) ($101.246) ($100.714) ($103.002)
Total Subsidies ($397.886) ($446.151) ($441.440) ($473.625) ($481.800)
* Effective 2012, the non-labor account structure of the MTA standard chart of accounts has been adjusted to reflect the reclassification and renaming of certain accounts in order to improve account reporting consistency among the Agencies. These changes, which affect most non-labor accounts presented on the attached tables, result in no net-impact to the bottom line. In order to maintain comparability with 2011 actual results for year-end reporting purposes, the 2011 account structure remains unchanged.
MTA METRO NORTH RAILROADFebruary Financial Plan 2012 - 2015
Accrual Statement of Operations by Category
($ in millions)

CASH FLOW ADJUSTMENTS
2011 2012
Final Adopted
Estimate* Budget 2013 2014 2015
Receipts
Farebox Revenue $7.435 $7.713 $7.950 $8.100 $8.500
Other Operating Revenue 22.883 24.744 24.820 24.634 24.699
Capital and Other Reimbursements:
MTA (26.914) 16.632 2.534 (1.697) (2.335)
CDOT 0.385 0.235 0.252 0.088 0.102
Other 5.426 (1.318) (0.055) (0.094) (0.110)
Total Capital and Other Reimbursements (21.103) 15.549 2.732 (1.703) (2.344)Total Receipts $9.214 $48.006 $35.501 $31.031 $30.855
Expenditures
Labor:
Payroll $1.707 ($3.310) $0.464 ($7.384) $1.431
Overtime 0.058 (0.717) 0.282 (1.778) 0.299
Health and Welfare (3.288) (2.788) (3.752) (4.079) (4.158)
OPEB Current Payment 0.000 0.000 0.000 0.000 0.000
Pensions (0.116) (0.110) (0.105) (0.104) (0.109)
Other Fringe Benefits 0.133 (1.144) (0.322) (1.768) 0.399
GASB Account 0.000 (8.746) (9.607) (10.512) (11.229)
Reimbursable Overhead (0.003) (0.291) (0.287) (0.292) (0.298)Total Labor ($1.510) ($17.106) ($13.327) ($25.917) ($13.665)
Non-Labor:
Electric Power $0.000 ($1.864) ($2.193) ($2.244) ($2.296)
Fuel 0.000 0.000 0.000 0.000 0.000
Insurance (0.168) 0.199 0.214 (0.968) 0.225
Claims (0.146) (0.146) (0.146) (0.146) (0.146)
Paratransit Service Contracts 0.000 0.000 0.000 0.000 0.000
Maintenance and Other Operating Contracts (13.692) (27.087) (9.035) (14.337) (13.656)
Professional Service Contracts (1.164) (1.085) (0.777) (0.766) (0.754)
Materials & Supplies (1.026) (12.156) (11.230) (8.442) (4.396)
Other Business Expenditures (9.120) (25.161) (25.073) (25.144) (25.460)Total Non-Labor ($25.316) ($67.301) ($48.241) ($52.046) ($46.482)
Other Adjustments:
Other 0.000 0.000 0.000 0.000 0.000
Total Other Expenditures Adjustments $0.000 $0.000 $0.000 $0.000 $0.000
Total Cash Conversion Adjustments before Depreciation and GASB Adjs.
($17.612) ($36.402) ($26.066) ($46.933) ($29.293)
Depreciation Adjustment $214.677 $236.015 $240.523 $245.478 $250.633
OPEB Obligation 56.275 59.997 61.143 62.402 63.713
Environmental Remediation 6.527 6.723 6.925 7.132 7.346
Baseline Total Cash Conversion Adjustments $259.867 $266.333 $282.525 $268.080 $292.400
* Effective 2012, the non-labor account structure of the MTA standard chart of accounts has been adjusted to reflect the reclassification and renaming of certain accounts in order to improve account reporting consistency among the Agencies. These changes, which affect most non-labor accounts presented on the attached tables, result in no net-impact to the bottom line. In order to maintain comparability with 2011 actual results for year-end reporting purposes, the 2011 account structure remains unchanged.
MTA METRO NORTH RAILROADFebruary Financial Plan 2012 - 2015
Cash Conversion (Cash Flow Adjustments)
($ in millions)

NON-REIMBURSABLE OVERTIME Hours $ %
SCHEDULED:Direct Service - Operations & Maintenance 469,046 $24.837 46.1%
Programmed Maintenance 207,423 9.173 17.0%
Total Scheduled 676,469 $34.010 63.2%
UNSCHEDULED:Vacancy/Absentee Coverage 224,879 $9.833 18.3%
Weather Emergencies 128,980 5.881 10.9%
Maintenance 58,311 2.538 4.7%
Service Delays - 0.000 0.0%
Emergencies - 0.000 0.0%
Tour Length - 0.000 0.0%
Safety/Security/Law Enforcement - 0.000 0.0%
All Other 37,828 1.592 3.0%
Total Unscheduled 449,998 19.844 36.8%
TOTAL NON-REIMBURSABLE OVERTIME: 1,126,467 $53.855 100.0%
REIMBURSABLE OVERTIME 398,373 $18.056
TOTAL OVERTIME 1,524,840 $71.911
MTA METRO NORTH RAILROAD2012 Adopted Budget
2012 Non-Reimbursable/Reimbursable Overtime ($ in millions)
Total

2011Final
Estimate
2012AdoptedBudget 2013 2014 2015
RIDERSHIP
Harlem Line 26.252 26.898 27.442 28.066 28.789
Hudson Line 15.755 16.274 16.683 17.136 17.565
New Haven Line 38.091 38.588 39.043 39.534 40.208
Total East of Hudson Ridership 80.098 81.760 83.168 84.736 86.562
West of Hudson 1.655 1.859 1.952 2.001 2.043
Total Ridership 81.753 83.619 85.120 86.737 88.605
FAREBOX REVENUE
Harlem Line $171.877 $176.067 $179.948 $184.327 $189.406
Hudson Line 125.935 130.264 133.746 137.658 141.337
New Haven Line 267.469 281.778 295.825 310.519 318.404
West of Hudson Mail & Ride 0.778 0.855 0.900 0.924 0.943
Total Farebox Revenue $566.059 $588.964 $610.419 $633.428 $650.090
MTA METRO-NORTH RAILROAD
February Financial Plan 2012 - 2015Ridership/(Utilization)
(in millions)

FUNCTION/DEPARTMENT
2011Final
Estimate
2012AdoptedBudget 2013 2014 2015
Administration
President 3 3 3 3 3
Labor Relations 9 9 9 9 9
Safety 16 19 19 19 19
COS/ Corporate & Public Affairs 15 17 17 17 17
Customer Service 45 45 45 45 45
Legal 17 17 17 17 17
Claims 14 14 14 14 14
Environmental Compliance & Svce 7 7 7 7 7
VP Administration 3 3 3 3 3
VP Human Resources 3 3 3 3 3
Human Resources & Diversity 25 24 24 24 24
Training 37 47 47 47 44
Employee Relations & Diversity 4 4 4 4 4
VP Planning 2 2 2 2 2
Operations Planning & Analysis 17 17 17 17 17
Capital Planning & Programming 13 13 13 13 13
Business Development Facilities & Mktg 21 21 21 21 21
Long Range Planning 8 8 8 8 8
VP Finance & Info Systems 2 2 2 2 2
Controller 78 78 77 77 77
Information Technology & Project Mgmt 96 97 97 97 97
Budget 18 18 18 18 18
Procurement & Material Management 42 41 41 41 41
Corporate 0 0 0 0 0
Total Administration 495 509 508 508 505
OperationsOperations Administration 55 55 55 55 55Operations Services 1,729 1,771 1,788 1,802 1,819Customer Service 236 236 236 236 236Business Development Facilities & Mktg 38 38 38 38 38Metro-North West 29 28 28 28 28
Total Operations 2,087 2,128 2,145 2,159 2,176
MaintenanceGCT 368 375 387 393 393Maintenance of Equipment 1,334 1,338 1,351 1,365 1,365Maintenance of Way 1,734 1,752 1,758 1,758 1,758Procurement & Material Management 120 120 120 120 120
Total Maintenance 3,556 3,585 3,616 3,636 3,636
Engineering/CapitalConstruction Management 37 37 37 37 37Engineering & Design 60 60 60 60 60
Total Engineering/Capital 97 97 97 97 97
Baseline Total Positions 6,235 6,319 6,366 6,400 6,414
Non-Reimbursable 5,589 5,709 5,756 5,790 5,804Reimbursable 646 610 610 610 610
Total Full-Time 6,234 6,318 6,365 6,399 6,413Total Full-Time-Equivalents 1 1 1 1 1
MTA METRO-NORTH RAILROADFebruary Financial Plan 2012 - 2015
Total Positions by Function and DepartmentNon-Reimbursable/Reimbursable and Full-Time/Full-Time Equivalents

FUNCTION/OCCUPATIONAL GROUP
2011Final
Estimate
2012AdoptedBudget 2013 2014 2015
Administration Managers/Supervisors 57 57 56 56 56 Professional, Technical, Clerical 438 452 452 452 449 Operational Hourlies - - - - -
Total Administration 495 509 508 508 505
Operations Managers/Supervisors 27 27 27 27 27 Professional, Technical, Clerical 499 505 505 505 505 Operational Hourlies 1,561 1,596 1,613 1,627 1,644
Total Operations 2,087 2,128 2,145 2,159 2,176
Maintenance Managers/Supervisors 57 57 57 57 57 Professional, Technical, Clerical 1,019 1,032 1,038 1,038 1,038 Operational Hourlies 2,480 2,496 2,521 2,541 2,541
Total Maintenance 3,556 3,585 3,616 3,636 3,636
Engineering/Capital Managers/Supervisors 27 27 27 27 27 Professional, Technical, Clerical 70 70 70 70 70 Operational Hourlies - - - - -
Total Engineering/Capital 97 97 97 97 97
Public Safety Managers/Supervisors - - - - - Professional, Technical, Clerical - - - - - Operational Hourlies - - - - -
Total Public Safety - - - - - Total Baseline Positions
Managers/Supervisors 168 168 167 167 167 Professional, Technical, Clerical 2,026 2,059 2,065 2,065 2,062 Operational Hourlies 4,041 4,092 4,134 4,168 4,185
Total Baseline Positions 6,235 6,319 6,366 6,400 6,414
MTA METRO-NORTH RAILROADFebruary Financial Plan 2012 - 2015
Total Positions by Function and Occupation

NON-REIMBURSABLE
Jan Feb Mar Apr May Jun Jul Aug Sep Oct Nov Dec TotalOperating RevenueFarebox Revenue $44.572 $43.667 $47.519 $48.042 $49.333 $51.379 $51.851 $50.462 $49.394 $51.028 $50.709 $51.009 $588.964Vehicle Toll Revenue - - - - - - - - - - - - - Other Operating Revenue 3.682 3.880 2.813 3.408 3.493 3.025 3.094 3.070 3.567 3.797 5.757 4.317 43.902Capital and Other Reimbursements - - - - - - - - - - - - - Total Revenue $48.254 $47.547 $50.332 $51.450 $52.826 $54.404 $54.945 $53.532 $52.961 $54.824 $56.466 $55.326 $632.866
Operating ExpensesLabor:Payroll $34.848 $32.573 $34.437 $32.312 $35.197 $32.410 $34.128 $35.097 $31.486 $35.024 $34.429 $34.450 $406.393Overtime 4.957 4.533 4.331 4.308 3.947 4.288 4.605 4.317 4.372 3.988 4.827 5.383 53.855Health and Welfare 7.984 7.389 7.765 7.220 7.866 7.237 7.724 7.928 7.032 7.873 7.867 7.934 91.818OPEB Current Payment 1.333 1.333 1.333 1.333 1.333 1.333 1.333 1.333 1.333 1.333 1.333 1.333 16.000Pensions 5.718 5.338 5.598 5.284 5.689 5.295 5.590 5.715 5.158 5.668 5.650 5.691 66.394Other Fringe Benefits 8.232 7.683 7.995 7.588 8.082 7.603 7.968 8.117 7.443 8.066 8.061 8.126 94.965Reimbursable Overhead (2.609) (2.668) (3.141) (3.949) (4.121) (4.056) (3.798) (4.023) (3.590) (3.870) (3.231) (2.695) (41.751)Total Labor Expenses $60.463 $56.181 $58.318 $54.097 $57.993 $54.110 $57.551 $58.484 $53.235 $58.082 $58.936 $60.223 $687.674
Non-Labor:Electric Power $7.483 $7.511 $7.496 $6.676 $6.806 $6.987 $6.993 $6.964 $6.935 $6.728 $6.645 $7.423 $84.648Fuel 2.709 2.730 2.635 2.178 2.101 2.082 2.079 2.115 2.138 2.445 2.373 2.643 28.229Insurance 0.872 0.872 0.886 0.889 0.929 0.940 0.914 0.914 0.914 0.914 0.917 0.934 10.893Claims 0.052 0.054 0.054 0.049 0.054 0.049 0.054 0.049 0.054 0.054 0.049 (0.091) 0.485Paratransit Service Contracts - - - - - - - - - - - - - Maintenance and Other Operating Contracts 7.616 8.649 8.351 9.130 7.498 9.181 8.905 8.784 7.987 11.809 7.875 9.049 104.834Professional Service Contracts 1.764 1.902 2.224 2.243 2.356 2.661 2.117 2.409 2.166 2.206 2.136 2.675 26.859Materials & Supplies 6.651 6.510 6.224 6.094 6.026 5.649 5.722 5.779 6.212 6.122 6.152 6.192 73.332Other Business Expenses 1.976 2.412 2.119 1.816 1.980 2.217 2.190 2.150 2.223 2.219 2.284 2.075 25.661Total Non-Labor $29.122 $30.641 $29.990 $29.075 $27.751 $29.765 $28.974 $29.164 $28.630 $32.498 $28.432 $30.900 $354.941
Other Expenses Adjustments:Other - - - - - - - - - - - - - Total Other Expense Adjustments $0.000 $0.000 $0.000 $0.000 $0.000 $0.000 $0.000 $0.000 $0.000 $0.000 $0.000 $0.000 $0.000
Total Expenses before Non-Cash Liability Adjs. $89.585 $86.822 $88.308 $83.173 $85.744 $83.875 $86.525 $87.648 $81.865 $90.580 $87.368 $91.123 $1,042.615
Depreciation $18.763 $18.763 $18.763 $19.007 $19.007 $19.007 $19.518 $19.518 $19.518 $21.381 $21.385 $21.385 $236.015OPEB Obligation 5.000 5.000 5.000 5.000 5.000 5.000 5.000 5.000 5.000 5.000 5.000 5.000 59.997Environmental Remediation - - 1.681 - - 1.681 - - 1.681 - - 1.681 6.723
Total Expenses $113.348 $110.585 $113.751 $107.179 $109.751 $109.563 $111.043 $112.166 $108.064 $116.961 $113.752 $119.188 $1,345.350
Net Surplus/(Deficit) ($65.093) ($63.038) ($63.419) ($55.729) ($56.925) ($55.158) ($56.098) ($58.634) ($55.103) ($62.136) ($57.287) ($63.863) ($712.484)
Cash Conversion Adjustments:Depreciation $18.763 $18.763 $18.763 $19.007 $19.007 $19.007 $19.518 $19.518 $19.518 $21.381 $21.385 $21.385 $236.015Operating Capital (0.447) (0.221) (0.787) (1.357) (2.181) (1.658) (1.438) (0.939) (2.769) (3.659) (1.116) (3.883) (20.455)Other Cash Adjustments 12.457 15.686 17.308 5.189 0.019 (6.796) 9.413 2.418 4.267 10.666 0.186 (20.041) 50.773Total Cash Conversion Adjustments $30.773 $34.228 $35.284 $22.839 $16.845 $10.553 $27.493 $20.997 $21.016 $28.388 $20.455 ($2.539) $266.333
Baseline Net Cash Surplus/(Deficit) ($34.320) ($28.810) ($28.135) ($32.890) ($40.080) ($44.605) ($28.605) ($37.637) ($34.087) ($33.748) ($36.832) ($66.402) ($446.151)
MTA METRO NORTH RAILROADFebruary Financial Plan - 2012 Adopted BudgetAccrual Statement of Operations by Category
($ in millions)

REIMBURSABLEJan Feb Mar Apr May Jun Jul Aug Sep Oct Nov Dec Total
RevenueFarebox Revenue $0.000 $0.000 $0.000 $0.000 $0.000 $0.000 $0.000 $0.000 $0.000 $0.000 $0.000 $0.000 $0.000Vehicle Toll Revenue - - - - - - - - - - - - - Other Operating Revenue - - - - - - - - - - - - - Capital and Other Reimbursements MNR - MTA 9.667 9.273 9.794 11.074 12.458 13.316 11.054 11.482 10.648 12.195 10.576 8.685 130.221 MNR - CDOT 6.577 5.530 7.549 8.397 6.261 5.702 4.470 9.515 5.400 4.324 2.928 3.608 70.262 MNR - Other 0.974 0.984 0.999 1.023 1.062 1.062 1.172 1.146 1.198 1.398 1.367 1.422 13.807Total Revenue $17.217 $15.787 $18.342 $20.494 $19.781 $20.080 $16.697 $22.142 $17.246 $17.917 $14.871 $13.716 $214.290
ExpensesLabor:Payroll $3.404 $3.439 $3.846 $4.273 $4.554 $4.433 $4.054 $4.334 $3.747 $4.262 $3.645 $3.160 $47.150Overtime 1.093 1.108 1.344 1.739 1.835 1.803 1.624 1.763 1.542 1.720 1.370 1.115 18.056Health and Welfare 0.934 0.946 1.095 1.299 1.377 1.348 1.225 1.320 1.134 1.282 1.062 0.892 13.916OPEB Current Payment - Pensions 0.669 0.676 0.759 0.848 0.904 0.878 0.801 0.859 0.747 0.852 0.723 0.623 9.339Other Fringe Benefits 0.755 0.764 0.872 1.012 1.075 1.049 0.956 1.027 0.887 1.004 0.841 0.716 10.957Reimbursable Overhead 2.610 2.671 3.149 3.987 4.163 4.092 3.724 3.980 3.518 3.828 3.153 2.585 41.460Total Labor $9.465 $9.602 $11.065 $13.157 $13.908 $13.602 $12.384 $13.284 $11.575 $12.948 $10.795 $9.092 $140.877
Non-Labor:Electric Power $0.000 $0.000 $0.000 $0.000 $0.000 $0.000 $0.000 $0.000 $0.000 $0.000 $0.000 $0.000 $0.000Fuel 0.000 0.000 0.000 0.000 0.000 0.000 0.000 0.000 0.000 0.000 0.000 0.000 0.000Insurance 0.338 0.346 0.427 0.552 0.534 0.569 0.498 0.539 0.452 0.501 0.400 0.333 5.490Claims - - - - - - - - - - - - - Paratransit Service Contracts - - - - - - - - - - - - - Maintenance and Other Operating Contracts 2.123 2.187 2.395 3.453 2.122 2.164 0.614 0.551 1.584 1.516 1.294 1.296 21.298Professional Service Contracts 0.087 0.200 1.235 0.502 0.618 1.324 0.371 0.215 0.840 0.265 0.215 0.687 6.558Materials & Supplies 5.138 3.413 3.113 2.683 2.490 2.303 2.485 7.247 2.486 1.870 1.822 2.001 37.052Other Business Expenses 0.067 0.039 0.106 0.146 0.109 0.119 0.346 0.307 0.309 0.817 0.346 0.306 3.016Total Non-Labor $7.752 $6.185 $7.277 $7.336 $5.874 $6.478 $4.313 $8.858 $5.671 $4.969 $4.077 $4.624 $73.413
Other Adjustments:Other - Total Other Adjustments $0.000 $0.000 $0.000 $0.000 $0.000 $0.000 $0.000 $0.000 $0.000 $0.000 $0.000 $0.000 $0.000
Total Expenses before Depreciation $17.217 $15.787 $18.342 $20.494 $19.781 $20.080 $16.697 $22.142 $17.246 $17.917 $14.871 $13.716 $214.290
Depreciation - - - - - - - - - - - - -
Total Expenses $17.217 $15.787 $18.342 $20.494 $19.781 $20.080 $16.697 $22.142 $17.246 $17.917 $14.871 $13.716 $214.290
Baseline Net Surplus/(Deficit) $0.000 $0.000 $0.000 $0.000 $0.000 $0.000 $0.000 $0.000 $0.000 $0.000 $0.000 $0.000 $0.000
MTA METRO NORTH RAILROADFebruary Financial Plan - 2012 Adopted BudgetAccrual Statement of Operations by Category
($ in millions)

NON-REIMBURSABLE / REIMBURSABLE
Jan Feb Mar Apr May Jun Jul Aug Sep Oct Nov Dec Total
RevenueFarebox Revenue $44.572 $43.667 $47.519 $48.042 $49.333 $51.379 $51.851 $50.462 $49.394 $51.028 $50.709 $51.009 $588.964Vehicle Toll Revenue - - - - - - - - - - - - - Other Operating Revenue 3.682 3.880 2.813 3.408 3.493 3.025 3.094 3.070 3.567 3.797 5.757 4.317 43.902 Capital and Other Reimbursements MNR - MTA 9.667 9.273 9.794 11.074 12.458 13.316 11.054 11.482 10.648 12.195 10.576 8.685 130.221 MNR - CDOT 6.577 5.530 7.549 8.397 6.261 5.702 4.470 9.515 5.400 4.324 2.928 3.608 70.262 MNR - Other 0.974 0.984 0.999 1.023 1.062 1.062 1.172 1.146 1.198 1.398 1.367 1.422 13.807 Total Revenue $65.472 $63.333 $68.673 $71.944 $72.607 $74.484 $71.642 $75.675 $70.207 $72.741 $71.337 $69.041 $847.156
ExpensesLabor:Payroll $38.252 $36.012 $38.284 $36.585 $39.750 $36.842 $38.182 $39.432 $35.233 $39.286 $38.074 $37.610 $453.543Overtime 6.050 5.640 5.675 6.047 5.782 6.091 6.229 6.080 5.914 5.708 6.197 6.498 71.911 Health and Welfare 8.918 8.335 8.860 8.519 9.243 8.585 8.949 9.248 8.167 9.155 8.929 8.826 105.734 OPEB Current Payment 1.333 1.333 1.333 1.333 1.333 1.333 1.333 1.333 1.333 1.333 1.333 1.333 16.000 Pensions 6.387 6.013 6.356 6.131 6.594 6.172 6.391 6.575 5.905 6.520 6.373 6.315 75.733 Other Fringe Benefits 8.987 8.447 8.867 8.600 9.157 8.653 8.924 9.143 8.330 9.070 8.902 8.842 105.922 Reimbursable Overhead 0.001 0.003 0.008 0.039 0.042 0.035 (0.074) (0.043) (0.071) (0.042) (0.078) (0.110) (0.291) Total Labor $69.928 $65.784 $69.383 $67.255 $71.901 $67.712 $69.935 $71.768 $64.811 $71.030 $69.730 $69.315 $828.552
Non-Labor:Electric Power $7.483 $7.511 $7.496 $6.676 $6.806 $6.987 $6.993 $6.964 $6.935 $6.728 $6.645 $7.423 $84.648Fuel 2.709 2.730 2.635 2.178 2.101 2.082 2.079 2.115 2.138 2.445 2.373 2.643 28.229 Insurance 1.210 1.218 1.313 1.441 1.463 1.509 1.411 1.452 1.366 1.415 1.317 1.267 16.383 Claims 0.052 0.054 0.054 0.049 0.054 0.049 0.054 0.049 0.054 0.054 0.049 (0.091) 0.485 Paratransit Service Contracts - - - - - - - - - - - - - Maintenance and Other Operating Contracts 9.739 10.836 10.747 12.583 9.620 11.344 9.519 9.334 9.572 13.325 9.169 10.345 126.133 Professional Service Contracts 1.851 2.102 3.459 2.745 2.974 3.984 2.489 2.624 3.006 2.471 2.351 3.362 33.417 Materials & Supplies 11.789 9.923 9.337 8.777 8.517 7.951 8.207 13.026 8.697 7.992 7.974 8.194 110.384 Other Business Expenses 2.043 2.451 2.225 1.962 2.089 2.336 2.535 2.457 2.532 3.036 2.630 2.381 28.677 Total Non-Labor $36.874 $36.825 $37.266 $36.411 $33.625 $36.244 $33.287 $38.022 $34.301 $37.467 $32.508 $35.524 $428.356
Other Adjustments:Other $0.000 $0.000 $0.000 $0.000 $0.000 $0.000 $0.000 $0.000 $0.000 $0.000 $0.000 $0.000 $0.000Total Other Adjustments $0.000 $0.000 $0.000 $0.000 $0.000 $0.000 $0.000 $0.000 $0.000 $0.000 $0.000 $0.000 $0.000
Total Expenses before Non-Cash Liability Adjs. $106.802 $102.609 $106.649 $103.666 $105.526 $103.955 $103.222 $109.790 $99.112 $108.497 $102.239 $104.838 $1,256.905
Depreciation $18.763 $18.763 $18.763 $19.007 $19.007 $19.007 $19.518 $19.518 $19.518 $21.381 $21.385 $21.385 $236.015OPEB Obligation 5.000 5.000 5.000 5.000 5.000 5.000 5.000 5.000 5.000 5.000 5.000 5.000 59.997 Environmental Remediation - - 1.681 - - 1.681 - - 1.681 - - 1.681 6.723
Total Expenses $130.565 $126.372 $132.093 $127.673 $129.532 $129.643 $127.739 $134.308 $125.310 $134.877 $128.624 $132.904 $1,559.640
Net Surplus/(Deficit) ($65.093) ($63.038) ($63.419) ($55.729) ($56.925) ($55.158) ($56.098) ($58.634) ($55.103) ($62.136) ($57.287) ($63.863) ($712.484)
Cash Conversion Adjustments:Depreciation $18.763 $18.763 $18.763 $19.007 $19.007 $19.007 $19.518 $19.518 $19.518 $21.381 $21.385 $21.385 $236.015Operating Capital (0.447) (0.221) (0.787) (1.357) (2.181) (1.658) (1.438) (0.939) (2.769) (3.659) (1.116) (3.883) (20.455) Other Cash Adjustments 12.457 15.686 17.308 5.189 0.019 (6.796) 9.413 2.418 4.267 10.666 0.186 (20.041) 50.773 Total Cash Conversion Adjustments $30.773 $34.228 $35.284 $22.839 $16.845 $10.553 $27.493 $20.997 $21.016 $28.388 $20.455 ($2.539) $266.333
Baseline Net Cash Surplus/(Deficit) ($34.320) ($28.810) ($28.135) ($32.890) ($40.080) ($44.605) ($28.605) ($37.637) ($34.087) ($33.748) ($36.832) ($66.402) ($446.151)
MTA METRO NORTH RAILROADFebruary Financial Plan - 2012 Adopted BudgetAccrual Statement of Operations by Category
($ in millions)

CASH RECEIPTS AND EXPENDITURESJan Feb Mar Apr May Jun Jul Aug Sep Oct Nov Dec Total
ReceiptsFarebox Revenue $45.173 $44.282 $48.140 $48.667 $49.958 $52.052 $52.545 $51.177 $50.030 $51.648 $51.346 $51.659 $596.677Vehicle Toll Revenue - - - - - - - - - - - - - Other Operating Revenue 6.288 5.343 5.001 6.240 5.136 5.172 5.032 5.898 7.514 5.445 6.110 5.467 68.646Capital and Other Reimbursements - MNR - MTA 6.682 14.000 26.701 9.212 10.390 9.303 10.624 13.479 12.801 10.573 12.440 10.648 146.853 MNR - CDOT 6.458 5.775 7.421 8.278 6.501 5.581 4.358 9.761 5.289 4.189 3.156 3.730 70.497 MNR - Other 0.999 0.964 0.445 1.093 1.107 1.116 1.139 1.066 1.057 1.184 1.134 1.185 12.489Total Receipts $65.600 $70.364 $87.708 $73.490 $73.092 $73.224 $73.698 $81.381 $76.691 $73.039 $74.186 $72.689 $895.162
ExpendituresLabor:Payroll $35.228 $35.878 $43.885 $34.925 $43.519 $35.892 $34.964 $43.667 $34.947 $34.973 $43.660 $35.315 $456.853Overtime 6.240 5.340 6.875 5.743 6.741 5.593 5.693 6.741 5.693 5.393 6.989 5.587 72.628Health and Welfare 9.002 9.002 9.127 9.002 9.002 9.127 9.002 9.002 9.126 9.002 9.001 9.131 108.522OPEB Current Payment 1.333 1.333 1.333 1.333 1.333 1.333 1.333 1.333 1.333 1.333 1.333 1.333 16.000Pensions 0.000 0.000 0.000 6.299 6.364 6.299 6.299 6.364 6.299 6.299 6.364 25.256 75.843Other Fringe Benefits 10.038 8.564 10.498 9.434 8.556 10.764 9.462 10.040 7.876 7.949 7.983 5.902 107.066GASB Account 0.729 0.729 0.729 0.729 0.729 0.729 0.729 0.729 0.729 0.729 0.729 0.727 8.746Reimbursable Overhead - - - - - - - - - - - - Total Labor $62.570 $60.846 $72.447 $67.465 $76.244 $69.737 $67.482 $77.876 $66.003 $65.678 $76.059 $83.251 $845.658
Non-Labor:Electric Power $7.620 $7.648 $7.683 $6.813 $6.944 $7.184 $7.130 $7.102 $7.132 $6.865 $6.782 $7.609 $86.512Fuel 2.708 2.730 2.635 2.178 2.101 2.083 2.080 2.116 2.139 2.446 2.373 2.640 28.229Insurance 0.000 1.422 2.086 0.000 1.501 2.667 0.027 1.466 2.156 0.000 1.466 3.393 16.184Claims 0.052 0.054 0.054 0.050 0.054 0.050 0.054 0.050 0.054 0.054 0.050 0.055 0.631Paratransit Service Contracts - - - - - - - - - - - - - Maintenance and Other Operating Contracts 8.937 10.021 12.813 13.739 9.512 18.181 9.324 10.150 14.569 14.092 8.586 23.295 153.219Professional Service Contracts 1.788 1.830 3.944 2.505 2.651 4.730 2.241 2.300 3.849 2.135 2.090 4.439 34.502Materials & Supplies 12.359 10.558 9.984 9.381 8.807 8.931 8.758 13.597 10.545 10.260 9.164 10.196 122.540Other Business Expenditures 3.886 4.065 4.197 4.249 5.358 4.266 5.207 4.361 4.331 5.257 4.448 4.213 53.838Total Non-Labor $37.350 $38.328 $43.396 $38.915 $36.928 $48.092 $34.821 $41.142 $44.775 $41.109 $34.959 $55.840 $495.655
Other Adjustments:Other - - - - - - - - - - - - -
Total Other Adjustments $0.000 $0.000 $0.000 $0.000 $0.000 $0.000 $0.000 $0.000 $0.000 $0.000 $0.000 $0.000 $0.000
Total Expenditures $99.920 $99.174 $115.843 $106.380 $113.172 $117.829 $102.303 $119.018 $110.778 $106.787 $111.018 $139.091 $1,341.313
Baseline Net Cash Deficit ($34.320) ($28.810) ($28.135) ($32.890) ($40.080) ($44.605) ($28.605) ($37.637) ($34.087) ($33.748) ($36.832) ($66.402) ($446.151)
MTA Subsidy $23.675 $18.707 $18.420 $25.508 $31.929 $38.045 $21.707 $30.047 $26.648 $25.830 $29.035 $56.974 $346.525CDOT Subsidy $10.645 $10.103 $9.715 $7.382 $8.151 $6.560 $6.898 $7.590 $7.439 $7.918 $7.797 $9.428 $99.626
MTA METRO NORTH RAILROADFebruary Financial Plan - 2012 Adopted Budget
Cash Receipts & Expenditures($ in millions)

CASH FLOW ADJUSTMENTSJan Feb Mar Apr May Jun Jul Aug Sep Oct Nov Dec Total
ReceiptsFarebox Revenue $0.601 $0.615 $0.621 $0.625 $0.625 $0.673 $0.694 $0.715 $0.636 $0.620 $0.637 $0.650 $7.713Vehicle Toll Revenue - - - - - - - - - - - - - Other Operating Revenue 2.606 1.463 2.188 2.832 1.643 2.147 1.938 2.828 3.947 1.648 0.353 1.150 24.744 Capital and Other Reimbursements MNR - MTA (2.985) 4.727 16.907 (1.862) (2.068) (4.013) (0.430) 1.997 2.153 (1.622) 1.864 1.963 16.632 MNR - CDOT (0.119) 0.245 (0.128) (0.119) 0.240 (0.121) (0.112) 0.246 (0.111) (0.135) 0.228 0.122 0.235 MNR - Other 0.025 (0.020) (0.554) 0.070 0.045 0.054 (0.033) (0.080) (0.141) (0.214) (0.233) (0.237) (1.318) Total Receipts $0.128 $7.031 $19.035 $1.546 $0.485 ($1.260) $2.056 $5.706 $6.484 $0.298 $2.849 $3.648 $48.006
ExpendituresLabor:Payroll $3.024 $0.134 ($5.601) $1.660 ($3.769) $0.950 $3.218 ($4.235) $0.286 $4.313 ($5.586) $2.295 ($3.310)Overtime (0.190) 0.300 (1.200) 0.304 (0.959) 0.498 0.536 (0.661) 0.221 0.315 (0.792) 0.911 (0.717) Health and Welfare (0.084) (0.666) (0.266) (0.483) 0.242 (0.542) (0.053) 0.246 (0.959) 0.153 (0.072) (0.304) (2.788) OPEB Current Payment - - - - - - - - - - - - - Pensions 6.387 6.013 6.356 (0.168) 0.230 (0.127) 0.092 0.211 (0.394) 0.221 0.009 (18.941) (0.110) Other Fringe Benefits (1.051) (0.117) (1.631) (0.834) 0.601 (2.111) (0.538) (0.897) 0.454 1.121 0.919 2.940 (1.144) GASB Account (0.729) (0.729) (0.729) (0.729) (0.729) (0.729) (0.729) (0.729) (0.729) (0.729) (0.729) (0.727) (8.746) Reimbursable Overhead 0.001 0.003 0.008 0.039 0.042 0.035 (0.074) (0.043) (0.071) (0.042) (0.078) (0.110) (0.291) Total Labor $7.358 $4.938 ($3.064) ($0.210) ($4.343) ($2.025) $2.453 ($6.108) ($1.192) $5.352 ($6.329) ($13.936) ($17.106)
Non-Labor:Electric Power ($0.137) ($0.137) ($0.187) ($0.137) ($0.138) ($0.197) ($0.137) ($0.138) ($0.197) ($0.137) ($0.137) ($0.186) ($1.864)Fuel 0.001 (0.000) (0.000) 0.000 0.000 (0.001) (0.001) (0.001) (0.001) (0.001) (0.000) 0.003 (0.000) Insurance 1.210 (0.204) (0.773) 1.441 (0.038) (1.158) 1.384 (0.014) (0.790) 1.415 (0.149) (2.126) 0.199 Claims (0.000) 0.000 0.000 (0.001) 0.000 (0.001) 0.000 (0.001) 0.000 0.000 (0.001) (0.146) (0.146) Paratransit Service Contracts - - - - - - - - - - - - - Maintenance and Other Operating Contracts 0.802 0.815 (2.066) (1.156) 0.108 (6.837) 0.195 (0.816) (4.997) (0.767) 0.583 (12.950) (27.087) Professional Service Contracts 0.063 0.272 (0.485) 0.240 0.323 (0.746) 0.248 0.324 (0.843) 0.336 0.261 (1.077) (1.085) Materials & Supplies (0.570) (0.635) (0.647) (0.604) (0.290) (0.980) (0.551) (0.571) (1.848) (2.268) (1.190) (2.002) (12.156) Other Business Expenditures (1.843) (1.614) (1.972) (2.287) (3.269) (1.930) (2.672) (1.904) (1.799) (2.221) (1.818) (1.832) (25.161) Total Non-Labor ($0.476) ($1.503) ($6.130) ($2.504) ($3.303) ($11.848) ($1.534) ($3.120) ($10.474) ($3.642) ($2.451) ($20.316) ($67.301)
Other Adjustments:Other $0.000 $0.000 $0.000 $0.000 $0.000 $0.000 $0.000 $0.000 $0.000 $0.000 $0.000 $0.000 $0.000Total Other Expenditures Adjustments $0.000 $0.000 $0.000 $0.000 $0.000 $0.000 $0.000 $0.000 $0.000 $0.000 $0.000 $0.000 $0.000
Total Cash Conversion Adjustments before Non-Cash Liability Adjs.
$7.011 $10.466 $9.841 ($1.168) ($7.161) ($15.134) $2.975 ($3.521) ($5.183) $2.007 ($5.930) ($30.605) ($36.402)
Depreciation Adjustment 18.763 18.763 18.763 19.007 19.007 19.007 19.518 19.518 19.518 21.381 21.385 21.385 236.015 OPEB Obligation 5.000 5.000 5.000 5.000 5.000 5.000 5.000 5.000 5.000 5.000 5.000 5.000 59.997 Environmental Remediation - - 1.681 - - 1.681 - - 1.681 - - 1.681 6.723
Baseline Total Cash Conversion Adjustments $30.773 $34.228 $35.284 $22.839 $16.845 $10.553 $27.493 $20.997 $21.016 $28.388 $20.455 ($2.539) $266.333
February Financial Plan - 2012 Adopted BudgetCash Conversion (Cash Flow Adjustments)
($ in millions)
MTA METRO NORTH RAILROAD

MTA METRO-NORTH RAILROADFebruary Financial Plan - 2012 Adopted Budget
Overtime - Non-Reimbursable/Reimbursable Basis($ in millions)
NON-REIMBURSABLE Jan Feb Mar Apr May Jun Jul Aug Sep Oct Nov Dec Total$ $ $ $ $ $ $ $ $ $ $ $ $
SCHEDULED:Direct Service $2.397 $1.963 $1.750 $2.083 $2.011 $1.854 $2.140 $1.796 $2.015 $1.801 $2.393 $2.635 $24.837
Programmed Maintenance 0.746 0.720 0.864 0.757 0.647 0.726 0.758 0.769 0.823 0.794 0.782 0.786 9.173
Total Scheduled $3.143 $2.683 $2.614 $2.840 $2.658 $2.580 $2.898 $2.565 $2.838 $2.595 $3.175 $3.421 $34.010
UNSCHEDULED:Vacancy/Absentee Coverage $0.611 $0.677 $0.768 $0.780 $0.710 $0.949 $0.982 $1.047 $0.827 $0.774 $0.848 $0.858 $9.833
Weather Emergencies 0.798 0.815 0.638 0.376 0.344 0.379 0.364 0.411 0.363 0.380 0.388 0.626 5.881
Maintenance 0.211 0.241 0.236 0.224 0.171 0.255 0.232 0.204 0.199 0.158 0.204 0.202 2.538
Service Delays - - - - - - - - - - - - -
Emergencies - - - - - - - - - - - - -
Tour Length - - - - - - - - - - - - -
Safety/Security/Law Enforcement - - - - - - - - - - - - -
All Other 0.193 0.116 0.074 0.088 0.063 0.125 0.128 0.089 0.146 0.082 0.212 0.274 1.592
Total Unscheduled $1.814 $1.850 $1.717 $1.468 $1.288 $1.708 $1.706 $1.752 $1.534 $1.394 $1.652 $1.961 $19.844
TOTAL NON-REIMBURSABLE OVERTIME: $4.957 $4.533 $4.331 $4.308 $3.947 $4.288 $4.605 $4.317 $4.372 $3.988 $4.827 $5.383 $53.855
REIMBURSABLE OVERTIME $1.093 $1.108 $1.344 $1.739 $1.835 $1.803 $1.624 $1.763 $1.542 $1.720 $1.370 $1.115 $18.056
TOTAL NR & R OVERTIME $6.050 $5.641 $5.675 $6.047 $5.782 $6.091 $6.229 $6.080 $5.914 $5.708 $6.197 $6.498 $71.911

MTA METRO-NORTH RAILROADFebruary Financial Plan - 2012 Adopted Budget
Ridership/(Utilization)(in millions)
Jan Feb Mar Apr May Jun Jul Aug Sep Oct Nov Dec Total
RidershipBaseline
Harlem Line 2.062 2.031 2.282 2.217 2.321 2.305 2.286 2.290 2.149 2.452 2.259 2.244 26.898Hudson Line 1.219 1.186 1.336 1.339 1.417 1.411 1.422 1.452 1.318 1.482 1.356 1.336 16.274New Haven Line 2.867 2.795 3.192 3.149 3.314 3.378 3.383 3.400 3.108 3.506 3.262 3.234 38.588
Total Ridership 6.148 6.012 6.810 6.705 7.052 7.094 7.091 7.142 6.575 7.440 6.877 6.814 81.760
Farebox RevenueBaseline Harlem Line 13.644 13.447 14.390 14.363 14.736 15.278 15.328 14.752 14.724 15.193 15.062 15.150 176.067Hudson Line 9.893 9.636 10.427 10.704 11.022 11.182 11.469 11.309 10.977 11.423 11.157 11.065 130.264New Haven Line 20.966 20.513 22.629 22.905 23.503 24.848 24.984 24.332 23.620 24.338 24.417 24.723 281.778West of Hudson Mail-n-Ride .070 .071 .073 .070 .072 .073 .069 .069 .073 .073 .072 .070 .855
Total Farebox Revenue 44.573 43.667 47.519 48.042 49.333 51.381 51.850 50.462 49.394 51.027 50.708 51.008 588.964

Jan Feb Mar Apr May Jun Jul Aug Sep Oct Nov DecAdministration
President 3 3 3 3 3 3 3 3 3 3 3 3Labor Relations 9 9 9 9 9 9 9 9 9 9 9 9Safety 19 19 19 19 19 19 19 19 19 19 19 19COS/Corporate & Public Affairs 17 17 17 17 17 17 17 17 17 17 17 17Customer Service 45 45 45 45 45 45 45 45 45 45 45 45Legal 17 17 17 17 17 17 17 17 17 17 17 17Claims 14 14 14 14 14 14 14 14 14 14 14 14Environmental Compliance & Service 7 7 7 7 7 7 7 7 7 7 7 7VP Administration 3 3 3 3 3 3 3 3 3 3 3 3VP Human Resources 3 3 3 3 3 3 3 3 3 3 3 3Human Resources & Diversity 24 24 24 24 24 24 24 24 24 24 24 24Training 47 47 47 47 47 47 47 47 47 47 47 47Employee Relations & Diversity 4 4 4 4 4 4 4 4 4 4 4 4VP Planning 2 2 2 2 2 2 2 2 2 2 2 2Operations Planning & Analysis 17 17 17 17 17 17 17 17 17 17 17 17Capital Planning & Programming 13 13 13 13 13 13 13 13 13 13 13 13Business Development Facilities & Mktg 21 21 21 21 21 21 21 21 21 21 21 21Long Range Planning 8 8 8 8 8 8 8 8 8 8 8 8VP Finance & Info Systems 2 2 2 2 2 2 2 2 2 2 2 2Controller 78 78 78 78 78 78 78 78 78 78 78 78Information Technology & Project Mgmt 97 97 97 97 97 97 97 97 97 97 97 97Budget 18 18 18 18 18 18 18 18 18 18 18 18Procurement & Material Mgmt 41 41 41 41 41 41 41 41 41 41 41 41Corporate 0 0 0 0 0 0 0 0 0 0 0 0
Total Administration 509 509 509 509 509 509 509 509 509 509 509 509
OperationsOperations Admin 55 55 55 55 55 55 55 55 55 55 55 55Operations Services 1,742 1,742 1,747 1,763 1,769 1,772 1,772 1,770 1,772 1,772 1,771 1,771Customer Service 236 236 236 236 236 236 236 236 236 236 236 236Business Dev Facilities & Mktg 38 38 38 38 38 38 38 38 38 38 38 38Metro-North West 28 28 28 28 28 28 28 28 28 28 28 28
Total Operations 2,099 2,099 2,104 2,120 2,126 2,129 2,129 2,127 2,129 2,129 2,128 2,128
MaintenanceGCT 375 375 375 375 375 375 375 375 375 375 375 375Maintenance of Equipment 1,330 1,330 1,330 1,330 1,319 1,331 1,331 1,331 1,331 1,338 1,338 1,338Maintenance of Way 1,749 1,749 1,749 1,749 1,749 1,749 1,749 1,749 1,752 1,752 1,752 1,752Procurement & Material Mgmt 120 120 120 120 120 120 120 120 120 120 120 120
Total Maintenance 3,574 3,574 3,574 3,574 3,563 3,575 3,575 3,575 3,578 3,585 3,585 3,585
Engineering/CapitalConstruction Management 37 37 37 37 37 37 37 37 37 37 37 37Engineering & Design 60 60 60 60 60 60 60 60 60 60 60 60
Total Engineering/Capital 97 97 97 97 97 97 97 97 97 97 97 97
Total Positions 6,279 6,279 6,284 6,300 6,295 6,310 6,310 6,308 6,313 6,320 6,319 6,319
Non-Reimbursable 5,747 5,729 5,657 5,536 5,511 5,505 5,536 5,540 5,558 5,607 5,645 5,709Reimbursable 532 550 627 764 784 805 774 768 755 713 674 610
Total Full-Time 6,278 6,278 6,283 6,299 6,294 6,309 6,309 6,307 6,312 6,319 6,318 6,318Total Full-Time-Equivalents 1 1 1 1 1 1 1 1 1 1 1 1
MTA METRO-NORTH RAILROADFebruary Financial Plan - 2012 Adopted Budget
Total Positions by Function and DepartmentNon-Reimbursable/Reimbursable and Full-Time/Full-Time Equivalents
FUNCTION/DEPARTMENT

FUNCTION/OCCUPATION Jan Feb Mar Apr May Jun Jul Aug Sep Oct Nov Dec
Administration Managers/Supervisors 57 57 57 57 57 57 57 57 57 57 57 57 Professional, Technical, Clerical 452 452 452 452 452 452 452 452 452 452 452 452 Operational Hourlies - - - - - - - - - - - -
Total Administration 509 509 509 509 509 509 509 509 509 509 509 509
Operations Managers/Supervisors 27 27 27 27 27 27 27 27 27 27 27 27 Professional, Technical, Clerical 505 505 505 505 505 505 505 505 505 505 505 505 Operational Hourlies 1,567 1,567 1,572 1,588 1,594 1,597 1,597 1,595 1,597 1,597 1,596 1,596
Total Operations 2,099 2,099 2,104 2,120 2,126 2,129 2,129 2,127 2,129 2,129 2,128 2,128
Maintenance Managers/Supervisors 57 57 57 57 57 57 57 57 57 57 57 57 Professional, Technical, Clerical 1,028 1,028 1,028 1,028 1,027 1,031 1,031 1,031 1,031 1,032 1,032 1,032 Operational Hourlies 2,489 2,489 2,489 2,489 2,479 2,487 2,487 2,487 2,490 2,496 2,496 2,496
Total Maintenance 3,574 3,574 3,574 3,574 3,563 3,575 3,575 3,575 3,578 3,585 3,585 3,585
Engineering/Capital Managers/Supervisors 27 27 27 27 27 27 27 27 27 27 27 27 Professional, Technical, Clerical 70 70 70 70 70 70 70 70 70 70 70 70 Operational Hourlies - - - - - - - - - - - -
Total Engineering/Capital 97 97 97 97 97 97 97 97 97 97 97 97
Public Safety Managers/Supervisors - - - - - - - - - - - - Professional, Technical, Clerical - - - - - - - - - - - - Operational Hourlies - - - - - - - - - - - -
Total Public Safety - - - - - - - - - - - -
Total Positions Managers/Supervisors 168 168 168 168 168 168 168 168 168 168 168 168 Professional, Technical, Clerical 2,055 2,055 2,055 2,055 2,054 2,058 2,058 2,058 2,058 2,059 2,059 2,059 Operational Hourlies 4,056 4,056 4,061 4,077 4,073 4,084 4,084 4,082 4,087 4,093 4,092 4,092
Total Positions 6,279 6,279 6,284 6,300 6,295 6,310 6,310 6,308 6,313 6,320 6,319 6,319
MTA METRO-NORTH RAILROADFebruary Financial Plan - 2012 Adopted Budget
Total Positions by Function and Occupation

[THIS PAGE INTENTIONALLY LEFT BLANK]

MTA Headquarters

MTA HEADQUARTERS FEBRUARY FINANCIAL PLAN FOR 2012-2015
2011 FINAL ESTIMATE AND ADOPTED BUDGET FOR 2012 In accordance with MTA-approved budget procedures, the following information presents MTA Headquarters’ 2011 Final Estimate, 2012 Adopted Budget and the Financial Plan for 2012-2015. The adopted budget reflects the inclusion of MTA adjustments that were presented in the November Financial Plan, which were adopted by the Board in December 2011, as well as other technical adjustments. These adjustments are presented on the attached reconciliations from the November Financial Plan and are described below: Labor savings of $1.997 million in 2012, $2.043 million in 2013, $2.088 in 2014
and $2.134 million in 2015 from the impact of a third year wage freeze in 2011 for non-represented employees
Labor savings of $0.657 million in 2013, $4.743 million in 2014 and $4.416
million in 2015 from the impact of the Accelerated Zero Savings Initiative for represented employees.
New MTA IT Streams, Consolidations and Communications efficiencies result in
MTA net cash savings of $5.318 million in 2012 and over $4.0 million in the out-years, including $3.4 million of recurring savings in maintenance contracts at the Integrated Electronic Security System (IESS) facility.
Effective 2012, the non-labor account structure of the MTA standard chart of accounts has been adjusted to reflect the reclassification and renaming of certain accounts in order to improve account reporting consistency among the Agencies. These changes result in an expense shift causing a reduction of $0.247 million in the Accrued Non-Reimbursable Baseline Deficit. In order to maintain comparability with 2011 actual results for year-end reporting purposes, the 2011 account structure remains unchanged.
Technical adjustments include a functional shift of 1 position from Administration
to Public Safety and some minor shifts within Administration which do not impact total positions.
Technical adjustments also include a shift of $3.5 million in Operating Capital from 2012 to 2013 due to timing.
This submission also includes schedules detailing the monthly allocation of financial and headcount data based on the 2012 Adopted Budget for the purpose of reporting actual results on a monthly basis to the Board.

Positions Dollars Positions Dollars Positions Dollars Positions Dollars Positions Dollars
2011 November Financial Plan: Baseline Surplus/(Deficit) 1,684 ($377.525) 1,717 ($397.891) 1,700 ($402.316) 1,700 ($419.084) 1,730 ($443.112)
Technical Adjustments:Chart of Account $0.247 $0.303 $0.328 $0.361
Sub-Total Technical Adjustments -$ -$ -$ 0.247$ -$ 0.303$ -$ 0.328$ -$ 0.361$
MTA Plan Adjustments:
Labor: 3 Zeroes Salary/Wage Initiative $0.000 $0.000 $0.000 $0.000 $0.000Accelerate 3 Zeroes 0.000 0.000 0.657 4.743 4.416Non Represented Wage Freeze 2011 1.926 1.997 2.043 2.088 2.134
New MTA Efficiencies 2.228 4.822 4.573 4.627 4.695Energy/Other Reimbursements 0.000 0.001 0.001 0.001 0.001
Sub-Total MTA Plan Adjustments 0 $4.154 0 $6.819 0 $7.274 0 $11.459 0 $11.246
2012 February Financial Plan: Baseline Surplus/(Deficit) 1,684 ($373.371) 1,717 ($390.826) 1,700 ($394.739) 1,700 ($407.297) 1,730 ($431.505)
MTA HEADQUARTERSFebruary Financial Plan 2012 - 2015
Reconciliation to the November Plan (Accrual) Non-Reimbursable($ in millions)
Favorable/(Unfavorable)2011 2012 2013 2014 2015

Positions Dollars Positions Dollars Positions Dollars Positions Dollars Positions Dollars
2011 November Financial Plan: Baseline Surplus/(Deficit) 48 $0.000 48 $0.000 48 $0.000 48 $0.000 48 $0.000
Technical Adjustments:Chart of Accounts
Sub-Total Technical Adjustments 0 $0.000 0 $0.000 0 $0.000 0 $0.000 0 $0.000
MTA Plan Adjustments
Labor:3 Zeroes Salary/Wage Initiative $0.000 $0.000 $0.000 $0.000 $0.000Accelerate 3 Zeroes - - - - -
New MTA Efficiencies - - - - - Energy/Other Reimbursements - - - - -
Sub-Total MTA Plan Adjustments 0 $0.000 0 $0.000 0 $0.000 0 $0.000 0 $0.000
2012 February Financial Plan: Baseline Surplus/(Deficit) 48 $0.000 48 $0.000 48 $0.000 48 $0.000 48 $0.000
MTA HEADQUARTERSFebruary Financial Plan 2012 - 2015
Reconciliation to the November Plan (Accrual) Reimbursable($ in millions)
Favorable/(Unfavorable)2011 2012 2013 2014 2015

Positions Dollars Positions Dollars Positions Dollars Positions Dollars Positions Dollars
2011 November Financial Plan: Baseline Cash Surplus/(Deficit) 1,732 ($276.278) 1,765 ($303.771) 1,748 ($307.246) 1,748 ($318.499) 1,778 ($338.049)
Technical Adjustments:Chart of Accounts $0.248 $0.303 $0.328 $0.361Change in Cash Adjustment (0.212) (0.183) (0.193) (0.196)Operating Capital Shift 3.500 (3.500)
Sub-Total Technical Adjustments 0 $0.000 0 $3.536 0 ($3.380) 0 $0.136 0 $0.165
MTA Plan Adjustments:
Labor:3 Zeroes Salary/Wage Initiative $0.000 $0.000 $0.000 $0.000 $0.000Accelerate 3 Zeroes 0.000 0.000 0.657 4.743 4.416Non Represented Wage Freeze 2011 1.926 1.997 2.043 2.088 2.134
New MTA Efficiencies 2.228 5.318 4.842 4.627 4.695Energy/Other Reimbursements 0.000 0.001 0.001 0.001 0.001
Sub-Total MTA Plan Adjustments 0 $4.154 0 $7.315 0 $7.543 0 $11.459 0 $11.246
2012 February Financial Plan: Baseline Cash Surplus/(Deficit) 1,732 ($272.125) 1,765 ($292.920) 1,748 ($303.083) 1,748 ($306.904) 1,778 ($326.637)
MTA HEADQUARTERSFebruary Financial Plan 2012 - 2015
Reconciliation to the November Plan - (Cash)($ in millions)
Favorable/(Unfavorable)2011 2012 2013 2014 2015

NON-REIMBURSABLE Final New February Proposed MTA Energy/ New All Adopted
Budget Labor Efficiencies Other Reimb. COA Other Budget
RevenueFarebox RevenueVehicle Toll RevenueOther Operating Revenue:
Rental Income 52.628 - - - - - 52.628 Other 4.085 - - - 0.213 - 4.298 Total Other Operating Revenue 56.713 - - - 0.213 - 56.926
Capital and Other Reimbursements - - - - - - -
Total Revenue $56.713 $0.000 $0.000 $0.000 $0.213 $0.000 $56.926
ExpensesLabor:Payroll 161.792 (1.483) - - - - 160.309 Overtime 8.775 - - - (0.000) - 8.775 Health and Welfare 25.661 (0.231) - - 0.000 - 25.430 OPEB Current Payment 8.400 - - - - - 8.400 Pensions 35.703 (0.162) - - (0.000) - 35.542 Other Fringe Benefits 14.332 (0.121) - - - 14.211 Reimbursable Overhead (57.097) - - - 0.000 - (57.097)
Total Labor Expenses $197.566 ($1.997) $0.000 $0.000 $0.000 $0.000 $195.570
Non-Labor:Electric Power - - - - 9.199 - 9.199 Fuel - - (0.001) - 2.592 - 2.591 Insurance 3.391 - - - (0.242) - 3.149 Claims 0.999 - - - - - 0.999 Paratransit Service Contracts - - - - - Maintenance and Other Operating Contracts 44.737 - (4.009) - 30.404 - 71.132 Professional Service Contracts 34.929 - (0.812) - 13.967 - 48.084 Materials & Supplies 6.652 - - - (6.639) - 0.013 Other Business Expenses
MTA Internal Subsidy 0.600 - - - - - 0.600 Other 55.017 - - - (49.316) - 5.701 Total Other Business Expenses 55.617 - - - (49.316) - 6.301
Total Non-Labor Expenses $146.325 $0.000 ($4.822) $0.000 ($0.034) $0.000 $141.469
Other Expense Adjustments:Other - - - - - - -
Total Other Expense Adjustments $0.000 $0.000 $0.000 0.000 0.000 0.000 0.000
Total Expenses before Non-Cash Liability Adjustments $343.891 ($1.997) ($4.822) $0.000 ($0.034) $0.000 337.039
Depreciation 39.713 - - - 0.000 - 39.713 OPEB Obligation 71.000 - - - - - 71.000
Total Expenses $454.604 ($1.997) ($4.822) $0.000 ($0.034) $0.000 $447.752
Baseline Surplus/(Deficit) ($397.891) $1.997 $4.822 $0.000 $0.247 $0.000 ($390.826)
Cash Conversion Adjustments:Depreciation 0.000Operating/Capital 0.000Other Cash Adjustments 0.000
Total Cash Conversion Adjustments $0.000 $0.000 $0.000 $0.000 $0.000 $0.000 $0.000
Baseline Net Cash Surplus/(Deficit) ($397.891) $1.997 $4.822 $0.000 $0.247 $0.000 ($390.826)
-- Differences are due to rounding.
MTA HEADQUARTERS2012 February Adopted Budget
Reconciliation to the 2012 Final Proposed Budget vs. 2012 Adopted Budget by Generic Category (Accrual and Cash)($ in millions)
2012
MTA Plan Adjustments

REIMBURSABLEFinal New February
Proposed MTA Energy/ New All AdoptedBudget Labor Efficiencies Other Reimb. COA Other Budget
RevenueFarebox Revenue - - - - - - - Vehicle Toll Revenue - - - - - - - Other Operating Revenue - - - - - - - Capital & Other Reimbursements 74.635 (0.085) - - 0.242 - 74.792
Total Revenue $74.635 ($0.085) $0.000 $0.000 $0.242 $0.000 $74.792
ExpensesLabor:Payroll 3.703 (0.063) - - - - 3.640 Overtime - - - - - - - Health and Welfare 0.534 (0.010) - - - - 0.524 OPEB Current Payment - - - - - - - Pensions 0.432 (0.007) - - - - 0.425 Other Fringe Benefits 0.274 (0.005) - - - 0.269 Reimbursable Overhead 57.097 - - - - - 57.097
Total Labor Expenses $62.040 ($0.085) $0.000 $0.000 $0.000 $0.000 $61.955
Non-Labor:Electric Power - - - - 0.014 - 0.014 Fuel - - - - - - - Insurance 0.112 - - - - - 0.112 Claims - - - - - - - Paratransit Service Contracts - - - - - - - Maintenance and Other Operating Contracts 0.115 - - - (0.021) - 0.094 Professional Service Contracts 12.122 - - - 0.384 - 12.507 Materials & Supplies 0.057 - - - (0.057) - - Other Business Expenses
MTA Internal Subsidy - - - - - - - Other 0.189 - - - (0.078) - 0.111 Total Other Business Expenses 0.189 - - - (0.078) - 0.111
Total Non-Labor Expenses $12.595 $0.000 $0.000 $0.000 $0.242 $0.000 $12.837
Other Expense Adjustments:Other - - - - - - -
Total Other Expense Adjustments $0.000 $0.000 $0.000 $0.000 $0.000 $0.000 $0.000
Total Expenses before Depreciation $74.635 ($0.085) $0.000 $0.000 $0.242 $0.000 $74.792
Depreciation - - - - - - -
Total Expenses $74.635 ($0.085) $0.000 $0.000 $0.242 $0.000 $74.792
Baseline Surplus/(Deficit) $0.000 $0.000 $0.000 $0.000 ($0.000) $0.000 $0.000
Cash Conversion Adjustments:Depreciation - - - - - - - Operating/Capital - - - - - - - Other Cash Adjustments - - - - - - -
Total Cash Conversion Adjustments $0.000 $0.000 $0.000 $0.000 $0.000 $0.000 $0.000
Baseline Net Cash Surplus/(Deficit) $0.000 $0.000 $0.000 $0.000 ($0.000) $0.000 $0.000
-- Differences are due to rounding.
MTA HEADQUARTERS2012 February Adopted Budget
Reconciliation to the 2012 Final Proposed Budget vs. 2012 Adopted Budget by Generic Category (Accrual and Cash)($ in millions)
2012MTA Plan Adjustments

NON-REIMBURSABLE/REIMBURSABLE Final New February
Proposed MTA Energy/ New All AdoptedBudget Labor Efficiencies Other Reimb. COA Other Budget
RevenueFarebox Revenue 0.000 0.000Vehicle Toll RevenueOther Operating Revenue
Rental Income 52.628 - - - - - 52.628 Other 4.085 - - - 0.213 - 4.298 Total Other Operating Revenue 56.713 - - - 0.213 - 56.926
Capital and Other Reimbursements 74.635 (0.085) - - 0.242 - 74.792 Total Revenue $131.348 ($0.085) $0.000 $0.000 $0.455 $0.000 $131.718
ExpensesLabor:Payroll 165.495 (1.546) - - - - 163.949 Overtime 8.775 - - - - - 8.775 Health and Welfare 26.194 (0.241) - - - - 25.954 OPEB Current Payment 8.400 - - - - - 8.400 Pensions 36.135 (0.169) - - - - 35.967 Other Fringe Benefits 14.605 (0.126) - - - - 14.480 Reimbursable Overhead - - - - 0.00 - 0.000 Total Labor Expenses $259.605 ($2.082) $0.000 $0.000 $0.000 $0.000 $257.525
Non-Labor:Electric Power - - - - 9.213 - 9.213 Fuel - - (0.001) - 2.592 - 2.591 Insurance 3.503 - - - (0.242) - 3.261 Claims 0.999 - - - - - 0.999 Paratransit Service Contracts - - - - - - - Maintenance and Other Operating Contracts 44.852 - (4.009) - 30.383 - 71.226 Professional Service Contracts 47.051 - (0.812) - 14.352 - 60.591 Materials & Supplies 6.708 - - - (6.696) - 0.013 Other Business Expenses
MTA Internal Subsidy 0.600 - - - - - 0.600 Other Business Expenses 55.207 - - - (49.394) - 5.812 Total Other Business Expenses 55.807 - - - (49.394) - 6.412
Total Non-Labor Expenses $158.921 $0.000 ($4.822) $0.000 $0.208 $0.000 $154.306
Other Expense Adjustments:Other - - - - - - - Total Other Expense Adjustments $0.000 $0.000 $0.000 $0.000 $0.000 $0.000 $0.000
Total Expenses before Non-Cash Liability Adjustments $418.526 ($2.082) ($4.822) $0.000 $0.208 $0.000 $411.831
Depreciation 39.713 - - - 0.000 - 39.713 OPEB Obligation 71.000 - - - - - 71.000
Total Expenses $529.239 ($2.082) ($4.822) $0.000 $0.208 $0.000 $522.544
Baseline Net Cash Surplus/(Deficit) ($397.891) $1.997 $4.822 $0.000 $0.247 $0.000 ($390.826)
-- Differences are due to rounding.
MTA HEADQUARTERS2012 February Adopted Budget
Reconciliation to the 2012 Final Proposed Budget vs. 2012 Adopted Budget by Generic Category (Accrual and Cash)($ in millions)
2012MTA Plan Adjustments

CASH RECEIPTS & EXPENDITURESFinal New February
Proposed MTA Energy/ New All AdoptedBudget Labor Efficiencies Other Reimb. COA Other Budget
ReceiptsFarebox RevenueVehicle Toll RevenueOther Operating Revenue
Rental Income 52.628 - - - - - 52.628 Other 4.335 - - - 0.213 - 4.548 Total Other Operating Revenue 56.963 - - - 0.213 - 57.176
Capital & Other Reimbursements 74.635 (0.085) - - 0.242 - 74.792 Total Receipts $131.598 ($0.085) $0.000 $0.000 $0.455 $0.000 $131.968
ExpendituresLabor:Payroll 163.005 (1.546) - - - - 161.459 Overtime 8.775 - - - - - 8.775 Health and Welfare 25.166 (0.241) - - - - 24.925 OPEB Current Payment 8.400 - - - - - 8.400 Pensions 39.355 (0.169) - - - - 39.187 Other Fringe Benefits 14.548 (0.126) - - - - 14.422 GASB Account 1.029 - - - 0.000 - 1.029 Reimbursable OverheadTotal Labor Expenditures $260.278 ($2.082) $0.000 $0.000 $0.000 $0.000 $258.197
Non-Labor:Electric Power - - - - 9.213 - 9.213 Fuel - - (0.001) - 2.592 - 2.591 Insurance 3.260 - - - (0.242) - 3.018 Claims 0.999 - - - - - 0.999 Paratransit Service ContractsMaintenance and Other Operating Contracts 43.618 - (3.844) - 28.527 - 68.301 Professional Service Contracts 44.228 - (0.752) - 12.570 - 56.046 Materials & Supplies 6.541 - - - (6.528) - 0.012 Other Business Expenditures
MTA Internal Subsidy 0.600 - - - - - 0.600 Other Business Expenses 51.342 - - - (45.936) - 5.405 Total Other Business Expenses 51.942 - - - (45.936) - 6.005
Total Non-Labor Expenditures $150.589 $0.000 ($4.597) $0.000 $0.195 $0.000 $146.186
Other Expenditure Adjustments:Operating Capital 24.502 - (0.497) - - (3.500) 20.505 Total Other Expenditure Adjustments $24.502 $0.000 ($0.497) $0.000 $0.000 ($3.500) 20.505
Total Expenditures $435.369 ($2.082) ($5.094) $0.000 $0.195 ($3.500) $424.888
Baseline Net Cash Surplus/(Deficit) ($303.771) $1.997 $5.094 $0.000 $0.260 $3.500 ($292.920)
-- Differences are due to rounding.
MTA HEADQUARTERS2012 February Adopted Budget
Reconciliation to the 2012 Final Proposed Budget vs. 2012 Adopted Budget by Generic Category (Accrual and Cash)($ in millions)
2012MTA Plan Adjustments

CASH FLOW ADJUSTMENTSFinal New February
Proposed MTA Energy/ New All AdoptedBudget Labor Efficiencies Other Reimb. COA Other Budget
ReceiptsFarebox Revenue 0.000 - - - - - 0.000Vehicle Toll Revenue 0.000 - - - - - 0.000
Other Operating RevenueRental Income 0.000 - - - - - 0.000Other 0.250 0.000 0.000 0.000 0.000 0.000 0.250Total Other Operating Revenue 0.250 - - - - - 0.250
Capital & Other Reimbursements 0.000 - - - - - 0.000Total Receipt Adjustments $0.250 $0.000 $0.000 $0.000 $0.000 $0.000 $0.250
ExpendituresLabor:Payroll 2.490 - - - - - 2.490Overtime - - - - - 0.000Health and Welfare 1.029 - - - - - 1.029OPEB Current Payment 0.000 - - - - - 0.000Pensions (3.219) - - - - - (3.219)Other Fringe Benefits 0.057 - - - - - 0.057GASB Account (1.029) - - - - - (1.029)Reimbursable Overhead 0.000 - - - - - 0.000Total Labor Expenditures ($0.673) $0.000 $0.000 $0.000 $0.000 $0.000 ($0.673)
Non-Labor:Electric Power - - - - - - - Fuel - - - - - - - Insurance 0.243 - - - - - 0.243 Claims - - - - - - - Paratransit Service Contracts - - - - - - - Maintenance and Other Operating Contracts 1.233 - (0.165) - 1.856 - 2.925 Professional Service Contracts 2.823 - (0.060) - 1.782 - 4.544 Materials & Supplies 0.168 - - - (0.167) - 0.000 Other Business Expenditures -
MTA Internal Subsidy - - - - - - - Other Business Expenses 3.864 - - - (3.457) - 0.407 Total Other Business Expenses 3.864 - - - (3.457) - 0.407
Total Non-Labor Expenditures $8.331 $0.000 ($0.225) $0.000 $0.013 $0.000 $8.120
Other Expenditure Adjustments:Operating Capital (24.502) - 0.497 - - 3.500 (20.505)Total Other Expenditure Adjustments ($24.502) $0.000 $0.497 $0.000 $0.000 $3.500 ($20.505)
Total Expenditure Adjustments ($16.843) $0.000 $0.272 $0.000 $0.013 $3.500 ($13.058)
Total Cash Conversion Adjustments beforeNon-Cash Liability Adjs. ($16.593) $0.000 $0.272 $0.000 $0.013 $3.500 ($12.808)
Depreciation Adjustment 39.713 - - - - - 39.713 OPEB Obligation 71.000 - - - - - 71.000
Baseline Total Cash Conversion Adjustments $94.120 $0.000 $0.272 $0.000 $0.013 $3.500 $97.905
-- Differences are due to rounding.
MTA HEADQUARTERS2012 February Adopted Budget
Reconciliation to the 2012 Final Proposed Budget vs. 2012 Adopted Budget by Generic Category (Accrual and Cash)($ in millions)
2012MTA Plan Adjustments

NON-REIMBURSABLE
2011 2012
Final Adopted
Estimate* Budget 2013 2014 2015
Operating Revenue
Fare Revenue $0.000 $0.000 $0.000 $0.000 $0.000
Vehicle Toll Revenue - - - - -
Other Operating Revenue
Rental Income $51.587 $52.628 $52.471 $53.468 $54.569
Other 4.435 4.298 4.364 4.447 4.538
Total Other Operating Revenue 56.023 56.926 56.834 57.914 59.107
Capital and Other Reimbursements - - - - -
Total Revenue $56.023 $56.926 $56.834 $57.914 $59.107
Operating Expenses
Labor:
Payroll $154.440 $160.309 $161.219 $162.462 $165.802
Overtime 8.863 8.775 8.932 9.098 9.103
Health and Welfare 19.484 25.430 26.292 28.181 30.848
OPEB Current Payment 6.957 8.400 9.600 10.900 12.200
Pensions 29.770 35.542 39.110 38.777 41.071
Other Fringe Benefits 15.500 14.211 14.171 14.470 15.050
Reimbursable Overhead (47.992) (57.097) (58.803) (60.008) (55.331)
Total Labor Expenses $187.022 $195.570 $200.520 $203.879 $218.744
Non-Labor:
Electric Power $0.000 $9.199 $9.372 $9.551 $9.747
Fuel - 2.591 2.665 2.689 2.697
Insurance 2.729 3.149 3.464 3.811 4.192
Claims 2.435 0.999 1.099 1.209 1.330
Paratransit Service Contracts - - - -
Maintenance and Other Operating Contracts 30.647 71.132 74.183 81.258 84.921
Professional Service Contracts 24.345 48.084 49.307 46.923 49.074
Materials & Supplies 6.511 0.013 0.013 0.013 0.014
Other Business Expenses
MTA Internal Subsidy 23.262 0.600 0.600 0.600 0.600
Other 44.698 5.701 5.724 5.831 6.010
Total Other Business Expenses 67.960 6.301 6.324 6.431 6.610
Total Non-Labor Expenses $134.625 $141.469 $146.429 $151.885 $158.585
Other Expenses Adjustments:
Other - - - - -
Total Other Expense Adjustments $0.000 $0.000 $0.000 $0.000 $0.000
Total Expenses before Depreciation and GASB Adjs. $321.647 $337.039 $346.949 $355.764 $377.328
Depreciation $40.646 $39.713 $29.624 $30.147 $29.683
OPEB Obligation 67.100 71.000 75.000 79.300 83.600
Environmental Remediation - - - - -
Total Expenses $429.394 $447.752 $451.573 $465.211 $490.612
Baseline Surplus/(Deficit) ($373.371) ($390.826) ($394.739) ($407.297) ($431.505)
*Effective 2012, the non-labor account structure of the MTA standard chart of accounts has been adjusted to reflect the reclassification and renaming of certain accounts in order to improve account reporting consistency among the Agencies. These changes result in an expense shift causing a reduction of $0.247 million in the Accrued Non-Reimbursable Baseline Deficit. In order to maintain comparability with 2011 actual results for year-end reporting purposes, the 2011 account structure remains unchanged.
($ in millions)
MTA HEADQUARTERSFebruary Financial Plan 2012-2015
Accrual Statement of Operations by Category

REIMBURSABLE
2011 2012 0 0 0
Final Adopted 0 0 0
Estimate* Budget 2013 2014 2015
Revenue
Fare Revenue $0.000 $0.000 $0.000 $0.000 $0.000
Vehicle Toll Revenue - - - - -
Other Operating Revenue - - - - -
Capital and Other Reimbursements 58.265 74.792 85.529 92.116 87.778
Total Revenue $58.265 $74.792 $85.529 $92.116 $87.778
Expenses
Labor:
Payroll $2.778 $3.640 $3.711 $3.783 $3.852
Overtime - - - - -
Health and Welfare 0.450 0.524 0.611 0.669 0.731
OPEB Current Payment - - - - -
Pensions 0.327 0.425 0.544 0.571 0.598
Other Fringe Benefits 0.272 0.269 0.308 0.319 0.332
Reimbursable Overhead 47.992 57.097 58.803 60.008 55.331
Total Labor Expenses $51.819 $61.955 $63.977 $65.351 $60.844
Non-Labor:
Electric Power $0.000 $0.014 $0.014 $0.014 $0.015
Fuel - - - - -
Insurance 0.110 0.112 0.123 0.135 0.149
Claims -
Paratransit Service Contracts -
Maintenance and Other Operating Contracts 0.077 0.094 0.095 0.097 0.099
Professional Service Contracts 6.120 12.507 21.207 26.403 26.553
Materials & Supplies 0.034 - - - -
Other Business Expenses
MTA Internal Subsidy - - - -
Other 0.104 0.111 0.113 0.115 0.117
Total Other Business Expenses 0.104 0.111 0.113 0.115 0.117
Total Non-Labor Expenses $6.446 $12.837 $21.553 $26.765 $26.934
Other Expenses Adjustments:
Other - -
Total Other Expense Adjustments $0.000 $0.000 $0.000 $0.000 $0.000
Total Expenses before Depreciation $58.265 $74.792 $85.529 $92.116 $87.778
Depreciation $0.000 $0.000 $0.000 $0.000 $0.000
OPEB Obligation - - - - -
Environmental Remediation - - - - -
Total Expenses $58.265 $74.792 $85.529 $92.116 $87.778
Baseline Surplus/(Deficit) $0.000 $0.000 $0.000 $0.000 $0.000
*Effective 2012, the non-labor account structure of the MTA standard chart of accounts has been adjusted to reflect the reclassification and renaming of certain accounts in order to improve account reporting consistency among the Agencies. These changes result in an expense shift causing a reduction of $0.247 million in the Accrued Non-Reimbursable Baseline Deficit. In order to maintain comparability with 2011 actual results for year-end reporting purposes, the 2011 account structure remains unchanged.
Accrual Statement of Operations by Category($ in millions)
MTA HEADQUARTERSFebruary Financial Plan 2012-2015

NON-REIMBURSABLE / REIMBURSABLE
2011 2012 0 0 0
Final Adopted 0 0 0
Estimate* Budget 2013 2014 2015
Revenue
Fare Revenue $0.000 $0.000 $0.000 $0.000 $0.000
Vehicle Toll Revenue - - - - -
Other Operating Revenue
Rental Income 51.587 52.628 52.471 53.468 54.569
Data Center Billings - - - - - Other 4.435 4.298 4.364 4.447 4.538
Total Other Operating Revenue 56.023 56.926 56.834 57.914 59.107
Capital and Other Reimbursements 58.265 74.792 85.529 92.116 87.778
Total Revenue $114.288 $131.718 $142.364 $150.030 $146.885
Expenses
Labor:
Payroll $157.218 $163.949 $164.930 $166.245 $169.654
Overtime 8.863 8.775 8.932 9.098 9.103
Health and Welfare 19.934 25.954 26.902 28.850 31.579
OPEB Current Payment 6.957 8.400 9.600 10.900 12.200
Pensions 30.097 35.967 39.654 39.348 41.670
Other Fringe Benefits 15.772 14.480 14.479 14.789 15.382
Reimbursable Overhead - - - - -
Total Labor Expenses $238.841 $257.525 $264.497 $269.230 $279.588
Non-Labor:
Electric Power $0.000 $9.213 $9.386 $9.565 $9.762
Fuel - 2.591 2.665 2.689 2.697
Insurance 2.839 3.261 3.588 3.946 4.341
Claims 2.435 0.999 1.099 1.209 1.330
Paratransit Service Contracts - - - - -
Maintenance and Other Operating Contracts 30.724 71.226 74.278 81.355 85.020
Professional Service Contracts 30.465 60.591 70.514 73.327 75.627
Materials & Supplies 6.545 0.013 0.013 0.013 0.014
Other Business Expenses
MTA Internal Subsidy 23.262 0.600 0.600 0.600 0.600
Other Business Expenses 44.802 5.812 5.837 5.946 6.127
Total Other Business Expenses 68.064 6.412 6.437 6.546 6.727
Total Non-Labor Expenses $141.071 $154.306 $167.982 $178.650 $185.518
Other Expenses Adjustments:
Other $0.000 $0.000 $0.000 $0.000 $0.000
Total Other Expense Adjustments $0.000 $0.000 $0.000 $0.000 $0.000
Total Expenses before Depreciation and GASB Adjs. $379.912 $411.831 $432.478 $447.880 $465.106
Depreciation $40.646 $39.713 $29.624 $30.147 $29.683
OPEB Obligation 67.100 71.000 75.000 79.300 83.600
Environmental Remediation - - - - -
Total Expenses $487.658 $522.544 $537.102 $557.327 $578.390
Baseline Surplus/(Deficit) ($373.371) ($390.826) ($394.739) ($407.297) ($431.505)
($ in millions)
MTA HEADQUARTERSFebruary Financial Plan 2012-2015
Accrual Statement of Operations by Category
*Effective 2012, the non-labor account structure of the MTA standard chart of accounts has been adjusted to reflect the reclassification and renaming of certain accounts in order to improve account reporting consistency among the Agencies. These changes result in an expense shift causing a reduction of $0.247 million in the Accrued Non-Reimbursable Baseline Deficit. In order to maintain comparability with 2011 actual results for year-end reporting purposes, the 2011 account structure remains unchanged.

CASH RECEIPTS AND EXPENDITURES
2011 2012 0 0 0
Final Adopted 0 0 0
Estimate* Budget 2013 2014 2015
Receipts
Fare Revenue $0.000 $0.000 $0.000 $0.000 $0.000
Vehicle Toll Revenue - - - - -
Other Operating Revenue
Rental Income 51.347 52.628 52.471 53.468 54.569
Data Center Billings
Other 4.664 4.548 4.618 4.706 4.803
Total Other Operating Revenue 56.012 57.176 57.089 58.174 59.372
Capital and Other Reimbursements 58.265 74.792 85.529 92.116 87.778
Total Receipts $114.277 $131.968 $142.618 $150.290 $147.150
Expenditures
Labor:
Payroll $153.053 $161.459 $162.401 $163.599 $166.949
Overtime 8.863 8.775 8.932 9.098 9.103
Health and Welfare 18.934 24.925 25.830 27.732 30.439
OPEB Current Payment 6.957 8.400 9.600 10.900 12.200
Pensions 30.386 39.187 40.524 40.134 42.210
Other Fringe Benefits 15.711 14.422 14.419 14.727 15.317
GASB Account 1.000 1.029 1.073 1.118 1.140
Reimbursable Overhead - - - - -
Total Labor Expenditures $234.904 $258.197 $262.778 $267.308 $277.359
Non-Labor:
Electric Power $0.000 $9.213 $9.386 $9.565 $9.762
Fuel - 2.591 2.665 2.689 2.697
Insurance 2.555 3.018 3.320 3.652 4.017
Claims 2.435 0.999 1.099 1.209 1.330
Paratransit Service Contracts
Maintenance and Other Operating Contracts 28.355 68.301 71.387 78.235 81.790
Professional Service Contracts 27.777 56.046 65.226 67.827 69.955
Materials & Supplies 6.618 0.012 0.013 0.013 0.013
Other Business Expenses
MTA Internal Subsidy 23.262 0.600 0.600 0.600 0.600
Other Business Expenses 46.339 5.405 5.428 5.530 5.698
Total Other Business Expenses 69.601 6.005 6.028 6.130 6.298
Total Non-Labor Expenditures $137.340 $146.186 $159.126 $169.320 $175.862
Other Expenditure Adjustments:
Operating Capital 14.157 20.505 23.797 20.566 20.566
Total Other Expenditure Adjustments $14.157 $20.505 $23.797 $20.566 $20.566
Total Expenditures $386.401 $424.888 $445.701 $457.193 $473.787
Baseline Cash Deficit ($272.125) ($292.920) ($303.083) ($306.904) ($326.637)
MTA HEADQUARTERSFebruary Financial Plan 2012-2015
Cash Receipts & Expenditures($ in millions)
*Effective 2012, the non-labor account structure of the MTA standard chart of accounts has been adjusted to reflect the reclassification and renaming of certain accounts in order to improve account reporting consistency among the Agencies. These changes result in an expense shift causing a reduction of $0.247 million in the Accrued Non-Reimbursable Baseline Deficit. In order to maintain comparability with 2011 actual results for year-end reporting purposes, the 2011 account structure remains unchanged.

CASH FLOW ADJUSTMENTS
2011 2012 0 0 0
Final Adopted 0 0 0
Estimate* Budget 2013 2014 2015
Receipts
Fare Revenue $0.000 $0.000 $0.000 $0.000 $0.000
Rental Income (0.240) - - - -
Other Operating Revenue 0.229 0.250 0.255 0.259 0.265
Capital and Other Reimbursements - - - - -
Total Receipts ($0.011) $0.250 $0.255 $0.259 $0.265
Expenditures
Labor:
Payroll $4.165 $2.490 $2.529 $2.646 $2.705
Overtime - - - - -
Health and Welfare 1.000 1.029 1.073 1.118 1.140
OPEB Current Payment - - - - -
Pensions (0.289) (3.219) (0.870) (0.786) (0.540)
Other Fringe Benefits 0.061 0.057 0.059 0.062 0.065
GASB Account (1.000) (1.029) (1.073) (1.118) (1.140)
Reimbursable Overhead - - - - -
Total Labor Expenditures $3.937 ($0.673) $1.718 $1.922 $2.230
Non-Labor:
Electric Power $0.000 $0.000 $0.000 $0.000 $0.000
Fuel - - - - -
Insurance 0.284 0.243 0.268 0.294 0.324
Claims - - - - -
Paratransit Service Contracts - - - - -
Maintenance and Other Operating Contracts 2.369 2.925 2.891 3.120 3.231
Professional Service Contracts 2.688 4.544 5.289 5.499 5.672
Materials & Supplies (0.074) 0.000 0.000 0.000 0.000
Other Business Expenses
MTA Internal Subsidy - - - - -
Other Business Expenses (1.537) 0.407 0.409 0.416 0.429
Total Other Business Expenses (1.537) 0.407 0.409 0.416 0.429
Total Non-Labor Expenditures $3.731 $8.120 $8.856 $9.331 $9.656
Other Expenditure Adjustments:
Operating Capital ($14.157) ($20.505) ($23.797) ($20.566) ($20.566)
Total Other Expenditure Adjustments ($14.157) ($20.505) ($23.797) ($20.566) ($20.566)
Total Cash Conversion Adjustments before Depreciation and GASB Adjs.
($6.500) ($12.808) ($12.968) ($9.054) ($8.416)
Depreciation Adjustment $40.646 $39.713 $29.624 $30.147 $29.683
OPEB Obligation 67.100 71.000 75.000 79.300 83.600
Environmental Remediation - - - - -
Baseline Total Cash Conversion Adjustments $101.246 $97.905 $91.656 $100.393 $104.867
($ in millions)
MTA HEADQUARTERSFebruary Financial Plan 2012-2015
Cash Conversion (Cash Flow Adjustments)
*Effective 2012, the non-labor account structure of the MTA standard chart of accounts has been adjusted to reflect the reclassification and renaming of certain accounts in order to improve account reporting consistency among the Agencies. These changes result in an expense shift causing a reduction of $0.247 million in the Accrued Non-Reimbursable Baseline Deficit. In order to maintain comparability with 2011 actual results for year-end reporting purposes, the 2011 account structure remains unchanged.

NON-REIMBURSABLE OVERTIME Hours $ %
SCHEDULED:Direct Service 0 $0.000 0.0%
Programmed Maintenance 0 0.000 0.0%
Total Scheduled - $0.000 0.0%
UNSCHEDULED:Vacancy/Absentee Coverage 66,802 $4.160 47.4%
Weather Emergencies 0 0.000 0.0%
Maintenance 0 0.000 0.0%
Service Delays 0 0.000 0.0%
Emergencies 0 0.000 0.0%
Safety/Security/Law Enforcement 69,363 4.315 49.2%
All Other 7,774 0.300 3.4%
Total Unscheduled 143,940 $8.775 100.0%
TOTAL NON-REIMBURSABLE OVERTIME: 143,940 $8.775 100.0%
REIMBURSABLE OVERTIME 0 $0.000
TOTAL OVERTIME 143,940 $8.775
MTA Headquarters2012 Adopted Budget
2012 Non-Reimbursable/Reimbursable Overtime ($ in millions)
Total

FUNCTION/DEPARTMENT
2011Final
Estimate
2012 Adopted Budget 2013 2014 2015
AdministrationOffice of Chairman 4 4 4 4 4Office of Chief of Staff 3 3 3 3 3General Counsel 56 57 57 57 57Office of Diversity 28 28 28 28 28Labor Relations 5 6 6 6 6Media Relations 11 11 11 11 11PCAC 4 4 4 4 4Audit 85 85 85 85 85Chief Financial Officer 58 60 60 60 60Real Estate 60 60 60 60 60Strategic Initiatives 3 4 4 4 4Bus Customer Info 8 8 8 8 8New Fare Systems 25 25 25 25 25Spec. Project Develop/Planning 8 8 8 8 8Environmental, Sustainability and Compliance 6 6 6 6 6Chief Operating Officer 1 1 1 1 1Federal Affairs 1 1 1 1 1Intergovernmental Relations 5 5 5 5 5Information Technology 67 67 67 67 67Corporate and Internal Communications 35 37 37 37 37Human Resources and Pensions 13 13 13 13 13Capital Programs 30 27 27 27 27Corporate Account 1 1 1 1 1Business Service Center 434 462 445 445 445
Total Administration 951 983 966 966 966
Public Safety 781 782 782 782 812
Baseline Total Positions 1,732 1,765 1,748 1,748 1,778
Non-Reimbursable 1,684 1,717 1,700 1,700 1,730Reimbursable 48 48 48 48 48
Full-Time 1,732 1,765 1,748 1,748 1,778Full-Time Equivalents - - - -
MTA HEADQUARTERSFebruary Financial Plan 2012-2015
Total Positions by Function and DepartmentNon-Reimbursable/Reimbursable and Full-Time/Full-Time Equivalents

FUNCTION/OCCUPATIONAL GROUP
2011 Final
Estimate
2012 Adopted Budget 2013 2014 2015
Administration * Managers/Supervisors 441 446 446 446 446 Professional, Technical, Clerical 510 537 520 520 520 Operational Hourlies
Total Administration 951 983 966 966 966
Operations Managers/Supervisors Professional, Technical, Clerical Operational Hourlies
Total Operations - - - - -
Maintenance Managers/Supervisors Professional, Technical, Clerical Operational Hourlies
Total Maintenance - - - - -
Engineering/Capital Managers/Supervisors Professional, Technical, Clerical Operational Hourlies
Total Engineering/Capital - - - - -
Public Safety Managers/Supervisors 38 38 38 38 38 Professional, Technical, Clerical 75 76 76 76 76 Operational Hourlies (Uniformed) 668 668 668 668 698
Total Public Safety 781 782 782 782 812
Total Positions Managers/Supervisors 479 484 484 484 484 Professional, Technical, Clerical 585 613 596 596 596 Operational Hourlies 668 668 668 668 698
Total Baseline Positions 1732 1765 1748 1748 1778
* Includes Business Service Center
MTA HEADQUARTERSFebruary Financial Plan 2012-2015
Total Positions by Function and Occupation

NON-REIMBURSABLEJan Feb Mar Apr May Jun Jul Aug Sep Oct Nov Dec Total
Operating RevenueFare Revenue $0.000 $0.000 $0.000 $0.000 $0.000 $0.000 $0.000 $0.000 $0.000 $0.000 $0.000 $0.000 $0.000Vehicle Toll Revenue - - - - - - - - - - - - - Other Operating Revenue - - - - - - - - - - - - - Rental Income $4.368 $4.368 $4.368 $4.433 $4.368 $4.368 $4.514 $4.368 $4.368 $4.368 $4.368 $4.368 $52.628Data Center BillingsOther 0.240 0.251 0.273 0.325 0.336 0.393 0.439 0.401 0.412 0.423 0.412 0.395 4.298 Total Other Operating Revenue 4.609 4.619 4.641 4.758 4.704 4.761 4.953 4.769 4.780 4.791 4.780 4.763 56.926Capital and Other Reimbursements - - - - - - - - - - - - - Total Revenue $4.609 $4.619 $4.641 $4.758 $4.704 $4.761 $4.953 $4.769 $4.780 $4.791 $4.780 $4.763 $56.926
Operating ExpensesLabor:Payroll $14.657 $12.760 $13.244 $12.760 $13.728 $12.760 $14.657 $13.728 $12.276 $13.728 $13.244 $12.768 $160.309Overtime 0.739 0.707 0.739 0.707 0.772 0.707 0.739 0.772 0.674 0.772 0.739 0.707 8.775 Health and Welfare 2.138 2.062 2.138 2.062 2.214 2.062 2.138 2.214 1.986 2.214 2.138 2.062 25.430 OPEB Current Payment - - 2.100 - - 2.100 - - 2.100 - - 2.100 8.400 Pensions 2.986 2.889 2.986 2.889 3.083 2.889 2.986 3.083 2.792 3.083 2.986 2.889 35.542 Other Fringe Benefits 1.195 1.152 1.195 1.152 1.238 1.152 1.195 1.238 1.110 1.238 1.195 1.152 14.211 Reimbursable Overhead (4.328) (4.315) (5.315) (4.343) (4.315) (5.712) (4.328) (4.315) (5.712) (4.315) (4.328) (5.772) (57.097) Total Labor Expenses $17.388 $15.255 $17.088 $15.227 $16.719 $15.958 $17.388 $16.720 $15.226 $16.720 $15.975 $15.906 $195.570
Non-Labor:Electric Power $0.741 $0.726 $0.726 $0.726 $0.726 $1.199 $0.726 $0.726 $0.726 $0.726 $0.726 $0.726 $9.199Fuel 0.217 0.216 0.216 0.216 0.216 0.216 0.216 0.216 0.216 0.216 0.216 0.216 2.591 Insurance 0.582 0.022 1.506 0.022 0.022 0.219 0.022 0.022 0.312 0.022 0.181 0.217 3.149 Claims - - 0.250 - - 0.250 - - 0.250 - - 0.250 0.999 Paratransit Service Contracts - Maintenance and Other Operating Contracts 5.729 5.692 5.726 7.047 5.700 5.788 5.709 5.727 5.717 5.728 6.270 6.301 71.132 Professional Service Contracts 4.892 3.328 4.075 3.604 3.593 3.860 5.842 3.569 4.115 3.607 3.286 4.311 48.084 Materials & Supplies 0.001 0.001 0.001 0.001 0.002 0.001 0.001 0.001 0.001 0.001 0.001 0.001 0.013 Other Business Expenses 0.000MTA Internal Subsidy 0.600 - - - - - - - - - - - 0.600 Other 0.612 0.436 0.436 0.478 0.440 0.491 0.508 0.457 0.433 0.436 0.478 0.496 5.701 Total Other Business Expenses 1.212 0.436 0.436 0.478 0.440 0.491 0.508 0.457 0.433 0.436 0.478 0.496 6.301Total Non-Labor Expenses $13.374 $10.420 $12.935 $12.094 $10.699 $12.024 $13.023 $10.718 $11.770 $10.736 $11.158 $12.517 $141.469
Other Expenses Adjustments:Other Total Other Expense Adjustments $0.000 $0.000 $0.000 $0.000 $0.000 $0.000 $0.000 $0.000 $0.000 $0.000 $0.000 $0.000 $0.000
Total Expenses before Non-Cash Liability Adjs. $30.762 $25.676 $30.023 $27.321 $27.418 $27.982 $30.411 $27.438 $26.996 $27.456 $27.133 $28.424 $337.039
Depreciation 3.325 3.308 3.308 3.308 3.308 3.308 3.308 3.308 3.308 3.308 3.308 3.308 39.713OPEB Obligation 5.917 5.917 5.917 5.917 5.917 5.917 5.917 5.917 5.917 5.917 5.917 5.917 71.000Environmental Remediation - - - - - - - - - - - - -
Total Expenses $40.004 $34.901 $39.248 $36.546 $36.643 $37.206 $39.635 $36.662 $36.221 $36.680 $36.358 $37.648 $447.752
Baseline Net Surplus/(Deficit) ($35.395) ($30.282) ($34.607) ($31.788) ($31.939) ($32.446) ($34.683) ($31.893) ($31.441) ($31.889) ($31.578) ($32.885) ($390.826)
MTA HEADQUARTERSFebruary Financial Plan - 2012 Adopted BudgetAccrual Statement of Operations by Category
($ in millions)

REIMBURSABLEJan Feb Mar Apr May Jun Jul Aug Sep Oct Nov Dec Total
RevenueFare Revenue $0.000 $0.000 $0.000 $0.000 $0.000 $0.000 $0.000 $0.000 $0.000 $0.000 $0.000 $0.000 $0.000Vehicle Toll Revenue - - - - - - - - - - - - - Other Operating Revenue - - - - - - - - - - - - - Capital and Other Reimbursements 5.273 5.251 7.004 5.284 6.022 6.995 5.273 6.271 6.985 6.570 5.273 8.591 74.792 Total Revenue $5.273 $5.251 $7.004 $5.284 $6.022 $6.995 $5.273 $6.271 $6.985 $6.570 $5.273 $8.591 $74.792
ExpensesLabor:Payroll $0.305 $0.298 $0.305 $0.298 $0.313 $0.298 $0.305 $0.313 $0.290 $0.313 $0.305 $0.298 $3.640Overtime - Health and Welfare 0.044 0.043 0.044 0.043 0.045 0.043 0.044 0.045 0.042 0.045 0.044 0.043 0.524 OPEB Current PaymentPensions 0.036 0.035 0.036 0.035 0.036 0.035 0.036 0.036 0.034 0.036 0.036 0.035 0.425 Other Fringe Benefits 0.023 0.022 0.023 0.022 0.023 0.022 0.023 0.023 0.021 0.023 0.023 0.022 0.269 Reimbursable Overhead 4.328 4.315 5.315 4.343 4.315 5.712 4.328 4.315 5.712 4.315 4.328 5.772 57.097 Total Labor Expenses $4.735 $4.712 $5.722 $4.740 $4.732 $6.109 $4.735 $4.732 $6.099 $4.732 $4.735 $6.169 $61.954
Non-Labor:Electric Power $0.001 $0.001 $0.001 $0.001 $0.001 $0.001 $0.001 $0.001 $0.001 $0.001 $0.001 $0.001 $0.014Fuel - - - - - - - - - - - - Insurance 0.009 0.009 0.009 0.009 0.009 0.009 0.009 0.009 0.009 0.009 0.009 0.009 0.112 Claims Paratransit Service Contracts Maintenance and Other Operating Contracts 0.008 0.008 0.008 0.008 0.008 0.008 0.008 0.008 0.008 0.008 0.008 0.009 0.094Professional Service Contracts 0.514 0.514 1.253 0.514 1.265 0.852 0.514 1.514 0.852 1.813 0.514 2.390 12.507 Materials & SuppliesOther Business Expenses MTA Internal SubsidyOther 0.006 0.006 0.010 0.012 0.006 0.016 0.006 0.006 0.015 0.006 0.006 0.013 0.111 Total Other Business Expenses 0.006 0.006 0.010 0.012 0.006 0.016 0.006 0.006 0.015 0.006 0.006 0.013 0.111Total Non-Labor Expenses $0.538 $0.538 $1.282 $0.544 $1.289 $0.886 $0.538 $1.538 $0.885 $1.838 $0.538 $2.422 $12.837
Other Expenses Adjustments:Other $0.000Total Other Expense Adjustments $0.000 $0.000 $0.000 $0.000 $0.000 $0.000 $0.000 $0.000 $0.000 $0.000 $0.000 $0.000 $0.000
Total Expenses before Depreciation $5.273 $5.251 $7.004 $5.284 $6.022 $6.995 $5.273 $6.271 $6.985 $6.570 $5.273 $8.591 $74.792
Depreciation - - - - - - - - - - - - -
Total Expenses $5.273 $5.251 $7.004 $5.284 $6.022 $6.995 $5.273 $6.271 $6.985 $6.570 $5.273 $8.591 $74.792
Baseline Net Surplus/(Deficit) $0.000 $0.000 $0.000 $0.000 $0.000 $0.000 $0.000 $0.000 $0.000 $0.000 $0.000 $0.000 $0.000
MTA HEADQUARTERSFebruary Financial Plan - 2012 Adopted BudgetAccrual Statement of Operations by Category
($ in millions)

NON-REIMBURSABLE / REIMBURSABLEJan Feb Mar Apr May Jun Jul Aug Sep Oct Nov Dec Total
RevenueFare Revenue $0.000 $0.000 $0.000 $0.000 $0.000 $0.000 $0.000 $0.000 $0.000 $0.000 $0.000 $0.000 $0.000Vehicle Toll Revenue - - - - - - - - - - - - - Other Operating Revenue - - - - - - - - - - - - - Rental Income $4.368 $4.368 $4.368 $4.433 $4.368 $4.368 $4.514 $4.368 $4.368 $4.368 $4.368 $4.368 $52.628Data Center Billings - - - - - - - - - - - - - Other 0.240 0.251 0.273 0.325 0.336 0.393 0.439 0.401 0.412 0.423 0.412 0.395 4.298 Total Other Operating Revenue 4.609 4.619 4.641 4.758 4.704 4.761 4.953 4.769 4.780 4.791 4.780 4.763 56.926 Capital and Other Reimbursements 5.273 5.251 7.004 5.284 6.022 6.995 5.273 6.271 6.985 6.570 5.273 8.591 74.792 Total Revenue $9.882 $9.870 $11.645 $10.041 $10.725 $11.756 $10.226 $11.040 $11.765 $11.361 $10.053 $13.354 $131.718
ExpensesLabor:Payroll $14.962 $13.058 $13.549 $13.058 $14.041 $13.058 $14.962 $14.041 $12.566 $14.041 $13.549 $13.066 $163.949Overtime 0.739 0.707 0.739 0.707 0.772 0.707 0.739 0.772 0.674 0.772 0.739 0.707 8.775 Health and Welfare 2.182 2.105 2.182 2.105 2.259 2.104 2.182 2.259 2.028 2.259 2.182 2.105 25.954 OPEB Current Payment - - 2.100 - - 2.100 - - 2.100 - - 2.100 8.400 Pensions 3.022 2.924 3.022 2.924 3.120 2.924 3.022 3.120 2.826 3.120 3.022 2.924 35.967 Other Fringe Benefits 1.217 1.174 1.217 1.174 1.261 1.174 1.217 1.261 1.131 1.261 1.217 1.174 14.480 Reimbursable Overhead - - - - - - - - - - - - - Total Labor expenses $22.123 $19.968 $22.810 $19.968 $21.452 $22.067 $22.123 $21.452 $21.325 $21.452 $20.710 $22.076 $257.525
Non-Labor:Electric Power $0.743 $0.727 $0.727 $0.727 $0.727 $1.201 $0.727 $0.727 $0.727 $0.727 $0.727 $0.727 $9.213Fuel 0.217 0.216 0.216 0.216 0.216 0.216 0.216 0.216 0.216 0.216 0.216 0.216 2.591 Insurance 0.591 0.031 1.515 0.031 0.031 0.229 0.031 0.031 0.322 0.031 0.191 0.226 3.261 Claims - - 0.250 - - 0.250 - - 0.250 - - 0.250 0.999 Paratransit Service Contracts - - - - - - - - - - - - - Maintenance and Other Operating Contracts 5.736 5.700 5.734 7.055 5.707 5.796 5.716 5.735 5.725 5.736 6.277 6.309 71.226 Professional Service Contracts 5.406 3.841 5.329 4.118 4.858 4.712 6.356 5.083 4.967 5.420 3.800 6.701 60.591 Materials & Supplies 0.001 0.001 0.001 0.001 0.002 0.001 0.001 0.001 0.001 0.001 0.001 0.001 0.013 Other Business Expenses MTA Internal Subsidy 0.600 - - - - - - - - - - - 0.600 Other Business Expenses 0.619 0.443 0.446 0.490 0.446 0.507 0.514 0.463 0.449 0.442 0.485 0.508 5.812 Total Other Business Expenses 1.219 0.443 0.446 0.490 0.446 0.507 0.514 0.463 0.449 0.442 0.485 0.508 6.412 Total Non-Labor expenses $13.913 $10.959 $14.217 $12.637 $11.988 $12.910 $13.561 $12.256 $12.655 $12.573 $11.696 $14.939 $154.306
Other Expenses Adjustments:Other $0.000 $0.000 $0.000 $0.000 $0.000 $0.000 $0.000 $0.000 $0.000 $0.000 $0.000 $0.000 $0.000Total Other Expense Adjustments $0.000 $0.000 $0.000 $0.000 $0.000 $0.000 $0.000 $0.000 $0.000 $0.000 $0.000 $0.000 $0.000
Total Expenses before Non-Cash Liability Adjs. $36.035 $30.927 $37.027 $32.605 $33.439 $34.977 $35.684 $33.708 $33.981 $34.026 $32.406 $37.015 $411.831
Depreciation 3.325 3.308 3.308 3.308 3.308 3.308 3.308 3.308 3.308 3.308 3.308 3.308 39.713 OPEB Obligation 5.917 5.917 5.917 5.917 5.917 5.917 5.917 5.917 5.917 5.917 5.917 5.917 71.000 Environmental Remediation
Total Expenses $45.277 $40.151 $46.252 $41.830 $42.664 $44.202 $44.909 $42.933 $43.205 $43.250 $41.631 $46.239 $522.544
Baseline Net Surplus/(Deficit) ($35.395) ($30.282) ($34.607) ($31.788) ($31.939) ($32.446) ($34.683) ($31.893) ($31.441) ($31.889) ($31.578) ($32.885) ($390.826)
Accrual Statement of Operations by Category($ in millions)
February Financial Plan - 2012 Adopted BudgetMTA HEADQUARTERS

CASH RECEIPTS AND EXPENDITURESJan Feb Mar Apr May Jun Jul Aug Sep Oct Nov Dec Total
ReceiptsFare Revenue $0.000 $0.000 $0.000 $0.000 $0.000 $0.000 $0.000 $0.000 $0.000 $0.000 $0.000 $0.000 $0.000Vehicle Toll Revenue - - - - - - - - - - - - - Other Operating Revenue - - - - - - - - - - - - - Rental Income $4.368 $4.368 $4.368 $4.433 $4.368 $4.368 $4.514 $4.368 $4.368 $4.368 $4.368 $4.368 $52.628Data Center Billings - Other 0.261 0.272 0.294 0.345 0.356 0.414 0.460 0.422 0.433 0.444 0.433 0.416 4.548 Total Other Operating Revenue 4.629 4.640 4.662 4.778 4.725 4.782 4.973 4.790 4.801 4.812 4.801 4.784 57.176 Capital and Other Reimbursements 5.273 5.251 7.004 5.284 6.022 6.995 5.273 6.271 6.985 6.570 5.273 8.591 74.792 Total Receipts $9.903 $9.890 $11.666 $10.062 $10.746 $11.777 $10.247 $11.060 $11.785 $11.382 $10.074 $13.375 $131.968
ExpendituresLabor:Payroll $15.535 $12.587 $14.078 $11.822 $14.395 $12.728 $14.511 $13.493 $12.266 $14.390 $13.028 $12.626 $161.459Overtime 0.739 0.707 0.739 0.707 0.772 0.707 0.739 0.772 0.674 0.772 0.739 0.707 8.775 Health and Welfare 2.182 2.105 2.182 2.105 2.259 2.104 2.182 2.259 2.028 2.259 2.182 1.076 24.925 OPEB Current Payment - - 2.100 - - 2.100 - - 2.100 - - 2.100 8.400 Pensions 3.022 2.924 3.022 2.924 3.120 2.924 3.022 3.120 2.826 3.120 3.022 6.143 39.187 Other Fringe Benefits 1.160 1.174 1.217 1.174 1.261 1.174 1.217 1.261 1.131 1.261 1.217 1.174 14.422 GASB Account - - - - - - - - - - - 1.029 1.029 Reimbursable Overhead - Total Labor Expenditures $22.638 $19.497 $23.339 $18.732 $21.806 $21.737 $21.672 $20.905 $21.025 $21.802 $20.189 $24.855 $258.197
Non-Labor:Electric Power $0.743 $0.727 $0.727 $0.727 $0.727 $1.201 $0.727 $0.727 $0.727 $0.727 $0.727 $0.727 $9.213Fuel 0.217 0.216 0.216 0.216 0.216 0.216 0.216 0.216 0.216 0.216 0.216 0.216 2.591 Insurance 0.527 (0.023) 1.560 (0.109) (0.029) 0.461 (0.019) 0.010 0.247 (0.068) 0.134 0.326 3.018 Claims - - 0.250 - - 0.250 - - 0.250 - - 0.250 0.999 Paratransit Service Contracts - - - - - - - - - - - - - Maintenance and Other Operating Contracts 5.751 5.107 6.032 7.146 6.211 5.087 5.760 5.916 4.445 5.499 5.638 5.709 68.301 Professional Service Contracts 2.931 5.081 6.942 1.999 3.030 2.151 8.899 8.623 1.061 6.135 5.644 3.552 56.046 Materials & Supplies 0.001 0.001 0.001 0.001 0.002 0.001 0.001 0.001 0.001 0.001 0.001 0.001 0.013 Other Business Expenses 0.000 0.000 0.000 0.000 0.000 0.000 0.000 0.000 0.000 0.000 0.000 0.000MTA Internal Subsidy 0.600 - - - - - - - - - - - 0.600 Other Business Expenses 0.627 0.385 0.465 0.569 0.386 0.379 0.342 1.032 (0.033) 0.648 0.560 0.044 5.405 Total Other Business Expenses 1.227 0.385 0.465 0.569 0.386 0.379 0.342 1.032 (0.033) 0.648 0.560 0.044 6.005 Total Non-Labor Expenditures $11.396 $11.494 $16.193 $10.549 $10.543 $9.745 $15.926 $16.524 $6.914 $13.157 $12.920 $10.826 $146.186
Other Expenditure Adjustments:Operating Capital 1.417 1.417 1.417 1.417 1.417 1.417 2.000 2.000 2.000 2.000 2.000 2.000 $20.505Total Other Expenditure Adjustments $1.417 $1.417 $1.417 $1.417 $1.417 $1.417 $2.000 $2.000 $2.000 $2.000 $2.000 $2.000 $20.505
Total Expenditures $35.451 $32.408 $40.950 $30.698 $33.766 $32.899 $39.598 $39.430 $29.939 $36.959 $35.109 $37.681 $424.888
Baseline Net Cash Deficit ($25.549) ($22.518) ($29.284) ($20.636) ($23.020) ($21.122) ($29.351) ($28.369) ($18.154) ($25.577) ($25.035) ($24.306) ($292.920)
MTA HEADQUARTERSFebruary Financial Plan - 2012 Adopted Budget
Cash Receipts & Expenditures($ in millions)

CASH FLOW ADJUSTMENTSJan Feb Mar Apr May Jun Jul Aug Sep Oct Nov Dec Total
ReceiptsFare Revenue $0.000 $0.000 $0.000 $0.000 $0.000 $0.000 $0.000 $0.000 $0.000 $0.000 $0.000 $0.000 $0.000Vehicle Toll Revenue - - - - - - - - - - - - - Other Operating Revenue 0.021 0.021 0.021 0.021 0.021 0.021 0.021 0.021 0.021 0.021 0.021 0.021 0.250Capital and Other Reimbursements 0.000 0.000 0.000 0.000 0.000 0.000 0.000 0.000 0.000 0.000 0.000 0.000 0.000Total Receipts $0.021 $0.021 $0.021 $0.021 $0.021 $0.021 $0.021 $0.021 $0.021 $0.021 $0.021 $0.021 $0.250
ExpendituresLabor:Payroll ($0.573) $0.471 ($0.529) $1.236 ($0.354) $0.330 $0.451 $0.548 $0.300 ($0.350) $0.521 $0.440 $2.490Overtime - - - - - - - - - - - - - Health and Welfare - - - - - - - - - - - 1.029 1.029 OPEB Current Payment - - - - - - - - - - - - - Pensions - - - - - - - - - - - (3.219) (3.219) Other Fringe Benefits 0.057 - - - - - - - - - - - 0.057 GASB Account - - - - - - - - - - - (1.029) (1.029) Reimbursable Overhead - - - - - - - - - - - - - Total Labor Expenditures ($0.516) $0.471 ($0.529) $1.236 ($0.354) $0.330 $0.451 $0.548 $0.300 ($0.350) $0.521 ($2.779) ($0.673)
Non-Labor:Electric Power - - - - - - - - - - - - - Fuel - - - - - - - - - - - - - Insurance 0.064 0.054 (0.045) 0.140 0.060 (0.232) 0.050 0.022 0.074 0.099 0.056 (0.100) 0.243Claims 0.000 0.000 0.000 0.000 0.000 0.000 0.000 0.000 0.000 0.000 0.000 0.000 0.000Paratransit Service Contracts - - - - - - - - - - - - - Maintenance and Other Operating Contracts (0.014) 0.593 (0.298) (0.092) (0.504) 0.709 (0.044) (0.181) 1.280 0.237 0.640 0.600 2.925Professional Service Contracts 2.475 (1.240) (1.613) 2.119 1.828 2.561 (2.543) (3.539) 3.906 (0.714) (1.844) 3.149 4.544Materials & Supplies 0.000 0.000 0.000 0.000 0.000 0.000 0.000 0.000 0.000 0.000 0.000 0.000 0.000Other Business Expenses MTA Internal Subsidy 0.000 0.000 0.000 0.000 0.000 0.000 0.000 0.000 0.000 0.000 0.000 0.000 0.000Other Business Expenses (0.009) 0.058 (0.019) (0.079) 0.060 0.128 0.172 (0.569) 0.482 (0.206) (0.075) 0.464 0.407Total Other Business Expenses (0.009) 0.058 (0.019) (0.079) 0.060 0.128 0.172 (0.569) 0.482 (0.206) (0.075) 0.464 0.407Total Non-Labor Expenditures $2.517 ($0.535) ($1.976) $2.088 $1.444 $3.166 ($2.364) ($4.268) $5.742 ($0.584) ($1.223) $4.114 $8.120
Other Expenditure Adjustments:Capital (1.417) (1.417) (1.417) (1.417) (1.417) (1.417) (2.000) (2.000) (2.000) (2.000) (2.000) (2.000) ($20.505)Total Other Expenditure Adjustments ($1.417) ($1.417) ($1.417) ($1.417) ($1.417) ($1.417) ($2.000) ($2.000) ($2.000) ($2.000) ($2.000) ($2.000) ($20.505)
Total Cash Conversion Adjustments before Non-Cash Liability Adjs. $0.605 ($1.461) ($3.901) $1.928 ($0.306) $2.099 ($3.893) ($5.700) $4.062 ($2.913) ($2.682) ($0.645) ($12.808)
Depreciation Adjustment 3.325 3.308 3.308 3.308 3.308 3.308 3.308 3.308 3.308 3.308 3.308 3.308 39.713 OPEB Obligation 5.917 5.917 5.917 5.917 5.917 5.917 5.917 5.917 5.917 5.917 5.917 5.917 71.000
Baseline Total Cash Conversion Adjustments $9.846 $7.764 $5.323 $11.152 $8.919 $11.324 $5.332 $3.524 $13.287 $6.312 $6.543 $8.579 $97.905
($ in millions)
February Financial Plan - 2012 Adopted BudgetCash Conversion (Cash Flow Adjustments)
MTA HEADQUARTERS

MTA Headquarters2011 Mid-Year Forecast
Overtime - Non-Reimbursable/Reimbursable Basis($ in millions)
NON-REIMBURSABLESCHEDULED:Direct Service $0.0 $0.0 $0.0 $0.0 $0.0 $0.0 $0.0 $0.0 $0.0 $0.0 $0.0 $0.0 $0.0
Programmed Maintenance - - - - - - - - - - - - -
Total Scheduled -$ -$ -$ -$ -$ -$ -$ -$ -$ -$ -$ -$ -
UNSCHEDULED:Vacancy/Absentee Coverage $0.336 $0.408 $0.335 $0.364 $0.359 $0.335 $0.349 $0.287 $0.241 $0.357 $0.394 $0.395 $4.160
Weather Emergencies 0.000 0.000 0.000 0.000 0.000 0.000 0.000 0.000 0.000 0.000 0.000 0.000 0.000
Maintenance 0.000 0.000 0.000 0.000 0.000 0.000 0.000 0.000 0.000 0.000 0.000 0.000 0.000
Service Delays 0.000 0.000 0.000 0.000 0.000 0.000 0.000 0.000 0.000 0.000 0.000 0.000 0.000
Emergencies 0.000 0.000 0.000 0.000 0.000 0.000 0.000 0.000 0.000 0.000 0.000 0.000 0.000
Safety/Security/Law Enforcement 0.379 0.273 0.379 0.318 0.388 0.347 0.366 0.460 0.408 0.390 0.320 0.286 4.315
All Other 0.025 0.025 0.025 0.025 0.025 0.025 0.025 0.025 0.025 0.025 0.025 0.025 0.300
Total Unscheduled 0.739$ 0.707$ 0.739$ 0.707$ 0.772$ 0.707$ 0.739$ 0.772$ 0.674$ 0.772$ 0.739$ 0.707$ 8.775$
TOTAL NON-REIMBURSABLE OVERTIME: 0.739$ 0.707$ 0.739$ 0.707$ 0.772$ 0.707$ 0.739$ 0.772$ 0.674$ 0.772$ 0.739$ 0.707$ 8.775$
Jul Aug Sep Oct Nov DecJan Feb Mar Apr May Jun Total

Jan Feb Mar Apr May Jun Jul Aug Sep Oct Nov Dec
AdministrationOffice of Chairman 4 4 4 4 4 4 4 4 4 4 4 4 Office of Chief of Staff 3 3 3 3 3 3 3 3 3 3 3 3 General Counsel 57 57 57 57 57 57 57 57 57 57 57 57 Office of Diversity 28 28 28 28 28 28 28 28 28 28 28 28 Labor Relations 6 6 6 6 6 6 6 6 6 6 6 6 Media Relations 11 11 11 11 11 11 11 11 11 11 11 11 PCAC 4 4 4 4 4 4 4 4 4 4 4 4 Audit 85 85 85 85 85 85 85 85 85 85 85 85 Chief Financial Officer 60 60 60 60 60 60 60 60 60 60 60 60 Real Estate 60 60 60 60 60 60 60 60 60 60 60 60 Strategic Initiatives 4 4 4 4 4 4 4 4 4 4 4 4 Bus Customer Info 8 8 8 8 8 8 8 8 8 8 8 8 New Fare Systems 25 25 25 25 25 25 25 25 25 25 25 25 Spec. Project Develop/Planning 8 8 8 8 8 8 8 8 8 8 8 8 Environmental, Sustainability and Compliance 6 6 6 6 6 6 6 6 6 6 6 6 Chief Operating Officer 1 1 1 1 1 1 1 1 1 1 1 1
Federal Affairs 1 1 1 1 1 1 1 1 1 1 1 1
Intergovernmental Relations 5 5 5 5 5 5 5 5 5 5 5 5 Information Technology 67 67 67 67 67 67 67 67 67 67 67 67 Corporate and Internal Communications 37 37 37 37 37 37 37 37 37 37 37 37
Human Resources and Pensions 13 13 13 13 13 13 13 13 13 13 13 13 Capital Programs 27 27 27 27 27 27 27 27 27 27 27 27 Corporate Account 1 1 1 1 1 1 1 1 1 1 1 1 Business Service Center 462 462 462 462 462 462 462 462 462 462 462 462
Total Administration 983 983 983 983 983 983 983 983 983 983 983 983
Public Safety 782 782 782 782 782 782 782 782 782 782 782 782
Total Positions 1,765 1,765 1,765 1,765 1,765 1,765 1,765 1,765 1,765 1,765 1,765 1,765
Non-Reimbursable 1,717 1,717 1,717 1,717 1,717 1,717 1,717 1,717 1,717 1,717 1,717 1,717Reimbursable 48 48 48 48 48 48 48 48 48 48 48 48
Total Full-Time 1,765 1,765 1,765 1,765 1,765 1,765 1,765 1,765 1,765 1,765 1,765 1,765Total Full-Time Equivalents - - - - - - - - - - - -
FUNCTION/DEPARTMENT
MTA HEADQUARTERSFebruary Financial Plan - 2012 Adopted Budget
Total Positions by Function and DepartmentNon-Reimbursable/Reimbursable and Full-Time/Full-Time Equivalents

FUNCTION/OCCUPATIONAL GROUP Jan Feb Mar Apr May Jun Jul Aug Sep Oct Nov Dec
Administration Managers/Supervisors 446 446 446 446 446 446 446 446 446 446 446 446 Professional, Technical, Clerical 537 537 537 537 537 537 537 537 537 537 537 537 Operational Hourlies
Total Administration 983 983 983 983 983 983 983 983 983 983 983 983
Operations Managers/Supervisors - - - - - - - - - - - - Professional, Technical, Clerical - - - - - - - - - - - - Operational Hourlies - - - - - - - - - - - -
Total Operations - - - - - - - - - - - -
Maintenance Managers/Supervisors - - - - - - - - - - - - Professional, Technical, Clerical - - - - - - - - - - - - Operational Hourlies - - - - - - - - - - - -
Total Maintenance - - - - - - - - - - - -
Engineering/Capital Managers/Supervisors - - - - - - - - - - - - Professional, Technical, Clerical - - - - - - - - - - - - Operational Hourlies - - - - - - - - - - - -
Total Engineering/Capital - - - - - - - - - - - -
Public Safety Managers/Supervisors 38 38 38 38 38 38 38 38 38 38 38 38 Professional, Technical, Clerical 76 76 76 76 76 76 76 76 76 76 76 76 Operational Hourlies 668 668 668 668 668 668 668 668 668 668 668 668
Total Public Safety 782 782 782 782 782 782 782 782 782 782 782 782
Total Positions Managers/Supervisors 484 484 484 484 484 484 484 484 484 484 484 484 Professional, Technical, Clerical 613 613 613 613 613 613 613 613 613 613 613 613 Operational Hourlies 668 668 668 668 668 668 668 668 668 668 668 668
Total Positions 1,765 1,765 1,765 1,765 1,765 1,765 1,765 1,765 1,765 1,765 1,765 1,765
MTA HEADQUARTERS
Total Positions by Function and Occupation February Financial Plan - 2012 Adopted Budget

MTA Headquarters MTA Headquarters includes four distinct components: Policy & Oversight, MTA Consolidated Functions, the Business Service Center, and MTA Security:
MTA HQ Policy & Oversight includes MTA Executive Leadership and policy/oversight functions. All aspects of Administration strive to identify opportunities to streamline expenses and increase efficiencies.
MTA Consolidated Functions includes areas where savings have been achieved
through function consolidations or areas where the work can be more efficiently performed at Headquarters. As MTA consolidates functions across the Agencies, it is likely that the net budget change associated with those functions will increase Headquarters’ costs, while staffing and expense levels decrease at a higher level at the Agencies.
The Business Service Center provides shared back-office financial including accounts receivable, payroll, procurement, and human resource services to all agencies. While a number of services began operating in January 2011, the full complement of services is expected to become available to all agencies by spring 2012.
Public Safety includes the MTA Police which patrols the MTA’s commuter railroads, and provides MTA-wide oversight of security and safety services. Public Safety also leads emergency preparedness, and interfaces with multiple city, state and federal law enforcement agencies.
The following tables show break-outs of the MTA HQ expenses and personnel Budgets by these categories.

MTA HEADQUARTERSFebruary Financial Plan 2012 - 2015
Accrual Statement of Operations by Major Function($ in millions)
NON-REIMBURSABLE 2011 2012 2013 2014 2015
MTA Consolidated FunctionsOperating Revenue $4.435 $4.085 $4.160 $4.239 $4.326
Labor Expenses $9.830 $8.465 $9.271 $9.731 $10.177Non-Labor Expenses 13.43 15.547 15.832 16.133 16.465 Depreciation / OPEB Obligation 1.300 1.300 1.324 1.349 1.377
Total Expenses $24.563 $25.313 $26.426 $27.213 $28.019
Baseline Deficit ($20.128) ($21.227) ($22.267) ($22.974) ($23.693)
MTA HQ, Policy & OversightOperating Revenue $51.587 $52.841 $52.674 $53.675 $54.781
Labor Expenses $41.517 $35.752 $37.800 $39.456 $47.497Non-Labor Expenses 93.93 99.776 107.125 113.966 119.579 Depreciation / OPEB Obligation 104.118 106.143 99.515 104.281 109.095
Total Expenses $239.561 $241.671 $244.439 $257.702 $276.171
Baseline Deficit ($187.974) ($188.830) ($191.765) ($204.027) ($221.390)
Business Service CenterOperating Revenue $0.000 $0.000 $0.000 $0.000 $0.000
Labor Expenses $33.206 $40.719 $37.709 $38.561 $39.892Non-Labor Expenses 14.97 13.901 10.974 9.070 9.214 Depreciation / OPEB Obligation - 1.042 2.136 2.137 1.096
Total Expenses $48.177 $55.663 $50.819 $49.768 $50.202
Baseline Deficit ($48.177) ($55.663) ($50.819) ($49.768) ($50.202)
Public SafetyOperating Revenue $0.000 $0.000 $0.000 $0.000 $0.000
Labor Expenses $102.468 $110.633 $115.740 $116.132 $121.177Non-Labor Expenses 12.30 12.244 12.499 12.716 13.327 Depreciation / OPEB Obligation 2.328 2.228 1.649 1.681 1.715
Total Expenses $117.092 $125.105 $129.888 $130.529 $136.220
Baseline Deficit ($117.092) ($125.105) ($129.888) ($130.529) ($136.220)

FUNCTION
2011Final
Estimate
2012 Adopted Budget 2013 2014 2015
MTA Consolidated Functions 258 258 258 258 258MTA HQ, Policy & Oversight 259 263 263 263 263Business Service Center 434 462 445 445 445Public Safety 781 782 782 782 812
Baseline Total Positions 1,732 1,765 1,748 1,748 1,778
Non-Reimbursable 1,684 1,717 1,700 1,700 1,730MTA Consolidated Functions 235 235 235 235 235MTA HQ, Policy & Oversight 259 263 263 263 263Business Service Center 409 437 420 420 420Public Safety 781 782 782 782 812
Reimbursable 48 48 48 48 48MTA Consolidated Functions 23 23 23 23 23MTA HQ, Policy & Oversight 0 0 0 0 0Business Service Center 25 25 25 25 25Public Safety 0 0 0 0 0
Full-Time 1,732 1,765 1,748 1,748 1,778Full-Time Equivalents - - - - -
Note: Actuals reflect headcount vacancies.
MTA HEADQUARTERSFebruary Financial Plan 2012-2015
Total Positions by FunctionNon-Reimbursable/Reimbursable and Full-Time Positions/Full-Time Equivalents

MTA INSPECTOR GENERAL FEBRUARY FINANCIAL PLAN FOR 2012-2015
2011 FINAL ESTIMATE AND 2012 ADOPTED BUDGET In accordance with MTA-approved budget procedures, the following information presents MTA Inspector General’s 2011 Final Estimate, 2012 Adopted Budget and the Financial Plan for 2012-2015. The Adopted Budget reflects the November Financial Plan, which was adopted by the Board in December 2011, as well as other technical adjustments.
In the 2011 Final Estimate, a total of $12.8 million is projected in baseline expenses, which remains unchanged from the November Financial Plan.
The 2012 Adopted Budget of $13.2 million remains unchanged from the November Financial Plan.
Effective 2012, the non-labor account structure of the MTA standard chart
of accounts has been adjusted to reflect the reclassification and renaming of certain accounts in order to improve account reporting consistency among the Agencies. These changes, which affect most non-labor accounts presented on the attached tables, result in no net-impact to the bottom line. In order to maintain comparability with 2011 actual results for year-end reporting purposes, the 2011 account structure remains unchanged.

REIMBURSABLE 2011 2012
Final Adopted
Estimate* Budget 2013 2014 2015
Operating Revenue
Farebox Revenue $0.000 $0.000 $0.000 $0.000 $0.000
Toll Revenue - - - - -
Other Operating Revenue - - - - -
Capital and Other Reimbursements 12.828 13.184 13.859 14.319 14.733
Total Revenue $12.828 $13.184 $13.859 $14.319 $14.733
Operating Expenses
Labor:
Payroll $7.052 $7.404 $7.549 $7.694 $7.837
Overtime - - - - -
Health and Welfare 1.013 1.154 1.243 1.360 1.488
OPEB Current Payment - - - - -
Pensions 0.777 0.809 1.105 1.161 1.218
Other Fringe Benefits 0.559 0.603 0.626 0.650 0.676
Reimbursable Overhead - - - - -
Total Labor Expenses $9.401 $9.970 $10.523 $10.865 $11.219
Non-Labor:
Electric Power $0.000 $0.000 $0.000 $0.000 $0.000
Fuel - 0.043 0.045 0.045 0.046
Insurance 0.018 0.023 0.025 0.027 0.030
Claims - - - - -
Paratransit Service Contracts - - - - -
Maintenance and Other Operating Contracts 0.304 0.259 0.263 0.269 0.274
Professional Service Contracts 0.525 0.239 0.244 0.248 0.253
Materials & Supplies 0.070 0.075 0.075 0.077 0.079
Other Business Expenses 2.412 2.483 2.530 2.578 2.632
Total Non-Labor Expenses $3.329 $3.122 $3.182 $3.244 $3.314
Other Expenses Adjustments:
Other $0.000 $0.000 $0.000 $0.000 $0.000
Total Other Expense Adjustments $0.000 $0.000 $0.000 $0.000 $0.000
Total Expenses before Depreciation $12.730 $13.092 $13.705 $14.109 $14.533
Depreciation $0.098 $0.092 $0.154 $0.210 $0.200
OPEB Obligation - - - - -
Environmental Remediation - - - - -
Total Expenses $12.828 $13.184 $13.859 $14.319 $14.733
Baseline Surplus/(Deficit) $0.000 $0.000 $0.000 $0.000 $0.000
MTA INSPECTOR GENERALFebruary Financial Plan 2012 - 2015
Accrual Statement of Operations by Category
($ in millions)
*Effective 2012, the non-labor account structure of the MTA standard chart of accounts has been adjusted to reflect the reclassification and renaming of certain accounts in order to improve account reporting consistency among the Agencies. These changes, which affect most non-labor accounts presented on the attached tables, result in no net-impact to the bottom line. In order to maintain comparability with 2011 actual results for year-end reporting purposes, the 2011 account structure remains unchanged.

CASH RECEIPTS AND EXPENDITURES2011 2012Final Adopted
Estimate* Budget 2013 2014 2015
Receipts
Farebox Revenue $0.000 $0.000 $0.000 $0.000 $0.000
Vehicle Toll Revenue - - - - -
Other Operating Revenue - - - - -
Capital and Other Reimbursements 12.730 13.092 14.305 14.109 14.683
Total Receipts $12.730 $13.092 $14.305 $14.109 $14.683
Expenditures
Labor:
Payroll $7.052 $7.404 $7.549 $7.694 $7.837
Overtime - - - - -
Health and Welfare 1.013 1.154 1.243 1.360 1.488
OPEB Current Payment - - - - -
Pensions 0.777 0.809 1.105 1.161 1.218
Other Fringe Benefits 0.559 0.603 0.626 0.650 0.676
GASB Account - - - - -
Reimbursable Overhead - - - - -
Total Labor Expenditures $9.401 $9.970 $10.523 $10.865 $11.219
Non-Labor:
Electric Power $0.000 $0.000 $0.000 $0.000 $0.000
Fuel - 0.043 0.045 0.045 0.046
Insurance 0.018 0.023 0.025 0.027 0.030
Claims - - - - -
Paratransit Service Contracts - - - - -
Maintenance and Other Operating Contracts 0.304 0.259 0.263 0.269 0.274
Professional Service Contracts 0.525 0.239 0.244 0.248 0.253
Materials & Supplies 0.070 0.075 0.075 0.077 0.079
Other Business Expenses 2.412 2.483 2.530 2.578 2.632
Total Non-Labor Expenses $3.329 $3.122 $3.182 $3.244 $3.314
Other Expenditure Adjustments:
Other $0.000 $0.000 $0.600 $0.000 $0.150
Total Other Expenditure Adjustments $0.000 $0.000 $0.600 $0.000 $0.150
Total Expenditures $12.730 $13.092 $14.305 $14.109 $14.683
Baseline Cash Surplus/(Deficit) $0.000 $0.000 $0.000 $0.000 $0.000
Net Cash Deficit $0.000 $0.000 $0.000 $0.000 $0.000
Cash Receipts & Expenditures($ in millions)
MTA INSPECTOR GENERALFebruary Financial Plan 2012 - 2015
*Effective 2012, the non-labor account structure of the MTA standard chart of accounts has been adjusted to reflect the reclassification and renaming of certain accounts in order to improve account reporting consistency among the Agencies. These changes, which affect most non-labor accounts presented on the attached tables, result in no net-impact to the bottom line. In order to maintain comparability with 2011 actual results for year-end reporting purposes, the 2011 account structure remains unchanged.

CASH FLOW ADJUSTMENTS
2011 2012
Final AdoptedEstimate* Budget 2013 2014 2015
Receipts
Farebox Revenue $0.000 $0.000 $0.000 $0.000 $0.000
Vehicle Toll Revenue - - - - -
Other Operating Revenue - - - - -
Capital and Other Reimbursements (0.098) (0.092) 0.446 (0.210) (0.050) Total Receipts ($0.098) ($0.092) $0.446 ($0.210) ($0.050)
Expenditures
Labor:
Payroll $0.000 $0.000 $0.000 $0.000 $0.000
Overtime - - - - -
Health and Welfare - - - - -
OPEB Current Payment - - - - -
Pensions - - - - -
Other Fringe Benefits - - - - -
GASB Account - - - - -
Reimbursable Overhead - - - - - Total Labor Expenditures $0.000 $0.000 $0.000 $0.000 $0.000
Non-Labor:
Electric Power $0.000 $0.000 $0.000 $0.000 $0.000
Fuel - - - - -
Insurance - - - - -
Claims - - - - -
Paratransit Service Contracts - - - - -
Maintenance and Other Operating Contracts - - - - -
Professional Service Contracts - - - - -
Materials & Supplies - - - - -
Other Business Expenditures - - - - -
Total Non-Labor Expenses $0.000 $0.000 $0.000 $0.000 $0.000
Other Expenses Adjustments:
Other $0.000 $0.000 ($0.600) $0.000 ($0.150)
Total Other Expenditures Adjustments $0.000 $0.000 ($0.600) $0.000 ($0.150)
Total Cash Conversion Adjustments before Depreciation ($0.098) ($0.092) ($0.154) ($0.210) ($0.200)
Depreciation $0.098 $0.092 $0.154 $0.210 $0.200
OPEB Obligation - - - - -
Environmental Remediation - - - - -
Baseline Total Cash Conversion Adjustments ($0.000) ($0.000) ($0.000) ($0.000) $0.000
MTA INSPECTOR GENERALFebruary Financial Plan 2012 - 2015
Cash Conversion (Cash Flow Adjustments)($ in millions)
*Effective 2012, the non-labor account structure of the MTA standard chart of accounts has been adjusted to reflect the reclassification and renaming of certain accounts in order to improve account reporting consistency among the Agencies. These changes, which affect most non-labor accounts presented on the attached tables, result in no net-impact to the bottom line. In order to maintain comparability with 2011 actual results for year-end reporting purposes, the 2011 account structure remains unchanged.

2011Final
Estimate
2012 Adopted Budget 2013 2014 2015
Administration
Office of the Inspector General 86 86 86 86 86
Total Administration 86 86 86 86 86
Baseline Total Positions 86 86 86 86 86
Non-ReimbursableReimbursable 86 86 86 86 86
Total Full-Time 86 86 86 86 86Total Full-Time Equivalents
FUNCTION/DEPARTMENT
MTA INSPECTOR GENERALFebruary Financial Plan 2012 - 2015
Total Positions by Function and DepartmentNon-Reimbursable/Reimbursable and Full-Time Positions/Full-Time Equivalents

[THIS PAGE INTENTIONALLY LEFT BLANK]

First Mutual Transportation Assurance Co. (FMTAC)

MTA FIRST MUTUAL TRANSPORATION ASSURANCE COMPANY FEBRUARY FINANCIAL PLAN FOR 2012-2015
2011 FINAL ESTIMATE AND 2012 ADOPTED BUDGET
In accordance with MTA-approved budget procedures, the following information presents MTA First Mutual Transportation Assurance Company’s 2011 Final Estimate, 2012 Adopted Budget and the Financial Plan for 2012-2015. The Adopted Budget reflects the November Financial Plan, which was adopted by the Board in December 2011, as such this budget remains unchanged.
This submission also includes schedules detailing the monthly allocation of the 2012 Adopted Budget for the purpose of reporting actual results on a monthly basis to the Board.

NON-REIMBURSABLE Final New February Proposed MTA Energy/ New All Adopted
Budget Labor Efficiencies Other Reimb. COA Other Budget
RevenueFarebox Revenue $0.000 $0.000 $0.000 $0.000 $0.000 $0.000 $0.000Vehicle Toll RevenueOther Operating Revenue 21.179 21.179Investment Income 0.840 0.840Capital & Other Reimbursements: 0.000 0.000Total Revenue $22.019 $0.000 $0.000 $0.000 $0.000 $0.000 $22.019
ExpensesLabor:Payroll $0.000 $0.000 $0.000 $0.000 $0.000 $0.000 $0.000Overtime 0.000Health and Welfare 0.000OPEB Current Payment 0.000Pensions 0.000Other Fringe Benefits 0.000Reimbursable Overhead 0.000Total Labor Expenses $0.000 $0.000 $0.000 $0.000 $0.000 $0.000 $0.000
Non-Labor:Electric Power $0.000 $0.000 $0.000 $0.000 $0.000 $0.000 $0.000Fuel 0.000 0.000 0.000 0.000 0.000 0.000 0.000Insurance (98.115) (98.115)Claims 79.407 79.407Paratransit Service ContractsMaintenance and Other Operating Contracts 0.000Professional Service Contracts 0.000Materials & Supplies 0.000Other Business Expenses 8.703 8.703Total Non-Labor Expenses ($10.005) $0.000 $0.000 0.000 0.000 0.000 (10.005)
Other Expense Adjustments:Other 0.000Total Other Expense Adjustments $0.000 $0.000 $0.000 0.000 0.000 0.000 0.000
Total Expenses before Non-Cash Liability Adjustments ($10.005) $0.000 $0.000 $0.000 $0.000 $0.000 (10.005)
Depreciation $0.000 $0.000 $0.000 $0.000 $0.000 $0.000 $0.000OPEB Obligation 0.000Environmental Remediation 0.000
Total Expenses ($10.005) $0.000 $0.000 $0.000 $0.000 $0.000 ($10.005)
Baseline Surplus/(Deficit) $32.024 $0.000 $0.000 0.000 0.000 0.000 32.024
- Differences are due to rounding.
MTA Plan Adjustments
MTA FIRST MUTUAL TRANSPORTATION ASSURANCE COMPANY2012 February Adopted Budget
($ in millions)Reconciliation to the 2012 Final Proposed Budget vs. 2012 Adopted Budget by Generic Category (Accrual and Cash)
2012

CASH RECEIPTS & EXPENDITURESFinal New February
Proposed MTA Energy/ New All AdoptedBudget Labor Efficiencies Other Reimb. COA Other Budget
ReceiptsFarebox Revenue $0.000 $0.000 $0.000 $0.000 $0.000 $0.000 $0.000Vehicle Toll Revenue 0.000Other Operating Revenue 21.179 21.179Investment Income 0.840 0.840Capital & Other Reimbursements: 0.000 0.000Total Receipts $22.019 $0.000 $0.000 $0.000 $0.000 $0.000 $22.019
ExpendituresLabor:Payroll $0.000 $0.000 $0.000 $0.000 $0.000 $0.000 $0.000Overtime 0.000Health and Welfare 0.000OPEB Current Payment 0.000Pensions 0.000Other Fringe Benefits 0.000GASB Account 0.000Reimbursable Overhead 0.000Total Labor Expenditures $0.000 $0.000 $0.000 $0.000 $0.000 $0.000 $0.000
Non-Labor:Electric Power $0.000 $0.000 $0.000 $0.000 $0.000 $0.000 $0.000Fuel 0.000 0.000 0.000 0.000 0.000 0.000 0.000Insurance (98.115) (98.115)Claims 68.455 68.455Paratransit Service Contracts 0.000Maintenance and Other Operating Contracts 0.000Professional Service Contracts 0.000Materials & Supplies 0.000Other Business Expenditures 8.703 8.703Total Non-Labor Expenditures ($20.957) $0.000 $0.000 $0.000 $0.000 $0.000 ($20.957)
Other Expenditure Adjustments:Other - Restricted Cash Adjustment 42.976 0.000 0.000 0.000 0.000 0.000 42.976Total Other Expenditure Adjustments $42.976 $0.000 $0.000 $0.000 $0.000 $0.000 $42.976
Total Expenditures $22.019 $0.000 $0.000 $0.000 $0.000 $0.000 $22.019
Baseline Cash Deficit $0.000 $0.000 $0.000 $0.000 $0.000 $0.000 $0.000
- Differences are due to rounding.
MTA Plan Adjustments
($ in millions)
2012 February Adopted BudgetReconciliation to the 2012 Final Proposed Budget vs. 2012 Adopted Budget by Generic Category (Accrual and Cash)
2012
MTA FIRST MUTUAL TRANSPORTATION ASSURANCE COMPANY

CASH FLOW ADJUSTMENTSFinal New February
Proposed MTA Energy/ New All AdoptedBudget Labor Efficiencies Other Reimb. COA Other Budget
ReceiptsFarebox Revenue $0.000 $0.000 $0.000 $0.000 $0.000 $0.000 $0.000Vehicle Toll RevenueOther Operating Revenue 0.000 0.000Investment Income 0.000 0.000Capital & Other Reimbursements: 0.000Total Receipt Adjustments $0.000 $0.000 $0.000 $0.000 $0.000 $0.000 $0.000
ExpendituresLabor:Payroll $0.000 $0.000 $0.000 $0.000 $0.000 $0.000 $0.000Overtime 0.000Health and Welfare 0.000OPEB Current Payment 0.000Pensions 0.000Other Fringe Benefits 0.000GASB Account 0.000Reimbursable Overhead 0.000Total Labor Expenditures $0.000 $0.000 $0.000 $0.000 $0.000 $0.000 $0.000
Non-Labor:Electric Power $0.000 $0.000 $0.000 $0.000 $0.000 $0.000 $0.000Fuel 0.000 0.000 0.000 0.000 0.000 0.000 0.000Insurance 0.000 0.000Claims 10.952 10.952Paratransit Service Contracts 0.000Maintenance and Other Operating Contracts 0.000Professional Service Contracts 0.000Materials & Supplies 0.000Other Business Expenditures 0.000Total Non-Labor Expenditures $10.952 $0.000 $0.000 $0.000 $0.000 $0.000 $10.952
Other Expenditure Adjustments:Other (42.977) 0.000 0.000 0.000 0.000 0.000 (42.977)Total Other Expenditure Adjustments ($42.977) $0.000 $0.000 $0.000 $0.000 $0.000 ($42.977)
Total Expenditure Adjustments ($32.025) $0.000 $0.000 $0.000 $0.000 $0.000 ($32.025)
Total Cash Conversion Adjustments beforeNon-Cash Liability Adjs. ($32.025) $0.000 $0.000 $0.000 $0.000 $0.000 ($32.025)
Depreciation Adjustment $0.000 $0.000 $0.000 $0.000 $0.000 $0.000 $0.000OPEB Obligation 0.000Environmental Remediation 0.000
Total Cash Conversion Adjustments ($32.025) $0.000 $0.000 $0.000 $0.000 $0.000 ($32.025)
- Differences are due to rounding.
MTA Plan Adjustments
2012 February Adopted BudgetMTA FIRST MUTUAL TRANSPORTATION ASSURANCE COMPANY
2012
Reconciliation to the 2012 Final Proposed Budget vs. 2012 Adopted Budget by Generic Category (Accrual and Cash)($ in millions)

NON-REIMBURSABLE 2011 2012
Final Adopted
Estimate Budget 2013 2014 2015
Operating Revenue
Farebox Revenue $0.000 $0.000 $0.000 $0.000 $0.000
Toll Revenue - - - - -
Other Operating Revenue 20.885 21.179 21.567 21.977 22.430
Investment Income 0.828 0.840 0.855 0.871 0.889
Capital and Other Reimbursements - - - - -
Total Revenue $21.713 $22.019 $22.422 $22.848 $23.319
Operating Expenses
Labor:
Payroll $0.000 $0.000 $0.000 $0.000 $0.000
Overtime - - - - -
Health and Welfare - - - - -
OPEB Current Payment - - - - -
Pensions - - - - -
Other Fringe Benefits - - - - -
Reimbursable Overhead - - - - -
Total Labor Expenses $0.000 $0.000 $0.000 $0.000 $0.000
Non-Labor:
Electric Power $0.000 $0.000 $0.000 $0.000 $0.000
Fuel - - - - -
Insurance (91.211) (98.115) (108.056) (121.111) (137.491)
Claims 71.038 79.407 88.367 96.282 102.812
Paratransit Service Contracts - - - - -
Maintenance and Other Operating Contracts - - - - -
Professional Service Contracts - - - - -
Materials & Supplies - - - - -
Other Business Expenses 8.532 8.703 8.877 9.054 9.235
Total Non-Labor Expenses ($11.641) ($10.005) ($10.812) ($15.775) ($25.444)
Other Expenses Adjustments:
Other $0.000 $0.000 $0.000 $0.000 $0.000
Total Other Expense Adjustments $0.000 $0.000 $0.000 $0.000 $0.000
Total Expenses before Depreciation ($11.641) ($10.005) ($10.812) ($15.775) ($25.444)
Depreciation $0.000 $0.000 $0.000 $0.000 $0.000
OPEB Obligation - - - - -
Environmental Remediation - - - - -
Total Expenses ($11.641) ($10.005) ($10.812) ($15.775) ($25.444)
Baseline Surplus/(Deficit) $33.354 $32.025 $33.234 $38.623 $48.762
MTA FIRST MUTUAL TRANSPORTATION ASSURANCE COMPANYFebruary Financial Plan 2012 - 2015
Accrual Statement of Operations by Category
($ in millions)

CASH RECEIPTS AND EXPENDITURES2011 2012Final Adopted
Estimate Budget 2013 2014 2015
Receipts
Farebox Revenue $0.000 $0.000 $0.000 $0.000 $0.000
Vehicle Toll Revenue - - - - -
Other Operating Revenue 20.885 21.179 21.567 21.977 22.430
Investment Income 0.828 0.840 0.855 0.871 0.889
Capital and Other Reimbursements - - - - -
Total Receipts $21.713 $22.019 $22.422 $22.848 $23.319
Expenditures
Labor:
Payroll $0.000 $0.000 $0.000 $0.000 $0.000
Overtime - - - - -
Health and Welfare - - - - -
OPEB Current Payment - - - - -
Pensions - - - - -
Other Fringe Benefits - - - - -
GASB Account - - - - -
Reimbursable Overhead
Total Labor Expenditures $0.000 $0.000 $0.000 $0.000 $0.000
Non-Labor:
Electric Power $0.000 $0.000 $0.000 $0.000 $0.000
Fuel - - - - -
Insurance (91.211) (98.115) (108.056) (121.111) (137.491)
Claims 61.239 68.455 76.179 83.002 88.631
Paratransit Service Contracts - - - - -
Maintenance and Other Operating Contracts - - - - -
Professional Service Contracts - - - - -
Materials & Supplies - - - - -
Other Business Expenses 8.532 8.703 8.877 9.054 9.235
Total Non-Labor Expenses ($21.440) ($20.957) ($23.000) ($29.055) ($39.625)
Other Expenditure Adjustments:
Other - Restricted Cash Adjustment $43.153 $42.977 $45.422 $51.903 $62.943
Total Other Expenditure Adjustments $43.153 $42.977 $45.422 $51.903 $62.943
Total Expenditures $21.713 $22.019 $22.422 $22.848 $23.319
Baseline Cash Surplus/(Deficit) $0.000 $0.000 $0.000 $0.000 $0.000
MTA FIRST MUTUAL TRANSPORTATION ASSURANCE COMPANYFebruary Financial Plan 2012 - 2015
Cash Receipts & Expenditures($ in millions)

CASH FLOW ADJUSTMENTS
2011 2012
Final AdoptedEstimate Budget 2013 2014 2015
Receipts
Farebox Revenue $0.000 $0.000 $0.000 $0.000 $0.000
Vehicle Toll Revenue - - - - -
Other Operating Revenue - - - - -
Investment Income - - - - -
Capital and Other Reimbursements - - - - - Total Receipts $0.000 $0.000 $0.000 $0.000 $0.000
Expenditures
Labor:
Payroll $0.000 $0.000 $0.000 $0.000 $0.000
Overtime - - - - -
Health and Welfare - - - - -
OPEB Current Payment - - - - -
Pensions - - - - -
Other Fringe Benefits - - - - -
GASB Account - - - - -
Reimbursable Overhead - - - - - Total Labor Expenditures $0.000 $0.000 $0.000 $0.000 $0.000
Non-Labor:
Electric Power $0.000 $0.000 $0.000 $0.000 $0.000
Fuel - - - - -
Insurance - - - - -
Claims 9.799 10.952 12.188 13.280 14.181
Paratransit Service Contracts - - - - -
Maintenance and Other Operating Contracts - - - - -
Professional Service Contracts - - - - -
Materials & Supplies - - - - -
Other Business Expenditures - - - - -
Total Non-Labor Expenses $9.799 $10.952 $12.188 $13.280 $14.181
Other Expenses Adjustments:
Other ($43.153) ($42.977) ($45.422) ($51.903) ($62.943)
Total Other Expenditures Adjustments ($43.153) ($42.977) ($45.422) ($51.903) ($62.943)
Total Cash Conversion Adjustments before Depreciation ($33.354) ($32.025) ($33.234) ($38.623) ($48.762)
Depreciation $0.000 $0.000 $0.000 $0.000 $0.000
OPEB Obligation - - - - -
Environmental Remediation - - - - -
Baseline Total Cash Conversion Adjustments ($33.354) ($32.025) ($33.234) ($38.623) ($48.762)
Cash Conversion (Cash Flow Adjustments)($ in millions)
MTA FIRST MUTUAL TRANSPORTATION ASSURANCE COMPANYFebruary Financial Plan 2012 - 2015

NON-REIMBURSABLEJan Feb Mar Apr May Jun Jul Aug Sep Oct Nov Dec Total
Operating Revenue
Farebox Revenue $0.000 $0.000 $0.000 $0.000 $0.000 $0.000 $0.000 $0.000 $0.000 $0.000 $0.000 $0.000 $0.000Toll Revenue - - - - - - - - - - - - - Other Operating Revenue 1.765 1.765 1.765 1.765 1.765 1.765 1.765 1.765 1.765 1.765 1.765 1.765 21.179 Investment Income 0.070 0.070 0.070 0.070 0.070 0.070 0.070 0.070 0.070 0.070 0.070 0.070 0.840 Capital and Other Reimbursements - - - - - - - - - - - - - Total Revenue $1.835 $1.835 $1.835 $1.835 $1.835 $1.835 $1.835 $1.835 $1.835 $1.835 $1.835 $1.835 $22.019
Operating Expenses
Labor:Payroll $0.000 $0.000 $0.000 $0.000 $0.000 $0.000 $0.000 $0.000 $0.000 $0.000 $0.000 $0.000 $0.000Overtime - - - - - - - - - - - - - Health and Welfare - - - - - - - - - - - - - OPEB Current Payment - - - - - - - - - - - - - Pensions - - - - - - - - - - - - - Other Fringe Benefits - - - - - - - - - - - - - Reimbursable Overhead - - - - - - - - - - - - - Total Labor Expenses $0.000 $0.000 $0.000 $0.000 $0.000 $0.000 $0.000 $0.000 $0.000 $0.000 $0.000 $0.000 $0.000
Non-Labor:Electric Power $0.000 $0.000 $0.000 $0.000 $0.000 $0.000 $0.000 $0.000 $0.000 $0.000 $0.000 $0.000 $0.000Fuel - - - - - - - - - - - - - Insurance (8.176) (8.176) (8.176) (8.176) (8.176) (8.176) (8.176) (8.176) (8.176) (8.176) (8.176) (8.176) (98.115) Claims 6.617 6.617 6.617 6.617 6.617 6.617 6.617 6.617 6.617 6.617 6.617 6.617 79.407 Paratransit Service Contracts - - - - - - - - - - - - - Maintenance and Other Operating Contracts - - - - - - - - - - - - - Professional Service Contracts - - - - - - - - - - - - - Materials & Supplies - - - - - - - - - - - - - Other Business Expenses 0.725 0.725 0.725 0.725 0.725 0.725 0.725 0.725 0.725 0.725 0.725 0.725 8.703 Total Non-Labor Expenses ($0.834) ($0.834) ($0.834) ($0.834) ($0.834) ($0.834) ($0.834) ($0.834) ($0.834) ($0.834) ($0.834) ($0.834) ($10.005)
Other Expenses Adjustments:Other - - - - - - - - - - - - $0.000Total Other Expense Adjustments $0.000 $0.000 $0.000 $0.000 $0.000 $0.000 $0.000 $0.000 $0.000 $0.000 $0.000 $0.000 $0.000
Total Expenses before Non-Cash Liability Adjs. ($0.834) ($0.834) ($0.834) ($0.834) ($0.834) ($0.834) ($0.834) ($0.834) ($0.834) ($0.834) ($0.834) ($0.834) ($10.005)
Total Expenses ($0.834) ($0.834) ($0.834) ($0.834) ($0.834) ($0.834) ($0.834) ($0.834) ($0.834) ($0.834) ($0.834) ($0.834) ($10.005)
Baseline Net Surplus/(Deficit) $2.669 $2.669 $2.669 $2.669 $2.669 $2.669 $2.669 $2.669 $2.669 $2.669 $2.669 $2.669 $32.025
MTA FIRST MUTUAL TRANSPORTATION ASSURANCE COMPANYFebruary Financial Plan - 2012 Adopted BudgetAccrual Statement of Operations by Category
($ in millions)

CASH RECEIPTS AND EXPENDITURESJan Feb Mar Apr May Jun Jul Aug Sep Oct Nov Dec Total
ReceiptsFarebox Revenue $0.000 $0.000 $0.000 $0.000 $0.000 $0.000 $0.000 $0.000 $0.000 $0.000 $0.000 $0.000 $0.000Vehicle Toll Revenue - - - - - - - - - - - - - Other Operating Revenue 1.765 1.765 1.765 1.765 1.765 1.765 1.765 1.765 1.765 1.765 1.765 1.765 21.179 Investment Income 0.070 0.070 0.070 0.070 0.070 0.070 0.070 0.070 0.070 0.070 0.070 0.070 0.840 Capital and Other Reimbursements - - - - - - - - - - - - - Total Receipts $1.835 $1.835 $1.835 $1.835 $1.835 $1.835 $1.835 $1.835 $1.835 $1.835 $1.835 $1.835 $22.019
ExpendituresLabor:Payroll $0.000 $0.000 $0.000 $0.000 $0.000 $0.000 $0.000 $0.000 $0.000 $0.000 $0.000 $0.000 $0.000Overtime - - - - - - - - - - - - - Health and Welfare - - - - - - - - - - - - - OPEB Current Payment - - - - - - - - - - - - - Pensions - - - - - - - - - - - - - Other Fringe Benefits - - - - - - - - - - - - - GASB Account - - - - - - - - - - - - - Reimbursable Overhead - - - - - - - - - - - - - Total Labor Expenditures $0.000 $0.000 $0.000 $0.000 $0.000 $0.000 $0.000 $0.000 $0.000 $0.000 $0.000 $0.000 $0.000
Non-Labor:Electric Power $0.000 $0.000 $0.000 $0.000 $0.000 $0.000 $0.000 $0.000 $0.000 $0.000 $0.000 $0.000 $0.000Fuel - - - - - - - - - - - - - Insurance (8.176) (8.176) (8.176) (8.176) (8.176) (8.176) (8.176) (8.176) (8.176) (8.176) (8.176) (8.176) (98.115) Claims 5.705 5.705 5.705 5.705 5.705 5.705 5.705 5.705 5.705 5.705 5.705 5.705 68.455 Paratransit Service Contracts - - - - - - - - - - - - - Maintenance and Other Operating Contracts - - - - - - - - - - - - - Professional Service Contracts - - - - - - - - - - - - - Materials & Supplies - - - - - - - - - - - - - Other Business Expenses 0.725 0.725 0.725 0.725 0.725 0.725 0.725 0.725 0.725 0.725 0.725 0.725 8.703 Total Non-Labor Expenditures ($1.746) ($1.746) ($1.746) ($1.746) ($1.746) ($1.746) ($1.746) ($1.746) ($1.746) ($1.746) ($1.746) ($1.746) ($20.957)
Other Expenditure Adjustments:Other - Restricted Cash Adjustment 3.581 3.581 3.581 3.581 3.581 3.581 3.581 3.581 3.581 3.581 3.581 3.581 42.977 Total Other Expenditure Adjustments $3.581 $3.581 $3.581 $3.581 $3.581 $3.581 $3.581 $3.581 $3.581 $3.581 $3.581 $3.581 $42.977
Total Expenditures $1.835 $1.835 $1.835 $1.835 $1.835 $1.835 $1.835 $1.835 $1.835 $1.835 $1.835 $1.835 $22.019
Baseline Net Cash Deficit $0.000 $0.000 $0.000 $0.000 $0.000 $0.000 $0.000 $0.000 $0.000 $0.000 $0.000 $0.000 $0.000
MTA FIRST MUTUAL TRANSPORTATION ASSURANCE COMPANYFebruary Financial Plan - 2012 Adopted Budget
Cash Receipts & Expenditures($ in millions)

CASH FLOW ADJUSTMENTSJan Feb Mar Apr May Jun Jul Aug Sep Oct Nov Dec Total
Receipts
Farebox Revenue $0.000 $0.000 $0.000 $0.000 $0.000 $0.000 $0.000 $0.000 $0.000 $0.000 $0.000 $0.000 $0.000Vehicle Toll Revenue - - - - - - - - - - - - - Other Operating Revenue - - - - - - - - - - - - - Investment Income - - - - - - - - - - - - Capital and Other Reimbursements - - - - - - - - - - - - - Total Receipts $0.000 $0.000 $0.000 $0.000 $0.000 $0.000 $0.000 $0.000 $0.000 $0.000 $0.000 $0.000 $0.000
Expenditures
Labor:Payroll $0.000 $0.000 $0.000 $0.000 $0.000 $0.000 $0.000 $0.000 $0.000 $0.000 $0.000 $0.000 $0.000Overtime - - - - - - - - - - - - - Health and Welfare - - - - - - - - - - - - - OPEB Current Payment - - - - - - - - - - - - - Pensions - - - - - - - - - - - - - Other Fringe Benefits - - - - - - - - - - - - - GASB Account - - - - - - - - - - - - - Reimbursable Overhead - - - - - - - - - - - - - Total Labor Expenditures $0.000 $0.000 $0.000 $0.000 $0.000 $0.000 $0.000 $0.000 $0.000 $0.000 $0.000 $0.000 $0.000
Non-Labor:Electric Power $0.000 $0.000 $0.000 $0.000 $0.000 $0.000 $0.000 $0.000 $0.000 $0.000 $0.000 $0.000 $0.000Fuel - - - - - - - - - - - - - Insurance - - - - - - - - - - - - - Claims 0.913 0.913 0.913 0.913 0.913 0.913 0.913 0.913 0.913 0.913 0.913 0.913 10.952 Paratransit Service Contracts - - - - - - - - - - - - - Maintenance and Other Operating Contracts - - - - - - - - - - - - - Professional Service Contracts - - - - - - - - - - - - - Materials & Supplies - - - - - - - - - - - - - Other Business Expenditures - - - - - - - - - - - - - Total Non-Labor Expenditures $0.913 $0.913 $0.913 $0.913 $0.913 $0.913 $0.913 $0.913 $0.913 $0.913 $0.913 $0.913 $10.952
Other Expenditures Adjustments:Other (3.581) (3.581) (3.581) (3.581) (3.581) (3.581) (3.581) (3.581) (3.581) (3.581) (3.581) (3.581) (42.977) Total Other Expenditures Adjustments ($3.581) ($3.581) ($3.581) ($3.581) ($3.581) ($3.581) ($3.581) ($3.581) ($3.581) ($3.581) ($3.581) ($3.581) ($42.977)
Total Cash Conversion Adjustments before Non-Cash Liability Adjs. ($2.669) ($2.669) ($2.669) ($2.669) ($2.669) ($2.669) ($2.669) ($2.669) ($2.669) ($2.669) ($2.669) ($2.669) ($32.025)
Baseline Total Cash Conversion Adjustments ($2.669) ($2.669) ($2.669) ($2.669) ($2.669) ($2.669) ($2.669) ($2.669) ($2.669) ($2.669) ($2.669) ($2.669) ($32.025)
MTA FIRST MUTUAL TRANSPORTATION ASSURANCE COMPANYFebruary Financial Plan - 2012 Adopted Budget
Cash Conversion (Cash Flow Adjustments)($ in millions)

New York City Transit

MTA NEW YORK CITY TRANSIT FEBRUARY FINANCIAL PLAN FOR 2012-2015
2011 FINAL ESTIMATE AND ADOPTED BUDGET FOR 2012 In accordance with MTA-approved budget procedures, the following information presents MTA New York City Transit’s 2011 Final Estimate, 2012 Adopted Budget and the Financial Plan for 2012-2015. The Adopted Budget reflects the inclusion of MTA adjustments that were presented in the November Financial Plan, which was adopted by the Board in December 2011, as well as other technical adjustments. These adjustments are presented on the attached reconciliations from the November Financial Plan and are described below:
Non-reimbursable labor savings of $9.1 million in 2012, $9.2 million in 2013, $55.4 million in 2014 and $65.7 million in 2015, from the elimination of a third year wage increase as part of a three-year net zero savings initiative for represented employees and the elimination of a third year (2011) non-represented employee wage increase.
Non-reimbursable labor savings of $18.9 million in 2012, $18.7 million in
2013, $14.5 million in 2014 and $6.8 million in 2015, from the impact of acceleration of the three-year net zero savings initiative.
Revised inflation assumptions, which result in net energy savings of $3.3
million in 2012, $3.0 million in 2013, $2.8 million in 2014, and $2.6 million in 2015.
New MTA efficiencies, which are projected to result in savings of $1.4
million each year.
Technical adjustments, principally due to retro-active cash payments related to the projected timing of labor contract settlements.
Effective 2012, the non-labor account structure of the MTA standard chart
of accounts has been adjusted to reflect the reclassification and renaming of certain accounts in order to improve account reporting consistency among the Agencies. These changes, which affect most non-labor accounts presented on the attached tables, result in no net-impact to the bottom line. In order to maintain comparability with 2011 actual results for year-end reporting purposes, the 2011 account structure remains unchanged.
This submission also includes schedules detailing the monthly allocation of financial, headcount and utilization data based on the 2012 Adopted Budget for the purpose of reporting actual results on a monthly basis to the Board.

Positions Dollars Positions Dollars Positions Dollars Positions Dollars Positions Dollars
2011 November Financial Plan: Baseline Surplus/(Deficit) 40,819 ($4,626.827) 41,071 ($5,065.926) 41,153 ($5,345.389) 41,278 ($5,696.577) 41,262 ($6,114.655)
Technical Adjustments: Miscellaneous Corrections 0.000 0.018 0.154 0.025 0.033
Sub-Total Technical Adjustments 0 $0.000 0 $0.018 0 $0.154 0 $0.025 0 $0.033
MTA Plan Adjustments:
Labor: 3 Zeros Salary/Wage Initiative 10.586 9.061 9.240 55.405 65.733 Accelerate 3 Zeros 6.002 18.874 18.657 14.453 6.785New MTA Efficiencies 0.338 1.368 1.368 1.368 1.368Energy/Other Reimbursements 2.859 3.260 3.042 2.785 2.570
Sub-Total MTA Plan Adjustments 0 $19.785 0 $32.563 0 $32.307 0 $74.011 0 $76.456
2012 February Financial Plan: Baseline Surplus/(Deficit) 40,819 (4,607.042)$ 41,071 (5,033.345)$ 41,153 (5,312.928)$ 41,278 (5,622.541)$ 41,262 (6,038.166)$
Favorable/(Unfavorable)2011 2012 2013 2014 2015
MTA NEW YORK CITY TRANSITFebruary Financial Plan 2012 - 2015
Reconciliation to the November Plan (Accrual) Non-Reimbursable($ in millions)

Positions Dollars Positions Dollars Positions Dollars Positions Dollars Positions Dollars
2011 November Financial Plan: Baseline Surplus/(Deficit) 4,896 $0.000 4,528 $0.000 4,315 $0.000 4,258 $0.000 4,244 $0.000
Technical Adjustments:
MTA Labor Agency Reforecast 0.000 (5.737) (5.737) (5.737) (5.738)Miscellaneous Corrections (0.021) (0.358) (0.147) 0.000 0.000
Sub-Total Technical Adjustments 0 ($0.021) 0 ($6.095) 0 ($5.884) 0 ($5.737) 0 ($5.738)
MTA Plan Adjustments:
Labor: 3 Zeros Salary/Wage Initiative 4.680 4.845 5.160 11.439 12.985 Accelerate 3 Zeros 0.000 1.721 1.759 1.726 0.657New MTA EfficienciesEnergy/Other Reimbursements
Sub-Total MTA Plan Adjustments 0 $4.680 0 $6.566 0 $6.919 0 $13.165 0 $13.642
Reimbursement Adjustment- Reimbursable Expense Changes (4.659) (0.471) (1.035) (7.428) (7.904)
2012 February Financial Plan: Baseline Surplus/(Deficit) 4,896 $0.000 4,528 $0.000 4,315 $0.000 4,258 $0.000 4,244 $0.000
Favorable/(Unfavorable)2011 2012 2013 2014 2015
MTA NEW YORK CITY TRANSITFebruary Financial Plan 2012 - 2015
Reconciliation to the November Plan (Accrual) Reimbursable($ in millions)

Positions Dollars Positions Dollars Positions Dollars Positions Dollars Positions Dollars
2011 November Financial Plan: Baseline Surplus/(Deficit) 45,715 ($2,340.824) 45,599 ($2,581.744) 45,468 ($2,825.732) 45,536 ($3,077.487) 45,506 ($3,414.635)
Technical Adjustments:
Timing of Retroactive Salary & Wage Payments (6.625) 6.625 0.000 0.000 0.000MTA Labor Agency Reforecast (Reimbursable) 0.000 (5.737) (5.737) (5.737) (5.738)Miscellaneous Corrections (0.021) (0.340) 0.007 0.026 0.034
Sub-Total Technical Adjustments 0 ($6.646) 0 $0.548 0 ($5.730) 0 ($5.711) 0 ($5.704)
MTA Plan Adjustments:
Labor: 3 Zeros Salary/Wage Initiative 15.266 13.906 14.400 66.844 78.718 Accelerate 3 Zeros 6.973 19.229 20.452 15.662 7.848New MTA Efficiencies 0.338 1.368 1.368 1.368 1.368Energy/Other Reimbursements 2.859 3.260 3.042 2.785 2.570
Sub-Total MTA Plan Adjustments 0 $25.436 0 $37.763 0 $39.262 0 $86.659 0 $90.504
Reimbursement Adjustment- Reimbursable Expense Changes (4.659) (0.471) (1.035) (7.428) (7.904)
2012 February Financial Plan: Surplus/(Deficit) 45,715 (2,326.693)$ 45,599 (2,543.904)$ 45,468 (2,793.235)$ 45,536 (3,003.967)$ 45,506 (3,337.739)$
Favorable/(Unfavorable)2011 2012 2013 2014 2015
MTA NEW YORK CITY TRANSITFebruary Financial Plan 2012 - 2015
Reconciliation to the November Plan - (Cash)($ in millions)

NON-REIMBURSABLE February Final Proposed New MTA Energy/ New All Adopted
Budget Labor Efficiencies Other Reimb. COA Other Budget
RevenueFarebox Revenue: Subway 2,746.177 0.000 0.000 0.000 0.000 0.000 2,746.177Bus 885.066 0.000 0.000 0.000 0.000 0.000 885.066Paratransit 17.003 0.000 0.000 0.000 0.000 0.000 17.003Fare Media Liability 56.221 0.000 0.000 0.000 0.000 0.000 56.221Farebox Revenue $3,704.467 $0.000 $0.000 $0.000 $0.000 $0.000 $3,704.467Vehicle Toll Revenue 0.000Other Operating Revenue:Fare Reimbursement 84.016 0.000 0.000 0.000 0.000 0.000 84.016Paratransit Reimbursement 132.619 0.000 0.000 0.000 0.000 0.000 132.619Other 108.592 0.000 0.000 0.000 0.000 0.000 108.592Other Operating Revenue 325.227 0.000 0.000 0.000 0.000 0.000 325.227Capital and Other Reimbursements 0.000 0.000 0.000 0.000 0.000 0.000 0.000Total Revenue $4,029.694 $0.000 $0.000 $0.000 $0.000 $0.000 $4,029.694
ExpensesLabor:Payroll 2,877.006 (24.681) 0.000 0.000 0.000 1.699 2,854.024Overtime 262.400 (0.368) 0.000 0.000 0.000 0.000 262.032Total Salaries & Wages 3,139.406 (25.049) 0.000 0.000 0.000 1.699 3,116.056Health and Welfare 580.019 0.000 0.000 0.000 0.000 (0.467) 579.552OPEB Current Payment 318.496 0.000 0.000 0.000 0.000 0.000 318.496Pensions 925.072 (2.290) 0.000 0.000 0.000 0.453 923.235Other Fringe Benefits 258.475 (2.203) 0.000 0.000 0.000 1.149 257.421Total Fringe Benefits 2,082.062 (4.493) 0.000 0.000 0.000 1.135 2,078.704Reimbursable Overhead (198.738) 1.607 0.000 0.000 0.000 0.000 (197.131)Total Labor Expenses $5,022.730 ($27.935) $0.000 $0.000 $0.000 $2.834 $4,997.629
Non-Labor:Electric Power 209.018 0.000 0.000 6.774 85.239 0.000 301.031Fuel 167.183 0.000 0.000 (10.034) 23.077 0.000 180.226Insurance 68.387 0.000 0.000 0.000 0.000 0.000 68.387Claims 95.039 0.000 0.000 0.000 0.000 0.000 95.039Paratransit Service Contracts 404.193 0.000 0.000 0.000 0.000 0.001 404.194Maintenance and Other Operating Contracts 286.720 0.000 (1.172) 0.000 (120.628) 0.000 164.920Professional Service Contracts 90.273 0.000 (0.052) 0.000 37.890 0.000 128.111Materials & Supplies 315.952 0.000 (0.103) 0.000 (32.193) (2.854) 280.802Other Business Expenses 61.242 0.000 (0.041) 0.000 6.615 0.001 67.817Total Non-Labor Expenses $1,698.007 $0.000 ($1.368) ($3.260) $0.000 ($2.852) $1,690.527
Other Expense Adjustments:Other 0.000 0.000 0.000 0.000 0.000 0.000 0.000Total Other Expense Adjustments $0.000 $0.000 $0.000 $0.000 $0.000 $0.000 $0.000
Total Expenses before Depreciation and GASB Adjs. $6,720.737 ($27.935) ($1.368) ($3.260) $0.000 ($0.018) $6,688.156
Depreciation 1,445.000 0.000 0.000 0.000 0.000 0.000 1,445.000OPEB Obligation 929.883 0.000 0.000 0.000 0.000 0.000 929.883Environmental Remediation 0.000 0.000 0.000 0.000 0.000 0.000 0.000
Total Expenses $9,095.620 ($27.935) ($1.368) ($3.260) $0.000 ($0.018) $9,063.039
Baseline Surplus/(Deficit) ($5,065.926) $27.935 $1.368 $3.260 $0.000 $0.018 ($5,033.345)
MTA New York City Transit2012 February Adopted Budget
Reconciliation to the 2012 Final Proposed Budget vs. 2012 Adopted Budget by Generic Category (Accrual and Cash)($ in millions)
2012
MTA Plan Adjustments

REIMBURSABLE February Final Proposed New MTA Energy/ New All Adopted
Budget Labor Efficiencies Other Reimb. COA Other Budget
RevenueFare Revenue $0.000 $0.000 $0.000 $0.000 $0.000 $0.000 0.000Vehicle Toll Revenue 0.000 0.000 0.000 0.000 0.000 0.000 0.000Other Operating Revenue 0.000 0.000 0.000 0.000 0.000 0.000 0.000Capital and Other Reimbursements 883.499 ($6.566) $0.000 $0.000 ($0.000) 6.095 883.028Total Revenue $883.499 ($6.566) $0.000 $0.000 ($0.000) $6.095 $883.028
ExpensesLabor:Payroll 367.710 (4.196) 0.000 0.000 0.000 5.515 369.029Overtime 65.915 0.000 0.000 0.000 0.000 (1.350) 64.565Total Salaries & Wages 433.625 (4.196) 0.000 0.000 0.000 4.165 433.594Health and Welfare 23.614 0.000 0.000 0.000 0.000 0.000 23.614OPEB Current Payment 0.000 0.000 0.000 0.000 0.000 0.000 0.000Pensions 18.502 (0.389) 0.000 0.000 0.000 0.391 18.504Other Fringe Benefits 108.141 (0.374) 0.000 0.000 0.000 1.207 108.974Total Fringe Benefits 150.257 (0.763) 0.000 0.000 0.000 1.598 151.092Reimbursable Overhead 198.738 (1.607) 0.000 0.000 0.000 0.000 197.131Total Labor Expenses $782.620 ($6.566) $0.000 $0.000 $0.000 $5.763 $781.817
Non-Labor:Electric Power 0.000 0.000 0.000 0.000 0.000 0.252 0.252Fuel 0.021 0.000 0.000 0.000 0.000 0.001 0.022Insurance 0.000 0.000 0.000 0.000 0.000 0.000 0.000Claims 0.000 0.000 0.000 0.000 0.000 0.000 0.000Paratransit Service Contracts 0.000 0.000 0.000 0.000 0.000 0.000 0.000Maintenance and Other Operating Contracts 32.702 0.000 0.000 0.000 0.329 0.079 33.110Professional Service Contracts 14.576 0.000 0.000 0.000 2.407 0.000 16.983Materials & Supplies 52.250 0.000 0.000 0.000 (2.967) 0.000 49.283Other Business Expenses 1.330 0.000 0.000 0.000 0.231 0.000 1.561Total Non-Labor Expenses $100.879 $0.000 $0.000 $0.000 ($0.000) $0.332 $101.211
Other Expense Adjustments:Other 0.000 0.000 0.000 0.000 0.000 0.000 0.000Total Other Expense Adjustments $0.000 $0.000 $0.000 $0.000 $0.000 $0.000 $0.000
Total Expenses before Depreciation $883.499 ($6.566) $0.000 $0.000 ($0.000) $6.095 $883.028
Depreciation 0.000 0.000 0.000 0.000 0.000 0.000 0.000
Total Expenses $883.499 ($6.566) $0.000 $0.000 ($0.000) $6.095 $883.028
Baseline Surplus/(Deficit) $0.000 $0.000 $0.000 $0.000 $0.000 $0.000 $0.000
MTA Plan Adjustments
($ in millions)
2012
MTA New York City Transit2012 February Adopted Budget
Reconciliation to the 2012 Final Proposed Budget vs. 2012 Adopted Budget by Generic Category (Accrual and Cash)

NON-REIMBURSABLE/REIMBURSABLE February Final Proposed New MTA Energy/ New All Adopted
Budget Labor Efficiencies Other Reimb. COA Other Budget
RevenueFarebox Revenue:Subway $2,746.18 $0.00 $0.00 $0.00 $0.00 $0.00 2,746.177Bus $885.07 $0.00 $0.00 $0.00 $0.00 $0.00 885.066Paratransit $17.00 $0.00 $0.00 $0.00 $0.00 $0.00 17.003Fare Media Liability $56.22 $0.00 $0.00 $0.00 $0.00 $0.00 56.221Total Farebox Revenue $3,704.467 $0.000 $0.000 $0.000 $0.000 $0.000 $3,704.467Vehicle Toll Revenue 0.000 0.000Other Operating Revenue:Fare Reimbursement 84.016 0.000 0.000 0.000 0.000 0.000 84.016Paratransit Reimbursement 132.619 0.000 0.000 0.000 0.000 0.000 132.619Other 108.592 0.000 0.000 0.000 0.000 0.000 108.592Other Operating Revenue 325.227 0.000 0.000 0.000 0.000 0.000 325.227Capital and Other Reimbursements 883.499 (6.566) 0.000 0.000 (0.000) 6.095 883.028Total Revenue $4,913.193 ($6.566) $0.000 $0.000 ($0.000) $6.095 $4,912.722
ExpensesLabor:Payroll 3,244.716 (28.877) 0.000 0.000 0.000 7.214 3,223.053Overtime 328.315 (0.368) 0.000 0.000 0.000 (1.350) 326.597Total Salaries & Wages 3,573.031 (29.245) 0.000 0.000 0.000 5.864 3,549.650Health and Welfare 603.633 0.000 0.000 0.000 0.000 (0.467) 603.166OPEB Current Payment 318.496 0.000 0.000 0.000 0.000 0.000 318.496Pensions 943.574 (2.679) 0.000 0.000 0.000 0.844 941.739Other Fringe Benefits 366.616 (2.577) 0.000 0.000 0.000 2.356 366.395Total Fringe Benefits 2,232.319 (5.256) 0.000 0.000 0.000 2.733 2,229.796Reimbursable Overhead 0.000 0.000 0.000 0.000 0.000 0.000 0.000Total Labor Expenses $5,805.350 ($34.501) $0.000 $0.000 $0.000 $8.597 $5,779.446
Non-Labor:Electric Power 209.018 0.000 0.000 6.774 85.239 0.252 301.283Fuel 167.204 0.000 0.000 (10.034) 23.077 0.001 180.248Insurance 68.387 0.000 0.000 0.000 0.000 0.000 68.387Claims 95.039 0.000 0.000 0.000 0.000 0.000 95.039Paratransit Service Contracts 404.193 0.000 0.000 0.000 0.000 0.001 404.194Maintenance and Other Operating Contracts 319.422 0.000 (1.172) 0.000 (120.299) 0.079 198.030Professional Service Contracts 104.849 0.000 (0.052) 0.000 40.297 0.000 145.094Materials & Supplies 368.202 0.000 (0.103) 0.000 (35.160) (2.854) 330.085Other Business Expenses 62.572 0.000 (0.041) 0.000 6.846 0.001 69.378Total Non-Labor Expenses $1,798.886 $0.000 ($1.368) ($3.260) ($0.000) ($2.520) $1,791.738
Other Expense Adjustments:Other 0.000 0.000 0.000 0.000 0.000 0.000 0.000Total Other Expense Adjustments $0.000 $0.000 $0.000 $0.000 $0.000 $0.000 $0.000
Total Expenses before Depreciation and GASB Adjs. $7,604.236 ($34.501) ($1.368) ($3.260) ($0.000) $6.077 $7,571.184
Depreciation 1,445.000 0.000 0.000 0.000 0.000 0.000 1,445.000OPEB Obligation 929.883 0.000 0.000 0.000 0.000 0.000 929.883Environmental Remediation 0.000 0.000 0.000 0.000 0.000 0.000 0.000
Total Expenses $9,979.119 ($34.501) ($1.368) ($3.260) ($0.000) $6.077 $9,946.067
Baseline Surplus/(Deficit) ($5,065.926) $27.935 $1.368 $3.260 $0.000 $0.018 ($5,033.345)
($ in millions)
2012
MTA Plan Adjustments
2012 February Adopted BudgetReconciliation to the 2012 Final Proposed Budget vs. 2012 Adopted Budget by Generic Category (Accrual and Cash)
MTA New York City Transit

CASH RECEIPTS AND EXPENDITURES February Final Proposed New MTA Energy/ New All Adopted
Budget Labor Efficiencies Other Reimb. COA Other Budget
ReceiptsFare Revenue $3,702.998 $0.000 $0.000 $0.000 $0.000 $0.000 3,702.998Vehicle Toll Revenue 0.000 $0.000 $0.000 $0.000 $0.000 $0.000 0.000Other Operating Revenue:Fare Reimbursement 84.016 0.000 0.000 0.000 0.000 0.000 84.016Paratransit Reimbursement 132.464 0.000 0.000 0.000 0.000 0.000 132.464Other 109.592 0.000 0.000 0.000 0.000 0.000 109.592Other Operating Revenue 326.072 0.000 0.000 0.000 0.000 0.000 326.072Capital and Other Reimbursements 1,039.377 (6.566) 0.000 0.000 0.000 5.227 1,038.038Total Receipts $5,068.447 ($6.566) $0.000 $0.000 $0.000 $5.227 $5,067.108
ExpendituresLabor:Payroll 3,275.240 (27.511) 0.000 0.000 0.000 0.701 3,248.430Overtime 331.404 (0.368) 0.000 0.000 0.000 (1.899) 329.137Total Salaries & Wages 3,606.644 (27.879) 0.000 0.000 0.000 (1.198) 3,577.567Health and Welfare 600.873 0.000 0.000 0.000 0.000 (0.467) 600.406OPEB Current Payment 318.496 0.000 0.000 0.000 0.000 0.000 318.496Pensions 930.883 (2.679) 0.000 0.000 0.000 0.844 929.048Other Fringe Benefits 339.764 (2.577) 0.000 0.000 0.000 1.924 339.111Total Fringe Benefits 2,190.016 (5.256) 0.000 0.000 0.000 2.301 2,187.061GASB Account 34.370 0.000 0.000 0.000 0.000 0.000 34.370Reimbursable Overhead 0.000 0.000 0.000 0.000 0.000 0.000 0.000Total Labor Expenditures $5,831.030 ($33.135) $0.000 $0.000 $0.000 $1.103 $5,798.998
Non-Labor:Electric Power 209.018 0.000 0.000 6.774 85.239 0.252 301.283Fuel 167.204 0.000 0.000 (10.034) 23.077 0.001 180.248Insurance 71.936 0.000 0.000 0.000 0.000 0.000 71.936Claims 87.065 0.000 0.000 0.000 0.000 0.001 87.066Paratransit Service Contracts 402.193 0.000 0.000 0.000 0.000 0.001 402.194Maintenance and Other Operating Contracts 330.122 0.000 (1.172) 0.000 (120.299) 0.079 208.730Professional Service Contracts 98.849 0.000 (0.052) 0.000 40.297 0.000 139.094Materials & Supplies 390.202 0.000 (0.103) 0.000 (35.160) (2.854) 352.085Other Business Expenditures 62.572 0.000 (0.041) 0.000 6.846 0.001 69.378Total Non-Labor Expenditures $1,819.161 $0.000 ($1.368) ($3.260) $0.000 ($2.519) $1,812.014
Other Expenditure Adjustments:Other 0.000 0.000 0.000 0.000 0.000 0.000 0.000Total Other Expenditure Adjustments $0.000 $0.000 $0.000 $0.000 $0.000 $0.000 $0.000
Total Expenditures $7,650.191 ($33.135) ($1.368) ($3.260) $0.000 ($1.416) $7,611.012
Baseline Cash Deficit ($2,581.744) $26.569 $1.368 $3.260 $0.000 $6.643 ($2,543.904)
($ in millions)
2012
MTA New York City Transit2012 February Adopted Budget
Reconciliation to the 2012 Final Proposed Budget vs. 2012 Adopted Budget by Generic Category (Accrual and Cash)
MTA Plan Adjustments

CASH FLOW ADJUSTMENTS February Final Proposed New MTA Energy/ New All Adopted
Budget Labor Efficiencies Other Reimb. COA Other Budget
ReceiptsFare Revenue (1.469) 0.000 0.000 0.000 0.000 0.000 (1.469)Vehicle Toll Revenue 0.000 0.000 0.000 0.000 0.000 0.000 0.000Other Operating Revenue:Fare Reimbursement 0.000 0.000 0.000 0.000 0.000 0.000 0.000Paratransit Reimbursement (0.155) 0.000 0.000 0.000 0.000 0.000 (0.155)Other 1.000 0.000 0.000 0.000 0.000 0.000 1.000Other Operating Revenue 0.845 0.000 0.000 0.000 0.000 0.000 0.845Capital and Other Reimbursements 155.878 0.000 0.000 0.000 0.000 (0.868) 155.010Total Receipt Adjustments $155.254 $0.000 $0.000 $0.000 $0.000 ($0.868) $154.386
ExpendituresLabor:Payroll (30.524) (1.366) 0.000 0.000 0.000 6.513 (25.377)Overtime (3.089) 0.000 0.000 0.000 0.000 0.549 (2.540)Total Salaries & Wages ($33.613) ($1.366) $0.000 $0.000 $0.000 $7.062 ($27.917)Health and Welfare 2.760 0.000 0.000 0.000 0.000 0.000 2.760OPEB Current Payment 0.000 0.000 0.000 0.000 0.000 0.000 0.000Pensions 12.691 0.000 0.000 0.000 0.000 (0.000) 12.691Other Fringe Benefits 26.852 0.000 0.000 0.000 0.000 0.432 27.284Total Fringe Benefits 42.303 0.000 0.000 0.000 0.000 0.432 42.735GASB Account (34.370) 0.000 0.000 0.000 0.000 0.000 (34.370)Reimbursable Overhead 0.000 0.000 0.000 0.000 0.000 0.000Total Labor Expenditures ($25.680) ($1.366) $0.000 $0.000 $0.000 $7.494 ($19.552)
Non-Labor:Electric Power 0.000 0.000 0.000 0.000 0.000 0.000 0.000Fuel 0.000 0.000 0.000 0.000 0.000 (0.000) (0.000)Insurance (3.549) 0.000 0.000 0.000 0.000 0.000 (3.549)Claims 7.974 0.000 0.000 0.000 0.000 (0.001) 7.973Paratransit Service Contracts 2.000 0.000 0.000 0.000 0.000 0.000 2.000Maintenance and Other Operating Contracts (10.700) 0.000 0.000 0.000 0.000 0.000 (10.700)Professional Service Contracts 6.000 0.000 0.000 0.000 0.000 0.000 6.000Materials & Supplies (22.000) 0.000 0.000 0.000 0.000 0.000 (22.000)Other Business Expenditures 0.000 0.000 0.000 0.000 0.000 (0.000) (0.000)Total Non-Labor Expenditures ($20.275) $0.000 $0.000 $0.000 $0.000 ($0.001) ($20.276)
Other Expenditure Adjustments:Other 0.000 0.000 0.000 0.000 0.000 0.000 0.000Total Other Expenditure Adjustments $0.000 $0.000 $0.000 $0.000 $0.000 $0.000 $0.000
Total Expenditure Adjustments ($45.955) ($1.366) $0.000 $0.000 $0.000 $7.493 ($39.828)
Total Cash Conversion Adjustments beforeDepreciation and GASB Adjs. $109.299 ($1.366) $0.000 $0.000 $0.000 $6.625 $114.558
Depreciation Adjustment 1,445.000 0.000 0.000 0.000 0.000 0.000 1,445.000OPEB Obligation 929.883 0.000 0.000 0.000 0.000 0.000 929.883Environmental Remediation 0.000 0.000 0.000 0.000 0.000 0.000 0.000
Total Cash Conversion Adjustments $2,484.182 ($1.366) $0.000 $0.000 $0.000 $6.625 $2,489.441
MTA Plan Adjustments
($ in millions)
2012
MTA New York City Transit
Reconciliation to the 2012 Final Proposed Budget vs. 2012 Adopted Budget by Generic Category (Accrual and Cash)2012 February Adopted Budget

NON-REIMBURSABLE
2011 2012
Final Adopted
Estimate* Budget 2013 2014 2015
Operating Revenue
Farebox Revenue:
Subway 2,689.411 2,746.177 2,784.519 2,829.559 2,873.194
Bus 868.384 885.066 891.990 900.720 908.673
Paratransit 14.647 17.003 19.573 22.529 25.928
Fare Media Liability 56.092 56.221 52.221 52.221 52.221
Farebox Revenue $3,628.534 $3,704.467 $3,748.303 $3,805.029 $3,860.016
Other Operating Revenue:
Fare Reimbursement 84.016 84.016 84.016 84.016 84.016
Paratransit Reimbursement 112.063 132.619 155.844 184.374 216.825
Other 105.809 108.592 112.381 116.343 120.450
Other Operating Revenue $301.888 $325.227 $352.241 $384.733 $421.291
Capital and Other Reimbursements - - - - -
Total Revenue $3,930.422 $4,029.694 $4,100.544 $4,189.762 $4,281.307
Operating Expenses
Labor:
Payroll $2,811.104 $2,854.024 $2,856.053 $2,876.081 $2,926.423
Overtime 296.011 262.032 259.774 259.536 263.412
Total Salaries & Wages $3,107.115 $3,116.056 $3,115.827 $3,135.617 $3,189.835
Health and Welfare 515.497 579.552 629.274 686.518 747.791
OPEB Current Payment 283.009 318.496 359.147 395.418 435.482
Pensions 776.780 923.235 928.709 975.486 1,018.102
Other Fringe Benefits 252.459 257.421 263.070 267.924 273.248
Total Fringe Benefits $1,827.745 $2,078.704 $2,180.200 $2,325.346 $2,474.623
Reimbursable Overhead (211.392) (197.131) (185.296) (182.406) (185.260)
Total Labor Expenses $4,723.468 $4,997.629 $5,110.731 $5,278.557 $5,479.198
Non-Labor:
Electric Power $186.891 $301.031 $335.785 $376.244 $417.790
Fuel $152.453 $180.226 $191.224 $193.542 $201.939
Insurance 57.429 68.387 83.227 101.596 124.440
Claims 103.505 95.039 90.116 92.245 96.244
Paratransit Service Contracts 356.043 404.194 468.084 550.025 636.950
Maintenance and Other Operating Contracts 246.780 164.920 170.410 154.755 164.689
Professional Service Contracts 83.759 128.111 129.356 131.752 132.253
Materials & Supplies 279.226 280.802 300.743 304.525 343.396
Other Business Expenses 59.163 67.817 70.017 71.422 72.794
Total Non-Labor Expenses $1,525.249 $1,690.527 $1,838.962 $1,976.106 $2,190.495
Other Expenses Adjustments:
Other 0.000 0.000 0.000 0.000 0.000
Total Other Expense Adjustments $0.000 $0.000 $0.000 $0.000 $0.000
Total Expenses before Depreciation and GASB Adjs. $6,248.717 $6,688.156 $6,949.693 $7,254.663 $7,669.693
Depreciation 1,370.000 1,445.000 1,520.000 1,595.000 1,670.000
OPEB Obligation 918.747 929.883 943.779 962.640 979.780
Environmental Remediation 0.000 0.000 0.000 0.000 0.000
Total Expenses $8,537.464 $9,063.039 $9,413.472 $9,812.303 $10,319.473
Baseline Surplus/(Deficit) ($4,607.042) ($5,033.345) ($5,312.928) ($5,622.541) ($6,038.166)
*Effective 2012, the non-labor account structure of the MTA standard chart of accounts has been adjusted to reflect the reclassification and renaming of certain accounts in order to improve account reporting consistency among the Agencies. These changes, which affect most non-labor accounts presented above, result in nonet-impact to the bottom line. In order to maintain comparability with 2011 actual results for year-end reporting purposes, the 2011 account structure remains unchanged.
MTA NEW YORK CITY TRANSITFebruary Financial Plan 2012 - 2015
Accrual Statement of Operations by Category
($ in millions)

REIMBURSABLE 2011 2012
Final AdoptedEstimate* Budget 2013 2014 2015
Revenue
Fare Revenue
Other Operating Revenue
Capital and Other Reimbursements 914.926 883.028 844.145 840.739 855.336
Total Revenue $914.926 $883.028 $844.145 $840.739 $855.336
Expenses
Labor:
Payroll 373.832 369.029 352.909 349.875 355.147
Overtime 78.536 64.565 63.381 63.109 64.199Total Salaries & Wages $452.368 $433.594 $416.290 $412.984 $419.346
Health and Welfare 22.596 23.614 25.570 27.848 30.310
OPEB Current Payment 0.000 0.000 0.000 0.000 0.000
Pensions 19.061 18.504 18.599 20.093 21.467
Other Fringe Benefits 110.214 108.974 103.196 101.812 103.358
Total Fringe Benefits $151.871 $151.092 $147.365 $149.753 $155.135
Reimbursable Overhead 211.392 197.131 185.296 182.406 185.260
Total Labor Expenses $815.631 $781.817 $748.951 $745.143 $759.741
Non-Labor:
Electric Power $0.000 $0.252 ($0.020) ($0.020) ($0.020)
Fuel $0.026 $0.022 $0.021 $0.021 $0.021
Insurance 0.000 0.000 0.000 0.000 0.000
Claims 0.000 0.000 0.000 0.000 0.000
Paratransit Service Contracts 0.000 0.000 0.000 0.000 0.000
Maintenance and Other Operating Contracts 31.431 33.110 32.722 33.625 33.625
Professional Service Contracts 15.099 16.983 14.652 14.652 14.652
Materials & Supplies 50.474 49.283 46.488 45.989 45.989
Other Business Expenses 2.265 1.561 1.331 1.329 1.328
Total Non-Labor Expenses $99.295 $101.211 $95.194 $95.596 $95.595
Other Expense Adjustments:
Other 0.000 0.000 0.000 0.000 0.000
Total Other Expense Adjustments $0.000 $0.000 $0.000 $0.000 $0.000
Total Expenses Before Depreciation $914.926 $883.028 $844.145 $840.739 $855.336
Depreciation 0.000 0.000 0.000 0.000 0.000
Total Expenses $914.926 $883.028 $844.145 $840.739 $855.336
Baseline Surplus/(Deficit) $0.000 $0.000 $0.000 $0.000 $0.000
*Effective 2012, the non-labor account structure of the MTA standard chart of accounts has been adjusted to reflect the reclassification and renaming of certain accounts in order to improve account reporting consistency among the Agencies. These changes, which affect most non-labor accounts presented above, result in nonet-impact to the bottom line. In order to maintain comparability with 2011 actual results for year-end reporting purposes, the 2011 account structure remains unchanged.
MTA NEW YORK CITY TRANSITFebruary Financial Plan 2012 - 2015
Accrual Statement of Operations by Category($ in millions)

NON-REIMBURSABLE / REIMBURSABLE
2011 2012
Final Adopted
Estimate* Budget 2013 2014 2015
Revenue
Farebox Revenue:
Subway $2,689.411 $2,746.177 $2,784.519 $2,829.559 $2,873.194
Bus 868.384 885.066 891.990 900.720 908.673
Paratransit 14.647 17.003 19.573 22.529 25.928
Fare Media Liability 56.092 56.221 52.221 52.221 52.221
Farebox Revenue $3,628.534 $3,704.467 $3,748.303 $3,805.029 $3,860.016
Other Operating Revenue:
Fare Reimbursement 84.016 84.016 84.016 84.016 84.016
Paratransit Reimbursement 112.063 132.619 155.844 184.374 216.825
Other 105.809 108.592 112.381 116.343 120.450
Other Operating Revenue $301.888 $325.227 $352.241 $384.733 $421.291
Capital and Other Reimbursements 914.926 883.028 844.145 840.739 855.336
Total Revenue $4,845.348 $4,912.722 $4,944.689 $5,030.501 $5,136.643
Expenses
Labor:
Payroll $3,184.936 $3,223.053 $3,208.962 $3,225.956 $3,281.570
Overtime 374.547 326.597 323.155 322.645 327.611
Total Salaries & Wages $3,559.483 $3,549.650 $3,532.117 $3,548.601 $3,609.181
Health and Welfare 538.093 603.166 654.844 714.366 778.101
OPEB Current Payment 283.009 318.496 359.147 395.418 435.482
Pensions 795.841 941.739 947.308 995.579 1,039.569
Other Fringe Benefits 362.673 366.395 366.266 369.736 376.606
Total Fringe Benefits $1,979.616 $2,229.796 $2,327.565 $2,475.099 $2,629.758
Reimbursable Overhead 0.000 0.000 0.000 0.000 0.000
Total Labor Expenses $5,539.099 $5,779.446 $5,859.682 $6,023.700 $6,238.939
Non-Labor:
Electric Power $186.891 $301.283 $335.765 $376.224 $417.770
Fuel 152.479 180.248 191.245 193.563 201.960
Insurance 57.429 68.387 83.227 101.596 124.440
Claims 103.505 95.039 90.116 92.245 96.244
Paratransit Service Contracts 356.043 404.194 468.084 550.025 636.950
Maintenance and Other Operating Contracts 278.211 198.030 203.132 188.380 198.314
Professional Service Contracts 98.858 145.094 144.008 146.404 146.905
Materials & Supplies 329.700 330.085 347.231 350.514 389.385
Other Business Expenses 61.428 69.378 71.348 72.751 74.122
Total Non-Labor Expenses $1,624.544 $1,791.738 $1,934.156 $2,071.702 $2,286.090
Other Expense Adjustments:
Other 0.000 0.000 0.000 0.000 0.000
Total Other Expense Adjustments $0.000 $0.000 $0.000 $0.000 $0.000
Total Expenses before Depreciation and GASB Adjs. $7,163.643 $7,571.184 $7,793.838 $8,095.402 $8,525.029
Depreciation 1,370.000 1,445.000 1,520.000 1,595.000 1,670.000
OPEB Obligation 918.747 929.883 943.779 962.640 979.780
Environmental Remediation 0.000 0.000 0.000 0.000 0.000
Total Expenses $9,452.390 $9,946.067 $10,257.617 $10,653.042 $11,174.809
Baseline Surplus/(Deficit) ($4,607.042) ($5,033.345) ($5,312.928) ($5,622.541) ($6,038.166)
*Effective 2012, the non-labor account structure of the MTA standard chart of accounts has been adjusted to reflect the reclassification and renaming of certain accounts in order to improve account reporting consistency among the Agencies. These changes, which affect most non-labor accounts presented above, result in nonet-impact to the bottom line. In order to maintain comparability with 2011 actual results for year-end reporting purposes, the 2011 account structure remains unchanged.
MTA NEW YORK CITY TRANSITFebruary Financial Plan 2012 - 2015
Accrual Statement of Operations by Category($ in millions)

CASH RECEIPTS AND EXPENDITURES
2011 2012
Final Adopted
Estimate* Budget 2013 2014 2015
Receipts
Fare Revenue 3,640.264 3,702.998 3,758.234 3,809.260 3,864.247
Other Operating Revenue:
Fare Reimbursement 84.016 84.016 84.016 84.016 84.016
Paratransit Reimbursement 112.398 132.464 155.582 184.230 216.550
Other 106.309 109.592 113.381 117.343 121.450
Other Operating Revenue 302.723 326.072 352.979 385.589 422.016
Capital and Other Reimbursements 832.570 1,038.038 851.742 840.945 851.789
Total Receipts $4,775.557 $5,067.108 $4,962.955 $5,035.794 $5,138.052
Expenditures
Labor:
Payroll 3,142.396 3,248.430 3,186.166 3,202.724 3,255.344
Overtime 369.556 329.137 320.873 320.319 324.986
Total Salaries & Wages $3,511.952 $3,577.567 $3,507.039 $3,523.043 $3,580.330
Health and Welfare 580.056 600.406 650.508 709.662 772.997
OPEB Current Payment 283.009 318.496 359.147 395.418 435.482
Pensions 773.403 929.048 934.963 965.183 1,016.079
Other Fringe Benefits 333.857 339.111 336.357 340.891 348.812
Total Fringe Benefits $1,970.325 $2,187.061 $2,280.975 $2,411.154 $2,573.370
GASB Account 26.523 34.370 35.762 35.793 36.432
Reimbursable Overhead 0.000 0.000 0.000 0.000 0.000
Total Labor Expenditures $5,508.800 $5,798.998 $5,823.776 $5,969.990 $6,190.132
Non-Labor:
Electric Power $189.691 $301.283 $335.765 $376.224 $417.770
Fuel 149.779 180.248 191.245 193.563 201.960
Insurance 55.101 71.936 85.032 103.493 129.939
Claims 100.800 87.066 81.869 83.717 85.614
Paratransit Service Contracts 367.943 402.194 466.084 548.025 634.950
Maintenance and Other Operating Contracts 285.111 208.730 213.832 199.080 209.014
Professional Service Contracts 95.382 139.094 138.008 140.404 140.905
Materials & Supplies 288.215 352.085 349.231 352.514 391.385
Other Business Expenditures 61.428 69.378 71.348 72.751 74.122
Total Non-Labor Expenditures $1,593.450 $1,812.014 $1,932.414 $2,069.771 $2,285.659
Other Expenditure Adjustments:
Other 0.000 0.000 0.000 0.000 0.000
Total Other Expenditure Adjustments $0.000 $0.000 $0.000 $0.000 $0.000
Total Expenditures $7,102.250 $7,611.012 $7,756.190 $8,039.761 $8,475.791
Baseline Cash Surplus/(Deficit) ($2,326.693) ($2,543.904) ($2,793.235) ($3,003.967) ($3,337.739)
*Effective 2012, the non-labor account structure of the MTA standard chart of accounts has been adjusted to reflect the reclassification and renaming of certain
accounts in order to improve account reporting consistency among the Agencies. These changes, which affect most non-labor accounts presented above, result in no
net-impact to the bottom line. In order to maintain comparability with 2011 actual results for year-end reporting purposes, the 2011 account structure remains unchanged.
MTA NEW YORK CITY TRANSITFebruary Financial Plan 2012 - 2015
Cash Receipts & Expenditures($ in millions)

CASH FLOW ADJUSTMENTS
2011 2012
Final Adopted
Estimate* Budget 2013 2014 2015
Receipts
Fare Revenue $11.730 ($1.469) $9.931 $4.231 $4.231
Other Operating Revenue:
Fare Reimbursement 0.000 0.000 0.000 0.000 0.000
Paratransit Reimbursement 0.335 (0.155) (0.262) (0.144) (0.275)
Other 0.500 1.000 1.000 1.000 1.000
Other Operating Revenue $0.835 $0.845 $0.738 $0.856 $0.725
Capital and Other Reimbursements (82.356) 155.010 7.597 0.206 (3.547)Total Receipt Adjustments ($69.791) $154.386 $18.266 $5.293 $1.409
Expenditures
Labor:
Payroll $42.540 ($25.377) $22.796 $23.232 $26.226
Overtime 4.991 (2.540) 2.282 2.326 2.625
Health and Welfare (41.963) 2.760 4.336 4.704 5.104
OPEB Current Payment 0.000 0.000 0.000 0.000 0.000
Pensions 22.438 12.691 12.345 30.396 23.490
Other Fringe Benefits 28.816 27.284 29.909 28.845 27.794
Total Fringe Benefits $9.291 $42.735 $46.590 $63.945 $56.388
GASB Account (26.523) (34.370) (35.762) (35.793) (36.432)
Reimbursable Overhead 0.000 0.000 0.000 0.000 0.000Total Labor Expenditures $30.299 ($19.552) $35.906 $53.710 $48.807
Non-Labor:
Electric Power ($2.800) $0.000 $0.000 $0.000 $0.000
Fuel 2.700 0.000 0.000 0.000 0.000
Insurance 2.328 (3.549) (1.805) (1.897) (5.499)
Claims 2.705 7.973 8.247 8.528 10.630
Paratransit Service Contracts (11.900) 2.000 2.000 2.000 2.000
Maintenance and Other Operating Contracts (6.900) (10.700) (10.700) (10.700) (10.700)
Professional Service Contracts 3.476 6.000 6.000 6.000 6.000
Materials & Supplies 41.485 (22.000) (2.000) (2.000) (2.000)
Other Business Expenditures 0.000 0.000 0.000 0.000 0.000Total Non-Labor Expenditures $31.094 ($20.276) $1.742 $1.931 $0.431
Other Expenditures Adjustments:
Other 0.000 0.000 0.000 0.000 0.000Total Other Expenditures Adjustments $0.000 $0.000 $0.000 $0.000 $0.000
Total Cash Conversion Adjustments before Depreciation and GASB Adjs.
($8.398) $114.558 $55.914 $60.934 $50.647
Depreciation Adjustment 1,370.000 1,445.000 1,520.000 1,595.000 1,670.000
OPEB Obligation 918.747 929.883 943.779 962.640 979.780
Environmental Remediation 0.000 0.000 0.000 0.000 0.000
Baseline Total Cash Conversion Adjustments $2,280.349 $2,489.441 $2,519.693 $2,618.574 $2,700.427
*Effective 2012, the non-labor account structure of the MTA standard chart of accounts has been adjusted to reflect the reclassification and renaming of certain
accounts in order to improve account reporting consistency among the Agencies. These changes, which affect most non-labor accounts presented above, result in no
net-impact to the bottom line. In order to maintain comparability with 2011 actual results for year-end reporting purposes, the 2011 account structure remains unchanged.
Cash Conversion (Cash Flow Adjustments)($ in millions)
February Financial Plan 2012 - 2015MTA NEW YORK CITY TRANSIT

MTA NEW YORK CITY TRANSIT2012 Adopted Budget
2012 Non-Reimbursable/Reimbursable Overtime ($ in millions)
NON-REIMBURSABLE OVERTIME Hours $ %
SCHEDULED:Direct Service 3,905,760 $115.102 43.9%
Programmed Maintenance 189,196 5.414 2.1%
Total Scheduled 4,094,956 $120.516 46.0%
UNSCHEDULED:Vacancy/Absentee Coverage 1,031,192 $30.806 11.8%
Weather Emergencies 120,567 3.665 1.4%
Maintenance 1,590,406 49.203 18.8%
Service Delays 1,042,860 32.648 12.5%
Tour Length 253,090 8.282 3.2%
Emergencies 258,964 8.028 3.1%
Safety/Security/Law Enforcement 98,074 2.616 1.0%
All Other ¹ 204,202 6.267 2.4%
Total Unscheduled 4,599,356 $141.516 54.0%
TOTAL NON-REIMBURSABLE OVERTIME: 8,694,312 $262.032 100.0%
REIMBURSABLE OVERTIME 2,026,282 $64.566
TOTAL OVERTIME 10,720,594 $326.598
¹ All other & reimbursable budget and actual includes PTE $ 's only. Does not include hours.
Total

2011Final
Estimate
2012 Adopted Budget 2013 2014 2015
RIDERSHIP
Subway 1,635.471 1,669.289 1,691.613 1,717.838 1,743.245 Bus 665.617 677.433 682.237 688.293 693.811 Paratransit 9.041 10.501 12.077 13.888 15.971
Total Ridership 2,310.129 2,357.223 2,385.927 2,420.019 2,453.027
FAREBOX REVENUE (Excluding fare media liability)
Subway 2,689.411 2,746.177 2,784.519 2,829.559 2,873.194Bus 868.384 885.066 891.990 900.720 908.673Paratransit 14.647 17.003 19.573 22.529 25.928
Total Farebox Revenue $3,572.442 $3,648.246 $3,696.082 $3,752.808 $3,807.795
($ in millions)Ridership/(Utilization)
February Financial Plan 2012 - 2015MTA NEW YORK CITY TRANSIT

2011 2012Final Adopted
Estimate Budget 2013 2014 2015
Administration Office of the President 20 20 20 20 20 Law 266 266 266 266 266 Office of the EVP 41 41 38 38 38 Human Resources 303 181 181 181 181 Office of Management and Budget 39 39 39 39 39 Capital Planning & Budget 31 31 31 31 31 Corporate Communications 245 243 243 243 243 AFC Program Management & Sales 54 54 54 54 54 Technology & Information Services 426 395 391 390 389 Non-Departmental 84 85 85 85 85 Labor Relations 96 96 96 96 96 Materiel 237 234 230 224 224 Controller 145 121 121 121 121
Total Administration 1,987 1,806 1,795 1,788 1,787
Operations Subways Service Delivery 7,391 7,390 7,315 7,314 7,311 Subways Operation Support /Admin 311 311 311 311 311 Subways Stations 2,677 2,693 2,693 2,693 2,693
Subtotal - Subways 10,379 10,394 10,319 10,318 10,315 Buses 10,255 10,294 10,291 10,291 10,291 Paratransit 150 148 148 148 148 Operations Planning 374 376 371 371 371 Revenue Control 423 423 423 423 423
Total Operations 21,581 21,635 21,552 21,551 21,548
Maintenance Subways Operation Support /Admin 169 166 166 166 163 Subways Engineering 313 300 284 258 258 Subways Car Equipment 3,935 4,110 4,173 4,089 4,098 Subways Infrastructure 1,696 1,641 1,633 1,634 1,634 Subways Stations 3,522 3,540 3,533 3,736 3,736 Subways Track 2,747 2,692 2,692 2,692 2,692 Subways Power 659 622 595 596 596 Subways Signals 1,413 1,451 1,407 1,383 1,383 Subways Electronics Maintenance 1,430 1,404 1,399 1,399 1,392
Subtotal - Subways 15,884 15,926 15,882 15,953 15,952 Buses 3,766 3,725 3,733 3,738 3,713 Revenue Control 137 150 150 150 150 Supply Logistics 547 547 546 546 546 System Safety 88 88 88 88 88
Total Maintenance 20,422 20,436 20,399 20,475 20,449
Engineering/Capital Capital Program Management 1,218 1,218 1,218 1,218 1,218
Total Engineering/Capital 1,218 1,218 1,218 1,218 1,218
Public Safety Security 507 504 504 504 504
Total Public Safety 507 504 504 504 504
Baseline Total Positions 45,715 45,599 45,468 45,536 45,506
Non-Reimbursable 40,819 41,071 41,153 41,278 41,262 Reimbursable 4,896 4,528 4,315 4,258 4,244
Total Full-Time 45,561 45,444 45,313 45,381 45,351 Total Full-Time Equivalents 154 155 155 155 155
MTA NEW YORK CITY TRANSITFebruary Financial Plan 2012 - 2015
Non-Reimbursable/Reimbursable and Full-Time/Full-Time Equivalents
Function/Department
Total Positions by Function and Department

2011 2012
Final Adopted
Estimate Budget 2013 2014 2015
Administration Managers/Supervisors 651 618 610 604 603
Professional, Technical, Clerical 1,219 1,072 1,069 1,068 1,068
Operational Hourlies 117 116 116 116 116
Total Administration 1,987 1,806 1,795 1,788 1,787
Operations Managers/Supervisors 2,486 2,516 2,492 2,491 2,488
Professional, Technical, Clerical 365 364 363 363 363
Operational Hourlies 18,730 18,755 18,697 18,697 18,697
Total Operations 21,581 21,635 21,552 21,551 21,548
Maintenance Managers/Supervisors 3,858 3,861 3,838 3,842 3,840
Professional, Technical, Clerical 1,053 1,026 995 986 980
Operational Hourlies 15,511 15,549 15,566 15,647 15,629
Total Maintenance 20,422 20,436 20,399 20,475 20,449
Engineering/Capital Managers/Supervisors 272 272 272 272 272
Professional, Technical, Clerical 944 944 944 944 944
Operational Hourlies 2 2 2 2 2
Total Engineering/Capital 1,218 1,218 1,218 1,218 1,218
Public Safety Managers/Supervisors 128 129 129 129 129
Professional, Technical, Clerical 32 32 32 32 32
Operational Hourlies 347 343 343 343 343
Total Public Safety 507 504 504 504 504
Total Managers/Supervisors 7,395 7,396 7,341 7,338 7,332 Professional, Technical, Clerical 3,613 3,438 3,403 3,393 3,387 Operational Hourlies 34,707 34,765 34,724 34,805 34,787
Baseline Total Positions 45,715 45,599 45,468 45,536 45,506
Function/Occupational Group
MTA NEW YORK CITY TRANSITFebruary Financial Plan 2012 - 2015
Total Positions by Function and Occupation

MTA NEW YORK CITY TRANSITFEBRUARY FINANCIAL PLAN - 2012 ADOPTED BUDGETACCRUAL STATEMENT OF OPERATIONS by CATEGORY
($ in millions)
Jan Feb Mar Apr May Jun Jul Aug Sep Oct Nov Dec TotalOperating RevenueFarebox Revenue:Subway $217.761 $216.031 $235.912 $224.531 $236.482 $232.118 $229.459 $230.430 $222.291 $244.045 $228.811 $228.306 $2,746.177Bus 69.629 68.963 76.213 72.338 77.144 74.389 75.710 76.652 73.856 78.334 71.918 69.920 885.066Paratransit 1.288 1.265 1.439 1.362 1.471 1.419 1.391 1.470 1.408 1.599 1.487 1.404 17.003Fare Media Liability 4.685 4.685 4.685 4.685 4.685 4.685 4.685 4.685 4.685 4.685 4.685 4.686 56.221Farebox Revenue $293.363 $290.944 $318.249 $302.916 $319.782 $312.611 $311.245 $313.237 $302.240 $328.663 $306.901 $304.316 $3,704.467Vehicle Toll Revenue 0.000 0.000 0.000 0.000 0.000 0.000 0.000 0.000 0.000 0.000 0.000 0.000 0.000Other Operating Revenue:Fare Reimbursement 7.722 7.473 9.556 7.353 9.541 6.580 2.909 2.173 6.090 9.463 8.223 6.933 84.016Paratransit Reimbursement 11.051 11.051 11.051 11.051 11.051 11.051 11.051 11.051 11.052 11.053 11.053 11.053 132.619Other 9.049 9.049 9.049 9.049 9.049 9.049 9.050 9.050 9.051 9.051 9.051 9.045 108.592Other Operating Revenue $27.822 $27.573 $29.656 $27.453 $29.641 $26.680 $23.010 $22.274 $26.193 $29.567 $28.327 $27.031 $325.227Capital and Other Reimbursements 0.000 0.000 0.000 0.000 0.000 0.000 0.000 0.000 0.000 0.000 0.000 0.000 0.000Total Revenue $321.185 $318.517 $347.905 $330.369 $349.423 $339.291 $334.255 $335.511 $328.433 $358.230 $335.228 $331.347 $4,029.694
Operating ExpensesLabor:Payroll 244.028 230.462 234.519 229.580 244.917 227.972 241.285 240.851 226.945 240.710 246.186 246.568 2,854.024Overtime 22.092 21.664 21.820 22.167 22.824 21.252 21.793 22.163 20.706 23.031 21.664 20.856 262.032Total Salaries & Wages 266.121 252.126 256.339 251.747 267.741 249.224 263.078 263.014 247.651 263.741 267.850 267.424 3,116.056Health and Welfare 47.527 47.103 47.118 46.964 47.053 47.238 48.930 49.193 48.982 48.907 48.905 51.633 579.552OPEB Current Payment 26.124 25.891 25.899 25.815 25.863 25.965 26.896 27.039 26.923 26.883 26.881 28.317 318.496Pensions 17.893 16.822 17.544 16.817 18.106 16.891 730.899 17.644 16.670 17.730 17.987 18.232 923.235Other Fringe Benefits 22.305 21.107 20.286 21.044 22.214 20.019 23.062 22.134 20.230 21.668 22.110 21.241 257.421Total Fringe Benefits 113.848 110.923 110.847 110.639 113.236 110.113 829.788 116.010 112.805 115.188 115.884 119.423 2,078.704Reimbursable Overhead (15.514) (15.695) (19.471) (15.667) (15.784) (18.941) (14.874) (15.061) (18.082) (15.104) (14.867) (18.072) (197.131)Total Labor Expenses $364.455 $347.354 $347.716 $346.719 $365.194 $340.395 $1,077.991 $363.963 $342.375 $363.824 $368.866 $368.775 $4,997.629
Non-Labor:Electric Power 24.145 27.123 23.263 24.247 22.607 25.121 27.663 24.870 27.901 25.853 24.480 23.756 301.031Fuel 16.250 15.757 17.164 17.507 15.803 13.784 13.264 13.193 13.200 13.929 14.420 15.957 180.226Insurance 5.396 5.396 5.692 5.693 5.764 5.764 5.764 5.764 5.764 5.764 5.811 5.812 68.387Claims 7.917 7.917 7.917 7.917 7.917 7.917 7.917 7.917 7.917 7.917 7.917 7.955 95.039Paratransit Service Contracts 31.108 30.886 34.312 32.842 34.423 34.119 33.141 34.420 33.709 36.731 34.902 33.601 404.194Mtce. and Other Operating Contracts 15.157 13.597 13.600 14.675 14.617 14.812 15.139 15.423 16.342 16.341 16.359 (1.141) 164.920Professional Service Contracts 9.607 8.939 10.972 9.496 9.561 10.865 10.099 10.000 11.481 11.081 11.593 14.418 128.111Materials & Supplies 21.464 25.361 21.587 21.384 21.387 21.597 25.172 25.163 25.375 25.294 25.310 21.706 280.802Other Business Expenses 5.259 5.204 7.681 5.499 5.437 5.525 5.516 5.490 5.437 5.637 5.430 5.702 67.817Total Non-Labor Expenses $136.303 $140.181 $142.186 $139.261 $137.516 $139.503 $143.675 $142.239 $147.128 $148.547 $146.222 $127.766 $1,690.527
Other Expense Adjustments:Other 0.000 0.000 0.000 0.000 0.000 0.000 0.000 0.000 0.000 0.000 0.000 0.000 0.000Total Other Expense Adjustments $0.000 $0.000 $0.000 $0.000 $0.000 $0.000 $0.000 $0.000 $0.000 $0.000 $0.000 $0.000 $0.000
Total Expensesbefore Depreciation, OPEB $500.757 $487.535 $489.903 $485.980 $502.709 $479.899 $1,221.667 $506.202 $489.503 $512.371 $515.089 $496.541 $6,688.156
Depreciation 114.500 115.500 116.500 118.000 119.000 120.000 121.000 122.000 123.000 124.000 125.000 126.500 1,445.000OPEB Account 0.000 0.000 232.471 0.000 0.000 232.471 0.000 0.000 232.471 0.000 0.000 232.471 929.883Environmental Remediation 0.000 0.000 0.000 0.000 0.000 0.000 0.000 0.000 0.000 0.000 0.000 0.000 0.000Total Expenses $615.257 $603.035 $838.873 $603.980 $621.709 $832.369 $1,342.667 $628.202 $844.974 $636.371 $640.089 $855.512 $9,063.039
Net Surplus/(Deficit) ($294.072) ($284.518) ($490.968) ($273.611) ($272.286) ($493.078) ($1,008.412) ($292.691) ($516.541) ($278.141) ($304.861) ($524.165) ($5,033.345)
NON-REIMBURSABLE

MTA NEW YORK CITY TRANSITFEBRUARY FINANCIAL PLAN - 2012 ADOPTED BUDGETACCRUAL STATEMENT OF OPERATIONS by CATEGORY
($ in millions)
Jan Feb Mar Apr May Jun Jul Aug Sep Oct Nov Dec TotalRevenueFarebox Revenue $0.000 $0.000 $0.000 $0.000 $0.000 $0.000 $0.000 $0.000 $0.000 $0.000 $0.000 $0.000 $0.000Vehicle Toll Revenue 0.000 0.000 0.000 0.000 0.000 0.000 0.000 0.000 0.000 0.000 0.000 0.000 0.000Other Operating Revenue 0.000 0.000 0.000 0.000 0.000 0.000 0.000 0.000 0.000 0.000 0.000 0.000 0.000Capital and Other Reimbursements 68.542 69.427 78.574 71.223 71.260 78.270 85.700 69.241 75.513 69.822 68.164 77.293 883.028Total Revenue $68.542 $69.427 $78.574 $71.223 $71.260 $78.270 $85.700 $69.241 $75.513 $69.822 $68.164 $77.293 $883.028
ExpensesLabor:Payroll 29.883 29.691 34.076 30.312 31.019 32.567 29.221 29.776 31.223 30.295 29.177 31.790 369.029Overtime 4.987 4.980 6.059 5.026 5.030 6.097 5.110 5.110 6.198 4.970 4.966 6.032 64.565Total Salaries & Wages 34.870 34.672 40.135 35.338 36.048 38.664 34.331 34.886 37.420 35.265 34.143 37.822 433.594Health and Welfare 1.971 1.918 1.918 1.918 1.938 1.938 1.996 1.996 1.996 1.996 1.996 2.033 23.614OPEB Current Payment 0.000 0.000 0.000 0.000 0.000 0.000 0.000 0.000 0.000 0.000 0.000 0.000 0.000Pensions 0.075 0.075 0.075 0.075 0.075 0.075 17.675 0.075 0.075 0.075 0.075 0.076 18.504Other Fringe Benefits 8.622 8.746 10.309 9.231 8.943 9.938 8.402 8.558 9.501 8.668 8.448 9.607 108.974Total Fringe Benefits 10.669 10.739 12.302 11.224 10.956 11.951 28.074 10.630 11.572 10.739 10.520 11.716 151.092Reimbursable Overhead 15.514 15.695 19.471 15.667 15.784 18.941 14.874 15.061 18.082 15.104 14.867 18.072 197.131Total Labor Expenses $61.052 $61.105 $71.908 $62.229 $62.788 $69.557 $77.279 $60.576 $67.074 $61.108 $59.530 $67.610 $781.817
Non-Labor:Electric Power 0.021 0.021 0.021 0.021 0.020 0.021 0.020 0.021 0.020 0.021 0.020 0.021 0.252Fuel 0.002 0.002 0.002 0.002 0.002 0.002 0.002 0.002 0.002 0.002 0.002 0.002 0.022Insurance 0.000 0.000 0.000 0.000 0.000 0.000 0.000 0.000 0.000 0.000 0.000 0.000 0.000Claims 0.000 0.000 0.000 0.000 0.000 0.000 0.000 0.000 0.000 0.000 0.000 0.000 0.000Paratransit Service Contracts 0.000 0.000 0.000 0.000 0.000 0.000 0.000 0.000 0.000 0.000 0.000 0.000 0.000Mtce. and Other Operating Contracts 2.705 2.837 2.727 2.705 2.837 2.727 2.705 2.837 2.727 2.705 2.853 2.746 33.110Professional Service Contracts 1.031 1.301 1.293 1.665 1.347 1.431 1.356 1.398 1.389 1.418 1.376 1.978 16.983Materials & Supplies 3.438 3.868 4.320 4.308 3.973 4.226 4.045 4.114 3.997 4.275 4.090 4.631 49.283Other Business Expenses 0.292 0.292 (1.695) 0.292 0.293 0.306 0.292 0.292 0.305 0.292 0.293 0.306 1.561Total Non-Labor Expenses $7.489 $8.322 $6.667 $8.994 $8.472 $8.713 $8.421 $8.665 $8.439 $8.713 $8.634 $9.684 $101.211
Other Expense Adjustments:Other 0.000 0.000 0.000 0.000 0.000 0.000 0.000 0.000 0.000 0.000 0.000 0.000 0.000Total Other Expense Adjustments $0.000 $0.000 $0.000 $0.000 $0.000 $0.000 $0.000 $0.000 $0.000 $0.000 $0.000 $0.000 $0.000
Total Expensesbefore Depreciation, OPEB $68.542 $69.427 $78.574 $71.223 $71.260 $78.270 $85.700 $69.241 $75.513 $69.822 $68.164 $77.293 $883.028
Depreciation 0.000 0.000 0.000 0.000 0.000 0.000 0.000 0.000 0.000 0.000 0.000 0.000 0.000OPEB Account 0.000 0.000 0.000 0.000 0.000 0.000 0.000 0.000 0.000 0.000 0.000 0.000 0.000
Total Expenses $68.542 $69.427 $78.574 $71.223 $71.260 $78.270 $85.700 $69.241 $75.513 $69.822 $68.164 $77.293 $883.028
Net Surplus/(Deficit) $0.000 $0.000 $0.000 $0.000 $0.000 $0.000 $0.000 $0.000 $0.000 $0.000 $0.000 $0.000 $0.000
REIMBURSABLE

MTA NEW YORK CITY TRANSITFEBRUARY FINANCIAL PLAN - 2012 ADOPTED BUDGETACCRUAL STATEMENT OF OPERATIONS by CATEGORY
($ in millions)
Jan Feb Mar Apr May Jun Jul Aug Sep Oct Nov Dec TotalRevenueFarebox Revenue:Subway $217.761 $216.031 $235.912 $224.531 $236.482 $232.118 $229.459 $230.430 $222.291 $244.045 $228.811 $228.306 $2,746.177Bus 69.629 68.963 76.213 72.338 77.144 74.389 75.710 76.652 73.856 78.334 71.918 69.920 885.066Paratransit 1.288 1.265 1.439 1.362 1.471 1.419 1.391 1.470 1.408 1.599 1.487 1.404 17.003Fare Media Liability 4.685 4.685 4.685 4.685 4.685 4.685 4.685 4.685 4.685 4.685 4.685 4.686 56.221Farebox Revenue $293.363 $290.944 $318.249 $302.916 $319.782 $312.611 $311.245 $313.237 $302.240 $328.663 $306.901 $304.316 $3,704.467Vehicle Toll Revenue 0.000 0.000 0.000 0.000 0.000 0.000 0.000 0.000 0.000 0.000 0.000 0.000 0.000Other Operating Revenue:Fare Reimbursement 7.722 7.473 9.556 7.353 9.541 6.580 2.909 2.173 6.090 9.463 8.223 6.933 84.016Paratransit Reimbursement 11.051 11.051 11.051 11.051 11.051 11.051 11.051 11.051 11.052 11.053 11.053 11.053 132.619Other 9.049 9.049 9.049 9.049 9.049 9.049 9.050 9.050 9.051 9.051 9.051 9.045 108.592Other Operating Revenue $27.822 $27.573 $29.656 $27.453 $29.641 $26.680 $23.010 $22.274 $26.193 $29.567 $28.327 $27.031 $325.227Capital and Other Reimbursements 68.542 69.427 78.574 71.223 71.260 78.270 85.700 69.241 75.513 69.822 68.164 77.293 883.028Total Revenue $389.727 $387.944 $426.479 $401.592 $420.683 $417.561 $419.955 $404.752 $403.946 $428.052 $403.392 $408.640 $4,912.722
ExpensesLabor:Payroll 273.911 260.154 268.595 259.892 275.936 260.539 270.506 270.627 258.168 271.005 275.363 278.358 3,223.053Overtime 27.080 26.644 27.879 27.193 27.853 27.349 26.903 27.273 26.904 28.001 26.630 26.888 326.597Total Salaries & Wages 300.991 286.798 296.475 287.085 303.789 287.888 297.409 297.900 285.072 299.006 301.993 305.246 3,549.650Health and Welfare 49.498 49.020 49.036 48.881 48.991 49.176 50.927 51.189 50.978 50.903 50.901 53.666 603.166OPEB Current Payment 26.124 25.891 25.899 25.815 25.863 25.965 26.896 27.039 26.923 26.883 26.881 28.317 318.496Pensions 17.968 16.898 17.619 16.892 18.181 16.967 748.575 17.719 16.746 17.806 18.062 18.308 941.739Other Fringe Benefits 30.927 29.853 30.595 30.276 31.157 29.957 31.465 30.692 29.731 30.336 30.559 30.848 366.395Total Fringe Benefits 124.517 121.662 123.149 121.863 124.192 122.064 857.862 126.639 124.378 125.927 126.404 131.139 2,229.796Reimbursable Overhead 0.000 0.000 0.000 0.000 0.000 0.000 0.000 0.000 0.000 0.000 0.000 0.000 0.000Total Labor Expenses $425.507 $408.459 $419.624 $408.948 $427.982 $409.952 $1,155.271 $424.539 $409.449 $424.933 $428.396 $436.385 $5,779.446
Non-Labor:Electric Power 24.166 27.145 23.284 24.269 22.628 25.143 27.683 24.892 27.922 25.874 24.501 23.777 301.283Fuel 16.251 15.759 17.166 17.508 15.805 13.785 13.266 13.194 13.202 13.931 14.422 15.959 180.248Insurance 5.396 5.396 5.692 5.693 5.764 5.764 5.764 5.764 5.764 5.764 5.811 5.812 68.387Claims 7.917 7.917 7.917 7.917 7.917 7.917 7.917 7.917 7.917 7.917 7.917 7.955 95.039Paratransit Service Contracts 31.108 30.886 34.312 32.842 34.423 34.119 33.141 34.420 33.709 36.731 34.902 33.601 404.194Mtce. and Other Operating Contracts 17.862 16.434 16.326 17.380 17.454 17.538 17.845 18.260 19.069 19.046 19.212 1.605 198.030Professional Service Contracts 10.638 10.241 12.264 11.161 10.908 12.295 11.455 11.398 12.870 12.498 12.969 16.396 145.094Materials & Supplies 24.902 29.229 25.906 25.692 25.360 25.824 29.217 29.278 29.372 29.569 29.400 26.337 330.085Other Business Expenses 5.551 5.496 5.986 5.792 5.730 5.831 5.808 5.782 5.742 5.930 5.723 6.008 69.378Total Non-Labor Expenses $143.792 $148.503 $148.853 $148.254 $145.987 $148.216 $152.096 $150.904 $155.567 $157.260 $154.856 $137.450 $1,791.738
Other Expense Adjustments:Other 0.000 0.000 0.000 0.000 0.000 0.000 0.000 0.000 0.000 0.000 0.000 0.000 0.000Total Other Expense Adjustments $0.000 $0.000 $0.000 $0.000 $0.000 $0.000 $0.000 $0.000 $0.000 $0.000 $0.000 $0.000 $0.000
Total Expensesbefore Depreciation, OPEB $569.299 $556.962 $568.477 $557.202 $573.969 $558.168 $1,307.367 $575.443 $565.016 $582.193 $583.252 $573.834 $7,571.184
Depreciation 114.500 115.500 116.500 118.000 119.000 120.000 121.000 122.000 123.000 124.000 125.000 126.500 1,445.000OPEB Account 0.000 0.000 232.471 0.000 0.000 232.471 0.000 0.000 232.471 0.000 0.000 232.471 929.883Environmental Remediation 0.000 0.000 0.000 0.000 0.000 0.000 0.000 0.000 0.000 0.000 0.000 0.000 0.000Total Expenses $683.799 $672.462 $917.448 $675.202 $692.969 $910.639 $1,428.367 $697.443 $920.487 $706.193 $708.252 $932.805 $9,946.067
Net Surplus/(Deficit) ($294.072) ($284.518) ($490.968) ($273.611) ($272.286) ($493.078) ($1,008.412) ($292.691) ($516.541) ($278.141) ($304.861) ($524.165) ($5,033.345)
NON-REIMBURSABLE &REIMBURSABLE

MTA NEW YORK CITY TRANSITFEBRUARY FINANCIAL PLAN - 2012 ADOPTED BUDGET
Jan Feb Mar Apr May Jun Jul Aug Sep Oct Nov Dec TotalReceiptsFarebox Revenue $289.781 $293.752 $320.556 $305.472 $313.976 $315.736 $310.056 $315.659 $299.909 $334.466 $301.160 $302.475 $3,702.998Vehicle Toll Revenue 0.000 0.000 0.000 0.000 0.000 0.000 0.000 0.000 0.000 0.000 0.000 0.000 0.000Other Operating Revenue:Fare Reimbursement 0.000 0.000 0.000 6.312 0.000 43.766 6.312 0.000 0.000 6.313 0.000 21.313 84.016Paratransit Reimbursement 2.185 42.185 2.185 2.185 42.185 2.185 2.185 2.185 28.425 2.185 2.185 2.189 132.464Other 63.334 3.387 3.387 3.387 3.387 3.387 3.387 3.387 3.388 3.388 3.388 12.385 109.592Other Operating Revenue $65.519 $45.572 $5.572 $11.884 $45.572 $49.338 $11.884 $5.572 $31.813 $11.886 $5.573 $35.887 $326.072Capital and Other Reimbursements 78.542 79.427 88.574 85.112 85.148 92.159 99.589 83.130 89.402 83.711 82.053 91.192 1,038.038Total Receipts $433.842 $418.751 $414.702 $402.468 $444.696 $457.233 $421.529 $404.361 $421.124 $430.063 $388.786 $429.554 $5,067.108
ExpendituresLabor:Payroll 240.694 259.634 337.650 237.610 291.883 239.543 284.225 356.279 239.497 243.559 301.159 216.697 3,248.430Overtime 23.899 26.594 34.493 25.059 29.381 25.338 28.217 35.476 25.116 25.373 29.101 21.092 329.137Total Salaries & Wages 264.593 286.228 372.143 262.669 321.264 264.881 312.441 391.755 264.613 268.932 330.259 237.789 3,577.567Health and Welfare 49.498 49.020 49.036 48.881 50.227 49.176 50.927 51.189 50.978 50.903 50.901 49.670 600.406OPEB Current Payment 26.124 25.891 25.899 25.815 25.863 25.965 26.896 27.039 26.923 26.883 26.881 28.317 318.496Pensions 17.968 16.898 17.619 16.892 18.181 321.299 16.463 17.719 16.746 17.806 18.062 433.397 929.048Other Fringe Benefits 25.725 27.356 33.854 25.979 30.043 25.767 30.171 35.327 25.735 25.614 30.242 23.299 339.111Total Fringe Benefits 119.315 119.165 126.408 117.566 124.314 422.206 124.456 131.274 120.382 121.205 126.087 534.683 2,187.061GASB Account 2.644 2.644 3.966 2.644 2.644 2.644 2.644 3.966 2.644 2.644 2.644 2.644 34.370Reimbursable Overhead 0.000 0.000 0.000 0.000 0.000 0.000 0.000 0.000 0.000 0.000 0.000 0.000 0.000Total Labor Expenditures $386.552 $408.037 $502.517 $382.879 $448.222 $689.731 $439.541 $526.995 $387.639 $392.781 $458.990 $775.116 $5,798.998
Non-Labor:Electric Power 24.166 27.145 23.284 24.269 22.628 25.143 27.683 24.892 27.922 25.874 24.501 23.777 301.283Fuel 16.251 15.759 17.166 17.508 15.805 13.785 13.266 13.194 13.202 13.931 14.422 15.959 180.248Insurance (0.021) 8.186 16.330 (0.020) 0.190 16.614 0.004 0.004 15.295 0.004 0.027 15.320 71.936Claims 7.252 7.252 7.252 7.252 7.252 7.252 7.252 7.252 7.252 7.252 7.252 7.290 87.066Paratransit Service Contracts 30.941 30.720 34.145 32.676 34.256 33.952 32.974 34.253 33.542 36.564 34.736 33.435 402.194Mtce. and Other Operating Contracts 17.862 16.434 16.326 17.380 17.454 17.538 17.845 18.260 19.069 19.046 19.212 12.305 208.730Professional Service Contracts 10.638 10.241 10.764 11.161 10.908 10.795 11.455 11.398 11.370 12.498 12.969 14.896 139.094Materials & Supplies 31.719 36.046 32.723 32.509 27.177 25.241 26.234 26.295 26.389 26.586 26.417 34.750 352.085Other Business Expenditures 5.551 5.496 5.986 5.792 5.730 5.831 5.808 5.782 5.742 5.930 5.723 6.008 69.378Total Non-Labor Expenditures $144.361 $157.279 $163.977 $148.527 $141.399 $156.152 $142.522 $141.330 $159.784 $147.686 $145.258 $163.739 $1,812.014
Other Expenditure Adjustments:Other 0.000 0.000 0.000 0.000 0.000 0.000 0.000 0.000 0.000 0.000 0.000 0.000 0.000Total Other Expenditure Adjustment $0.000 $0.000 $0.000 $0.000 $0.000 $0.000 $0.000 $0.000 $0.000 $0.000 $0.000 $0.000 $0.000
Total Expenditures $530.912 $565.315 $666.494 $531.407 $589.621 $845.882 $582.063 $668.325 $547.423 $540.467 $604.248 $938.855 $7,611.012
($97.071) ($146.565) ($251.792) ($128.939) ($144.925) ($388.650) ($160.534) ($263.965) ($126.298) ($110.404) ($215.462) ($509.301) ($2,543.904)Net Cash Deficit
($ in millions)CASH RECEIPTS and EXPENDITURES
CASH RECEIPTS AND EXPENDITURES

MTA NEW YORK CITY TRANSITFEBRUARY FINANCIAL PLAN - 2012 ADOPTED BUDGET
($ in millions)
Jan Feb Mar Apr May Jun Jul Aug Sep Oct Nov Dec TotalReceiptsFarebox Revenue ($3.582) $2.808 $2.307 $2.556 ($5.806) $3.125 ($1.189) $2.422 ($2.331) $5.803 ($5.741) ($1.841) ($1.469)Vehicle Toll Revenue 0.000 0.000 0.000 0.000 0.000 0.000 0.000 0.000 0.000 0.000 0.000 0.000 0.000Other Operating Revenue:Fare Reimbursement (7.722) (7.473) (9.556) (1.041) (9.541) 37.186 3.403 (2.173) (6.090) (3.150) (8.223) 14.380 0.000Paratransit Reimbursement (8.866) 31.134 (8.866) (8.866) 31.134 (8.866) (8.866) (8.866) 17.373 (8.868) (8.868) (8.864) (0.155)Other 54.285 (5.662) (5.662) (5.662) (5.662) (5.662) (5.663) (5.663) (5.663) (5.663) (5.663) 3.340 1.000Other Operating Revenue $37.697 $17.999 ($24.084) ($15.569) $15.931 $22.658 ($11.126) ($16.702) $5.620 ($17.681) ($22.754) $8.856 $0.845Capital and Other Reimbursements 10.000 10.000 10.000 13.889 13.889 13.889 13.889 13.889 13.889 13.889 13.889 13.899 155.010Total Receipt Adjustments $44.115 $30.807 ($11.777) $0.876 $24.014 $39.672 $1.574 ($0.391) $17.178 $2.011 ($14.606) $20.914 $154.386
ExpendituresLabor:Payroll 33.217 0.520 (69.055) 22.282 (15.947) 20.997 (13.719) (85.652) 18.671 27.445 (25.796) 61.661 (25.377)Overtime 3.181 0.050 (6.613) 2.134 (1.527) 2.011 (1.314) (8.203) 1.788 2.628 (2.470) 5.796 (2.540)Total Salaries & Wages 36.398 0.570 (75.668) 24.416 (17.474) 23.008 (15.032) (93.855) 20.459 30.074 (28.266) 67.457 (27.917)Health and Welfare 0.000 0.000 0.000 0.000 (1.236) 0.000 0.000 0.000 0.000 0.000 0.000 3.996 2.760OPEB Current Payment 0.000 0.000 0.000 0.000 0.000 0.000 0.000 0.000 0.000 0.000 0.000 0.000 0.000Pensions 0.000 0.000 0.000 0.000 0.000 (304.332) 732.112 0.000 0.000 0.000 0.000 (415.089) 12.691Other Fringe Benefits 5.202 2.497 (3.259) 4.297 1.114 4.190 1.294 (4.635) 3.996 4.722 0.317 7.549 27.284Total Fringe Benefits 5.202 2.497 (3.259) 4.297 (0.122) (300.142) 733.406 (4.635) 3.996 4.722 0.317 (403.544) 42.735GASB Account (2.644) (2.644) (3.966) (2.644) (2.644) (2.644) (2.644) (3.966) (2.644) (2.644) (2.644) (2.644) (34.370)Reimbursable Overhead 0.000 0.000 0.000 0.000 0.000 0.000 0.000 0.000 0.000 0.000 0.000 0.000 0.000Total Labor Expenditures $38.956 $0.423 ($82.893) $26.069 ($20.240) ($279.778) $715.730 ($102.456) $21.811 $32.152 ($30.593) ($338.731) ($19.552)
Non-Labor:Electric Power 0.000 0.000 0.000 0.000 0.000 0.000 0.000 0.000 0.000 0.000 0.000 0.000 0.000Fuel 0.000 0.000 0.000 0.000 0.000 0.000 0.000 0.000 0.000 0.000 0.000 0.000 0.000Insurance 5.417 (2.790) (10.638) 5.713 5.574 (10.850) 5.760 5.760 (9.531) 5.760 5.784 (9.508) (3.549)Claims 0.664 0.664 0.664 0.664 0.664 0.664 0.664 0.664 0.664 0.664 0.664 0.664 7.973Paratransit Service Contracts 0.167 0.167 0.167 0.167 0.167 0.167 0.167 0.167 0.167 0.167 0.167 0.167 2.000Mtce. and Other Operating Contracts 0.000 0.000 0.000 0.000 0.000 0.000 0.000 0.000 0.000 0.000 0.000 (10.700) (10.700)Professional Service Contracts 0.000 0.000 1.500 0.000 0.000 1.500 0.000 0.000 1.500 0.000 0.000 1.500 6.000Materials & Supplies (6.817) (6.817) (6.817) (6.817) (1.817) 0.583 2.983 2.983 2.983 2.983 2.983 (8.413) (22.000)Other Business Expenditures 0.000 0.000 0.000 0.000 0.000 0.000 0.000 0.000 0.000 0.000 0.000 0.000 0.000Total Non-Labor Expenditures ($0.569) ($8.776) ($15.124) ($0.273) $4.588 ($7.936) $9.574 $9.574 ($4.217) $9.574 $9.598 ($26.290) ($20.276)
Other Expenditure Adjustments:Other 0.000 0.000 0.000 0.000 0.000 0.000 0.000 0.000 0.000 0.000 0.000 0.000 0.000Total Other Expenditure Adjustment $0.000 $0.000 $0.000 $0.000 $0.000 $0.000 $0.000 $0.000 $0.000 $0.000 $0.000 $0.000 $0.000
Total Expenditure Adjustments $38.387 ($8.353) ($98.017) $25.796 ($15.652) ($287.714) $725.304 ($92.882) $17.594 $41.726 ($20.995) ($365.021) ($39.828)
Total Cash Conversion Adj.before Depreciation, OPEB $82.502 $22.454 ($109.794) $26.672 $8.362 ($248.042) $726.878 ($93.273) $34.772 $43.737 ($35.601) ($344.107) $114.558
Depreciation Adjustment 114.500 115.500 116.500 118.000 119.000 120.000 121.000 122.000 123.000 124.000 125.000 126.500 1,445.000OPEB Obligation 0.000 0.000 232.471 0.000 0.000 232.471 0.000 0.000 232.471 0.000 0.000 232.471 929.883Environmental Remediation 0.000 0.000 0.000 0.000 0.000 0.000 0.000 0.000 0.000 0.000 0.000 0.000 0.000Total Cash Conversion Adj. $197.002 $137.954 $239.177 $144.672 $127.362 $104.429 $847.878 $28.727 $390.243 $167.737 $89.399 $14.864 $2,489.441
CASH CONVERSION (CASH FLOW ADJUSTMENTS)
CASH FLOW ADJUSTMENTS

MTA NEW YORK CITY TRANSITFebruary Financial Plan - 2012 Adopted Budget
Overtime - Non-Reimbursable/Reimbursable Basis($ in millions)
NON-REIMBURSABLE
SCHEDULED:Direct Service $9.655 $9.290 $10.044 $9.540 $9.993 $9.621 $9.054 $9.350 $9.190 $10.233 $9.626 $9.505 $115.102
Programmed Maintenance 0.451 0.448 0.454 0.451 0.453 0.452 0.448 0.450 0.449 0.455 0.452 0.452 5.414
Total Scheduled $10.106 $9.738 $10.498 $9.991 $10.446 $10.072 $9.502 $9.800 $9.640 $10.688 $10.078 $9.956 $120.516
UNSCHEDULED:Vacancy/Absentee Coverage 2.489 2.449 2.394 2.655 2.699 2.570 2.667 2.686 2.534 2.724 2.523 2.415 30.806
Weather Emergencies 0.783 0.761 0.784 0.026 0.011 0.021 0.038 0.046 0.042 0.018 0.055 1.081 3.665
Maintenance 4.002 3.965 3.830 4.299 4.401 3.997 4.387 4.416 3.921 4.392 4.000 3.593 49.203
Service Delays 2.719 2.785 2.535 2.874 2.894 2.615 2.882 2.893 2.596 2.887 2.797 2.172 32.648
Tour Length 0.642 0.610 0.529 0.774 0.792 0.652 0.792 0.790 0.636 0.786 0.758 0.522 8.282
Emergencies 0.656 0.661 0.578 0.731 0.746 0.620 0.732 0.736 0.613 0.741 0.689 0.526 8.028
Safety/Security/Law Enforcement 0.218 0.218 0.218 0.218 0.218 0.218 0.218 0.218 0.218 0.218 0.218 0.218 2.616
All Other ¹ 0.476 0.475 0.454 0.601 0.617 0.487 0.574 0.578 0.507 0.577 0.547 0.374 6.267
Total Unscheduled $11.986 $11.926 $11.322 $12.176 $12.378 $11.180 $12.290 $12.364 $11.067 $12.343 $11.586 $10.900 $141.516
TOTAL NON-REIMBURSABLE OVERTIME: $22.092 $21.664 $21.820 $22.167 $22.824 $21.252 $21.793 $22.163 $20.706 $23.031 $21.664 $20.857 $262.032
REIMBURSABLE OVERTIME 4.987 4.980 6.059 5.026 5.030 6.097 5.110 5.110 6.198 4.970 4.966 6.032 64.566
TOTAL NR & R OVERTIME $27.080 $26.644 $27.879 $27.193 $27.853 $27.349 $26.903 $27.273 $26.904 $28.001 $26.630 $26.889 $326.598
¹ All other & reimbursable budget and actual includes PTE $ 's only. Does not include hours.
Jul Aug Sep Oct Nov DecMay TotalJan Feb Mar Apr Jun

MTA NEW YORK CITY TRANSITFebruary Financial Plan - 2012 Adopted Budget
Ridership/(Utilization)
Jan Feb Mar Apr May Jun Jul Aug Sep Oct Nov Dec TotalRidership
Subway 133.409 132.213 145.876 137.981 146.985 140.954 135.210 135.028 134.262 150.106 139.857 137.408 1,669.289Bus 54.068 53.137 60.265 55.919 61.301 56.673 54.130 54.001 55.982 61.881 56.377 53.699 677.433
Subtotal 187.477 185.350 206.141 193.900 208.286 197.627 189.340 189.029 190.244 211.987 196.234 191.107 2,346.722
Paratransit* 0.795 0.781 0.889 0.841 0.908 0.876 0.859 0.908 0.870 0.988 0.919 0.867 10.501
Total Ridership 188.272 186.131 207.030 194.741 209.194 198.503 190.199 189.937 191.114 212.975 197.153 191.974 2,357.223
Farebox Revenue (excluding fare media liability)
Subway 217.761 216.031 235.912 224.531 236.482 232.118 229.459 230.430 222.291 244.045 228.811 228.306 2,746.177Bus 69.629 68.963 76.213 72.338 77.144 74.389 75.710 76.652 73.856 78.334 71.918 69.920 885.066
Subtotal 287.390 284.994 312.125 296.869 313.626 306.507 305.169 307.082 296.147 322.379 300.729 298.226 3,631.243
Paratransit 1.288 1.265 1.439 1.362 1.471 1.419 1.391 1.470 1.408 1.599 1.487 1.404 17.003
Total Farebox Revenue 288.678 286.259 313.564 298.231 315.097 307.926 306.560 308.552 297.555 323.978 302.216 299.630 3,648.246
* Paratransit ridership includes guests and personal care attendants.
(in millions)

Jan Feb Mar Apr May Jun Jul Aug Sep Oct Nov Dec
Administration Office of the President 20 20 20 20 20 20 20 20 20 20 20 20
Law 265 265 265 265 265 265 266 266 266 266 266 266 Office of the EVP 41 41 41 41 41 41 41 41 41 41 41 41
Human Resources 303 303 303 181 181 181 181 181 181 181 181 181 Office of Management and Budget 39 39 39 39 39 39 39 39 39 39 39 39 Capital Planning & Budget 31 31 31 31 31 31 31 31 31 31 31 31 Corporate Communications 243 243 243 243 243 243 243 243 243 243 243 243 AFC Program Management & Sales 54 54 54 54 54 54 54 54 54 54 54 54 Technology & Information Services 426 426 426 397 397 397 395 395 395 395 395 395 Non-Departmental 84 84 84 84 84 84 84 84 84 84 84 85 Labor Relations 96 96 96 96 96 96 96 96 96 96 96 96 Materiel 235 235 235 235 235 235 234 234 234 234 234 234 Controller 145 145 145 121 121 121 121 121 121 121 121 121
Total Administration 1,982 1,982 1,982 1,807 1,807 1,807 1,805 1,805 1,805 1,805 1,805 1,806 Operations Subways Service Delivery 7,412 7,412 7,434 7,413 7,413 7,425 7,404 7,404 7,404 7,367 7,367 7,390 Subways Operations Support./Admin. 312 312 312 312 312 312 312 312 312 312 312 311
Subways Stations 2,682 2,682 2,682 2,682 2,700 2,700 2,700 2,700 2,700 2,682 2,682 2,693 Sub-total - Subways 10,406 10,406 10,428 10,407 10,425 10,437 10,416 10,416 10,416 10,361 10,361 10,394
Buses 10,293 10,293 10,293 10,293 10,330 10,330 10,245 10,245 10,334 10,293 10,293 10,294 Paratransit 148 148 148 148 148 148 148 148 148 148 148 148 Operations Planning 376 376 376 376 376 376 376 376 376 376 376 376 Revenue Control 423 423 423 423 423 423 423 423 423 423 423 423
Total Operations 21,646 21,646 21,668 21,647 21,702 21,714 21,608 21,608 21,697 21,601 21,601 21,635 Maintenance Subways Operations/Support./Admin. 161 161 161 161 161 161 161 161 161 161 161 166 Subways Engineering 298 298 298 298 298 298 299 299 299 299 297 300 Subways Car Equipment 4,126 4,126 4,126 4,125 4,125 4,103 4,110 4,110 4,110 4,110 4,110 4,110 Subways Infrastructure 1,708 1,708 1,712 1,712 1,708 1,712 1,658 1,658 1,658 1,658 1,658 1,641 Subways Stations 3,542 3,542 3,542 3,542 3,554 3,554 3,554 3,554 3,554 3,542 3,542 3,540 Subways Track 2,711 2,711 2,711 2,711 2,711 2,711 2,711 2,711 2,711 2,711 2,711 2,692 Subways Power 609 609 609 609 609 610 610 610 594 594 594 622 Subways Signals 1,447 1,447 1,447 1,447 1,447 1,447 1,447 1,447 1,447 1,447 1,447 1,451 Subways Electronics Maintenance 1,427 1,427 1,424 1,424 1,413 1,413 1,404 1,404 1,404 1,404 1,404 1,404 Sub-total - Subways 16,029 16,029 16,030 16,029 16,026 16,009 15,954 15,954 15,938 15,926 15,924 15,926
Buses 3,740 3,740 3,740 3,740 3,740 3,740 3,738 3,738 3,738 3,738 3,738 3,725 Revenue Control 137 137 137 137 137 137 150 150 150 150 150 150 Supply Logistics 547 547 547 547 547 547 547 547 547 547 547 547 System Safety 88 88 88 88 88 88 88 88 88 88 88 88
Total Maintenance 20,541 20,541 20,542 20,541 20,538 20,521 20,477 20,477 20,461 20,449 20,447 20,436 Engineering/Capital
Capital Program Management 1,218 1,218 1,218 1,218 1,218 1,218 1,218 1,218 1,218 1,218 1,218 1,218 Total Engineering/Capital 1,218 1,218 1,218 1,218 1,218 1,218 1,218 1,218 1,218 1,218 1,218 1,218
Public Safety Security 504 504 504 504 504 504 504 504 504 504 504 504
Total Public Safety 504 504 504 504 504 504 504 504 504 504 504 504
Total Positions 45,891 45,891 45,914 45,717 45,769 45,764 45,612 45,612 45,685 45,577 45,575 45,599
Non-Reimbursable 41,220 41,220 41,231 41,065 41,128 41,123 41,071 41,071 41,160 41,082 41,082 41,071Reimbursable 4,671 4,671 4,683 4,652 4,641 4,641 4,541 4,541 4,525 4,495 4,493 4,528
Total Full-Time 45,737 45,737 45,760 45,563 45,615 45,610 45,457 45,457 45,530 45,422 45,420 45,444 Total Full-Time Equivalents 154 154 154 154 154 154 155 155 155 155 155 155
Function/Department
Total Positions by Function and Department
MTA NEW YORK CITY TRANSITFebruary Financial Plan - 2012 Adopted Budget
Non-Reimbursable/Reimbursable and Full-Time/Full-Time Equivalents

FUNCTION/OCCUPATIONAL GROUP Jan Feb Mar Apr May Jun Jul Aug Sep Oct Nov Dec
AdministrationManagers/Supervisors 648 648 648 619 619 619 618 618 618 618 618 618 Professional, Technical, Clerical 1,217 1,217 1,217 1,072 1,072 1,072 1,071 1,071 1,071 1,071 1,071 1,072 Operational Hourlies 117 117 117 116 116 116 116 116 116 116 116 116
Total Administration 1,982 1,982 1,982 1,807 1,807 1,807 1,805 1,805 1,805 1,805 1,805 1,806Operations
Managers/Supervisors 2,508 2,508 2,508 2,508 2,508 2,508 2,508 2,508 2,508 2,508 2,508 2,516 Professional, Technical, Clerical 363 363 363 363 363 363 363 363 363 363 363 364 Operational Hourlies 18,775 18,775 18,797 18,776 18,831 18,843 18,737 18,737 18,826 18,730 18,730 18,755
Total Operations 21,646 21,646 21,668 21,647 21,702 21,714 21,608 21,608 21,697 21,601 21,601 21,635Maintenance
Managers/Supervisors 3,745 3,745 3,746 3,746 3,745 3,745 3,730 3,730 3,728 3,728 3,728 3,861 Professional, Technical, Clerical 1,047 1,047 1,044 1,044 1,038 1,038 1,034 1,034 1,034 1,034 1,032 1,026 Operational Hourlies 15,749 15,749 15,752 15,751 15,755 15,738 15,713 15,713 15,699 15,687 15,687 15,549
Total Maintenance 20,541 20,541 20,542 20,541 20,538 20,521 20,477 20,477 20,461 20,449 20,447 20,436Engineering/Capital
Managers/Supervisors 272 272 272 272 272 272 272 272 272 272 272 272 Professional, Technical, Clerical 944 944 944 944 944 944 944 944 944 944 944 944 Operational Hourlies 2 2 2 2 2 2 2 2 2 2 2 2
Total Engineering/Capital 1,218 1,218 1,218 1,218 1,218 1,218 1,218 1,218 1,218 1,218 1,218 1,218Public Safety
Managers/Supervisors 129 129 129 129 129 129 129 129 129 129 129 129 Professional, Technical, Clerical 32 32 32 32 32 32 32 32 32 32 32 32 Operational Hourlies 343 343 343 343 343 343 343 343 343 343 343 343
Total Public Safety 504 504 504 504 504 504 504 504 504 504 504 504
Total PositionsManagers/Supervisors 7,302 7,302 7,303 7,274 7,273 7,273 7,257 7,257 7,255 7,255 7,255 7,396Professional, Technical, Clerical 3,603 3,603 3,600 3,455 3,449 3,449 3,444 3,444 3,444 3,444 3,442 3,438Operational Hourlies 34,986 34,986 35,011 34,988 35,047 35,042 34,911 34,911 34,986 34,878 34,878 34,765
Total Positions 45,891 45,891 45,914 45,717 45,769 45,764 45,612 45,612 45,685 45,577 45,575 45,599
MTA NEW YORK CITY TRANSITFebruary Financial Plan - 2012 Adopted Budget
Total Positions by Function and Occupation

[THIS PAGE INTENTIONALLY LEFT BLANK]

MTA Bus Company

MTA BUS COMPANY FEBRUARY FINANCIAL PLAN FOR 2012-2015
2011 FINAL ESTIMATE AND 2012 ADOPTED BUDGET In accordance with MTA-approved budget procedures, the following information presents MTA Bus Company’s 2011 Final Estimate, 2012 Adopted Budget and the Financial Plan for 2012-2015. The adopted budget reflects the inclusion of MTA Adjustments that were presented in the November Financial Plan, which were adopted by the Board in December 2011, as well as technical adjustments. These adjustments are presented on the attached reconciliation from the November Financial Plan and are described below:
Three-year zero savings initiative impact for Represented employees: $4.2 million in 2014 and $5.7 million in 2015.
Non-represented wage freeze savings: $0.9 million in 2011 and 2012, and $0.8 million in 2013 through 2015.
Accelerated zero savings initiative for Represented employees: $1.1M in 2011, $5.4 million in 2012, $5.9 million in 2013, $1.7 million in 2014 and $0.4 million in 2015.
Revised inflation assumptions, which result in net Fuel savings of $0.7 million in 2011 and $2.7 million in 2012 through 2015, as well as Non-Revenue Fuel savings of $0.3 million in 2011, and $1.4 million in 2012 through 2015.
New MTA Efficiencies are projected to result in savings of $0.6 million in 2011, and $0.2 million each year thereafter.
Effective 2012, the non-labor account structure of the MTA standard chart of accounts has been adjusted to reflect the reclassification and renaming of certain accounts in order to improve account reporting consistency among the Agencies. These changes, which affect most non-labor accounts presented on the attached tables, result in no net-impact to the bottom line. In order to maintain comparability with 2011 actual results for year-end reporting purposes, the 2011 account structure remains unchanged.
Technical adjustments include a departmental shift of 8 positions from various departments and some minor shifts within Administration which does not impact total positions.
This submission also includes schedules detailing the monthly allocation of financial, headcount and utilization data based on the 2012 Adopted Budget for the purpose of reporting actual results on a monthly basis to the Board.

Positions Dollars Positions Dollars Positions Dollars Positions Dollars Positions Dollars
2011 November Financial Plan: Baseline Net Surplus/(Deficit) 3,462 ($422.674) 3,462 ($437.754) 3,454 ($442.890) 3,443 ($455.953) 3,527 ($493.304)
Technical Adjustments:
Sub-Total Technical Adjustments 0 $0.000 0 $0.000 0 $0.000 0 $0.000 0 $0.000
MTA Plan Adjustments:
Labor: 3 Zeros Salary/Wage Initiative $0.926 $0.924 $0.828 $5.036 $6.510 Accelerate 3 Zeros 1.081 5.384 5.929 1.666 0.405New MTA Efficiencies 0.583 0.202 0.202 0.202 0.202Energy/Other Reimbursements 0.957 4.174 4.174 4.174 4.174
Sub-Total MTA Plan Adjustments 0 $3.547 0 $10.684 0 $11.133 0 $11.078 0 $11.291
2012 February Financial Plan: Baseline Net Surplus/(Deficit) 3,462 (419.127)$ 3,462 (427.070)$ 3,454 (431.757)$ 3,443 (444.875)$ 3,527 (482.013)$
MTA BUS COMPANY
2015
February Financial Plan 2012 - 2015Reconciliation to the November Plan (Accrual) Non-Reimbursable
($ in millions)
Favorable/(Unfavorable)2011 2012 2013 2014

Positions Dollars Positions Dollars Positions Dollars Positions Dollars Positions Dollars
2011 November Financial Plan: Baseline Net Surplus/(Deficit) 63 $0.000 64 $0.000 64 $0.000 64 $0.000 64 $0.000
Technical Adjustments:
Sub-Total Technical Adjustments 0 $0.000 0 $0.000 0 $0.000 0 $0.000 0 $0.000
MTA Plan Adjustments
Labor: 3 Zeros Salary/Wage Initiative Accelerate 3 Zeros New MTA EfficienciesEnergy/Other Reimbursements
Sub-Total MTA Plan Adjustments 0 $0.000 0 $0.000 0 $0.000 0 $0.000 0 $0.000
2012 February Financial Plan: Baseline Net Surplus/(Deficit) 63 $0.000 64 $0.000 64 $0.000 64 $0.000 64 $0.000
MTA BUS COMPANYFebruary Financial Plan 2012 - 2015
Reconciliation to the November Plan (Accrual) Reimbursable($ in millions)
Favorable/(Unfavorable)2011 2012 2013 2014 2015

Positions Dollars Positions Dollars Positions Dollars Positions Dollars Positions Dollars
2011 November Financial Plan: Baseline Net Surplus/(Deficit) 3,525 ($352.518) 3,526 ($344.783) 3,518 ($338.355) 3,507 ($352.651) 3,591 ($388.102)
Technical Adjustments:
Sub-Total Technical Adjustments 0 $0.000 0 $0.000 0 $0.000 0 $0.000 0 $0.000
MTA Plan Adjustments:
Labor: 3 Zeros Salary/Wage Initiative 0 $0.926 0 $0.924 0 $0.828 0 $5.036 0 $6.510 Accelerate 3 Zeros 0 1.081 0 5.384 0 5.929 0 1.666 0 0.405New MTA Efficiencies 0 0.583 0 0.202 0 0.202 0 0.202 0 0.202Energy/Other Reimbursements 0 0.957 0 4.174 0 4.174 0 4.174 0 4.174
Sub-Total MTA Plan Adjustments 0 $3.547 0 $10.684 0 $11.133 0 $11.078 0 $11.291
2012 February Financial Plan: Baseline Net Surplus/(Deficit) 3,525 (348.971)$ 3,526 (334.099)$ 3,518 (327.222)$ 3,507 (341.573)$ 3,591 (376.811)$
MTA BUS COMPANYFebruary Financial Plan 2012 - 2015
Reconciliation to the November Plan - (Cash)($ in millions)
Favorable/(Unfavorable)2011 2012 2013 2014 2015

NON-REIMBURSABLE Final FebruaryProposed New MTA Energy/ New All Adopted
Budget Labor Efficiencies Other Reimb. COA Other Budget
RevenueFarebox Revenue $180.168 $0.000 $0.000 $0.000 $0.000 $0.000 $180.168Toll Revenue - 0.000Other Operating Revenue 19.019 19.019Capital and Other Reimbursements - 0.000Total Revenue $199.187 $0.000 $0.000 $0.000 $0.000 $0.000 $199.187
ExpensesLabor:Payroll $227.302 ($4.509) $222.793Overtime 41.568 (0.785) 0.000 40.783Health and Welfare 44.118 0.000 44.118OPEB Current Payment 14.586 0.000 14.586Pensions 43.722 (0.573) 0.000 43.149Other Fringe Benefits 23.242 (0.442) 0.000 22.800Reimbursable Overhead - 0.000 0.000Total Labor Expenses $394.538 ($6.308) $0.000 $0.000 $0.000 $0.000 $388.230
Non-Labor:Electric Power $0.000 $0.000 $0.000 $0.000 $0.000 $0.000 $0.000Fuel 38.582 0.000 0.000 (4.174) 0.000 0.000 34.408Insurance 14.668 14.668Claims 25.000 25.000Paratransit Service Contracts - Maintenance and Other Operating Contracts 28.440 28.440Professional Service Contracts 6.907 (0.202) 6.705Materials & Supplies 26.904 0.000 26.904Other Business Expenses 4.252 4.252Total Non-Labor Expenses $144.753 $0.000 ($0.202) (4.174) 0.000 0.000 140.377
Other Expense Adjustments:OtherTotal Other Expense Adjustments $0.000 $0.000 $0.000 0.000 0.000 0.000 0.000
Total Expenses before Non-Cash Liability Adjustments $539.291 ($6.308) ($0.202) ($4.174) $0.000 $0.000 528.607
Depreciation $42.235 $0.000 $0.000 $0.000 $0.000 $0.000 $42.235OPEB Obligation 55.415 55.415Environmental Remediation - 0.000
Total Expenses $636.941 ($6.308) ($0.202) ($4.174) $0.000 $0.000 $626.257
Baseline Surplus/(Deficit) ($437.754) $6.308 $0.202 $4.174 $0.000 $0.000 ($427.070)
- Differences are due to rounding.
MTA BUS COMPANY2012 February Adopted Budget
($ in millions)
MTA Plan Adjustments2012
Reconciliation to the 2012 Final Proposed Budget vs. 2012 Adopted Budget by Generic Category (Accrual and Cash)

REIMBURSABLE
Final FebruaryProposed New MTA Energy/ New All Adopted
Budget Labor Efficiencies Other Reimb. COA Other BudgetRevenueFarebox Revenue $0.000 $0.000 $0.000 $0.000 $0.000 $0.000 $0.000Toll Revenue 0.000Other Operating Revenue 0.000Capital and Other Reimbursements 7.727 7.727Total Revenue $7.727 $0.000 $0.000 $0.000 $0.000 $0.000 $7.727
ExpensesLabor:Payroll $5.718 $0.000 $0.000 $0.000 $0.000 $0.000 $5.718Overtime - 0.000Health and Welfare 1.052 1.052OPEB Current Payment - 0.000Pensions 0.492 0.492Other Fringe Benefits 0.465 0.465Reimbursable Overhead - 0.000Total Labor Expenses $7.727 $0.000 $0.000 $0.000 $0.000 $0.000 $7.727
Non-Labor:Electric Power $0.000 $0.000 $0.000 $0.000 $0.000 $0.000 $0.000Fuel 0.000 0.000 0.000 0.000 0.000 0.000 0.000Insurance 0.000Claims 0.000Paratransit Service Contracts 0.000Maintenance and Other Operating Contracts 0.000Professional Service Contracts 0.000Materials & Supplies 0.000Other Business Expenses 0.000Total Non-Labor Expenses $0.000 $0.000 $0.000 $0.000 $0.000 $0.000 $0.000
Other Expense Adjustments:Other 0.000 0.000 0.000 0.000 0.000 0.000 0.000Total Other Expense Adjustments $0.000 $0.000 $0.000 $0.000 $0.000 $0.000 $0.000
Total Expenses before Depreciation $7.727 $0.000 $0.000 $0.000 $0.000 $0.000 $7.727
Depreciation 0.000 0.000 0.000 0.000 0.000 0.000 0.000
Total Expenses $7.727 $0.000 $0.000 $0.000 $0.000 $0.000 $7.727
Baseline Surplus/(Deficit) $0.000 $0.000 $0.000 $0.000 $0.000 $0.000 $0.000
- Differences are due to rounding.
MTA BUS COMPANY
2012
2012 February Adopted BudgetReconciliation to the 2012 Final Proposed Budget vs. 2012 Adopted Budget by Generic Category (Accrual and Cash)
($ in millions)
MTA Plan Adjustments

NON-REIMBURSABLE/REIMBURSABLE
Final FebruaryProposed New MTA Energy/ New All Adopted
Budget Labor Efficiencies Other Reimb. COA Other BudgetRevenueFarebox Revenue $180.168 $0.000 $0.000 $0.000 $0.000 $0.000 $180.168Toll Revenue 0.000 0.000 0.000 0.000 0.000 0.000 0.000Other Operating Revenue 19.019 0.000 0.000 0.000 0.000 0.000 19.019Capital and Other Reimbursements 7.727 0.000 0.000 0.000 0.000 0.000 7.727Total Revenue $206.914 $0.000 $0.000 $0.000 $0.000 $0.000 $206.914
ExpensesLabor:Payroll $233.021 ($4.509) $0.000 $0.000 $0.000 $0.000 $228.512Overtime 41.568 (0.785) 0.000 0.000 0.000 0.000 40.783Health and Welfare 45.170 0.000 0.000 0.000 0.000 0.000 45.170OPEB Current Payment 14.586 0.000 0.000 0.000 0.000 0.000 14.586Pensions 44.214 (0.573) 0.000 0.000 0.000 0.000 43.641Other Fringe Benefits 23.707 (0.442) 0.000 0.000 0.000 0.000 23.266Reimbursable Overhead 0.000 0.000 0.000 0.000 0.000 0.000 0.000Total Labor Expenses $402.265 ($6.308) $0.000 $0.000 $0.000 $0.000 $395.957
Non-Labor:Electric Power $0.000 $0.000 $0.000 $0.000 $0.000 $0.000 0.000Fuel 38.582 0.000 0.000 (4.174) 0.000 0.000 34.408Insurance 14.668 0.000 0.000 0.000 0.000 0.000 14.668Claims 25.000 0.000 0.000 0.000 0.000 0.000 25.000Paratransit Service Contracts 0.000 0.000 0.000 0.000 0.000 0.000 0.000Maintenance and Other Operating Contracts 28.440 0.000 0.000 0.000 0.000 0.000 28.440Professional Service Contracts 6.907 0.000 (0.202) 0.000 0.000 0.000 6.705Materials & Supplies 26.904 0.000 0.000 0.000 0.000 0.000 26.904Other Business Expenses 4.251 0.000 0.000 0.000 0.000 0.000 4.251Total Non-Labor Expenses $144.753 $0.000 ($0.202) ($4.174) $0.000 $0.000 $140.377
Other Expense Adjustments:Other 0.000 0.000 0.000 0.000 0.000 0.000 0.000Total Other Expense Adjustments $0.000 $0.000 $0.000 $0.000 $0.000 $0.000 $0.000
Total Expenses before Non-Cash Liability Adjustments $547.018 ($6.308) ($0.202) ($4.174) $0.000 $0.000 $536.334
Depreciation $42.235 $0.000 $0.000 $0.000 $0.000 $0.000 $42.235OPEB Obligation 55.415 0.000 0.000 0.000 0.000 0.000 55.415Environmental Remediation 0.000 0.000 0.000 0.000 0.000 0.000 0.000
Total Expenses $644.668 ($6.308) ($0.202) ($4.174) $0.000 $0.000 $633.984
Baseline Surplus/(Deficit) ($437.754) $6.308 $0.202 $4.174 $0.000 $0.000 ($427.070)
- Differences are due to rounding.
2012
Reconciliation to the 2012 Final Proposed Budget vs. 2012 Adopted Budget by Generic Category (Accrual and Cash) 2012 February Adopted Budget
($ in millions)
MTA BUS COMPANY
MTA Plan Adjustments

CASH RECEIPTS & EXPENDITURES
Final FebruaryProposed New MTA Energy/ New All Adopted
Budget Labor Efficiencies Other Reimb. COA Other BudgetReceiptsFarebox Revenue $180.168 $0.000 $0.000 $0.000 $0.000 $0.000 $180.168Toll Revenue 0.000 0.000 0.000Other Operating Revenue 19.019 0.000 19.019Capital and Other Reimbursements 11.838 0.000 11.838Total Receipts $211.025 $0.000 $0.000 $0.000 $0.000 $0.000 $211.025
ExpendituresLabor:Payroll $246.136 ($4.509) $0.000 $0.000 $0.000 $0.000 $241.627Overtime 41.568 (0.785) 0.000 40.783Health and Welfare 44.766 0.000 0.000 44.766OPEB Current Payment 14.586 0.000 0.000 14.586Pensions 44.040 (0.573) 0.000 43.467Other Fringe Benefits 23.542 (0.442) 0.000 23.100GASB Account 4.317 0.000 4.317Reimbursable Overhead 0.000 0.000 0.000Total Labor Expenditures $418.955 ($6.308) $0.000 $0.000 $0.000 $0.000 $412.647
Non-Labor:Electric Power $0.000 $0.000 $0.000 $0.000 $0.000 $0.000 $0.000Fuel 38.582 0.000 0.000 (4.174) 0.000 0.000 34.408Insurance 14.668 0.000 14.668Claims 17.100 0.000 17.100Paratransit Service Contracts 0.000 0.000 0.000Maintenance and Other Operating Contracts 28.440 0.000 28.440Professional Service Contracts 6.907 (0.202) 0.000 6.705Materials & Supplies 26.904 0.000 26.904Other Business Expenditures 4.252 0.000 4.252Total Non-Labor Expenditures $136.853 $0.000 ($0.202) ($4.174) $0.000 $0.000 $132.477
Other Expenditure Adjustments:Other 0.000 0.000Total Other Expenditure Adjustments $0.000 $0.000 $0.000 $0.000 $0.000 $0.000 $0.000
Total Expenditures $555.808 ($6.308) ($0.202) ($4.174) $0.000 $0.000 $545.124
Baseline Cash Deficit ($344.783) $6.308 $0.202 $4.174 $0.000 $0.000 ($334.099)
- Differences are due to rounding.
2012MTA Plan Adjustments
2012 February Adopted BudgetMTA BUS COMPANY
Reconciliation to the 2012 Final Proposed Budget vs. 2012 Adopted Budget by Generic Category (Accrual and Cash) ($ in millions)

CASH FLOW ADJUSTMENTS
Final FebruaryProposed New MTA Energy/ New All Adopted
Budget Labor Efficiencies Other Reimb. COA Other BudgetReceiptsFarebox Revenue $0.000 $0.000 $0.000 $0.000 $0.000 $0.000 $0.000Toll Revenue 0.000 0.000 0.000 0.000 0.000 0.000 0.000Other Operating Revenue 0.000 0.000 0.000 0.000 0.000 0.000 0.000Capital and Other Reimbursements 4.111 0.000 0.000 0.000 0.000 0.000 4.111Total Receipt Adjustments $4.111 $0.000 $0.000 $0.000 $0.000 $0.000 $4.111
ExpendituresLabor:Payroll ($13.116) $0.000 $0.000 $0.000 $0.000 $0.000 ($13.116)Overtime 0.000 0.000 0.000 0.000 0.000 0.000 0.000Health and Welfare 0.403 0.000 0.000 0.000 0.000 0.000 0.403OPEB Current Payment 0.000 0.000 0.000 0.000 0.000 0.000 0.000Pensions 0.174 0.000 0.000 0.000 0.000 0.000 0.174Other Fringe Benefits 0.165 0.000 0.000 0.000 0.000 0.000 0.165GASB Account (4.317) 0.000 0.000 0.000 0.000 0.000 (4.317)Reimbursable Overhead 0.000 0.000 0.000 0.000 0.000 0.000 0.000Total Labor Expenditures ($16.690) $0.000 $0.000 $0.000 $0.000 $0.000 ($16.690)
Non-Labor:Electric Power $0.000 $0.000 $0.000 $0.000 $0.000 $0.000 $0.000Fuel 0.000 0.000 0.000 0.000 0.000 0.000 0.000Insurance 0.000 0.000 0.000 0.000 0.000 0.000 0.000Claims 7.900 0.000 0.000 0.000 0.000 0.000 7.900Paratransit Service Contracts 0.000 0.000 0.000 0.000 0.000 0.000 0.000Maintenance and Other Operating Contracts 0.000 0.000 0.000 0.000 0.000 0.000 0.000Professional Service Contracts 0.000 0.000 0.000 0.000 0.000 0.000 0.000Materials & Supplies 0.000 0.000 0.000 0.000 0.000 0.000 0.000Other Business Expenditures 0.000 0.000 0.000 0.000 0.000 0.000 0.000Total Non-Labor Expenditures $7.900 $0.000 $0.000 $0.000 $0.000 $0.000 7.900
Other Expenditure Adjustments:Other 0.000 0.000 0.000 0.000 0.000 0.000 0.000Total Other Expenditure Adjustments $0.000 $0.000 $0.000 $0.000 $0.000 $0.000 $0.000
Total Expenditure Adjustments $0.000 $0.000 $0.000 $0.000 $0.000 $0.000 $0.000
Total Cash Conversion Adjustments beforeNon-Cash Liability Adjs. ($4.678) $0.000 $0.000 $0.000 $0.000 $0.000 ($4.678)
Depreciation Adjustment $42.235 $0.000 $0.000 $0.000 $0.000 $0.000 $42.235OPEB Obligation 55.415 0.000 0.000 0.000 0.000 0.000 55.415Environmental Remediation 0.000 0.000 0.000 0.000 0.000 0.000 0.000
Total Cash Conversion Adjustments $92.972 $0.000 $0.000 $0.000 $0.000 $0.000 $92.972
- Differences are due to rounding.
2012 February Adopted Budget
MTA Plan Adjustments2012
MTA BUS COMPANY
Reconciliation to the 2012 Final Proposed Budget vs. 2012 Adopted Budget by Generic Category (Accrual and Cash) ($ in millions)

NON-REIMBURSABLE 2011 2012
Final Adopted
Estimate * Budget 2013 2014 2015
Operating Revenue
Farebox Revenue $177.351 $180.168 $181.879 $183.956 $185.964
Other Operating Revenue 18.841 19.019 19.391 19.771 20.169
Capital and Other Reimbursements - - - - -
Total Revenue $196.192 $199.187 $201.270 $203.727 $206.133
Operating Expenses
Labor:
Payroll $222.645 $222.793 222.181 $221.856 $234.801
Overtime 43.886 40.783 39.795 39.186 40.509
Health and Welfare 37.129 44.118 48.765 53.888 60.829
OPEB Current Payment 13.892 14.586 15.315 16.081 16.885
Pensions 33.847 43.150 45.395 45.676 46.376
Other Fringe Benefits 22.551 22.800 23.200 22.353 23.464
Reimbursable Overhead - - - - -
Total Labor Expenses $373.949 $388.230 $394.651 $399.040 $422.864
Non-Labor:
Traction and Propulsion Power
Fuel for Buses and Trains $36.844 $34.408 $35.912 $35.695 $35.843
Insurance 13.291 14.668 16.135 19.791 19.523
Claims 24.000 25.000 26.000 27.000 28.000
Paratransit Service Contracts - - - - -
Maintenance and Other Operating Contracts 26.864 28.440 22.779 27.416 33.727
Professional Service Contracts 6.267 6.705 6.920 9.421 9.574
Materials & Supplies 32.248 26.904 27.928 28.611 36.186
Other Business Expenses 4.993 4.251 4.172 2.474 2.532
Total Non-Labor Expenses $144.506 $140.377 $139.845 $150.408 $165.385
Other Expenses Adjustments:
Other - - - - -
Total Other Expense Adjustments $0.000 $0.000 $0.000 $0.000 $0.000
Total Expenses before Depreciation & GASB Adj. $518.455 $528.607 $534.497 $549.448 $588.249
Depreciation $42.235 $42.235 $42.235 $42.235 $42.235
OPEB Obligation 54.630 55.415 56.296 56.919 57.663
Environmental Remediation - - - - -
Total Expenses $615.320 $626.257 $633.027 $648.602 $688.146
Baseline Surplus/(Deficit) ($419.127) ($427.070) ($431.757) ($444.875) ($482.013)
MTA BUS COMPANYFebruary Financial Plan 2012 - 2015
Accrual Statement of Operations by Category
($ in millions)
*Effective 2012, the non‐labor account structure of the MTA standard chart of accounts has been adjusted to reflect the reclassification and renaming of certain accounts in order to improve account reporting consistency among the Agencies. These changes, which affect most non‐labor accounts presented on the attached tables, result in no net‐impact to the bottom line. In order to maintain comparability with 2011 actual results for year‐end reporting purposes, the 2011 account structure remains unchanged.

REIMBURSABLE2011 2012Final Adopted
Estimate * Budget 2013 2014 2015RevenueFarebox Revenue - - - - - Other Operating Revenue - - - - - Capital and Other Reimbursements 7.191 7.727 7.406 7.516 7.625
Total Revenue $7.191 $7.727 $7.406 $7.516 $7.625
ExpensesLabor:Payroll $5.337 $5.718 $5.490 $5.572 $5.655Overtime - - - - - Health and Welfare 0.974 1.052 1.008 1.023 1.038 OPEB Current Payment - - - - - Pensions 0.449 0.492 0.461 0.465 0.470 Other Fringe Benefits 0.432 0.466 0.448 0.456 0.462 Reimbursable Overhead - - - - -
Total Labor Expenses $7.191 $7.727 $7.406 $7.516 $7.625
Non-Labor:Traction and Propulsion Power Fuel for Buses and Trains - - - - - Insurance - - - - - Claims - - - - - Paratransit Service Contracts - - - - - Maintenance and Other Operating Contracts - - - - - Professional Service Contracts - - - - - Materials & Supplies - - - - - Other Business Expenses - - - - -
Total Non-Labor Expenses $0.000 $0.000 $0.000 $0.000 $0.000
Other Expenses Adjustments:Other - - - - -
Total Other Expense Adjustments $0.000 $0.000 $0.000 $0.000 $0.000
Total Expenses before Depreciation & GASB Adj. $7.191 $7.727 $7.406 $7.516 $7.625
Depreciation - - - - -
Total Expenses $7.191 $7.727 $7.406 $7.516 $7.625
Baseline Surplus/(Deficit) $0.000 $0.000 $0.000 $0.000 $0.000
MTA BUS COMPANYFebruary Financial Plan 2012 - 2015
Accrual Statement of Operations by Category($ in millions)
*Effective 2012, the non‐labor account structure of the MTA standard chart of accounts has been adjusted to reflect the reclassification and renaming of certain accounts in order to improve account reporting consistency among the Agencies. These changes, which affect most non‐labor accounts presented on the attached tables, result in no net‐impact to the bottom line. In order to maintain comparability with 2011 actual results for year‐end reporting purposes, the 2011 account structure remains unchanged.

NON-REIMBURSABLE / REIMBURSABLE2011 2012Final Adopted
Estimate * Budget 2013 2014 2015RevenueFarebox Revenue $177.351 $180.168 $181.879 $183.956 $185.964Other Operating Revenue 18.841 19.019 19.391 19.771 20.169 Capital and Other Reimbursements 7.191 7.727 7.406 7.516 7.625
Total Revenue $203.384 $206.914 $208.676 $211.243 $213.758
ExpensesLabor:Payroll $227.982 $228.512 $227.670 $227.428 $240.455Overtime 43.886 40.783 39.795 39.186 40.509 Health and Welfare 38.102 45.170 49.773 54.911 61.867 OPEB Current Payment 13.892 14.586 15.315 16.081 16.885 Pensions 34.296 43.641 45.856 46.142 46.846 Other Fringe Benefits 22.983 23.266 23.648 22.809 23.927
Reimbursable Overhead - - - - - Total Labor Expenses $381.141 $395.957 $402.057 $406.556 $430.488
Non-Labor:Traction and Propulsion Power - - - - - Fuel for Buses and Trains $36.844 $34.408 $35.912 $35.695 $35.843Insurance 13.291 14.668 16.135 19.791 19.523 Claims 24.000 25.000 26.000 27.000 28.000 Paratransit Service Contracts - - - - - Maintenance and Other Operating Contracts 26.864 28.440 22.779 27.416 33.727 Professional Service Contracts 6.267 6.705 6.920 9.421 9.574 Materials & Supplies 32.248 26.904 27.928 28.611 36.186 Other Business Expenses 4.993 4.251 4.172 2.474 2.532
Total Non-Labor Expenses $144.506 $140.377 $139.845 $150.408 $165.385
Other Expenses Adjustments:Other - - - - -
Total Other Expense Adjustments $0.000 $0.000 $0.000 $0.000 $0.000
Total Expenses before Depreciation & GASB Adj. $525.646 $536.334 $541.903 $556.964 $595.873
Depreciation $42.235 $42.235 $42.235 $42.235 $42.235OPEB Obligation 54.630 55.415 56.296 56.919 57.663 Environmental Remediation - - - - -
Total Expenses $622.511 $633.984 $640.433 $656.118 $695.771
Baseline Surplus/(Deficit) ($419.127) ($427.070) ($431.757) ($444.875) ($482.013)
($419.127) ($427.070) ($431.757) ($444.875) ($482.013)*Effective 2012, the non‐labor account structure of the MTA standard chart of accounts has been adjusted to reflect the reclassification and renaming of certain accounts in order to improve account reporting consistency among the Agencies. These changes, which affect most non‐labor accounts presented on the attached tables, result in no net‐impact to the bottom line. In order to maintain comparability with 2011 actual results for year‐end reporting purposes, the 2011 account structure remains unchanged.
MTA BUS COMPANYFebruary Financial Plan 2012 - 2015
Accrual Statement of Operations by Category($ in millions)

CASH RECEIPTS AND EXPENDITURES2011 2012Final Adopted
Estimate * Budget 2013 2014 2015ReceiptsFarebox Revenue $177.351 $180.168 $181.879 $183.956 $185.964Other Operating Revenue 18.841 19.019 19.391 19.771 20.169 Capital and Other Reimbursements 11.163 11.838 11.997 12.236 12.477
Total Receipts $207.356 $211.025 $213.267 $215.963 $218.610
ExpendituresLabor:Payroll $229.803 $241.627 $225.689 $225.436 $238.445Overtime 43.886 40.783 39.795 39.186 40.509 Health and Welfare 45.280 44.766 49.365 54.501 61.453 OPEB Current Payment 13.892 14.586 15.315 16.081 16.885 Pensions 35.998 43.467 45.681 45.969 46.673 Other Fringe Benefits 24.425 23.100 23.481 22.639 23.756 GASB Account 3.948 4.317 5.317 6.317 6.317 Reimbursable Overhead - - - - -
Total Labor Expenditures $397.232 $412.647 $404.643 $410.128 $434.037
Non-Labor:Traction and Propulsion Power Fuel for Buses and Trains $35.468 $34.408 $35.912 $35.695 $35.843Insurance 28.955 14.668 16.135 19.791 19.523 Claims 18.000 17.100 22.000 24.000 24.000 Paratransit Service Contracts - - - - - Maintenance and Other Operating Contracts 28.676 28.440 22.779 27.416 33.727 Professional Service Contracts 8.425 6.705 6.920 9.421 9.574 Materials & Supplies 34.514 26.904 27.928 28.611 36.186 Other Business Expenses 5.057 4.251 4.172 2.474 2.532
Total Non-Labor Expenditures $159.095 $132.477 $135.845 $147.408 $161.384
Other Expenditure Adjustments:Other - - - - -
Total Other Expenditure Adjustments $0.000 $0.000 $0.000 $0.000 $0.000
Total Expenditures $556.327 $545.124 $540.489 $557.536 $595.421
Cash Timing and Availability Adjustment - - - - -
Baseline Cash Deficit ($348.971) ($334.099) ($327.222) ($341.573) ($376.811)
($ in millions)
*Effective 2012, the non‐labor account structure of the MTA standard chart of accounts has been adjusted to reflect the reclassification and renaming of certain accounts in order to improve account reporting consistency among the Agencies. These changes, which affect most non‐labor accounts presented on the attached tables, result in no net‐impact to the bottom line. In order to maintain comparability with 2011 actual results for year‐end reporting purposes, the 2011 account structure remains unchanged.
MTA BUS COMPANYFebruary Financial Plan 2012 - 2015
Accrual Statement of Operations by Category

CASH FLOW ADJUSTMENTS2011 2012Final Adopted
Estimate * Budget 2013 2014 2015ReceiptsFarebox Revenue $0.000 $0.000 $0.000 $0.000 $0.000Other Operating Revenue - - - - - Capital and Other Reimbursements 3.972 4.111 4.591 4.720 4.853
Total Receipts $3.972 $4.111 $4.591 $4.720 $4.853
ExpendituresLabor:Payroll ($1.821) ($13.116) $1.982 $1.992 $2.011Overtime - - - - - Health and Welfare (7.178) 0.403 0.407 0.410 0.414 OPEB Current Payment - - - - - Pensions (1.702) 0.174 0.175 0.173 0.173 Other Fringe Benefits (1.442) 0.165 0.167 0.169 0.171 Pattern Labor Provision - - - - - GASB Account (3.948) (4.317) (5.317) (6.317) (6.317) Reimbursable Overhead - - - - -
Total Labor Expenditures ($16.091) ($16.690) ($2.586) ($3.572) ($3.548)
Non-Labor:Traction and Propulsion Power - - - - - Fuel for Buses and Trains $1.376 - - - - Insurance (15.664) - - - - Claims 6.000 7.900 4.000 3.000 4.000 Paratransit Service Contracts - - - - - Maintenance and Other Operating Contracts (1.812) - - - - Professional Service Contracts (2.158) - - - - Materials & Supplies (2.267) - - - - Other Business Expenditures (0.065) - - - -
Total Non-Labor Expenditures ($14.589) $7.900 $4.000 $3.000 $4.000
Other Expenditures Adjustments:Other - - - - -
Total Other Expenditures Adjustments $0.000 $0.000 $0.000 $0.000 $0.000
Total Cash Conversion Adjustments before Depreciation and GASB Adjs. ($26.708) ($4.678) $6.005 $4.148 $5.305
Depreciation Adjustment $42.235 $42.235 $42.235 $42.235 $42.235OPEB Obligation 54.630 55.415 56.296 56.919 57.663 Environmental Remediation - - - - -
Cash Timing and Availability Adjustment - - - - -
Baseline Total Cash Conversion Adjustments $70.156 $92.972 $104.535 $103.302 $105.203
MTA BUS COMPANYFebruary Financial Plan 2012 - 2015
*Effective 2012, the non‐labor account structure of the MTA standard chart of accounts has been adjusted to reflect the reclassification and renaming of certain accounts in order to improve account reporting consistency among the Agencies. These changes, which affect most non‐labor accounts presented on the attached tables, result in no net‐impact to the bottom line. In order to maintain comparability with 2011 actual results for year‐end reporting purposes, the 2011 account structure remains unchanged.
Accrual Statement of Operations by Category($ in millions)

NON-REIMBURSABLE OVERTIME Hours $ %
SCHEDULED:Direct Service 579,327 $24.354 59.7%
Programmed Maintenance 0.0%
Total Scheduled 579,327 $24.354 59.7%
UNSCHEDULED:Vacancy/Absentee Coverage 150,474 $6.844 16.8%
Weather Emergencies 1,275 $0.059 0.1%
Maintenance 163,793 $7.019 17.2%
Service Delays 31,383 $1.452 3.6%
Emergencies 0 $0.000 0.0%
Tour Length 12,481 $0.582 1.4%
Safety/Security/Law Enforcement 2,641 $0.128 0.3%
All Other 7,371 $0.344 0.8%
Total Unscheduled 369,419 $16.428 40.3%
TOTAL NON-REIMBURSABLE OVERTIME: 948,745 $40.783 100.0%
REIMBURSABLE OVERTIME 0 $0.000
TOTAL OVERTIME 948,745 $40.783
MTA Bus Company2012 Adopted Budget
2012 Non-Reimbursable/Reimbursable Overtime ($ in millions)
Total

2011 2012Final Adopted
Estimate Budget 2013 2014 2015
RIDERSHIP
Fixed Route 116.963 118.840 119.757 120.879 121.937
Baseline Total Ridership 116.963 118.840 119.757 120.879 121.937
FAREBOX REVENUE
Fixed Route $177.351 $180.168 $181.879 $183.956 $185.964
Baseline Total Revenue $177.351 $180.168 $181.879 $183.956 $185.964101.59% 100.95% 101.14% 101.09%
1% 1% 1%
February Financial Plan 2012-2015MTA BUS COMPANY
Ridership/(Utilization)(in millions)

2011 2012Final Adopted
FUNCTION/DEPARTMENT Estimate Budget 2013 2014 2015
AdministrationOffice of the EVP 4 4 4 4 4 Human Resources 8 6 6 6 6 Office of Management and Budget 17 14 14 14 14 Technology & Information Services 17 17 18 18 18 Materiel 18 18 18 18 18 Controller 29 13 13 13 13 Office of the President 7 5 5 5 5 System Safety Administration 5 5 5 5 5 Law 21 21 21 21 21 Corporate Communications 2 2 2 2 2 Strategic Office - 8 8 8 8 Labor Relations 4 4 4 4 4 Non Departmental 46 57 57 64 68
Total Administration 178 174 175 182 186
OperationsBuses 2,048 2,056 2,056 2,056 2,056 Office of the Executive Vice President, Regional 1 1 1 1 1 Safety & Training 23 21 21 21 21 Road Operations 119 116 116 116 116 Transportation Support 20 20 20 20 20 Operations Planning 23 30 30 30 30 Revenue Control 21 21 21 21 21
Total Operations 2,255 2,265 2,265 2,265 2,265
MaintenanceBuses 739 730 722 722 722Maintenance Support/CMF 153 152 151 133 213Facilities 72 72 72 72 72Supply Logistics 82 83 83 83 83
Total Maintenance 1,046 1,037 1,028 1,010 1,090
Engineering/CapitalCapital Program Management 34 38 38 38 38
Public SafetyOffice of the Senior Vice President 12 12 12 12 12
Total Positions 3,525 3,526 3,518 3,507 3,591
Non-Reimbursable 3,462 3,462 3,454 3,443 3,527 Reimbursable 63 64 64 64 64
Total Full-Time 3,510 3,511 3,503 3,492 3,576 Total Full-Time Equivalents 15 15 15 15 15
MTA BUS COMPANYFebruary Financial Plan 2012-2015
Non-Reimbursable/Reimbursable and Full-Time/Full Time Equivalents Total Positions by Function and Department

2011 2012Final Adopted
FUNCTION/OCCUPATIONAL GROUP Estimate Budget 2013 2014 2015
Administration Managers/Supervisors 41 47 47 47 47 Professional, Technical, Clerical 91 70 71 71 71 Operational Hourlies 46 57 57 64 68
Total Administration 178 174 175 182 186
Operations Managers/Supervisors 292 297 297 297 297 Professional, Technical, Clerical 45 50 50 50 50 Operational Hourlies 1,918 1,918 1,918 1,918 1,918
Total Operations 2,255 2,265 2,265 2,265 2,265
Maintenance Managers/Supervisors 203 195 195 195 195 Professional, Technical, Clerical 12 12 12 12 12 Operational Hourlies 831 830 821 803 883
Total Maintenance 1,046 1,037 1,028 1,010 1,090
Engineering/Capital Managers/Supervisors 18 22 22 22 22 Professional, Technical, Clerical 16 16 16 16 16 Operational Hourlies - - - - -
Total Engineering/Capital 34 38 38 38 38
Public Safety Managers/Supervisors 9 9 9 9 9 Professional, Technical, Clerical 3 3 3 3 3 Operational Hourlies - - - - -
Total Public Safety 12 12 12 12 12
Total Positions Managers/Supervisors 563 570 570 570 570 Professional, Technical, Clerical 167 151 152 152 152 Operational Hourlies 2,795 2,805 2,796 2,785 2,869
Total Baseline Positions 3,525 3,526 3,518 3,507 3,591
MTA BUS COMPANYFebruary Financial Plan 2012-2015
Total Positions by Function and Occupation

NON-REIMBURSABLEJan Feb Mar Apr May Jun Jul Aug Sep Oct Nov Dec Total
Operating Revenue
Farebox Revenue $14.156 $13.901 $15.294 $14.798 $15.702 $15.167 $15.498 $15.738 $14.726 $15.877 $14.791 $14.521 $180.168Other Operating Revenue 1.627 1.539 2.089 1.582 2.040 1.569 0.873 0.936 1.481 1.871 1.722 1.692 19.019 Capital and Other Reimbursements - Total Revenue $15.783 $15.441 $17.382 $16.379 $17.741 $16.736 $16.371 $16.674 $16.207 $17.748 $16.512 $16.212 $199.187
Operating Expenses
Labor:Payroll $18.915 $17.801 $18.536 $17.757 $19.227 $17.979 $18.603 $18.670 $17.801 $18.626 $18.291 $20.586 $222.793Overtime 3.217 3.213 3.476 3.386 3.465 3.368 3.406 3.533 3.395 3.573 3.289 3.463 40.783 Health and Welfare 3.676 3.676 3.676 3.676 3.676 3.676 3.676 3.676 3.676 3.676 3.676 3.676 44.118 OPEB Current Payment 1.216 1.216 1.216 1.216 1.216 1.216 1.216 1.216 1.216 1.216 1.216 1.216 14.586 Pensions 3.596 3.596 3.596 3.596 3.596 3.596 3.596 3.596 3.596 3.596 3.596 3.596 43.150 Other Fringe Benefits 1.936 1.822 1.897 1.817 1.968 1.840 1.904 1.911 1.822 1.906 1.872 2.107 22.800 Reimbursable Overhead - Total Labor Expenses $32.556 $31.324 $32.397 $31.448 $33.148 $31.675 $32.400 $32.601 $31.506 $32.592 $31.940 $34.644 $388.230
Non-Labor:Electric Power $0.000 $0.000 $0.000 $0.000 $0.000 $0.000 $0.000 $0.000 $0.000 $0.000 $0.000 $0.000 $0.000Fuel 2.795 2.704 2.930 2.802 2.917 3.153 2.863 2.985 2.680 2.984 2.804 2.792 34.408 Insurance 1.222 1.222 1.222 1.222 1.222 1.222 1.222 1.222 1.222 1.222 1.222 1.222 14.668 Claims 2.083 2.083 2.083 2.083 2.083 2.083 2.083 2.083 2.083 2.083 2.083 2.083 25.000 Paratransit Service Contracts - - - - - - - - - - - - - Maintenance and Other Operating Contracts 2.370 2.370 2.370 2.370 2.370 2.370 2.370 2.370 2.370 2.370 2.370 2.370 28.440 Professional Service Contracts 0.559 0.559 0.559 0.559 0.559 0.559 0.559 0.559 0.559 0.559 0.559 0.559 6.705 Materials & Supplies 2.242 2.242 2.242 2.242 2.242 2.242 2.242 2.242 2.242 2.242 2.242 2.242 26.904 Other Business Expenses 0.354 0.354 0.354 0.354 0.354 0.354 0.354 0.354 0.354 0.354 0.354 0.354 4.251 Total Non-Labor Expenses $11.625 $11.535 $11.761 $11.632 $11.748 $11.984 $11.693 $11.816 $11.511 $11.815 $11.635 $11.623 $140.377
Other Expenses Adjustments:Other - Total Other Expense Adjustments $0.000 $0.000 $0.000 $0.000 $0.000 $0.000 $0.000 $0.000 $0.000 $0.000 $0.000 $0.000 $0.000
Total Expenses before Non-Cash Liability Adjs. $44.181 $42.859 $44.158 $43.080 $44.895 $43.658 $44.094 $44.417 $43.016 $44.407 $43.574 $46.267 $528.607
Depreciation $3.520 $3.520 $3.520 $3.520 $3.520 $3.520 $3.520 $3.520 $3.520 $3.520 $3.520 $3.520 $42.235OPEB Obligation 4.618 4.618 4.618 4.618 4.618 4.618 4.618 4.618 4.618 4.618 4.618 4.618 55.415 Environmental Remediation -
Total Expenses $52.319 $50.996 $52.296 $51.218 $53.033 $51.796 $52.231 $52.554 $51.154 $52.545 $51.712 $54.404 $626.257
Baseline Net Surplus/(Deficit) ($36.536) ($35.556) ($34.913) ($34.839) ($35.291) ($35.060) ($35.861) ($35.880) ($34.946) ($34.797) ($35.199) ($38.192) ($427.070)
MTA BUS COMPANYFebruary Financial Plan - 2012 Adopted BudgetAccrual Statement of Operations by Category
($ in millions)

REIMBURSABLEJan Feb Mar Apr May Jun Jul Aug Sep Oct Nov Dec Total
RevenueFarebox Revenue $0.000Other Operating Revenue - Capital and Other Reimbursements 0.644 0.644 0.644 0.644 0.644 0.644 0.644 0.644 0.644 0.644 0.644 0.644 7.727 Total Revenue $0.644 $0.644 $0.644 $0.644 $0.644 $0.644 $0.644 $0.644 $0.644 $0.644 $0.644 $0.644 $7.727
ExpensesLabor:Payroll $0.477 $0.477 $0.477 $0.477 $0.477 $0.477 $0.477 $0.477 $0.477 $0.477 $0.477 $0.477 $5.718Overtime - - - - - - - - - - - - - Health and Welfare 0.088 0.088 0.088 0.088 0.088 0.088 0.088 0.088 0.088 0.088 0.088 0.088 1.052 OPEB Current Payment - - - - - - - - - - - - - Pensions 0.041 0.041 0.041 0.041 0.041 0.041 0.041 0.041 0.041 0.041 0.041 0.041 0.492 Other Fringe Benefits 0.039 0.039 0.039 0.039 0.039 0.039 0.039 0.039 0.039 0.039 0.039 0.039 0.466 Reimbursable Overhead - - - - - - - - - - - - - Total Labor Expenses $0.644 $0.644 $0.644 $0.644 $0.644 $0.644 $0.644 $0.644 $0.644 $0.644 $0.644 $0.644 $7.727
Non-Labor:Electric Power $0.000 $0.000 $0.000 $0.000 $0.000 $0.000 $0.000 $0.000 $0.000 $0.000 $0.000 $0.000 $0.000Fuel - - - - - - - - - - - - - Insurance - Claims - Paratransit Service Contracts - Maintenance and Other Operating Contracts - Professional Service Contracts - Materials & Supplies - Other Business Expenses - Total Non-Labor Expenses $0.000 $0.000 $0.000 $0.000 $0.000 $0.000 $0.000 $0.000 $0.000 $0.000 $0.000 $0.000 $0.000
Other Expenses Adjustments:Other - Total Other Expense Adjustments $0.000 $0.000 $0.000 $0.000 $0.000 $0.000 $0.000 $0.000 $0.000 $0.000 $0.000 $0.000 $0.000
Total Expenses before Depreciation $0.644 $0.644 $0.644 $0.644 $0.644 $0.644 $0.644 $0.644 $0.644 $0.644 $0.644 $0.644 $7.727
Depreciation -
Total Expenses $0.644 $0.644 $0.644 $0.644 $0.644 $0.644 $0.644 $0.644 $0.644 $0.644 $0.644 $0.644 $7.727
Baseline Net Surplus/(Deficit) $0.000 $0.000 $0.000 $0.000 $0.000 $0.000 $0.000 $0.000 $0.000 $0.000 $0.000 $0.000 $0.000
Accrual Statement of Operations by Category($ in millions)
MTA BUS COMPANYFebruary Financial Plan - 2012 Adopted Budget

NON-REIMBURSABLE / REIMBURSABLEJan Feb Mar Apr May Jun Jul Aug Sep Oct Nov Dec Total
RevenueFarebox Revenue $14.156 $13.901 $15.294 $14.798 $15.702 $15.167 $15.498 $15.738 $14.726 $15.877 $14.791 $14.521 $180.168Other Operating Revenue 1.627 1.539 2.089 1.582 2.040 1.569 0.873 0.936 1.481 1.871 1.722 1.692 19.019 Capital and Other Reimbursements 0.644 0.644 0.644 0.644 0.644 0.644 0.644 0.644 0.644 0.644 0.644 0.644 7.727 Total Revenue $16.427 $16.085 $18.026 $17.023 $18.385 $17.380 $17.015 $17.318 $16.851 $18.392 $17.156 $16.856 $206.914
ExpensesLabor:Payroll $19.392 $18.278 $19.013 $18.233 $19.704 $18.456 $19.080 $19.147 $18.278 $19.102 $18.768 $21.063 $228.512Overtime 3.217 3.213 3.476 3.386 3.465 3.368 3.406 3.533 3.395 3.573 3.289 3.463 40.783 Health and Welfare 3.764 3.764 3.764 3.764 3.764 3.764 3.764 3.764 3.764 3.764 3.764 3.764 45.170 OPEB Current Payment 1.216 1.216 1.216 1.216 1.216 1.216 1.216 1.216 1.216 1.216 1.216 1.216 14.586 Pensions 3.637 3.637 3.637 3.637 3.637 3.637 3.637 3.637 3.637 3.637 3.637 3.637 43.641 Other Fringe Benefits 1.975 1.861 1.936 1.856 2.006 1.879 1.943 1.949 1.861 1.945 1.911 2.146 23.266 Reimbursable Overhead - - - - - - - - - - - - - Total Labor Expenses $33.200 $31.968 $33.041 $32.092 $33.792 $32.319 $33.044 $33.245 $32.149 $33.236 $32.584 $35.288 $395.957
Non-Labor:Electric PowerFuel $2.795 $2.704 $2.930 $2.802 $2.917 $3.153 $2.863 $2.985 $2.680 $2.984 $2.804 $2.792 $34.408Insurance 1.222 1.222 1.222 1.222 1.222 1.222 1.222 1.222 1.222 1.222 1.222 1.222 $14.668Claims 2.083 2.083 2.083 2.083 2.083 2.083 2.083 2.083 2.083 2.083 2.083 2.083 $25.000Paratransit Service Contracts - - - - - - - - - - - - $0.000Maintenance and Other Operating Contracts 2.370 2.370 2.370 2.370 2.370 2.370 2.370 2.370 2.370 2.370 2.370 2.370 $28.440Professional Service Contracts 0.559 0.559 0.559 0.559 0.559 0.559 0.559 0.559 0.559 0.559 0.559 0.559 $6.705Materials & Supplies 2.242 2.242 2.242 2.242 2.242 2.242 2.242 2.242 2.242 2.242 2.242 2.242 $26.904Other Business Expenses 0.354 0.354 0.354 0.354 0.354 0.354 0.354 0.354 0.354 0.354 0.354 0.354 $4.251Total Non-Labor Expenses $11.625 $11.535 $11.761 $11.632 $11.748 $11.984 $11.693 $11.816 $11.511 $11.815 $11.635 $11.623 $140.377
Other Expenses Adjustments:Other - - - - - - - - - - - - - Total Other Expense Adjustments $0.000 $0.000 $0.000 $0.000 $0.000 $0.000 $0.000 $0.000 $0.000 $0.000 $0.000 $0.000 $0.000
Total Expenses before Non-Cash Liability Adjs. $44.825 $43.503 $44.802 $43.724 $45.539 $44.302 $44.738 $45.061 $43.660 $45.051 $44.218 $46.911 $536.334
Depreciation $3.520 $3.520 $3.520 $3.520 $3.520 $3.520 $3.520 $3.520 $3.520 $3.520 $3.520 $3.520 $42.235OPEB Obligation 4.618 4.618 4.618 4.618 4.618 4.618 4.618 4.618 4.618 4.618 4.618 4.618 55.415 Environmental Remediation - - - - - - - - - - - - -
Total Expenses $52.963 $51.640 $52.940 $51.862 $53.677 $52.440 $52.875 $53.198 $51.798 $53.189 $52.356 $55.048 $633.984
Baseline Net Surplus/(Deficit) ($36.536) ($35.556) ($34.913) ($34.839) ($35.291) ($35.060) ($35.861) ($35.880) ($34.946) ($34.797) ($35.199) ($38.192) ($427.070)
February Financial Plan - 2012 Adopted Budget
($ in millions)Accrual Statement of Operations by Category
MTA BUS COMPANY

CASH RECEIPTS AND EXPENDITURESJan Feb Mar Apr May Jun Jul Aug Sep Oct Nov Dec Total
ReceiptsFarebox Revenue $14.156 $13.901 $15.294 $14.798 $15.702 $15.167 $15.498 $15.738 $14.726 $15.877 $14.791 $14.521 $180.168Other Operating Revenue 1.627 1.539 2.089 1.582 2.040 1.569 0.873 0.936 1.481 1.871 1.722 1.692 19.019 Capital and Other Reimbursements 0.987 0.987 0.987 0.987 0.987 0.987 0.987 0.987 0.987 0.987 0.987 0.987 11.838 Total Receipts $16.769 $16.427 $18.369 $17.366 $18.728 $17.722 $17.357 $17.660 $17.194 $18.735 $17.499 $17.199 $211.025
ExpendituresLabor:Payroll $18.587 $18.587 $18.587 $18.587 $27.880 $18.587 $18.587 $18.587 $18.587 $27.880 $18.587 $18.587 $241.627Overtime 3.137 3.137 3.137 3.137 4.706 3.137 3.137 3.137 3.137 4.706 3.137 3.137 40.783 Health and Welfare 3.731 3.731 3.731 3.731 3.731 3.731 3.731 3.731 3.731 3.731 3.731 3.731 44.766 OPEB Current Payment 1.216 1.216 1.216 1.216 1.216 1.216 1.216 1.216 1.216 1.216 1.216 1.216 14.586 Pensions 3.622 3.622 3.622 3.622 3.622 3.622 3.622 3.622 3.622 3.622 3.622 3.622 43.467 Other Fringe Benefits 1.777 1.777 1.777 1.777 2.665 1.777 1.777 1.777 1.777 2.665 1.777 1.777 23.100 GASB Account 0.360 0.360 0.360 0.360 0.360 0.360 0.360 0.360 0.360 0.360 0.360 0.360 4.317 Reimbursable Overhead - Total Labor Expenditures $32.429 $32.429 $32.429 $32.429 $44.179 $32.429 $32.429 $32.429 $32.429 $44.179 $32.429 $32.429 $412.647
Non-Labor:Electric Power $0.000 $0.000 $0.000 $0.000 $0.000 $0.000 $0.000 $0.000 $0.000 $0.000 $0.000 $0.000 $0.000Fuel 2.795 2.704 2.930 2.802 2.917 3.153 2.863 2.985 2.680 2.984 2.804 2.792 34.408 Insurance 1.222 1.222 1.222 1.222 1.222 1.222 1.222 1.222 1.222 1.222 1.222 1.222 14.668 Claims 1.425 1.425 1.425 1.425 1.425 1.425 1.425 1.425 1.425 1.425 1.425 1.425 17.100 Paratransit Service Contracts - - - - - - - - - - - - - Maintenance and Other Operating Contracts 2.370 2.370 2.370 2.370 2.370 2.370 2.370 2.370 2.370 2.370 2.370 2.370 28.440 Professional Service Contracts 0.559 0.559 0.559 0.559 0.559 0.559 0.559 0.559 0.559 0.559 0.559 0.559 6.705 Materials & Supplies 2.242 2.242 2.242 2.242 2.242 2.242 2.242 2.242 2.242 2.242 2.242 2.242 26.904 Other Business Expenses 0.354 0.354 0.354 0.354 0.354 0.354 0.354 0.354 0.354 0.354 0.354 0.354 4.251 Total Non-Labor Expenditures $10.967 $10.876 $11.103 $10.974 $11.089 $11.325 $11.035 $11.157 $10.852 $11.157 $10.976 $10.964 $132.477
Other Expenditure Adjustments:Other - Total Other Expenditure Adjustments $0.000 $0.000 $0.000 $0.000 $0.000 $0.000 $0.000 $0.000 $0.000 $0.000 $0.000 $0.000 $0.000
Total Expenditures $43.396 $43.305 $43.532 $43.403 $55.269 $43.754 $43.464 $43.586 $43.281 $55.336 $43.405 $43.393 $545.124
Baseline Net Cash Deficit ($26.627) ($26.878) ($25.163) ($26.037) ($36.541) ($26.032) ($26.107) ($25.926) ($26.087) ($36.601) ($25.906) ($26.194) ($334.099)
MTA BUS COMPANY
Cash Receipts & Expenditures($ in millions)
February Financial Plan - 2012 Adopted Budget

CASH FLOW ADJUSTMENTSJan Feb Mar Apr May Jun Jul Aug Sep Oct Nov Dec Total
Receipts
Farebox Revenue $0.000 $0.000 $0.000 $0.000 $0.000 $0.000 $0.000 $0.000 $0.000 $0.000 $0.000 $0.000 $0.000Other Operating Revenue - - - - - - - - - - - - - Capital and Other Reimbursements 0.343 0.343 0.343 0.343 0.343 0.343 0.343 0.343 0.343 0.343 0.343 0.343 4.111 Total Receipts $0.343 $0.343 $0.343 $0.343 $0.343 $0.343 $0.343 $0.343 $0.343 $0.343 $0.343 $0.343 $4.111
Expenditures
Labor:Payroll $0.805 ($0.309) $0.426 ($0.354) ($8.176) ($0.131) $0.493 $0.560 ($0.309) ($8.778) $0.181 $2.476 ($13.116)Overtime 0.080 0.076 0.339 0.249 (1.241) 0.230 0.268 0.395 0.258 (1.133) 0.151 0.326 0.000 Health and Welfare 0.034 0.034 0.034 0.034 0.034 0.034 0.034 0.034 0.034 0.034 0.034 0.034 0.403 OPEB Current Payment - - - - - - - - - - - - - Pensions 0.015 0.015 0.015 0.015 0.015 0.015 0.015 0.015 0.015 0.015 0.015 0.015 0.174 Other Fringe Benefits 0.198 0.084 0.159 0.079 (0.659) 0.102 0.166 0.173 0.084 (0.721) 0.134 0.369 0.165 GASB Account (0.360) (0.360) (0.360) (0.360) (0.360) (0.360) (0.360) (0.360) (0.360) (0.360) (0.360) (0.360) (4.317) Reimbursable Overhead - - - - - - - - - - - - - Total Labor Expenditures $0.771 ($0.461) $0.612 ($0.337) ($10.388) ($0.110) $0.616 $0.816 ($0.279) ($10.943) $0.155 $2.859 ($16.690)
Non-Labor:Electric Power $0.000 $0.000 $0.000 $0.000 $0.000 $0.000 $0.000 $0.000 $0.000 $0.000 $0.000 $0.000 $0.000Fuel - - - - - - - - - - - - - Insurance - - - - - - - - - - - - - Claims 0.658 0.658 0.658 0.658 0.658 0.658 0.658 0.658 0.658 0.658 0.658 0.658 7.900 Paratransit Service Contracts - - - - - - - - - - - - - Maintenance and Other Operating Contracts - - - - - - - - - - - - - Professional Service Contracts - - - - - - - - - - - - - Materials & Supplies - - - - - - - - - - - - - Other Business Expenditures - - - - - - - - - - - - - Total Non-Labor Expenditures $0.658 $0.658 $0.658 $0.658 $0.658 $0.658 $0.658 $0.658 $0.658 $0.658 $0.658 $0.658 $7.900
Other Expenditures Adjustments:Other - - - - - - - - - - - - - Total Other Expenditures Adjustments $0.000 $0.000 $0.000 $0.000 $0.000 $0.000 $0.000 $0.000 $0.000 $0.000 $0.000 $0.000 $0.000
Total Cash Conversion Adjustments before Non-Cash Liability Adjs. $1.772 $0.540 $1.613 $0.664 ($9.387) $0.891 $1.617 $1.817 $0.722 ($9.942) $1.156 $3.860 ($4.678)
Depreciation Adjustment $3.520 $3.520 $3.520 $3.520 $3.520 $3.520 $3.520 $3.520 $3.520 $3.520 $3.520 $3.520 $42.235OPEB Obligation 4.618 4.618 4.618 4.618 4.618 4.618 4.618 4.618 4.618 4.618 4.618 4.618 55.415 Environmental Remediation - - - - - - - - - - - - -
Baseline Total Cash Conversion Adjustments $9.909 $8.677 $9.751 $8.802 ($1.249) $9.028 $9.754 $9.955 $8.859 ($1.805) $9.293 $11.997 $92.972
MTA BUS COMPANYFebruary Financial Plan - 2012 Adopted Budget
Cash Conversion (Cash Flow Adjustments)($ in millions)

MTA Bus CompanyFebruary Financial Plan - 2012 Adopted Budget
Overtime - Non-Reimbursable/Reimbursable Basis($ in millions)
NON-REIMBURSABLE
SCHEDULED:
Direct Service 1.920$ 1.919$ 2.076$ 2.022$ 2.069$ 2.011$ 2.034$ 2.110$ 2.027$ 2.134$ 1.964$ 2.068$ 24.354$
Programmed Maintenance 0.000 0.000 0.000 0.000 0.000 0.000 0.000 0.000 0.000 0.000 0.000 0.000 0.000
Total Scheduled 1.920$ 1.919$ 2.076$ 2.022$ 2.069$ 2.011$ 2.034$ 2.110$ 2.027$ 2.134$ 1.964$ 2.068$ 24.354$
UNSCHEDULED:
Vacancy/Absentee Coverage 0.477$ 0.550$ 0.586$ 0.555$ 0.580$ 0.614$ 0.642$ 0.665$ 0.573$ 0.570$ 0.487$ 0.545$ 6.844$
Weather Emergencies 0.006 0.004 0.005 0.005 0.005 0.005 0.005 0.005 0.005 0.005 0.006 0.005 0.059
Maintenance 0.578 0.552 0.607 0.607 0.610 0.541 0.526 0.547 0.591 0.656 0.586 0.617 7.019
Service Delays 0.145 0.107 0.116 0.112 0.115 0.112 0.113 0.117 0.113 0.119 0.148 0.134 1.452
Emergencies 0.000 0.000 0.000 0.000 0.000 0.000 0.000 0.000 0.000 0.000 0.000 0.000 0.000
Tour Length 0.057 0.043 0.047 0.045 0.046 0.045 0.046 0.047 0.046 0.048 0.059 0.053 0.582
Safety/Security/Law Enforcement 0.006 0.011 0.011 0.011 0.011 0.011 0.011 0.011 0.011 0.012 0.011 0.011 0.128
All Other 0.027 0.027 0.029 0.029 0.029 0.028 0.029 0.030 0.029 0.030 0.028 0.029 0.344
Total Unscheduled 1.297$ 1.294$ 1.400$ 1.364$ 1.396$ 1.356$ 1.372$ 1.423$ 1.367$ 1.439$ 1.325$ 1.395$ 16.428$
TOTAL NON-REIMBURSABLE OVERTIME: 3.217 3.213 3.476 3.386 3.465 3.368 3.406 3.533 3.395 3.573 3.289 3.463 40.783
REIMBURSABLE OVERTIME 0.000 0.000 0.000 0.000 0.000 0.000 0.000 0.000 0.000 0.000 0.000 0.000 0.000
TOTAL NR & R OVERTIME 3.217$ 3.213$ 3.476$ 3.386$ 3.465$ 3.368$ 3.406$ 3.533$ 3.395$ 3.573$ 3.289$ 3.463$ 40.783$
TotalJul Aug Sep Oct Nov DecJan Feb Mar Apr May Jun

MTA BUS COMPANY
Ridership/(Utilization)
Jan Feb Mar Apr May Jun Jul Aug Sep Oct Nov Dec Total
Fixed Route 9.433 9.220 10.549 9.774 10.646 9.987 9.524 9.590 9.861 10.706 9.944 9.606 118.840
Baseline Total Ridership 9.433 9.220 10.549 9.774 10.646 9.987 9.524 9.590 9.861 10.706 9.944 9.606 118.840
Fixed Route 14.156 13.901 15.294 14.798 15.702 15.167 15.498 15.738 14.726 15.877 14.791 14.521 180.168
Baseline Total Revenue $14.156 $13.901 $15.294 $14.798 $15.702 $15.167 $15.498 $15.738 $14.726 $15.877 $14.791 $14.521 $180.168
February Financial Plan - 2012 Adopted Budget
(in millions)
RIDERSHIP
FAREBOX REVENUE

Jan Feb Mar Apr May Jun Jul Aug Sep Oct Nov Dec
Office of the EVP 4 4 4 4 4 4 4 4 4 4 4 4Human Resources 6 6 6 6 6 6 6 6 6 6 6 6Office of Management and Budget 14 14 14 14 14 14 14 14 14 14 14 14Technology & Information Services 17 17 17 17 17 17 17 17 17 17 17 17Materiel 18 18 18 18 18 18 18 18 18 18 18 18Controller 19 19 19 19 13 13 13 13 13 13 13 13Office of the President 5 5 5 5 5 5 5 5 5 5 5 5Sytem Safety Administration 5 5 5 5 5 5 5 5 5 5 5 5Law 21 21 21 21 21 21 21 21 21 21 21 21Corporate Communications 2 2 2 2 2 2 2 2 2 2 2 2Strategic Office 8 8 8 8 8 8 8 8 8 8 8 8Non-Departmental 4 4 4 4 4 4 4 4 4 4 4 4Labor Relations 57 57 57 57 57 57 57 57 57 57 57 57
Total Administration 180 180 180 180 174 174 174 174 174 174 174 174
OperationsBuses 2,056 2,056 2,056 2,056 2,056 2,056 2,056 2,056 2,056 2,056 2,056 2,056Office of the Executive Vice President, Regional 1 1 1 1 1 1 1 1 1 1 1 1Safety & Training 21 21 21 21 21 21 21 21 21 21 21 21Road Operations 119 119 119 119 119 119 116 116 116 116 116 116Transportation Support 20 20 20 20 20 20 20 20 20 20 20 20Operations Planning 30 30 30 30 30 30 30 30 30 30 30 30Revenue Control 21 21 21 21 21 21 21 21 21 21 21 21
Total Operations 2,268 2,268 2,268 2,268 2,268 2,268 2,265 2,265 2,265 2,265 2,265 2,265
MaintenanceBuses 730 730 730 730 730 730 730 730 730 730 730 730Maintenance Support/CMF 152 152 152 152 152 152 152 152 152 152 152 152Facilities 72 72 72 72 72 72 72 72 72 72 72 72Supply Logistics 83 83 83 83 83 83 83 83 83 83 83 83
Total Maintenance 1,037 1,037 1,037 1,037 1,037 1,037 1,037 1,037 1,037 1,037 1,037 1,037
Engineering/CapitalCapital Program Management 38 38 38 38 38 38 38 38 38 38 38 38
Public SafetyOffice of the Senior Vice President 12 12 12 12 12 12 12 12 12 12 12 12
Total Positions 3,535 3,535 3,535 3,535 3,529 3,529 3,526 3,526 3,526 3,526 3,526 3,526
Non-Reimbursable 3,468 3,468 3,468 3,468 3,462 3,462 3,462 3,462 3,462 3,462 3,462 3,462Reimbursable 67 67 67 67 67 67 64 64 64 64 64 64
Total Full-Time 3,520 3,520 3,520 3,520 3,514 3,514 3,511 3,511 3,511 3,511 3,511 3,511Total Full-Time Equivalents 15 15 15 15 15 15 15 15 15 15 15 15
MTA BUS COMPANYFebruary Financial Plan - 2012 Adopted Budget
Total Positions by Function and DepartmentNon-Reimbursable/Reimbursable and Full-Time/Full-Time Equivalents
FUNCTION/DEPARTMENT

FUNCTION/OCCUPATION Jan Feb Mar Apr May Jun Jul Aug Sep Oct Nov Dec
Administration Managers/Supervisors 47 47 47 47 47 47 47 47 47 47 47 47 Professional, Technical, Clerical 76 76 76 76 70 70 70 70 70 70 70 70 Operational Hourlies 57 57 57 57 57 57 57 57 57 57 57 57
Total Administration 180 180 180 180 174 174 174 174 174 174 174 174
Operations Managers/Supervisors 300 300 300 300 300 300 297 297 297 297 297 297 Professional, Technical, Clerical 50 50 50 50 50 50 50 50 50 50 50 50 Operational Hourlies 1,918 1,918 1,918 1,918 1,918 1,918 1,918 1,918 1,918 1,918 1,918 1,918
Total Operations 2,268 2,268 2,268 2,268 2,268 2,268 2,265 2,265 2,265 2,265 2,265 2,265
Maintenance Managers/Supervisors 195 195 195 195 195 195 195 195 195 195 195 195 Professional, Technical, Clerical 12 12 12 12 12 12 12 12 12 12 12 12 Operational Hourlies 830 830 830 830 830 830 830 830 830 830 830 830
Total Maintenance 1,037 1,037 1,037 1,037 1,037 1,037 1,037 1,037 1,037 1,037 1,037 1,037
Engineering/Capital Managers/Supervisors 22 22 22 22 22 22 22 22 22 22 22 22 Professional, Technical, Clerical 16 16 16 16 16 16 16 16 16 16 16 16 Operational Hourlies - - - - - - - - - - - -
Total Engineering/Capital 38 38 38 38 38 38 38 38 38 38 38 38
Public Safety Managers/Supervisors 9 9 9 9 9 9 9 9 9 9 9 9 Professional, Technical, Clerical 3 3 3 3 3 3 3 3 3 3 3 3 Operational Hourlies - - - - - - - - - - - -
Total Public Safety 12 12 12 12 12 12 12 12 12 12 12 12
Total Baseline Positions Managers/Supervisors 573 573 573 573 573 573 570 570 570 570 570 570 Professional, Technical, Clerical 157 157 157 157 151 151 151 151 151 151 151 151 Operational Hourlies 2,805 2,805 2,805 2,805 2,805 2,805 2,805 2,805 2,805 2,805 2,805 2,805
Total Baseline Positions 3,535 3,535 3,535 3,535 3,529 3,529 3,526 3,526 3,526 3,526 3,526 3,526
MTA BUS COMPANYFebruary Financial Plan - 2012 Adopted Budget
Total Positions by Function and Occupation

[THIS PAGE INTENTIONALLY LEFT BLANK]

Staten Island Railway

MTA STATEN ISLAND RAILWAY FEBRUARY FINANCIAL PLAN FOR 2012-2015
2011 FINAL ESTIMATE AND 2012 ADOPTED BUDGET In accordance with MTA-approved budget procedures, the following information presents MTA Staten Island Railway’s 2011 Final Estimate, 2012 Adopted Budget and the Financial Plan for 2012-2015. The Adopted Budget reflects the inclusion of MTA adjustments that were presented in the November Financial Plan, which was adopted by the Board in December 2011. These adjustments are presented on the attached reconciliations from the November Financial Plan and are described below:
Labor savings of $0.313 million in 2012 and 2013, $0.320 million in 2014 and $0.326 million in 2015, from the assumption of a three-year net zero savings initiative for represented employees.
Labor savings of $0.063 million in 2012, $0.064 million in 2013, $0.065
million in 2014 and $0.066 million in 2015, from the impact of a third year wage freeze in 2011 for non-represented employees.
Revised inflation assumptions, which result in increases in traction &
propulsion power costs of $0.089 million in 2012, $0.092 million in 2013, $0.095 million in 2014 and $0.098 million in 2015.
Revised inflation assumptions, which result in decreases in fuel costs of
$0.003 million for each plan year. Effective 2012, the non-labor account structure of the MTA standard chart
of accounts has been adjusted to reflect the reclassification and renaming of certain accounts in order to improve account reporting consistency among the Agencies. These changes, which affect most non-labor accounts presented on the attached tables, result in no net-impact to the bottom line. In order to maintain comparability with 2011 actual results for year-end reporting purposes, the 2011 account structure remains unchanged.
This submission also includes schedules detailing the monthly allocation of financial, headcount and utilization data based on the 2012 Adopted Budget for the purpose of reporting actual results on a monthly basis to the Board.

Positions Dollars Positions Dollars Positions Dollars Positions Dollars Positions Dollars
2011 November Financial Plan: Baseline Surplus/(Deficit) 263 ($38.564) 264 ($45.023) 264 ($44.126) 264 ($45.722) 264 ($47.396)
Technical Adjustments:
Sub-Total Technical Adjustments 0 $0.000 0 $0.000 0 $0.000 0 $0.000 0 $0.000
MTA Plan Adjustments:
Labor: 3 Zeros Salary/Wage Initiative $0.061 $0.376 $0.377 $0.385 $0.392 Accelerate 3 Zeros 0.000 0.000 0.000 0.000 0.000New MTA Efficiencies 0.000 0.000 0.000 0.000 0.000Energy/Other Reimbursements 0.001 (0.086) (0.089) (0.092) (0.095)
Sub-Total MTA Plan Adjustments 0 $.062 0 $.290 0 $.288 0 $.293 0 $.297
2012 February Financial Plan: Baseline Surplus/(Deficit) 263 ($38.502) 264 ($44.733) 264 ($43.838) 264 ($45.429) 264 ($47.099)
MTA STATEN ISLAND RAILWAY
2015
February Financial Plan 2012 - 2015Reconciliation to the November Plan (Accrual) Non-Reimbursable
($ in millions)
Favorable/(Unfavorable)2011 2012 2013 2014

Positions Dollars Positions Dollars Positions Dollars Positions Dollars Positions Dollars
2011 November Financial Plan: Baseline Surplus/(Deficit) 3 $0.000 3 $0.000 3 $0.000 3 $0.000 3 $0.000
Technical Adjustments:
Sub-Total Technical Adjustments 0 $0.000 0 $0.000 0 $0.000 0 $0.000 0 $0.000
MTA Plan Adjustments
Labor: 3 Zeros Salary/Wage Initiative Accelerate 3 Zeros New MTA EfficienciesEnergy/Other Reimbursements
Sub-Total MTA Plan Adjustments 0 $0.000 0 $0.000 0 $0.000 0 $0.000 0 $0.000
2012 February Financial Plan: Baseline Surplus/(Deficit) 3 $0.000 3 $0.000 3 $0.000 3 $0.000 3 $0.000
MTA STATEN ISLAND RAILWAYFebruary Financial Plan 2012 - 2015
Reconciliation to the November Plan (Accrual) Reimbursable($ in millions)
Favorable/(Unfavorable)2011 2012 2013 2014 2015

Positions Dollars Positions Dollars Positions Dollars Positions Dollars Positions Dollars
2011 November Financial Plan: Baseline Surplus/(Deficit) 266 ($27.130) 267 ($38.273) 267 ($32.505) 267 ($34.137) 267 ($35.811)
Technical Adjustments:
Sub-Total Technical Adjustments 0 $0.000 0 $0.000 0 $0.000 0 $0.000 0 $0.000
MTA Plan Adjustments:
Labor: 3 Zeros Salary/Wage Initiative $0.061 $0.376 $0.377 $0.385 $0.392 Accelerate 3 Zeros 0.000 0.000 0.000 0.000 0.000New MTA Efficiencies 0.000 0.000 0.000 0.000 0.000Energy/Other Reimbursements 0.001 (0.086) (0.089) (0.092) (0.095)
Sub-Total MTA Plan Adjustments 0 $.062 0 $.290 0 $.288 0 $.293 0 $.297
2012 February Financial Plan: BaselineSurplus/(Deficit) 266 ($27.068) 267 ($37.983) 267 ($32.217) 267 ($33.844) 267 ($35.514)
MTA STATEN ISLAND RAILWAYFebruary Financial Plan 2012 - 2015
Reconciliation to the November Plan - (Cash)($ in millions)
Favorable/(Unfavorable)2011 2012 2013 2014 2015

NON-REIMBURSABLE Final February Proposed New MTA Energy/ New All Adopted
Budget Labor Efficiencies Other Reimb. COA Other BudgetRevenueFarebox Revenue $5.726 5.726Vehicle Toll Revenue 0.000 0.000Other Operating Revenue 2.071 2.071Capital and Other Reimbursements 0.000 0.000Total Revenue $7.797 $0.000 $0.000 $0.000 $0.000 $0.000 $7.797
ExpensesLabor:Payroll $17.116 ($0.350) 16.766Overtime 0.681 0.681Health and Welfare 3.781 3.781OPEB Current Payment 0.639 0.639Pensions 5.941 5.941Other Fringe Benefits 1.302 (0.026) 1.276Reimbursable Overhead 0.000 0.000Total Labor Expenses $29.460 ($0.376) $0.000 $0.000 $0.000 $0.000 $29.084
Non-Labor:Electric Power $3.997 $0.000 $0.000 $0.089 $0.633 $0.000 4.719Fuel 0.000 0.000 0.000 (0.003) 0.412 0.000 0.409Insurance 0.267 0.267Claims 0.277 0.277Paratransit Service Contracts 0.000 0.000Maintenance and Other Operating Contracts 2.779 (1.045) 1.734Professional Service Contracts 0.421 0.421Materials & Supplies 3.614 3.614Other Business Expenses 0.005 0.005Total Non-Labor Expenses $11.360 $0.000 $0.000 $0.086 $0.000 $0.000 $11.446
Other Expense Adjustments:Other $0.000 0.000Total Other Expense Adjustments $0.000 $0.000 $0.000 $0.000 $0.000 $0.000 $0.000
Total Expenses Before Depreciation $40.820 ($0.376) $0.000 $0.086 $0.000 $0.000 $40.530
Depreciation $9.000 9.000Other Post Employment Benefits $3.000 3.000Environmental Remediation $0.000 0.000
Total Expenses $52.820 ($0.376) $0.000 $0.086 $0.000 $0.000 $52.530
Baseline Surplus/(Deficit) ($45.023) $0.376 $0.000 ($0.086) $0.000 $0.000 ($44.733)
MTA Staten Island Railway2012 February Adopted Budget
Reconciliation to the 2012 Final Proposed Budget vs. 2012 Adopted Budget by Generic Category (Accrual and Cash) ($ in millions)
2012
MTA Plan Adjustments

REIMBURSABLE Final February Proposed New MTA Energy/ New All Adopted
Budget Labor Efficiencies Other Reimb. COA Other BudgetRevenueFarebox Revenue $0.000 0.000Vehicle Toll Revenue 0.000 0.000Other Operating Revenue 0.000 0.000Capital and Other Reimbursements 1.672 1.672Total Revenue $1.672 $0.000 $0.000 $0.000 $0.000 $0.000 $1.672
ExpensesLabor:Payroll $0.288 0.288Overtime 0.704 0.704Health and Welfare 0.509 0.509OPEB Current Payment 0.000 0.000Pensions 0.094 0.094Other Fringe Benefits 0.077 0.077Reimbursable Overhead 0.000 0.000Total Labor Expenses $1.672 $0.000 $0.000 $0.000 $0.000 $0.000 $1.672
Non-Labor:Electric Power $0.000 $0.000 $0.000 $0.000 $0.000 $0.000 $0.000Fuel 0.000 0.000 0.000 0.000 0.000 0.000 0.000Insurance 0.000 0.000Claims 0.000 0.000Paratransit Service Contracts 0.000 0.000Maintenance and Other Operating Contracts 0.000 0.000Professional Service Contracts 0.000 0.000Materials & Supplies 0.000 0.000Other Business Expenses 0.000 0.000Total Non-Labor Expenses $0.000 $0.000 $0.000 $0.000 $0.000 $0.000 $0.000
Other Expense Adjustments:Other $0.000 0.000Total Other Expense Adjustments $0.000 $0.000 $0.000 $0.000 $0.000 $0.000 $0.000
Total Expenses Before Depreciation $1.672 $0.000 $0.000 $0.000 $0.000 $0.000 $1.672
Depreciation $0.000 0.000Other Post Employment Benefits $0.000 0.000Environmental Remediation $0.000 0.000
Total Expenses $1.672 $0.000 $0.000 $0.000 $0.000 $0.000 $1.672
Baseline Surplus/(Deficit) $0.000 $0.000 $0.000 $0.000 $0.000 $0.000 $0.000
2012
($ in millions)Reconciliation to the 2012 Final Proposed Budget vs. 2012 Adopted Budget by Generic Category (Accrual and Cash)
MTA Plan Adjustments
MTA Staten Island Railway2012 February Adopted Budget

NON REIMBURSABLE/REIMBURSABLE Final February Proposed New MTA Energy/ New All Adopted
Budget Labor Efficiencies Other Reimb. COA Other BudgetRevenueFarebox Revenue $5.726 $0.000 $0.000 $0.000 $0.000 $0.000 $5.726Vehicle Toll Revenue 0.000 0.000 0.000 0.000 0.000 0.000 0.000Other Operating Revenue 2.071 0.000 0.000 0.000 0.000 0.000 2.071Capital and Other Reimbursements 1.672 0.000 0.000 0.000 0.000 0.000 1.672Total Revenue $9.469 $0.000 $0.000 $0.000 $0.000 $0.000 $9.469
ExpensesLabor:Payroll $17.404 ($0.350) $0.000 $0.000 $0.000 $0.000 $17.054Overtime 1.385 0.000 0.000 0.000 0.000 0.000 1.385Health and Welfare 4.290 0.000 0.000 0.000 0.000 0.000 4.290OPEB Current Payment 0.639 0.000 0.000 0.000 0.000 0.000 0.639Pensions 6.035 0.000 0.000 0.000 0.000 0.000 6.035Other Fringe Benefits 1.379 (0.026) 0.000 0.000 0.000 0.000 1.353Reimbursable Overhead 0.000 0.000 0.000 0.000 0.000 0.000 0.000Total Labor Expenses $31.132 ($0.376) $0.000 $0.000 $0.000 $0.000 $30.756
Non-Labor:Electric Power $3.997 $0.000 $0.000 $0.089 $0.633 $0.000 $4.719Fuel 0.000 0.000 0.000 (0.003) 0.412 0.000 0.409Insurance 0.267 0.000 0.000 0.000 0.000 0.000 0.267Claims 0.277 0.000 0.000 0.000 0.000 0.000 0.277Paratransit Service Contracts 0.000 0.000 0.000 0.000 0.000 0.000 0.000Maintenance and Other Operating Contracts 2.779 0.000 0.000 0.000 (1.045) 0.000 1.734Professional Service Contracts 0.421 0.000 0.000 0.000 0.000 0.000 0.421Materials & Supplies 3.614 0.000 0.000 0.000 0.000 0.000 3.614Other Business Expenses 0.005 0.000 0.000 0.000 0.000 0.000 0.005Total Non-Labor Expenses $11.360 $0.000 $0.000 $0.086 $0.000 $0.000 $11.446
Other Expense Adjustments:Other $0.000 $0.000 $0.000 $0.000 $0.000 $0.000 $0.000Total Other Expense Adjustments $0.000 $0.000 $0.000 $0.000 $0.000 $0.000 $0.000
Total Expenses Before Depreciation $42.492 ($0.376) $0.000 $0.086 $0.000 $0.000 $42.202
Depreciation 9.000 0.000 0.000 0.000 0.000 0.000 9.000Other Post Employment Benefits 3.000 0.000 0.000 0.000 0.000 0.000 3.000Environmental Remediation 0.000 0.000 0.000 0.000 0.000 0.000 0.000
Total Expenses $54.492 ($0.376) $0.000 $0.086 $0.000 $0.000 $54.202
Baseline Surplus/(Deficit) ($45.023) $0.376 $0.000 ($0.086) $0.000 $0.000 ($44.733)
Reconciliation to the 2012 Final Proposed Budget vs. 2012 Adopted Budget by Generic Category (Accrual and Cash) ($ in millions)
2012 February Adopted BudgetMTA Staten Island Railway
2012
MTA Plan Adjustments

CASH RECEIPTS AND EXPENDITURES Final February Proposed New MTA Energy/ New All Adopted
Budget Labor Efficiencies Other Reimb. COA Other BudgetReceiptsFarebox Revenue $5.726 $5.726Vehicle Toll Revenue 0.000 0.000Other Operating Revenue 2.071 0.000 2.071Capital and Other Reimbursements 1.672 1.672Total Receipts $9.469 $0.000 $0.000 $0.000 $0.000 $0.000 $9.469
ExpendituresLabor:Payroll $21.959 ($0.350) $21.609Overtime 1.385 1.385Health and Welfare 4.290 4.290OPEB Current Payment 0.639 0.639Pensions 6.035 6.035Other Fringe Benefits 1.727 (0.026) 1.701GASB Account 0.347 0.347Reimbursable Overhead 0.000 0.000Total Labor Expenditures $36.382 ($0.376) $0.000 $0.000 $0.000 $0.000 $36.006
Non-Labor:Electric Power $3.997 $0.000 $0.000 $0.089 $0.633 $0.000 $4.719Fuel 0.000 0.000 0.000 (0.003) 0.412 0.000 0.409Insurance 0.267 0.267Claims 0.277 0.277Paratransit Service Contracts 0.000 0.000Maintenance and Other Operating Contracts 2.779 (1.045) 1.734Professional Service Contracts 0.421 0.421Materials & Supplies 3.614 3.614Other Business Expenses 0.005 0.005Total Non-Labor Expenditures $11.360 $0.000 $0.000 $0.086 $0.000 $0.000 $11.446
Other Expense Adjustments:B&T Capital Transfer $0.000 $0.000General Reserve 0.000 0.000Interagency Subsidy 0.000 0.000Other 0.000 0.000Total Other Expenditure Adjustments $0.000 $0.000 $0.000 $0.000 $0.000 $0.000 $0.000
Total Expenditures $47.742 ($0.376) $0.000 $0.086 $0.000 $0.000 $47.452-
Operating Cash Deficit ($38.273) $0.376 $0.000 ($0.086) $0.000 $0.000 ($37.983)
2012
MTA Staten Island Railway2012 February Adopted Budget
Reconciliation to the 2012 Final Proposed Budget vs. 2012 Adopted Budget by Generic Category (Accrual and Cash)
MTA Plan Adjustments
($ in millions)

CASH FLOW ADJUSTMENTS Final February Proposed New MTA Energy/ New All Adopted
Budget Labor Efficiencies Other Reimb. COA Other BudgetReceiptsFarebox Revenue $0.000 $0.000 $0.000 $0.000 $0.000 $0.000 $0.000Vehicle Toll Revenue 0.000 0.000 0.000 0.000 0.000 0.000 0.000Other Operating Revenue 0.000 0.000 0.000 0.000 0.000 0.000 0.000Capital and Other Reimbursements 0.000 0.000 0.000 0.000 0.000 0.000 0.000Total Receipts $0.000 $0.000 $0.000 $0.000 $0.000 $0.000 $0.000
ExpendituresLabor:Payroll ($4.555) $0.000 $0.000 $0.000 $0.000 $0.000 ($4.555)Overtime 0.000 0.000 0.000 0.000 0.000 0.000 0.000Health and Welfare 0.000 0.000 0.000 0.000 0.000 0.000 0.000OPEB Current Payment 0.000 0.000 0.000 0.000 0.000 0.000 0.000Pensions 0.000 0.000 0.000 0.000 0.000 0.000 0.000Other Fringe Benefits (0.348) 0.000 0.000 0.000 0.000 0.000 (0.348)GASB Account (0.347) 0.000 0.000 0.000 0.000 0.000 (0.347)Reimbursable Overhead 0.000 0.000 0.000 0.000 0.000 0.000 0.000Total Labor Expenditures ($5.250) $0.000 $0.000 $0.000 $0.000 $0.000 ($5.250)
Non-Labor:Electric Power $0.000 $0.000 $0.000 $0.000 $0.000 $0.000 $0.000Fuel 0.000 0.000 0.000 0.000 0.000 0.000 0.000Insurance 0.000 0.000 0.000 0.000 0.000 0.000 0.000Claims 0.000 0.000 0.000 0.000 0.000 0.000 0.000Paratransit Service Contracts 0.000 0.000 0.000 0.000 0.000 0.000 0.000Maintenance and Other Operating Contracts 0.000 0.000 0.000 0.000 0.000 0.000 0.000Professional Service Contracts 0.000 0.000 0.000 0.000 0.000 0.000 0.000Materials & Supplies 0.000 0.000 0.000 0.000 0.000 0.000 0.000Other Business Expenses 0.000 0.000 0.000 0.000 0.000 0.000 0.000Total Non-Labor Expenditures $0.000 $0.000 $0.000 $0.000 $0.000 $0.000 $0.000
Other Expense Adjustments:Other 0.000 0.000 0.000 0.000 0.000 0.000 0.000Total Other Expenditure Adjustments $0.000 $0.000 $0.000 $0.000 $0.000 $0.000 $0.000
Total Expenditures Before Depreciation ($5.250) $0.000 $0.000 $0.000 $0.000 $0.000 ($5.250)
Depreciation 9.000 0.000 0.000 0.000 0.000 0.000 9.000Other Post Employment Benefits 3.000 0.000 0.000 0.000 0.000 0.000 3.000
Total Expenditures $6.750 $0.000 $0.000 $0.000 $0.000 $0.000 $6.750
Baseline Surplus/(Deficit) $6.750 $0.000 $0.000 $0.000 $0.000 $0.000 $6.750
Reconciliation to the 2012 Final Proposed Budget vs. 2012 Adopted Budget by Generic Category (Accrual and Cash)
2012 February Adopted Budget
($ in millions)
MTA Plan Adjustments2012
MTA Staten Island Railway

NON-REIMBURSABLE
2011 2012
Final Adopted
Estimate* Budget 2013 2014 2015
Operating Revenue
Farebox Revenue $5.587 $5.726 $5.809 $5.904 $5.995
Toll Revenue
Other Operating Revenue 2.071 2.071 2.071 2.071 2.071
Capital and Other Reimbursements 0.000 0.000 0.000 0.000 0.000
Total Revenue $7.658 $7.797 $7.880 $7.975 $8.066
Operating Expenses
Labor:
Payroll $16.224 $16.766 $16.968 $17.283 $17.592
Overtime 0.792 0.681 0.696 0.712 0.727
Health and Welfare 3.390 3.781 3.982 4.299 4.641
OPEB Current Payment 0.585 0.639 0.678 0.733 0.793
Pensions 4.000 5.941 5.970 5.849 6.094
Other Fringe Benefits 1.234 1.276 1.290 1.313 1.342
Reimbursable Overhead 0.000 0.000 0.000 0.000 0.000
Total Labor Expenses $26.225 $29.084 $29.584 $30.189 $31.189
Non-Labor:
Electric Power $3.658 $4.719 $5.267 $5.903 $6.631
Fuel 0.000 0.409 0.427 0.422 0.422
Insurance 0.349 0.267 0.293 0.440 0.355
Claims 0.272 0.277 0.282 0.288 0.294
Paratransit Service Contracts 0.000 0.000 0.000 0.000 0.000
Maintenance and Other Operating Contracts 2.321 1.734 1.717 1.740 1.799
Professional Service Contracts 0.415 0.421 0.429 0.439 0.447
Materials & Supplies 1.115 3.614 1.714 1.978 2.023
Other Business Expenses 0.005 0.005 0.005 0.005 0.005
Total Non-Labor Expenses $8.135 $11.446 $10.134 $11.215 $11.976
Other Expenses Adjustments:
Other $0.000 $0.000 $0.000 $0.000 $0.000
Total Other Expense Adjustments $0.000 $0.000 $0.000 $0.000 $0.000
Total Expenses before Depreciation and GASB Adjs. $34.360 $40.530 $39.718 $41.404 $43.165
Depreciation $9.000 $9.000 $9.000 $9.000 $9.000
OPEB Obligation 2.800 3.000 3.000 3.000 3.000
Environmental Remediation 0.000 0.000 0.000 0.000 0.000
Total Expenses $46.160 $52.530 $51.718 $53.404 $55.165
Baseline Surplus/(Deficit) ($38.502) ($44.733) ($43.838) ($45.429) ($47.099)
*Effective 2012, the non-labor account structure of the MTA standard chart of accounts has been adjusted to reflect the reclassification and renaming of certain
accounts in order to improve account reporting consistency among the Agencies. These changes, which affect most non-labor accounts presented above, result in no
net-impact to the bottom line. In order to maintain comparability with 2011 actual results for year-end reporting purposes, the 2011 account structure remains unchanged.
MTA STATEN ISLAND RAILWAYFebruary Financial Plan 2012-2015
Accrual Statement of Operations by Category
($ in millions)

REIMBURSABLE
2011 2012Final Adopted
Estimate* Budget 2013 2014 2015
Revenue
Farebox Revenue $0.000 $0.000 $0.000 $0.000 $0.000
Toll Revenue 0.000 0.000 0.000 0.000 0.000
Other Operating Revenue 0.000 0.000 0.000 0.000 0.000
Capital and Other Reimbursements 0.600 1.672 1.674 1.680 1.680
Total Revenue $0.600 $1.672 $1.674 $1.680 $1.680
Expenses
Labor:
Payroll $0.100 $0.288 $0.287 $0.288 $0.288
Overtime 0.300 0.704 0.704 0.704 0.704
Health and Welfare 0.100 0.509 0.513 0.517 0.517
OPEB Current Payment 0.000 0.000 0.000 0.000 0.000
Pensions 0.050 0.094 0.094 0.094 0.094
Other Fringe Benefits 0.050 0.077 0.076 0.077 0.077
Reimbursable Overhead 0.000 0.000 0.000 0.000 0.000
Total Labor Expenses $0.600 $1.672 $1.674 $1.680 $1.680
Non-Labor:
Electric Power $0.000 $0.000 $0.000 $0.000 $0.000
Fuel 0.000 0.000 0.000 0.000 0.000
Insurance 0.000 0.000 0.000 0.000 0.000
Claims 0.000 0.000 0.000 0.000 0.000
Paratransit Service Contracts 0.000 0.000 0.000 0.000 0.000
Maintenance and Other Operating Contracts 0.000 0.000 0.000 0.000 0.000
Professional Service Contracts 0.000 0.000 0.000 0.000 0.000
Materials & Supplies 0.000 0.000 0.000 0.000 0.000
Other Business Expenses 0.000 0.000 0.000 0.000 0.000
Total Non-Labor Expenses $0.000 $0.000 $0.000 $0.000 $0.000
Other Expenses Adjustments:
Other
Total Other Expense Adjustments $0.000 $0.000 $0.000 $0.000 $0.000
Total Expenses before Depreciation $0.600 $1.672 $1.674 $1.680 $1.680
Depreciation - - - - -
Total Expenses $0.600 $1.672 $1.674 $1.680 $1.680
Baseline Surplus/(Deficit) $0.000 $0.000 $0.000 $0.000 $0.000
*Effective 2012, the non-labor account structure of the MTA standard chart of accounts has been adjusted to reflect the reclassification and renaming of certain
accounts in order to improve account reporting consistency among the Agencies. These changes, which affect most non-labor accounts presented above, result in no
net-impact to the bottom line. In order to maintain comparability with 2011 actual results for year-end reporting purposes, the 2011 account structure remains unchanged.
Accrual Statement of Operations by Category($ in millions)
MTA STATEN ISLAND RAILWAYFebruary Financial Plan 2012-2015

NON-REIMBURSABLE / REIMBURSABLE
2011 2012Final Adopted
Estimate* Budget 2013 2014 2015
Revenue
Farebox Revenue $5.587 $5.726 $5.809 $5.904 $5.995
Toll Revenue 0.000 0.000 0.000 0.000 0.000
Other Operating Revenue 2.071 2.071 2.071 2.071 2.071
Capital and Other Reimbursements 0.600 1.672 1.674 1.680 1.680
Total Revenue $8.258 $9.469 $9.554 $9.655 $9.746
Expenses
Labor:
Payroll $16.324 $17.054 $17.255 $17.571 $17.880
Overtime 1.092 1.385 1.400 1.416 1.431
Health and Welfare 3.490 4.290 4.495 4.816 5.158
OPEB Current Payment 0.585 0.639 0.678 0.733 0.793
Pensions 4.050 6.035 6.064 5.943 6.188
Other Fringe Benefits 1.284 1.353 1.366 1.390 1.419
Reimbursable Overhead 0.000 0.000 0.000 0.000 0.000
Total Labor Expenses $26.825 $30.756 $31.258 $31.869 $32.869
Non-Labor:
Electric Power $3.658 $4.719 $5.267 $5.903 $6.631
Fuel 0.000 0.409 0.427 0.422 0.422
Insurance 0.349 0.267 0.293 0.440 0.355
Claims 0.272 0.277 0.282 0.288 0.294
Paratransit Service Contracts 0.000 0.000 0.000 0.000 0.000
Maintenance and Other Operating Contracts 2.321 1.734 1.717 1.740 1.799
Professional Service Contracts 0.415 0.421 0.429 0.439 0.447
Materials & Supplies 1.115 3.614 1.714 1.978 2.023
Other Business Expenses 0.005 0.005 0.005 0.005 0.005
Total Non-Labor Expenses $8.135 $11.446 $10.134 $11.215 $11.976
Other Expenses Adjustments:
Other $0.000 $0.000 $0.000 $0.000 $0.000
Total Other Expense Adjustments $0.000 $0.000 $0.000 $0.000 $0.000
Total Expenses before Depreciation $34.960 $42.202 $41.392 $43.084 $44.845
Depreciation $9.000 $9.000 $9.000 $9.000 $9.000
OPEB Obligation 2.800 3.000 3.000 3.000 3.000
Environmental Remediation 0.000 0.000 0.000 0.000 0.000
Total Expenses $46.760 $54.202 $53.392 $55.084 $56.845
Baseline Surplus/(Deficit) ($38.502) ($44.733) ($43.838) ($45.429) ($47.099)
*Effective 2012, the non-labor account structure of the MTA standard chart of accounts has been adjusted to reflect the reclassification and renaming of certain
accounts in order to improve account reporting consistency among the Agencies. These changes, which affect most non-labor accounts presented above, result in no
net-impact to the bottom line. In order to maintain comparability with 2011 actual results for year-end reporting purposes, the 2011 account structure remains unchanged.
MTA STATEN ISLAND RAILWAYFebruary Financial Plan 2012-2015
Accrual Statement of Operations by Category($ in millions)

CASH RECEIPTS AND EXPENDITURES
2011 2012Final Adopted
Estimate* Budget 2013 2014 2015
Receipts
Farebox Revenue $5.587 $5.726 $5.809 $5.904 $5.995
Vehicle Toll Revenue 0.000 0.000 0.000 0.000 0.000
Other Operating Revenue 2.071 2.071 2.071 2.071 2.071
Capital and Other Reimbursements 0.600 1.672 1.674 1.680 1.680
Total Receipts $8.258 $9.469 $9.554 $9.655 $9.746
Expenditures
Labor:
Payroll $16.324 $21.609 $17.255 $17.571 $17.880
Overtime 1.092 1.385 1.400 1.416 1.431
Health and Welfare 3.490 4.290 4.495 4.816 5.158
OPEB Current Payment 0.585 0.639 0.678 0.733 0.793
Pensions 4.050 6.035 6.064 5.943 6.188
Other Fringe Benefits 1.284 1.701 1.366 1.390 1.419
GASB Account 0.317 0.347 0.379 0.415 0.415
Reimbursable Overhead 0.000 0.000 0.000 0.000 0.000
Total Labor Expenditures $27.142 $36.006 $31.637 $32.284 $33.284
Non-Labor:
Electric Power $3.658 $4.719 $5.267 $5.903 $6.631
Fuel 0.000 0.409 0.427 0.422 0.422
Insurance 0.383 0.267 0.293 0.440 0.355
Claims 0.272 0.277 0.282 0.288 0.294
Paratransit Service Contracts 0.000 0.000 0.000 0.000 0.000
Maintenance and Other Operating Contracts 2.321 1.734 1.717 1.740 1.799
Professional Service Contracts 0.415 0.421 0.429 0.439 0.447
Materials & Supplies 1.130 3.614 1.714 1.978 2.023
Other Business Expenses 0.005 0.005 0.005 0.005 0.005
Total Non-Labor Expenditures $8.184 $11.446 $10.134 $11.215 $11.976
Other Expenditure Adjustments:
Other
Total Other Expenditure Adjustments $0.000 $0.000 $0.000 $0.000 $0.000
Total Expenditures $35.326 $47.452 $41.771 $43.499 $45.260
Baseline Cash Deficit ($27.068) ($37.983) ($32.217) ($33.844) ($35.514)
*Effective 2012, the non-labor account structure of the MTA standard chart of accounts has been adjusted to reflect the reclassification and renaming of certain
accounts in order to improve account reporting consistency among the Agencies. These changes, which affect most non-labor accounts presented above, result in no
net-impact to the bottom line. In order to maintain comparability with 2011 actual results for year-end reporting purposes, the 2011 account structure remains unchanged.
MTA STATEN ISLAND RAILWAYFebruary Financial Plan 2012-2015
Cash Receipts & Expenditures($ in millions)

CASH FLOW ADJUSTMENTS
2011 2012
Final AdoptedEstimate* Budget 2013 2014 2015
Receipts
Farebox Revenue $0.000 $0.000 $0.000 $0.000 $0.000
Vehicle Toll Revenue 0.000 0.000 0.000 0.000 0.000
Other Operating Revenue 0.000 0.000 0.000 0.000 0.000
Capital and Other Reimbursements 0.000 0.000 0.000 0.000 0.000Total Receipts $0.000 $0.000 $0.000 $0.000 $0.000
Expenditures
Labor:
Payroll $0.000 ($4.555) $0.000 $0.000 $0.000
Overtime 0.000 0.000 0.000 0.000 0.000
Health and Welfare 0.000 0.000 0.000 0.000 0.000
OPEB Current Payment 0.000 0.000 0.000 0.000 0.000
Pensions 0.000 0.000 0.000 0.000 0.000
Other Fringe Benefits 0.000 (0.348) 0.000 0.000 0.000
GASB Account (0.317) (0.347) (0.379) (0.415) (0.415)
Reimbursable Overhead 0.000 0.000 0.000 0.000 0.000Total Labor Expenditures ($0.317) ($5.250) ($0.379) ($0.415) ($0.415)
Non-Labor:
Electric Power $0.000 $0.000 $0.000 $0.000 $0.000
Fuel 0.000 0.000 0.000 0.000 0.000
Insurance (0.034) 0.000 0.000 0.000 0.000
Claims 0.000 0.000 0.000 0.000 0.000
Paratransit Service Contracts 0.000 0.000 0.000 0.000 0.000
Maintenance and Other Operating Contracts 0.000 0.000 0.000 0.000 0.000
Professional Service Contracts 0.000 0.000 0.000 0.000 0.000
Materials & Supplies (0.015) 0.000 0.000 0.000 0.000
Other Business Expenditures 0.000 0.000 0.000 0.000 0.000
Total Non-Labor Expenditures ($0.049) $0.000 $0.000 $0.000 $0.000
Other Expenditures Adjustments:
Other $0.000 $0.000 $0.000 $0.000 $0.000
Total Other Expenditures Adjustments $0.000 $0.000 $0.000 $0.000 $0.000
Total Cash Conversion Adjustments before Depreciation and GASB Adjs.
($0.366) ($5.250) ($0.379) ($0.415) ($0.415)
Depreciation Adjustment $9.000 $9.000 $9.000 $9.000 $9.000
OPEB Obligation 2.800 3.000 3.000 3.000 3.000
Environmental Remediation 0.000 0.000 0.000 0.000 0.000
Total Cash Conversion Adjustments $11.434 $6.750 $11.621 $11.585 $11.585
*Effective 2012, the non-labor account structure of the MTA standard chart of accounts has been adjusted to reflect the reclassification and renaming of certain
accounts in order to improve account reporting consistency among the Agencies. These changes, which affect most non-labor accounts presented above, result in no
net-impact to the bottom line. In order to maintain comparability with 2011 actual results for year-end reporting purposes, the 2011 account structure remains unchanged.
Cash Conversion (Cash Flow Adjustments)($ in millions)
MTA STATEN ISLAND RAILWAYFebruary Financial Plan 2012-2015

NON-REIMBURSABLE OVERTIME Hours $ %
SCHEDULED:Direct Service 0 $0.000 0.0%
Programmed Maintenance 0 0.000 0.0%
Total Scheduled - $0.000 0.0%
UNSCHEDULED:Vacancy/Absentee Coverage 18,387 $0.681 100.0%
Weather Emergencies 0 0.000 0.0%
Maintenance 0 0.000 0.0%
Service Delays 0 0.000 0.0%
Emergencies 0 0.000 0.0%
Tour Length 0 0.000 0.0%
Safety/Security/Law Enforcement 0 0.000 0.0%
All Other 0 0.000 0.0%
Total Unscheduled 18,387 $0.681 100.0%
TOTAL NON-REIMBURSABLE OVERTIME: 18,387 $0.681 100.0%
REIMBURSABLE OVERTIME 19,008 $0.704
TOTAL OVERTIME 37,395 $1.385
MTA Staten Island Railway2012 Adopted Budget
2012 Non-Reimbursable/Reimbursable Overtime
Total

2011Final
Estimate
2012AdoptedBudget 2013 2014 2015
RIDERSHIP
Fixed Route 4.566 4.658 4.716 4.781 4.843
Baseline Total Ridership 4.566 4.658 4.716 4.781 4.843
FAREBOX REVENUE
Fixed Route $5.587 $5.726 $5.809 $5.904 $5.995
Paratransit
Baseline Total Revenue $5.587 $5.726 $5.809 $5.904 $5.995
MTA STATEN ISLAND RAILWAYFebruary Financial Plan 2012 - 2015
Ridership/(Utilization)(in millions)

2011Final
Estimate
2012AdoptedBudget 2013 2014 2015
AdministrationExecutive 9 9 9 9 9 General Office 8 7 7 7 7 Purchasing/Stores 5 5 5 5 5
Total Administration 22 21 21 21 21
OperationsTransportation 95 91 91 91 91
MaintenanceMechanical 35 35 35 35 35 Car and Station Cleaning 18 18 18 18 18 Power/Signals 25 25 25 25 25 Maintenance of Way 48 48 48 48 48 Bridge and Buildings 21 27 27 27 27 Material Handling 2 2 2 2 2
Total Maintenance 149 155 155 155 155
Engineering/CapitalNone - - - - -
Public SafetyPolice - - - - -
Baseline Total Positions 266 267 267 267 267
Non-Reimbursable 263 264 264 264 264 Reimbursable 3 3 3 3 3
Total Full-Time 266 267 267 267 267 Total Full-Time Equivalents
FUNCTION/DEPARTMENT
MTA STATEN ISLAND RAILWAYFebruary Financial Plan 2012 - 2015
Total Positions by Function and DepartmentNon-Reimbursable/Reimbursable and Full Time/Full Time Equivalents

FUNCTION/OCCUPATIONAL GROUP
2011Final
Estimate
2012AdoptedBudget 2013 2014 2015
Administration Managers/Supervisors 12 12 12 12 12 Professional, Technical, Clerical 10 9 9 9 9 Operational Hourlies - - - - -
Total Administration 22 21 21 21 21
Operations Managers/Supervisors 8 8 8 8 8 Professional, Technical, Clerical 4 4 4 4 4 Operational Hourlies 83 79 79 79 79
Total Operations 95 91 91 91 91
Maintenance Managers/Supervisors 6 6 6 6 6 Professional, Technical, Clerical 3 3 3 3 3 Operational Hourlies 140 146 146 146 146
Total Maintenance 149 155 155 155 155
Engineering/Capital Managers/Supervisors Professional, Technical, Clerical Operational Hourlies
Total Engineering/Capital - - - - -
Public Safety Managers/Supervisors Professional, Technical, Clerical Operational Hourlies
Total Public Safety - - - - -
Total Positions Managers/Supervisors Professional, Technical, Clerical 26 26 26 26 26 Operational Hourlies 17 16 16 16 16
Baseline Total Positions 223 225 225 225 225 266 267 267 267 267
MTA STATEN ISLAND RAILWAY
Total Positions by Function and OccupationFebruary Financial Plan 2012 - 2015

NON-REIMBURSABLE
Jan Feb Mar Apr May Jun Jul Aug Sep Oct Nov Dec Total
Operating Revenue
Farebox Revenue $0.454 $0.437 $0.489 $0.458 $0.493 $0.494 $0.492 $0.499 $0.472 $0.527 $0.482 $0.429 $5.726
Toll Revenue -
Other Operating Revenue 0.204 0.158 0.216 0.165 0.214 0.173 0.062 0.052 0.174 0.251 0.215 0.187 2.071
Capital and Other Reimbursements - - - - - - - - - - - - - Total Revenue $0.658 $0.595 $0.705 $0.623 $0.707 $0.667 $0.554 $0.551 $0.646 $0.778 $0.697 $0.616 $7.797
Operating Expenses
Labor:
Payroll $1.420 $1.329 $1.420 $1.374 $1.420 $1.374 $1.420 $1.420 $1.374 $1.420 $1.374 $1.421 16.766
Overtime 0.057 0.057 0.057 0.057 0.057 0.057 0.057 0.057 0.057 0.057 0.057 0.054 0.681
Health and Welfare 0.315 0.315 0.315 0.315 0.315 0.315 0.315 0.315 0.315 0.315 0.315 0.316 3.781
OPEB Current Payment 0.053 0.053 0.053 0.053 0.053 0.053 0.053 0.053 0.053 0.053 0.053 0.056 0.639
Pensions 0.495 0.495 0.495 0.495 0.495 0.495 0.495 0.495 0.495 0.495 0.495 0.496 5.941
Other Fringe Benefits 0.108 0.101 0.108 0.105 0.108 0.105 0.108 0.108 0.105 0.108 0.105 0.107 1.276
Reimbursable Overhead 0.000 0.000 0.000 0.000 0.000 0.000 0.000 0.000 0.000 0.000 0.000 0.000 0.000Total Labor Expenses $2.448 $2.350 $2.448 $2.399 $2.448 $2.399 $2.448 $2.448 $2.399 $2.448 $2.399 $2.450 $29.084
Non-Labor:
Electric Power $0.394 $0.394 $0.394 $0.394 $0.394 $0.394 $0.393 $0.393 $0.393 $0.392 $0.392 $0.392 $4.719
Fuel 0.034 0.034 0.034 0.034 0.034 0.034 0.034 0.034 0.034 0.034 0.034 0.035 0.409
Insurance 0.022 0.022 0.022 0.022 0.022 0.022 0.022 0.022 0.022 0.023 0.023 0.023 0.267
Claims 0.023 0.023 0.023 0.023 0.023 0.023 0.023 0.023 0.023 0.023 0.023 0.024 0.277
Paratransit Service Contracts 0.000 0.000 0.000 0.000 0.000 0.000 0.000 0.000 0.000 0.000 0.000 0.000 0.000
Maintenance and Other Operating Contracts 0.144 0.144 0.144 0.144 0.144 0.144 0.145 0.145 0.145 0.145 0.145 0.145 1.734
Professional Service Contracts 0.035 0.035 0.035 0.035 0.035 0.035 0.035 0.035 0.035 0.035 0.035 0.036 0.421
Materials & Supplies 0.301 0.301 0.301 0.301 0.301 0.301 0.301 0.301 0.301 0.301 0.302 0.302 3.614
Other Business Expenses 0.001 0.001 0.001 0.001 0.001 0.000 0.000 0.000 0.000 0.000 0.000 0.000 0.005Total Non-Labor Expenses $0.954 $0.954 $0.954 $0.954 $0.954 $0.953 $0.953 $0.953 $0.953 $0.953 $0.954 $0.957 $11.446
Other Expenses Adjustments:
Other $0.000Total Other Expense Adjustments $0.000 $0.000 $0.000 $0.000 $0.000 $0.000 $0.000 $0.000 $0.000 $0.000 $0.000 $0.000 $0.000
Total Expenses before Non-Cash Liability Adjs. $3.402 $3.304 $3.402 $3.353 $3.402 $3.352 $3.401 $3.401 $3.352 $3.401 $3.353 $3.407 $40.530
Depreciation 0.750 0.750 0.750 0.750 0.750 0.750 0.750 0.750 0.750 0.750 0.750 0.750 9.000
OPEB Obligation 0.250 0.250 0.250 0.250 0.250 0.250 0.250 0.250 0.250 0.250 0.250 0.250 3.000
Environmental Remediation - - - - - - - - - - - - -
Total Expenses $4.402 $4.304 $4.402 $4.353 $4.402 $4.352 $4.401 $4.401 $4.352 $4.401 $4.353 $4.407 $52.530
Net Surplus/(Deficit) ($3.744) ($3.709) ($3.697) ($3.730) ($3.695) ($3.685) ($3.847) ($3.850) ($3.706) ($3.623) ($3.656) ($3.791) ($44.733)
MTA STATEN ISLAND RAILWAYFebruary Financial Plan - 2012 Adopted Budget
Accrual Statement of Operations by Category
($ in millions)

REIMBURSABLE
Jan Feb Mar Apr May Jun Jul Aug Sep Oct Nov Dec Total
Revenue
Farebox Revenue $0.000 $0.000 $0.000 $0.000 $0.000 $0.000 $0.000 $0.000 $0.000 $0.000 $0.000 $0.000 $0.000
Toll Revenue - - - - - - - - - - - - -
Other Operating Revenue - - - - - - - - - - - - -
Capital and Other Reimbursements 0.138 0.138 0.139 0.139 0.139 0.139 0.140 0.141 0.140 0.140 0.140 0.139 1.672 Total Revenue $0.138 $0.138 $0.139 $0.139 $0.139 $0.139 $0.140 $0.141 $0.140 $0.140 $0.140 $0.139 $1.672
Expenses
Labor:
Payroll $0.024 $0.024 $0.024 $0.024 $0.024 $0.024 $0.024 $0.024 $0.024 $0.024 $0.024 $0.024 $0.288
Overtime 0.059 0.059 0.059 0.059 0.059 0.059 0.059 0.059 0.058 0.058 0.058 0.058 0.704
Health and Welfare 0.042 0.042 0.042 0.042 0.042 0.042 0.043 0.043 0.043 0.043 0.043 0.042 0.509
OPEB Current Payment - - - - - - - - - - - - -
Pensions 0.007 0.007 0.008 0.008 0.008 0.008 0.008 0.008 0.008 0.008 0.008 0.008 0.094
Other Fringe Benefits 0.006 0.006 0.006 0.006 0.006 0.006 0.006 0.007 0.007 0.007 0.007 0.007 0.077
Reimbursable Overhead - Total Labor Expenses $0.138 $0.138 $0.139 $0.139 $0.139 $0.139 $0.140 $0.141 $0.140 $0.140 $0.140 $0.139 $1.672
Non-Labor:
Electric Power $0.000 $0.000 $0.000 $0.000 $0.000 $0.000 $0.000 $0.000 $0.000 $0.000 $0.000 $0.000 $0.000
Fuel $0.000 $0.000 $0.000 $0.000 $0.000 $0.000 $0.000 $0.000 $0.000 $0.000 $0.000 $0.000 $0.000
Insurance - - - - - - - - - - - - -
Claims - - - - - - - - - - - - -
Paratransit Service Contracts - - - - - - - - - - - - -
Maintenance and Other Operating Contracts - - - - - - - - - - - - -
Professional Service Contracts - - - - - - - - - - - - -
Materials & Supplies - - - - - - - - - - - - -
Other Business Expenses - - - - - - - - - - - - - Total Non-Labor Expenses $0.000 $0.000 $0.000 $0.000 $0.000 $0.000 $0.000 $0.000 $0.000 $0.000 $0.000 $0.000 $0.000
Other Expenses Adjustments:
Other - - - - - - - - - - - - - Total Other Expense Adjustments $0.000 $0.000 $0.000 $0.000 $0.000 $0.000 $0.000 $0.000 $0.000 $0.000 $0.000 $0.000 $0.000
Total Expenses before Depreciation $0.138 $0.138 $0.139 $0.139 $0.139 $0.139 $0.140 $0.141 $0.140 $0.140 $0.140 $0.139 $1.672
Depreciation - - - - - - - - - - - - -
Total Expenses $0.138 $0.138 $0.139 $0.139 $0.139 $0.139 $0.140 $0.141 $0.140 $0.140 $0.140 $0.139 $1.672
Net Surplus/(Deficit) $0.000 $0.000 $0.000 $0.000 $0.000 $0.000 $0.000 $0.000 $0.000 $0.000 $0.000 $0.000 $0.000
Accrual Statement of Operations by Category
($ in millions)
MTA STATEN ISLAND RAILWAYFebruary Financial Plan - 2012 Adopted Budget
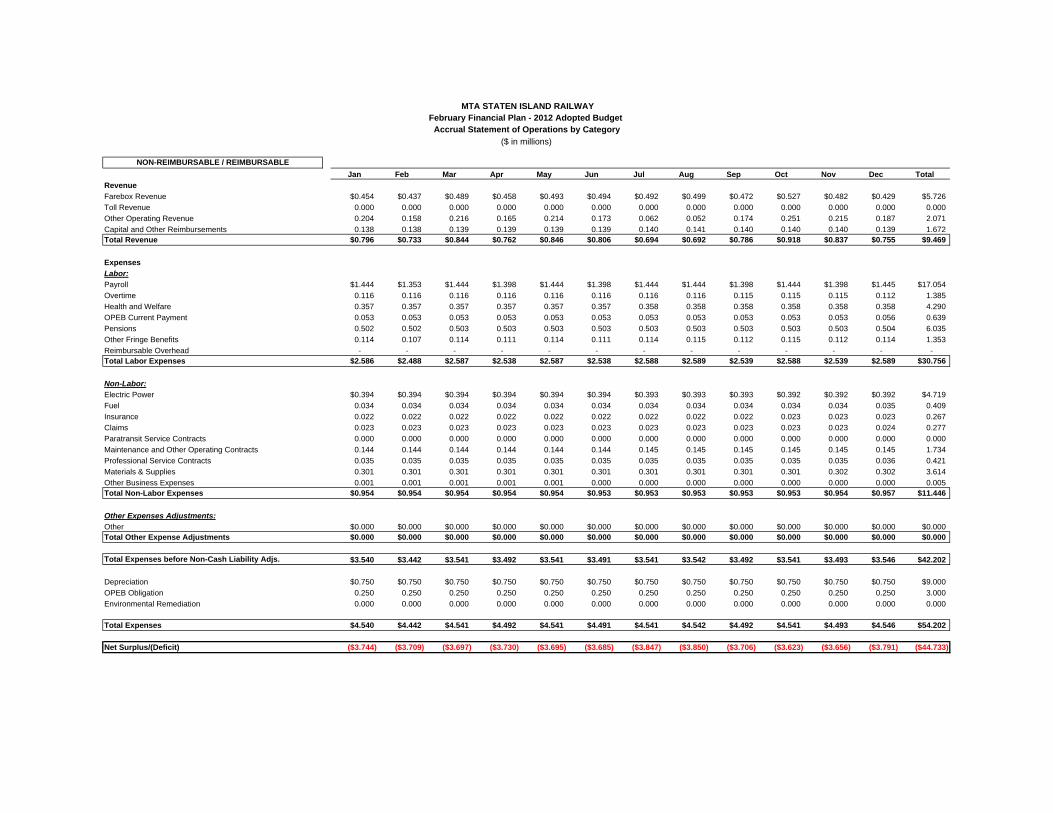
NON-REIMBURSABLE / REIMBURSABLE
Jan Feb Mar Apr May Jun Jul Aug Sep Oct Nov Dec Total
Revenue
Farebox Revenue $0.454 $0.437 $0.489 $0.458 $0.493 $0.494 $0.492 $0.499 $0.472 $0.527 $0.482 $0.429 $5.726
Toll Revenue 0.000 0.000 0.000 0.000 0.000 0.000 0.000 0.000 0.000 0.000 0.000 0.000 0.000
Other Operating Revenue 0.204 0.158 0.216 0.165 0.214 0.173 0.062 0.052 0.174 0.251 0.215 0.187 2.071
Capital and Other Reimbursements 0.138 0.138 0.139 0.139 0.139 0.139 0.140 0.141 0.140 0.140 0.140 0.139 1.672Total Revenue $0.796 $0.733 $0.844 $0.762 $0.846 $0.806 $0.694 $0.692 $0.786 $0.918 $0.837 $0.755 $9.469
Expenses
Labor:
Payroll $1.444 $1.353 $1.444 $1.398 $1.444 $1.398 $1.444 $1.444 $1.398 $1.444 $1.398 $1.445 $17.054
Overtime 0.116 0.116 0.116 0.116 0.116 0.116 0.116 0.116 0.115 0.115 0.115 0.112 1.385
Health and Welfare 0.357 0.357 0.357 0.357 0.357 0.357 0.358 0.358 0.358 0.358 0.358 0.358 4.290
OPEB Current Payment 0.053 0.053 0.053 0.053 0.053 0.053 0.053 0.053 0.053 0.053 0.053 0.056 0.639
Pensions 0.502 0.502 0.503 0.503 0.503 0.503 0.503 0.503 0.503 0.503 0.503 0.504 6.035
Other Fringe Benefits 0.114 0.107 0.114 0.111 0.114 0.111 0.114 0.115 0.112 0.115 0.112 0.114 1.353
Reimbursable Overhead - - - - - - - - - - - - - Total Labor Expenses $2.586 $2.488 $2.587 $2.538 $2.587 $2.538 $2.588 $2.589 $2.539 $2.588 $2.539 $2.589 $30.756
Non-Labor:
Electric Power $0.394 $0.394 $0.394 $0.394 $0.394 $0.394 $0.393 $0.393 $0.393 $0.392 $0.392 $0.392 $4.719
Fuel 0.034 0.034 0.034 0.034 0.034 0.034 0.034 0.034 0.034 0.034 0.034 0.035 0.409
Insurance 0.022 0.022 0.022 0.022 0.022 0.022 0.022 0.022 0.022 0.023 0.023 0.023 0.267
Claims 0.023 0.023 0.023 0.023 0.023 0.023 0.023 0.023 0.023 0.023 0.023 0.024 0.277
Paratransit Service Contracts 0.000 0.000 0.000 0.000 0.000 0.000 0.000 0.000 0.000 0.000 0.000 0.000 0.000
Maintenance and Other Operating Contracts 0.144 0.144 0.144 0.144 0.144 0.144 0.145 0.145 0.145 0.145 0.145 0.145 1.734
Professional Service Contracts 0.035 0.035 0.035 0.035 0.035 0.035 0.035 0.035 0.035 0.035 0.035 0.036 0.421
Materials & Supplies 0.301 0.301 0.301 0.301 0.301 0.301 0.301 0.301 0.301 0.301 0.302 0.302 3.614
Other Business Expenses 0.001 0.001 0.001 0.001 0.001 0.000 0.000 0.000 0.000 0.000 0.000 0.000 0.005Total Non-Labor Expenses $0.954 $0.954 $0.954 $0.954 $0.954 $0.953 $0.953 $0.953 $0.953 $0.953 $0.954 $0.957 $11.446
Other Expenses Adjustments:
Other $0.000 $0.000 $0.000 $0.000 $0.000 $0.000 $0.000 $0.000 $0.000 $0.000 $0.000 $0.000 $0.000Total Other Expense Adjustments $0.000 $0.000 $0.000 $0.000 $0.000 $0.000 $0.000 $0.000 $0.000 $0.000 $0.000 $0.000 $0.000
Total Expenses before Non-Cash Liability Adjs. $3.540 $3.442 $3.541 $3.492 $3.541 $3.491 $3.541 $3.542 $3.492 $3.541 $3.493 $3.546 $42.202
Depreciation $0.750 $0.750 $0.750 $0.750 $0.750 $0.750 $0.750 $0.750 $0.750 $0.750 $0.750 $0.750 $9.000
OPEB Obligation 0.250 0.250 0.250 0.250 0.250 0.250 0.250 0.250 0.250 0.250 0.250 0.250 3.000
Environmental Remediation 0.000 0.000 0.000 0.000 0.000 0.000 0.000 0.000 0.000 0.000 0.000 0.000 0.000
Total Expenses $4.540 $4.442 $4.541 $4.492 $4.541 $4.491 $4.541 $4.542 $4.492 $4.541 $4.493 $4.546 $54.202
Net Surplus/(Deficit) ($3.744) ($3.709) ($3.697) ($3.730) ($3.695) ($3.685) ($3.847) ($3.850) ($3.706) ($3.623) ($3.656) ($3.791) ($44.733)
($ in millions)
February Financial Plan - 2012 Adopted Budget Accrual Statement of Operations by Category
MTA STATEN ISLAND RAILWAY

CASH RECEIPTS AND EXPENDITURES
Jan Feb Mar Apr May Jun Jul Aug Sep Oct Nov Dec Total
Receipts
Farebox Revenue $0.454 $0.437 $0.489 $0.458 $0.493 $0.494 $0.492 $0.499 $0.472 $0.527 $0.482 $0.429 $5.726
Vehicle Toll Revenue - - - - - - - - - - - - 0.000
Other Operating Revenue 0.204 0.158 0.216 0.165 0.214 0.173 0.062 0.052 0.174 0.251 0.215 0.187 2.071
Capital and Other Reimbursements 0.138 0.138 0.139 0.139 0.139 0.139 0.140 0.141 0.140 0.140 0.140 0.139 1.672Total Receipts $0.796 $0.733 $0.844 $0.762 $0.846 $0.806 $0.694 $0.692 $0.786 $0.918 $0.837 $0.755 $9.469
Expenditures
Labor:
Payroll $1.959 $1.314 $1.314 $1.314 $1.314 $1.314 $1.959 $1.314 $1.314 $1.314 $1.314 $5.865 21.609
Overtime 0.116 0.116 0.116 0.116 0.116 0.116 0.116 0.116 0.115 0.115 0.115 0.112 1.385
Health and Welfare 0.357 0.357 0.357 0.357 0.357 0.357 0.358 0.358 0.358 0.358 0.358 0.358 4.290
OPEB Current Payment 0.053 0.053 0.053 0.053 0.053 0.053 0.053 0.053 0.053 0.053 0.053 0.056 0.639
Pensions 0.502 0.502 0.503 0.503 0.503 0.503 0.503 0.503 0.503 0.503 0.503 0.504 6.035
Other Fringe Benefits 0.114 0.107 0.114 0.111 0.114 0.111 0.114 0.115 0.112 0.115 0.112 0.462 1.701
GASB Account 0.000 0.000 0.000 0.000 0.000 0.000 0.000 0.000 0.000 0.000 0.000 0.347 0.347
Reimbursable Overhead 0.000 0.000 0.000 0.000 0.000 0.000 0.000 0.000 0.000 0.000 0.000 0.000 0.000Total Labor Expenditures $3.101 $2.449 $2.457 $2.454 $2.457 $2.454 $3.103 $2.459 $2.455 $2.458 $2.455 $7.704 $36.006
Non-Labor:
Electric Power $0.394 $0.394 $0.394 $0.394 $0.394 $0.394 $0.393 $0.393 $0.393 $0.392 $0.392 $0.392 $4.719
Fuel $0.034 $0.034 $0.034 $0.034 $0.034 $0.034 $0.034 $0.034 $0.034 $0.034 $0.034 $0.035 0.409
Insurance 0.022 0.022 0.022 0.022 0.022 0.022 0.022 0.022 0.022 0.023 0.023 0.023 0.267
Claims 0.023 0.023 0.023 0.023 0.023 0.023 0.023 0.023 0.023 0.023 0.023 0.024 0.277
Paratransit Service Contracts - - - - - - - - - - - - 0.000
Maintenance and Other Operating Contracts 0.144 0.144 0.144 0.144 0.144 0.144 0.145 0.145 0.145 0.145 0.145 0.145 1.734
Professional Service Contracts 0.035 0.035 0.035 0.035 0.035 0.035 0.035 0.035 0.035 0.035 0.035 0.036 0.421
Materials & Supplies 0.301 0.301 0.301 0.301 0.301 0.301 0.301 0.301 0.301 0.301 0.302 0.302 3.614
Other Business Expenses 0.001 0.001 0.001 0.001 0.001 - - - - - - - 0.005Total Non-Labor Expenditures $0.954 $0.954 $0.954 $0.954 $0.954 $0.953 $0.953 $0.953 $0.953 $0.953 $0.954 $0.957 $11.446
Other Expenditure Adjustments:
Other - - - - - - - - - - - - $0.000Total Other Expenditure Adjustments $0.000 $0.000 $0.000 $0.000 $0.000 $0.000 $0.000 $0.000 $0.000 $0.000 $0.000 $0.000 $0.000
Total Expenditures $4.055 $3.403 $3.411 $3.408 $3.411 $3.407 $4.056 $3.412 $3.408 $3.411 $3.409 $8.661 $47.452
Net Cash Deficit ($3.259) ($2.670) ($2.567) ($2.646) ($2.565) ($2.601) ($3.362) ($2.720) ($2.622) ($2.493) ($2.572) ($7.906) ($37.983)
MTA STATEN ISLAND RAILWAYFebruary Financial Plan - 2012 Adopted Budget
($ in millions)
Cash Receipts & Expenditures

CASH FLOW ADJUSTMENTS
Jan Feb Mar Apr May Jun Jul Aug Sep Oct Nov Dec Total
Receipts
Farebox Revenue $0.000 $0.000 $0.000 $0.000 $0.000 $0.000 $0.000 $0.000 $0.000 $0.000 $0.000 $0.000 $0.000
Vehicle Toll Revenue 0.000 0.000 0.000 0.000 0.000 0.000 0.000 0.000 0.000 0.000 0.000 0.000 0.000
Other Operating Revenue 0.000 0.000 0.000 0.000 0.000 0.000 0.000 0.000 0.000 0.000 0.000 0.000 0.000
Capital and Other Reimbursements 0.000 0.000 0.000 0.000 0.000 0.000 0.000 0.000 0.000 0.000 0.000 0.000 0.000Total Receipts $0.000 $0.000 $0.000 $0.000 $0.000 $0.000 $0.000 $0.000 $0.000 $0.000 $0.000 $0.000 $0.000
Expenditures
Labor:
Payroll ($0.515) $0.039 $0.130 $0.084 $0.130 $0.084 ($0.515) $0.130 $0.084 $0.130 $0.084 ($4.420) ($4.555)
Overtime 0.000 0.000 0.000 0.000 0.000 0.000 0.000 0.000 0.000 0.000 0.000 0.000 0.000
Health and Welfare 0.000 0.000 0.000 0.000 0.000 0.000 0.000 0.000 0.000 0.000 0.000 0.000 0.000
OPEB Current Payment 0.000 0.000 0.000 0.000 0.000 0.000 0.000 0.000 0.000 0.000 0.000 0.000 0.000
Pensions 0.000 0.000 0.000 0.000 0.000 0.000 0.000 0.000 0.000 0.000 0.000 0.000 0.000
Other Fringe Benefits 0.000 0.000 0.000 0.000 0.000 0.000 0.000 0.000 0.000 0.000 0.000 (0.348) (0.348)
GASB Account 0.000 0.000 0.000 0.000 0.000 0.000 0.000 0.000 0.000 0.000 0.000 (0.347) (0.347)
Reimbursable Overhead 0.000 0.000 0.000 0.000 0.000 0.000 0.000 0.000 0.000 0.000 0.000 0.000 0.000Total Labor Expenditures ($0.515) $0.039 $0.130 $0.084 $0.130 $0.084 ($0.515) $0.130 $0.084 $0.130 $0.084 ($5.115) ($5.250)
Non-Labor:
Electric Power $0.000 $0.000 $0.000 $0.000 $0.000 $0.000 $0.000 $0.000 $0.000 $0.000 $0.000 $0.000 $0.000
Fuel 0.000 0.000 0.000 0.000 0.000 0.000 0.000 0.000 0.000 0.000 0.000 0.000 0.000
Insurance 0.000 0.000 0.000 0.000 0.000 0.000 0.000 0.000 0.000 0.000 0.000 0.000 0.000
Claims 0.000 0.000 0.000 0.000 0.000 0.000 0.000 0.000 0.000 0.000 0.000 0.000 0.000
Paratransit Service Contracts 0.000 0.000 0.000 0.000 0.000 0.000 0.000 0.000 0.000 0.000 0.000 0.000 0.000
Maintenance and Other Operating Contracts 0.000 0.000 0.000 0.000 0.000 0.000 0.000 0.000 0.000 0.000 0.000 0.000 0.000
Professional Service Contracts 0.000 0.000 0.000 0.000 0.000 0.000 0.000 0.000 0.000 0.000 0.000 0.000 0.000
Materials & Supplies 0.000 0.000 0.000 0.000 0.000 0.000 0.000 0.000 0.000 0.000 0.000 0.000 0.000
Other Business Expenditures 0.000 0.000 0.000 0.000 0.000 0.000 0.000 0.000 0.000 0.000 0.000 0.000 0.000Total Non-Labor Expenditures $0.000 $0.000 $0.000 $0.000 $0.000 $0.000 $0.000 $0.000 $0.000 $0.000 $0.000 $0.000 $0.000
Other Expenditures Adjustments:
Other $0.000 $0.000 $0.000 $0.000 $0.000 $0.000 $0.000 $0.000 $0.000 $0.000 $0.000 $0.000 $0.000Total Other Expenditures Adjustments $0.000 $0.000 $0.000 $0.000 $0.000 $0.000 $0.000 $0.000 $0.000 $0.000 $0.000 $0.000 $0.000
Total Cash Conversion Adjustments before Non-Cash Liability Adjs. ($0.515) $0.039 $0.130 $0.084 $0.130 $0.084 ($0.515) $0.130 $0.084 $0.130 $0.084 ($5.115) ($5.250)
Depreciation Adjustment 0.750 0.750 0.750 0.750 0.750 0.750 0.750 0.750 0.750 0.750 0.750 0.750 9.000
OPEB Obligation 0.250 0.250 0.250 0.250 0.250 0.250 0.250 0.250 0.250 0.250 0.250 0.250 3.000
Environmental Remediation 0.000 0.000 0.000 0.000 0.000 0.000 0.000 0.000 0.000 0.000 0.000 0.000 0.000
Total Cash Conversion Adjustments $0.485 $1.039 $1.130 $1.084 $1.130 $1.084 $0.485 $1.130 $1.084 $1.130 $1.084 ($4.115) $6.750
Cash Conversion (Cash Flow Adjustments)February Financial Plan - 2012 Adopted Budget
($ in millions)
MTA STATEN ISLAND RAILWAY

MTA STATEN ISLAND RAILWAYFebruary Financial Plan - 2012 Adopted Budget
Overtime - Non-Reimbursable/Reimbursable Basis($ in millions)
NON-REIMBURSABLE
SCHEDULED:Direct Service $0.000
Programmed Maintenance $0.000
Total Scheduled $0.000 $0.000 $0.000 $0.000 $0.000 $0.000 $0.000 $0.000 $0.000 $0.000 $0.000 $0.000 $0.000
UNSCHEDULED:Vacancy/Absentee Coverage $0.057 $0.057 $0.057 $0.057 $0.057 $0.057 $0.057 $0.057 $0.057 $0.057 $0.057 $0.054 $0.681
Weather Emergencies $0.000
Maintenance $0.000
Service Delays - - - - - - - - - - - - $0.000
Emergencies - - - - - - - - - - - - $0.000
Tour Length - - - - - - - - - - - - $0.000
Safety/Security/Law Enforcement - - - - - - - - - - - - $0.000
All Other $0.000
Total Unscheduled $0.057 $0.057 $0.057 $0.057 $0.057 $0.057 $0.057 $0.057 $0.057 $0.057 $0.057 $0.054 $0.681
TOTAL NON-REIMBURSABLE OVERTIME: $0.057 $0.057 $0.057 $0.057 $0.057 $0.057 $0.057 $0.057 $0.057 $0.057 $0.057 $0.054 $0.681
REIMBURSABLE OVERTIME $0.059 $0.059 $0.059 $0.059 $0.059 $0.059 $0.059 $0.059 $0.058 $0.058 $0.058 $0.058 $0.704
TOTAL NR & R OVERTIME $0.116 $0.116 $0.116 $0.116 $0.116 $0.116 $0.116 $0.116 $0.115 $0.115 $0.115 $0.112 $1.385
TotalJuly August September October November DecemberJan Feb Mar Apr May June

MTA STATEN ISLAND RAILWAYFebruary Financial Plan - 2012 Adopted Budget
Ridership/(Utilization)(in millions)
Jan Feb Mar Apr May Jun Jul Aug Sep Oct Nov Dec Total
Baseline Ridership 0.387 0.357 0.417 0.373 0.417 0.398 0.346 0.347 0.386 0.458 0.411 0.361 4.658
Total Ridership 0.387 0.357 0.417 0.373 0.417 0.398 0.346 0.347 0.386 0.458 0.411 0.361 4.658

Jan Feb Mar Apr May Jun Jul Aug Sep Oct Nov Dec
AdministrationExecutive 9 9 9 9 9 9 9 9 9 9 9 9General Office 8 8 8 8 8 8 8 8 8 8 8 7Purchasing/Stores 5 5 5 5 5 5 5 5 5 5 5 5
Total Administration 22 22 22 22 22 22 22 22 22 22 22 21
OperationsTransportation 95 95 95 95 91 91 91 91 91 91 91 91
MaintenanceMechanical 35 35 35 35 35 35 35 35 35 35 35 35Car and Station Cleaning 18 18 18 18 18 18 18 18 18 18 18 18Power/Signals 25 25 25 25 25 25 25 25 25 25 25 25Maintenance of Way 48 48 48 48 48 48 48 48 48 48 48 48Bridge and Buildings 27 27 27 27 27 27 27 27 27 27 27 27Material Handling 2 2 2 2 2 2 2 2 2 2 2 2
Total Maintenance 155 155 155 155 155 155 155 155 155 155 155 155
Public SafetyPolice 0 0 0 0 0 0 0 0 0 0 0 0
Total Baseline Positions 272 272 272 272 268 268 268 268 268 268 268 267
Non-Reimbursable 269 269 269 269 265 265 265 265 265 265 265 264Reimbursable 3 3 3 3 3 3 3 3 3 3 3 3
Total Full-Time 272 272 272 272 268 268 268 268 268 268 268 267Total Full-Time-Equivalents - - - - - - - - - - - -
FUNCTION/DEPARTMENT
MTA STATEN ISLAND RAILWAYFebruary Financial Plan - 2012 Adopted Budget
Total Positions by Function and DepartmentNon-Reimbursable/Reimbursable and Full-Time/Full-Time Equivalents

FUNCTION/OCCUPATION Jan Feb Mar Apr May Jun Jul Aug Sep Oct Nov Dec
Administration
Managers/Supervisors 12 12 12 12 12 12 12 12 12 12 12 12
Professional, Technical, Clerical 10 10 10 10 10 10 10 10 10 10 10 9
Operational Hourlies
Total Administration 22 22 22 22 22 22 22 22 22 22 22 21
Operations
Managers/Supervisors 9 9 9 9 8 8 8 8 8 8 8 8
Professional, Technical, Clerical 4 4 4 4 4 4 4 4 4 4 4 4
Operational Hourlies 82 82 82 82 79 79 79 79 79 79 79 79
Total Operations 95 95 95 95 91 91 91 91 91 91 91 91
Maintenance
Managers/Supervisors 6 6 6 6 6 6 6 6 6 6 6 6
Professional, Technical, Clerical 3 3 3 3 3 3 3 3 3 3 3 3
Operational Hourlies 146 146 146 146 146 146 146 146 146 146 146 146
Total Maintenance 155 155 155 155 155 155 155 155 155 155 155 155
Engineering/Capital
Managers/Supervisors - - - - - - - - - - - -
Professional, Technical, Clerical - - - - - - - - - - - -
Operational Hourlies - - - - - - - - - - - -
Total Engineering/Capital - - - - - - - - - - - -
Public Safety
Managers/Supervisors - - - - - - - - - - - -
Professional, Technical, Clerical - - - - - - - - - - - -
Operational Hourlies - - - - - - - - - - - -
Total Public Safety - - - - - - - - - - - -
Total Baseline Positions
Managers/Supervisors 27 27 27 27 26 26 26 26 26 26 26 26
Professional, Technical, Clerical 17 17 17 17 17 17 17 17 17 17 17 16
Operational Hourlies 228 228 228 228 225 225 225 225 225 225 225 225
Total Positions 272 272 272 272 268 268 268 268 268 268 268 267
MTA STATEN ISLAND RAILWAYFebruary Financial Plan - 2012 Adopted Budget
Total Positions by Function and Occupation

[THIS PAGE INTENTIONALLY LEFT BLANK]

VII. Appendix

Staff Summary Page 1 of 6
Subject MTA Consolidated 2012 Operating Budget
Date December 14, 2011
Department
Vendor Name
Department Chief Financial Officer
Contract Number
Department Head Name Robert E. Foran
Contract Manager Name
Project Manager/Division Head Douglas F. Johnson
Table of Contents Ref #
Board Action Internal Approvals
Order
To
Date
Approval
Info Other
Order Approval
Order Approval
1 Finance Comm.
12/19 1 Chief Financial Officer
2 Board 12/21 2 Legal
3 Executive Director
Purpose: To secure MTA Board (i) adoption of the accompanying 2012 Final Proposed Budget and the Four Year Financial Plan 2012-2015 (December Plan), which includes approving the 2011 Final Estimate, the General Reserve, and all Plan Adjustments (items below the baseline), and (ii) authorization of Budget and Plan adjustments, budget and cash management actions and other staff actions as set forth below in the Staff Summary. Discussion: This document summarizes the Plan presented to the Board in November (“November Plan”) and describes new developments that have adversely impacted this Plan and which require the Board’s consideration of additional budgetary measures to be incorporated into the 2012 Final Proposed Budget and Four-Year Financial Plan (the “December Plan”). Subsequent to the November Plan, the MTA has made several important re-estimates that are detailed on pages 3-4 (and Attachment A). Recent discussions with the New York State Division of the Budget (NYSDOB) indicate a likely reduction in the level of MMTOA taxes that were projected in the November Plan. A modest increase in the level of taxes known as MTA Aid will offset some of that reduction, as will the release of certain reserves. However, in order to eliminate the remaining 2012 shortfall and to offset the net subsidy reduction in the out-years, the MTA will implement $35 million in recurring deficit reduction measures that currently are unspecified. These measures will be identified early in 2012 and incorporated into the July 2012 Financial Plan. Recent legislation signed into law by Governor Cuomo makes significant changes to the Payroll Mobility Tax (PMT) by eliminating or reducing the PMT for certain taxpayers including public and private schools, small employers and self-employed with income below a legislated threshold. New York State projects a reduction in PMT revenues of $310 million annually; however, the December Act expressly provides that any reductions in transit aid attributable to these reductions in the payroll mobility tax “shall be offset through alternative sources that will be included in the state budget” (“replacement funds”). This Financial Plan, therefore, assumes that there will be no reduction in net revenue to the MTA. The December Plan projects ending cash balances of $200 million in 2011, $1 million in 2012, and $80 million in 2013 with projected cash deficits of $141 million in 2014 and $211 million in 2015 (see Attachment A). Compared with the November Financial Plan, the forecast of Net Cash Balances is $21 million higher in 2011 and flat in 2012. Projections for 2013 through 2015 are slightly worse than the November Plan by $16 million, $19 million, and $5 million respectively.

Staff Summary Page 2 of 6
The November Financial Plan 2012-2015 The 2011 November Forecast, 2012 Final Proposed Budget and November Financial Plan 2012-2015 (the “November Plan” or “Plan”), which was presented to the MTA Board at its last meeting, reaffirms the MTA’s commitment to establishing fiscal stability for the MTA’s finances. The Plan includes a continued focus on cost cutting to achieve $850 million annual recurring savings by 2015, with a cumulative total efficiency savings in the Plan alone of almost $4 billion, without budget-driven service cuts; continued receipt of dedicated taxes and subsidies; and agreement with labor for “net zero” wage savings of more than $300 million annually by 2015. Consistent with the 2009 State understanding on MTA financing, the Plan also includes 7.5 % fare and toll increases in 2013 and 2015. The Plan will protect the revenues budgeted for capital Pay-As-You-Go so that they will be available to pay debt service on new debt critical to funding the final three years of the 2010-14 Capital Program. The capital funding proposal will require approval by the Board and Capital Program Review Board. The November Plan incorporates the increased MTA efficiency targets that were established in the July Plan and has significantly reduced the portion of the future targets that are unidentified. Vigilance will be required not to backslide where savings have been achieved. The MTA must continue to seek out and pursue new opportunities not just to deliver existing services more efficiently, but also to create savings that can be reinvested for improved reliability and service. Additionally, the November Plan assumes that labor settlements will include three years of “net zero” wage growth. With approximately 60% of the MTA’s expenses driven by labor costs, it is essential that growth in this area reflect the economic realities of this region and the State. The MTA’s plan includes three years of “net zero” wage savings which are in line with the contract agreements reached by the State and its two largest unions, the CSEA and PEF. By the end of 2011, non-represented employees will have gone three years without a wage increase. The Plan captures the impacts of three significant weather events that took place during 2011 that affected MTA operations and finances – record breaking January snowfalls, an October Nor’easter that dropped unusually early, heavy snowfall and August’s Tropical Storm Irene. Irene caused extensive infrastructure damage to MTA properties with Metro-North’s Port Jervis line the hardest hit. Metro-North and its employees did an excellent job mitigating the impact and cost of that storm, restoring service on November 28th. Repairs were done faster and less expensively than originally estimated, and recoveries from insurance and the Federal Emergency Management Agency (FEMA) are anticipated in 2012. For 2012 and beyond, the Plan continues to assume the exclusion of LI Bus from all budget forecasts of MTA subsidies. We note that there will be recurring costs beyond 2011 to finish the “wind-down” of MTA operations and future payments for employee and other liabilities including vacation and sick leave balances, retiree health insurance, worker’s compensation claims, pension liabilities and unemployment insurance. While these costs likely will impact MTA short-term cash flow, such expenses are the financial responsibility of Nassau County under the terms of the Lease and Operating Agreement between Nassau County and the MTA, and MTA will seek reimbursement for such future expenses from the County. Other Changes between the July and November Plans November Plan subsidy projections are similar to July. The November Plan recognized the likelihood that State subsidies to the MTA will be lower than anticipated because of a slow-down in the economic activity supporting those specific taxes. These losses, however, are expected to be mostly offset by higher real estate revenues. Agency projections are also similar to July as the combination of lower passenger revenues and higher claims costs are being offset by slightly lower costs for health & welfare and energy. Lower debt service and favorable spending in 2011 will help to finance reinvestments that are described below. The elimination of most of the remaining general reserve in 2011, and a significant shift in the timing of expenses from 2011 to 2012 will permit the MTA to repay an inter-agency loan of $135 million in 2011 rather than in 2012, as was assumed in the July Plan. In 2012 and beyond, the General Reserve increases to approximately one percent of the MTA’s operating budget. Energy fluctuations and weather impacts seen in 2011 alone demonstrate the necessity of an increased General Reserve. The November Plan continues the fuel hedge program through 2015. The November Plan projected a $179 million ending cash balance in 2011, a positive balance (less than $1 million) in 2012, and a $96 million ending cash balance in 2013. Projected cash deficits of $122 million in 2014 and $206 million in 2015 reflect a worsening in out-year results.
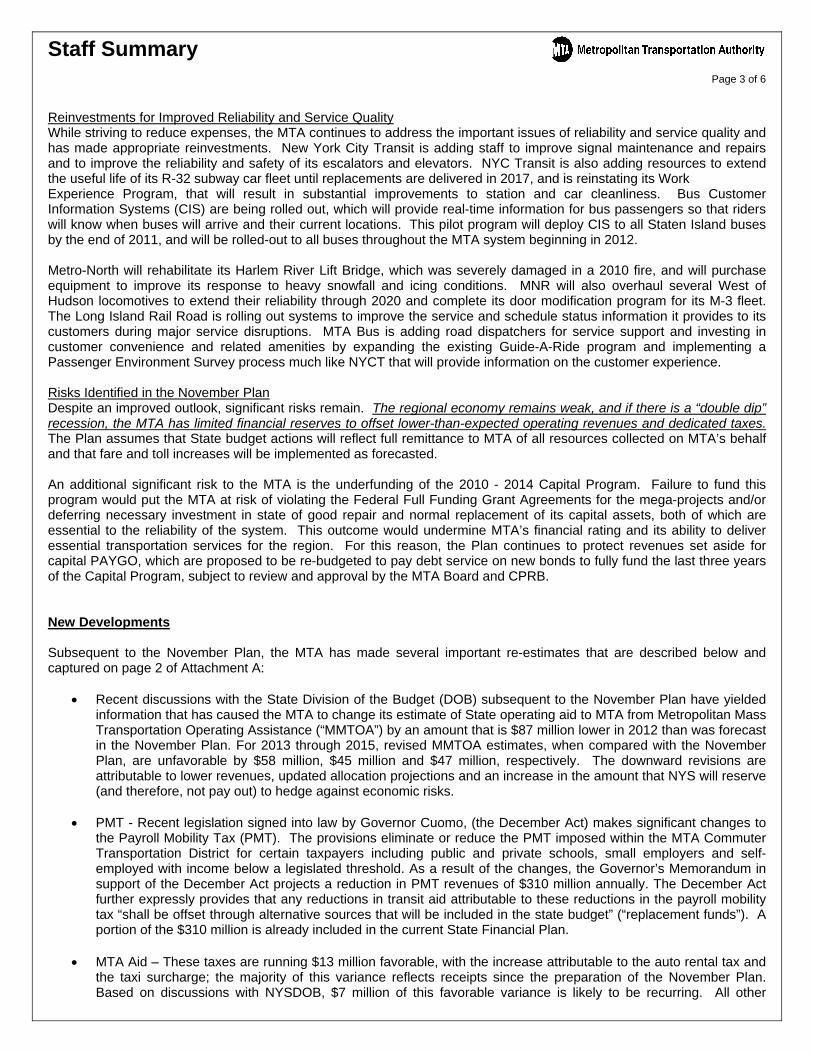
Staff Summary Page 3 of 6
Reinvestments for Improved Reliability and Service Quality While striving to reduce expenses, the MTA continues to address the important issues of reliability and service quality and has made appropriate reinvestments. New York City Transit is adding staff to improve signal maintenance and repairs and to improve the reliability and safety of its escalators and elevators. NYC Transit is also adding resources to extend the useful life of its R-32 subway car fleet until replacements are delivered in 2017, and is reinstating its Work Experience Program, that will result in substantial improvements to station and car cleanliness. Bus Customer Information Systems (CIS) are being rolled out, which will provide real-time information for bus passengers so that riders will know when buses will arrive and their current locations. This pilot program will deploy CIS to all Staten Island buses by the end of 2011, and will be rolled-out to all buses throughout the MTA system beginning in 2012. Metro-North will rehabilitate its Harlem River Lift Bridge, which was severely damaged in a 2010 fire, and will purchase equipment to improve its response to heavy snowfall and icing conditions. MNR will also overhaul several West of Hudson locomotives to extend their reliability through 2020 and complete its door modification program for its M-3 fleet. The Long Island Rail Road is rolling out systems to improve the service and schedule status information it provides to its customers during major service disruptions. MTA Bus is adding road dispatchers for service support and investing in customer convenience and related amenities by expanding the existing Guide-A-Ride program and implementing a Passenger Environment Survey process much like NYCT that will provide information on the customer experience. Risks Identified in the November Plan Despite an improved outlook, significant risks remain. The regional economy remains weak, and if there is a “double dip” recession, the MTA has limited financial reserves to offset lower-than-expected operating revenues and dedicated taxes. The Plan assumes that State budget actions will reflect full remittance to MTA of all resources collected on MTA’s behalf and that fare and toll increases will be implemented as forecasted. An additional significant risk to the MTA is the underfunding of the 2010 - 2014 Capital Program. Failure to fund this program would put the MTA at risk of violating the Federal Full Funding Grant Agreements for the mega-projects and/or deferring necessary investment in state of good repair and normal replacement of its capital assets, both of which are essential to the reliability of the system. This outcome would undermine MTA’s financial rating and its ability to deliver essential transportation services for the region. For this reason, the Plan continues to protect revenues set aside for capital PAYGO, which are proposed to be re-budgeted to pay debt service on new bonds to fully fund the last three years of the Capital Program, subject to review and approval by the MTA Board and CPRB. New Developments Subsequent to the November Plan, the MTA has made several important re-estimates that are described below and captured on page 2 of Attachment A:
Recent discussions with the State Division of the Budget (DOB) subsequent to the November Plan have yielded information that has caused the MTA to change its estimate of State operating aid to MTA from Metropolitan Mass Transportation Operating Assistance (“MMTOA”) by an amount that is $87 million lower in 2012 than was forecast in the November Plan. For 2013 through 2015, revised MMTOA estimates, when compared with the November Plan, are unfavorable by $58 million, $45 million and $47 million, respectively. The downward revisions are attributable to lower revenues, updated allocation projections and an increase in the amount that NYS will reserve (and therefore, not pay out) to hedge against economic risks.
PMT - Recent legislation signed into law by Governor Cuomo, (the December Act) makes significant changes to the Payroll Mobility Tax (PMT). The provisions eliminate or reduce the PMT imposed within the MTA Commuter Transportation District for certain taxpayers including public and private schools, small employers and self-employed with income below a legislated threshold. As a result of the changes, the Governor’s Memorandum in support of the December Act projects a reduction in PMT revenues of $310 million annually. The December Act further expressly provides that any reductions in transit aid attributable to these reductions in the payroll mobility tax “shall be offset through alternative sources that will be included in the state budget” (“replacement funds”). A portion of the $310 million is already included in the current State Financial Plan.
MTA Aid – These taxes are running $13 million favorable, with the increase attributable to the auto rental tax and the taxi surcharge; the majority of this variance reflects receipts since the preparation of the November Plan. Based on discussions with NYSDOB, $7 million of this favorable variance is likely to be recurring. All other

Staff Summary Page 4 of 6
subsidies are tracking close to budget. While the improvement in MTA Aid offsets a small portion of the reduced MMTOA projections, the net 2011-2012 subsidy impact is $67 million unfavorable.
2011 General Reserve - The November Plan left $8 million dollars in MTA’s General Reserve for 2011 to mitigate
potential unfavorable financial impacts from the October Nor’easter and other potential storms through the remainder of the year. The MTA is confident that any storm impacts can be absorbed within existing Agency forecasts, and is releasing the rest of that reserve, which will improve the cash carryover into 2012 by $8 million.
2012 General Reserve - The November Financial Plan recognized the risks posed by a tenuous economic
recovery (see underlined sentence above). This risk was one reason that the cash reserve for 2012 was increased to $125 million, approximately 1% of the MTA’s operating budget. Since the reduced MMTOA estimate is clearly one of the risks cited in the November Financial Plan, and that risk has now been quantified and incorporated into this Plan, the MTA will lower the 2012 General Reserve by $25 million to partially cover the MMTOA shortfall. Out-year reserve levels will not be adjusted.
The use of reserves offsets some but not all of the above unfavorable subsidy re-estimate. In order to eliminate the remaining 2012 shortfall and to offset the net subsidy reduction in the out-years, the MTA will implement $35 million in recurring deficit reduction measures that currently are unspecified. These measures will be identified early in 2012 and be incorporated into the July 2012 Financial Plan. The December Plan projects ending cash balances of $200 million in 2011, $1 million in 2012, and $80 million in 2013 with projected cash deficits of $141 million in 2014 and $211 million in 2015. Compared with the November Financial Plan, the forecast of Net Cash Balances is $21 million higher in 2011 and flat in 2012. Projections for 2013 through 2015 are slightly worse than November by $16 million, $19 million, and $5 million respectively. Recommendation: It is recommended that the Board:
Adopt the 2012 Final Proposed Budget and Four Year Financial Plan 2012-2015 (December Plan), which includes approving the 2011 Final Estimate, the General Reserve, and all Plan Adjustments (items below the baseline). The approval of this Plan will supersede prior Board Plan Approvals for this period.
Authorize staff, under the guidance of the Executive Director, to take actions to implement the subsidy and other technical adjustments set forth in the December Plan.
Authorize technical adjustments to Agency Budgets and forecasts of a non-material nature in the February Plan. Authorize adjustment of Agency 2012 Budgets and forecasts to reflect labor settlements approved from time to
time by the Board.
Consistent with last December’s Board Action, which authorized staff under the direction of the Chair/CEO to take actions in furtherance of ending subsidization of the Long Island Bus deficit, authorize the transfer of certain LI Bus staff temporarily to MTA HQ to continue “wind down” work necessary to close out LI Bus’ operations.
As previously approved, the Plan assumes that the MTA will enter into fuel hedge agreements, up to 12 months in length, and set aside up to $100 million to collateralize these hedges. It is recommended that the Board authorize staff to continue its previously authorized energy hedge program and authorize forward hedges up to but not exceeding 24 months in duration to always assure one full year of price certainty for the hedged amount.
Approve additional budget and cash management actions, as has been done in past budget adoptions, as further
described below: Advance of Bridges and Tunnels Operating Surplus As has been done on previous occasions, the Board is requested to authorize Bridges and Tunnels to advance to MTA and NYC Transit, to the extent funds are available, all or part of the estimated operating surplus for the year 2012, when and as directed by the Executive Director or his designee.

Staff Summary Page 5 of 6
Uses of MTA MRT-2 Corporate Account Monies Unlike many other forms of intergovernmental aid, these subsidy monies, by statute, can be allocated at the Board’s discretion. It is recommended that the Board authorize that these funds be used as set forth in the Plan, authorize staff under direction of the Executive Director to administer these funds in a manner consistent with the Plan, and to temporarily help stabilize cash-flow requirements. As in the past, the advance of funds to the MTA and its affiliates and subsidiaries to stabilize cash-flow requirements may be made, provided that such advances are repaid prior to the end of the fiscal year in which made. Uses of Payroll Mobility Tax (and Replacement Funds) and Other New Taxes Like the MRT-2 Corporate Account moneys, these subsidy moneys, by statute, can be allocated at the Board’s discretion. It is recommended that the Board authorize that the revenues from the PMT (and Replacement Funds) be released as needed: (i) for pledged revenues by MTA to secure and be applied to the payment of bonds to be issued in the future, to fund capital projects of MTA, its subsidiaries, and MTA New York City Transit and its subsidiary and (ii) to pay capital costs, including debt service of MTA, its subsidiaries, and MTA New York City Transit and its subsidiary. It is further recommended that the Board authorize that subject to the provisions of any such pledge, or in the event there is no such pledge, the PMT Revenues be used by MTA to pay for costs, including operating costs of MTA, its subsidiaries and MTA New York City Transit and its subsidiary, and that the Executive Director or his designee be authorized to release these funds as needed in any of these areas described above. Further, it is recommended that the Board authorize that the revenues in the MTA Aid Trust Account (derived from four fees and taxes imposed in the Metropolitan Commuter Transportation District - a supplemental motor vehicle license fee, a supplemental motor vehicle registration fee, a tax on medallion taxicab rides, and a supplemental tax on passenger car rentals) be released as needed and used as pledged revenues by MTA or pledged to the Triborough Bridge and Tunnel Authority to secure debt of MTA Bridges and Tunnels. Further subject to the provisions of such pledge, or in the event there is no such pledge, it is recommended that that the Executive Director or his designee be authorized to direct the release of these funds to be used by MTA for the payment of operating and capital costs of the MTA, its subsidiaries, and MTA New York City Transit and its subsidiary. Inter-Agency Loans The Board is requested to authorize the Executive Director or his designee, acting under Section1266 (6-a) of the Public Authorities Law, to enter into inter-agency loan agreements among the MTA and its affiliates and subsidiaries. This authorization would allow the temporary movement of funds among agencies to meet cash flow requirements for operating or capital purposes resulting from a mismatch between the receipt of subsidies and other monies and cash flow needs. The statute requires that any such inter-agency loans be repaid no later than the end of the next succeeding calendar year. Use of Stabilization Reserve: Provision for Prompt Payment of Contractual Obligations In 1996, the Board approved the establishment of a Stabilization Reserve, to be held by the MTA Treasurer (the “Treasurer”), to stabilize MTA Agencies’ cash flow requirements. The fund consists of two accounts, the MTA New York City Transit Account (the “Transit Account”) and the MTA Commuter Railroad Account (the “Commuter Railroad Account”). The Board is requested to authorize the use of any balances in such accounts, plus any amounts authorized below to be transferred to such accounts, to meet the cash flow requirements of MTA New York City Transit and the MTA Commuter Railroads and to authorize MTA New York City Transit to pay to the Treasurer for deposit in the Transit Account such amounts as it deems necessary to accomplish the purpose thereof, consistent with this Plan; and the Treasurer, subject to the approval of the Executive Director or his designee, to pay into the Commuter Railroad Account, such amounts as are deemed necessary to accomplish the purpose thereof, consistent with this Plan. The Treasurer, upon request of MTA New York City Transit, shall pay to NYCT such amounts as are necessary to meet cash flow requirements of NYCT and as authorized by the Executive Director or his designee, shall transfer from the Commuter Railroad Account such amounts as are necessary to meet the cash flow requirements of MTA Commuter Railroads. The Treasurer shall also use such funds as from time to time may be necessary or convenient to timely make debt service payments on MTA bonds.

Staff Summary Page 6 of 6
Government Accounting Standards Board (GASB) Contributions In June 2008, the MTA approved the establishment of the “MTA Retiree Welfare Benefits Trust” to govern the administration and investment of the OPEB trust assets. Pending transfer to the “Trust,” the Treasurer will continue to hold the 2006 through 2011 funds set aside in discrete sub-accounts that comprise the GASB Account. Moreover, agencies will make contributions of $58 million as set forth in the 2012 Budget to the GASB Account in 2012 (with additional contributions in the out years of the Plan). The Treasurer is authorized to use the GASB accounts to fund intra-agency loans as well as inter-agency loans. If an agency uses its own GASB funds to meet 2012 cash flow needs, the amounts withdrawn in 2012 must be paid back by December 31, 2014. If the GASB funds are used as inter-agency loans in 2012, they would be subject to repayment no later than December 31, 2013, consistent with the Inter-Agency Loan provision described above.

[THIS PAGE INTENTIONALLY LEFT BLANK]

Attachment A
Line
No.
7 Non-Reimbursable 2011 20128 2010 Final Final Proposed9 Actual 1 Estimate Budget 2013 2014 2015
10 Operating Revenue11 Farebox Revenue $4,586 $4,991 $5,050 $5,122 $5,208 $5,28612 Toll Revenue 1,417 1,499 1,510 1,508 1,514 1,520 13 Other Revenue 491 496 524 551 589 630 14 Capital and Other Reimbursements 0 0 0 0 0 015 Total Operating Revenue $6,495 $6,986 $7,085 $7,181 $7,310 $7,436
16
17 Operating Expense
18 Labor Expenses:19 Payroll 1 $4,171 $4,206 $4,248 $4,265 $4,358 $4,46120 Overtime 1 443 523 463 460 467 47521 Health & Welfare 738 776 863 938 1,026 1,12322 OPEB Current Payment 356 390 435 484 530 58123 Pensions 1,030 1,091 1,308 1,321 1,374 1,43424 Other-Fringe Benefits 540 485 489 500 514 53025 Reimbursable Overhead (345) (328) (334) (316) (317) (311)26 Sub-total Labor Expenses $6,933 $7,143 $7,473 $7,651 $7,952 $8,29327
28 Non-Labor Expenses:
29 Traction and Propulsion Power $325 $337 $385 $428 $477 $53030 Fuel for Buses and Trains 190 244 240 254 255 26331 Insurance 10 15 23 33 46 5632 Claims 285 232 229 234 245 25733 Paratransit Service Contracts 380 356 404 468 550 63734 Maintenance and Other Operating Contracts 542 616 670 682 706 76435 Professional Service Contracts 203 189 213 213 218 22136 Materials & Supplies 511 525 583 599 617 66937 Other Business Expenses 190 170 160 164 166 17038 Sub-total Non-Labor Expenses $2,636 $2,684 $2,906 $3,075 $3,281 $3,56839
40 Other Expense Adjustments:41 Other ($18) $5 $36 $34 $35 $3542 General Reserve 0 8 125 130 135 14543 Sub-total Other Expense Adjustments ($18) $13 $161 $164 $170 $18044
45 Total Operating Expense before Non-Cash Liability Adj. $9,550 $9,840 $10,540 $10,891 $11,403 $12,041
46
47 Depreciation $1,981 $2,077 $2,179 $2,245 $2,325 $2,42048 OPEB Obligation 1,167 1,241 1,256 1,281 1,306 1,33849 Environmental Remediation 19 9 9 9 9 950
51 Total Operating Expense after Non-Cash Liability Adj. $12,717 $13,167 $13,984 $14,426 $15,043 $15,809
52
53 Net Deficit Before Subsidies and Debt Service ($6,222) ($6,181) ($6,899) ($7,245) ($7,733) ($8,372)
54
55 Conversion to Cash Basis: Non-Cash Liability Adjs. $3,166 $3,326 $3,444 $3,535 $3,640 $3,76856
57 Debt Service (excludes Service Contract Bonds) (1,781) (1,949) (2,129) (2,271) (2,418) (2,555)58
59 Total Operating Expense with Debt Service $11,332 $11,789 $12,669 $13,162 $13,822 $14,596
60
61 Dedicated Taxes and State/Local Subsidies $4,914 $5,249 $5,509 $5,782 $6,023 $6,24662
63 Net Deficit After Subsidies and Debt Service $77 $446 ($76) ($199) ($488) ($914)
64
65 Conversion to Cash Basis: GASB Account (67) ($39) (57) (61) (65) (67)66 Conversion to Cash Basis: All Other 20 ($419) (27) (267) (343) (400)67
68 CASH BALANCE BEFORE PRIOR-YEAR CARRY-OVER $30 ($13) ($160) ($527) ($896) ($1,381)
69 NOVEMBER ADJUSTMENTS (detail on page 2) 0 32 (19) 624 678 1,176
70 PRIOR-YEAR CARRY-OVER 130 160 179 0 96 0
71 NET CASH BALANCE (NOVEMBER PLAN) $160 $179 $0 $96 ($122) ($206)
72
73 DECEMBER ADJUSTMENTS (detail on page 2) 0 21 (20) (17) (4) (5)
74 CHANGE IN PRIOR-YEAR CARRY-OVER 0 0 21 1 (16) 0
75 NET CASH BALANCE (DECEMBER PLAN) $160 $200 $1 $80 ($141) ($211)
1
($ in millions)
Page 1 of 2
In order to establish consistency among Agencies when reporting overtime results, certain overtime-related expenses that had been captured within payroll (straight-time) were shifted to the overtime category beginning in 2011. However, the 2010 Actual results do not reflect the change. The result would have been a zero-sum shift of approximately $48 million from payroll to overtime, making the 2010 Actual for Overtime $491 million and Payroll $4,121 million.
METROPOLITAN TRANSPORTATION AUTHORITYFinancial Plan 2012-2015
MTA Consolidated Statement Of Operations By Category

2011 2012 2013 2014 2015
November Plan Cash Surplus/(Deficit) Before Adjustments ($13) ($160) ($527) ($896) ($1,381)
Fare/Toll Increases:Fare/Toll Yields on 1/1/13: 7.5% - - 449 466 472
Fare/Toll Yields on 1/1/15: 7.5% - - - - 494
Subtotal: - - 449 466 966
MTA Initiatives:New MTA Efficiencies 6 30 93 84 79 3 Zeroes Salary/Wage Initiative 15 26 35 83 95 Accelerate 3 Zeroes 11 25 27 24 15
MetroCard Green Fee and Cost Savings - - 20 20 20
Subtotal: 32 81 175 212 210
MTA Re-estimates:
Continuing Energy Hedge Program - (100) - - -
Subtotal: - (100) - - -
Total Adjustments: 32 (19) 624 678 1,176
Prior Year Carryover 160 179 0 96 -
November Financial Plan Net Cash Surplus/(Deficit) $179 $0 $96 ($122) ($206)
Changes to November Plan:
MTA Re-estimates:MMTOA - (87) (58) (45) (47)MTA Aid 13 7 7 7 7 Reduced PMT - (212) (324) (338) (352) State Actions to Replace PMT Revenue - 212 324 338 352
Subtotal: 13 (80) (52) (39) (40)
Policy Actions:Reduce General Reserve 8 25 - - - Unspecified Deficit Reduction - 35 35 35 35
Subtotal: 8 60 35 35 35
Changes in Baseline from November Plan: 21 (20) (17) (4) (5)
Change in Prior-Year Carryover - 21 1 (16) -
December Financial Plan Net Cash Surplus/(Deficit) $200 $1 $80 ($141) ($211)
Page 2 of 2
METROPOLITAN TRANSPORTATION AUTHORITY
($ in millions)
Financial Plan 2012-2015 (December Plan)

[THIS PAGE INTENTIONALLY LEFT BLANK]


[THIS PAGE INTENTIONALLY LEFT BLANK]

VIII. Other

The MTA Budget Process MTA budgeting is a rigorous and thorough process that begins in the spring and culminates with the passage of the Budget in December. In the course of a year, MTA prepares a February, July and November Financial Plan, and Adoption Materials in December. In addition to the existing year, each Plan requires Agencies to prepare four-year projections which include the upcoming and three future calendar years. Both the July and November Financial Plans are divided into two distinct volumes:
Volume I supports the complete financial plan, including the baseline as well as policy items and below-the-line gap closing items;
Volume II includes detailed Agency information supporting baseline revenue, expense, cash and headcount projections. Also included is detailed information supporting actions taken to increase savings as well as individual Agency deficit reduction programs.
July Plan The July Financial Plan provides the opportunity for the MTA to present a revised forecast of the current years finances, a preliminary presentation of the following years proposed budget, and a three-year reforecast of out-year finances. This Plan may include a series of gap closing proposals necessary to maintain a balanced budget and actions requiring public hearings. The Mid-Year Forecast is allocated over the period of 12 months and becomes the basis in which monthly results are compared for the remainder of the year.
November Plan After stakeholders weigh in and the impact of new developments and risks are quantified, a November Plan is prepared, which is an update to the July Financial Plan. The November Plan includes a revised current year and finalization of the proposed budget for the upcoming year and projections for the three out-years. December Adopted Budget In December, the November Plan is updated to capture further developments, risks and actions that are necessary to ensure budget balance, which is ultimately presented to the MTA Board for review and approval of the budget for the upcoming year. February Plan Finally, in the Adopted Budget below-the-line policy issues are moved into the baseline and technical adjustments are made. This results in what is called the February Plan. The current year (the Adopted Budget) is allocated over the period of 12 months and becomes the basis in which monthly results are compared.

[THIS PAGE INTENTIONALLY LEFT BLANK]

VII. Appendix

VIII. Other