Embed Size (px)
Citation preview

1February 1, 2007 www.atlascopco.com
Atlas Copco Group
Q4 Results
February 1, 2007

2February 1, 2007 www.atlascopco.com
Contents
Q4 Business Highlights
Market Development
Business Areas
Financials
Capital Distribution
2006 Summary
Outlook

3February 1, 2007 www.atlascopco.com
Q4 - Highlights
Continuous efforts to strengthen market presence and penetration pay off– Double digit growth in all regions
Record results
Significant capital distribution – 18.4 million B-shares repurchased in Q4 2006 for BSEK 3.8
– Proposed dividend and share redemption of BSEK 27.3 SEK 44.75 per share
Completion of the equipment rental business divestment – Total gain of MSEK 7 789
4February 1, 2007 www.atlascopco.com
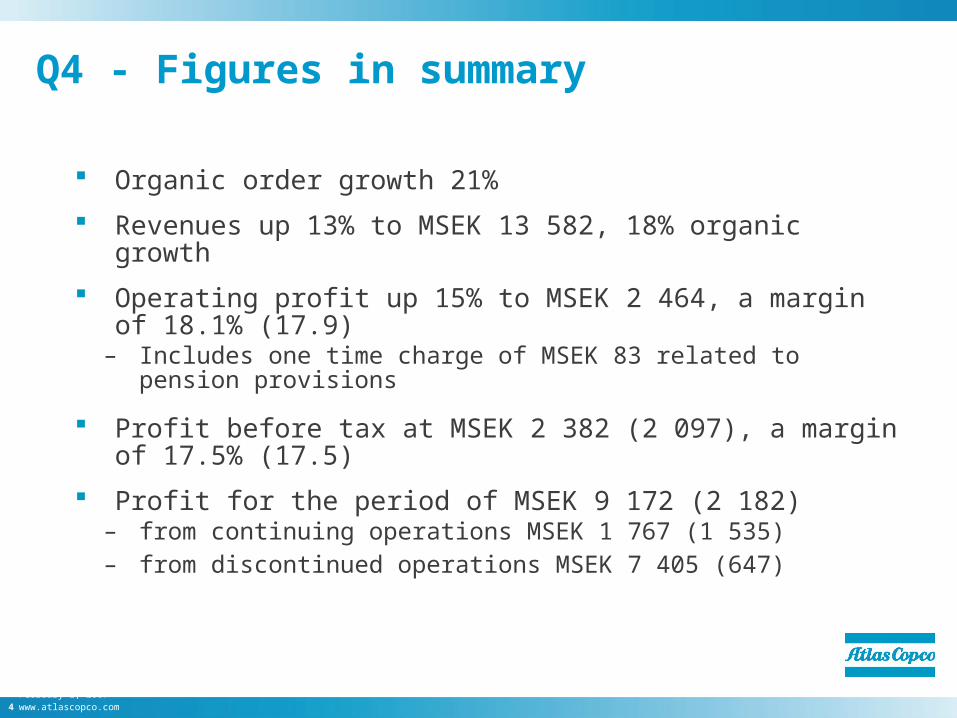
Q4 - Figures in summary
Organic order growth 21%
Revenues up 13% to MSEK 13 582, 18% organic growth
Operating profit up 15% to MSEK 2 464, a margin of 18.1% (17.9)– Includes one time charge of MSEK 83 related to pension provisions
Profit before tax at MSEK 2 382 (2 097), a margin of 17.5% (17.5)
Profit for the period of MSEK 9 172 (2 182)– from continuing operations MSEK 1 767 (1 535)– from discontinued operations MSEK 7 405 (647)

5February 1, 2007 www.atlascopco.com
Contents
Q4 Business Highlights
Market Development
Business Areas
Financials
Capital Distribution
2006 Summary
Outlook

6February 1, 2007 www.atlascopco.com
Orders received - Local currencyGroup total +23% YTD, + 24% last 3 months(Structural change +3% YTD, +3% last 3 months)
December 2006
A B C
A = Portion of sales, Year-to-date, %
B = Year-to-date vs. prev. year, %
C = Last 3 months vs. prev. year, %
7 +26 +60
39 +16 +12
10 +61 +72
18 +33 +38
4 +22 +34
22 +19 +16
7February 1, 2007 www.atlascopco.com
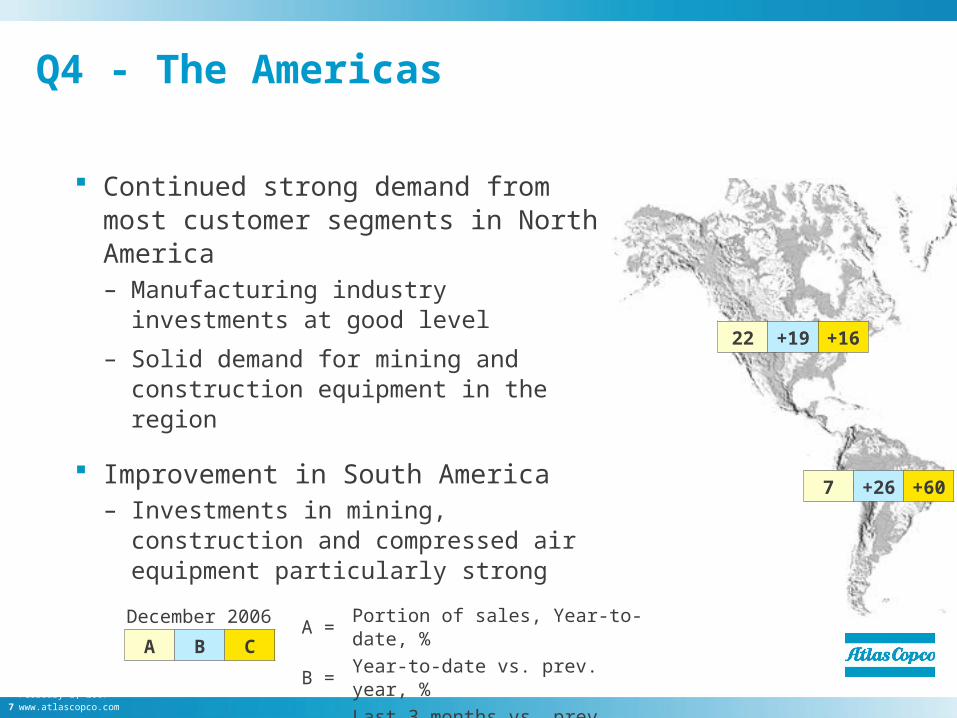
Q4 - The Americas
Continued strong demand from most customer segments in North America– Manufacturing industry investments at good
level
– Solid demand for mining and construction equipment in the region
Improvement in South America– Investments in mining, construction and
compressed air equipment particularly strong
December 2006
A B C
A = Portion of sales, Year-to-date, %
B = Year-to-date vs. prev. year, %
C = Last 3 months vs. prev. year, %
7 +26 +60
22 +19 +16

8February 1, 2007 www.atlascopco.com
Q4 - Europe and Africa/Middle East
Healthy growth in Europe– Continued strong growth for all types of
compressed air equipment
– Solid demand from the construction and mining industries
– Strong growth for industrial tools to general industry but slow demand from the motor vehicle industry
– Russia continued to grow rapidly
Strong growth in the Africa / Middle East region– Significant order increase for construction and
industrial equipment in the Middle East
December 2006
A B C
A = Portion of sales, Year-to-date, %
B = Year-to-date vs. prev. year, %
C = Last 3 months vs. prev. year, %
39 +16 +12
10 +61 +72

9February 1, 2007 www.atlascopco.com
Q4 - Asia and Australia
High growth in Asia– Strong development in all major markets
– Large compressor orders in China, on top of already strong underlying growth
Significant growth for mining in Australia
December 2006
A B C
A = Portion of sales, Year-to-date, %
B = Year-to-date vs. prev. year, %
C = Last 3 months vs. prev. year, %
18 +33 +38
4 +22 +34

10February 1, 2007 www.atlascopco.com
Volume Growth per Quarter
Change in orders received in % vs. same Quarter previous year
Atlas Copco Group, continuing operations
-10
-5
0
5
10
15
20
25
00 Q
1
00 Q
2
00 Q
3
00 Q
4
01 Q
1
01 Q
2
01 Q
3
01 Q
4
02 Q
1
02 Q
2
02 Q
3
02 Q
4
03 Q
1
03 Q
2
03 Q
3
03 Q
4
04 Q
1
04 Q
2
04 Q
3
04 Q
4
05 Q
1
05 Q
2
05 Q
3
05 Q
4
06 Q
1
06 Q
2
06 Q
3
06 Q
4

11February 1, 2007 www.atlascopco.com
Atlas CopcoGrowth – Orders receivedAtlas Copco Group, excl. Professional Electric Tools and Rental Service
12%
17%
-10%
-5%
0%
5%
10%
15%
20%
25%
30%
2002 2003 2004 2005 2006
Change in order volume and price, % Structural changes, %
CAGR, 2002 - 2006, volume and price CAGR, 2002 - 2006, excl. currency

12February 1, 2007 www.atlascopco.com
Atlas Copco Group – Sales Bridge
Orders Revenues Orders RevenuesMSEK Received Received2005 12 145 11 982 44 744 42 205Structural change, % +3 +3 +3 +3Currency, % -8 -8 0 0Price, % +2 +2 +2 +2Volume, % +19 +16 +18 +15Total, % +16 +13 +23 +202006 14 131 13 582 55 239 50 512
October - December January - December

13February 1, 2007 www.atlascopco.com
Contents
Q4 Business Highlights
Market Development
Business Areas
Financials
Capital Distribution
2006 Summary
Outlook

14February 1, 2007 www.atlascopco.com
Atlas Copco GroupOperating Profit and Return On Capital Employed (ROCE) by Business Areas
Revenues Operating Operating ROCEMSEK profit margin12 month values, period ending Dec. 2006 Dec. 2006 Dec. 2006 Dec. 2006Compressor Technique 24 907 5 071 20.4% 70%Construction and Mining Technique 18 914 3 010 15.9% 35%Industrial Technique 6 440 1 346 20.9% 63%Rental Service - continuing operations 757 252 33.3% na.Eliminations/Common Group Functions -506 -476Atlas Copco Group 50 512 9 203 18.2% 37%

15February 1, 2007 www.atlascopco.com
Compressor Technique
Very strong order growth in all markets – Organic order growth 25%
– Increased market presence and penetration support equipment and aftermarket growth
– Several large orders won in the gas and process business
Operating profit up 12%. – Margin at 21%, excluding one-time pension provision
Prime Energy part of the Compressor Technique business area as of January 1, 2007– New Specialty Rental Division

16February 1, 2007 www.atlascopco.com
Compressor Technique
-10
-5
0
5
10
15
20
25
-10
-5
0
5
10
15
20
25
00
Q1
00
Q2
00
Q3
00
Q4
01
Q1
01
Q2
01
Q3
01
Q4
02
Q1
02
Q2
02
Q3
02
Q4
03
Q1
03
Q2
03
Q3
03
Q4
04
Q1
04
Q2
04
Q3
04
Q4
05
Q1
05
Q2
05
Q3
05
Q4
06
Q1
06
Q2
06
Q3
06
Q4
Revenue volume growth: Change vs. same quarter previous year, %
Quarterly operating margin, %

17February 1, 2007 www.atlascopco.com
Continued strong demand, particularly in mining
Organic order growth 26%– 19th consecutive quarter with volume growth
Operating profit up 23%. – Record margin at 16.6%
Launch of new range of small hydraulic breakers
Construction and Mining Technique

18February 1, 2007 www.atlascopco.com
-10
-5
0
5
10
15
20
25
-10
-5
0
5
10
15
20
25
00
Q1
00
Q2
00
Q3
00
Q4
01
Q1
01
Q2
01
Q3
01
Q4
02
Q1
02
Q2
02
Q3
02
Q4
03
Q1
03
Q2
03
Q3
03
Q4
04
Q1
04
Q2
04
Q3
04
Q4
05
Q1
05
Q2
05
Q3
05
Q4
06
Q1
06
Q2
06
Q3
06
Q4
Revenue volume growth: Change vs. same quarter previous year, %
Quarterly operating margin, %
Construction and Mining Technique

19February 1, 2007 www.atlascopco.com
Industrial Technique
Strong growth within general industry
Weaker demand from the motor vehicle industry
Significant increase of the aftermarket business
Strategic acquisition in the vehicle service business
Record operating margin

20February 1, 2007 www.atlascopco.com
Industrial Technique
-5
0
5
10
15
20
-5
0
5
10
15
20
03
Q1
03
Q2
03
Q3
03
Q4
04
Q1
04
Q2
04
Q3
04
Q4
05
Q1
05
Q2
05
Q3
05
Q4
06
Q1
06
Q2
06
Q3
06
Q4
Revenue volume growth: Change vs. same quarter previous year, %
Quarterly operating margin, %

21February 1, 2007 www.atlascopco.com
Rental Service
Result of discontinued operations– Operating results, net of tax 1 324
– Effect of discontinued depreciation, IFRS 889
– Capital gain 6 900
– Profit from discontinued operations, net of tax 9 113
Continuing operations in 2006– Revenues MSEK 757
– Operating profit MSEK 252, margin 33,3%
– Prime Energy and Prime Mexico will be integrated into the rental operations in the Compressor Technique business area on January 1, 2007
2006

22February 1, 2007 www.atlascopco.com
Contents
Q4 Business Highlights
Market Development
Business Areas
Financials
Capital Distribution
2006 Summary
Outlook

23February 1, 2007 www.atlascopco.com
Group Total
MSEK 2006 2005 % 2006 2005 %Orders received 14 131 12 145 +16 55 239 44 744 +23
Revenues 13 582 11 982 +13 50 512 42 205 +20
Operating profit 2 464 2 146 +15 9 203 6 938 +33
- as a percentage of revenues 18.1 17.9 18.2 16.4
Profit before tax 2 382 2 097 +14 8 695 6 863 +27
- as a percentage of revenues 17.5 17.5 17.2 16.3
Profit for the period
from continuing operations 1 767 1 535 +15 6 260 4 964 +26
Profit for the period from
discontinued operations, net of tax 7 405 647 9 113 1 617
Profit for the period 1) 9 172 2 182 +320 15 373 6 581 +134
Basic earnings per share, SEK 1) 14.74 3.46 +326 24.48 10.43 +1351) Including discontinued operations.
October - December January - December

24February 1, 2007 www.atlascopco.com
Balance Sheet
MSEK
Intangible assets 4 299 8% 10 607 19%
Rental equipment 1 979 4% 13 456 24%
Other property, plant and equipment 3 777 7% 4 503 8%
Other fixed assets 3 161 6% 1 818 3%
Inventories 8 487 15% 7 215 13%
Receivables 12 401 22% 13 240 24%
Current financial assets 1 016 2% 389 1%
Cash and cash equivalents 20 135 36% 3 727 7%
TOTAL ASSETS 55 255 54 955
Total equity 32 708 59% 25 808 47%
Interest-bearing liabilities 8 787 16% 11 345 21%
Non-interest-bearing liabilities 13 760 25% 17 802 32%
TOTAL EQUITY AND LIABILITIES 55 255 54 955
* including discontinued operations
Dec. 31, 2006 Dec. 31, 2005*

25February 1, 2007 www.atlascopco.com
Cash FlowIncluding discontinued operations
MSEK 2006 2005 2006 2005
Operating cash surplus after tax 3 444 2 997 12 305 10 230 of which depreciation added back 442 929 2 142 3 320Change in working capital -1 960 -561 -3 100 -231 Cash flow from operations 1 484 2 436 9 205 9 999Investments in tangible fixed assets -938 -1 853 -7 555 -7 236Sale of tangible fixed assets 252 724 1 963 2 548Other investments, net -461 -429 -1 507 -790Cash flow from investments -1 147 -1 558 -7 099 -5 478 Operating cash flow 337 878 2 106 4 521Company acquisitions/ divestments 22 686 -168 21 636 3 482Dividends paid -1 - -2 676 -1 890Share redemption - - - -4 192Repurchase of own shares -3 776 - -3 776Change in interest-bearing liabilities -2 018 -482 -1 045 -1 439
October - December January - December

26February 1, 2007 www.atlascopco.com
Contents
Q4 Business Highlights
Market Development
Business Areas
Financials
Capital Distribution
2006 Summary
Outlook
27February 1, 2007 www.atlascopco.com
Capital Distribution
Substantial increase in Group profits in the last 3 years
Very strong financial position already before RSC divestment
Substantial cash proceeds from RSC divestment
Reduced operating risk after RSC divestment
Background

28February 1, 2007 www.atlascopco.com
3,38 3,85 3,99 3,83 4,65 4,88 4,63 5,21
10,43
24,48
1,42 1,50 1,58 1,75 1,83 1,92 2,50 3,004,25 4,75
7,41
1,25
44,75
9,67
0
5
10
15
20
25
30
35
40
45
50
1996 1997 1998 1999 2000 2001 2002 2003 2004 2005 2006*
Earnings pershare
Dividend pershare
Dividend +redemptionof share
Atlas Copco GroupBasic earnings per share, dividend and redemption
* Proposed by the Board of Directors
29February 1, 2007 www.atlascopco.com
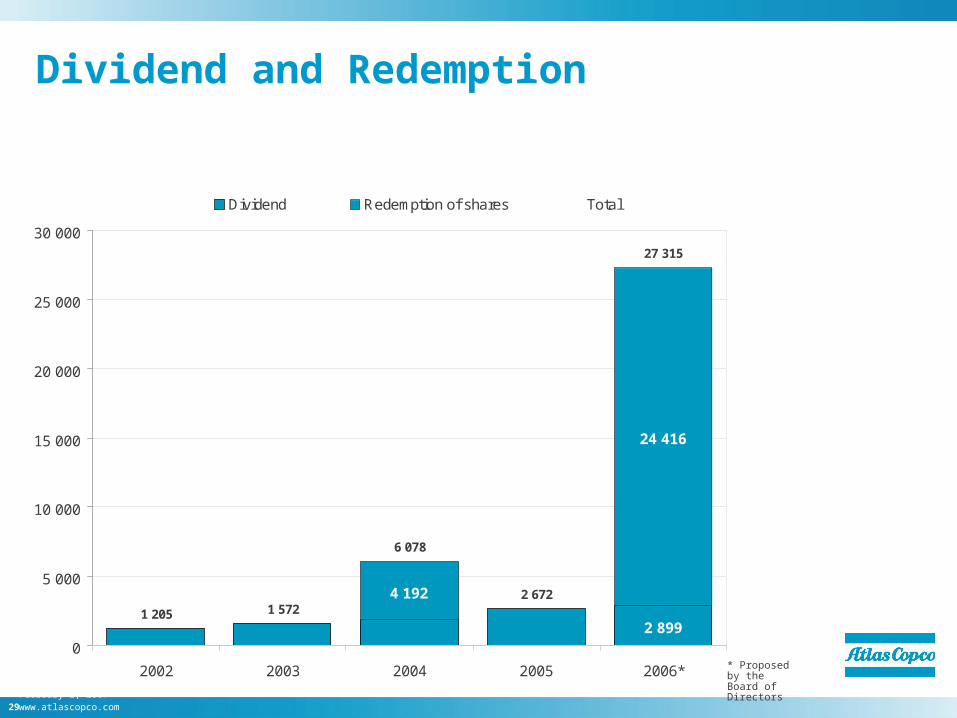
4 192
2 899
24 416
1 205 1 572
6 078
27 315
2 672
0
5 000
10 000
15 000
20 000
25 000
30 000
2002 2003 2004 2005 2006*
Dividend Redemption of shares Total
Dividend and Redemption
* Proposed by the Board of Directors

30February 1, 2007 www.atlascopco.com
Redemption Procedure
Split 3:1
2 new ordinary shares
1 new redemption share– Redeemed automatically
for SEK 402 new shares (A or B)
1 share (A or B)
1 new redemption share
Example: Based on Board proposal
SEK 40

31February 1, 2007 www.atlascopco.com
Contents
Q4 Business Highlights
Market Development
Business Areas
Financials
Capital Distribution
2006 Summary
Outlook
32February 1, 2007 www.atlascopco.com
2006 Full Year Summary
Strong demand from most customer segments, double digit order growth in all regions, and improved market positions
Order intake up 23%, up 18% in volume
Revenues up 20% to MSEK 50 512, up 15% in volume
Operating profit up 33% to MSEK 9 203, a margin of 18.2% (16.4)
Profit before tax at MSEK 8 695 (6 863), a margin of 17.2% (16.3)
Significant capital distribution proposed

33February 1, 2007 www.atlascopco.com
Contents
Q4 Business Highlights
Market Development
Business Areas
Financials
Capital Distribution
2006 Summary
Outlook

34February 1, 2007 www.atlascopco.com
Near-term Outlook
The demand for Atlas Copco’s products and services, from most customer segments such as mining, construction, and the manufacturing and process industries, is expected to remain at the current high level.

35

36February 1, 2007 www.atlascopco.com
Cautionary Statement
“Some statements herein are forward-looking and the actual outcome could be materially different. In addition to the factors explicitly commented upon, the actual outcome could be materially effected by other factors like for example, the effect of economic conditions, exchange-rate and interest-rate movements, political risks, impact of competing products and their pricing, product development, commercialization and technological difficulties, supply disturbances, and the major customer credit losses.”