Embed Size (px)
Citation preview
Principal Islamic PRSPlus GrowthInterim Report
For the Six Months Financial Period Ended 28 February 2021
PRINCIPAL ISLAMIC PRS PLUS GROWTH INTERIM REPORT FOR THE SIX MONTHS FINANCIAL PERIOD ENDED 28 FEBRUARY 2021
PRINCIPAL ISLAMIC PRS PLUS GROWTH
CONTENTS PAGE(S)
MEMBERS’ LETTER 1
SHARIAH ADVISER’S REPORT 2
STATEMENT BY THE PRS PROVIDER 3
TRUSTEE’S REPORT 4
PRS PROVIDER’S REPORT 5 - 15
Fund Objective and Policy
Performance Data
Market Review
Fund Performance
Portfolio Structure
Market Outlook
Investment Strategy
Members Statistics
Soft Commissions and Rebates
UNAUDITED STATEMENT OF COMPREHENSIVE INCOME 16
UNAUDITED STATEMENT OF FINANCIAL POSITION 17
UNAUDITED STATEMENT OF CHANGES IN NET ASSETS ATTRIBUTABLE TO MEMBERS 18
UNAUDITED STATEMENT OF CASH FLOWS 19
NOTES TO THE FINANCIAL STATEMENTS 20 - 55
DIRECTORY 56

PRINCIPAL ISLAMIC PRS PLUS GROWTH
1
MEMBERS’ LETTER
Dear Valued Member, Fuelled by the pandemic crisis, the world has expedited the digital enablement agenda in view of growing expectations and adoption of new digital offerings. Our investments to foster a digital and customer-first mindset with new technology, training and tooling has given Principal a competitive advantage on this front. The equity market has had a phenomenal first quarter, recording positive year-to-date (“YTD”) returns, led by strong inflows, improving economic data, and reducing number of Coronavirus Disease 2019 (“COVID-19”) cases globally. Despite the near-term concerns on higher inflation that can add to the recent volatility, investors should keep a long-term perspective. The key focus should be on growth and recovery of Asian economies, the revitalisation of ASEAN markets, Environmental, Social, and Governance (“ESG”), Biotech and other renewable themes. We remain positive on Asian equities favouring China and more developed Asian economies on a 12-month basis. We’ve also added more ASEAN names in anticipation of a broader economic recovery which would be strengthened by the greater availability of COVID-19 vaccines by mid-2021. We appreciate your continuous support and the trust you place in us. Yours faithfully, for Principal Asset Management Berhad
Munirah Khairuddin Chief Executive Officer
PRINCIPAL ISLAMIC PRS PLUS GROWTH
2
Shariah Adviser’s Report To the Members of Principal Islamic PRS Plus Growth (“Fund”) For the Six Months Financial Period ended 28 February 2021 We hereby confirm the following: 1. To the best of our knowledge, after having made all reasonable enquiries, Principal Asset
Management Berhad has operated and managed the Fund during the period covered by these financial statements in accordance with the Shariah principles and complied with the applicable guidelines, rulings or decisions issued by the Securities Commission Malaysia (“SC”) pertaining to Shariah matters; and
2. The asset of the Fund comprises of instruments that have been classified as Shariah compliant. For Amanie Advisors Sdn Bhd Datuk Dr Mohd Daud Bakar Executive Chairman Kuala Lumpur 9 April 2021
PRINCIPAL ISLAMIC PRS PLUS GROWTH
3
STATEMENT BY THE PRS PROVIDER TO THE MEMBERS OF PRINCIPAL ISLAMIC PRS PLUS GROWTH We, being the Directors of Principal Asset Management Berhad (the “PRS Provider”), do hereby state that, in the opinion of the PRS Provider, the accompanying unaudited financial statements set out on pages 16 to 55 are drawn up in accordance with the provisions of the Deeds and give a true and fair view of the statement of financial position of the Fund as at 28 February 2021 and of its financial performance, changes in net assets attributable to members and cash flows for the financial period then ended in accordance with Malaysian Financial Reporting Standards (“MFRS”) 134 - Interim Financial Reporting and International Accounting Standards ("IAS") 34 - Interim Financial Reporting. For and on behalf of the PRS Provider Principal Asset Management Berhad (Company No.: 199401018399 (304078-K)) MUNIRAH KHAIRUDDIN JUAN IGNACIO EYZAGUIRRE BARAONA Chief Executive Officer/Executive Director Director
Kuala Lumpur 26 April 2021
PRINCIPAL ISLAMIC PRS PLUS GROWTH
4
TRUSTEE’S REPORT TO THE MEMBERS OF PRINCIPAL ISLAMIC PRS PLUS GROWTH We have acted as Trustee for Principal Islamic PRS Plus Growth (the “Fund”) for the six months financial period ended 28 February 2021. To the best of our knowledge, for the financial period under review, Principal Asset Management Berhad (the “PRS Provider”) has operated and managed the Fund in accordance with the following:- (a) limitations imposed on the investment powers of the PRS Provider under the Deed(s), the
Securities Commission’s Guidelines on Private Retirement Schemes, the Capital Markets and Services Act 2007 and other applicable laws;
(b) valuation and pricing for the Fund is carried out in accordance with the Deed(s) of the Fund and
any regulatory requirements; and
(c) creation and cancellation of units for the Fund are carried out in accordance with the Deed(s) of the Fund and any regulatory requirements.
We are of the view that the distribution made during the six months financial period ended 28 February 2021 by the PRS Provider is not inconsistent with the objectives of the Fund. For Deutsche Trustees Malaysia Berhad NG HON LEONG GERARD ANG Head, Trustee Operations Chief Executive Officer Kuala Lumpur 9 April 2021
PRINCIPAL ISLAMIC PRS PLUS GROWTH
5
PRS PROVIDER’S REPORT FUND OBJECTIVE AND POLICY What is the investment objective of the Fund? The Fund seeks to provide capital growth over the long-term by investing in a portfolio of primarily Shariah-compliant equities with some exposure in Sukuk. Has the Fund achieved its objective? The Fund has achieved its objective as stated under the Fund Performance section for the financial period under review. What are the Fund investment policy and principal investment strategy? The Fund will invest in a portfolio of mixed assets, primarily in Shariah-compliant equities with some exposure in Sukuk, to provide capital growth to the Fund. The fixed income portion will provide capital stability to the Fund whilst the equity portion will provide the added return in a rising market. The Fund may opt to invest in Sukuk and Shariah-compliant equities either directly or via Islamic collective investment scheme. Before 1 June 2020 The investments by the Fund in Shariah-compliant equities which include foreign exposure may be up to 70% of the Fund’s Net Asset Value (“NAV”) and investments in local and/or foreign Sukuk will be at least 30% of the Fund’s NAV with a minimum credit rating of “BBB3” or “P2” by RAM Ratings (“RAM”) or equivalent rating by Malaysian Rating Corporation Berhad (“MARC”) or “BBB” or “A-2” by Standard & Poor's (“S&P”) or equivalent rating by any other international rating agencies. The asset allocation strategy for this Fund is as follows:
• At least 30% of the Fund’s NAV will be invested in Sukuk;
• Up to 70% of the Fund’s NAV may be invested in Shariah-compliant equities; and
• Up to 5% of the Fund’s NAV may be invested in Islamic liquid assets for liquidity purpose. With effect from 1 June 2020 The investments by the Fund in Shariah-compliant equities which include foreign exposure may be up to 90% of the Fund’s NAV and investments in local and/or foreign Sukuk will be at least 10% of the Fund’s NAV with a minimum credit rating of “BBB3” or “P2” by RAM or equivalent rating by MARC or “BBB” or “A-2” by S&P or equivalent rating by any other international rating agencies. Notwithstanding, the Fund may also invest up to 10% of its NAV in unrated Sukuk. The asset allocation strategy for this Fund is as follows:
• At least 10% of the Fund’s NAV will be invested in Sukuk;
• Up to 10% of the Fund’s NAV may be invested in unrated Sukuk;
• Up to 90% of the Fund’s NAV may be invested in Shariah-compliant equities; and
• Up to 5% of the Fund’s NAV may be invested in Islamic liquid assets for liquidity purpose. Fund category/type Core (Growth) When was the Fund launched?
Name of Class Launch Date
Class A 12 November 2012
Class C 12 November 2012
Class X 12 November 2012
What was the size of the Fund as at 28 February 2021? RM109.18 million (132.55 million units)
PRINCIPAL ISLAMIC PRS PLUS GROWTH
6
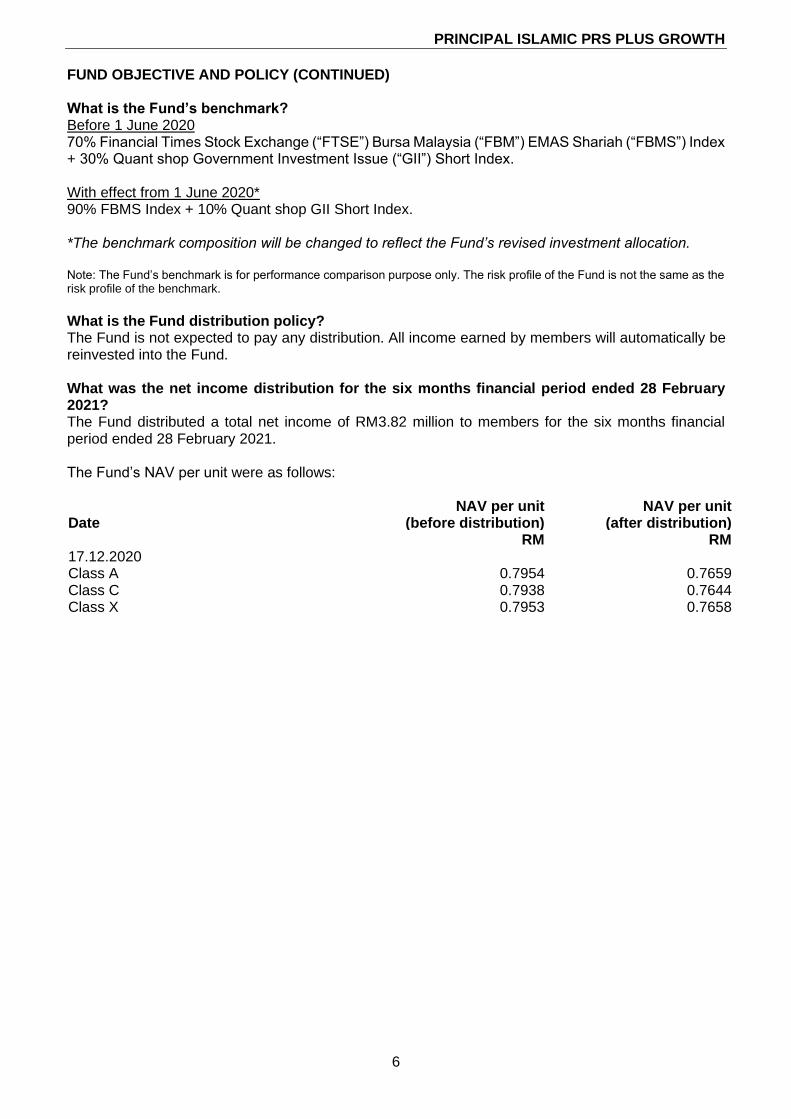
FUND OBJECTIVE AND POLICY (CONTINUED) What is the Fund’s benchmark? Before 1 June 2020 70% Financial Times Stock Exchange (“FTSE”) Bursa Malaysia (“FBM”) EMAS Shariah (“FBMS”) Index + 30% Quant shop Government Investment Issue (“GII”) Short Index. With effect from 1 June 2020* 90% FBMS Index + 10% Quant shop GII Short Index. *The benchmark composition will be changed to reflect the Fund’s revised investment allocation. Note: The Fund’s benchmark is for performance comparison purpose only. The risk profile of the Fund is not the same as the risk profile of the benchmark.
What is the Fund distribution policy? The Fund is not expected to pay any distribution. All income earned by members will automatically be reinvested into the Fund. What was the net income distribution for the six months financial period ended 28 February 2021? The Fund distributed a total net income of RM3.82 million to members for the six months financial period ended 28 February 2021. The Fund’s NAV per unit were as follows:
Date NAV per unit
(before distribution) NAV per unit
(after distribution) RM RM 17.12.2020 Class A 0.7954 0.7659 Class C 0.7938 0.7644 Class X 0.7953 0.7658
PRINCIPAL ISLAMIC PRS PLUS GROWTH
7
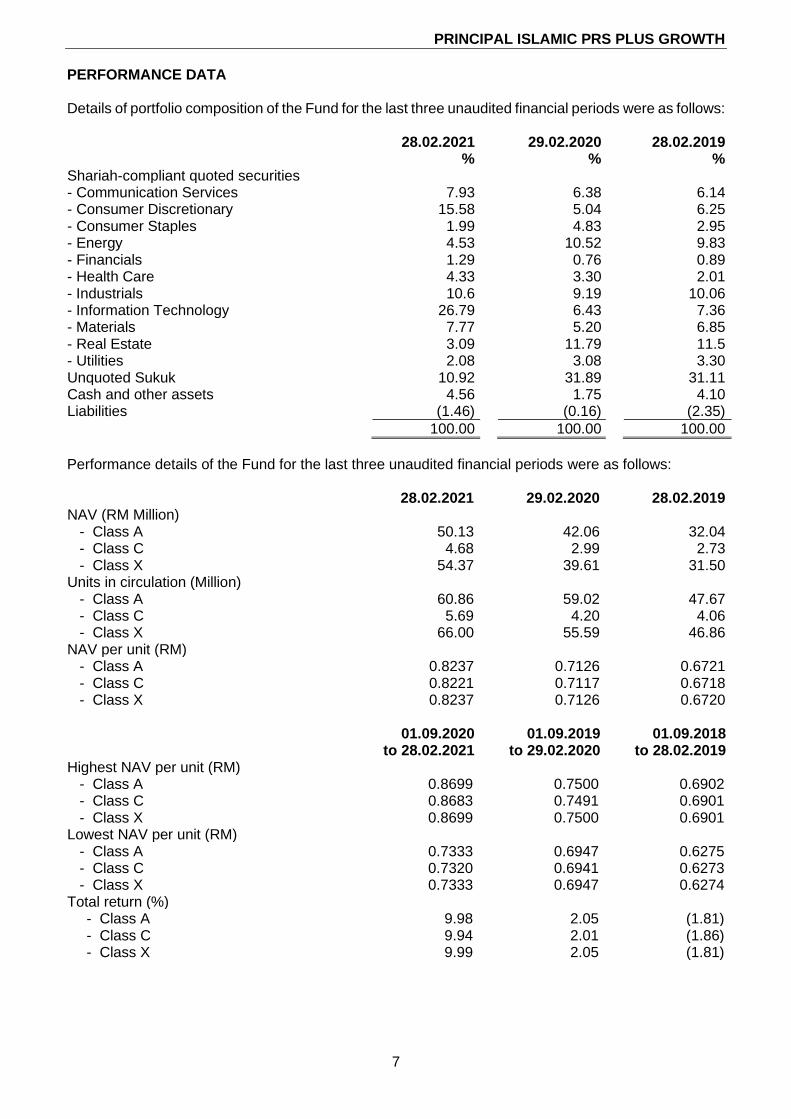
PERFORMANCE DATA Details of portfolio composition of the Fund for the last three unaudited financial periods were as follows: 28.02.2021 29.02.2020 28.02.2019 % % % Shariah-compliant quoted securities - Communication Services 7.93 6.38 6.14 - Consumer Discretionary 15.58 5.04 6.25 - Consumer Staples 1.99 4.83 2.95 - Energy 4.53 10.52 9.83 - Financials 1.29 0.76 0.89 - Health Care 4.33 3.30 2.01 - Industrials 10.6 9.19 10.06 - Information Technology 26.79 6.43 7.36 - Materials 7.77 5.20 6.85 - Real Estate 3.09 11.79 11.5 - Utilities 2.08 3.08 3.30 Unquoted Sukuk 10.92 31.89 31.11 Cash and other assets 4.56 1.75 4.10 Liabilities (1.46) (0.16) (2.35)
100.00 100.00 100.00
Performance details of the Fund for the last three unaudited financial periods were as follows: 28.02.2021 29.02.2020 28.02.2019 NAV (RM Million) - Class A 50.13 42.06 32.04 - Class C 4.68 2.99 2.73 - Class X 54.37 39.61 31.50 Units in circulation (Million) - Class A 60.86 59.02 47.67 - Class C 5.69 4.20 4.06 - Class X 66.00 55.59 46.86 NAV per unit (RM) - Class A 0.8237 0.7126 0.6721 - Class C 0.8221 0.7117 0.6718 - Class X 0.8237 0.7126 0.6720
01.09.2020
to 28.02.2021 01.09.2019
to 29.02.2020 01.09.2018
to 28.02.2019 Highest NAV per unit (RM) - Class A 0.8699 0.7500 0.6902 - Class C 0.8683 0.7491 0.6901 - Class X 0.8699 0.7500 0.6901 Lowest NAV per unit (RM) - Class A 0.7333 0.6947 0.6275 - Class C 0.7320 0.6941 0.6273 - Class X 0.7333 0.6947 0.6274 Total return (%) - Class A 9.98 2.05 (1.81) - Class C 9.94 2.01 (1.86) - Class X 9.99 2.05 (1.81)
PRINCIPAL ISLAMIC PRS PLUS GROWTH
8
PERFORMANCE DATA (CONTINUED) Performance details of the Fund for the last three unaudited financial periods were as follows: (continued)
01.09.2020
to 28.02.2021 01.09.2019
to 29.02.2020 01.09.2018
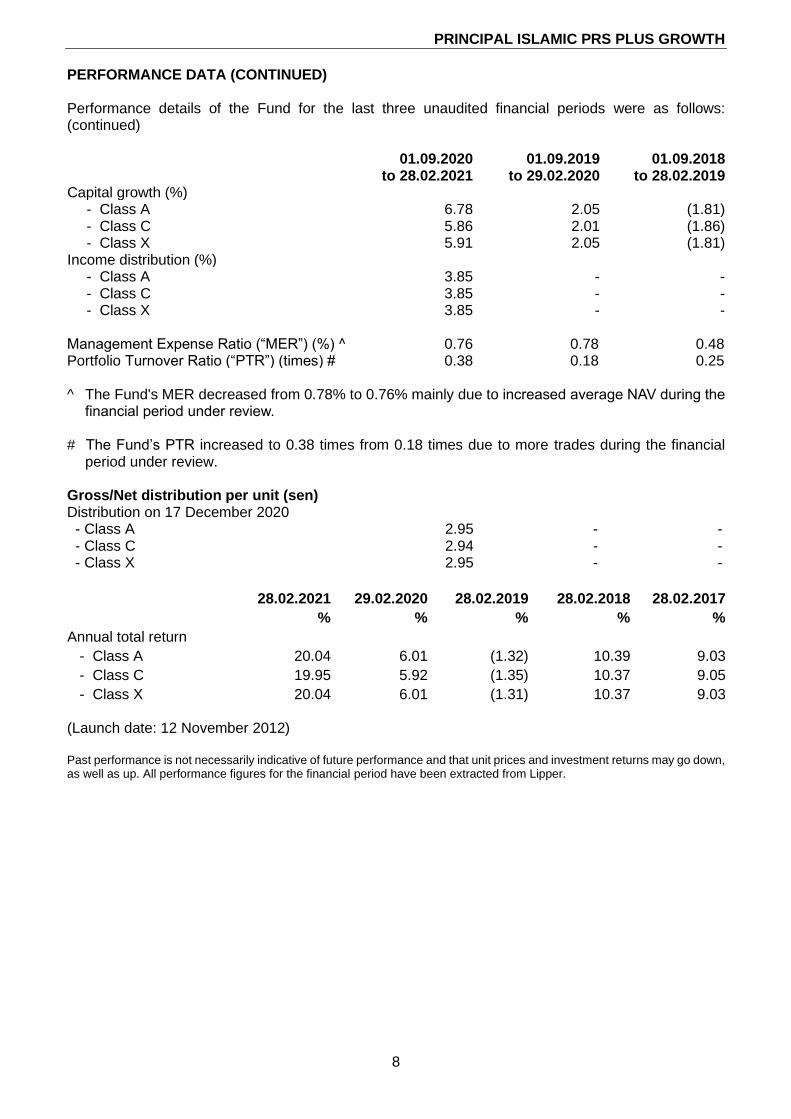
to 28.02.2019 Capital growth (%) - Class A 6.78 2.05 (1.81) - Class C 5.86 2.01 (1.86) - Class X 5.91 2.05 (1.81)
Income distribution (%) - Class A 3.85 - - - Class C 3.85 - - - Class X 3.85 - -
Management Expense Ratio (“MER”) (%) ^ 0.76 0.78 0.48 Portfolio Turnover Ratio (“PTR”) (times) # 0.38 0.18 0.25 ^ The Fund's MER decreased from 0.78% to 0.76% mainly due to increased average NAV during the
financial period under review. # The Fund’s PTR increased to 0.38 times from 0.18 times due to more trades during the financial
period under review. Gross/Net distribution per unit (sen) Distribution on 17 December 2020 - Class A 2.95 - - - Class C 2.94 - - - Class X 2.95 - -
28.02.2021 29.02.2020 28.02.2019 28.02.2018 28.02.2017
% % % % %
Annual total return
- Class A 20.04 6.01 (1.32) 10.39 9.03
- Class C 19.95 5.92 (1.35) 10.37 9.05
- Class X 20.04 6.01 (1.31) 10.37 9.03 (Launch date: 12 November 2012) Past performance is not necessarily indicative of future performance and that unit prices and investment returns may go down, as well as up. All performance figures for the financial period have been extracted from Lipper.
PRINCIPAL ISLAMIC PRS PLUS GROWTH
9
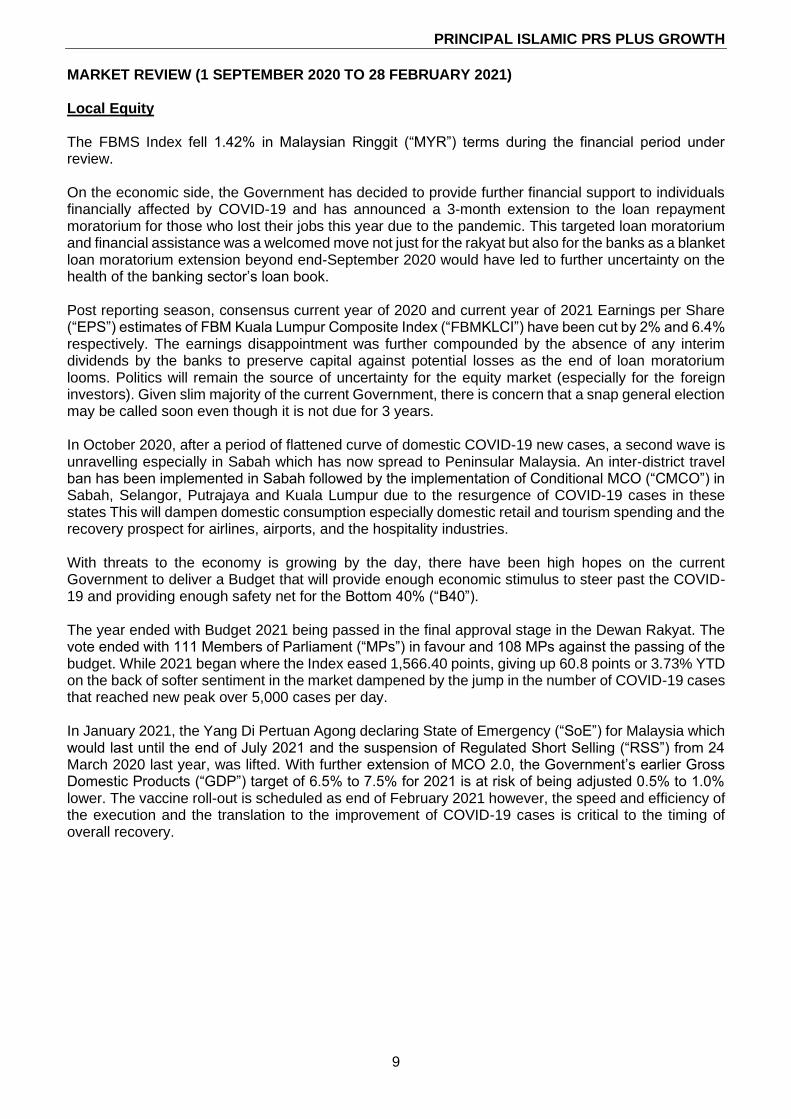
MARKET REVIEW (1 SEPTEMBER 2020 TO 28 FEBRUARY 2021) Local Equity The FBMS Index fell 1.42% in Malaysian Ringgit (“MYR”) terms during the financial period under review. On the economic side, the Government has decided to provide further financial support to individuals financially affected by COVID-19 and has announced a 3-month extension to the loan repayment moratorium for those who lost their jobs this year due to the pandemic. This targeted loan moratorium and financial assistance was a welcomed move not just for the rakyat but also for the banks as a blanket loan moratorium extension beyond end-September 2020 would have led to further uncertainty on the health of the banking sector’s loan book. Post reporting season, consensus current year of 2020 and current year of 2021 Earnings per Share (“EPS”) estimates of FBM Kuala Lumpur Composite Index (“FBMKLCI”) have been cut by 2% and 6.4% respectively. The earnings disappointment was further compounded by the absence of any interim dividends by the banks to preserve capital against potential losses as the end of loan moratorium looms. Politics will remain the source of uncertainty for the equity market (especially for the foreign investors). Given slim majority of the current Government, there is concern that a snap general election may be called soon even though it is not due for 3 years. In October 2020, after a period of flattened curve of domestic COVID-19 new cases, a second wave is unravelling especially in Sabah which has now spread to Peninsular Malaysia. An inter-district travel ban has been implemented in Sabah followed by the implementation of Conditional MCO (“CMCO”) in Sabah, Selangor, Putrajaya and Kuala Lumpur due to the resurgence of COVID-19 cases in these states This will dampen domestic consumption especially domestic retail and tourism spending and the recovery prospect for airlines, airports, and the hospitality industries. With threats to the economy is growing by the day, there have been high hopes on the current Government to deliver a Budget that will provide enough economic stimulus to steer past the COVID-19 and providing enough safety net for the Bottom 40% (“B40”). The year ended with Budget 2021 being passed in the final approval stage in the Dewan Rakyat. The vote ended with 111 Members of Parliament (“MPs”) in favour and 108 MPs against the passing of the budget. While 2021 began where the Index eased 1,566.40 points, giving up 60.8 points or 3.73% YTD on the back of softer sentiment in the market dampened by the jump in the number of COVID-19 cases that reached new peak over 5,000 cases per day. In January 2021, the Yang Di Pertuan Agong declaring State of Emergency (“SoE”) for Malaysia which would last until the end of July 2021 and the suspension of Regulated Short Selling (“RSS”) from 24
March 2020 last year, was lifted. With further extension of MCO 2.0, the Government’s earlier Gross Domestic Products (“GDP”) target of 6.5% to 7.5% for 2021 is at risk of being adjusted 0.5% to 1.0% lower. The vaccine roll-out is scheduled as end of February 2021 however, the speed and efficiency of the execution and the translation to the improvement of COVID-19 cases is critical to the timing of overall recovery.
PRINCIPAL ISLAMIC PRS PLUS GROWTH
10
MARKET REVIEW (1 SEPTEMBER 2020 TO 28 FEBRUARY 2021) (CONTINUED) Foreign Equity The MSCI AC Asia ex Japan Islamic Index rose 13.70% in MYR terms during the financial period under review. A risk on rally continued from September 2020 through the end of the year as economies begun to re-open around the globe after vaccines were approved. The Pfizer, Moderna and AstraZeneca vaccines were allowed for mass use and vaccination rates increased in major economies such as the UK and US progressively. The US elected Joe Biden as the new President, and he took office on 20 Jan 2021. There are hopes the US-China relationship will be less volatile under Biden than during the Trump administration. Overall, the investment environment for equities was very favorable also given continued monetary and fiscal support. Entering the new year, US Treasury (“UST”) bond yields started to rise and China withdrew liquidity, driving the overnight repo rate to the highest since 2015 in February 2021. Surveillance of credit to the real estate sector was also increased further. Valuation for Asian equities was not cheap relative to history and we saw some near-term market weakness. Unquoted Sukuk Bank Negara Malaysia (“BNM”) reduced its Overnight Policy Rate (“OPR”) by a total of 125 basis point (“bps”) in 2020, in the months prior to September 2020. Following that, BNM maintained the OPR steady at 1.75% at all the Monetary Policy Committee (“MPC”) meetings in September 2020 and November 2020 as well as the latest MPC meeting in January 2021. The Central Bank continued to mention that the overall outlook locally and globally remains subject to downside risks, primarily if there is a further resurgence of COVID-19 cases. On 23 September 2020, the Prime Minister announced an additional RM10 billions of fiscal stimulus package to bolster the country’s economy in weathering the impact of COVID-19. The Kita Prihatin programme is a special initiative aimed at helping micro entrepreneurs, the country’s workforce and those from the B40 as well as the Middle 40 (“M40”) income group. In January 2021, the government unveiled PERMAI, its 5th economic stimulus package worth RM15 billion spread over 22 initiatives aimed at safeguarding the welfare of the people and supporting business continuity following the implementation of MCO2.0. At the time of writing, in mid-March 2021, another stimulus package worth RM20 billion was announced (i.e. PEMERKASA) of which RM11 billion is via direct fiscal injection. With this latest stimulus package announcement, the Ministry of Finance has guided for Malaysia’s deficit ratio in 2021 to be revised higher to 6% (vs. 5.4% under Budget 2021). 2021 began with two major announcements– i.e. the MCO 2.0 and the State of Emergency (“SoE”). The entire country was placed under MCO 2.0 (except Sarawak) up until 4 February 2021. MCO2.0 continued up until 4 March 2021 for 4 states i.e. Selangor, Kuala Lumpur, Johor and Penang due to the high number of cases. Meanwhile, the Palace issued the SoE proclamation to suspend Parliament and State Legislative Assemblies (including elections) until 1 August 2020. Malaysia’s Budget 2021 was passed at its policy stage via a majority voice vote on 27 November 2020 with additional measures/amendments including a further loan moratorium for the B40 and Micro, Small and Medium Enterprises (“MSMEs”) and the expansion of i-Sinar facility to include all Employees' Provident Fund (“EPF”) members whose income has been affected persons from by the pandemic. In February 2021, it was announced that members with savings of RM100,000 and below in their Account 1 can withdraw up to RM10,000, while those with savings of RM100,000 and above can withdraw up to 10% of their Account 1 or up to RM60,000 – whichever the lower.
PRINCIPAL ISLAMIC PRS PLUS GROWTH
11
MARKET REVIEW (1 SEPTEMBER 2020 TO 28 FEBRUARY 2021) (CONTINUED) Unquoted Sukuk (continued) On 4 December 2020, Fitch Ratings downgraded Malaysia’s sovereign rating to “BBB+” from “A-” with a stable outlook. Fitch noted that COVID-19 has weakened Malaysia’s several key credit metrics. Fitch pointed that Malaysia’s debt burden is significantly higher than the medians of 59.2% and 52.7% for the 'A' and 'BBB' rating categories respectively. Additionally, it views the lingering political uncertainty following the change in Government in March 2021 weights on the policy outlook and affects the prospects for further improvement in governance standards. Meanwhile, in January 2021, Moody’s reaffirmed Malaysia’s A3 rating and maintained its stable outlook. The rating agency cited strong medium-term growth prospects, credible and effective macro policymaking institutions, and expectations of gradual fiscal consolidation over the next 2 years to 3 years. These credit strengths moderate Malaysia’s relatively high debt level. Malaysia’s Consumer Price Index (“CPI”) continued to be in deflation mode until the end of the year with the latest December 2020 data pointing at CPI falling by 1.4% year-on-year (“y-o-y”). The drop in the overall index was mainly due to the transport index as the lower oil prices continued to drag down the index. CPI for the year 2020 decreased by 1.2% as compared to last year. In January 2021, Malaysia’s CPI slipped 0.2% y-o-y but rose for the first time in 12 months in February 2021 as it expanded 0.1% y-o-y on higher prices of food and other goods & services. In 2020, Malaysia’s GDP contracted by -5.6%, which is the worst contraction seen since 1998. In fourth quarter of 2020, the country’s economy contracted by -3.4% (third quarter of 2020: -2.7%, second quarter of 2020: -17.1%). In 2019, Malaysia recorded GDP growth of 4.3%. Construction, mining and services sectors posted the biggest declines in 2020, contracting by 19.4%, 10% and 5.5%, respectively. The 3-year, 5-year, 7-year, 10-year, 15-year, 20-year and 30-year Malaysian Government Securities (“MGS”) yields closed at 2.10%, 2.43%, 2.82%, 3.07%, 3.85%, 3.96% and 4.32% respectively at the end of February 2021. FUND PERFORMANCE
6 months to 28.02.2021
1 year to 28.02.2021
Class A Class C Class X Class A Class C Class X % % % % % % Income Distribution 3.85 3.85 3.85 3.85 3.85 3.85 Capital Growth 6.78 5.86 5.91 16.76 15.50 15.59 Total Return 9.98 9.94 9.99 20.04 19.95 20.04 Benchmark (1.20) (1.20) (1.20) 15.51 15.51 15.51 Average Total Return N/A N/A N/A 20.04 19.95 20.04
3 years to 28.02.2021
5 years to 28.02.2021
Class A Class C Class X Class A Class C Class X % % % % % % Income Distribution 3.85 3.85 3.85 3.85 3.85 3.85 Capital Growth 22.15 20.69 20.94 47.00 45.24 45.51 Total Return 25.85 25.34 25.60 51.14 50.86 51.14 Benchmark (1.60) (1.60) (1.60) 7.64 7.64 7.64 Average Total Return 7.89 7.82 7.89 8.61 8.57 8.61
PRINCIPAL ISLAMIC PRS PLUS GROWTH
12
FUND PERFORMANCE (CONTINUED)
Since inception to
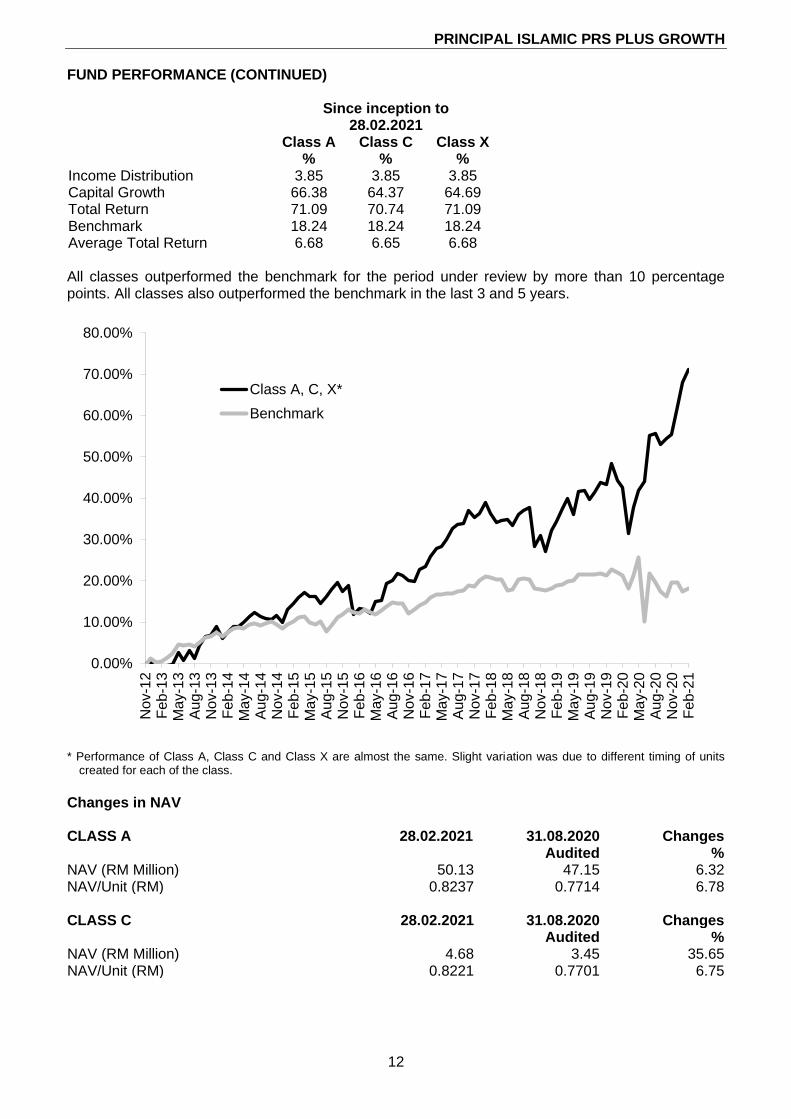
28.02.2021 Class A Class C Class X % % % Income Distribution 3.85 3.85 3.85 Capital Growth 66.38 64.37 64.69 Total Return 71.09 70.74 71.09 Benchmark 18.24 18.24 18.24 Average Total Return 6.68 6.65 6.68 All classes outperformed the benchmark for the period under review by more than 10 percentage points. All classes also outperformed the benchmark in the last 3 and 5 years.
* Performance of Class A, Class C and Class X are almost the same. Slight variation was due to different timing of units
created for each of the class.
Changes in NAV CLASS A 28.02.2021 31.08.2020 Changes
Audited % NAV (RM Million) 50.13 47.15 6.32 NAV/Unit (RM) 0.8237 0.7714 6.78 CLASS C 28.02.2021 31.08.2020 Changes Audited % NAV (RM Million) 4.68 3.45 35.65 NAV/Unit (RM) 0.8221 0.7701 6.75
0.00%
10.00%
20.00%
30.00%
40.00%
50.00%
60.00%
70.00%
80.00%
No
v-1
2F
eb
-13
Ma
y-1
3A
ug-1
3N
ov-1
3F
eb
-14
Ma
y-1
4A
ug-1
4N
ov-1
4F
eb
-15
Ma
y-1
5A
ug-1
5N
ov-1
5F
eb
-16
Ma
y-1
6A
ug-1
6N
ov-1
6F
eb
-17
May-1
7A
ug-1
7N
ov-1
7F
eb
-18
Ma
y-1
8A
ug-1
8N
ov-1
8F
eb-1
9M
ay-1
9A
ug-1
9N
ov-1
9F
eb
-20
Ma
y-2
0A
ug-2
0N
ov-2
0F
eb
-21
Class A, C, X*
Benchmark
PRINCIPAL ISLAMIC PRS PLUS GROWTH
13
FUND PERFORMANCE (CONTINUED) Changes in NAV (Continued) CLASS X 28.02.2021 31.08.2020 Changes Audited % NAV (RM Million) 54.37 46.63 16.60 NAV/Unit (RM) 0.8237 0.7714 6.78 The fund recorded net inflows for Class C and X for the period under consideration. The NAV per unit rose for all share classes. Performance data represents the combined income and capital return as a result of holding units in the Fund for the specified length of time, based on NAV to NAV price. The performance data assumes that all earnings from the Fund are reinvested and are net of management and trustee fees. Past performance is not reflective of future performance and income distributions are not guaranteed. Unit prices and income distributions, if any, may fall and rise. All performance figures for the financial period have been extracted from Lipper.
PORTFOLIO STRUCTURE Asset allocation
(% of NAV) 28.02.2021
31.08.2020
Audited
Shariah-compliant quoted securities 85.98 66.07
Unquoted Sukuk 10.92 30.50
Cash and other assets 4.56 4.72
Liabilities (1.46) (1.29)
Total 100.00 100.00
The Fund remained invested during the financial period under review. Allocation towards Shariah-compliant quoted securities increased to 85.99% as the PRS Provider positioned for an upswing in the equities market as economies recover. MARKET OUTLOOK* Local Equity We continue to like equities, but markets may be choppy in the near term on concerns over rising US Government bond yields and a tightening of liquidity. China is moving towards policy normalization given that the economy has recovered to close to pre-COVID-19 levels. The recent correction in Asian markets have echoed these risks. We are watching a few issues including the successful roll-out of mass vaccinations in the various markets and the timing of a pullback in stimulus measures globally. While Emerging Markets (“EM”) are lagging developed ones in vaccination rate, recent plans suggest a meaningful pick-up ahead. Foreign Equity We continue to like equities, but markets may be choppy in the near term on concerns over rising US Government bond yields and a tightening of liquidity. China is moving towards policy normalization given that the economy has recovered to close to pre-COVID-19 levels. The recent correction in Asian markets have echoed these risks. We are watching a few issues including the successful roll-out of mass vaccinations in the various markets and the timing of a pullback in stimulus measures globally. While EM are lagging developed ones in vaccination rate, recent plans suggest a meaningful pick-up ahead.
PRINCIPAL ISLAMIC PRS PLUS GROWTH
14
MARKET OUTLOOK* (CONTINUED) Unquoted Sukuk Despite the OPR cut of 1.25% in 2020, only the short end bonds saw yields contracted by the same magnitude. Malaysia’s bond markets were not spared from the global sell-off and coupled with our own domestic concerns, the MGS yield curve bear-steepened and is probably trading at one of its steepest we have seen in recent times, with term spreads trading above both its long-term and short-term averages. The long-end steepness now is still reflecting the underlying risks investing in MYR Bond. With the lower-than-expected GDP number released for fourth quarter of 2020, it is expected that the Central Bank would release its revised outlook for full year economic growth in March 2021/ April 2021. The initial projections by the Ministry of Finance (“MoF”) were between 6.5% to 7.5%. At the time of writing, the World Bank has lowered its forecast growth for Malaysia’s GDP to 6% for 2021 from 6.7% previously in December 2020 on the back of an increase in COVID-19 cases, unemployment rate and political instability. They have mentioned specifically that the strength and timing of economic recovery are largely dependent on the vaccination programme, which is expected to cover 30% of the population by August 2021. * This market outlook does not constitute an offer, invitation, commitment, advice or recommendation to make a purchase of any investment. The information given in this article represents the views of Principal Asset Management Berhad (“Principal Malaysia”) or based on data obtained from sources believed to be reliable by Principal Malaysia. Whilst every care has been taken in preparing this, Principal Malaysia makes no guarantee, representation or warranty and is under no circumstances liable for any loss or damage caused by reliance on, any opinion, advice or statement made in this market outlook.
INVESTMENT STRATEGY Local Equity We remain constructive on the market and look ahead towards normalization. With that, we will be focusing on post COVID-19 recovery theme; positioning into companies with high growth, resilient earnings and solid track record while being fully invested. Foreign Equity The fund is positioned structurally in technology companies with monopolistic power in both the internet and hardware space, domestic consumption firms in both China and India which have strong moats as well as innovators in emerging fields. Unquoted Sukuk We expect more supply to the market although we are seeing mostly high-grade names supply and highlight potential repricing risk with the global reflation theme in play. As such, we will take profit accordingly when possible to move to new credit supply. With that said, we continue to be mindful in our credit selection with a preference on names which are more resilient with stronger fundamentals, as well as better liquidity.
PRINCIPAL ISLAMIC PRS PLUS GROWTH
15
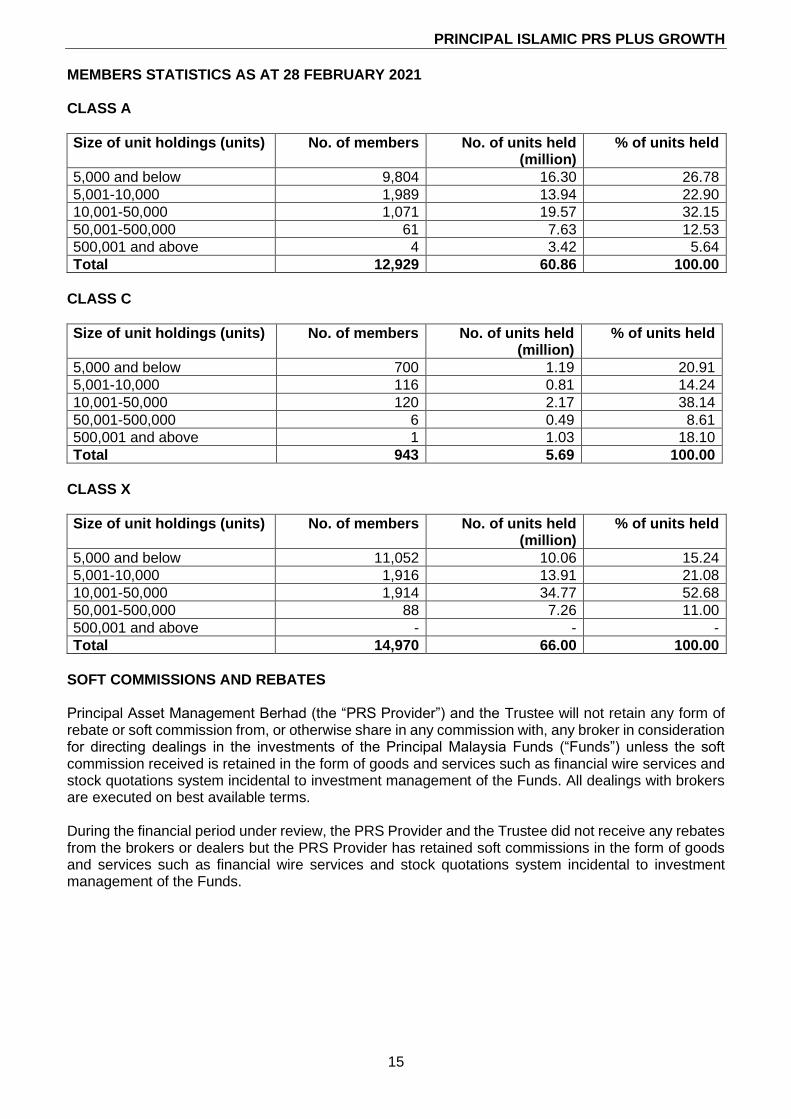
MEMBERS STATISTICS AS AT 28 FEBRUARY 2021 CLASS A
Size of unit holdings (units) No. of members No. of units held (million)
% of units held
5,000 and below 9,804 16.30 26.78
5,001-10,000 1,989 13.94 22.90
10,001-50,000 1,071 19.57 32.15
50,001-500,000 61 7.63 12.53
500,001 and above 4 3.42 5.64
Total 12,929 60.86 100.00
CLASS C
Size of unit holdings (units) No. of members No. of units held (million)
% of units held
5,000 and below 700 1.19 20.91
5,001-10,000 116 0.81 14.24
10,001-50,000 120 2.17 38.14
50,001-500,000 6 0.49 8.61
500,001 and above 1 1.03 18.10
Total 943 5.69 100.00
CLASS X
Size of unit holdings (units) No. of members No. of units held (million)
% of units held
5,000 and below 11,052 10.06 15.24
5,001-10,000 1,916 13.91 21.08
10,001-50,000 1,914 34.77 52.68
50,001-500,000 88 7.26 11.00
500,001 and above - - -
Total 14,970 66.00 100.00
SOFT COMMISSIONS AND REBATES Principal Asset Management Berhad (the “PRS Provider”) and the Trustee will not retain any form of rebate or soft commission from, or otherwise share in any commission with, any broker in consideration for directing dealings in the investments of the Principal Malaysia Funds (“Funds”) unless the soft commission received is retained in the form of goods and services such as financial wire services and stock quotations system incidental to investment management of the Funds. All dealings with brokers are executed on best available terms. During the financial period under review, the PRS Provider and the Trustee did not receive any rebates from the brokers or dealers but the PRS Provider has retained soft commissions in the form of goods and services such as financial wire services and stock quotations system incidental to investment management of the Funds.
PRINCIPAL ISLAMIC PRS PLUS GROWTH
16
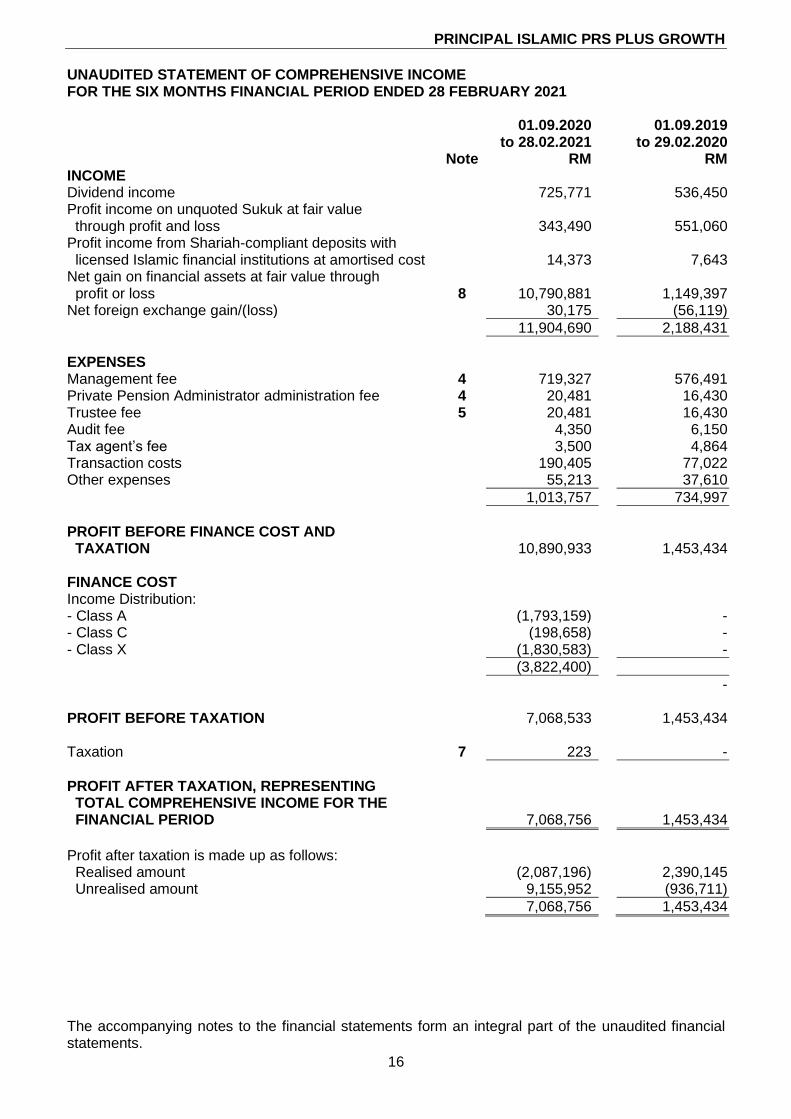
UNAUDITED STATEMENT OF COMPREHENSIVE INCOME FOR THE SIX MONTHS FINANCIAL PERIOD ENDED 28 FEBRUARY 2021
01.09.2020
to 28.02.2021 01.09.2019
to 29.02.2020 Note RM RM INCOME Dividend income 725,771 536,450 Profit income on unquoted Sukuk at fair value through profit and loss 343,490 551,060 Profit income from Shariah-compliant deposits with licensed Islamic financial institutions at amortised cost 14,373 7,643 Net gain on financial assets at fair value through profit or loss 8 10,790,881 1,149,397 Net foreign exchange gain/(loss) 30,175 (56,119)
11,904,690 2,188,431
EXPENSES Management fee 4 719,327 576,491 Private Pension Administrator administration fee 4 20,481 16,430 Trustee fee 5 20,481 16,430 Audit fee 4,350 6,150 Tax agent’s fee 3,500 4,864 Transaction costs 190,405 77,022 Other expenses 55,213 37,610
1,013,757 734,997
PROFIT BEFORE FINANCE COST AND TAXATION 10,890,933 1,453,434 FINANCE COST Income Distribution: - Class A (1,793,159) - - Class C (198,658) - - Class X (1,830,583) -
(3,822,400)
- PROFIT BEFORE TAXATION 7,068,533 1,453,434 Taxation 7 223 -
PROFIT AFTER TAXATION, REPRESENTING TOTAL COMPREHENSIVE INCOME FOR THE FINANCIAL PERIOD 7,068,756 1,453,434
Profit after taxation is made up as follows: Realised amount (2,087,196) 2,390,145 Unrealised amount 9,155,952 (936,711)
7,068,756 1,453,434
The accompanying notes to the financial statements form an integral part of the unaudited financial statements.
PRINCIPAL ISLAMIC PRS PLUS GROWTH
17
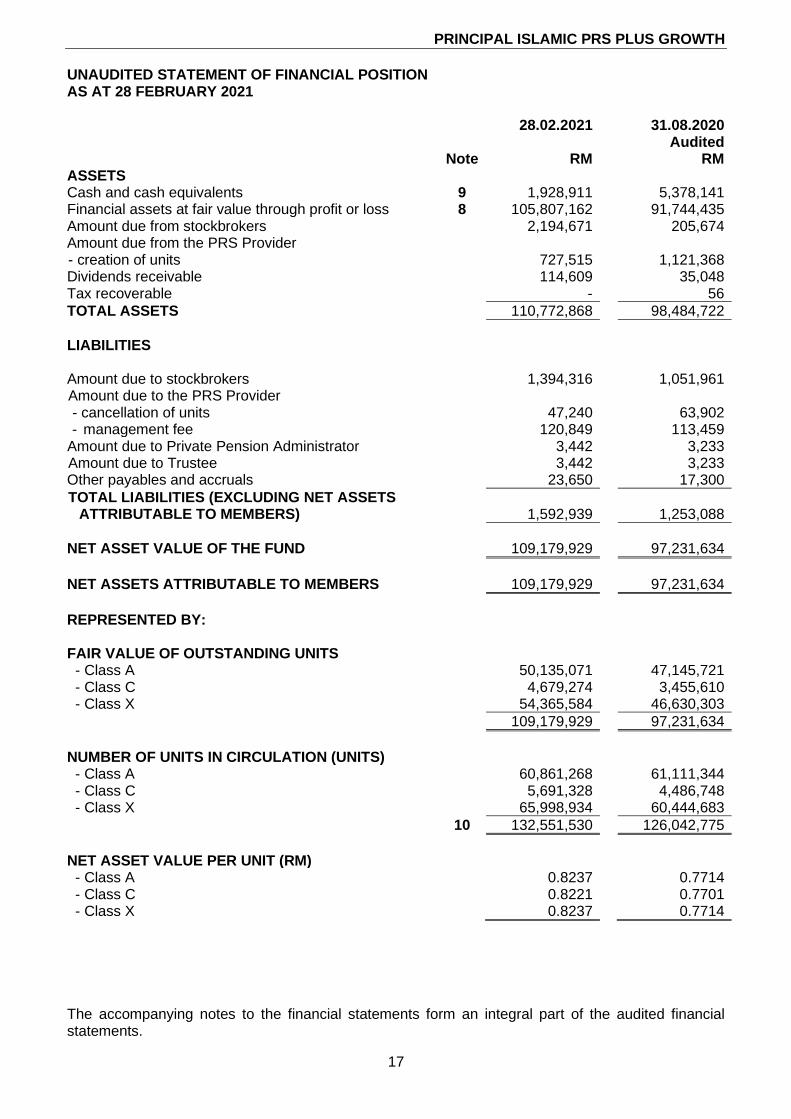
UNAUDITED STATEMENT OF FINANCIAL POSITION AS AT 28 FEBRUARY 2021 28.02.2021 31.08.2020 Audited Note RM RM ASSETS Cash and cash equivalents 9 1,928,911 5,378,141 Financial assets at fair value through profit or loss 8 105,807,162 91,744,435 Amount due from stockbrokers 2,194,671 205,674 Amount due from the PRS Provider - creation of units 727,515 1,121,368 Dividends receivable 114,609 35,048 Tax recoverable - 56
TOTAL ASSETS 110,772,868 98,484,722
LIABILITIES Amount due to stockbrokers 1,394,316 1,051,961 Amount due to the PRS Provider - cancellation of units 47,240 63,902 - management fee 120,849 113,459
Amount due to Private Pension Administrator 3,442 3,233 Amount due to Trustee 3,442 3,233 Other payables and accruals 23,650 17,300
TOTAL LIABILITIES (EXCLUDING NET ASSETS ATTRIBUTABLE TO MEMBERS) 1,592,939 1,253,088
NET ASSET VALUE OF THE FUND 109,179,929 97,231,634
NET ASSETS ATTRIBUTABLE TO MEMBERS 109,179,929 97,231,634
REPRESENTED BY: FAIR VALUE OF OUTSTANDING UNITS - Class A 50,135,071 47,145,721 - Class C 4,679,274 3,455,610 - Class X 54,365,584 46,630,303
109,179,929 97,231,634
NUMBER OF UNITS IN CIRCULATION (UNITS) - Class A 60,861,268 61,111,344 - Class C 5,691,328 4,486,748 - Class X 65,998,934 60,444,683
10 132,551,530 126,042,775
NET ASSET VALUE PER UNIT (RM) - Class A 0.8237 0.7714 - Class C 0.8221 0.7701 - Class X 0.8237 0.7714
The accompanying notes to the financial statements form an integral part of the audited financial statements.
PRINCIPAL ISLAMIC PRS PLUS GROWTH
18
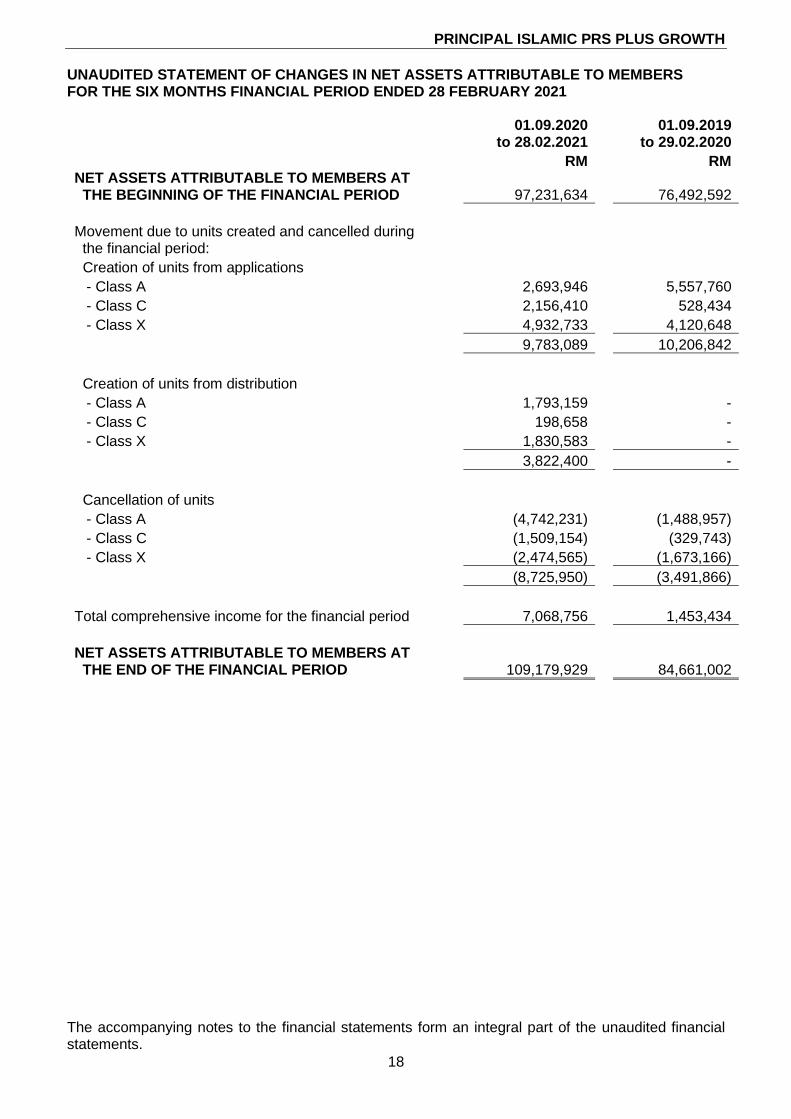
UNAUDITED STATEMENT OF CHANGES IN NET ASSETS ATTRIBUTABLE TO MEMBERS FOR THE SIX MONTHS FINANCIAL PERIOD ENDED 28 FEBRUARY 2021
01.09.2020 to 28.02.2021
01.09.2019 to 29.02.2020
RM RM NET ASSETS ATTRIBUTABLE TO MEMBERS AT THE BEGINNING OF THE FINANCIAL PERIOD 97,231,634 76,492,592
Movement due to units created and cancelled during the financial period:
Creation of units from applications
- Class A 2,693,946 5,557,760
- Class C 2,156,410 528,434
- Class X 4,932,733 4,120,648
9,783,089 10,206,842
Creation of units from distribution
- Class A 1,793,159 -
- Class C 198,658 -
- Class X 1,830,583 -
3,822,400 -
Cancellation of units
- Class A (4,742,231) (1,488,957)
- Class C (1,509,154) (329,743)
- Class X (2,474,565) (1,673,166)
(8,725,950) (3,491,866)
Total comprehensive income for the financial period 7,068,756 1,453,434
NET ASSETS ATTRIBUTABLE TO MEMBERS AT THE END OF THE FINANCIAL PERIOD 109,179,929 84,661,002
The accompanying notes to the financial statements form an integral part of the unaudited financial statements.
PRINCIPAL ISLAMIC PRS PLUS GROWTH
19
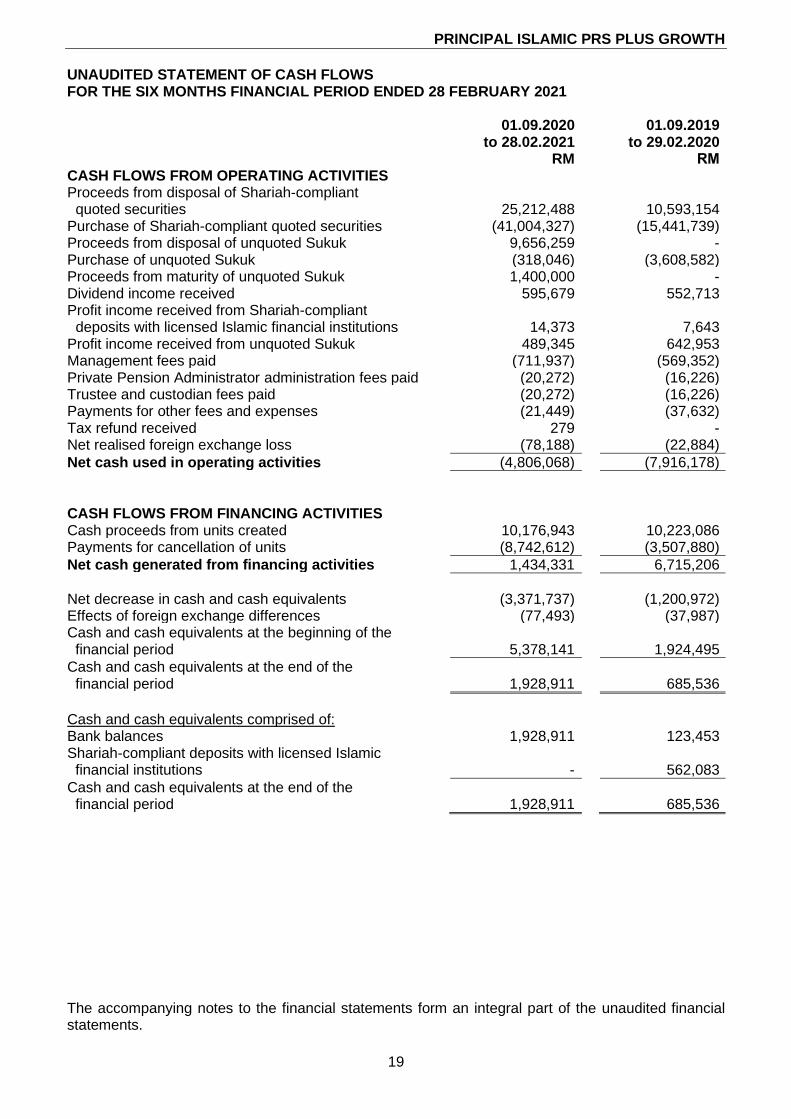
UNAUDITED STATEMENT OF CASH FLOWS FOR THE SIX MONTHS FINANCIAL PERIOD ENDED 28 FEBRUARY 2021
01.09.2020
to 28.02.2021 01.09.2019
to 29.02.2020 RM RM CASH FLOWS FROM OPERATING ACTIVITIES Proceeds from disposal of Shariah-compliant quoted securities 25,212,488 10,593,154 Purchase of Shariah-compliant quoted securities (41,004,327) (15,441,739) Proceeds from disposal of unquoted Sukuk 9,656,259 - Purchase of unquoted Sukuk (318,046) (3,608,582) Proceeds from maturity of unquoted Sukuk 1,400,000 - Dividend income received 595,679 552,713 Profit income received from Shariah-compliant deposits with licensed Islamic financial institutions 14,373 7,643 Profit income received from unquoted Sukuk 489,345 642,953 Management fees paid (711,937) (569,352) Private Pension Administrator administration fees paid (20,272) (16,226) Trustee and custodian fees paid (20,272) (16,226) Payments for other fees and expenses (21,449) (37,632) Tax refund received 279 - Net realised foreign exchange loss (78,188) (22,884)
Net cash used in operating activities (4,806,068) (7,916,178)
CASH FLOWS FROM FINANCING ACTIVITIES Cash proceeds from units created 10,176,943 10,223,086 Payments for cancellation of units (8,742,612) (3,507,880)
Net cash generated from financing activities 1,434,331 6,715,206
Net decrease in cash and cash equivalents (3,371,737) (1,200,972) Effects of foreign exchange differences (77,493) (37,987) Cash and cash equivalents at the beginning of the financial period 5,378,141 1,924,495
Cash and cash equivalents at the end of the financial period 1,928,911 685,536
Cash and cash equivalents comprised of: Bank balances 1,928,911 123,453 Shariah-compliant deposits with licensed Islamic financial institutions - 562,083
Cash and cash equivalents at the end of the financial period 1,928,911 685,536
The accompanying notes to the financial statements form an integral part of the unaudited financial statements.
PRINCIPAL ISLAMIC PRS PLUS GROWTH
20
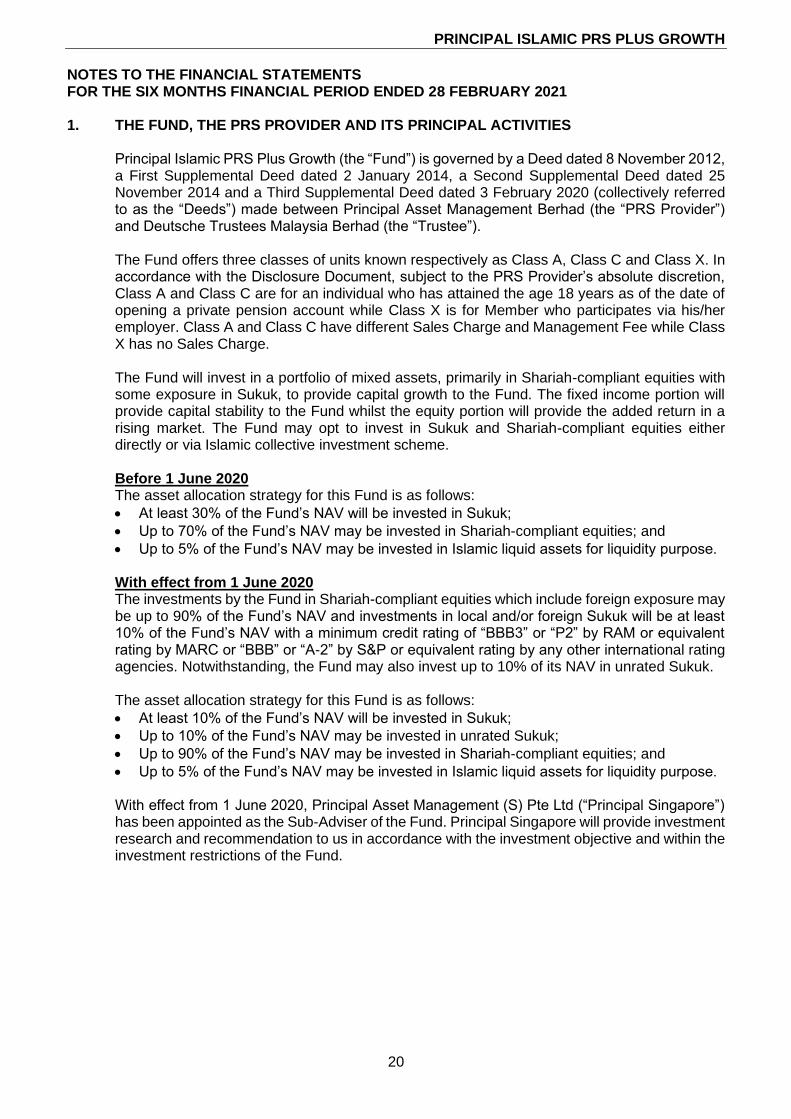
NOTES TO THE FINANCIAL STATEMENTS FOR THE SIX MONTHS FINANCIAL PERIOD ENDED 28 FEBRUARY 2021 1. THE FUND, THE PRS PROVIDER AND ITS PRINCIPAL ACTIVITIES
Principal Islamic PRS Plus Growth (the “Fund”) is governed by a Deed dated 8 November 2012, a First Supplemental Deed dated 2 January 2014, a Second Supplemental Deed dated 25 November 2014 and a Third Supplemental Deed dated 3 February 2020 (collectively referred to as the “Deeds”) made between Principal Asset Management Berhad (the “PRS Provider”) and Deutsche Trustees Malaysia Berhad (the “Trustee”). The Fund offers three classes of units known respectively as Class A, Class C and Class X. In accordance with the Disclosure Document, subject to the PRS Provider’s absolute discretion, Class A and Class C are for an individual who has attained the age 18 years as of the date of opening a private pension account while Class X is for Member who participates via his/her employer. Class A and Class C have different Sales Charge and Management Fee while Class X has no Sales Charge. The Fund will invest in a portfolio of mixed assets, primarily in Shariah-compliant equities with some exposure in Sukuk, to provide capital growth to the Fund. The fixed income portion will provide capital stability to the Fund whilst the equity portion will provide the added return in a rising market. The Fund may opt to invest in Sukuk and Shariah-compliant equities either directly or via Islamic collective investment scheme. Before 1 June 2020 The asset allocation strategy for this Fund is as follows:
• At least 30% of the Fund’s NAV will be invested in Sukuk;
• Up to 70% of the Fund’s NAV may be invested in Shariah-compliant equities; and
• Up to 5% of the Fund’s NAV may be invested in Islamic liquid assets for liquidity purpose. With effect from 1 June 2020 The investments by the Fund in Shariah-compliant equities which include foreign exposure may be up to 90% of the Fund’s NAV and investments in local and/or foreign Sukuk will be at least 10% of the Fund’s NAV with a minimum credit rating of “BBB3” or “P2” by RAM or equivalent rating by MARC or “BBB” or “A-2” by S&P or equivalent rating by any other international rating agencies. Notwithstanding, the Fund may also invest up to 10% of its NAV in unrated Sukuk. The asset allocation strategy for this Fund is as follows:
• At least 10% of the Fund’s NAV will be invested in Sukuk;
• Up to 10% of the Fund’s NAV may be invested in unrated Sukuk;
• Up to 90% of the Fund’s NAV may be invested in Shariah-compliant equities; and
• Up to 5% of the Fund’s NAV may be invested in Islamic liquid assets for liquidity purpose.
With effect from 1 June 2020, Principal Asset Management (S) Pte Ltd (“Principal Singapore”) has been appointed as the Sub-Adviser of the Fund. Principal Singapore will provide investment research and recommendation to us in accordance with the investment objective and within the investment restrictions of the Fund.
PRINCIPAL ISLAMIC PRS PLUS GROWTH
21
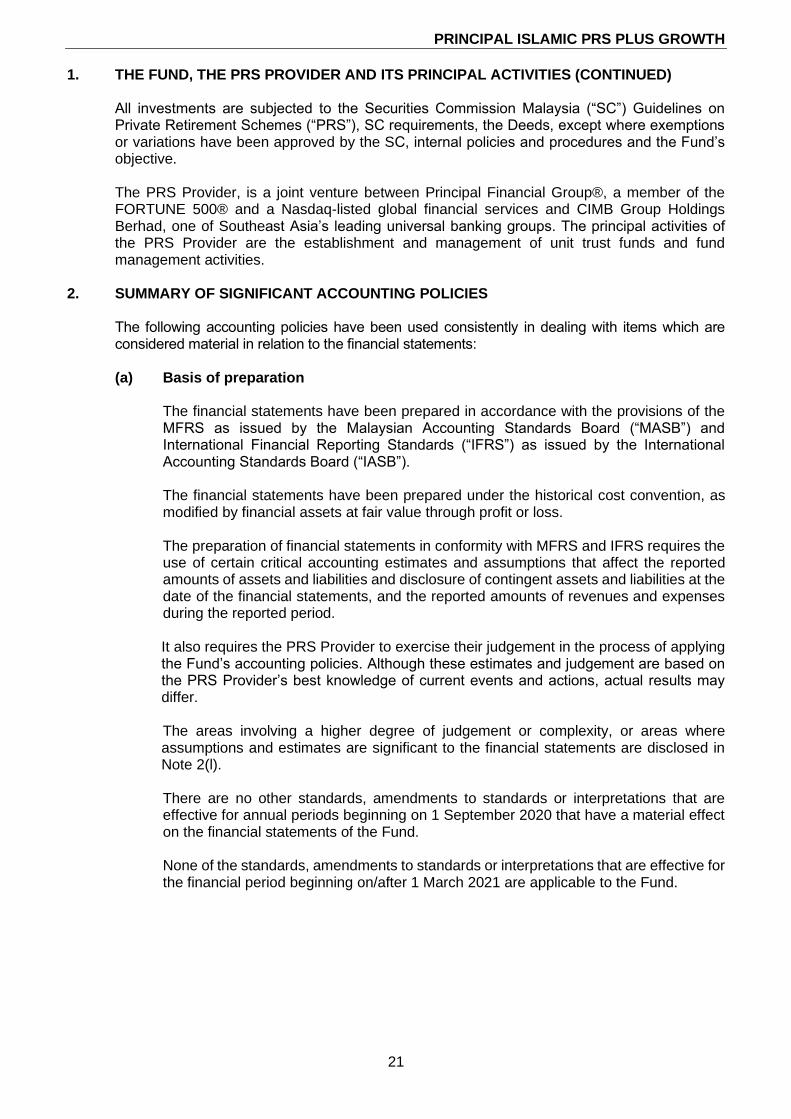
1. THE FUND, THE PRS PROVIDER AND ITS PRINCIPAL ACTIVITIES (CONTINUED) All investments are subjected to the Securities Commission Malaysia (“SC”) Guidelines on Private Retirement Schemes (“PRS”), SC requirements, the Deeds, except where exemptions or variations have been approved by the SC, internal policies and procedures and the Fund’s objective. The PRS Provider, is a joint venture between Principal Financial Group®, a member of the FORTUNE 500® and a Nasdaq-listed global financial services and CIMB Group Holdings Berhad, one of Southeast Asia’s leading universal banking groups. The principal activities of the PRS Provider are the establishment and management of unit trust funds and fund management activities.
2. SUMMARY OF SIGNIFICANT ACCOUNTING POLICIES
The following accounting policies have been used consistently in dealing with items which are considered material in relation to the financial statements: (a) Basis of preparation
The financial statements have been prepared in accordance with the provisions of the MFRS as issued by the Malaysian Accounting Standards Board (“MASB”) and International Financial Reporting Standards (“IFRS”) as issued by the International Accounting Standards Board (“IASB”).
The financial statements have been prepared under the historical cost convention, as modified by financial assets at fair value through profit or loss. The preparation of financial statements in conformity with MFRS and IFRS requires the use of certain critical accounting estimates and assumptions that affect the reported amounts of assets and liabilities and disclosure of contingent assets and liabilities at the date of the financial statements, and the reported amounts of revenues and expenses during the reported period. It also requires the PRS Provider to exercise their judgement in the process of applying the Fund’s accounting policies. Although these estimates and judgement are based on the PRS Provider’s best knowledge of current events and actions, actual results may differ. The areas involving a higher degree of judgement or complexity, or areas where assumptions and estimates are significant to the financial statements are disclosed in Note 2(l). There are no other standards, amendments to standards or interpretations that are effective for annual periods beginning on 1 September 2020 that have a material effect on the financial statements of the Fund. None of the standards, amendments to standards or interpretations that are effective for the financial period beginning on/after 1 March 2021 are applicable to the Fund.
PRINCIPAL ISLAMIC PRS PLUS GROWTH
22
2. SUMMARY OF SIGNIFICANT ACCOUNTING POLICIES (CONTINUED)
(b) Financial assets and financial liabilities Classification The Fund classifies its financial assets in the following measurement categories: • those to be measured subsequently at fair value through profit or loss, and • those to be measured at amortised cost.
The Fund classifies its investments based on both the Fund’s business model for managing those financial assets and the contractual cash flow characteristics of the financial assets. The portfolio of financial assets is managed and performance is evaluated on a fair value basis. The Fund is primarily focused on fair value information and uses that information to assess the assets’ performance and to make decisions. The Fund has not taken the option to irrevocably designate any equity securities as fair value through other comprehensive income (“OCI”). The contractual cash flows of the Fund’s debt securities are solely principal and interest1
(“SPPI”). However, these securities are neither held for the purpose of collecting contractual cash flows nor held both for collecting contractual cash flows and for sale. The collection of contractual cash flows is only incidental to achieving the Fund’s business model’s objective. Consequently, all investments are measured at fair value through profit or loss.
The Fund classifies cash and cash equivalents, amount due from stockbrokers, amount
due from the PRS Provider - creation of units and dividends receivable at amortised cost as these financial assets are held to collect contractual cash flows consisting of the amount outstanding. All of the Fund’s financial liabilities are measured at amortised cost.
Recognition and measurement Regular purchases and sales of financial assets are recognised on the trade-date, the date on which the Fund commits to purchase or sell the asset. Shariah-compliant investments are initially recognised at fair value. Transaction costs are expensed in the statement of comprehensive income. Financial instruments are recognised in the statement of financial position when, and only when, the Fund becomes a party to the contractual provisions of the financial instrument. Financial assets are derecognised when the rights to receive cash flows from the Shariah-compliant investments have expired or have been transferred and the Fund has transferred substantially all risks and rewards of ownership. Financial liabilities are derecognised when it is extinguished, i.e. when the obligation specified in the contract is discharged or cancelled or expired. Unrealised gains or losses arising from changes in the fair value of the financial assets at fair value through profit or loss are presented in the statement of comprehensive income within net gain or loss on financial assets at fair value through profit or loss in the financial period which they arise.
1 For the purposes of this Fund, interest refers to profits earned from Shariah-compliant investments.
PRINCIPAL ISLAMIC PRS PLUS GROWTH
23
2. SUMMARY OF SIGNIFICANT ACCOUNTING POLICIES (CONTINUED)
(b) Financial assets and financial liabilities (continued)
Recognition and measurement (continued) Dividend income from financial assets at fair value through profit or loss is recognised in the statement of comprehensive income as part of gross dividend income when the Fund’s right to receive payments is established. Shariah-compliant quoted securities in Malaysia are valued at the last traded market price quoted on Bursa Malaysia Securities Bhd (“Bursa Securities”) at the date of the statement of financial position. Foreign Shariah-compliant quoted securities are valued at the last traded market price quoted on the respective foreign stock exchanges at the close of the business day of the respective foreign stock exchanges. If a valuation based on the market price does not represent the fair value of the Shariah-compliant quoted securities, for example during abnormal market conditions or when no market price is available, including in the event of a suspension in the quotation of the Shariah-compliant quoted securities for a period exceeding 14 days, or such shorter period as agreed by the Trustee, then the Shariah-compliant quoted securities are valued as determined in good faith by the PRS Provider, based on the methods or basis approved by the Trustee after appropriate technical consultation. Unquoted Sukuk denominated in MYR are revalued on a daily basis based on fair value prices quoted by a Bond Pricing Agency (“BPA”) registered with the SC as per the SC Guidelines on PRS. Refer to Note 2(l) for further explanation. Shariah-compliant deposits with licensed Islamic financial institutions are stated at cost plus accrued profit calculated on the effective profit method over the period from the date of placement to the date of maturity of the respective deposits. Financial assets at amortised cost and other financial liabilities are subsequently carried at amortised cost using the effective profit method. Impairment for assets carried at amortised costs The Fund measures credit risk and expected credit losses (“ECL”) using probability of default, exposure at default and loss given default. The PRS Provider consider both historical analysis and forward looking information in determining any ECL. The PRS Provider consider the probability of default to be close to zero as these instruments have a low risk of default and the counterparties have a strong capacity to meet their contractual obligations in the near term. As a result, no loss allowance has been recognised based on 12 month ECL as any such impairment would be wholly insignificant to the Fund. Significant increase in credit risk A significant increase in credit risk is defined by the PRS Provider as any contractual payment which is more than 30 days past due.
PRINCIPAL ISLAMIC PRS PLUS GROWTH
24
2. SUMMARY OF SIGNIFICANT ACCOUNTING POLICIES (CONTINUED)
(b) Financial assets and financial liabilities (continued) Definition of default and credit-impaired financial assets Any contractual payment which is more than 90 days past due is considered credit impaired. Write-off The Fund writes off financial assets, in whole or in part, when it has exhausted all practical recovery efforts and has concluded there is no reasonable expectation of recovery. The assessment of no reasonable expectation of recovery is based on unavailability of debtor’s sources of income or assets to generate sufficient future cash flows to repay the amount. The Fund may write-off financial assets that are still subject to enforcement activity. Subsequent recoveries of amounts previously written off will result in impairment gains. There are no write-offs/recoveries during the financial period.
(c) Income recognition Dividend income is recognised on the ex-dividend date when the right to receive
payment is established. Profit income from Shariah-compliant deposits with licensed Islamic financial institutions
and unquoted Sukuk are recognised on a time proportionate basis using the effective profit method on an accrual basis. Profit income is calculated by applying the effective profit rate to the gross carrying amount of a financial asset except for financial assets that subsequently become credit-impaired. For credit-impaired financial assets the effective profit rate is applied to the net carrying amount of the financial asset (after deduction of the loss allowance). Realised gain or loss on disposal of Shariah-compliant quoted securities is accounted for as the difference between the net disposal proceeds and the carrying amount of Shariah-compliant quoted securities, determined on a weighted average cost basis.
Realised gain or loss on disposal of unquoted Sukuk is accounted for as the difference
between the net disposal proceeds and the carrying amount of unquoted Sukuk, determined on cost adjusted for accretion of discount or amortisation of premium.
PRINCIPAL ISLAMIC PRS PLUS GROWTH
25
2. SUMMARY OF SIGNIFICANT ACCOUNTING POLICIES (CONTINUED) (d) Foreign currency
Functional and presentation currency Items included in the financial statements of the Fund are measured using the currency
of the primary economic environment in which the Fund operates (the “functional currency”). The financial statements are presented in MYR, which is the Fund’s functional and presentation currency. Due to mixed factors in determining the functional currency of the Fund, the PRS Provider has used its judgement to determine the functional currency that most faithfully represents the economic effects of the underlying transactions, events and conditions and have determined the functional currency to be in MYR primarily due to the following factors:
i) The Fund’s units are denominated in MYR; ii) Significant portion of the Fund’s expenses are denominated in MYR; and iii) Significant portion of the Fund’s NAV is invested in investment denominated in
MYR.
Transactions and balances Foreign currency transactions are translated into the functional currency using the exchange rates prevailing at the dates of the transactions or valuation where items are remeasured. Foreign exchange gains and losses resulting from the settlement of such transactions and from the translation at financial year end exchange rates of monetary assets and liabilities denominated in foreign currencies are recognised in statement of comprehensive income.
(e) Members’ contributions
The members’ contributions to the Fund meet the definition of puttable instruments classified as financial liability under MFRS 132 “Financial Instruments: Presentation”. The Fund issues cancellable units, in three classes of units, known respectively as Class A, Class C and Class X, which are cancelled at the member’s option and do not have identical features subject to restrictions as stipulated in the Disclosure Document and SC Guidelines on PRS. The units are classified as financial liabilities. Cancellable units can be put back to the Fund at any time for cash equal to a proportionate share of the Fund’s NAV of respective classes. The outstanding units are carried at the redemption amount that is payable at the date of statement of financial position if the member exercises the right to put back the unit to the Fund. Units are created and cancelled at the member’s option at prices based on the Fund’s NAV per unit of respective classes at the close of business on the relevant dealing day. The Fund’s NAV per unit of respective classes is calculated by dividing the net assets attributable to members of respective classes with the total number of outstanding units of respective classes.
PRINCIPAL ISLAMIC PRS PLUS GROWTH
26
2. SUMMARY OF SIGNIFICANT ACCOUNTING POLICIES (CONTINUED)
(f) Distribution Distribution to members are recognised in the statement of comprehensive income as
finance costs, as the members' contribution are classified as financial liability as per Note 2(e). Distribution is reinvested into the PRS on the ex-date. Reinvestment of units is based on the NAV per unit on the ex-date, which is also the time of creation. Proposed distributions are recognised as a liability in the financial period in which it is approved by the Trustee.
(g) Transaction costs
Transaction costs are costs incurred to acquire or dispose financial assets or liabilities at fair value through profit or loss. They include fees and commissions paid to agents, advisors, brokers and dealers. Transaction costs, when incurred, are immediately recognised in the statement of comprehensive income as expenses.
(h) Cash and cash equivalents
For the purpose of statement of cash flows, cash and cash equivalents comprise bank balances and Shariah-compliant deposits held in highly liquid investments with original maturities of three months or less that are readily convertible to known amount of cash and which are subject to an insignificant risk of changes in value.
(i) Taxation
Current tax expense is determined according to Malaysian tax laws at the current rate based upon the taxable profit earned during the financial period.
Tax on investment income from foreign quoted securities is based on the tax regime of the respective countries that the Fund invests in.
(j) Amount due from/to stockbrokers
Amount due from and amount due to stockbrokers represent receivables for Shariah-compliant quoted securities and unquoted Sukuk sold and payables for Shariah-compliant quoted securities and unquoted Sukuk purchased that have been contracted for but not yet settled or delivered on the statement of financial position date respectively. These amounts are recognised initially at fair value and subsequently measured at amortised cost. At each reporting date, the Fund measures the loss allowance on amounts due from dealer at an amount equal to the lifetime ECL if the credit risk has increased significantly since initial recognition. If, at the reporting date, the credit risk has not increased significantly since initial recognition, the Fund shall measure the loss allowance at an amount equal to 12-month ECL. Significant financial difficulties of the broker, probability that the dealer will enter bankruptcy or financial reorganisation, and default in payments are all considered indicators that a loss allowance may be required. If the credit risk increases to the point that it is considered to be credit impaired, profit income will be calculated based on the gross carrying amount adjusted for the loss allowance. A significant increase in credit risk is defined by management as any contractual payment which is more than 30 days past due. Any contractual payment which is more than 90 days past due is considered credit impaired.
PRINCIPAL ISLAMIC PRS PLUS GROWTH
27
2. SUMMARY OF SIGNIFICANT ACCOUNTING POLICIES (CONTINUED (k) Realised and unrealised portions of profit or loss after taxation
The analysis of realised and unrealised portions of profit or loss after taxation as presented on the statement of comprehensive income is prepared in accordance with SC Guidelines on PRS.
(l) Critical accounting estimates and judgements in applying accounting policies The Fund makes estimates and assumptions concerning the future. The resulting accounting estimates will, by definition, rarely equal the related actual results. To enhance the information content of the estimates, certain key variables that are anticipated to have material impact to the Funds’ results and financial position are tested for sensitivity to changes in the underlying parameters.
Estimates and judgement are continually evaluated by the PRS Provider and are based on historical experience and other factors, including expectations of future events that are believed to be reasonable under the circumstances. Estimate of fair value of unquoted Sukuk In undertaking any of the Fund’s Shariah-compliant investments, the PRS Provider will ensure that all assets of the Fund under management will be valued appropriately, that is at fair value and in compliance with the SC Guidelines on PRS. Ringgit-denominated unquoted Sukuk are valued using fair value prices quoted by a BPA. Where the PRS Provider is of the view that the price quoted by BPA for a specific unquoted Sukuk differs from the market price by more than 20 bps, the PRS Provider may use market price, provided that the PRS Provider records its basis for using a non-BPA price, obtains necessary internal approvals to use the non-BPA price, and keeps an audit trail of all decisions and basis for adopting the use of non-BPA price.
PRINCIPAL ISLAMIC PRS PLUS GROWTH
28
3. RISK MANAGEMENT OBJECTIVES AND POLICIES
All liabilities are financial liabilities which are carried at amortised cost except net assets attributable to members which are carried at fair value through profit or loss. The investment objective of the Fund is to provide capital growth over the long-term by investing in a portfolio of primarily Shariah-compliant equities with some exposure in Sukuk. The Fund is exposed to a variety of risks which include market risk (inclusive of price risk, interest rate risk and currency risk), credit risk and liquidity risk. Financial risk management is carried out through internal control process adopted by the PRS Provider and adherence to the investment restrictions as stipulated in the Deeds and SC Guidelines on PRS. (a) Market risk
(i) Price risk This is the risk that the fair value of an investment in Shariah-compliant quoted securities and unquoted Sukuk will fluctuate because of changes in market prices. The value of investments in Shariah-compliant quoted securities and unquoted Sukuk may fluctuate according to the activities of individual companies, sector and overall political and economic conditions. Such fluctuation may cause the Fund’s NAV and prices of units to fall as well as rise, and income produced by the Fund may also fluctuate.
The price risk is managed through diversification and selection of Shariah-compliant quoted securities, unquoted Sukuk and other financial instruments within specified limits according to the Deeds.
(ii) Interest rate risk In general, when interest rates rise, unquoted Sukuk prices will tend to fall and vice versa. Therefore, the NAV of the Fund may also tend to fall when interest rates rise or are expected to rise. However, investors should be aware that should the Fund holds an unquoted Sukuk till maturity, such price fluctuations would dissipate as it approaches maturity, and thus the growth of the NAV shall not be affected at maturity. In order to mitigate interest rates exposure of the Fund, the PRS Provider will manage the duration of the portfolio via shorter or longer tenured assets depending on the view of the future interest rate trend of the PRS Provider, which is based on its continuous fundamental research and analysis. Although unquoted Sukuk is a non-interest bearing instrument, investors should note that the movement in prices of unquoted Sukuk are correlated to the movement in interest rates. As such, the investments in unquoted Sukuk are exposed to the movement of the interest rates. Even though the Fund does not invest in interest bearing instruments, the interest rate referred herein is to the general interest rate of the country, which may affect the value of the investment of the Fund. However, it does not in any way suggest that this Fund will invest in conventional financial instruments. All investments carried out for the Fund including placement and deposits are in accordance with Shariah.
PRINCIPAL ISLAMIC PRS PLUS GROWTH
29
3. RISK MANAGEMENT OBJECTIVES AND POLICIES (CONTINUED) (a) Market risk (continued)
(ii) Interest rate risk (continued)
This risk is crucial since unquoted Sukuk portfolio management depends on forecasting interest rate movements. Prices of unquoted Sukuk move inversely to interest rate movements, therefore as interest rates rise, the prices of unquoted Sukuk decrease and vice versa. Furthermore, unquoted Sukuk with longer maturity and lower yield interest rates are more susceptible to interest rate movements.
Such Shariah-compliant investments may be subject to unanticipated rise in interest rates which may impair the ability of the issuers to meet the obligation under the instrument, especially if the issuers are highly leveraged. An increase in interest rates may therefore increase the potential for default by an issuer.
(iii) Currency risk Currency risk of the Fund is associated with Shariah-compliant investments that are quoted and/or priced in foreign currency denomination. Foreign currency risk is the risk that the value of financial instruments will fluctuate due to changes in foreign exchange rates. The PRS Provider will evaluate the likely directions of a foreign currency versus MYR based on considerations of economic fundamentals such as profit rate differentials, balance of payments position, debt levels, and technical chart considerations.
(b) Credit risk
Credit risk refers to the risk that a counter party will default on its contractual obligation resulting in financial loss to the Fund. Investment in unquoted Sukuk may involve a certain degree of credit/default risk with regards to the issuers. Generally, credit risk or default risk is the risk of loss due to the issuer’s non-payment or untimely payment of the investment amount as well as the returns on investment. This will cause a decline in value of the defaulted unquoted Sukuk and subsequently depress the NAV of the Fund. Usually credit risk is more apparent for an investment with a longer tenure, i.e. the longer the duration, the higher the credit risk. Credit risk can be managed by performing continuous fundamental credit research and analysis to ascertain the creditworthiness of its issuer. In addition, the PRS Provider imposes a minimum rating requirement as rated by either local and/or foreign rating agencies and manages the duration of the investment in accordance with the objective of the Fund. For this Fund, the unquoted Sukuk investments must satisfy a minimum credit rating of “BBB3” or “P2” by RAM or equivalent rating by MARC or “BBB” or “A-2” by S&P or equivalent rating by any other international rating agencies. The credit risk arising from bank balances and placements of Shariah-compliant deposits in licensed Islamic financial institutions is managed by ensuring that the Fund will only place Shariah-compliant deposits in reputable licensed Islamic financial institutions. For amount due from the PRS Provider, the settlement terms of the proceeds from the creation of units receivable from the PRS Provider are governed by the SC Guidelines on PRS.

PRINCIPAL ISLAMIC PRS PLUS GROWTH
30
3. RISK MANAGEMENT OBJECTIVES AND POLICIES (CONTINUED)
(c) Liquidity risk Liquidity risk is the risk that the Fund will encounter difficulty in meeting its financial obligations. The PRS Provider manages this risk by maintaining sufficient level of liquid assets to meet anticipated payments and cancellations of the units by members. Liquid assets comprise bank balances and Shariah-compliant deposits with licensed Islamic financial institutions, which are capable of being converted into cash within 7 business days. Generally, all Shariah-compliant investments are subject to a certain degree of liquidity risk depending on the nature of the investment instruments, market, sector and other factors. For the purpose of the Fund, the PRS Provider will attempt to balance the entire portfolio by investing in a mix of assets with satisfactory trading volume and those that occasionally could encounter poor liquidity. This is expected to reduce the risks for the entire portfolio without limiting the Fund’s growth potentials.
(d) Capital risk management
The capital of the Fund is represented by equity consisting of net assets attributable to members. The amount of capital can change significantly on a daily basis as the Fund is subjected to daily subscriptions and redemptions at the discretion of members. The Fund’s objective when managing capital is to safeguard the Fund’s ability to continue as a going concern in order to provide returns to members and benefits for other stakeholders and to maintain a strong capital base to support the development of the investment activities of the Fund.
(e) Fair value estimation Fair value is defined as the price that would be received to sell an asset or paid to transfer a liability in an orderly transaction between market participants at the measurement date (i.e. an exit price). The fair values of financial assets traded in active markets (such as trading securities) are based on quoted market prices at the close of trading on the financial period end date. The Fund utilises the last traded market price for financial assets where the last traded price falls within the bid-ask spread. In circumstances where the last traded price is not within the bid-ask spread, the PRS Provider will determine the point within the bid-ask spread that is most representative of the fair value. An active market is a market in which transactions for the asset or liability take place with sufficient frequency and volume to provide pricing information on an on-going basis. The fair value of financial assets that are not traded in an active market is determined by using valuation techniques.
PRINCIPAL ISLAMIC PRS PLUS GROWTH
31
3. RISK MANAGEMENT OBJECTIVES AND POLICIES (CONTINUED)
(e) Fair value estimation (continued)
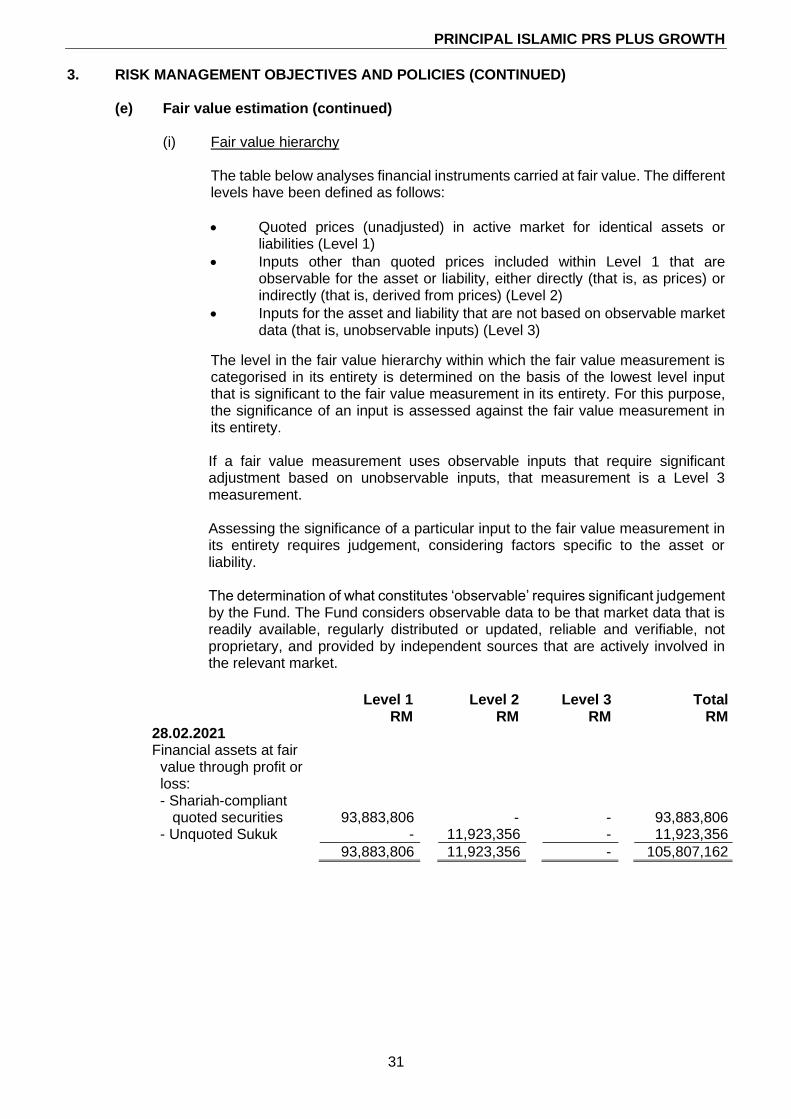
(i) Fair value hierarchy
The table below analyses financial instruments carried at fair value. The different levels have been defined as follows:
• Quoted prices (unadjusted) in active market for identical assets or liabilities (Level 1)
• Inputs other than quoted prices included within Level 1 that are observable for the asset or liability, either directly (that is, as prices) or indirectly (that is, derived from prices) (Level 2)
• Inputs for the asset and liability that are not based on observable market data (that is, unobservable inputs) (Level 3)
The level in the fair value hierarchy within which the fair value measurement is categorised in its entirety is determined on the basis of the lowest level input that is significant to the fair value measurement in its entirety. For this purpose, the significance of an input is assessed against the fair value measurement in its entirety.
If a fair value measurement uses observable inputs that require significant adjustment based on unobservable inputs, that measurement is a Level 3 measurement. Assessing the significance of a particular input to the fair value measurement in its entirety requires judgement, considering factors specific to the asset or liability. The determination of what constitutes ‘observable’ requires significant judgement by the Fund. The Fund considers observable data to be that market data that is readily available, regularly distributed or updated, reliable and verifiable, not proprietary, and provided by independent sources that are actively involved in the relevant market.
Level 1 Level 2 Level 3 Total RM RM RM RM 28.02.2021 Financial assets at fair value through profit or loss: - Shariah-compliant quoted securities 93,883,806 - - 93,883,806 - Unquoted Sukuk - 11,923,356 - 11,923,356
93,883,806 11,923,356 - 105,807,162
PRINCIPAL ISLAMIC PRS PLUS GROWTH
32
3. RISK MANAGEMENT OBJECTIVES AND POLICIES (CONTINUED)
(e) Fair value estimation (continued)
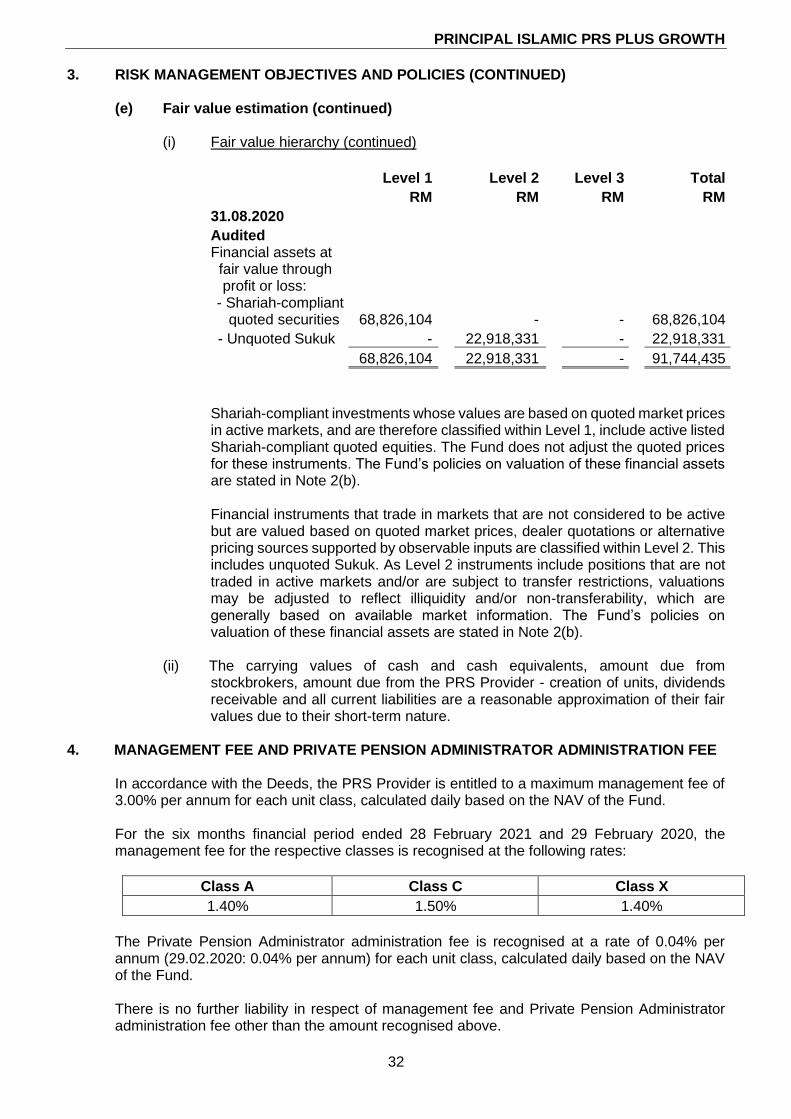
(i) Fair value hierarchy (continued)
Level 1 Level 2 Level 3 Total
RM RM RM RM
31.08.2020
Audited Financial assets at fair value through
profit or loss: - Shariah-compliant
quoted securities 68,826,104 - - 68,826,104
- Unquoted Sukuk - 22,918,331 - 22,918,331
68,826,104 22,918,331 - 91,744,435
Shariah-compliant investments whose values are based on quoted market prices in active markets, and are therefore classified within Level 1, include active listed Shariah-compliant quoted equities. The Fund does not adjust the quoted prices for these instruments. The Fund’s policies on valuation of these financial assets are stated in Note 2(b). Financial instruments that trade in markets that are not considered to be active but are valued based on quoted market prices, dealer quotations or alternative pricing sources supported by observable inputs are classified within Level 2. This includes unquoted Sukuk. As Level 2 instruments include positions that are not traded in active markets and/or are subject to transfer restrictions, valuations may be adjusted to reflect illiquidity and/or non-transferability, which are generally based on available market information. The Fund’s policies on valuation of these financial assets are stated in Note 2(b).
(ii) The carrying values of cash and cash equivalents, amount due from
stockbrokers, amount due from the PRS Provider - creation of units, dividends receivable and all current liabilities are a reasonable approximation of their fair values due to their short-term nature.
4. MANAGEMENT FEE AND PRIVATE PENSION ADMINISTRATOR ADMINISTRATION FEE
In accordance with the Deeds, the PRS Provider is entitled to a maximum management fee of
3.00% per annum for each unit class, calculated daily based on the NAV of the Fund. For the six months financial period ended 28 February 2021 and 29 February 2020, the
management fee for the respective classes is recognised at the following rates:
Class A Class C Class X
1.40% 1.50% 1.40%
The Private Pension Administrator administration fee is recognised at a rate of 0.04% per
annum (29.02.2020: 0.04% per annum) for each unit class, calculated daily based on the NAV of the Fund.
There is no further liability in respect of management fee and Private Pension Administrator
administration fee other than the amount recognised above.
PRINCIPAL ISLAMIC PRS PLUS GROWTH
33
5. TRUSTEE FEE In accordance with the Deeds, the Trustee is entitled to a maximum fee of 0.04% per annum for each unit class, calculated daily based on the NAV of the Fund. The Trustee fee includes local custodian fees and charges but excludes foreign sub-custodian fees and charges. For the six months financial period ended 28 February 2021, the Trustee fee was recognised at a rate of 0.04% per annum (29.02.2020: 0.04% per annum) for each unit class. There was no further liability to the Trustee in respect of Trustee fee other than the amount recognised above.
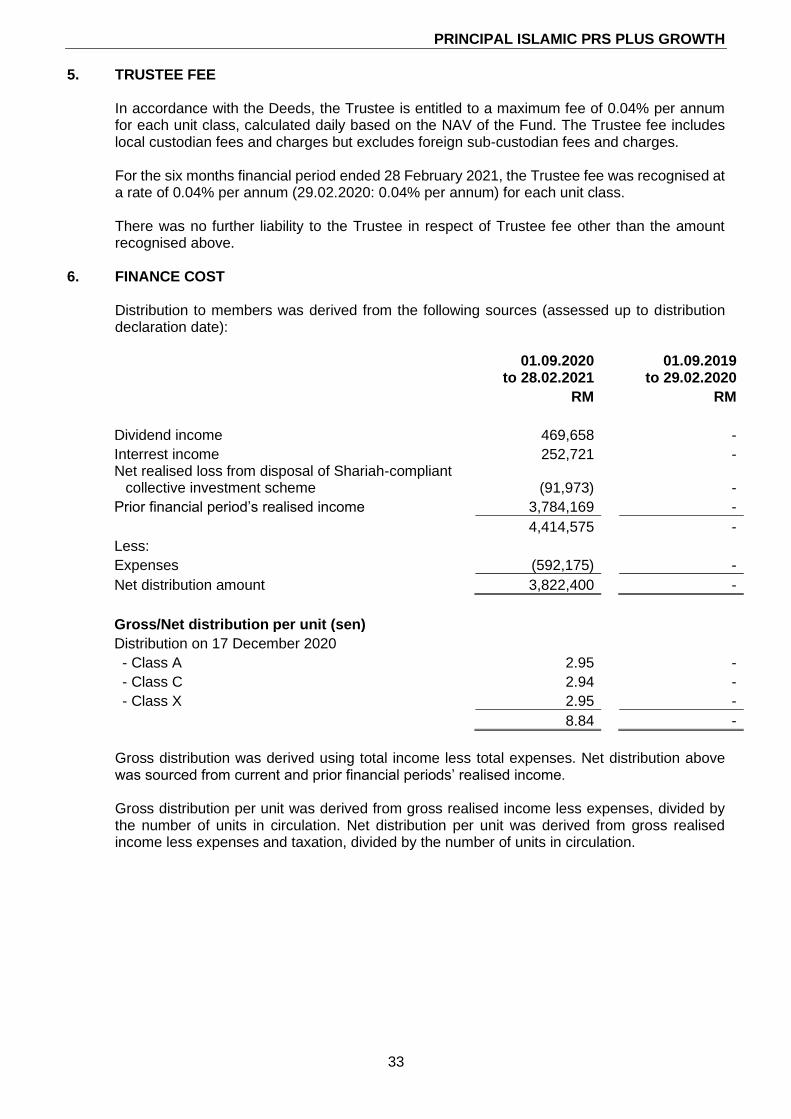
6. FINANCE COST Distribution to members was derived from the following sources (assessed up to distribution declaration date):
01.09.2020
to 28.02.2021 01.09.2019
to 29.02.2020
RM RM
Dividend income 469,658 -
Interrest income 252,721 - Net realised loss from disposal of Shariah-compliant
collective investment scheme (91,973) -
Prior financial period’s realised income 3,784,169 -
4,414,575 -
Less:
Expenses (592,175) -
Net distribution amount 3,822,400 -
Gross/Net distribution per unit (sen)
Distribution on 17 December 2020
- Class A 2.95 -
- Class C 2.94 -
- Class X 2.95 -
8.84 -
Gross distribution was derived using total income less total expenses. Net distribution above was sourced from current and prior financial periods’ realised income. Gross distribution per unit was derived from gross realised income less expenses, divided by the number of units in circulation. Net distribution per unit was derived from gross realised income less expenses and taxation, divided by the number of units in circulation.
PRINCIPAL ISLAMIC PRS PLUS GROWTH
34
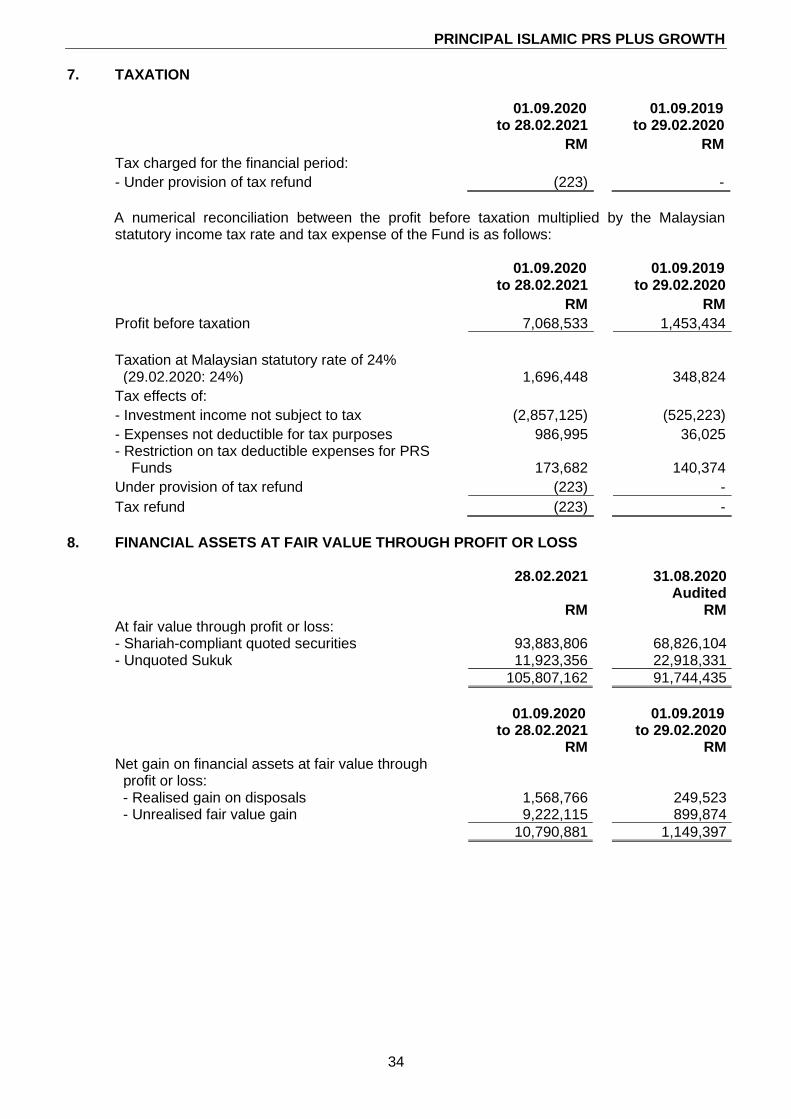
7. TAXATION
01.09.2020
to 28.02.2021 01.09.2019
to 29.02.2020
RM RM
Tax charged for the financial period:
- Under provision of tax refund (223) -
A numerical reconciliation between the profit before taxation multiplied by the Malaysian statutory income tax rate and tax expense of the Fund is as follows:
01.09.2020 to 28.02.2021
01.09.2019 to 29.02.2020
RM RM
Profit before taxation 7,068,533 1,453,434
Taxation at Malaysian statutory rate of 24% (29.02.2020: 24%) 1,696,448 348,824
Tax effects of:
- Investment income not subject to tax (2,857,125) (525,223)
- Expenses not deductible for tax purposes 986,995 36,025 - Restriction on tax deductible expenses for PRS Funds 173,682 140,374
Under provision of tax refund (223) -
Tax refund (223) -
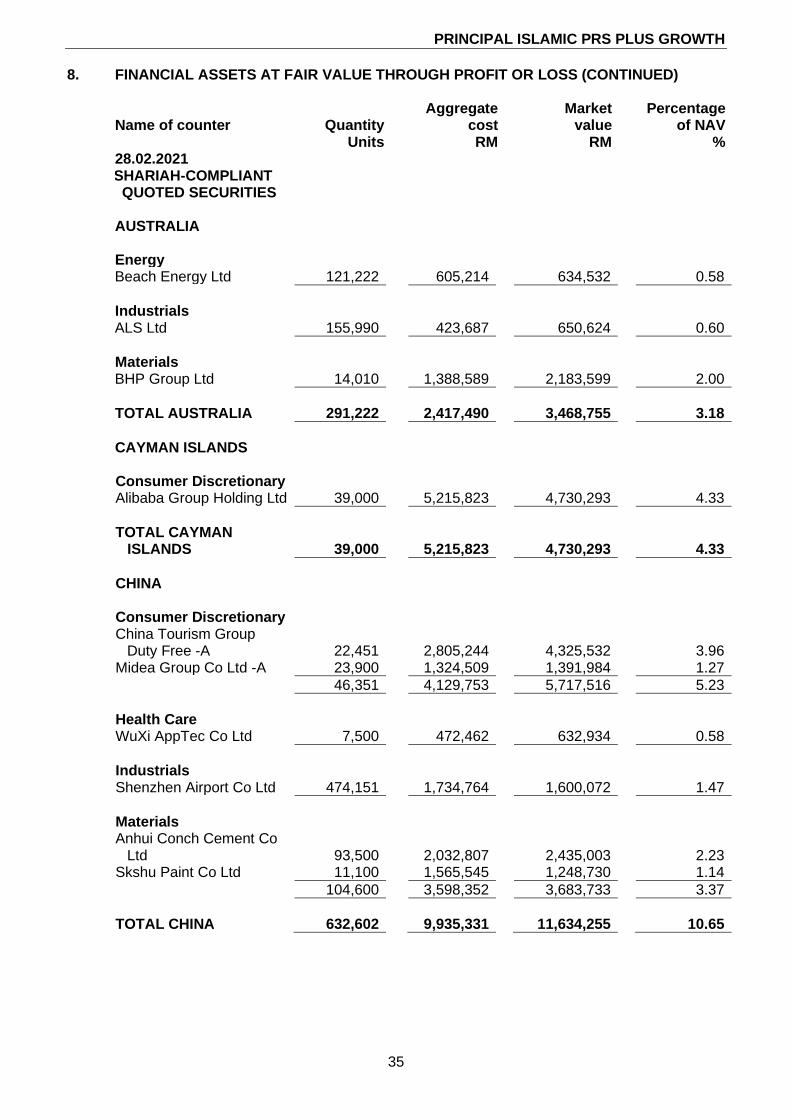
8. FINANCIAL ASSETS AT FAIR VALUE THROUGH PROFIT OR LOSS
28.02.2021 31.08.2020 Audited
RM RM At fair value through profit or loss: - Shariah-compliant quoted securities 93,883,806 68,826,104 - Unquoted Sukuk 11,923,356 22,918,331
105,807,162 91,744,435
01.09.2020
to 28.02.2021 01.09.2019
to 29.02.2020 RM RM Net gain on financial assets at fair value through profit or loss: - Realised gain on disposals 1,568,766 249,523 - Unrealised fair value gain 9,222,115 899,874
10,790,881 1,149,397
PRINCIPAL ISLAMIC PRS PLUS GROWTH
35
8. FINANCIAL ASSETS AT FAIR VALUE THROUGH PROFIT OR LOSS (CONTINUED)
Name of counter Quantity Aggregate
cost Market
value Percentage
of NAV
Units RM RM % 28.02.2021 SHARIAH-COMPLIANT QUOTED SECURITIES
AUSTRALIA Energy Beach Energy Ltd 121,222 605,214 634,532 0.58
Industrials ALS Ltd 155,990 423,687 650,624 0.60
Materials BHP Group Ltd 14,010 1,388,589 2,183,599 2.00
TOTAL AUSTRALIA 291,222 2,417,490 3,468,755 3.18
CAYMAN ISLANDS Consumer Discretionary Alibaba Group Holding Ltd 39,000 5,215,823 4,730,293 4.33
TOTAL CAYMAN
ISLANDS 39,000
5,215,823
4,730,293
4.33
CHINA Consumer Discretionary China Tourism Group
Duty Free -A 22,451
2,805,244
4,325,532
3.96 Midea Group Co Ltd -A 23,900 1,324,509 1,391,984 1.27
46,351 4,129,753 5,717,516 5.23
Health Care WuXi AppTec Co Ltd 7,500 472,462 632,934 0.58
Industrials Shenzhen Airport Co Ltd 474,151 1,734,764 1,600,072 1.47
Materials Anhui Conch Cement Co
Ltd 93,500
2,032,807
2,435,003
2.23 Skshu Paint Co Ltd 11,100 1,565,545 1,248,730 1.14
104,600 3,598,352 3,683,733 3.37
TOTAL CHINA 632,602 9,935,331 11,634,255 10.65
PRINCIPAL ISLAMIC PRS PLUS GROWTH
36
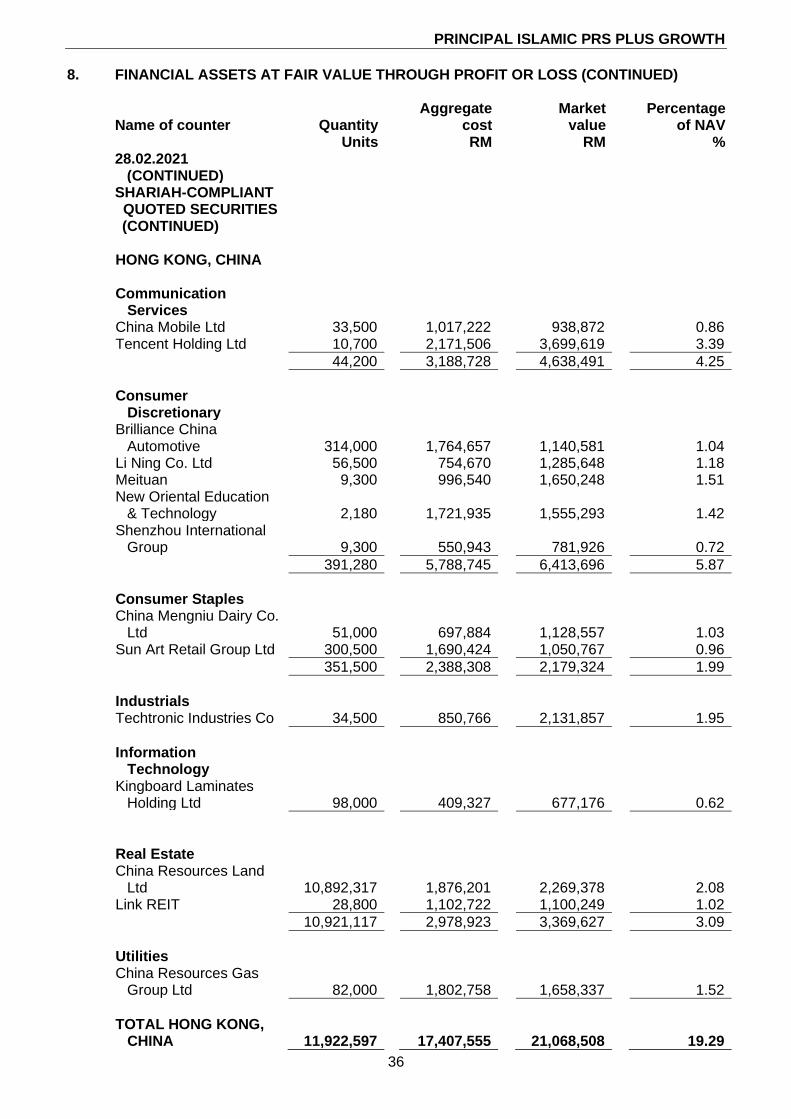
8. FINANCIAL ASSETS AT FAIR VALUE THROUGH PROFIT OR LOSS (CONTINUED)
Name of counter Quantity Aggregate
cost Market
value Percentage
of NAV
Units RM RM % 28.02.2021
(CONTINUED) SHARIAH-COMPLIANT QUOTED SECURITIES (CONTINUED)
HONG KONG, CHINA Communication
Services
China Mobile Ltd 33,500 1,017,222 938,872 0.86 Tencent Holding Ltd 10,700 2,171,506 3,699,619 3.39
44,200 3,188,728 4,638,491 4.25
Consumer
Discretionary
Brilliance China
Automotive 314,000
1,764,657
1,140,581
1.04 Li Ning Co. Ltd 56,500 754,670 1,285,648 1.18 Meituan 9,300 996,540 1,650,248 1.51 New Oriental Education
& Technology 2,180
1,721,935
1,555,293
1.42 Shenzhou International
Group 9,300
550,943
781,926
0.72
391,280 5,788,745 6,413,696 5.87
Consumer Staples China Mengniu Dairy Co.
Ltd 51,000
697,884
1,128,557
1.03 Sun Art Retail Group Ltd 300,500 1,690,424 1,050,767 0.96
351,500 2,388,308 2,179,324 1.99
Industrials Techtronic Industries Co 34,500 850,766 2,131,857 1.95
Information
Technology
Kingboard Laminates
Holding Ltd 98,000
409,327
677,176
0.62
Real Estate China Resources Land
Ltd 10,892,317
1,876,201
2,269,378
2.08 Link REIT 28,800 1,102,722 1,100,249 1.02
10,921,117 2,978,923 3,369,627 3.09
Utilities China Resources Gas
Group Ltd 82,000
1,802,758
1,658,337
1.52
TOTAL HONG KONG,
CHINA 11,922,597
17,407,555
21,068,508
19.29
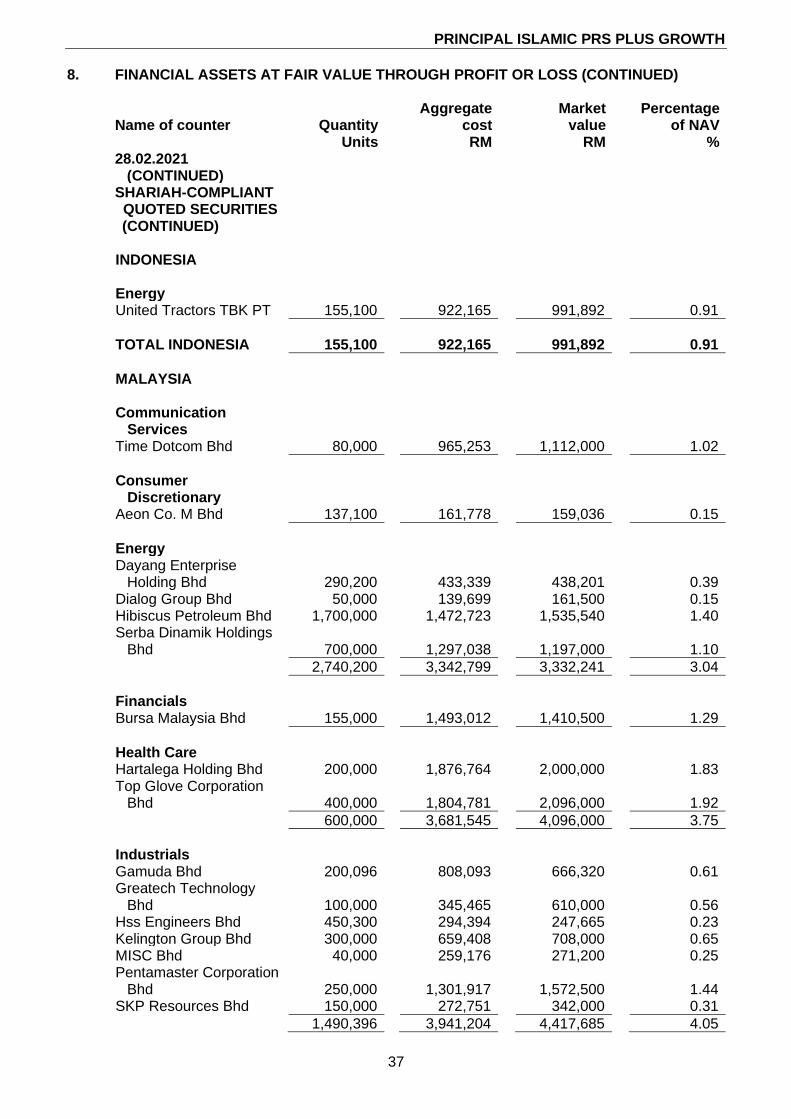
PRINCIPAL ISLAMIC PRS PLUS GROWTH
37
8. FINANCIAL ASSETS AT FAIR VALUE THROUGH PROFIT OR LOSS (CONTINUED)
Name of counter Quantity Aggregate
cost Market
value Percentage
of NAV
Units RM RM % 28.02.2021
(CONTINUED) SHARIAH-COMPLIANT QUOTED SECURITIES (CONTINUED)
INDONESIA Energy United Tractors TBK PT 155,100 922,165 991,892 0.91
TOTAL INDONESIA 155,100 922,165 991,892 0.91
MALAYSIA Communication
Services
Time Dotcom Bhd 80,000 965,253 1,112,000 1.02
Consumer
Discretionary
Aeon Co. M Bhd 137,100 161,778 159,036 0.15
Energy Dayang Enterprise
Holding Bhd 290,200
433,339
438,201
0.39 Dialog Group Bhd 50,000 139,699 161,500 0.15 Hibiscus Petroleum Bhd 1,700,000 1,472,723 1,535,540 1.40 Serba Dinamik Holdings
Bhd 700,000
1,297,038
1,197,000
1.10
2,740,200 3,342,799 3,332,241 3.04
Financials Bursa Malaysia Bhd 155,000 1,493,012 1,410,500 1.29
Health Care Hartalega Holding Bhd 200,000 1,876,764 2,000,000 1.83 Top Glove Corporation
Bhd 400,000
1,804,781
2,096,000
1.92
600,000 3,681,545 4,096,000 3.75
Industrials Gamuda Bhd 200,096 808,093 666,320 0.61 Greatech Technology
Bhd 100,000
345,465
610,000
0.56 Hss Engineers Bhd 450,300 294,394 247,665 0.23 Kelington Group Bhd 300,000 659,408 708,000 0.65 MISC Bhd 40,000 259,176 271,200 0.25 Pentamaster Corporation
Bhd 250,000
1,301,917
1,572,500
1.44 SKP Resources Bhd 150,000 272,751 342,000 0.31
1,490,396 3,941,204 4,417,685 4.05
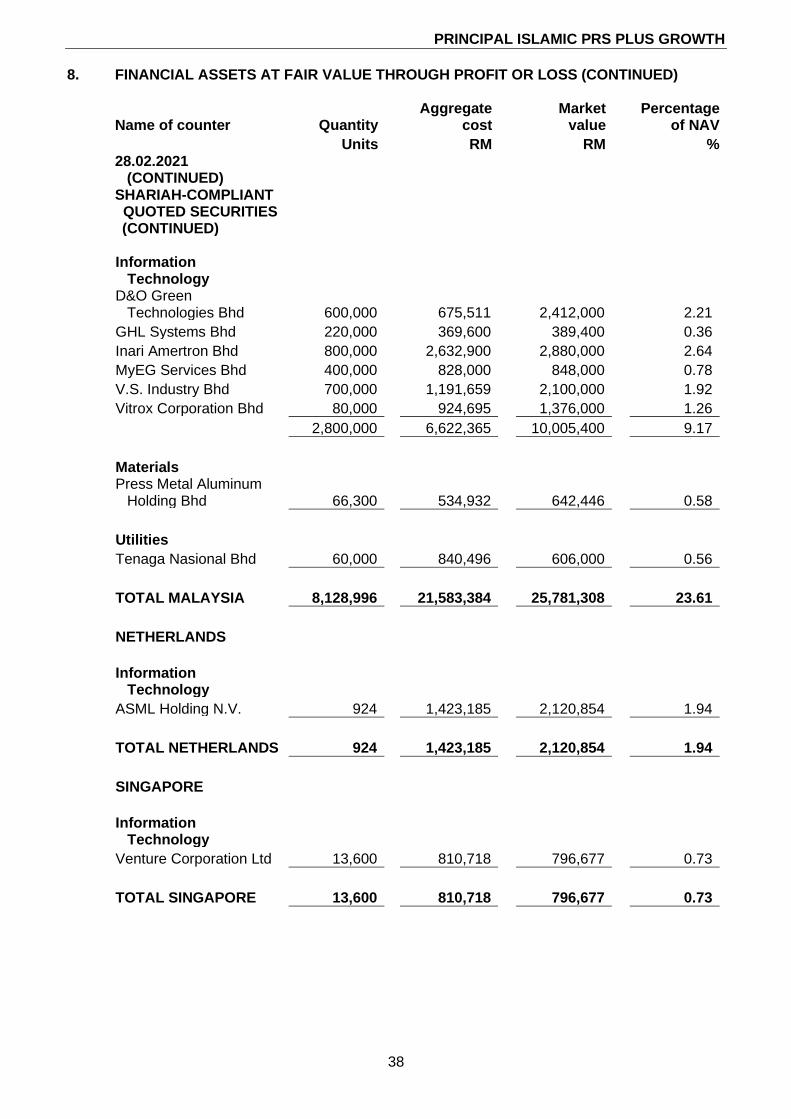
PRINCIPAL ISLAMIC PRS PLUS GROWTH
38
8. FINANCIAL ASSETS AT FAIR VALUE THROUGH PROFIT OR LOSS (CONTINUED)
Name of counter Quantity Aggregate
cost Market
value Percentage
of NAV
Units RM RM % 28.02.2021
(CONTINUED) SHARIAH-COMPLIANT QUOTED SECURITIES (CONTINUED)
Information
Technology
D&O Green
Technologies Bhd 600,000
675,511
2,412,000
2.21
GHL Systems Bhd 220,000 369,600 389,400 0.36
Inari Amertron Bhd 800,000 2,632,900 2,880,000 2.64
MyEG Services Bhd 400,000 828,000 848,000 0.78
V.S. Industry Bhd 700,000 1,191,659 2,100,000 1.92
Vitrox Corporation Bhd 80,000 924,695 1,376,000 1.26
2,800,000 6,622,365 10,005,400 9.17
Materials Press Metal Aluminum
Holding Bhd 66,300
534,932
642,446
0.58
Utilities
Tenaga Nasional Bhd 60,000 840,496 606,000 0.56
TOTAL MALAYSIA 8,128,996 21,583,384 25,781,308 23.61
NETHERLANDS
Information
Technology
ASML Holding N.V. 924 1,423,185 2,120,854 1.94
TOTAL NETHERLANDS 924 1,423,185 2,120,854 1.94
SINGAPORE
Information
Technology
Venture Corporation Ltd 13,600 810,718 796,677 0.73
TOTAL SINGAPORE 13,600 810,718 796,677 0.73
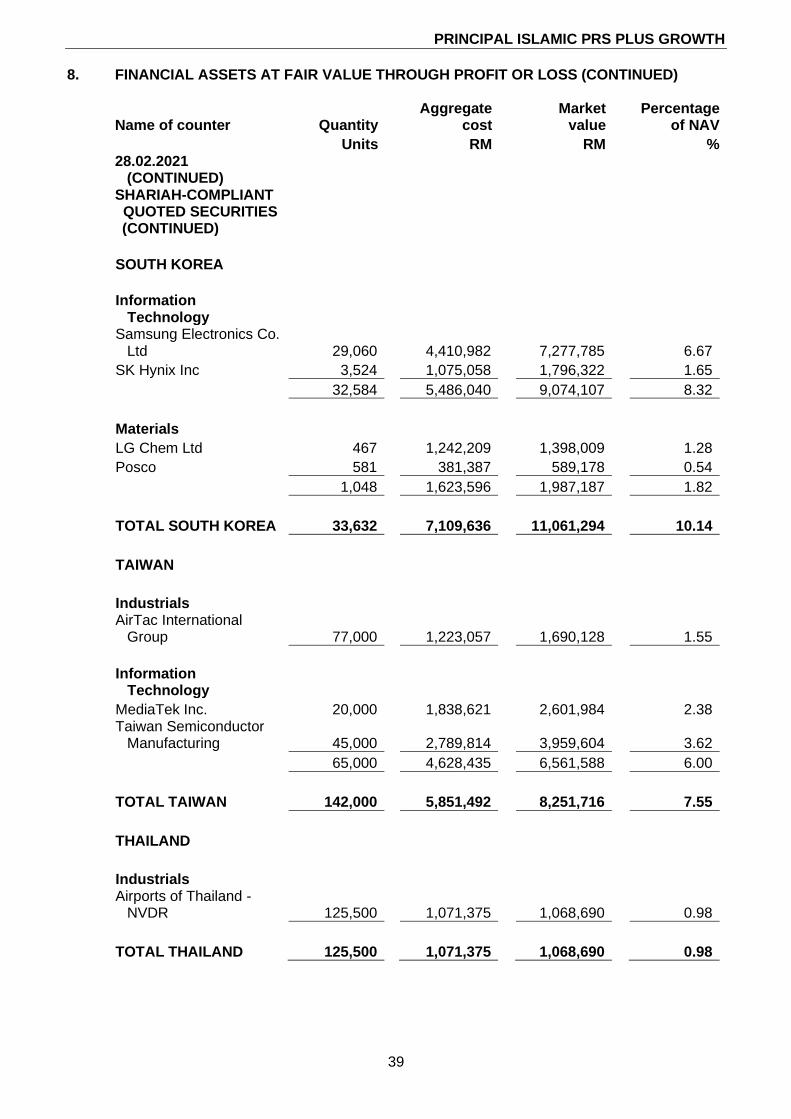
PRINCIPAL ISLAMIC PRS PLUS GROWTH
39
8. FINANCIAL ASSETS AT FAIR VALUE THROUGH PROFIT OR LOSS (CONTINUED)
Name of counter Quantity Aggregate
cost Market
value Percentage
of NAV
Units RM RM % 28.02.2021
(CONTINUED) SHARIAH-COMPLIANT QUOTED SECURITIES (CONTINUED)
SOUTH KOREA
Information
Technology
Samsung Electronics Co.
Ltd 29,060
4,410,982
7,277,785
6.67
SK Hynix Inc 3,524 1,075,058 1,796,322 1.65
32,584 5,486,040 9,074,107 8.32
Materials
LG Chem Ltd 467 1,242,209 1,398,009 1.28
Posco 581 381,387 589,178 0.54
1,048 1,623,596 1,987,187 1.82
TOTAL SOUTH KOREA 33,632 7,109,636 11,061,294 10.14
TAIWAN
Industrials AirTac International
Group 77,000
1,223,057
1,690,128
1.55
Information
Technology
MediaTek Inc. 20,000 1,838,621 2,601,984 2.38 Taiwan Semiconductor
Manufacturing 45,000
2,789,814
3,959,604
3.62
65,000 4,628,435 6,561,588 6.00
TOTAL TAIWAN 142,000 5,851,492 8,251,716 7.55
THAILAND
Industrials Airports of Thailand -
NVDR 125,500
1,071,375
1,068,690
0.98
TOTAL THAILAND 125,500 1,071,375 1,068,690 0.98
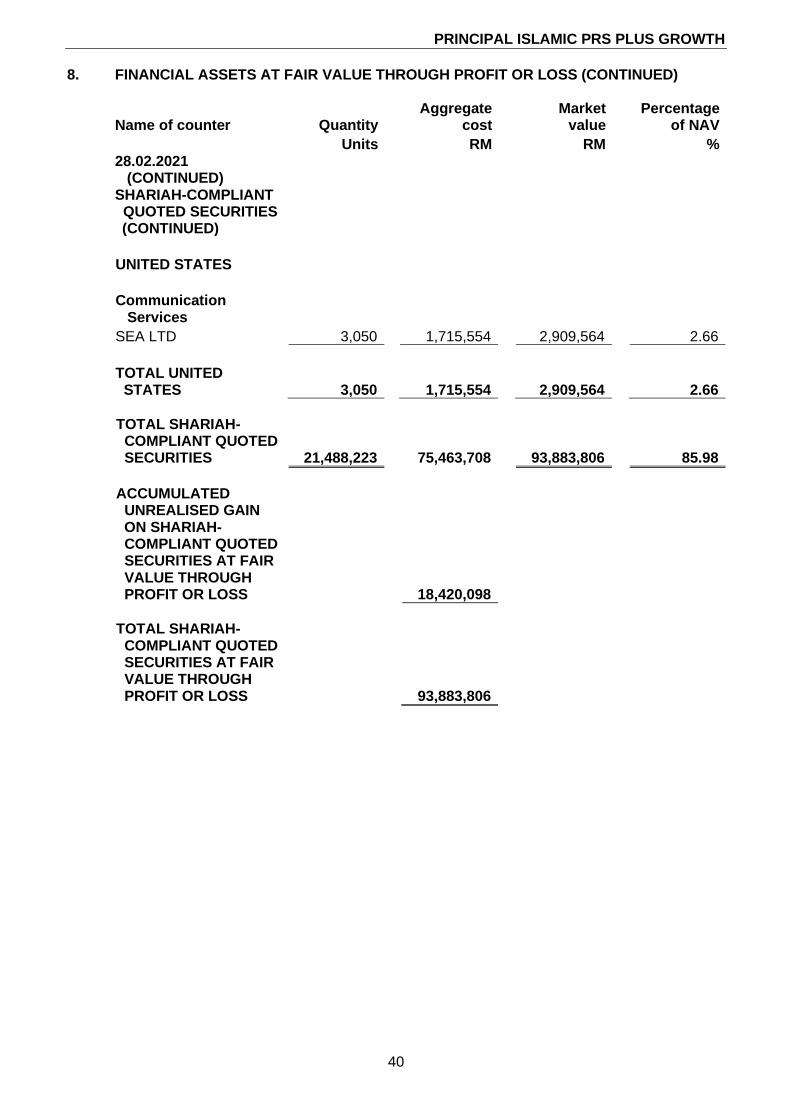
PRINCIPAL ISLAMIC PRS PLUS GROWTH
40
8. FINANCIAL ASSETS AT FAIR VALUE THROUGH PROFIT OR LOSS (CONTINUED)
Name of counter Quantity Aggregate
cost Market
value Percentage
of NAV
Units RM RM % 28.02.2021
(CONTINUED) SHARIAH-COMPLIANT QUOTED SECURITIES (CONTINUED)
UNITED STATES
Communication
Services
SEA LTD 3,050 1,715,554 2,909,564 2.66
TOTAL UNITED STATES 3,050
1,715,554
2,909,564
2.66
TOTAL SHARIAH- COMPLIANT QUOTED SECURITIES 21,488,223 75,463,708 93,883,806 85.98
ACCUMULATED UNREALISED GAIN ON SHARIAH- COMPLIANT QUOTED SECURITIES AT FAIR VALUE THROUGH PROFIT OR LOSS 18,420,098
TOTAL SHARIAH- COMPLIANT QUOTED SECURITIES AT FAIR VALUE THROUGH PROFIT OR LOSS
93,883,806
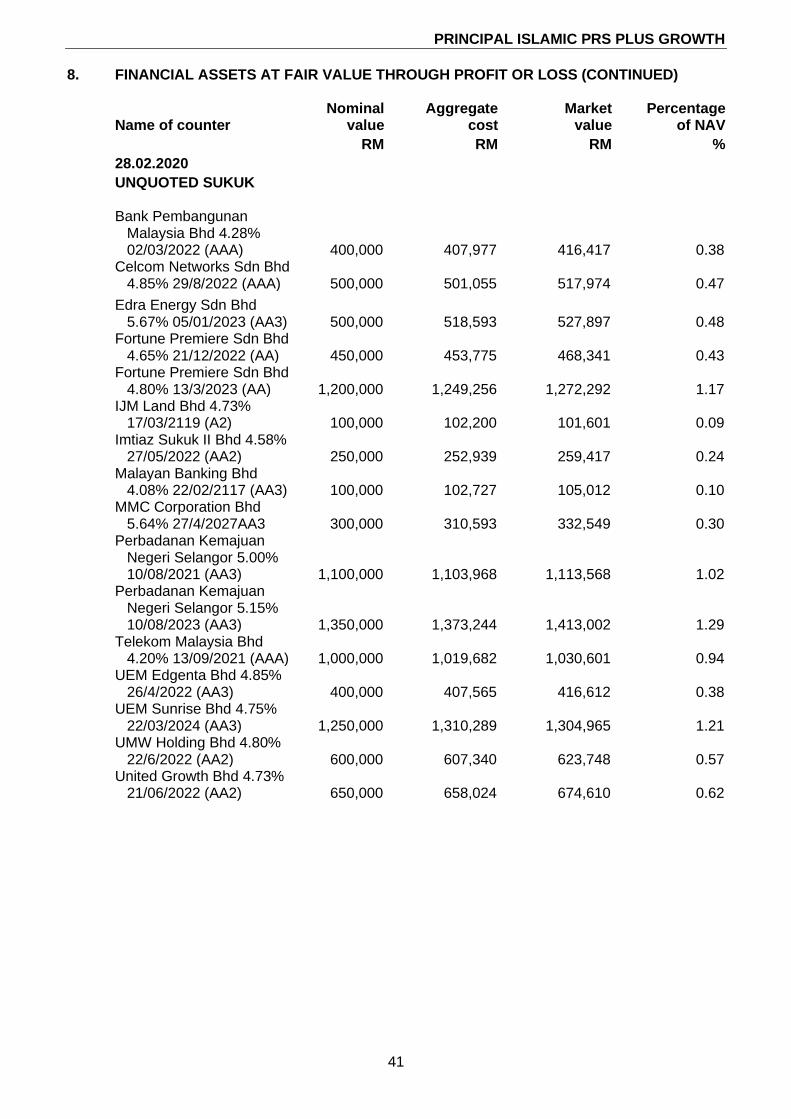
PRINCIPAL ISLAMIC PRS PLUS GROWTH
41
8. FINANCIAL ASSETS AT FAIR VALUE THROUGH PROFIT OR LOSS (CONTINUED)
Name of counter Nominal
value Aggregate
cost Market
value Percentage
of NAV
RM RM RM %
28.02.2020
UNQUOTED SUKUK
Bank Pembangunan Malaysia Bhd 4.28% 02/03/2022 (AAA)
400,000
407,977
416,417 0.38
Celcom Networks Sdn Bhd 4.85% 29/8/2022 (AAA)
500,000
501,055
517,974 0.47
Edra Energy Sdn Bhd 5.67% 05/01/2023 (AA3)
500,000
518,593
527,897 0.48
Fortune Premiere Sdn Bhd 4.65% 21/12/2022 (AA)
450,000
453,775
468,341 0.43
Fortune Premiere Sdn Bhd 4.80% 13/3/2023 (AA)
1,200,000
1,249,256
1,272,292 1.17
IJM Land Bhd 4.73% 17/03/2119 (A2)
100,000
102,200
101,601 0.09
Imtiaz Sukuk II Bhd 4.58% 27/05/2022 (AA2)
250,000
252,939
259,417 0.24
Malayan Banking Bhd 4.08% 22/02/2117 (AA3)
100,000
102,727
105,012 0.10
MMC Corporation Bhd 5.64% 27/4/2027AA3
300,000
310,593
332,549 0.30
Perbadanan Kemajuan Negeri Selangor 5.00% 10/08/2021 (AA3)
1,100,000
1,103,968
1,113,568 1.02
Perbadanan Kemajuan Negeri Selangor 5.15% 10/08/2023 (AA3)
1,350,000
1,373,244
1,413,002 1.29
Telekom Malaysia Bhd 4.20% 13/09/2021 (AAA)
1,000,000
1,019,682
1,030,601 0.94
UEM Edgenta Bhd 4.85% 26/4/2022 (AA3)
400,000
407,565
416,612 0.38
UEM Sunrise Bhd 4.75% 22/03/2024 (AA3)
1,250,000
1,310,289
1,304,965 1.21
UMW Holding Bhd 4.80% 22/6/2022 (AA2)
600,000
607,340
623,748 0.57
United Growth Bhd 4.73% 21/06/2022 (AA2)
650,000
658,024
674,610 0.62
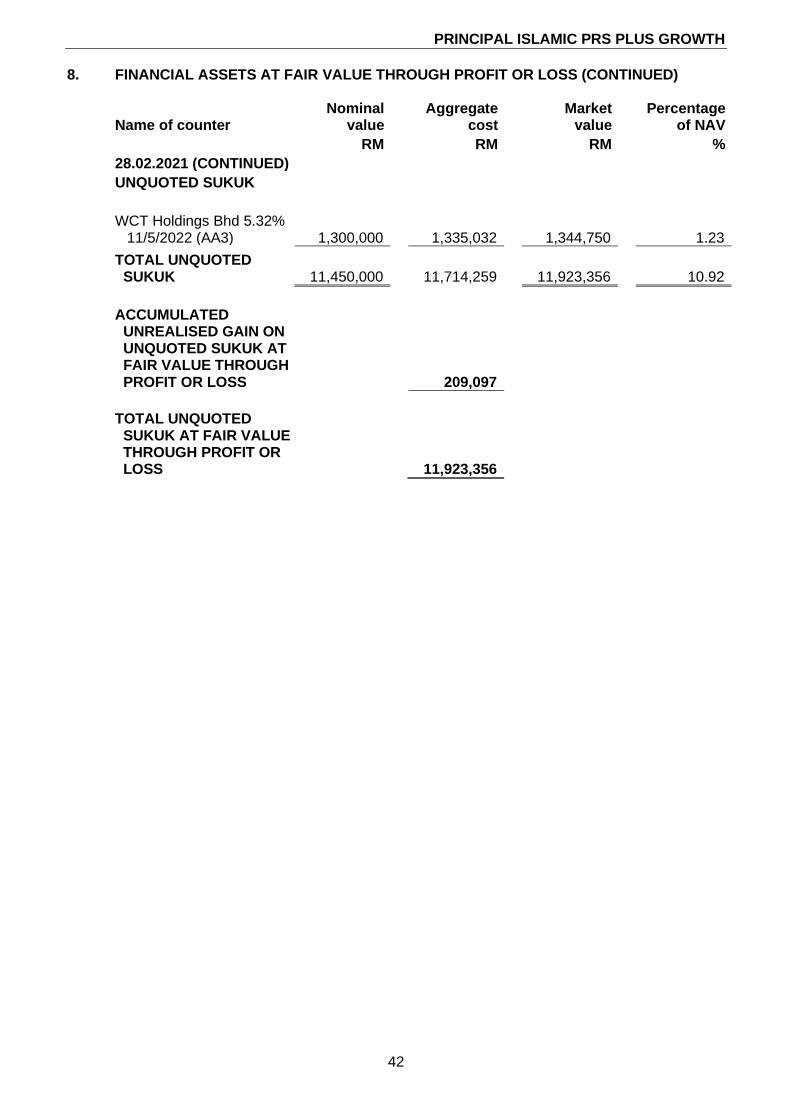
PRINCIPAL ISLAMIC PRS PLUS GROWTH
42
8. FINANCIAL ASSETS AT FAIR VALUE THROUGH PROFIT OR LOSS (CONTINUED)
Name of counter Nominal
value Aggregate
cost Market
value Percentage
of NAV
RM RM RM %
28.02.2021 (CONTINUED)
UNQUOTED SUKUK
WCT Holdings Bhd 5.32% 11/5/2022 (AA3)
1,300,000
1,335,032
1,344,750 1.23
TOTAL UNQUOTED SUKUK
11,450,000
11,714,259
11,923,356 10.92
ACCUMULATED UNREALISED GAIN ON UNQUOTED SUKUK AT FAIR VALUE THROUGH PROFIT OR LOSS 209,097
TOTAL UNQUOTED SUKUK AT FAIR VALUE THROUGH PROFIT OR LOSS 11,923,356
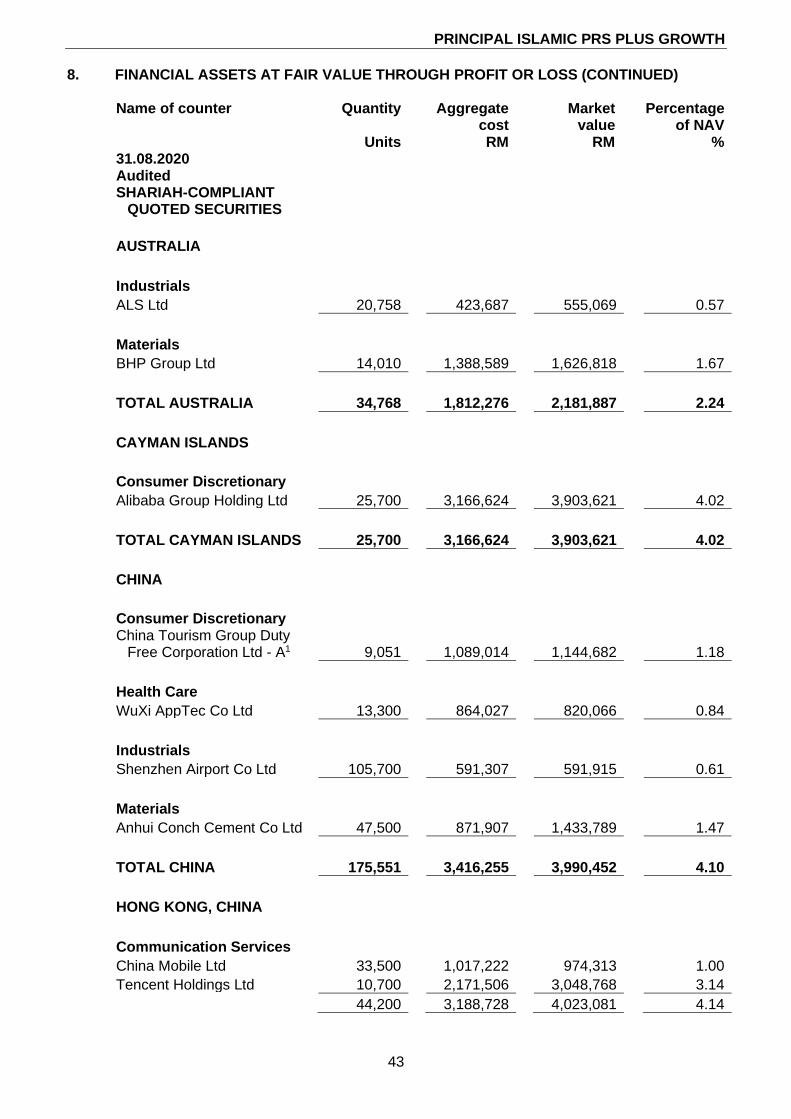
PRINCIPAL ISLAMIC PRS PLUS GROWTH
43
8. FINANCIAL ASSETS AT FAIR VALUE THROUGH PROFIT OR LOSS (CONTINUED)
Name of counter Quantity
Aggregate cost
Market value
Percentage of NAV
Units RM RM % 31.08.2020 Audited
SHARIAH-COMPLIANT QUOTED SECURITIES
AUSTRALIA
Industrials ALS Ltd 20,758 423,687 555,069 0.57
Materials BHP Group Ltd 14,010 1,388,589 1,626,818 1.67
TOTAL AUSTRALIA 34,768 1,812,276 2,181,887 2.24
CAYMAN ISLANDS
Consumer Discretionary Alibaba Group Holding Ltd 25,700 3,166,624 3,903,621 4.02
TOTAL CAYMAN ISLANDS 25,700 3,166,624 3,903,621 4.02
CHINA
Consumer Discretionary China Tourism Group Duty
Free Corporation Ltd - A1 9,051 1,089,014 1,144,682 1.18
Health Care WuXi AppTec Co Ltd 13,300 864,027 820,066 0.84
Industrials Shenzhen Airport Co Ltd 105,700 591,307 591,915 0.61
Materials Anhui Conch Cement Co Ltd 47,500 871,907 1,433,789 1.47
TOTAL CHINA 175,551 3,416,255 3,990,452 4.10
HONG KONG, CHINA
Communication Services China Mobile Ltd 33,500 1,017,222 974,313 1.00
Tencent Holdings Ltd 10,700 2,171,506 3,048,768 3.14
44,200 3,188,728 4,023,081 4.14
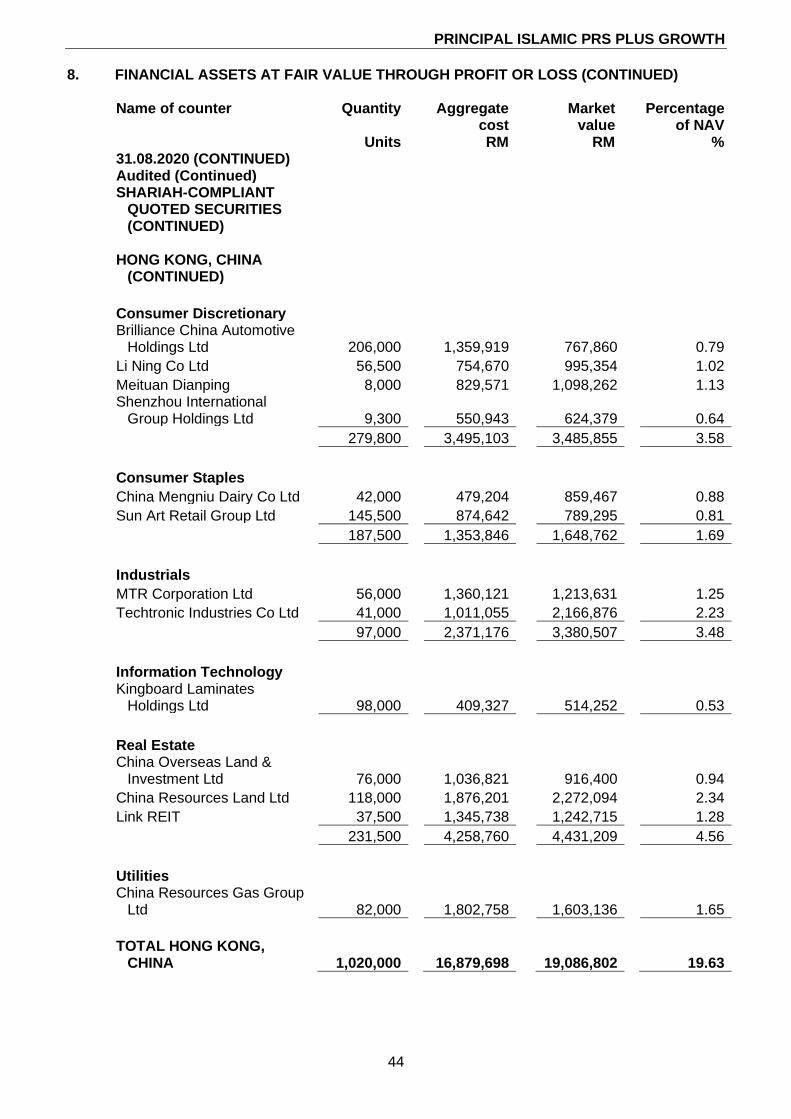
PRINCIPAL ISLAMIC PRS PLUS GROWTH
44
8. FINANCIAL ASSETS AT FAIR VALUE THROUGH PROFIT OR LOSS (CONTINUED)
Name of counter Quantity
Aggregate cost
Market value
Percentage of NAV
Units RM RM % 31.08.2020 (CONTINUED) Audited (Continued)
SHARIAH-COMPLIANT QUOTED SECURITIES (CONTINUED)
HONG KONG, CHINA
(CONTINUED)
Consumer Discretionary Brilliance China Automotive
Holdings Ltd 206,000 1,359,919 767,860 0.79
Li Ning Co Ltd 56,500 754,670 995,354 1.02
Meituan Dianping 8,000 829,571 1,098,262 1.13 Shenzhou International
Group Holdings Ltd 9,300 550,943 624,379 0.64
279,800 3,495,103 3,485,855 3.58
Consumer Staples China Mengniu Dairy Co Ltd 42,000 479,204 859,467 0.88
Sun Art Retail Group Ltd 145,500 874,642 789,295 0.81
187,500 1,353,846 1,648,762 1.69
Industrials MTR Corporation Ltd 56,000 1,360,121 1,213,631 1.25
Techtronic Industries Co Ltd 41,000 1,011,055 2,166,876 2.23
97,000 2,371,176 3,380,507 3.48
Information Technology Kingboard Laminates
Holdings Ltd 98,000 409,327 514,252 0.53
Real Estate China Overseas Land &
Investment Ltd 76,000 1,036,821 916,400 0.94
China Resources Land Ltd 118,000 1,876,201 2,272,094 2.34
Link REIT 37,500 1,345,738 1,242,715 1.28
231,500 4,258,760 4,431,209 4.56
Utilities China Resources Gas Group
Ltd 82,000 1,802,758 1,603,136 1.65
TOTAL HONG KONG,
CHINA 1,020,000 16,879,698 19,086,802 19.63
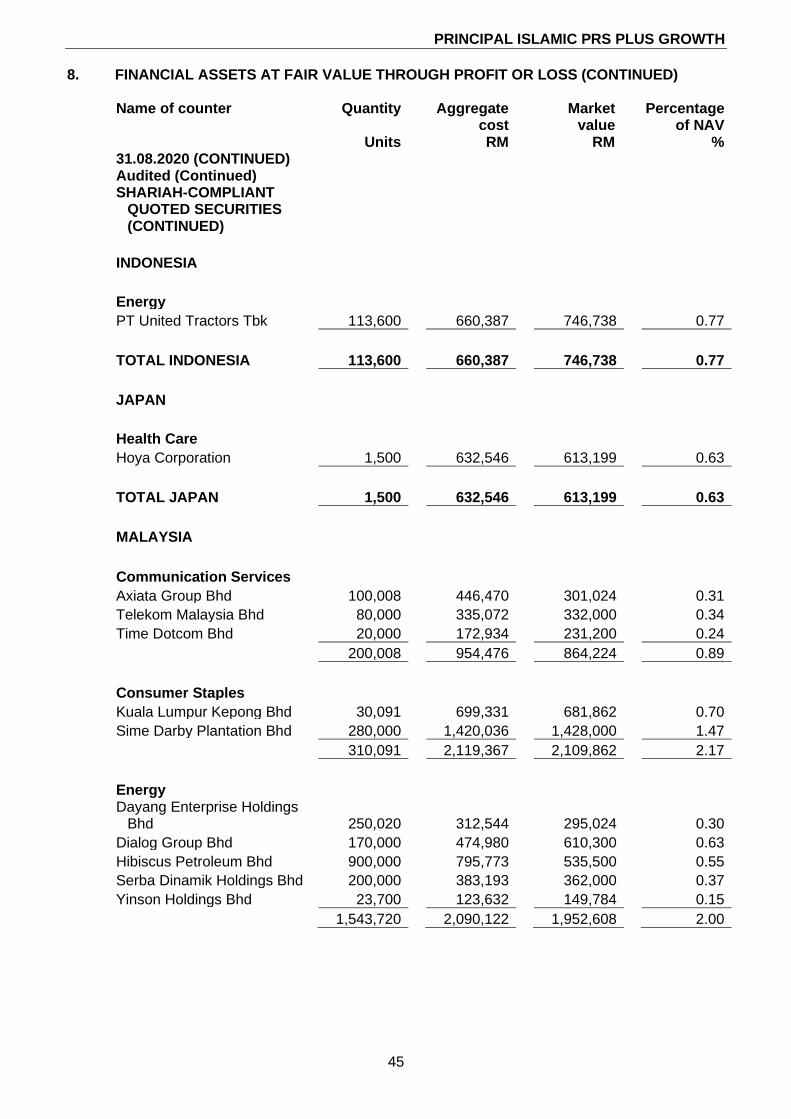
PRINCIPAL ISLAMIC PRS PLUS GROWTH
45
8. FINANCIAL ASSETS AT FAIR VALUE THROUGH PROFIT OR LOSS (CONTINUED)
Name of counter Quantity
Aggregate cost
Market value
Percentage of NAV
Units RM RM % 31.08.2020 (CONTINUED) Audited (Continued)
SHARIAH-COMPLIANT QUOTED SECURITIES (CONTINUED)
INDONESIA
Energy PT United Tractors Tbk 113,600 660,387 746,738 0.77
TOTAL INDONESIA 113,600 660,387 746,738 0.77
JAPAN
Health Care Hoya Corporation 1,500 632,546 613,199 0.63
TOTAL JAPAN 1,500 632,546 613,199 0.63
MALAYSIA
Communication Services Axiata Group Bhd 100,008 446,470 301,024 0.31
Telekom Malaysia Bhd 80,000 335,072 332,000 0.34
Time Dotcom Bhd 20,000 172,934 231,200 0.24
200,008 954,476 864,224 0.89
Consumer Staples Kuala Lumpur Kepong Bhd 30,091 699,331 681,862 0.70
Sime Darby Plantation Bhd 280,000 1,420,036 1,428,000 1.47
310,091 2,119,367 2,109,862 2.17
Energy Dayang Enterprise Holdings
Bhd 250,020 312,544 295,024 0.30
Dialog Group Bhd 170,000 474,980 610,300 0.63
Hibiscus Petroleum Bhd 900,000 795,773 535,500 0.55
Serba Dinamik Holdings Bhd 200,000 383,193 362,000 0.37
Yinson Holdings Bhd 23,700 123,632 149,784 0.15
1,543,720 2,090,122 1,952,608 2.00
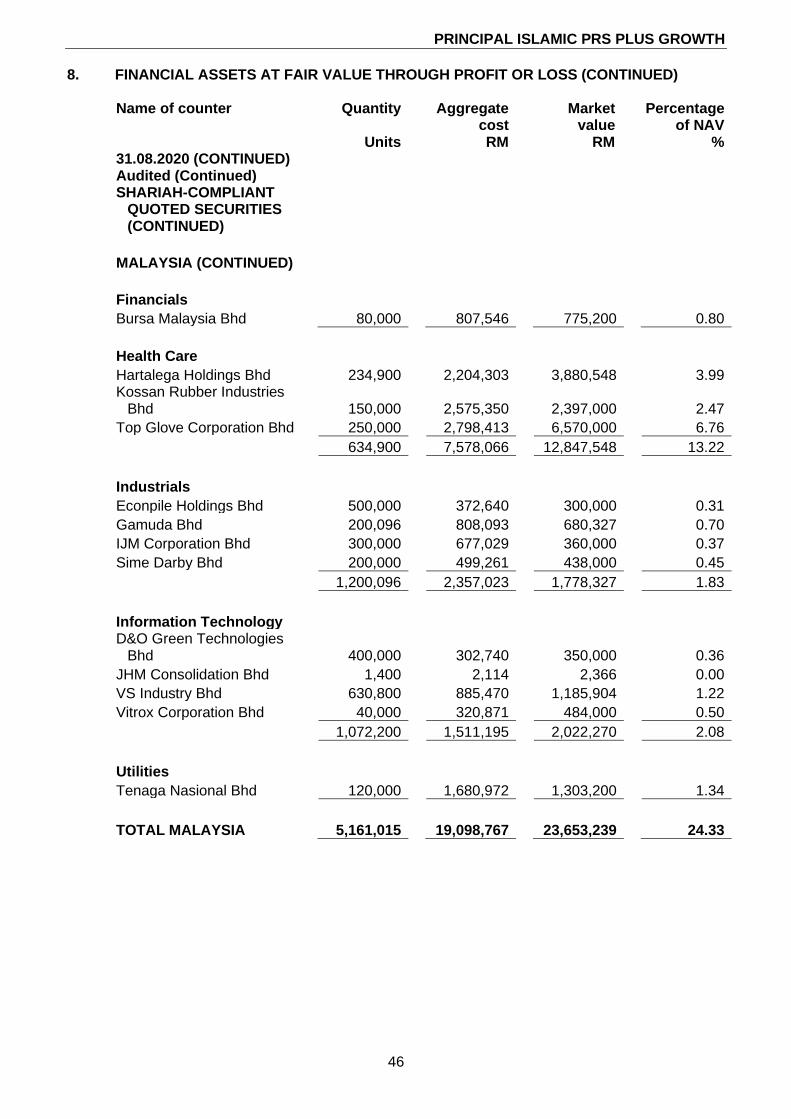
PRINCIPAL ISLAMIC PRS PLUS GROWTH
46
8. FINANCIAL ASSETS AT FAIR VALUE THROUGH PROFIT OR LOSS (CONTINUED)
Name of counter Quantity
Aggregate cost
Market value
Percentage of NAV
Units RM RM % 31.08.2020 (CONTINUED) Audited (Continued)
SHARIAH-COMPLIANT QUOTED SECURITIES (CONTINUED)
MALAYSIA (CONTINUED)
Financials Bursa Malaysia Bhd 80,000 807,546 775,200 0.80
Health Care Hartalega Holdings Bhd 234,900 2,204,303 3,880,548 3.99 Kossan Rubber Industries
Bhd 150,000 2,575,350 2,397,000 2.47
Top Glove Corporation Bhd 250,000 2,798,413 6,570,000 6.76
634,900 7,578,066 12,847,548 13.22
Industrials Econpile Holdings Bhd 500,000 372,640 300,000 0.31
Gamuda Bhd 200,096 808,093 680,327 0.70
IJM Corporation Bhd 300,000 677,029 360,000 0.37
Sime Darby Bhd 200,000 499,261 438,000 0.45
1,200,096 2,357,023 1,778,327 1.83
Information Technology D&O Green Technologies
Bhd 400,000 302,740 350,000 0.36
JHM Consolidation Bhd 1,400 2,114 2,366 0.00
VS Industry Bhd 630,800 885,470 1,185,904 1.22
Vitrox Corporation Bhd 40,000 320,871 484,000 0.50
1,072,200 1,511,195 2,022,270 2.08
Utilities Tenaga Nasional Bhd 120,000 1,680,972 1,303,200 1.34
TOTAL MALAYSIA 5,161,015 19,098,767 23,653,239 24.33
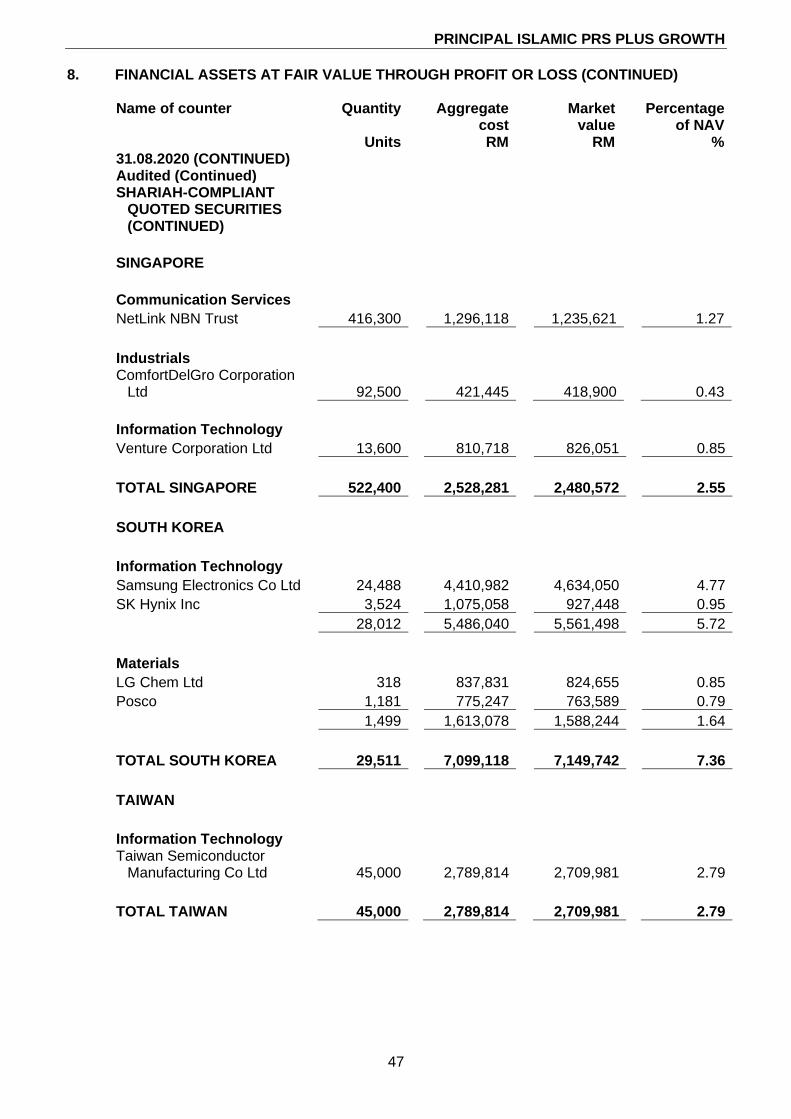
PRINCIPAL ISLAMIC PRS PLUS GROWTH
47
8. FINANCIAL ASSETS AT FAIR VALUE THROUGH PROFIT OR LOSS (CONTINUED)
Name of counter Quantity
Aggregate cost
Market value
Percentage of NAV
Units RM RM % 31.08.2020 (CONTINUED) Audited (Continued)
SHARIAH-COMPLIANT QUOTED SECURITIES (CONTINUED)
SINGAPORE
Communication Services NetLink NBN Trust 416,300 1,296,118 1,235,621 1.27
Industrials ComfortDelGro Corporation
Ltd 92,500 421,445 418,900 0.43
Information Technology Venture Corporation Ltd 13,600 810,718 826,051 0.85
TOTAL SINGAPORE 522,400 2,528,281 2,480,572 2.55
SOUTH KOREA
Information Technology Samsung Electronics Co Ltd 24,488 4,410,982 4,634,050 4.77
SK Hynix Inc 3,524 1,075,058 927,448 0.95
28,012 5,486,040 5,561,498 5.72
Materials LG Chem Ltd 318 837,831 824,655 0.85
Posco 1,181 775,247 763,589 0.79
1,499 1,613,078 1,588,244 1.64
TOTAL SOUTH KOREA 29,511 7,099,118 7,149,742 7.36
TAIWAN
Information Technology Taiwan Semiconductor
Manufacturing Co Ltd 45,000 2,789,814 2,709,981 2.79
TOTAL TAIWAN 45,000 2,789,814 2,709,981 2.79
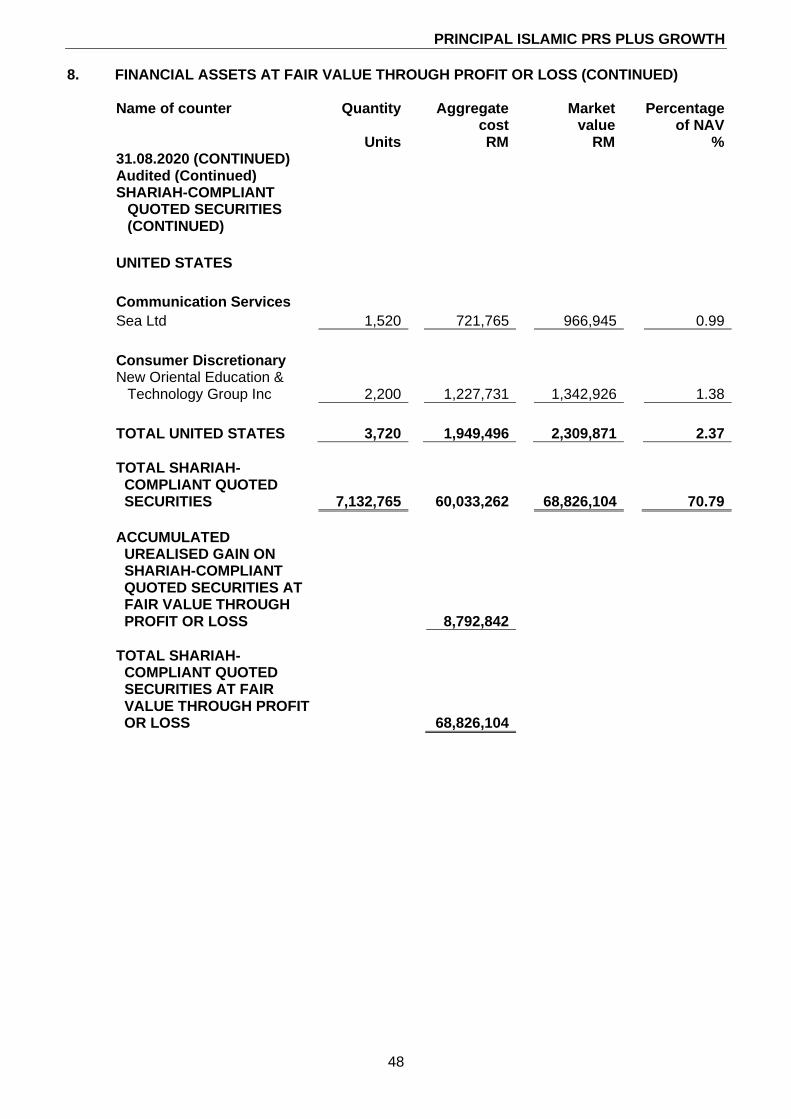
PRINCIPAL ISLAMIC PRS PLUS GROWTH
48
8. FINANCIAL ASSETS AT FAIR VALUE THROUGH PROFIT OR LOSS (CONTINUED)
Name of counter Quantity
Aggregate cost
Market value
Percentage of NAV
Units RM RM % 31.08.2020 (CONTINUED) Audited (Continued)
SHARIAH-COMPLIANT QUOTED SECURITIES (CONTINUED)
UNITED STATES
Communication Services Sea Ltd 1,520 721,765 966,945 0.99
Consumer Discretionary New Oriental Education &
Technology Group Inc 2,200 1,227,731 1,342,926 1.38
TOTAL UNITED STATES 3,720 1,949,496 2,309,871 2.37
TOTAL SHARIAH- COMPLIANT QUOTED SECURITIES 7,132,765 60,033,262 68,826,104 70.79
ACCUMULATED UREALISED GAIN ON SHARIAH-COMPLIANT QUOTED SECURITIES AT FAIR VALUE THROUGH PROFIT OR LOSS
8,792,842
TOTAL SHARIAH- COMPLIANT QUOTED SECURITIES AT FAIR VALUE THROUGH PROFIT OR LOSS
68,826,104
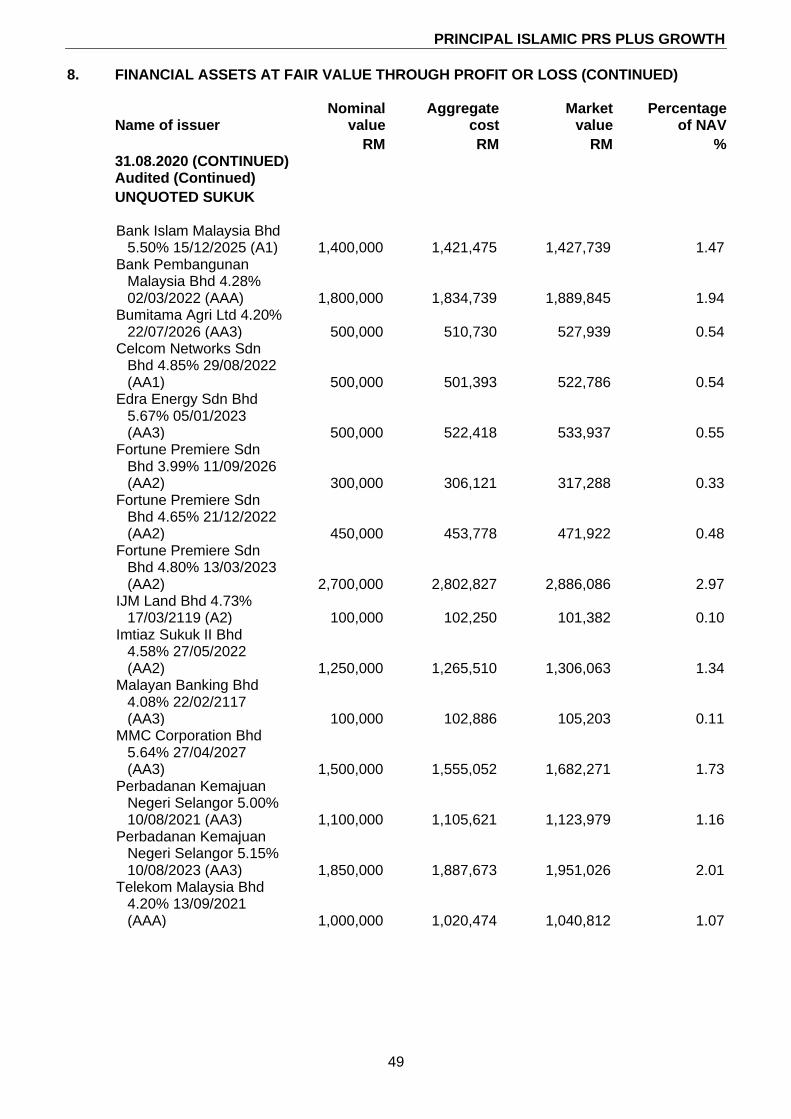
PRINCIPAL ISLAMIC PRS PLUS GROWTH
49
8. FINANCIAL ASSETS AT FAIR VALUE THROUGH PROFIT OR LOSS (CONTINUED)
Name of issuer Nominal
value Aggregate
cost Market
value Percentage
of NAV
RM RM RM % 31.08.2020 (CONTINUED) Audited (Continued)
UNQUOTED SUKUK
Bank Islam Malaysia Bhd 5.50% 15/12/2025 (A1) 1,400,000 1,421,475 1,427,739 1.47
Bank Pembangunan Malaysia Bhd 4.28% 02/03/2022 (AAA) 1,800,000 1,834,739 1,889,845 1.94
Bumitama Agri Ltd 4.20% 22/07/2026 (AA3) 500,000 510,730 527,939 0.54
Celcom Networks Sdn Bhd 4.85% 29/08/2022 (AA1) 500,000 501,393 522,786 0.54
Edra Energy Sdn Bhd 5.67% 05/01/2023 (AA3) 500,000 522,418 533,937 0.55
Fortune Premiere Sdn Bhd 3.99% 11/09/2026 (AA2) 300,000 306,121 317,288 0.33
Fortune Premiere Sdn Bhd 4.65% 21/12/2022 (AA2) 450,000 453,778 471,922 0.48
Fortune Premiere Sdn Bhd 4.80% 13/03/2023 (AA2) 2,700,000 2,802,827 2,886,086 2.97
IJM Land Bhd 4.73% 17/03/2119 (A2) 100,000 102,250 101,382 0.10
Imtiaz Sukuk II Bhd 4.58% 27/05/2022 (AA2) 1,250,000 1,265,510 1,306,063 1.34
Malayan Banking Bhd 4.08% 22/02/2117 (AA3) 100,000 102,886 105,203 0.11
MMC Corporation Bhd 5.64% 27/04/2027 (AA3) 1,500,000 1,555,052 1,682,271 1.73
Perbadanan Kemajuan Negeri Selangor 5.00% 10/08/2021 (AA3) 1,100,000 1,105,621 1,123,979 1.16
Perbadanan Kemajuan Negeri Selangor 5.15% 10/08/2023 (AA3) 1,850,000 1,887,673 1,951,026 2.01
Telekom Malaysia Bhd 4.20% 13/09/2021 (AAA) 1,000,000 1,020,474 1,040,812 1.07
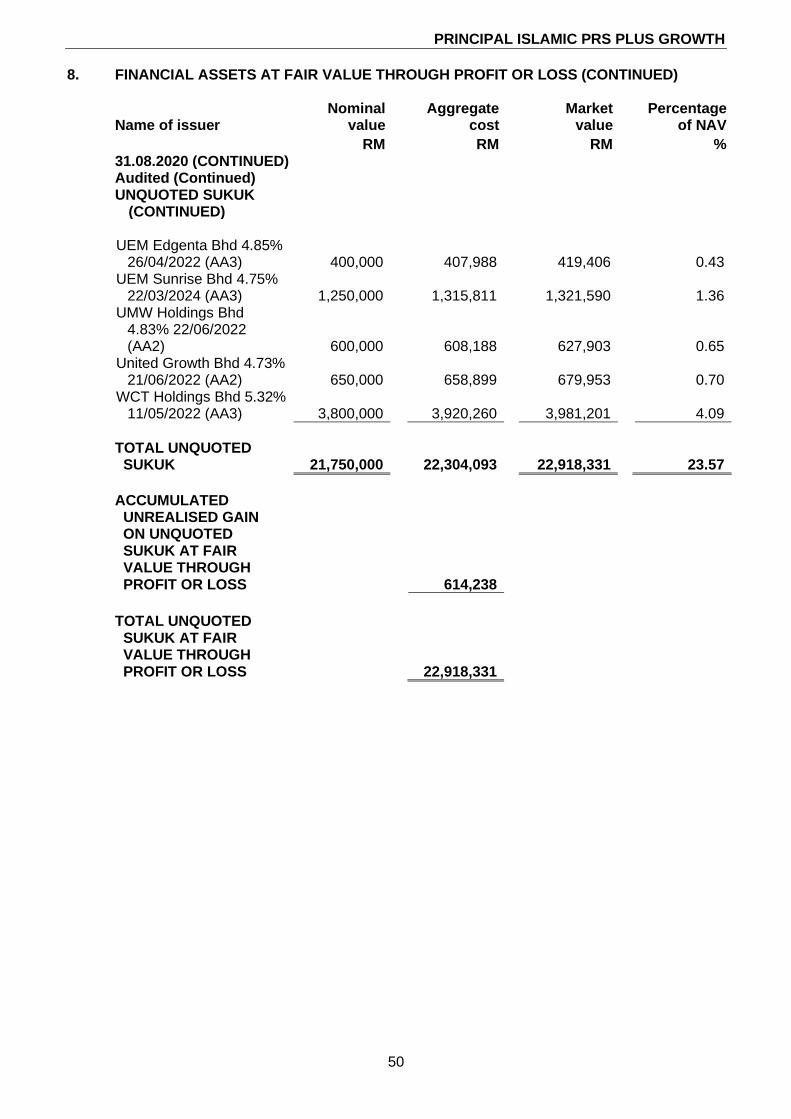
PRINCIPAL ISLAMIC PRS PLUS GROWTH
50
8. FINANCIAL ASSETS AT FAIR VALUE THROUGH PROFIT OR LOSS (CONTINUED)
Name of issuer Nominal
value Aggregate
cost Market
value Percentage
of NAV
RM RM RM % 31.08.2020 (CONTINUED) Audited (Continued) UNQUOTED SUKUK
(CONTINUED)
UEM Edgenta Bhd 4.85% 26/04/2022 (AA3) 400,000 407,988 419,406 0.43
UEM Sunrise Bhd 4.75% 22/03/2024 (AA3) 1,250,000 1,315,811 1,321,590 1.36
UMW Holdings Bhd 4.83% 22/06/2022 (AA2) 600,000 608,188 627,903 0.65
United Growth Bhd 4.73% 21/06/2022 (AA2) 650,000 658,899 679,953 0.70
WCT Holdings Bhd 5.32% 11/05/2022 (AA3) 3,800,000 3,920,260 3,981,201 4.09
TOTAL UNQUOTED SUKUK 21,750,000 22,304,093 22,918,331 23.57
ACCUMULATED UNREALISED GAIN ON UNQUOTED SUKUK AT FAIR VALUE THROUGH PROFIT OR LOSS 614,238
TOTAL UNQUOTED SUKUK AT FAIR VALUE THROUGH PROFIT OR LOSS 22,918,331
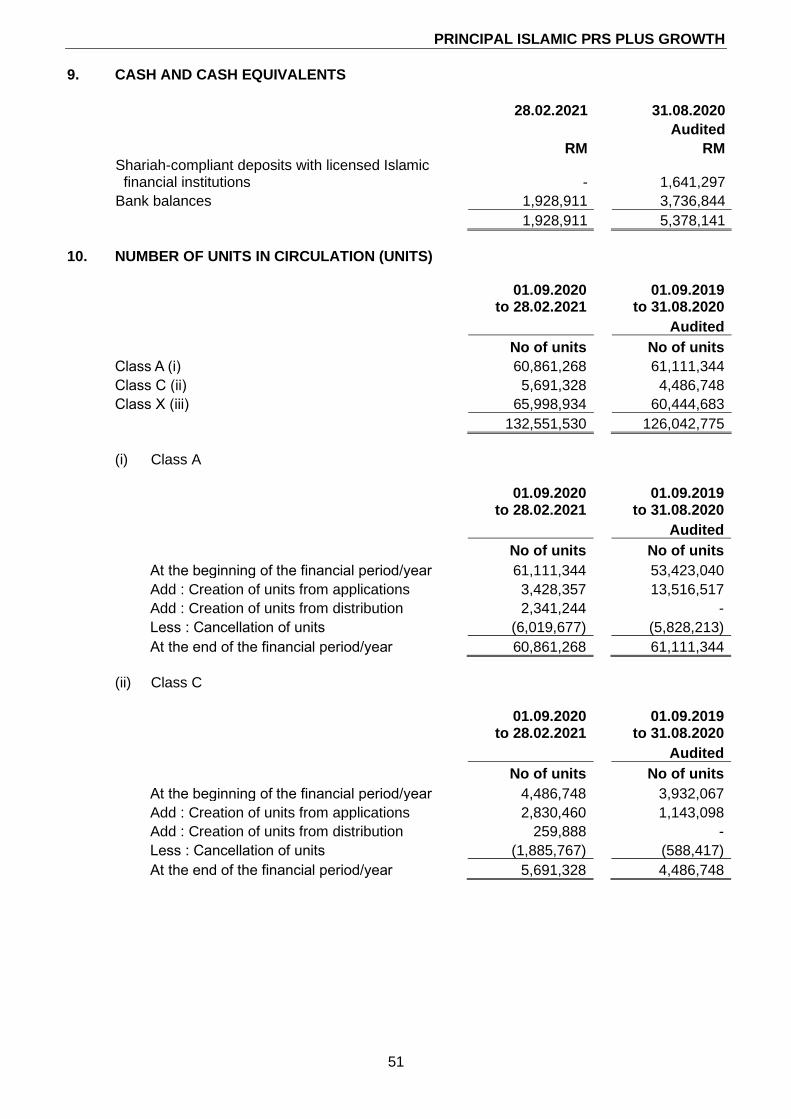
PRINCIPAL ISLAMIC PRS PLUS GROWTH
51
9. CASH AND CASH EQUIVALENTS
28.02.2021 31.08.2020
Audited
RM RM Shariah-compliant deposits with licensed Islamic financial institutions - 1,641,297
Bank balances 1,928,911 3,736,844
1,928,911 5,378,141
10. NUMBER OF UNITS IN CIRCULATION (UNITS)
01.09.2020
to 28.02.2021 01.09.2019
to 31.08.2020
Audited
No of units No of units
Class A (i) 60,861,268 61,111,344
Class C (ii) 5,691,328 4,486,748
Class X (iii) 65,998,934 60,444,683
132,551,530 126,042,775
(i) Class A
01.09.2020
to 28.02.2021 01.09.2019
to 31.08.2020
Audited
No of units No of units
At the beginning of the financial period/year 61,111,344 53,423,040
Add : Creation of units from applications 3,428,357 13,516,517
Add : Creation of units from distribution 2,341,244 -
Less : Cancellation of units (6,019,677) (5,828,213)
At the end of the financial period/year 60,861,268 61,111,344
(ii) Class C
01.09.2020
to 28.02.2021 01.09.2019
to 31.08.2020
Audited
No of units No of units
At the beginning of the financial period/year 4,486,748 3,932,067
Add : Creation of units from applications 2,830,460 1,143,098
Add : Creation of units from distribution 259,888 -
Less : Cancellation of units (1,885,767) (588,417)
At the end of the financial period/year 5,691,328 4,486,748
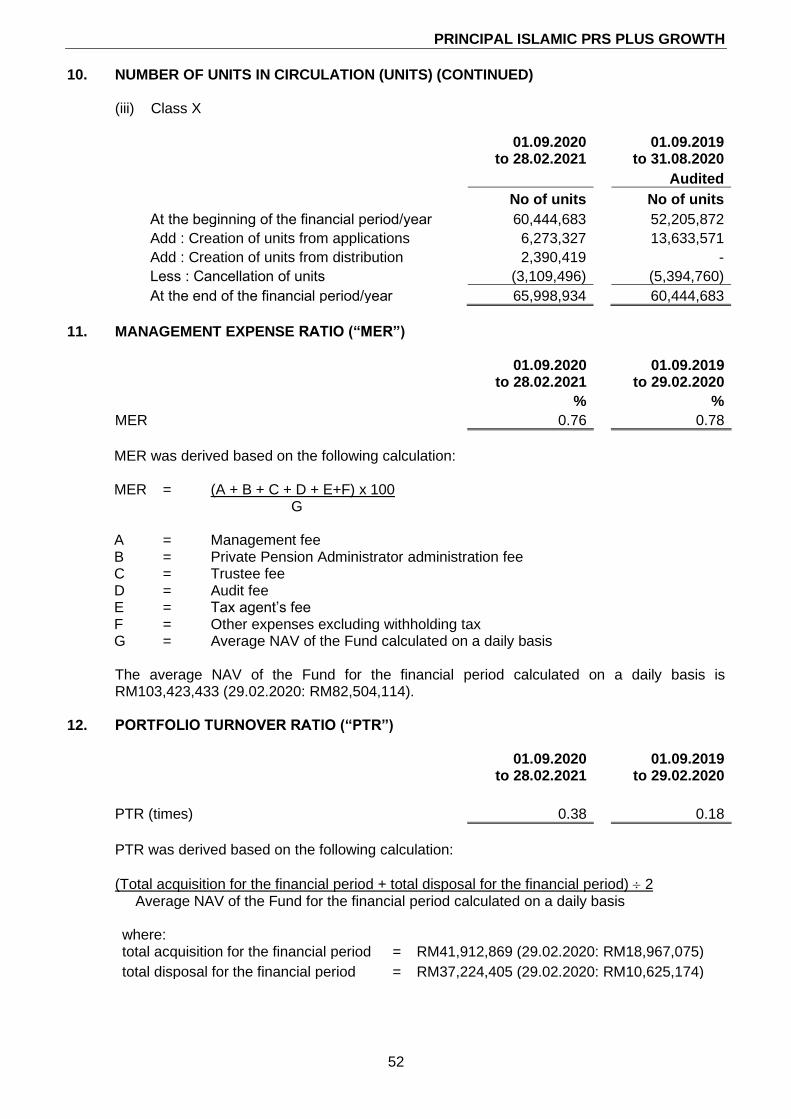
PRINCIPAL ISLAMIC PRS PLUS GROWTH
52
10. NUMBER OF UNITS IN CIRCULATION (UNITS) (CONTINUED)
(iii) Class X
01.09.2020
to 28.02.2021 01.09.2019
to 31.08.2020
Audited
No of units No of units
At the beginning of the financial period/year 60,444,683 52,205,872
Add : Creation of units from applications 6,273,327 13,633,571
Add : Creation of units from distribution 2,390,419 -
Less : Cancellation of units (3,109,496) (5,394,760)
At the end of the financial period/year 65,998,934 60,444,683
11. MANAGEMENT EXPENSE RATIO (“MER”)
01.09.2020
to 28.02.2021 01.09.2019
to 29.02.2020
% %
MER 0.76 0.78
MER was derived based on the following calculation: MER = (A + B + C + D + E+F) x 100 G
A = Management fee B = Private Pension Administrator administration fee C = Trustee fee D = Audit fee E = Tax agent’s fee F = Other expenses excluding withholding tax G = Average NAV of the Fund calculated on a daily basis The average NAV of the Fund for the financial period calculated on a daily basis is RM103,423,433 (29.02.2020: RM82,504,114).
12. PORTFOLIO TURNOVER RATIO (“PTR”)
01.09.2020
to 28.02.2021 01.09.2019
to 29.02.2020
PTR (times) 0.38 0.18
PTR was derived based on the following calculation:
(Total acquisition for the financial period + total disposal for the financial period) 2 Average NAV of the Fund for the financial period calculated on a daily basis where: total acquisition for the financial period = RM41,912,869 (29.02.2020: RM18,967,075)
total disposal for the financial period = RM37,224,405 (29.02.2020: RM10,625,174)
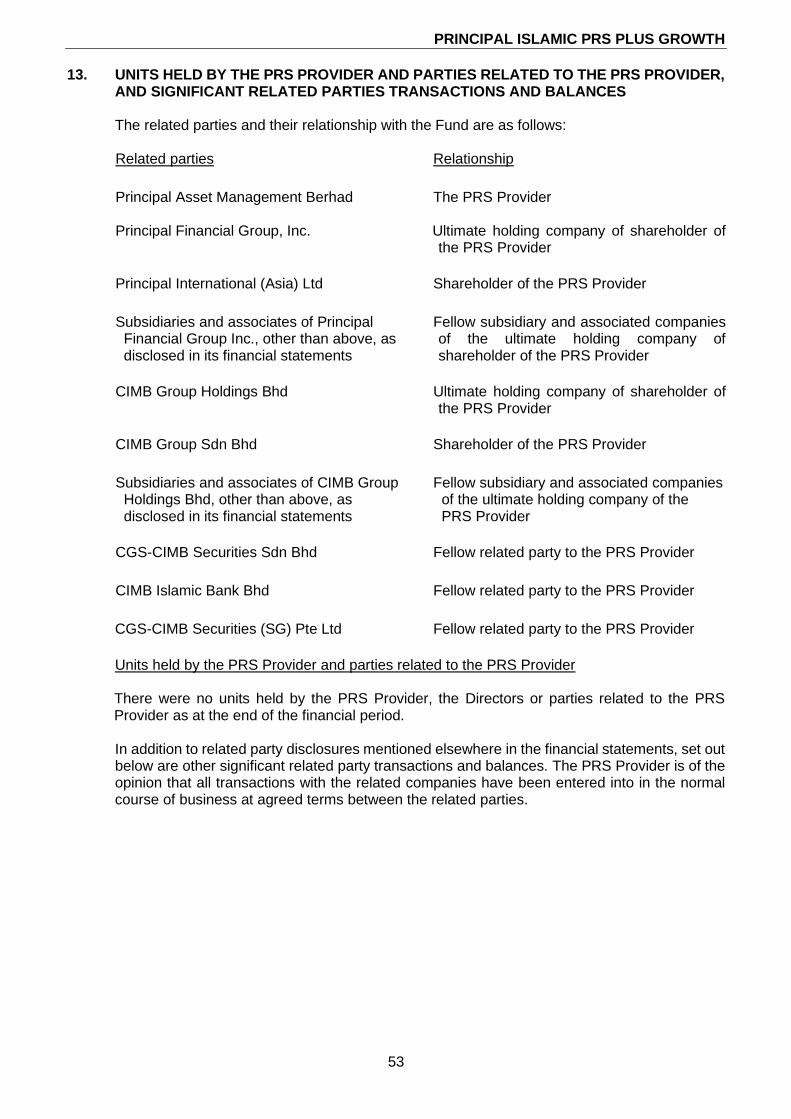
PRINCIPAL ISLAMIC PRS PLUS GROWTH
53
13. UNITS HELD BY THE PRS PROVIDER AND PARTIES RELATED TO THE PRS PROVIDER, AND SIGNIFICANT RELATED PARTIES TRANSACTIONS AND BALANCES The related parties and their relationship with the Fund are as follows: Related parties Relationship
Principal Asset Management Berhad
The PRS Provider
Principal Financial Group, Inc. Ultimate holding company of shareholder of the PRS Provider
Principal International (Asia) Ltd Shareholder of the PRS Provider
Subsidiaries and associates of Principal Financial Group Inc., other than above, as disclosed in its financial statements
Fellow subsidiary and associated companies of the ultimate holding company of shareholder of the PRS Provider
CIMB Group Holdings Bhd Ultimate holding company of shareholder of the PRS Provider
CIMB Group Sdn Bhd Shareholder of the PRS Provider
Subsidiaries and associates of CIMB Group Holdings Bhd, other than above, as disclosed in its financial statements
Fellow subsidiary and associated companies of the ultimate holding company of the PRS Provider
CGS-CIMB Securities Sdn Bhd Fellow related party to the PRS Provider
CIMB Islamic Bank Bhd Fellow related party to the PRS Provider
CGS-CIMB Securities (SG) Pte Ltd Fellow related party to the PRS Provider
Units held by the PRS Provider and parties related to the PRS Provider There were no units held by the PRS Provider, the Directors or parties related to the PRS Provider as at the end of the financial period.
In addition to related party disclosures mentioned elsewhere in the financial statements, set out below are other significant related party transactions and balances. The PRS Provider is of the opinion that all transactions with the related companies have been entered into in the normal course of business at agreed terms between the related parties.
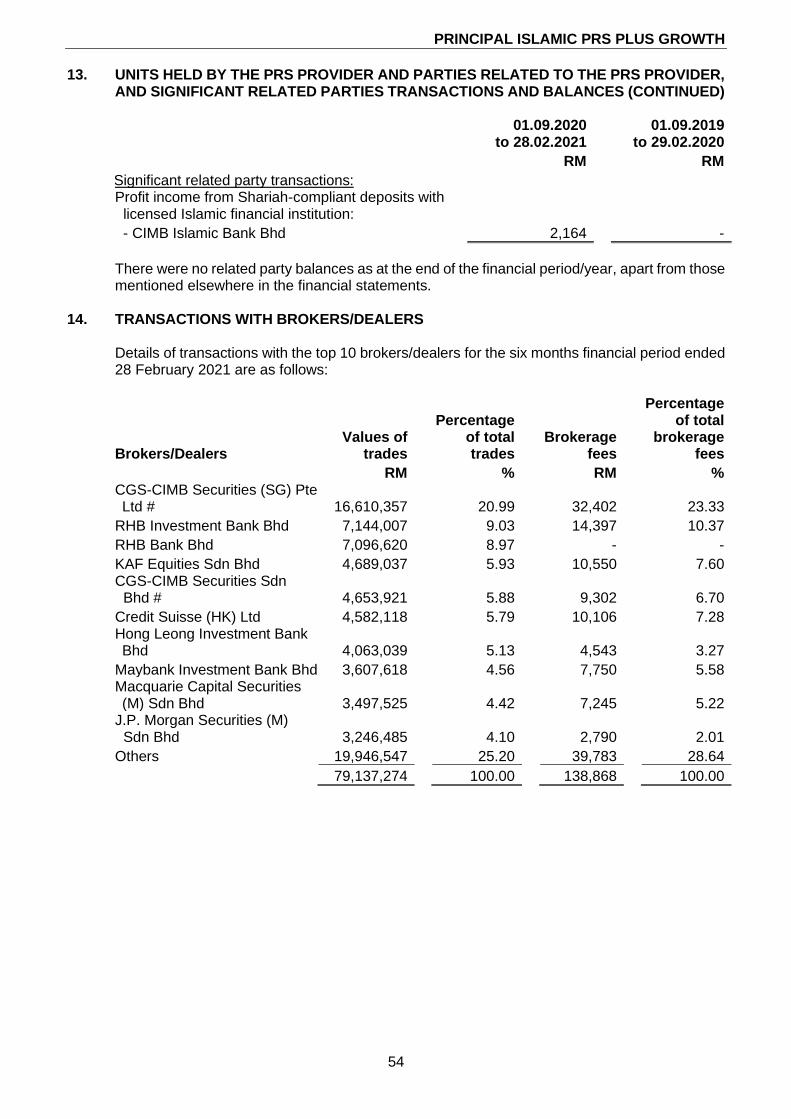
PRINCIPAL ISLAMIC PRS PLUS GROWTH
54
13. UNITS HELD BY THE PRS PROVIDER AND PARTIES RELATED TO THE PRS PROVIDER, AND SIGNIFICANT RELATED PARTIES TRANSACTIONS AND BALANCES (CONTINUED)
01.09.2020
to 28.02.2021 01.09.2019
to 29.02.2020
RM RM
Significant related party transactions: Profit income from Shariah-compliant deposits with licensed Islamic financial institution:
- CIMB Islamic Bank Bhd 2,164 -
There were no related party balances as at the end of the financial period/year, apart from those mentioned elsewhere in the financial statements.
14. TRANSACTIONS WITH BROKERS/DEALERS
Details of transactions with the top 10 brokers/dealers for the six months financial period ended 28 February 2021 are as follows:
Brokers/Dealers Values of
trades
Percentage of total trades
Brokerage fees
Percentage of total
brokerage fees
RM % RM % CGS-CIMB Securities (SG) Pte Ltd # 16,610,357 20.99 32,402 23.33
RHB Investment Bank Bhd 7,144,007 9.03 14,397 10.37
RHB Bank Bhd 7,096,620 8.97 - -
KAF Equities Sdn Bhd 4,689,037 5.93 10,550 7.60 CGS-CIMB Securities Sdn Bhd # 4,653,921 5.88 9,302 6.70
Credit Suisse (HK) Ltd 4,582,118 5.79 10,106 7.28 Hong Leong Investment Bank Bhd 4,063,039 5.13 4,543 3.27
Maybank Investment Bank Bhd 3,607,618 4.56 7,750 5.58 Macquarie Capital Securities (M) Sdn Bhd 3,497,525 4.42 7,245 5.22
J.P. Morgan Securities (M) Sdn Bhd 3,246,485 4.10 2,790 2.01
Others 19,946,547 25.20 39,783 28.64
79,137,274 100.00 138,868 100.00
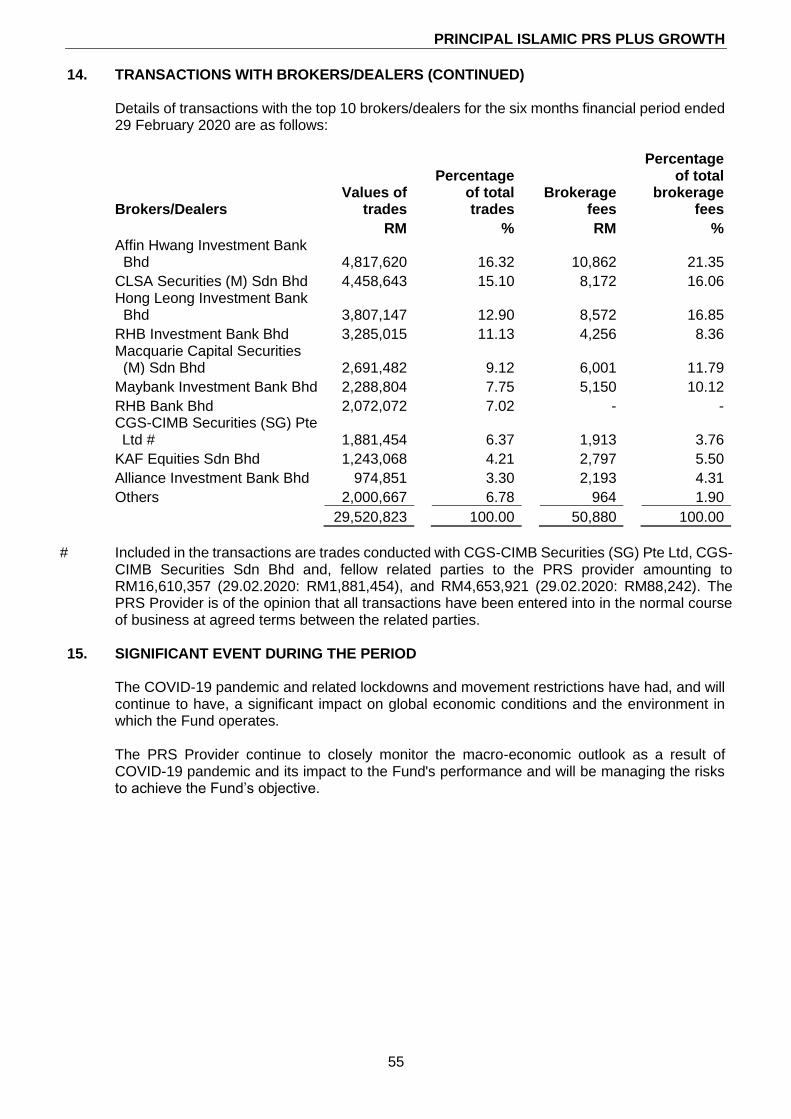
PRINCIPAL ISLAMIC PRS PLUS GROWTH
55
14. TRANSACTIONS WITH BROKERS/DEALERS (CONTINUED)
Details of transactions with the top 10 brokers/dealers for the six months financial period ended 29 February 2020 are as follows:
Brokers/Dealers Values of
trades
Percentage of total trades
Brokerage fees
Percentage of total
brokerage fees
RM % RM % Affin Hwang Investment Bank Bhd 4,817,620 16.32 10,862 21.35
CLSA Securities (M) Sdn Bhd 4,458,643 15.10 8,172 16.06 Hong Leong Investment Bank Bhd 3,807,147 12.90 8,572 16.85
RHB Investment Bank Bhd 3,285,015 11.13 4,256 8.36 Macquarie Capital Securities (M) Sdn Bhd 2,691,482 9.12 6,001 11.79
Maybank Investment Bank Bhd 2,288,804 7.75 5,150 10.12
RHB Bank Bhd 2,072,072 7.02 - - CGS-CIMB Securities (SG) Pte Ltd # 1,881,454 6.37 1,913 3.76
KAF Equities Sdn Bhd 1,243,068 4.21 2,797 5.50
Alliance Investment Bank Bhd 974,851 3.30 2,193 4.31
Others 2,000,667 6.78 964 1.90
29,520,823 100.00 50,880 100.00
# Included in the transactions are trades conducted with CGS-CIMB Securities (SG) Pte Ltd, CGS-
CIMB Securities Sdn Bhd and, fellow related parties to the PRS provider amounting to RM16,610,357 (29.02.2020: RM1,881,454), and RM4,653,921 (29.02.2020: RM88,242). The PRS Provider is of the opinion that all transactions have been entered into in the normal course of business at agreed terms between the related parties.
15. SIGNIFICANT EVENT DURING THE PERIOD
The COVID-19 pandemic and related lockdowns and movement restrictions have had, and will continue to have, a significant impact on global economic conditions and the environment in which the Fund operates. The PRS Provider continue to closely monitor the macro-economic outlook as a result of COVID-19 pandemic and its impact to the Fund's performance and will be managing the risks to achieve the Fund’s objective.
PRINCIPAL ISLAMIC PRS PLUS GROWTH
56
DIRECTORY Head Office of the PRS Provider Principal Asset Management Berhad (Company No.: 199401018399 (304078-K)) 10th Floor, Bangunan CIMB, Jalan Semantan, Damansara Heights, 50490 Kuala Lumpur, MALAYSIA. Tel: (03) 2084 8888 Website www.principal.com.my E-mail address [email protected] Customer Care Centre (03) 7718 3000 Trustee for the Principal Islamic PRS Plus Growth Deutsche Trustees Malaysia Berhad (Co. No.: 200701005591 (763590-H)) Level 20 Menara IMC, 8 Jalan Sultan Ismail, 50250 Kuala Lumpur, MALAYSIA. Tel: (03) 2053 7522 Fax: (03) 2053 7526 Shariah Adviser of the Principal Islamic PRS Plus Growth Amanie Advisors Sdn. Bhd. (Company No.: 200501007003 (684050-H)) Level 13A-2, Menara Tokio Marine Life, No 189, Jalan Tun Razak, 50400 Kuala Lumpur, MALAYSIA. Tel: (03) 2161 0260 Fax: (03) 2161 0262

Enquiries:
Customer Care Centre (603)7718 3000
Email [email protected]
Website www.principal.com.my
Principal Asset Management Berhad199401018399 (304078-K)