Embed Size (px)
Citation preview
Broward County Climate Change Task Force
Recycling in Broward County: An Update & Review of its Potential Role in Reducing Greenhouse Gas Emissions
By Phil Bresee, Recycling Program Manager, Broward County
February 19, 2009
1

Municipal Solid Waste (MSW) Contributions to GHG Emissions*
2
Source: Governor’s Climate Action Team, 2008
* = Sector based…
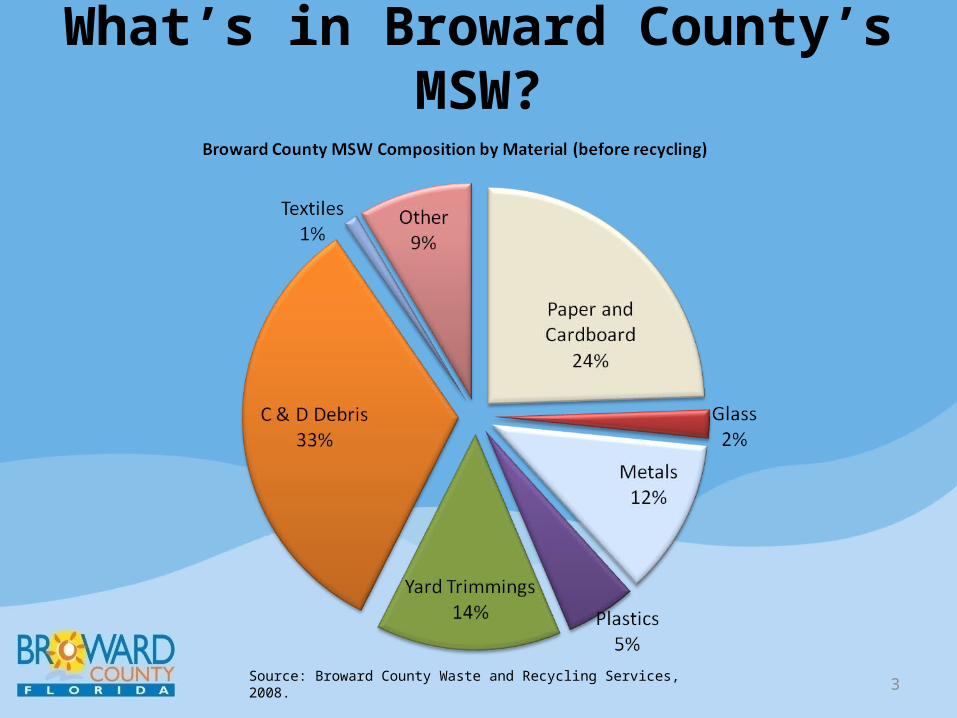
What’s in Broward County’s MSW?
3Source: Broward County Waste and Recycling Services, 2008.

How Should MSW be Managed?
4
US EPA developed solid waste management hierarchy in late 1980s.
• Source, or waste reduction means minimizing or not creating waste in the first place.
• Recycling is preferred way to manage materials.
• WTE with energy recovery for non-recyclable trash offers benefits through less reliance on fossil fuels.

Recent MSW and Recycling Trends in Broward County
5
Sources: Florida Dept. of Environmental Protection & Broward County Waste and Recycling Services, 2008.
Recycling in Broward County: Background• 1988 Florida Solid Waste Management Act established county recycling
goals, including 30% recycling goal by end of 1994.• State also established Recycling & Education grants to counties.• First Broward County curbside recycling program began 1988-89 in
unincorporated areas collecting aluminum cans and newspaper through “curb-sorting”.
• City recyclables delivered to various local Materials Recovery Facilities (MRFs, pronounced “Murph”); County’s Resource Recovery System elected to pursue system-wide MRF in 1991.
• All but two of Broward County’s cities provide curbside recycling.• Some cities also provide or facilitate recycling at multi-family complexes
(condos and apartments).
6
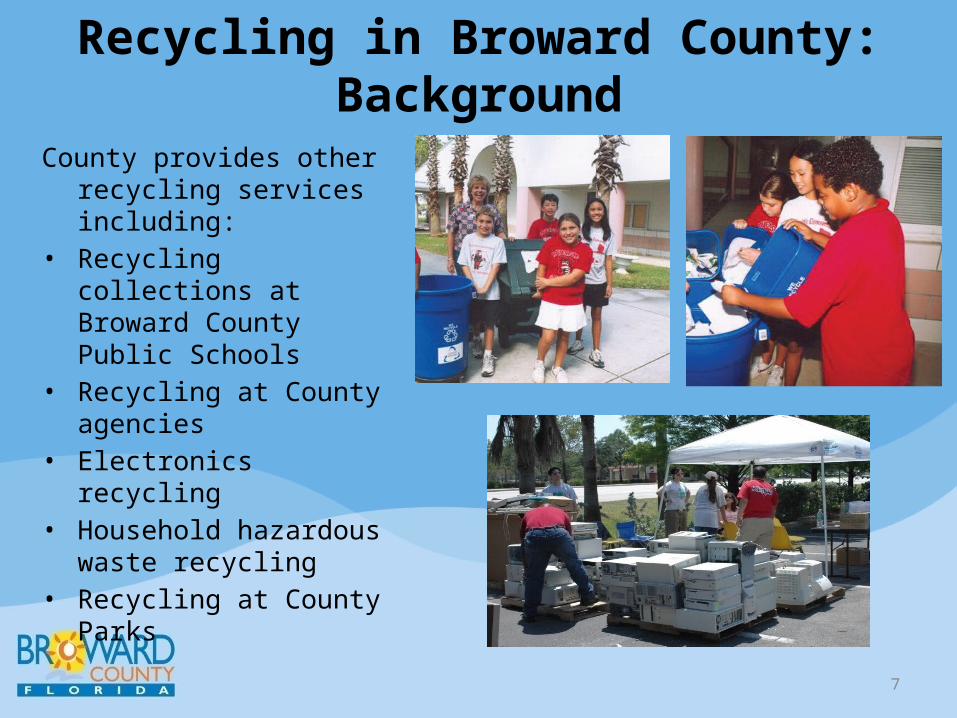
Recycling in Broward County: Background
County provides other recycling services including:
• Recycling collections at Broward County Public Schools
• Recycling at County agencies• Electronics recycling• Household hazardous waste
recycling• Recycling at County Parks
7
Emerging and Potential Recycling Trends, Programs, & Policy Actions to Increase Recycling
8
• Producer responsibility and product stewardship.
• State consideration of renewable energy sources, including WTE biomass and landfill gas diversion credits in achieving goals. (part of 2008 Energy Bill – HB 7135)
• Reporting requirements and what can be counted towards recycling credit.
• State financial support for recycling efforts.
• Public place recycling – including recycling at FLL & “green lodging.”
• Reduce landfill disposal of “high volume recyclables” including construction & demolition debris , yard waste and paper.
• Focus on multi-family (50% ~ of Broward’s households) through more on-site recycling, drop-off centers, etc.
• City solid waste contracts that include green waste recycling (“1-1-1”) and commercial recycling.
• Single-stream recycling.
Single-Stream Recycling 101
Single-Stream Recycling = Process in which all recyclables (paper materials and metal, glass & plastic food and beverage containers) are collected in a single, mixed form, and subsequently separated and processed at a MRF into marketable commodities.
9
Single-Stream Recycling 101 (cont.)
• Single-stream recycling provided in many large communities long known for their aggressive recycling programs including Seattle, Portland and San Francisco.
• Currently about 600 single-stream curbside recycling programs operating (out of about 8,600+ total in the U.S.) and the number keeps growing.
• Single-stream recycling began to take root in Florida in 2004 and current list of participants includes:o Collier Countyo Martin Countyo Stuarto Orlandoo Miami-Dade Countyo Parkland
10
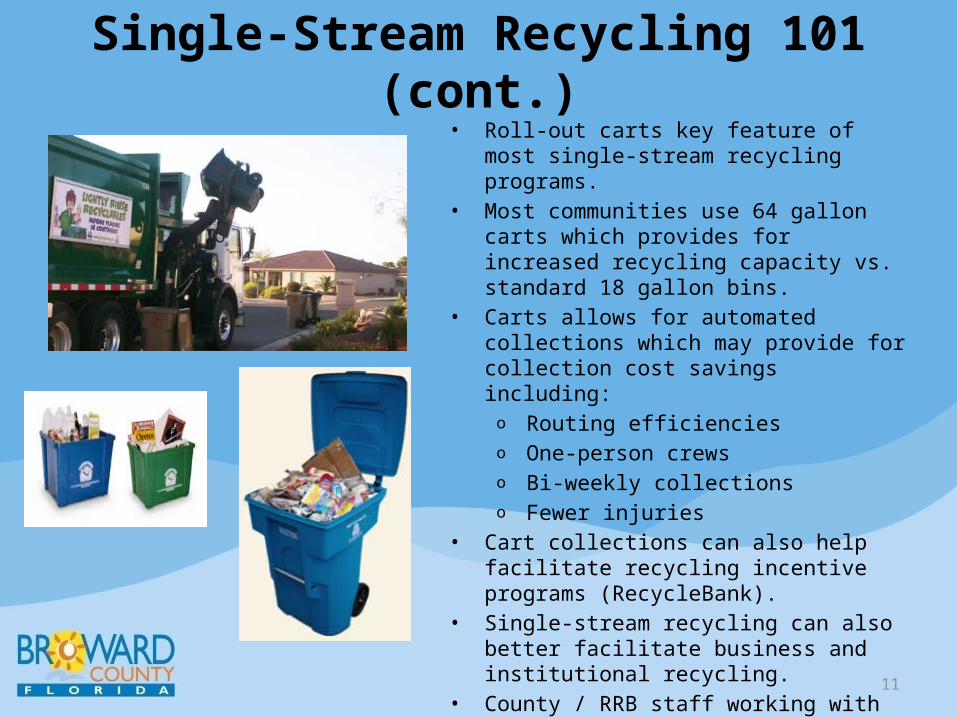
Single-Stream Recycling 101 (cont.)• Roll-out carts key feature of most single-stream
recycling programs.• Most communities use 64 gallon carts which
provides for increased recycling capacity vs. standard 18 gallon bins.
• Carts allows for automated collections which may provide for collection cost savings including: o Routing efficiencieso One-person crewso Bi-weekly collectionso Fewer injuries
• Cart collections can also help facilitate recycling incentive programs (RecycleBank).
• Single-stream recycling can also better facilitate business and institutional recycling.
• County / RRB staff working with cities on transition to single-stream; will most likely utilize system-wide combination of bins and carts, at least initially.
11
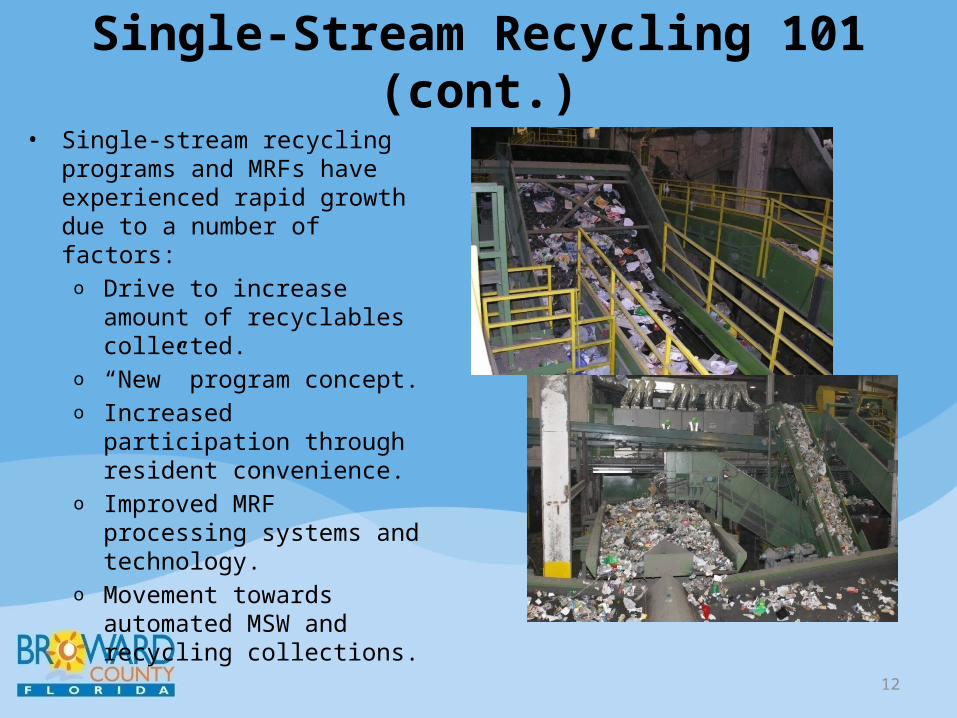
Single-Stream Recycling 101 (cont.)• Single-stream recycling programs and
MRFs have experienced rapid growth due to a number of factors:o Drive to increase amount of
recyclables collected. o “New” program concept.o Increased participation through
resident convenience.o Improved MRF processing
systems and technology.o Movement towards automated
MSW and recycling collections.
12
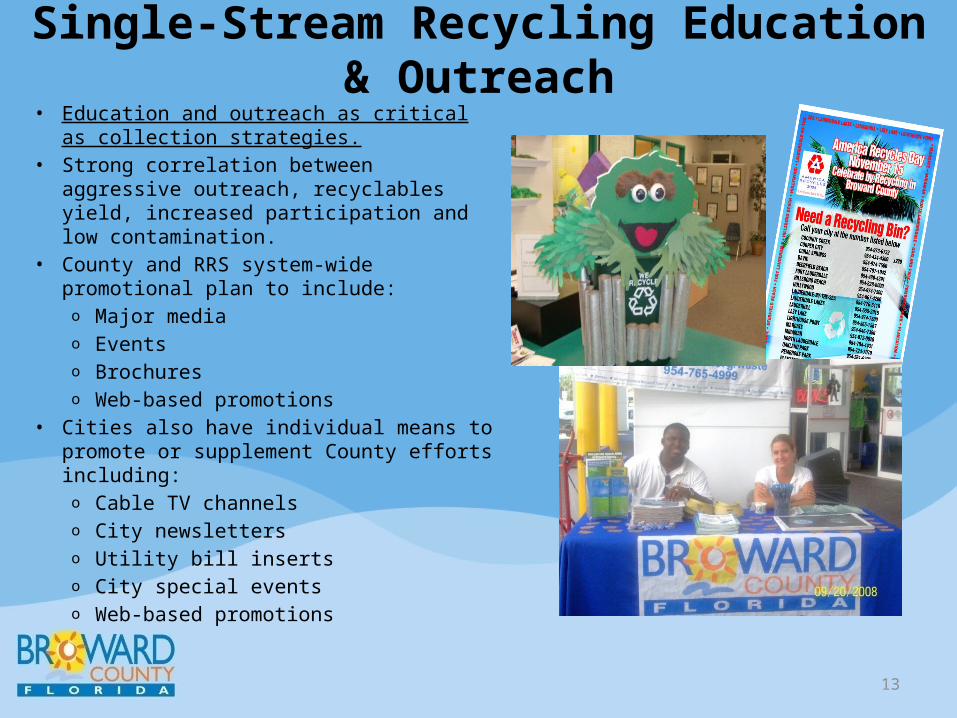
Single-Stream Recycling Education & Outreach• Education and outreach as critical as collection
strategies.• Strong correlation between aggressive
outreach, recyclables yield, increased participation and low contamination.
• County and RRS system-wide promotional plan to include:o Major mediao Eventso Brochureso Web-based promotions
• Cities also have individual means to promote or supplement County efforts including:o Cable TV channelso City newsletterso Utility bill insertso City special eventso Web-based promotions
13
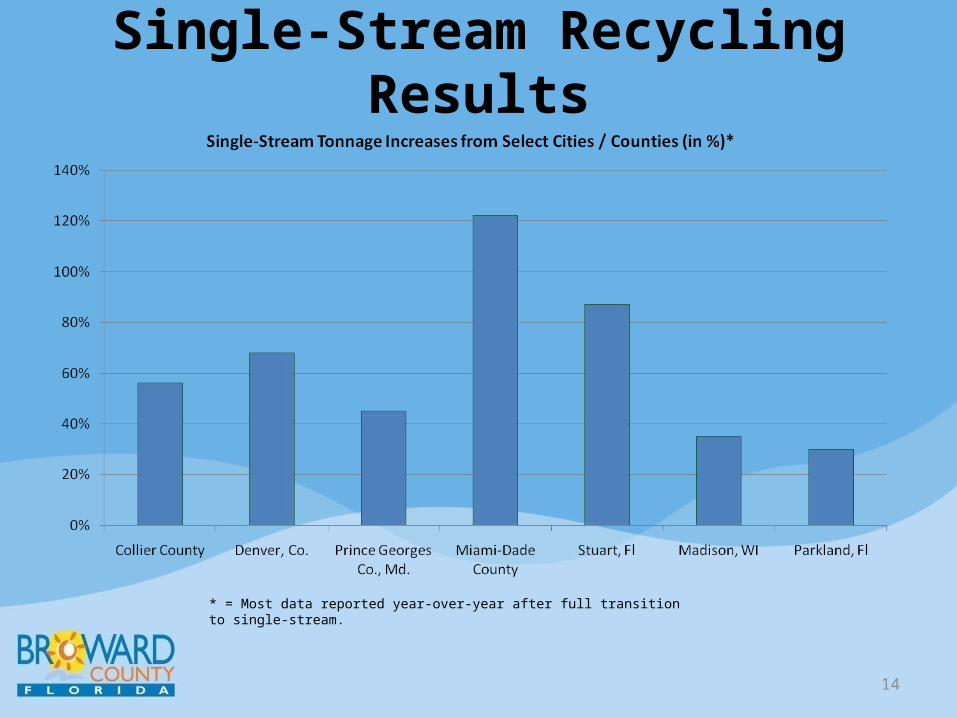
Single-Stream Recycling Results
14
* = Most data reported year-over-year after full transition to single-stream.

Environmental Benefits of Recycling
15
• Greenhouse gases (GHG) are emitted during product life-cycles, which include extraction, manufacturing and disposal.
• Recycling and waste reduction can be effective tools for reducing GHG by:o Reducing / eliminating
emissions from raw materials extraction.
o Reducing emissions from energy consumption during manufacturing.
o Increases carbon sequestration (paper recycling).
o Reducing methane emissions from landfills.
Illustration courtesy of U.S. EPA
Environmental Benefits of Recycling & Waste Reduction (cont.)
16
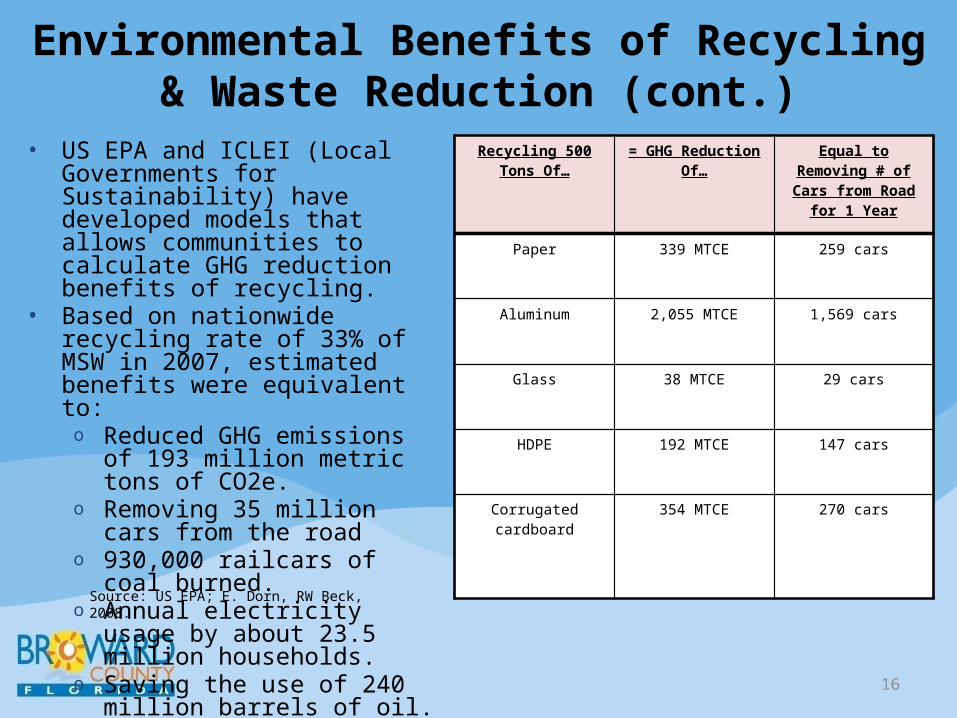
Recycling 500 Tons Of…
= GHG Reduction Of…
Equal to Removing # of Cars from Road
for 1 Year
Paper 339 MTCE 259 cars
Aluminum 2,055 MTCE 1,569 cars
Glass 38 MTCE 29 cars
HDPE 192 MTCE 147 cars
Corrugated cardboard
354 MTCE 270 cars
• US EPA and ICLEI (Local Governments for Sustainability) have developed models that allows communities to calculate GHG reduction benefits of recycling.
• Based on nationwide recycling rate of 33% of MSW in 2007, estimated benefits were equivalent to: o Reduced GHG emissions of 193
million metric tons of CO2e.o Removing 35 million cars from the
roado 930,000 railcars of coal burned.o Annual electricity usage by about
23.5 million households.o Saving the use of 240 million
barrels of oil.
Source: US EPA; E. Dorn, RW Beck, 2008.
Economic Benefits of Recycling
17
• Recycling is value-added, creating more jobs than disposal.
• According to national economic study in 2001, US recycling and reuse industry accounted for:o $236 billion in annual revenues.o 56,000+ recycling & reuse establishments.o Employment of 1.1 million with annual
payroll of $37 billion.• Florida study determined:
o $4.4 billion in annual revenues.o 3,700 recycling and reuse establishments.o Employment base of 32,000 with payroll
of $765 million.• Recyclables are commodities. (commodity
prices have been impacted by global recession)
Illustration courtesy of US EPA.

Conclusions• Recycling is a demonstrated
environmental protection success story with environmental and economic benefits.
• Environmental goals can seem abstract – recycling allows for hands-on and visible opportunity for citizens and businesses to help their environment.
• Is a “low-hanging fruit” for cities and counties to use to help reduce their carbon footprints. Uses infrastructure already in place.
• Recycling can be a “gateway” to other positive environmental behaviors.
18