Embed Size (px)
Citation preview

0 1992 Wiley-Liss, Inc. Cytometry 13:795-808 (1992)
REVIEW ARTICLE
Features of Apoptotic Cells Measured by Flow Cytometry
2. Darzynkiewicz', S. Bruno, G. Del Bino, W. Gorczyca, M.A. Hotz, P. Lassota, and F. Traganos
The Cancer Research Institute, New York Medical College, Valhalla, New York 10595 Received for publication March 27, 1992; accepted June 9, 1992
The present review describes several methods to characterize and differentiate between two different mechanisms of cell death, apoptosis and necrosis. Most of these methods were applied to studies of apoptosis triggered in the human leu- kemic HL-60 cell line by DNA topo- isomerase I or I1 inhibitors, and in rat thymocytes by either topoisomerase in- hibitors or prednisolone. In most cases, apoptosis was selective to cells in a par- ticular phase of the cell cycle: only S- phase HL-60 cells and Go thymocytes were mainly affected. Necrosis was in- duced by excessively high concentra- tions of these drugs. The following cell features were found useful to character- ize the mode of cell death a) Activation of an endonuclease in apoptotic cells re- sulted in extraction of the low molecular weight DNA following cell permeabiliza- tion, which, in turn, led to their de- creased stainability with DNA-specific fluorochromes. Measurements of DNA content made it possible to identify apo- ptotic cells and to recognize the cell cycle phase specificity of the apoptotic pro- cess. b) Plasma membrane integrity, which is lost in necrotic but not in apop- totic cells, was probed by the exclusion of propidium iodide (PI). The combination of PI followed by Hoechst 33342 proved to be an excellent probe to distinguish live, necrotic, early- and late-apoptotic cells. c) Mitochondria1 transmembrane potential, assayed by retention of rhoda- mine 123 was preserved in apoptotic but not necrotic cells. d) The ATP-dependent lysosomal proton pump, tested by the su- pravital uptake of acridine orange (AO)
was also preserved in apoptotic but not necrotic cells. e) Bivariate analysis of cells stained for DNA and protein re- vealed markedly diminished protein con- tent in apoptotic cells, most likely due to activation of endogenous proteases. Ne- crotic cells, having leaky membranes, had minimal protein content. f) Staining of RNA allowed for the discrimination of Go from G, cells and thus made it possible to reveal that apoptosis was selective to Go thymocytes. g) The decrease in for- ward light scatter, paralleled either by no change (HL-60 cells) or an increase (thy- mocytes) of right angle scatter, were early changes during apoptosis. h) The sensitivity of DNA in situ to denatur- ation, was increased in apoptotic and ne- crotic cells. This feature, probed by stain- ing with A 0 at low pH, provided a sensitive and early assay to discriminate between live, apoptotic and necrotic cells, and to evaluate the cell cycle phase specificity of these processes. i) The in situ nick translation assay employing la- beled triphosphonucleotides can be used to reveal DNA strand breaks, to detect the very early stages of apoptosis. The data presented indicate that flow cytom- etry can be applied in basic research on molecular and biochemical mechanisms of apoptosis, as well as in the clinic, where the ability to monitor early signs of apoptosis in samples from patients' tu-
'Address reprint requests to Dr. Zbigniew Darzynkiewicz, The Can- cer Research Institute, New York Medical College, 100 Grasslands Road, Elmsford, NY 10523.
Reprinted with permission of Cytometry Part A, John Wiley and Sons, Inc.

796 DARZYNKIEWICZ ET AL.
mors may be predictive of the outcome of some treatment protocols. 0 1992 Wiley-Liss, Inc.
Key terms: Programmed cell death, DNA topoisomerases, DNA degradation, mito- chondria, lysosomes, chromatin
I. APOPTOSIS, PROGRAMMED CELL DEATH, AND NECROSIS
The term apoptosis is used to describe the character- istic mode of cell death common to various cell types and often triggered by diverse environmental stimuli (2,36,37,59,60). During this process, a cascade of spe- cific biochemical events, the most prominent of which is the activation of an endogenous endonuclease that has affinity for internucleosomal (spacer) DNA re- gions, is paralleled by specific morphological changes in both the cell nucleus and cytoplasm (59,60). Exten- sive literature exists regarding morphological, bio- chemical and molecular changes that occur during apoptosis (reviews 2,25,36,53,59,60).
The term programmed cell death is often used inter- changeably with apoptosis. Mechanisms involved in programmed cell death and apoptosis, although similar in many respects, are not identical, and the terms are not synonymous (reviewed in 41). The interest in these mechanisms stems from the fact that they play a key role in tissue and organ development during embryo- genesis (30,411, regulation of immune responses (27,431, or natural death of differentiated cells a t the end of their lifespan (41,42,47).
In oncology, the interest in apoptosis originates from the observations that ionizing radiation or interactions of antitumor drugs with their respective intracellular targets often result in this mode of cell death, and that the efficacy of several antitumor drugs correlates with their ability to induce apoptosis (5,25,35,38,50,55). The possibility, therefore, of modulating this process can open new strategies for improving chemotherapy. Also, the ability to monitor early signs of apoptosis in sam- ples from patient tumors may be predictive of the out- come of treatment protocols.
In contrast to apoptosis, or programmed cell death, necrosis is a nonspecific mode of cell death, often caused by excessively high concentrations of toxic agents (36,40,46,53). Necrosis, occurring as the result of rapid cell poisoning, is characterized by swelling of mitochondria and immediate loss of plasma membrane integrity.
Several attempts to distinguish apoptotic cells by flow cytometry were reported (1,10,11,26,44,49,51,52, 56,58). In nearly all these studies, decreased DNA stainability with different f luorochromes has been pro- posed as a marker of apoptotic cells. In the most ex- haustive studies, Telford et al. (51) compared several DNA fluorochromes with respect to their ability to stain DNA in apoptotic cells. They observed that the stainability of apoptotic cells with each of the dyes studied was diminished to a similar degree, compared to normal cells, regardless of the mechanism of binding
of the dye to DNA (intercalation, involving different unwinding angles or binding to the minor grove of the double helix).
In the course of our studies on the mechanism of action of DNA topoisomerase type I or type I1 inhibi- tors, we observed that the DNA topoisomerase I inhib- itor camptothecin (CAM) or certain inhibitors of DNA topoisomerase I1 (teniposide, TN; m-AMSA; Fostriecin, FST; Genistein, GEN), induce apoptosis of cells of hu- man myelogenous leukemic HL-60 or KG1 lines (20- 24,31,32). We have also investigated apoptosis of ra t thymocytes triggered by topoisomerase inhibitors as well as by the glucocorticoid hormone prednisolone (6,7). In both cases, we observed that apoptosis is se- lective to cells in particular phases of the cell cycle, namely to S phase cells in the case of myelogenous leukemias (21) and to Go cells in the case of thymocytes (7). By applying a variety of flow cytometric techniques designed to analyze diverse metabolic features of the cell, we were able to characterize the changes that ac- company this process. In this article, we review these results and provide additional observations related to this subject. We also compare our results with obser- vations of others, on other cell systems. Most data per- taining to materials and methods were presented in our recent publications (6,7,20 -24,3 1,321, although some details are presently included in the legends to figures.
11. INDUCTION OF APOPTOSIS OR NECROSIS Exponentially growing HL-60 cells were exposed to a
wide range of concentrations of CAM, TN, m-AMSA, FST, or GEN, as described in detail elsewhere (6,7,20- 24,31,32). At certain concentrations of CAM, TN, or m-AMSA, a selective decrease of DNA stainability in S-phase cells was observed as early as 2 h after addi- tion of the drugs; the drugs had no significant effect on cells in GI, G2, or M phases of the cell cycle (20,22). On the other hand FST and GEN caused apoptosis of HL- 60 cells in all phases of the cycle (32,54). The same cells (HL-60), as well as the human lymphocytic leukemic MOLT-4 cell line, treated with excessively high con- centrations of the drugs, served as a model of necrotic death (31,321. Another model of apoptosis were thymo- cytes isolated from the thymus glands of 2-4 weeks old Sprague-Dawley rats, treated in culture with 5 pM prednisolone, 0.15 pM CAM or 1 pM TN. In this cell system, the decrease of DNA stainability was also ob- served after 2 h of treatment, though the treatment was selective for Go cells (7). In both cases, the endo- nucleolytic activity triggered by the drugs resulted in typical fragmentation of DNA into sections of the size
Reprinted with permission of Cytometry Part A, John Wiley and Sons, Inc.

APOPTOTIC CELL FEATURES 797
M C t P C T
A
M C t C
B FIG 1. Agarose gel electrophoresis of DNA extracted from rat thy-
mocytes (A) or human myelogenous leukemic HL-60 cells (B). A: thy- mocytes were incubated in cultures either in the absence of any drugs (Control, Ct), or in the presence of 5 pM prednisolone (PI, 0.15 KM camptothecin (C), or 1 (LM teniposide (TI for 6 h. The three lowest bands on the molecular weight marker lane (MI represent DNA of MW equivalent of 4,631,2,322, and 2,027 base pairs, respectively (for details, see 7). B: HIJ-60 cells, untreated, growing exponentially (Con- trol, Ct), or treated for 4 h with 0.15 pM camptothecin (C). The three lowest bands on the M lane represent DNA of MW equivalent of 2,322, 2,027, and 564 base pairs, respectively. For details, see (22). Note the typical “ladder” pattern of DNA extracted from the drug treated cells, which indicates the presence of DNA fragments of the size equivalent to single nucleosomes or oligonucleosomes. This pattern is character- istic of the DNA of apoptotic cells.
equivalent of individual nucleosomes or oligonucleo- somes (Fig. 1).
111. DNA CONTENT (STAINABILITY) It has been recognized independently in several lab-
oratories that apoptotic cells have reduced DNA stain- ability following staining with a variety of fluoro- chromes (1,10,11,44). Therefore, the appearance of cells with low DNA stainability, lower than that of G, cells (“sub-GI peak,” “AO cells”) in cultures treated with var- ious drugs, has been considered to be the marker of cell death by apoptosis. It was unresolved, however, whether the reduced DNA stainability represented a decrease in DNA content (as a result of activation of
the apoptosis-specific endonuclease) or a change in DNA conformation and accessibility to the dyes. In nearly all these studies, the authors interpreted the observed decrease in DNA stainability as representing a change in DNA accessibility to fluorochromes rather than loss of cellular DNA.
However, several observations, as summarized be- low, indicate that the observed reduced DNA stainabil- ity in apoptotic cells is a consequence of partial loss of DNA from these cells due to activation of an endoge- nous endonuclease and subsequent diffusion of the low molecular weight DNA products from the cell, prior to cell measurement:
1. The change in DNA accessibility to the dyes as a result of the change in structure of nuclear chromatin of apoptotic cells is expected to be reflected in differ- ences in the accessibility of particular dyes, depending on their mechanism of binding to DNA, as has been observed in other cell systems (17,29). Yet, there is striking concordance in the degree of reduction of DNA stainability in apoptotic cells with different fluoro- chromes (51). Furthermore, the chromatin structure of the fragmented nuclei of apoptotic cells (i.e.7 the pres- ence of all histones, HMG proteins, etc.) is not much changed compared to that of the cells prior to apoptosis (2).
2. In the most detailed biochemical studies on chro- matin of apoptotic cells, Arends et al., (2) have ob- served that whereas the DNA content of unfixed apo- ptotic cells is unchanged compared to normal cells, cell lysis (detergent treatment) released low molecular weight DNA, some of it associated with free mononu- cleosomes or oligonucleosomes. Over 30% of DNA in apoptotic cells was not associated with the nuclear frac- tion and could not be sedimented by centrifugation at 100 g but sedimented at 27,OOOg (2). A large portion of DNA in apoptotic cells, thus, is of a low molecular weight and is expected to dissociate from cells which are permeabilized by detergents or fixed by ethanol, prior to staining and measurement by flow cytonietry.
3. In our studies on either HL-60 cells or thymo- cytes, we noticed that the decrease in DNA stainability of apoptotic cells was markedly enhanced if, following fixation or permeabilization by detergent, and prior to cell measurement, the cells were left in suspension for an extended period of time. Thus, for example, when the apoptotic cells were fixed in cold ethanol (-20°C), centrifuged, immediately stained (at 0-4°C) with DAPI, and their fluorescence measured shortly after staining, the difference in DNA stainability of normal and apoptotic cells was minimal, and often undetected. However, if the same cells were kept suspended in PBS at 24-37”C, for longer than 5 min prior to their mea- surement, a decrease in the fluorescence of apoptotic cells stained with DAPI was clearly evident (Fig. 2). The decrease was more pronounced when the cells were maintained in PBS prior to staining for longer periods of time, or were exposed to higher temperatures. Fur-
Reprinted with permission of Cytometry Part A, John Wiley and Sons, Inc.

798 DARZYNKIEWICZ ET AL.
900
G, = 46.6
G,M = 16.1 s = 48.2
c- 600
5 5 0 0 z
B 480
G, = 23.2 s = 58.0
G,M = 18.8
DNA Content
FIG. 2. DNA content frequency histograms of HL-60 cells, un- treated (A) and treated with 100 +g/ml of Genistein (GEN) for 4 h (B and C). The cells were either stained immediately following fixation at 0°C with DAPI (19,221, and measured by flow cytometry (A and B); or, after fixation, were suspended in Hanks' buffered saline and main-
thermore, the presence of low molecular DNA, of the size equivalent of mononucleosomes, was detected in the PBS in which the apoptotic cells were suspended following fixation in ethanol or permeabilization with Triton X-100 (Lassota et al., in preparation).
4. Observation of apoptotic cells stained with DAPI and sulforhodamine 101 under the U.V. light micro- scope revealed that DNA was in two compartments (Fig. 3B). One of these compartments were fragmented nuclei, appearing as granules of different sizes, strongly and uniformly stainable with DAPI. In con- trast to normal nuclei, no distinct chromatin structure in these granules was evident. The chromatin in these granules was highly condensed and the DNA, when stained with hematoxylin, showed hyperchromicity (not shown). DNA in the second compartment appeared in a dispersed form, outside the granules. Its presence could be inferred from the blue fluorescence component of the cytoplasm, which was evident in apoptotic cells outside the nuclear fragments, and was not apparent in normal cells (Fig. 3A). The uniformity of the blue hue of the cytoplasm of these cells suggested that this DNA was evenly dispersed outside of the granules. When apoptotic cells fixed on slides were subsequently rinsed for over 10 min in PBS prior to staining with DAPI and sulforhodamine 101, the blue fluorescence component in the cytoplasm was no longer apparent (Fig. 3C).
5. I t has been shown that a t later stages of apoptosis, so called apoptotic bodies (fragments of the cell inte- rior, including DNA, enveloped in plasma membrane) detach from the cell (36,37). Their release is thus ex- pected to reduce cellular DNA content as well.
Considering the above observations, the most likely explanation for the reduced stainability of apoptotic cells with DNA-specific dyes is not the change in DNA accessibility to the dyes, but its progressive loss from
C ' ' ' '
3,01 r G, = S =
GEM = 840
200
1 6 0
120
4 0
0 0 32 64 96 128 160 19B
DNA Content ~~~ ~.~
DNA Content
25.9 54.3 19.8
I_
284 e:
tained at 37°C for 20 min prior to staining and measurement (C). GEN induces apoptosis of HL-60 cells (54). Note that the position of apo- ptotic cells (Ap) was shifted to lower DNA content values when the cells were maintained in suspension prior to measurement, sugges- tive of DNA extraction from these cells.
these cells. At early stages of apoptosis, this loss occurs predominantly following cell fixation, or during perme- abilization with detergents. The course of events lead- ing to DNA extraction from apoptotic cells can thus be visualized as follows: Initially, activation of a n endo- nuclease in cells undergoing apoptosis cleaves DNA between nucleosomes. Free, single nucleosomes or small oligonucleosomes may then diffuse outside the nucleus or nuclear fragments (chromatin granules), but cannot leave the cell because the integrity of the cell membrane is still preserved. These nucleosomes cannot be irreversibly immobilized by fixation (e.g., in ethanol), or retained in the cells after their permeabil- ization with detergents. Following fixation, when the cells are rinsed, these free nucleosomes diffuse out of the cell. The portion of DNA remaining in apoptotic cells after their permeabilization and rinsing most likely represents fragments of DNA loops still attached to the nuclear matrix and long stretches of nucleo- somes which cannot be extracted under these condi- tions.
Thus, apoptotic cells can be recognized by their diminished stainability with DNA specific f luoro- chromes, such as propidium iodide (PI), DAPI, acridine orange (AO), or Hoechst dyes, due to DNA degradation and its subsequent leakage from the cell. Because the degree of DNA leakage can be manipulated by the ex- tent of cell washing after fixation (or permeabiliza- tion), it is possible to adjust DNA content of apoptotic cells (position of the "sub-G, peak' on the DNA fre- quency histograms) so that their overlap with cells that do not undergo apoptosis is minimal and separation between these two populations is adequate (e.g., Fig. 2C vs. 2B).
In contrast to apoptotic cells, necrotic cells generally do not show an immediate reduction in DNA stainabil- ity (Fig. 4). Thus, the discrimination between normal
Reprinted with permission of Cytometry Part A, John Wiley and Sons, Inc.

APOPTOTIC CELL FEATURES 799
a b C
d e f
g h FIG. 3. U.V. light photography of HL-60 cells stained with DAPI
and sulforhodamine 101 or AO. a: Untreated cells were cytocentri- fuged, fixed in 70% ethanol, air dried, and stained with DAPI and sulforhodamine 101 to differentially stain DNA and protein (22). b: Cells treated with 0.15 p,M of camptothecin for 4 h and stained as a. c: Cells treated with camptothecin (as b) and stained as a and b, except that following fixation and prior to staining the cells were suspended in HBSS for 20 min. Note the loss of the blue component of the cytoplasmic fluorescence of apoptotic cells in c, compared to b, which suggests that DNA that is evenly dispersed in the cytoplasm of these cells is extracted with HBSS. d The cells treated with 0.15 p,M of camptothecin for 4 h had their DNA and RNA differentially stained with A 0 (13); DNA (double stranded) stains green, RNA and single stranded DNA, red; overlap of the cytoplasm (RNA) over and under nucleoplasm (DNA) contributes to the nuclear yellow fluorescence. Some apoptotic cells (with fragmented nuclei) appear to have un-
i changed RNA content. e: The cells were treated with 1 mM fostriecin for 4 h (i.e., under conditions that induce necrosis) and stained with A 0 (as in d); a typical necrotic cell with damaged plasma membrane is in the center. f, g: Cells from untreated cultures, with their DNA partially denatured by acid and stained with A 0 to differentially stain double stranded (green) and denatured (red) DNA. Note that DNA of mitotic cells (metaphase and telophase) stains more intensely red and has lower green fluorescence than that of the interphase cells. Spontaneous apoptosis occasionally occurs in control HL-60 cultures, the nucleus of such a cell is seen in g; initial chromatin condensation on the periphery of the nucleus is then followed by nuclear fragmen- tation. h: The cells were treated with 0.15 pM camptothecin for 4 h and stained as in f and g. Note more extensive DNA denaturation in fragmented nuclei of the apoptotic cells than in the normal interphase nuclei. i: The cells were stained as in f and g; note the increased DNA denaturation (red luminescence) in the typical necrotic cell.
live- and necrotic- cells is impossible based on single- parameter DNA content analysis alone.
ptotic cells, thus, exclude "viability assay" dyes such as trypan blue or PI (22). This is in contrast to cell necro- ~.
sis, where one of the earliest changes is loss of mem- brane function and its structural intern-itv (40). Bv IV- I"J3XXtITY OF THE PLASMA RIEMBRANE
- . I , . I
The integrity of the plasma membrane of cells un- dergoing apoptosis is preserved and most functions of the membrane remain unchanged (2,37,59,60). Apo-
their ability to exclude PI, apoptotic cells can be erro- neously classified by flow cytometry as viable cells.
The assay of cell viability based on simultaneous cell
Reprinted with permission of Cytometry Part A, John Wiley and Sons, Inc.

800
e 3
240.. e -
DllRZYNKIEWICZ ET AL.
A
4Eor G, ’ ’ FSTO ’ pM
0 32 6.
G, = 39.5 s = 46.7
G,M = 13.8
*TA Content
B 400 , -
AP’ FST 140 pM
300..
250..
200. .
1 5 0 ~ ~
100.-
5 0 ~ .
0 0’’
G, = 450 s = 475
G,M = 6 7
DNA Content
C 780
640
G, = 437 S = 44.1
G,M = 12.3
560
4 8 U
400
320
240
160
80
0 0 3P 64 96 188 160 IS2 824 2,
DNA Content
FIG. 4. DNA content of apoptotic and necrotic cells. DNA frequency histograms (after staining with DAPI) of HL-60 cells, untreated (A), treated with 140 (LM fostriecin for 6 h, which induces apoptosis (B) and 1.1 mM fostriecin, a concentration at which the cells rapidly become necrotic (C). Note no change in DNA content of necrotic cells, compared to control, which contrasts to apoptotic (Ap) cells (for details, see 31,321.
staining with PI and Hoechst 33342 (HO 3421, e.g., as proposed by Pollack and Ciancio (43, provides a means to discriminate between live versus apoptoti,c versus necrotic cells (Fig. 5). In this method, the cultured cells are first exposed to PI. This dye is excluded by the cells that have their plasma membrane integrity preserved, but i t stains DNA in the cells that have damaged mem- branes. Subsequent staining of cells with HO 342 re- sults in a situation in which the red fluorescence (PI) of the dead cells is higher than that of live cells, and conversely, the blue fluorescence (HO 342) of live cells is higher than that of dead cells. DNA stainability with each of these dyes, respectively, is proportional to DNA content, which allows one to determine the cell cycle positions of cells in both the live and dead cell popula- tions (45).
When this method was applied by us to the analysis of apoptotic cells (22) it became apparent that HO 342 DNA stainability in these cells was reduced, reflecting, as already discussed, endonuclease-triggered DNA loss (Fig. 5). Yet, for a significant period of time (4-6 h) the apoptotic cells were still able to exclude PI and there- fore their red fluorescence was minimal, i.e., similar to that of DNA in live cells, With time, DNA in apoptotic cells started to stain with PI, though, as with their blue fluorescence, the red fluorescence was also reduced compared to truly viable cells. Necrotic cells showed reduced HO 342 stainability though their PI fluores- cence was not reduced as in the case of apoptotic cells. Thus, this method offers an attractive assay to differ- entiate between live, apoptotic and necrotic cells, and as well as to recognize early and late stages of apoptosis based on the difference in membrane permeability to PI (22).
Kubbies (39) applied this method to human lympho- cyte cultures treated with X-rays, mitomycin C , or bleomycin. In his studies, the stainability of apoptotic
lymphocytes with HO 342 was similar to that of HL-60 treated with DNA topoisomerase inhibitors (22; Fig. 5). In contrast to apoptotic cells, the intensity of red fluo- rescence of necrotic cells was high, reflecting un- changed DNA content in these cells (39). Most recently, Dive et al. (26), using similar methodology, studied apoptosis of rat thymocytes, Burkitt lymphoma and ra t hepatoma cells treated with methylprednisolone, anti- immunoglobulin, or cis-platin. The authors (26) were able to identify live, apoptotic and necrotic cells within all three cell types, based on the differences in their stainability with HO 342 and PI.
Because of the difference between apoptotic and ne- crotic cells in the integrity of their plasma membrane, preincubation with a mixture of trypsin (0.25%) and DNase I (200 pgiml) results in total dissolution and loss, from the cell suspension, of necrotic and late apo- ptotic cells, which cannot exclude these enzymes (19). In contrast, live and early apoptotic cells exclude trypsin and DNase I and remain in the suspension fol- lowing incubation with these enzymes. Such treat- ment, therefore, applied prior to cell fixation and mea- surements by flow cytometry, by eliminating the necrotic and late apoptotic cells, can ensure that only live and early apoptotic cells are analyzed.
V. MITOCHONDRIAL TRANSMEMBRANE POTENTIAL
No marked changes in energy metabolism were ob- served in apoptotic cells (36,37). Actually, apoptosis is an energy requiring process, and in many instances de novo protein synthesis is needed for apoptosis to occur (8,9). The morphology of mitochondria of apoptotic cells also remains unchanged (36,37). This is in contrast to necrosis, where mitochondria1 swelling is one of the earliest changes (36,401.
The ability of mitochondria to maintain their trans-
Reprinted with permission of Cytometry Part A, John Wiley and Sons, Inc.

APOPTOTIC CELL FEATURES 801
B CAM
DO'
0 20 40 60 80 0 20 40 60
Propidium Iodide FIG. 5. Stainability of untreated (A) and CAM-treated (B) cells
with Hoechst 33342 and PI. The cells were first exposed to PI, then permeabilized and stained with Hoechst 33342 (HO 342; 22,45). In this assay, the cells with undamaged plasma membranes exclude PI and stain predominantly blue with HO 342, whereas cells that cannot exclude PI have more intense red fluorescence and proportionally lower blue fluorescence (45). Note that live cells from the untreated cultures (A) stain strongly with HO 342, in proportion to their DNA
membrane potential (electronegativity of the mito- chondrial interior), which can be assayed by retention of the cationic probe, rhodamine 123 (R 123) (15,33,57) is preserved in apoptotic cells (22). Thus, this dye can be used to discriminate between cells dying by apopto- sis versus necrosis (Fig. 6). Simultaneous staining with R 123 and PI makes it possible to distinguish cells ex- cluding PI from cells that have a damaged plasma membrane, and thus to evaluate the mitochondria1 transmembrane potential of the former.
VI. LYSOSOMAL PROTON PUMP Supravital cell stainability with A 0 observed at low
concentration of this dye (1-5 FM) and appearing as red luminescence, is a reflection of the activity of the proton pump of lysosomes (reviewed in 13). The uptake of AO, which is a weak base, is due to the low pH inside these organelles. Namely, the cell membrane is perme- able to the uncharged form of A 0 and the dye can pen- etrate into lysosomes. Once inside, the dye becomes protonated as a result of the high proton concentration, and therefore entrapped in these organelles (13). Accu- mulation of A 0 is predominantly determined by the p H gradient across the membrane of these lysosomes, which is maintained by the ATP-dependent proton pump (13).
The ability of apoptotic cells to accumulate A 0 in lysosomes is not markedly changed (22; see Fig. 7). This would indicate that, during apoptosis, the ATP- dependent proton pump is not significantly affected. Necrotic cells, on the other hand, tend to lose their
I
content, and have low PI fluorescence. The cells that undergo apo- ptosis (6 h treatment with 0.15 pM camptothecin), a t first (during the initial 2-6 h), show diminished HO 342 fluorescence and low PI flu- orescence (Apl), indicating that they still exclude PI. With time (after 6 h), apoptotic cells stain more with PI and less intensely with HO 342 (Ap2). Necrotic cells (N) have unchanged DNA content and would stain more intensely with PI than with HO 342 (not shown, but their position is indicated by the broken outline).
ability to concentrate A 0 in lysosomes resulting in minimal A 0 red luminescence (Fig. 7).
VII. PROTEIN AND RNA CONTENT Differential staining of DNA and protein with DAPI
and sulforhodamine 101 reveals that apoptotic cells have, in addition to lowered DNA content, markedly diminished protein content (Fig. 8). When apoptosis was induced in HL-60 cells or thymocytes by various drugs, including DNA topoisomerase I or I1 inhibitors, the decrease in protein content was observed to occur simultaneously with a decrease in DNA content (21- 24). Thus, during apoptosis the endonucleolytic activ- ity was paralleled by proteolysis which was suggestive that these two processes may be coupled. Indeed, in subsequent studies, we observed that suppression of intracellular proteolysis by small molecular weight in- hibitors of serine proteinase(s) prevented DNA degra- dation and apoptosis in HL-60 cells (6) and rat thymo- cytes (7). These results indicated that proteolysis is necessary for DNA degradation to progress, and pro- vided evidence that the nucleolytic and proteolytic steps may indeed be coupled (6,7). Simultaneous stain- ing of DNA and protein, therefore, by revealing a de- crease in the content of both these constituents during apoptosis, made it possible to investigate a correlation between these processes (6,7).
Because the plasma membrane of necrotic cells is leaky, the protein content of these cells is also reduced (data not shown). However, since the DNA content of necrotic cells is not markedly altered compared to live
Reprinted with permission of Cytometry Part A, John Wiley and Sons, Inc.

DARZYNKIEWICZ ET AL.
100
0 a, c80 Q 0 v) Q 60 L
2 G 40
C
E 2 0 c3
0
802
1CQ
80
( 3 6 0 cv K 4 o
7
20
0
100 . 100
CAM 6 h 80
CAM 4 h 80
CAM 0 h '
60 60
40 40
20 & 2o 8 . ' 0 - O &
A I
0 20 40 60 80
B rp'
9 CAM
C
20 40 60 8 0 0 20 40 60 80 loo
Propidium Iodide
FIG. 7. Supravital uptake of A 0 by HL-60 cells, untreated (CAM 0 h) or treated with 0.15 pM camptothecin (CAM) for 4 and 6 h. The red luminescence represents the accumulation of A 0 in lysosomes due to an active proton pump (13,221. Treatment with camptothecin, which
cells, the DNNprotein ratio of necrotic cells is higher than that of live, or apoptotic cells. This ratio, there- fore, in combination with total DNA content, may also be used as a marker discriminating between live, ne- crotic and apoptotic cells.
It is difficult to estimate RNA content of apoptotic cells because simultaneously with the possible loss of RNA, there is a change in the conformation of DNA. Since both RNA probes, A 0 (18) as well as pyronine Y (PY), cannot easily discriminate between RNA and sin- gle stranded DNA (14), an increase in the proportion of denatured (single-stranded) DNA can compensate for loss of RNA. The data presented in Fig. 9 indicate that, indeed, the proportion of denatured DNA is increased in apoptotic cells. Namely, Go thymocytes, prior to apoptosis, have minimal RNA content and thus low red
induces extensive apoptosis, has little effect on the uptake of AO; over 95% of the cells remain within population A following 4 or 6 h expo- sure to the drug, with only a few cells losing the ability to accumulate the dye in lysosomes (population B) (for details see 22).
luminescence. During apoptosis, these cells are char- acterized by increasing red luminescence in proportion to a decrease in their green fluorescence (Fig. 9; see the negative correlation between green and red lumines- cence of apoptotic cells). The increased red lumines- cence of DNA stained with A 0 in fragmented nuclei of apoptotic cells, compared to intact nuclei, is also evi- dent in the micrograph shown in Fig. 3D. Some dena- turation of DNA in apoptotic cells, thus, is apparent. Therefore, during apoptosis, the increase in the propor- tion of single stranded DNA can obscure the possible loss of RNA since both stain similarly (red) with AO.
These data appear to be at odds with observations of Arends et al., (92) who reported that the degree of DNA denaturation in apoptotic cells is minimal. However, the dyes used to stain RNA (48) or single stranded
Reprinted with permission of Cytometry Part A, John Wiley and Sons, Inc.

APOPTOTIC CELL FEATURES 803
n :L 20 0
0 20 40 60
Protein 0 20 40 60
Protein
FIG. 8. Bivariate, DNA, and protein content distribution of HL-60 cells, untreated (Control) and treated with 0.15 p M camptothecin for 4 h (CAM). The cells were stained with DAPI and sulforhodamine 101; their DNA frequency histograms are included in the respective inserts. Note that the appearance of apoptotic cells (Ap) coincides with
a loss of cells from S phase of the cell cycle, which indicates that S phase cells selectively undergo apoptosis (22). A decrease in DNA content in these cells is paralleled by a decrease in their protein con- tent.
FIG. 9. Apoptosis of rat thymocytes induced by prednisolone (PRED), camptothecin (CAM) or teniposide (TN). Freshly isolated rat thymocytes were incubated either with 5 p M prednisolone, 0.15 p M camptothecin or 3 pM teniposide for 4 h. Their DNA and RNA was then differentially stained with A 0 (6,7,18). Based on differences in RNA content it is possible to discriminate between Go and G, cells.
DNA ( A 0 or PY), by virtue of their high affinity to single stranded regions, are themselves capable of po- tentiating the degree of DNA denaturation (14). This staining pattern, therefore, may reflect the increased sensitivity of DNA to denaturation (see further) rather than the mere presence of single stranded DNA sec- tions.
As with protein content, RNA content of necrotic cells is minimal, due to the efflux of RNA resulting from the loss of plasma membrane integrity (not shown).
Simultaneous measurement of cellular DNA and RNA, when applied in studies of apoptosis, offers one significant advantage. Namely, RNA content allows
RNA The appearance of apoptotic cells with reduced DNA content (Ap) coincides with the selective loss of Go cells. This indicates that, unlike in the case of HL-60 cells where S phase cells selectively undergo apoptosis, apoptosis of thymocytes regardless of the inducer (PRED, CAM or TN) was preferential to Go cells (7).
one to discriminate Go cells from GI cells (16,181. Therefore, the method can be used to reveal whether Go or G, cells are selectively affected. An illustration of this approach is presented in Fig. 9. The data shown in this figure, (and published in greater detail elsewhere; 7) clearly indicate that when thymocytes are treated with prednisolone or CAM, apoptosis is selective to Go cells; G,, S and G2 cells remain unaffected by the treat- ment. Because RNA content is measured prior to apo- ptosis or in those cells that do not undergo apoptosis, the problems with denatured DNA stainability, as dis- cussed above, do not apply in this case. The method, thus, can be very useful to elucidate the cell cycle spec- ificity of the drugs that induce apoptosis.
Reprinted with permission of Cytometry Part A, John Wiley and Sons, Inc.

804
lOOb , . . . I , . , . r . ....... . . . I . . . . , , ...... 100 10' 102 10) 1
DARZYNKIEWICZ ET AL.
CAM, 2 h
I , ,,,,(, . , , ,,,,,, , , , . * ,.., , , , ....
CAM, 3 h I , 1 o2 1 oa 10'10~ 10' 10' 1 o3 10' lo '
Forward Light Scatter FIG. 10. Changes in light scatter properties of HL-60 cells treated wilh 0.15 pM camptothecin for 2 and
3 h. Treatment with camptothecin induces apoptosis in approximately 35-40% of the cells (S-phase cells). The initial decrease in forward light scatter of the cells which undergo apoptosis after 2 h of the treatment (Apl), is followed by an even more dramatic change in their ability to scatter light at right angles after 4 h (Ap2).
VIII. LIGHT SCATTER Changes in the morphology of cells undergoing apo-
ptosis affect their light scattering properties (Fig. 10). In the case of HL-60 cells, the earliest change was ob- served 2 h after exposure to CAM, i.e. prior to a change in DNA content (Gorczyca et al., in preparation). Ini- tially, a decrease in forward light scatter was apparent, with no change in the intensity of the right angle scat- ter signal (Apl population). After 3 h, a decrease in both forward and right angle scatter were evident (Ap2). Cell death by necrosis results in an immediate decrease of the forward and right angle scatter signals (Gorczyca et al., in preparation).
The decrease in forward light scatter was also ob- served by Swat et al., (49) in the case of thymocytes triggered to undergo apoptosis by prednisolone. In the latter cell system, this decrease was paralleled by an increase in right angle scatter, most likely reflecting condensation of chromatin and fragmentation of nuclei (49). These authors have also observed the appearance of apoptotic bodies as separate particles with low light scatter properties (49). Most recently, Dive et al., (26) have combined cell staining with HO 342 and PI, as described above, with light scatter measurements of the same cells. This allowed them to correlate the light scatter changes and stainability with PI and HO 342 of thymocytes, Burkitt lymphoma, and hepatoma cells undergoing apoptosis. The decrease in forward light scatter and a minor increase in right angle scatter was typical of cells which had reduced stainability with HO 342 (26).
The major advantage of the detection of apoptotic cells by their altered light scatter properties is the pos- sibility of combining this method with their surface
immunofluorescence analysis. As demonstrated by Swat et al., (49) this approach allows one to identify subtypes of lymphocytes that selectively undergo apo- ptosis following specific treatments. This analysis can also be combined with live cell sorting.
IX. SENSITIVITY OF DNA IN SITU TO DENATURATION
The metachromatic dye A 0 can differentially stain double stranded and denatured DNA in cells or cell nuclei (14). The dye intercalates into double stranded DNA and, when bound in this form, fluoresces green. A 0 can also condense the denatured sections of DNA and in the condensed form A 0 luminesces red (14). The ratio of red to total (red plus green) cell luminescence (at; see ref. 12) represents the proportion of denatured DNA in the cell. When the measurements are stan- dardized, the sum of intensities of green and red lumi- nescence (LbJ is proportional to total DNA content (12). This method, therefore, can be applied to evaluate the sensitivity of DNA to denaturation. The cells are fixed, treated with RNase to remove any RNA which can obscure DNA stainability, treated with heat or acid to partially denature DNA, and stained with AO, as described in detail elsewhere (12). In earlier studies, we (12) and others (4) have observed that DNA in con- densed chromatin, such as in the case of mitotic or Go cells, is much more sensitive to denaturation than is DNA in interphase cells (see Fig. 3F,G). Therefore, the method can be used to identify these cells by flow cy- tometry.
The DNA of apoptotic and necrotic cells shows mark- edly increased sensitivity to denaturation, higher even than the DNA of mitotic cells (32; Figs. 3E-I, 11). Ac-
Reprinted with permission of Cytometry Part A, John Wiley and Sons, Inc.

APOPTOTIC CELL FEATURES
HL-60
805
20 40 60
i n t
0 20 40 60 80 100
1 mM I
20 40 60 80 100
MOLT-4
100 pM
0 20 40 60 80 100 0 20 40 60 80 100
FIG. 11. Sensitivity of DNA in situ to denaturation in apoptotic or necrotic HL-60 and MOLT-4 cells. HL-60 cells were treated with 100 p,M fostriecin, which induces apoptosis, or 1 mM fostriecin, which causes necrosis (31,32). MOLT-4 cells when treated with either 100 p,M or 1 mM fostriecin undergo necrosis (32). DNA sensitivity to de- naturation was assayed by exposure of the RNase-treated cells to 0.1 M HCl followed by staining with A 0 at pH 2.6. Under these condi- tions double stranded DNA sections stain green whereas denatured DNA stains red. Total cellular luminescence (green plus red) is pro- portional to total DNA content; a,, the ratio of red to total lumines-
tually, the data, when plotted as bivariate distribu- tions of total cell luminescence (L,J versus a, reveal both the total DNA content and the fraction of DNA that is denatured. This approach, thus, provides a sen- sitive and early assay to discriminate between viable, apoptotic and necrotic cells. Viable interphase cells have low at values and high Ltot (proportional to their DNA content). Apoptotic cells are characterized by very high at and diminished LtOt, reflecting DNA deg- radation. Necrotic cells also have highly increased at values, but their L,, is higher than that of apoptotic cells (32). Necrotic cells, however, overlap, in their at and L,, values with mitotic cells.
The assay of DNA in situ sensitivity to denaturation allows one not only to identify apoptotic or necrotic cells, but also to correlate these processes with the po- sition of cells in the cell cycle, as illustrated in Figure 11.
X. IN SITU NICK TRANSLATION Jonker e t al. (34) have recently reported that a non-
radioactive in situ nick translation assay (3) can be applied to detect DNA strand breaks in apoptotic cells.
cence, represents the fraction of denatured DNA (12). DNA frequency histograms (after staining with DAPl) of the cells from respective cultures are included in the insets. Apoptotic cells can be distin- guished by their increased a, values and reduced total luminescence. Necrotic cells have increased a, and only slightly lowered total lumi- nescence. This method allows one to correlate sensitivity of DNA to denaturation with cell position in the cycle. For example, the increase in a, of MOLT-4 cells observed at 100 pM FST is preferential to G, and late S indicating that these cells are more sensitive to FST (32).
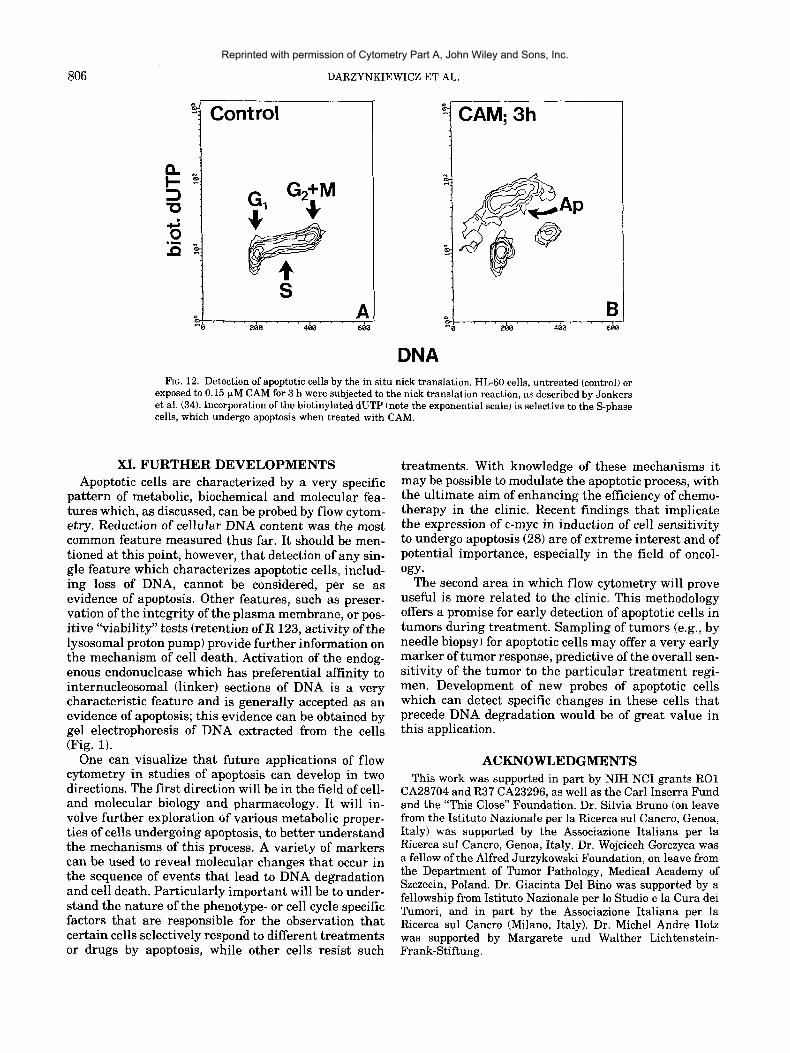
In this assay, DNA breaks are labeled in a cytochem- ical reaction employing exogenous DNA polymerase and a mixture of triphosphonucleotides, one of which is biotinylated. By combining this reaction with cellular DNA staining with PI, the authors (34) were able to reveal the cell cycle phase specificity of DNA breaks. This method, when applied to thymus lymphocytes, was sensitive enough to detect effects of 0.25 Gy irra- diation (34). We have applied their method to detect apoptosis in CAM-treated HL-60 cells (Fig. 12; Gorc- zyca et al., in preparation). The data clearly show the utility of this approach in the identification of the ori- gin of the cells with DNA breaks (incorporating bioti- nylated dUTP) with respect to their cell cycle position.
The major advantage of the nick translation assay appears to be its ability to reveal early DNA breaks during apoptosis, prior to the loss of any significant DNA content or nuclear fragmentation. The method, thus, is well suited to identify cells at the very early stages of apoptosis. However, since the presence of DNA strand breaks is not unique to apoptosis, this as- say should be run together with other methods that can confirm the apoptotic mode of cell death.
Reprinted with permission of Cytometry Part A, John Wiley and Sons, Inc.
806 DARZYNKIEWICZ ET AL.
1 s
4”””
-6 280 400
B v
608
FIG. 12. Detection of apoptotic cells by the in situ nick translation. HL-60 cells, untreated (control) or exposed to 0.15 FM CAM for 3 h were subjected to the nick translation reaction, as described by Jonkers et al. (34). Incorporation of the biotinylated dUTP (note the exponential scale) is selective to the S-phase cells, which undergo apoptosis when treated with CAM.
XI. FURTHER DEVELOPMENTS Apoptotic cells are characterized by a very specific
pattern of metabolic, biochemical and molecular fea- tures which, as discussed, can be probed by flow cytom- etry. Reduction of cellular DNA content was the most common feature measured thus far. It should be men- tioned at this point, however, that detection of any sin- gle feature which characterizes apoptotic cells, includ- ing loss of DNA, cannot be considered, per se as evidence of apoptosis. Other features, such as preser- vation of the integrity of the plasma membrane, or pos- itive “viability” tests (retention of R 123, activity of the lysosomal proton pump) provide further information on the mechanism of cell death. Activation of the endog- enous endonuclease which has preferential affinity to internucleosomal (linker) sections of DNA is a very characteristic feature and is generally accepted as an evidence of apoptosis; this evidence can be obtained by gel electrophoresis of DNA extracted from the cells (Fig. 1).
One can visualize that future applications of flow cytometry in studies of apoptosis can develop in two directions. The first direction will be in the field of cell- and molecular biology and pharmacology. It will in- volve further exploration of various metabolic proper- ties of cells undergoing apoptosis, to better understand the mechanisms of this process. A variety of markers can be used to reveal molecular changes that occur in the sequence of events that lead to DNA degradation and cell death. Particularly important will be to under- stand the nature of the phenotype- or cell cycle specific factors that are responsible for the observation that certain cells selectively respond to different treatments or drugs by apoptosis, while other cells resist such
treatments. With knowledge of these mechanisms i t may be possible to modulate the apoptotic process, with the ultimate aim of enhancing the efficiency of chemo- therapy in the clinic. Recent findings that implicate the expression of c-myc in induction of cell sensitivity to undergo apoptosis (28) are of extreme interest and of potential importance, especially in the field of oncol- om.
The second area in which flow cytometry will prove useful is more related to the clinic. This methodology offers a promise for early detection of apoptotic cells in tumors during treatment. Sampling of tumors (e.g., by needle biopsy) for apoptotic cells may offer a very early marker of tumor response, predictive of the overall sen- sitivity of the tumor to the particular treatment regi- men. Development of new probes of apoptotic cells which can detect specific changes in these cells that precede DNA degradation would be of great value in this application.
ACKNOWLEDGMENTS This work was supported in part by NIH NCI grants R01
CA28704 and R37 CA23296, as well as the Carl Inserra Fund and the “This Close” Foundation. Dr. Silvia Bruno (on leave from the Istituto Nazionale per la Ricerca sul Cancro, Genoa, Italy) was supported by the Associazione Italiana per la Ricerca sul Cancro, Genoa, Italy. Dr. Wojciech Gorczyca was a fellow of the Alfred Jurzykowski Foundation, on leave from the Department of Tumor Pathology, Medical Academy of Szczecin, Poland. Dr. Giacinta Del Bin0 was supported by a fellowship from Istituto Nazionale per lo Studio e la Cura dei Tumori, and in part by the Associazione Italiana per la Ricerca sul Cancro (Milano, Italy). Dr. Michel Andre Hotz was supported by Margarete und Walther Lichtenstein- Frank-Stiftung.
Reprinted with permission of Cytometry Part A, John Wiley and Sons, Inc.

APOPTOTIC CELL FEATURES 807
NOTE ADDED IN PROOFS: A method to identify apoptotic cells by flow cytome-
try, based on cell lysis by detergent and DNA staining with A 0 was recently published by Ojeda et al., (61). Sequential cell staining with Hoechst 33342 and PI was used by Sun et al., (62) and Ormerod et al., (63) to discriminate live, apoptotic and dead cells, the latter having a permeable plasma membrane.
1.
2.
3.
4.
5.
6.
7.
8.
9.
10.
11.
12.
13.
14.
15.
16.
17.
LITERATURE CITED Afanas'ev VN, Korol' BA, Mantsygin YA, Nelipovich PA, Pecht- nikov VA, Umansky SR: Flow cytometry and biochemical analy- sis of DNA degradation characteristic of two types of cell death.
Arends MJ, Morris RG, Wyllie H: Apoptosis: The role of endonu- clease. Am J Pathol 136593-608, 1990. Ausubel MF, Brent R, Kingston RE, Moore DD, Seidman JG, Smith JA, Struhl K (eds): Short Protocols in Molecular Biology, Second Edition. Greene Publishing Associates and John Wiley & Sons, New York, 1992, pp 3-20 to 3-25. Bauer KD, Dethlefsen LA: Control of cellular proliferation in HeLa suspension cultures. Characterization of cultures utilizing acridine orange staining procedures. J Cell Physiol 108:99-112, 1981. Bertrand R, Kerrigan D, Sarang M, Pommier Y: Cell death in- duced by topoisomerase inhibitors. Biochem Pharmacol42:77-85, 1991. Bruno S, Del Bin0 G, Lassota P, Giaretti W, Darzynkiewicz Z: Inhibitors of proteases prevent endonucleolysis accompanying ap- optotic cell death. Leukemia (in press). Bruno S, Lassota P, Giaretti W, Darzynkiewicz Z: Apoptosis of rat thymocytes by prednisolone, camptothecin or teniposide is selec- tive to Go cells and is prevented by inhibitors of proteases. On- cology Res 4:29-35, 1992. Buttyan R Genetic response of prostate cells to androgen depri- vation: Insights to the cellular mechanism of apoptosis. In: Apo- ptosis: The Molecular Basis of Cell Death. Curr. Commun. Cell & Mol. Biol. Vol. 3, Tomei LD, Cope FO (eds). Cold Spring Harbor Laboratory Press, Cold Spring Harbor, NY, 1991, pp 157-173. Buttyan R, Zakeri Z, Lockshin R, Wolgemuth D: Cascade induc- tion of c-fos, c-myc, and heat shock 70K transcripts during regres- sion of the rat ventral prostate gland. Mol Endocrinol2:650-657, 1988. Compton MM, Haskill JS, Cidlowski JA: Analysis of glucocorti- coid actions on rat thymocyte deoxyribonucleic acid by fluores- cence-activated flow cytometry. Endocrin 122:2158-2164, 1988. Cowden RR, Curtis SK: Microfluorometric investigations of chro- matin structure. Histochem 72:ll-23, 1981. Darzynkiewicz Z: Probing nuclear chromatin by flow cytometry. In: Flow Cytornetry and Sorting, Second Edition, Melamed MR, Lindmo T, and Mendelsohn ML (eds). J . Wiley & Sons, Inc., New York, 1990, pp 315-340. Darzynkiewicz Z, Kapuscinski J: Acridine orange: A versatile probe of nucleic acids and other cell constituents. In: Flow Cy- tometry and Sorting, Second Edition, Melamed MR, Lindmo T, and Mendelsohn ML (eds). J. Wiley & Sons, Inc., New York, 1990, pp. 291-314. Darzynkiewicz Z, Kapuscinski J , Traganos F, Crissman HA: Ap- plication of pyronin Y (Gj in cytochemistry of nucleic acids. Cy- tometry 8:138-145, 1987. Darzynkiewicz Z, Staiano-Coico L, Melamed MR: Increased mito- chondrial uptake of rhodamine 123 during lymphocyte stimula- tion. Proc Natl Acad Sci (USA) 78:2383-2387, 1981. Darzynkiewicz 2, Traganos F: Multiparameter flow cytometry in studies of the cell cycle. In: Flow Cytometry and Sorting, Second Edition, Melamed MR, Lindmo T, and Mendelsohn ML (eds). J. Wiley & Sons, Inc., New York, 1990, pp. 469-501. Darzynkiewicz Z, Traganos F, Kapuscinski J, Staiano-Coico L, Melamed MR: Accessibility of DNA in situ to various fluoro-
FEBS 194347-350, 1986.
18.
19.
20.
21.
22.
23.
24.
25.
26.
27.
28.
29.
30.
31.
32.
33.
34.
35.
36.
chromes: Relationship to chromatin changes during erythroid dif- ferentiation of Friend leukemia cells. Cytometry 5:355-363, 1984. Darzynkiewicz Z, Traganos F, Sharpless T, Melamed M R Lym- phocyte stimulation: A rapid multiparameter analysis. Proc Natl Acad Sci USA 73:2881-2886, 1976. Darzynkiewicz Z, Williamson B, Carswell EA, Old U: Cell cycle- specific effects of tumor necrosis factor. Cancer Res 44:83-90, 1984. Del Bin0 G, Bruno S, Yi PN, Darzynkiewicz Z: Apoptotic cell death triggered by camptothecin or teniposide. The cell cycle specificity and effects of ionizing radiation. Cell Prolif (in press). Del Bin0 G, Darzynkiewicz Z: Camptothecin, teniposide or 4'- (9-acridinylamino)-3-methane-sulfon-m-anisidide but not mitox- antrone or doxorubicin, induces degradation of nuclear DNA in S phase of HL-60 cells. Cancer Res 51:1165-1169, 1991. Del Bin0 G, Lassota P, Darzynkiewicz Z: The S-phase cytotoxicity of camptothecin. Exp Cell Res 193:27-35, 1991. Del Bin0 G, Skierski JS, Darzynkiewicz Z: Diverse effects of camptothecin, an inhibitor of topoisomerase I on the cell cycle of lymphocytic (L1210, MOLT-4) and myelogenous (HL-60, KG1) leukemia cells. Cancer Res 50:5746-5750, 1990. Del Bin0 G, Skierski JS, Darzynkiewicz Z: The concentration- dependent diversity of effects of DNA topoisomerase I and I1 in- hibitors on the cell cycle of HL-60 cells. Exp Cell Res 195:485- 491, 1991. Dive C, Hickman JA: Drug-target interactions: Only the first step in the commitment to a programmed cell death? Br J Cancer 64:192-196, 1991. Dive C, Gregory CD, Phipps DJ, Evans DL, Milner AE, Wyllie AH: Analysis and discrimination of necrosis and apoptosis (pro- grammed cell death) by multipararneter flow cytometry. Biochim Biophys Acta 1133:275-285, 1992. Duke RC: Apoptosis in cell-mediated immunity. In Apoptosis: The Molecular Basis of Cell Death. Curr. Commun. Cell & Mol. Biol., Vol. 3, Tomei LD, Cope FO (eds). Cold Spring Harbor Lab- oratory Press, Cold Spring Harbor, NY, 1991, pp 209-226. Evan GI, Wyllie AH, Gilbert CS, Littlewood TD, Land H, Brooks M, Waters CM, Penn LZ, Hancock DC: Induction of apoptosis in fibroblasts by c-myc protein. Cell 69:119-128, 1992. Evenson D, Darzynkiewicz Z, Jost L, Janca F, Ballachey B: Changes in accessibility of DNA to various fluorochromes during spermatogenesis. Cytometry 7:45-53, 1986. Goldman AS, Baker MK, Piddington R, Herold R: Inhibition of programmed cell death in mouse embryonic palate in vitro by cortisol and phenytoin: Receptor involvement and requirement of protein synthesis. Proc SOC Exp Biol Med 174:239-243, 1983. Hotz MA, Del Bin0 G, Lassota P, Traganos F, Darzynkiewicz Z: Cytostatic and cytotoxic effects of fostriecin on human promyelo- cytic HL-60 and lymphocytic MOLT-4 cells. Cancer Res 52:1530- 1535, 1992. Hotz MA, Traganos F, Darzynkiewicz Z: Changes in nuclear chro- matin related to apoptosis or necrosis induced by the DNA topoi- somerase I1 inhibitor fostriecin in MOLT-4 and HL-60 cells are revealed by altered DNA sensitivity to denaturation. Exp Cell Res 201:184-191, 1992. Johnson LV, Walsh ML, Chen LB: Localization of mitochondria in living cells with rhodamine 123. Proc Natl Acad Sci (USA) 77: 990-994, 1980. Jonker RR, Bauman JGJ, Visser JMW Detection of apoptosis using non-radioactive in situ nick translation. In: NATO Ad- vanced Study Institutes Programme. New Developments in Flow Cytometry. Lectures Option C. CNRS, Villejuif, 1992, pp. 30-31. Kaufmann SH: Induction of endonucleolytic DNA cleavage in hu- man acute myelogenous leukemia cells by etoposide, camptothe- cin, and other cytotoxic anticancer drugs. A cautionary note. Can- cer Res 49:5870-5878, 1989. Kerr JFR, Harmon BV: Definition and incidence of apoptosis: An historical perspective. In: Apoptosis: The Molecular Basis of Cell Death. Curr. Commun. Cell & Mol. Biol., Vol. 3, Tomei LD, Cope FO (eds). Cold Spring Harbor Laboratory Press, Cold Spring Har- bor, NY, 1991, pp 5-29.
Reprinted with permission of Cytometry Part A, John Wiley and Sons, Inc.

808 DARZYNKIEWICZ ET AL.
37. Kerr JFR, Wyllie AH, Curie A R Apoptosis: A basic biological phenomenon with wide-ranging implications in tissue kinetics. Br J Cancer 26939-257, 1972.
38. Krishan A, Frei E, I11 Morphological basis for the cytolytic effect of Vinblastine and Vincristine on cultured human leukemic lym- phocytes. Cancer Res 35:497-501, 1975.
39. Kubbies M: Flow cytometric recognition of clastogen induced chromatin damage in GJG, lymphocytes by non-stoichiometric Hoechst fluorochrome binding. Cytometry 11:386-394, 1990.
40. Lennon SV, Martin SJ, Cotter TG: Dose-dependent induction of apoptosis in human tumour cell lines by widely diverging stimuli. Cell Prolif 24:203-214, 1991.
41. Lockshin RA, Zakeri Z: Programmed cell death and apoptosis. In: Apoptosis: The Molecular Basis of Cell Death. Curr. Commun. Cell & Mol. Biol., Vol. 3, Tomei LD, Cope FO (eds). Cold Spring Harbor Laboratory Press, Cold Spring Harbor, NY, 1991, pp 47- 60.
42. Martin DP, Johnson EM, Jr.: Programmed cell death in the pe- ripheral nervous system. In: Apoptosis: The Molecular Basis of Cell Death. Curr. Commun. Cell & Mol. Biol., Vol. 3, Tomei LD, Cope FO (eds). Cold Spring Harbor Laboratory Press, Cold Spring Harbor, NY, 1991, pp 247-261.
43. McConkey DJ, Orrenius S: Cellular signaling in thymocyte apo- ptosis. In: Apoptosis: The Molecular Basis of Cell Death. Curr. Commun. Cell & Mol. Biol., Vol. 3, Tomei LD, Cope FO (eds). Cold Spring Harbor Laboratory Press, Cold Spring Harbor, NY, 1991, pp 227-246.
44. Qeda F, Guarda MI, Maldonado C, Folch H: Protein kinase-C involvement in thymocyte apoptosis induced by hydrocortisone. Cell Immunol 125:535-539, 1990.
45. Pollack A, Ciancio G Cell cycle phase-specific analysis of cell viability using Hoechst 33342 and propidium iodide after ethanol preservation. In: Flow Cytometry, Darzynkiewicz 2, Crissman HA (eds). Academic Press, San Diego, CA, 1991, pp. 19-24.
46. Schrek R, Chandra S, Molnar Z, Stefani S: Two types of inter- phase death of lymphocytes exposed to temperatures of 37-45°C. Radiat Res 82:162-170.
47. Server AC, Mobley WC: Neuronal cell death and the role of apo- ptosis. In: Apoptosis: The Molecular Basis of Cell Death. Curr. Commun. Cell & Mol. Biol., Vol. 3, Tomei LD, Cope FO (edsj. Cold Spring Harbor Laboratory Press, Cold Spring Harbor, NY, 1991, pp 263-278.
48. Shapiro HM: Flow cytometric estimation of DNA and RNA con- tent in intact cells stained with Hoechst 33342 and pyronin Y. Cytometry 2143-150, 1981.
49. Swat W, Ignatowicz L, Kisielow P Detection of apoptosis of im- mature CD4’8’ thymocytes by flow cytometry. J Immunol Meth 137:79-87, 1991.
50. Szende B, Zalatnai A, Schally A V Programmcd cell death (apo-
ptosisj in pancreatic cancers of hamsters after treatment with analogs of both luteinizing hormone-releasing hormone and so- matostatin. Proc Natl Acad Sci (USA) 86:1643-1647, 1989.
51. Telford WG, King LE, Fraker PJ: Comparative evaluation of sev- eral DNA binding dyes in the detection of apoptosis-associated chromatin degradation by flow cytometry. Cytometry 13:137- 143, 1992.
52. Telford WG, King LE, Fraker PJ: Evaluation of glucocorticoid- induced DNA fragmentation in mouse thymocytes by flow cytom- etry. Cell Prolif 24:447-459, 1991.
53. Tomei LD, Cope FO (eds): Apoptosis: The Molecular Basis of Cell Death. Curr. Commun. Cell and Mol. Biol., Vol. 3. Cold Spring Harbor Laboratory Press, Cold Spring Harbor, NY, 1991.
54. Traganos F, Ardelt B, Halko N, Bruno S, Darzynkiewicz Z: Effects of Genistein on the growth and cell cycle progression of normal human lymphocytes and human leukemic MOLT-4 and HL-60 cells. Cancer Res (in press).
55. Tritton TR: Cell death in cancer chemotherapy: The case of Adri- amycin. In: Apoptosis: The Molecular Basis of Cell Death. Curr. Commun. Cell and Mol. Biol., Vol. 3, Tomei LD, Cope FO (eds). Cold Spring Harbor Laboratory Press, Cold Spring Harbor, NY, 1991, pp 121-137.
56. Umansky SR, Korol’ BR, Nelipoich PA: In vivo DNA degradation in the thymocytes of gamma-irradiated or hydrocortisone-treated rats. Biochim Biophys Acta 655:281-290,1981.
57. Waggoner AS: Fluorescent probes for cytometry. In: Flow Cytom- etry and Sorting, Melamed MR, Lindmo T, Mendelsohn ML (eds). Wiley-Liss, New York, 1990 pp 209-225.
58. Walker PR, Smith C, Yondale T, Leblanc J , Whitfield JF, Sikor- ska M Topoisomerase 11-reactive chemotherapeutic drugs induce apoptosis in thymocytes. Cancer Res 52:1078-1085, 1991.
59. Wyllie AH, Kerr JFR, Currie A R Cell dea th The significance of apoptosis. In: International Review of Cytology, Vol. 68, Bourne GH, Danielli FJ, Jeon KW (eds). Academic Press, New York, 1980, pp 251-306.
60. Wyllie AH, Morris RG, Smith AL, Dunlop D: Chromatin cleavage in apoptosis: Association with condensed chromatin morphology and dependence on macromolecular synthesis. J Pathol 142:67- 77,1984.
61. Ojeda F, Guarda MI, Maldonado C, Folch H: A flow-cytometric method to study DNA fragmentation in lymphocytes. J Immun Meth 152:171-176, 1992.
62. Sun X-M, Snowden RT, Skiletter DN, Dinsdale D, Ormerod MG, Cohen GM: A flow-cytometric method for the separation and quantitation of normal and apoptotic thymocytes. Analyt Bio- chem 204:351-356, 1992.
63. Ormerod MG, Collins MKL, Rodriguez-Tarduchy G, Robertson D: Apoptosis in interleukin-3-dependent haemopoietic cells. J Im- mun Meth (in press).
Reprinted with permission of Cytometry Part A, John Wiley and Sons, Inc.