Embed Size (px)
Citation preview

Features of Ag Image Tone in Water-Coated Photothermographic Materials
Tomoyuki Ohzeki*, Yasuhiro Yoshioka*, and Kimitoshi Nagao** * Digital & Photo Imaging Materials Research Laboratories
**Quality Design and Evaluation Center Fuji Photo Film Co., Ltd.,Japan
Abstract
The silver image tone in water-coated photothermographic materials usually depends on the image density in contrast to that in organic solvent-coated one. It was revealed by TEM observation and simulation that the size of developed silver particles depended on the image density owing to the absence of sphere of influence in water-coated photothermographic materials, while it did not in organic solvent-coated ones owing to the presence of sphere of influence.
Introduction
In the diagnostic photothermographic (PT) material field, it is important to keep silver image tone neutral gray for diagnostic capability, and also to achieve enhanced covering power at the maximum optical density (Dmax) with reduced silver amount from commercial point of view.
Many efforts to simulate the characteristic curve of PT materials were repoted.1-4 According to these simulations, it is necessary to increase the number of silver halide grains in order to increase Dmax when the coated amount of silver carboxylates is constant.3 However, these simulation studies treated organic solvent-coated PT materials which have “sphere of influence”. Although it is expected that such simulations are applied to water-coated PT materials having any obvious “sphere of influence”, we have not yet succeeded in it satisfactorily up to the present time.
In spite of the absence of any obvious “sphere of influence” in the water-coated PT material5, the increase in the number of silver halide grains is also effective for increasing Dmax in the same manner as organic solvent-coated PT materials. However, the increase in the number of silver halide grains is inclined to bring about such a problem as to deviate the silver tone from neutral gray in the region near Dmax.
The morphology and size of developed silver particles in PT materials were reported in some literatures.6-7 Bokhonov and co-workers reported the morphological variation of silver particles depended on the variations of in-situ or ex-situ AgX grains and toning agents. As Whitcomb mentioned in his book8, very little knowledge has been
published on the characteristics of developed silver in this field. There is still no sufficient general understanding of the relation of tone with morphology or size of developed silver.
On the other hand, many studies have been reported in the field of conventional wet processing materials, especially in black and white diffusion transfer materials,9-11 and are very helpful for us to know the relationship of covering power and image tone with morphology and size of silver particles.
In this paper we report qualitative analysis of covering power and silver image tone, which depends on the image density, being peculiar to water-coated PT materials.
Experimental
The water-coated PT materials The water-coated PT materials investigated in this study consist of chemically sensitized cubic silver bromoiodide (I=3.5mol%) emulsion prepared by an usual controlled double jet technique, silver behenate (AgBeh) dispersion with PVA as a dispersing agent, water-dispersible SBR latex as binder, dispersion of bis-phenol as reducing agent, dispersion of polyhalides compounds as antifoggants, and a combination of phthalazine derivative and phthalic acid as silver ion carrier. These agents are coated according to a water-coating technique5.
Measurement of the covering power To obtain accurately the covering power (CP), it is necessary to leave developed silver in a photosensitive layer while undeveloped AgBeh and AgX are removed from it by a fixing process. Technique to fix silver salts from a hydrophobic layer has not yet been reported in the past. We found that a methanolic solution of a thioether compound known as a conventional solvent for silver halide, 3,6-dithia-1,8-octanediol, could fix both undeveloped AgBeh and AgX after removing a protective layer. The amount of remaining developed silver was then measured by a usual X-ray fluorescent spectrometer. The condition of the fixing process was adjusted to obtain stable results without over-fixing. We could confirm the disappearance of AgBeh and
2004 International Symposium on Silver Halide Technology
7
AgX by observing the cross section of the layer by transmission electron microscopy (TEM).
A cross-section of a photosensitive layer was prepared by a microtome, and subjected to the TEM observation by means of a JEOL JEM-2000FX or JEM-4000EX microscope at liquid Nitrogen temperature.
Figure 1. Covering power versus amount of developed silver with development time of 5,10,15,20,25 and 30sec. The thick broken line with an arrow indicates CP at the same low exposure with
variation of developing time.
Results and Discussion
Covering power and size of developed silver particles The water-coated PT materials were exposed to light of 390nm through a step wedge, and subjected to heating by 4 plates at 112,119,121and121℃, respectively. The amount
of developed silver, optical density, and then CP were measured as a function of exposure and analyzed in terms of their dependences on the time of development.
As shown in fig.1, CP in the initial stage with developing time of 5-10 second was high and almost constant at any exposure level, while it decreased in the succeeding stage with developing time of 15-30 second especially in the region with low exposure. On the other hand, CP in the region near Dmax was high and almost constant at any developing time.
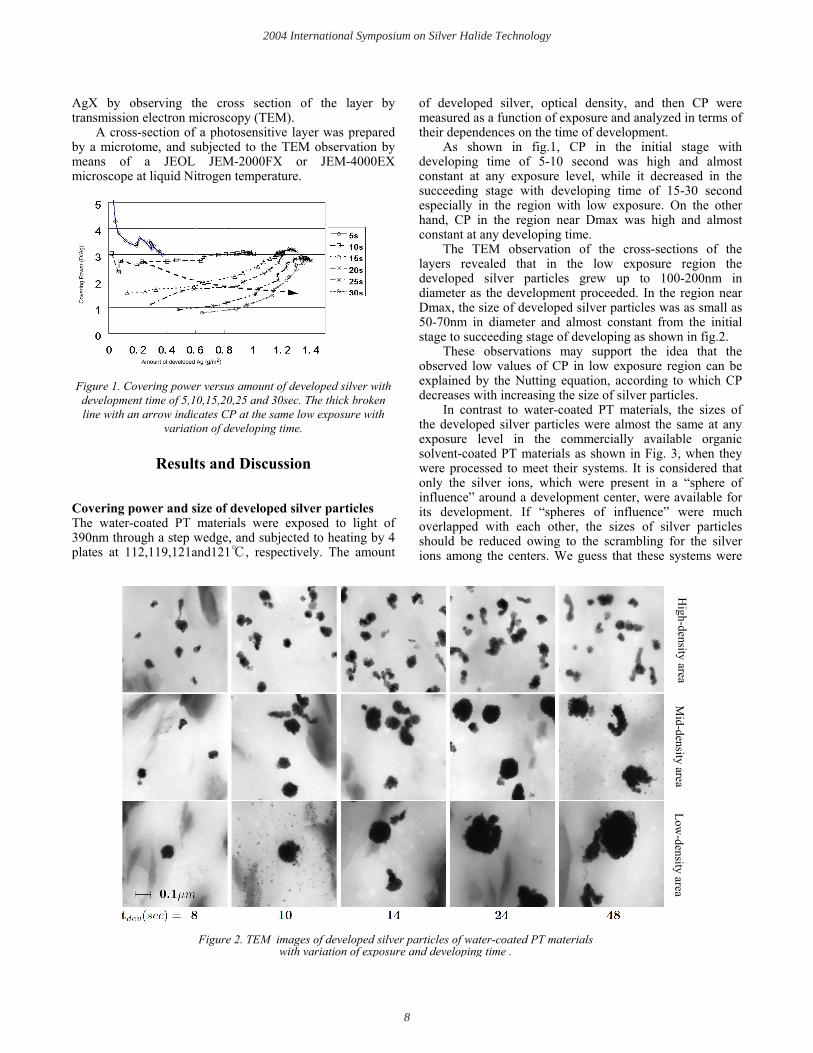
The TEM observation of the cross-sections of the layers revealed that in the low exposure region the developed silver particles grew up to 100-200nm in diameter as the development proceeded. In the region near Dmax, the size of developed silver particles was as small as 50-70nm in diameter and almost constant from the initial stage to succeeding stage of developing as shown in fig.2.
These observations may support the idea that the observed low values of CP in low exposure region can be explained by the Nutting equation, according to which CP decreases with increasing the size of silver particles.
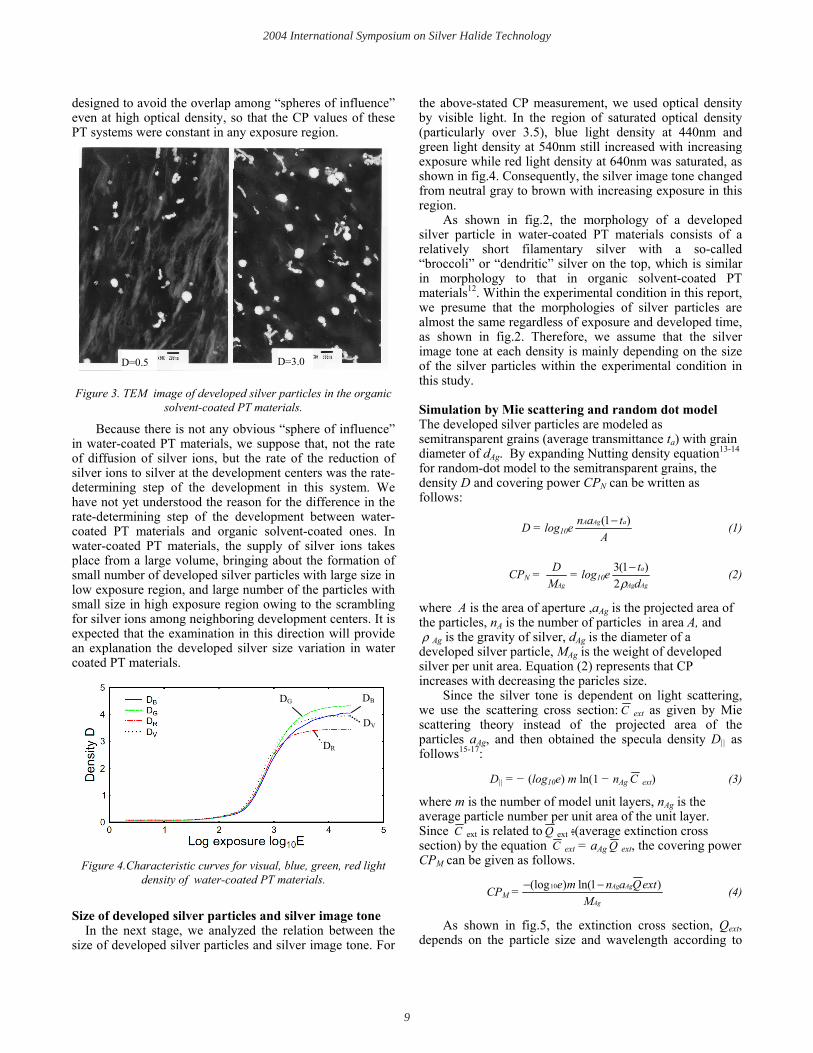
In contrast to water-coated PT materials, the sizes of the developed silver particles were almost the same at any exposure level in the commercially available organic solvent-coated PT materials as shown in Fig. 3, when they were processed to meet their systems. It is considered that only the silver ions, which were present in a “sphere of influence” around a development center, were available for its development. If “spheres of influence” were much overlapped with each other, the sizes of silver particles should be reduced owing to the scrambling for the silver ions among the centers. We guess that these systems were
Figure 2. TEM images of developed silver particles of water-coated PT materials with variation of exposure and developing time .
High-density area
Low-density area
Mid-density area
2004 International Symposium on Silver Halide Technology
8
designed to avoid the overlap among “spheres of influence” even at high optical density, so that the CP values of these PT systems were constant in any exposure region.
D=3.0 D=0.5
Figure 3. TEM image of developed silver particles in the organic solvent-coated PT materials.
Because there is not any obvious “sphere of influence” in water-coated PT materials, we suppose that, not the rate of diffusion of silver ions, but the rate of the reduction of silver ions to silver at the development centers was the rate-determining step of the development in this system. We have not yet understood the reason for the difference in the rate-determining step of the development between water-coated PT materials and organic solvent-coated ones. In water-coated PT materials, the supply of silver ions takes place from a large volume, bringing about the formation of small number of developed silver particles with large size in low exposure region, and large number of the particles with small size in high exposure region owing to the scrambling for silver ions among neighboring development centers. It is expected that the examination in this direction will provide an explanation the developed silver size variation in water coated PT materials.
Figure 4.Characteristic curves for visual, blue, green, red light density of water-coated PT materials.
Size of developed silver particles and silver image tone In the next stage, we analyzed the relation between the
size of developed silver particles and silver image tone. For
the above-stated CP measurement, we used optical density by visible light. In the region of saturated optical density (particularly over 3.5), blue light density at 440nm and green light density at 540nm still increased with increasing exposure while red light density at 640nm was saturated, as shown in fig.4. Consequently, the silver image tone changed from neutral gray to brown with increasing exposure in this region.
As shown in fig.2, the morphology of a developed silver particle in water-coated PT materials consists of a relatively short filamentary silver with a so-called “broccoli” or “dendritic” silver on the top, which is similar in morphology to that in organic solvent-coated PT materials12. Within the experimental condition in this report, we presume that the morphologies of silver particles are almost the same regardless of exposure and developed time, as shown in fig.2. Therefore, we assume that the silver image tone at each density is mainly depending on the size of the silver particles within the experimental condition in this study.
Simulation by Mie scattering and random dot model The developed silver particles are modeled as semitransparent grains (average transmittance ta) with grain diameter of dAg. By expanding Nutting density equation13-14
for random-dot model to the semitransparent grains, the density D and covering power CPN can be written as follows:
D = log10e Atan aAgA )1( − (1)
CPN = AgM
D = log10eAgAg
a
dt
ρ2)1(3 − (2)
where A is the area of aperture ,aAg is the projected area of the particles, nA is the number of particles in area A, and ρ Ag is the gravity of silver, dAg is the diameter of a developed silver particle, MAg is the weight of developed silver per unit area. Equation (2) represents that CP increases with decreasing the paricles size.
Since the silver tone is dependent on light scattering, we use the scattering cross section: C ext as given by Mie scattering theory instead of the projected area of the particles aAg, and then obtained the specula density D|| as follows15-17:
D|| = − (log10e) m ln(1 − nAg C ext) (3)
where m is the number of model unit layers, nAg is the average particle number per unit area of the unit layer. Since C ext is related to Q ext :(average extinction cross section) by the equation C ext = aAg Q ext, the covering power CPM can be given as follows.
CPM =Ag
AgAg
MextQanme )1ln()(log10 −− (4)
As shown in fig.5, the extinction cross section, Qext, depends on the particle size and wavelength according to
DR
DB
DV
DG
2004 International Symposium on Silver Halide Technology
9

the calculation result. Namely, Qext of the particles with diameter of 0.1-0.2µm, which correspond to the particles in the range with low to middle density has little dependence on the wavelength, while that of the particles with diameter of 0.05-0.1µm, which correspond to the particles in high density range shows relatively much dependence on the wavelength. We assume that the light scattering is the cause for the change in silver tone at high-density region according to this simulation.
Fiugre5.Caluculated efficiency factors for light extinction versus diameter of silver particles.
Conclusion
It was observed that the size of developed silver particles and silver image tone changed, depending on exposure in water-coated PT materials. We assume that the difference of the developed silver particles size was caused by the supply of silver ions from a large volume around a development center as indicated by the absence of any obvious “sphere of influence” in water-coated PT materials on the contrary to the case in organic solvent ones. We attribute the change in silver tone to the change in particle size, since the morphology was almost the same among the particles formed at various exposure levels according to the TEM observation. This idea was supported by the simulation.
References
1. D.H.Klosterboer and R.H.Rutledge, Paper summaries, SPSE 33rd Annual Conference, SPSE, Washington DC, 1980, paper N-7.
2. D.H.Klosterboer, in Imaging Processes and Materials, Neblette’s Eight Edition, Ed.by Sturge et.al., Van Nostrand Reinhold, NY, 1989.
3. A. Hirano, Proc. IST/SPSTJ’s International Symposium on Silver Halide Imaging, IST, Springfield, VA, 1997, P.113.
4. T.Ito, S.Nishiwaki and T.Mitsuhashi, J. Imaging Sci. Technol. 45, 357(2001).
5. T.Tsuzuki, A.Hatakeyama and K.Nakajima, Proc. ISIS’02 International Congress of Imaging Science 2002,Tokyo,P27.
6. (a) B.B.Bokhonov, L.P.Burleva,W.Frank, M.B.Mizen, D.R.Whitcomb, J.Winslow and C.Zou, J. Imag. Sci. Technol. 40,417(1996) (b) B.B.Bokhonov, L.P.Burleva and D.R.Whitcomb, J. Imag. Sci. Technol. 43.505(1999)
7. S.E.Hill, M.B.Mizen and M.R.V.Sahyun and Y.E.Usanov, J. Imag. Sci. Technol. 40.568(1996)
8. P.J.Cowdery-Corvan and D.R.Whitcomb, Photothermographic and Thermographic Imaging Materials, HandBook of Imaging Materials, A.Diamond, D.Weiss, Eds.,Marcel Dekker, New York, NY, 2002
9. C.R.Berry and D.C.Skillman, J. Photgr. Sci. 17, 145(1969) 10. L.R.Solman, J. Photogr. Sci. 18, 136(1970) 11. E.H.Land, V.K.Walworth and R.S.Corley, Photo. Sci. Eng.,
16, 313(1972) 12. P.L.Potapov, D.Schryvers, H.Strijckers and C.V.Roost, J.
Imag. Sci. Technol. 47, 115(2003) 13. P. G. Nutting: Phil. Mag., 26, 423(1913) 14. J. C. Dainty and R. Shaw: ”Image Science”, Chap.1and 2,
Academic Press (1974) 15. S. K. Salib, J. J. DePalma, and J. Gasper: Photgr. Sci. Eng.,
18(2),145(1974) 16. C. F. Bohren and D. R. Huffman: ” Absorption
andScattering of Light by Small Particles”, p477, Wiley-Interscience(1983)
17. N. C. Wickramasinghe: ” Light Scattering Functionsfor Small Particles”, chap.3, Adam Hilger(1973)
Biography
Tomoyuki Ohzeki was born in 1963 in Tokyo Japan. In 1988 he was graduated from the graduated course of chemistry division of Waseda University, and obtained a degree of Master of Art. In the same year, he joined Ashigara Research Laboratories of Fuji Photo Film Co., Ltd.
2004 International Symposium on Silver Halide Technology
10