Embed Size (px)
Citation preview
iihs.org
Feat(ures) for fleets
American Automotive Leasing AssociationNewport Beach, CAMarch 8, 2016
Adrian LundPresident, IIHS and HLDI

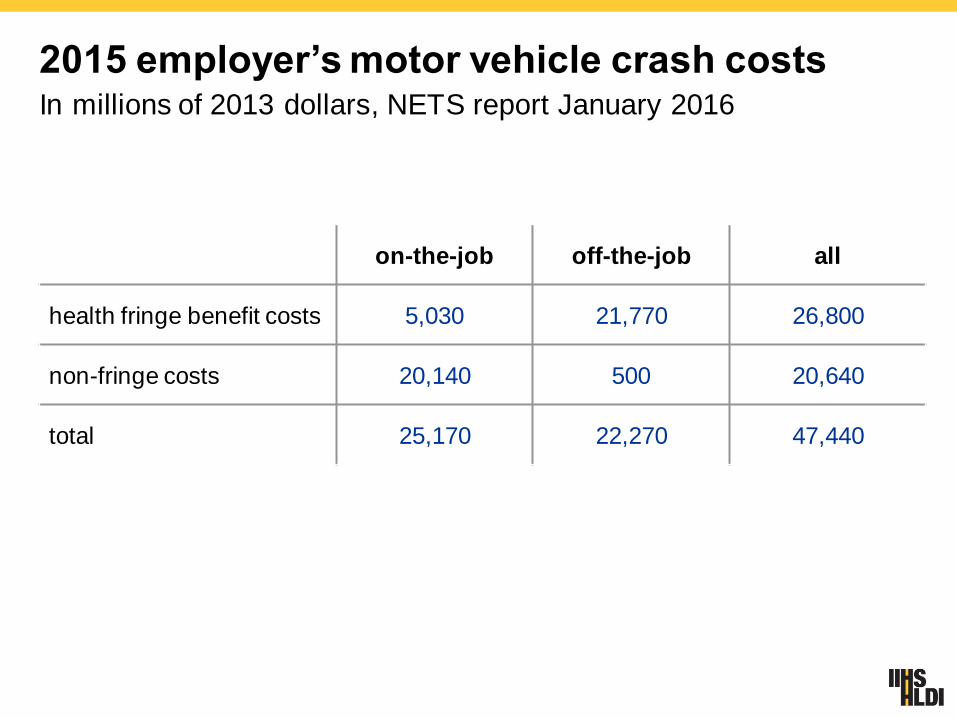
2015 employer’s motor vehicle crash costsIn millions of 2013 dollars, NETS report January 2016
on-the-job off-the-job all
health fringe benefit costs 5,030 21,770 26,800
non-fringe costs 20,140 500 20,640
total 25,170 22,270 47,440

Motor vehicle crash deaths and deaths per billion vehicle miles traveled
1950-2014
30,000
35,000
40,000
45,000
50,000
55,000
60,000
1950 1960 1970 1980 1990 2000 20100
10
20
30
40
50
60
70
80
Motor vehiclecrash deaths
Crash deaths perbillion vehicle miles traveled
201410.8 per billion
32,675 deaths

US motor vehicle crash deaths and unemployment rate1950-2014
0
5
10
15
20
30,000
35,000
40,000
45,000
50,000
55,000
60,000
1950 55 60 65 70 75 80 85 90 95 2000 05 10
Motor vehicle crash deaths
Unemployment rate
6 percent
32,675

Motor vehicle crash deaths per billion vehicle miles traveled and unemployment rate1950-2014
0
10
20
30
40
50
60
70
80
0
5
10
15
20
1950 1960 1970 1980 1990 2000 2010
Unemployment rate
Crash deaths perbillion vehicle miles traveled
10.8 per billion
6 percent

Year-to-year percent changes in US motor vehicle crash deaths per billion vehicle miles traveled and unemployment rate1951-2014
-80
-40
0
40
80
-20
-15
-10
-5
0
5
10
15
20
1950 55 60 65 70 75 80 85 90 95 2000 05 10
Crash deaths perbillion vehicle miles traveled
Unemployment rate


Overview of IIHS-HLDI
IIHS is an independent, nonprofit scientific and
educational organization dedicated to reducing the losses
— deaths, injuries and property damage — from crashes on the nation’s roads.
HLDI shares this mission by analyzing insurance
data representing human and economic losses from
crashes and other events related to vehicle ownership.
Both organizations are wholly supported by auto insurers.

Member groupsAcceptance Insurance Gainsco Insurance Oregon Mutual Insurance
ACE Private Risk Services GEICO Corporation Pekin Insurance
Affirmative Insurance The General Insurance PEMCO Insurance
Alfa Alliance Insurance Corporation Georgia Farm Bureau Mutual Insurance Company Plymouth Rock Assurance
Alfa Insurance Goodville Mutual Casualty Company Progressive Insurance
Allstate Insurance Group Grange Insurance PURE Insurance
American Family Mutual Insurance Hallmark Financial Services The Responsive Auto Insurance Company
American National Hanover Insurance Group Rockingham Group
Ameriprise Auto & Home Haulers Insurance Company Safe Auto Insurance Company
Amica Mutual Insurance Company The Hartford Safeco Insurance
Auto Club Enterprises Horace Mann Insurance Companies Samsung Fire & Marine Insurance Company
Auto Club Group ICW Group SECURA Insurance
Auto-Ow ners Insurance Imperial Fire & Casualty Insurance Company Sentry Insurance
Aviva Insurance Indiana Farmers Mutual Insurance Company Shelter Insurance
Bankers Insurance Group Infinity Property & Casualty Sompo Japan Insurance Company of America
Bitco Insurance Companies Kemper Corporation South Carolina Farm Bureau Mutual Insurance Company
California Casualty Group Kentucky Farm Bureau Mutual Insurance Companies Southern Farm Bureau Casualty Insurance Company
Capital Insurance Group Liberty Mutual Insurance Company State Auto Insurance Companies
Censtat Casualty Company Louisiana Farm Bureau Mutual Insurance Company State Farm Insurance Companies
Chubb & Son Main Street America Group Tennessee Farmers Mutual Insurance Company
Colorado Farm Bureau Mutual Insurance Company Mercury Insurance Group Texas Farm Bureau Insurance Companies
Concord Group Insurance Companies MetLife Auto & Home The Travelers Companies
COUNTRY Financial MiddleOak United Educators
CSAA Insurance Group Mississippi Farm Bureau Casualty Insurance Company USAA
CSE Insurance Group MMG Insurance Utica National Insurance Group
Direct General Corporation Munich Reinsurance America, Inc. Virginia Farm Bureau Mutual Insurance
Erie Insurance Group Mutual of Enumclaw Insurance Company West Bend Mutual Insurance Company
Esurance Nationw ide Western National Insurance Group

Washington, DC
Ruckersville, VA
Arlington, VA
Where are we?
Much of the improved highway safety picture is due to vehicle designs

Vehicle and non-vehicle factors and highway safetyPassenger vehicle driver deaths per million vehicles,
actual vs. expected for 1985 fleet
40
60
80
100
120
140
160
180
1985 1987 1989 1991 1993 1995 1997 1999 2001 2003 2005 2007 2009 2011
calendar year
actual rates
expected rates
Crashworthiness ratings
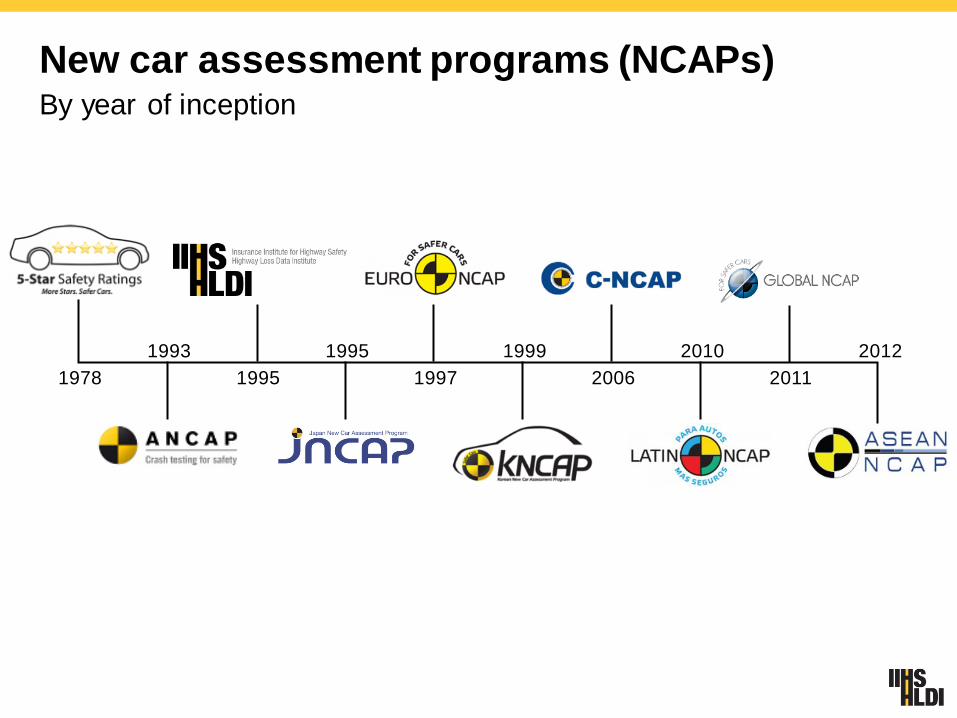
New car assessment programs (NCAPs)By year of inception
1978 1995 1997 2006 2011
1993 1995 1999 2010 2012
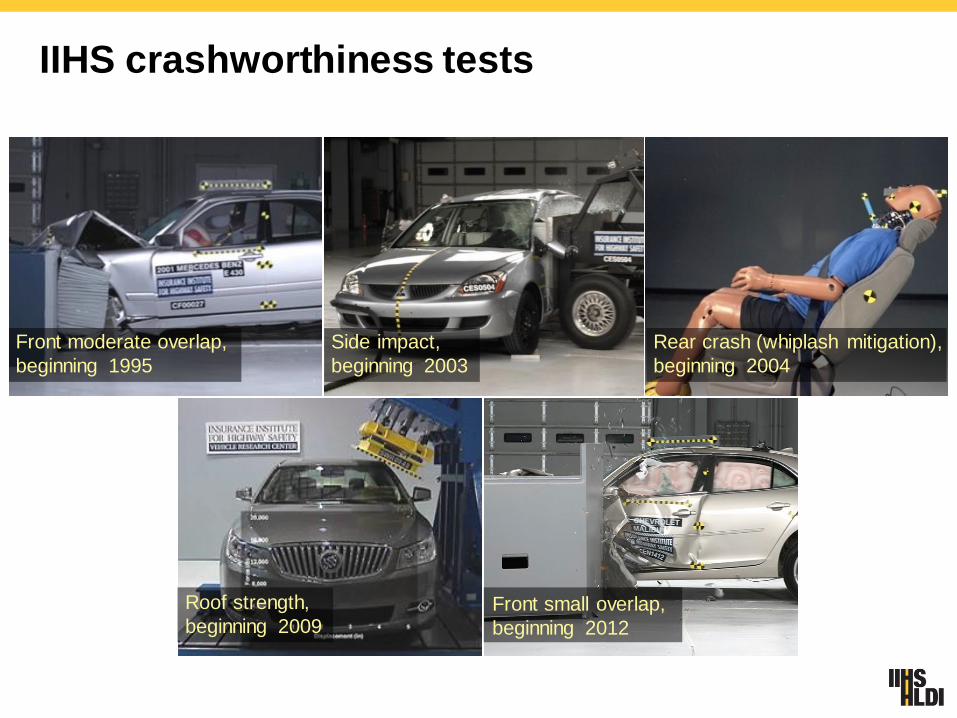
IIHS crashworthiness tests
Front small overlap,
beginning 2012
Front moderate overlap,
beginning 1995
Side impact,
beginning 2003
Rear crash (whiplash mitigation),
beginning 2004
Roof strength,
beginning 2009
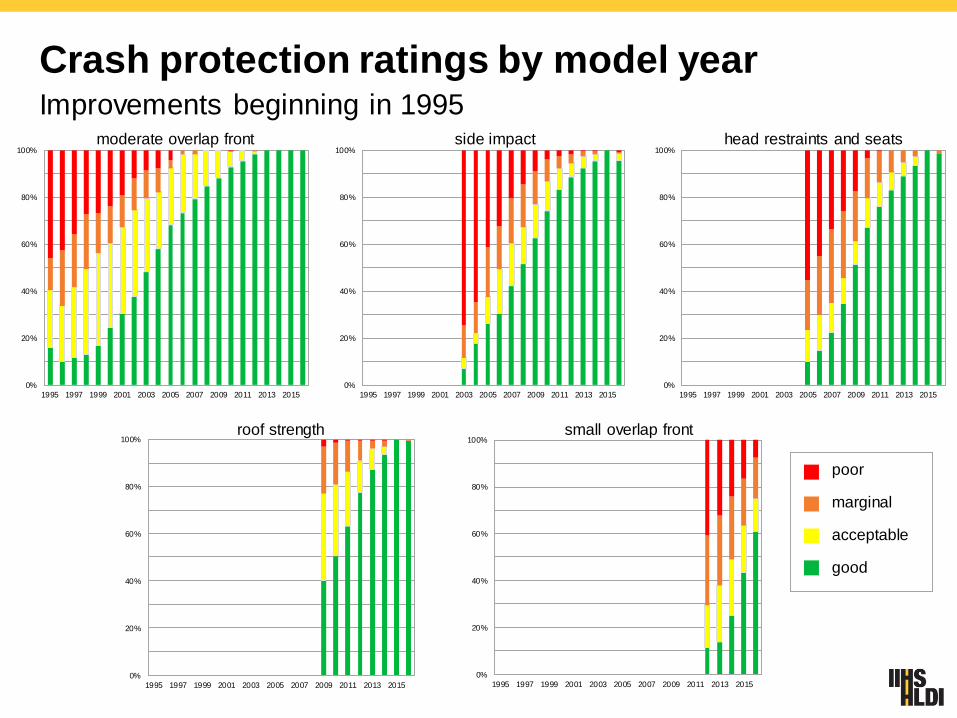
Crash protection ratings by model yearImprovements beginning in 1995
0%
20%
40%
60%
80%
100%
1995 1997 1999 2001 2003 2005 2007 2009 2011 2013 2015
0%
20%
40%
60%
80%
100%
1995 1997 1999 2001 2003 2005 2007 2009 2011 2013 2015
0%
20%
40%
60%
80%
100%
1995 1997 1999 2001 2003 2005 2007 2009 2011 2013 2015
0%
20%
40%
60%
80%
100%
1995 1997 1999 2001 2003 2005 2007 2009 2011 2013 2015
0%
20%
40%
60%
80%
100%
1995 1997 1999 2001 2003 2005 2007 2009 2011 2013 2015
moderate overlap front
roof strength small overlap front
side impact head restraints and seats
poor
marginal
acceptable
good

IIHS crashworthiness tests
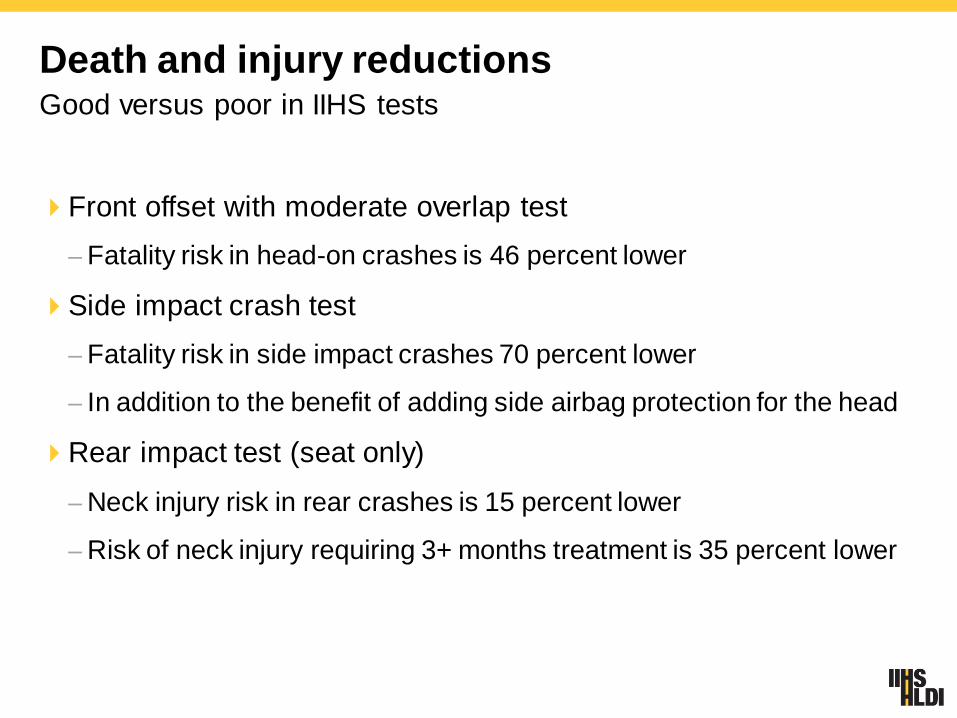
Death and injury reductionsGood versus poor in IIHS tests
Front offset with moderate overlap test
– Fatality risk in head-on crashes is 46 percent lower
Side impact crash test
– Fatality risk in side impact crashes 70 percent lower
– In addition to the benefit of adding side airbag protection for the head
Rear impact test (seat only)
– Neck injury risk in rear crashes is 15 percent lower
– Risk of neck injury requiring 3+ months treatment is 35 percent lower

The Google visionAutonomous vehicles delivering occupants to pre-set destinations

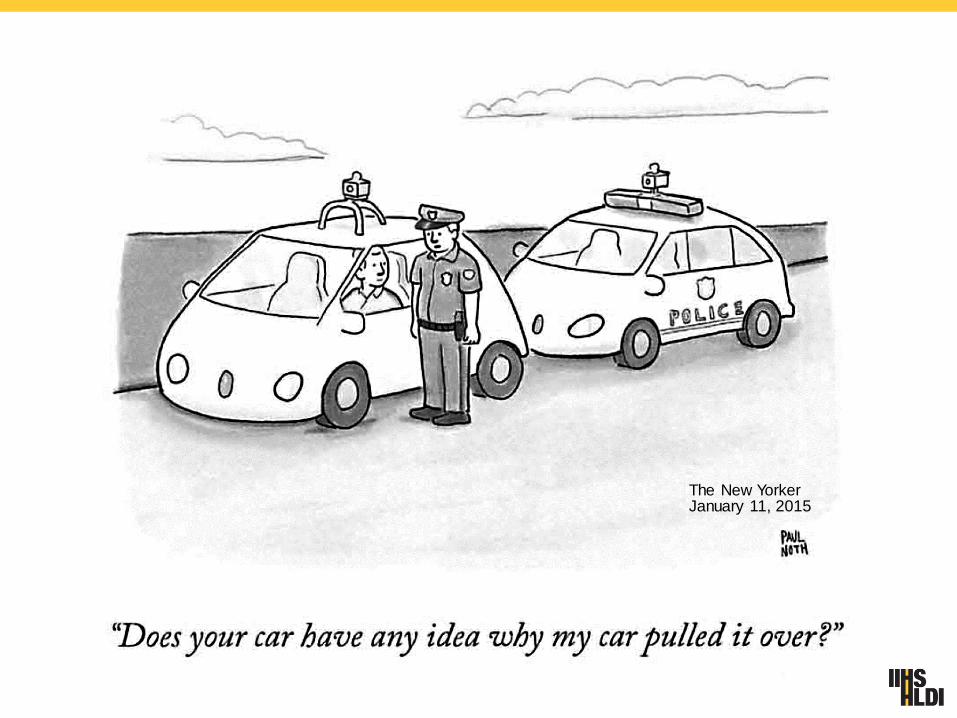
The New YorkerJanuary 11, 2015


Velodyne LIDARused by Google Self-Driving Car
325 ft range with 360º rotation
Short-range radar100 ft range
80º opening angle
Mid-range radar260 ft range,
16º opening angle
Mid-range radar200 ft range,
60º opening angle
Long-range radar650 ft range,
18-20º opening angle
Infrared525 ft range
20º opening angle
Mono/stereo cameras325 ft range, 45º opening angle
LIDAR45 ft range,
27º opening angle
Ultrasonic sensors15 ft range
Driver assistance features

Crash avoidance technologies

Crashes relevant to 4 crash avoidance systemsFARS and GES, 2004-08
all injury fatal
front crash prevention 1,165,000 66,000 879
lane departure prevention 179,000 37,000 7,529
side view assist 395,000 20,000 393
adaptive headlights 142,000 29,000 2,484
total unique crashes 1,866,000 149,000 10,238

Front crash prevention is working

Front crash prevention
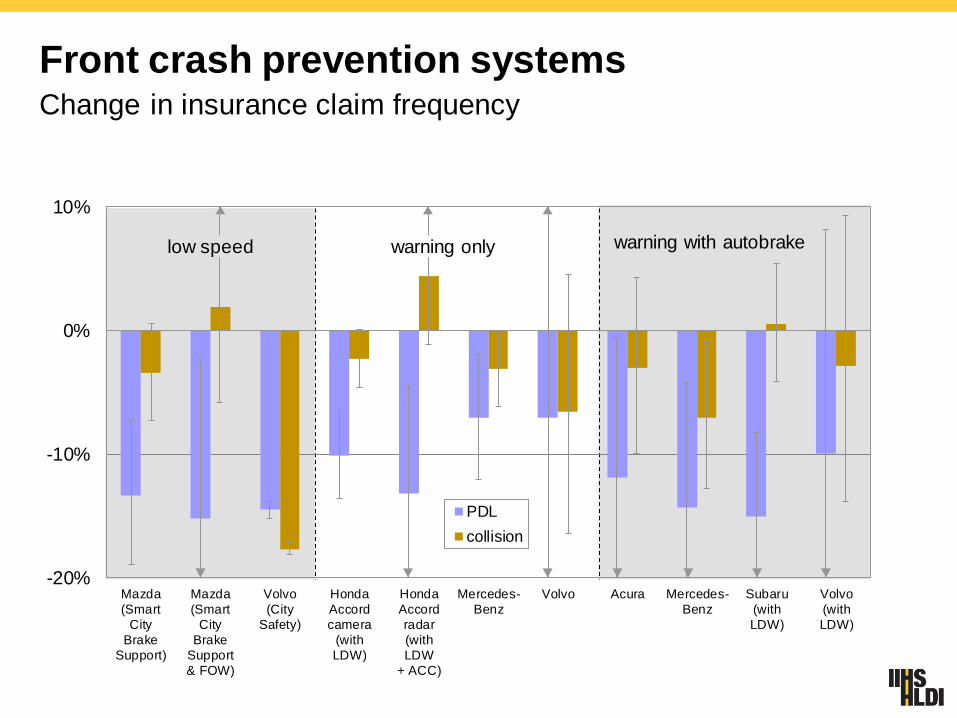
Front crash prevention systemsChange in insurance claim frequency
-20%
-10%
0%
10%
Mazda
(Smart
City
Brake
Support)
Mazda
(Smart
City
Brake
Support
& FOW)
Volvo
(City
Safety)
Honda
Accord
camera
(with
LDW)
Honda
Accord
radar
(with
LDW
+ ACC)
Mercedes-
Benz
Volvo Acura Mercedes-
Benz
Subaru
(with
LDW)
Volvo
(with
LDW)
PDL
collision
warning only warning with autobrakelow speed

Front crash prevention systemsChange in insurance claim frequency
warning only
-40%
-30%
-20%
-10%
0%
10%
Mazda Volvo CitySafety
HondaAccord
(includesLDW)
HondaAccordTouring
Mercedes Volvo Acura Mercedes Subaru Volvo(includes
LDW)
-30%
-20%
-10%
0%
10%
20%
30%
Mazda(smartCity
BrakeSupport)
Volvo(City
Safety)
HondaAccordcamera
(withLDW)
HondaAccordradar(withLDW
+ ACC)
Mercedes-Benz
Volvo Acura Mercedes-Benz
Subaru Volvo(withLDW)
MedPay
PIP
Bodilyinjuryliability
low speed warning only warning with autobrake
low speed warning with autobrake

Effects of systems on rear-end strikesPercent difference in police-reported crash rates
-80%
-60%
-40%
-20%
0%
20%
40%
60%
Honda
Accord
camera(w/LDW)
Honda
Accord
radar(w/LDW+ACC)
Mercedes-
Benz
Volvo warning
only
pooled
Acura Mercedes-
Benz
Subaru
(w/LDW)
Volvo
(w/LDW)
autobrake
pooled
warning onlywarning with
autobrake
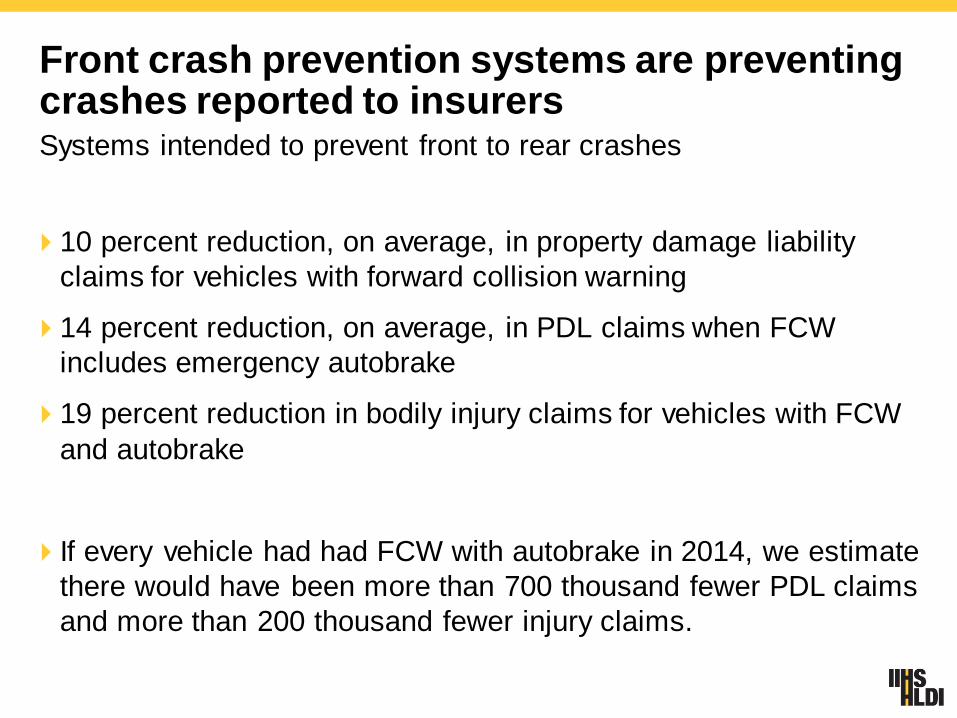
Front crash prevention systems are preventing crashes reported to insurersSystems intended to prevent front to rear crashes
10 percent reduction, on average, in property damage liability
claims for vehicles with forward collision warning
14 percent reduction, on average, in PDL claims when FCW
includes emergency autobrake
19 percent reduction in bodily injury claims for vehicles with FCW
and autobrake
If every vehicle had had FCW with autobrake in 2014, we estimate
there would have been more than 700 thousand fewer PDL claims
and more than 200 thousand fewer injury claims.

Other evidence of AEB effectivenessFrom outside the U.S.
Effectiveness of low-speed autonomous emergency braking in real-world
rear-end crashes; Fildes, B. et al. Accident Analysis and Prevention,
August 2015
– 38 percent reduction of rear-end injury crashes for vehicles with systems compared to
those without
Real-World Performance of City Safety Based on Swedish Insurance Data;
Isaksson-Hellman, I. and Lindman, M. 2015 ESV Conference
– 28 percent reduction in front-to-rear insurance claim frequency
AEB Real—world validation using UK motor insurance claims data;
Doyle, M., Edwards, A., Avery. M 2015 ESV Conference
– 1-6 percent reduction in own damage claim frequency
– 8-20 percent reduction in 3rd party damage claim frequency
– 21-45 percent reduction in 3rd party injury claim frequency
Lane departure warning is not working as expected

Lane departure warning

Lane departure warningChange in claim frequency
-20%
-10%
0%
10%
Mercedes-Benz Buick(with
Blindspot)
Mazda HondaAccordcamera
(withFCW)
HondaAccordradar(with
FCW/ACC)
Subaru(with
FCW/AEB)
Volvo(with
FCW/AEB)
PDL collision
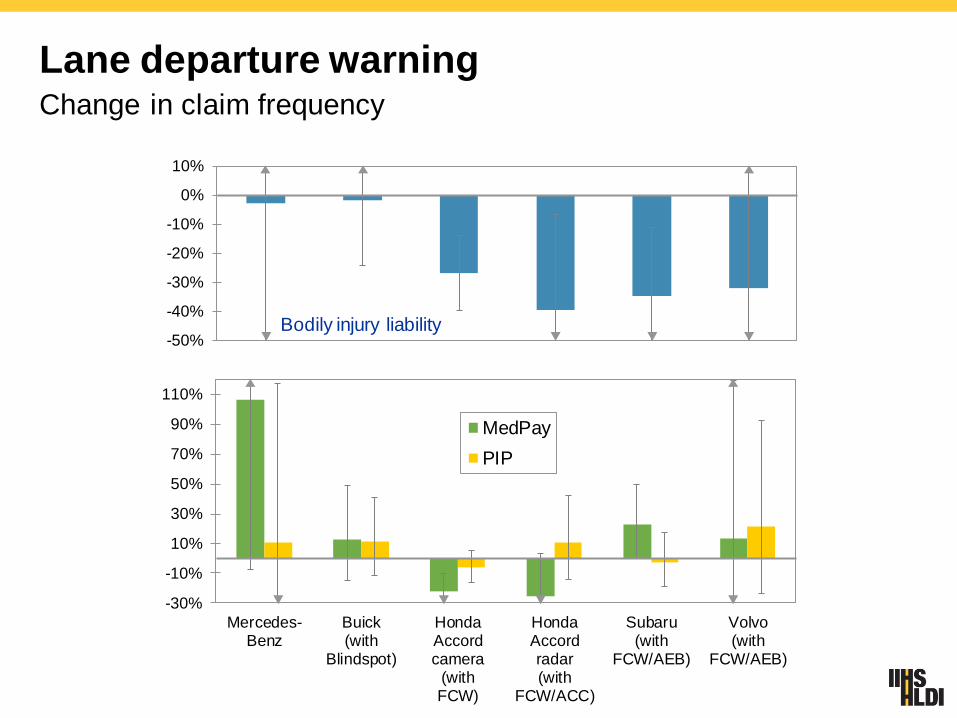
Lane departure warningChange in claim frequency
-50%
-40%
-30%
-20%
-10%
0%
10%
Mercedes Buick HondaAccordcamera
(w/FCW)
HondaAccordradar
(w/FCW &ACC)
Subaru(w/
FCW/AEB)
Volvo
-30%
-10%
10%
30%
50%
70%
90%
110%
Mercedes-Benz
Buick(with
Blindspot)
HondaAccordcamera
(withFCW)
HondaAccordradar(with
FCW/ACC)
Subaru(with
FCW/AEB)
Volvo(with
FCW/AEB)
MedPay
PIP
Bodily injury liability

Percent of vehicle owners who reported driving with systems on
0
20
40
60
80
100
Toyotaforward collision
warning
Volvoforward collsion
warning
Dodge and Jeepforward collision
warning
Volvolane departure
warning
Infinitilane departure
warning
unknown
never
sometimes
always

Percent of vehicles with lane departure warning or forward collision warning activatedObservations at Honda Dealers - 2015
percent with
FCW on
percent with
LDW on
Accord99
(n = 98)
40
(n = 139)
CR-V100
(n = 6)
33
(n = 6)
Odyssey100
(n = 77)
25
(n = 120)
total99.5
(n = 182)
32
(n = 265)

Adaptive headlights

Adaptive headlights
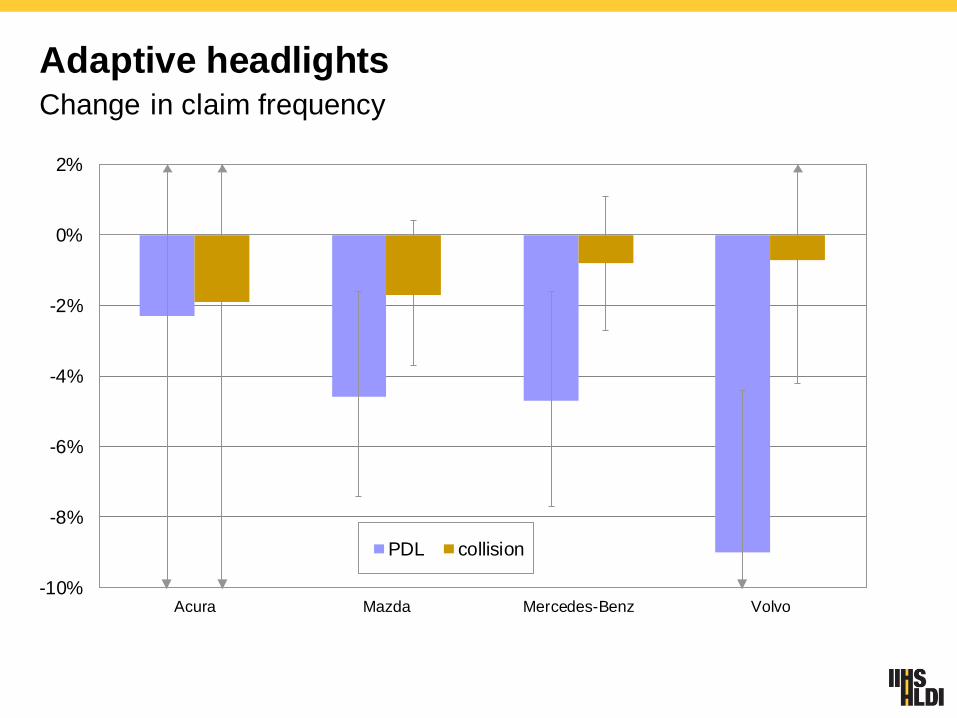
Adaptive headlightsChange in claim frequency
-10%
-8%
-6%
-4%
-2%
0%
2%
Acura Mazda Mercedes-Benz Volvo
PDL collision
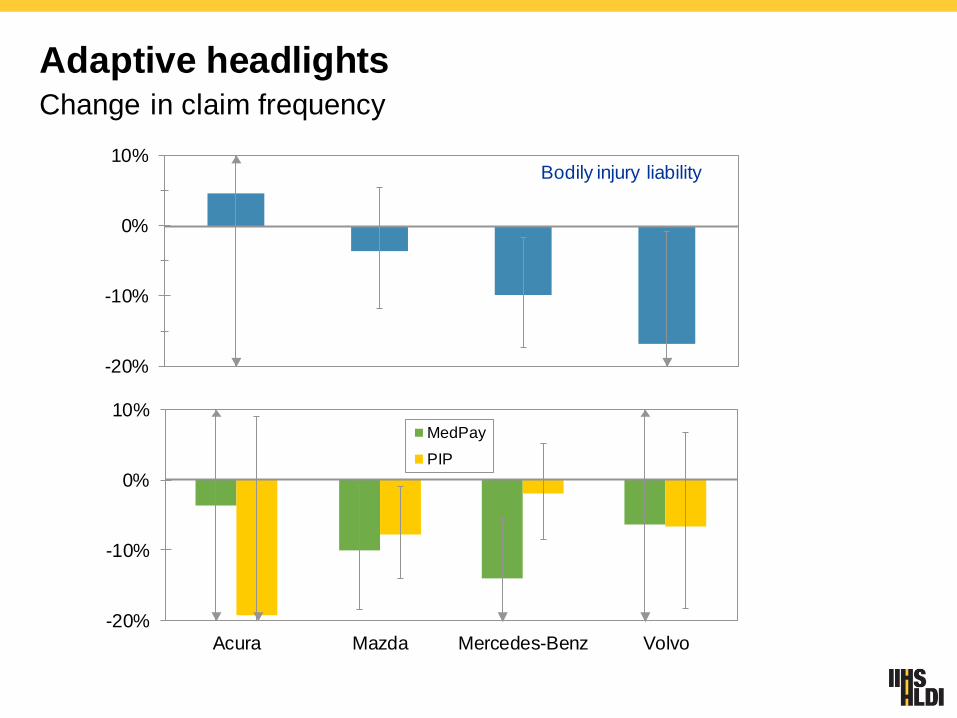
Adaptive headlightsChange in claim frequency
-20%
-10%
0%
10%
Acura Mazda Mercedes Volvo
Bodily injury liability
-20%
-10%
0%
10%
Acura Mazda Mercedes-Benz Volvo
MedPay
PIP

Blind spot monitoring

Blind spot monitoring
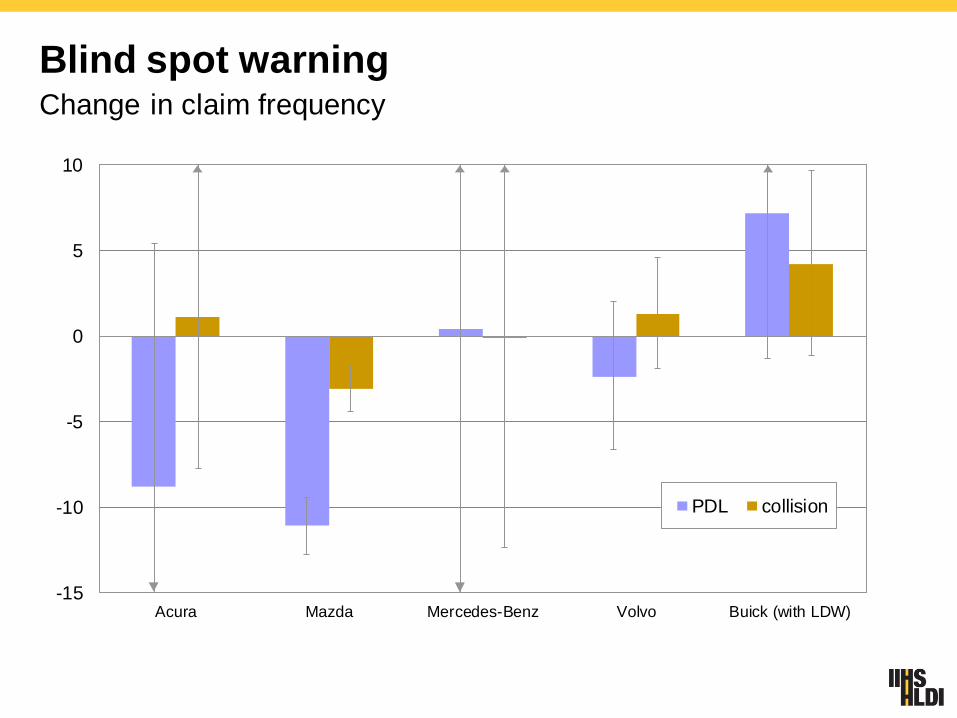
Blind spot warningChange in claim frequency
-15
-10
-5
0
5
10
Acura Mazda Mercedes-Benz Volvo Buick (with LDW)
PDL collision

Blind spot warningChange in claim frequency
-20
-15
-10
-5
0
5
Acura Mazda Mercedes Volvo Buick
-30
-20
-10
0
10
Acura Mazda Mercedes Volvo Buick(with LDW)
MedPay
PIP
Bodily injury liability

insurance claims
reductions in percent
Collision PDL BIL
front crash prevention2A 9A 15A
2B 14B 19B
adaptive headlights 1 5 8
lane departure prevention 1C (1)C 3D
side view assist (blind spot) 2 10 16
Insurance claim frequency reduction for 4 crash avoidance technologiesPooled estimates across vehicle models
C = Mercedes & Mazda LDW onlyD = Mercedes only
A = FCW without autobrake
B = FCW with autobrake

Front crash prevention testing and rating

Front crash prevention releases
Update of FCP ratings
May 2014
24 additional models evaluated
79 million
Inaugural FCP ratings
September 2013
74 models evaluated
Estimated audience –
58 million
Update of FCP ratings
August 2015
19 additional models evaluated


Front crash prevention ratings
vehicles without forward collision warning or autobrake; or
vehicles equipped with a system that doesn’t meet NHTSA or
IIHS criteria
vehicles earning 1 point for forward collision warning
or 1 point in either 20 or 40 km/h test
vehicles with autobrake that achieve 2-4 points for forward
collision warning and/or performance in autobraking tests
vehicles with autobrake that achieve 5-6 points for forward
collision warning and/or performance in autobraking tests

Front crash prevention ratings2013-16 models (as of February 2016)
134
40
11 10
111
51
28
19
81
56
4034
43
50
37
51
0
20
40
60
80
100
120
140
160
Not qualified/notavailable
Basic Advanced Superior
2013 2014 2015 2016

Headlight rating system
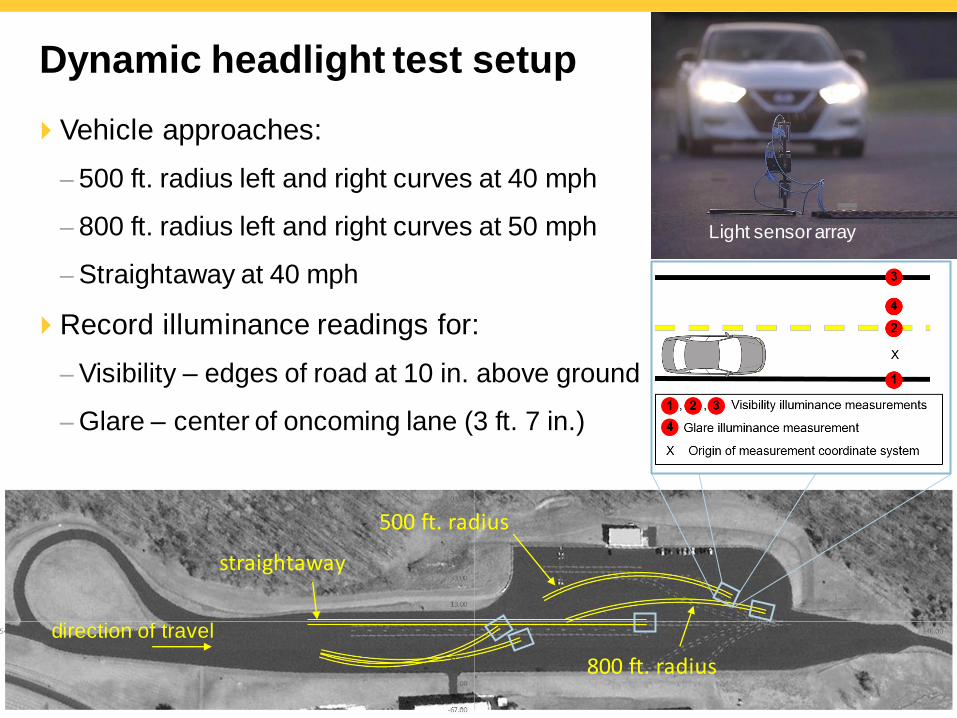
Vehicle approaches:
– 500 ft. radius left and right curves at 40 mph
– 800 ft. radius left and right curves at 50 mph
– Straightaway at 40 mph
Record illuminance readings for:
– Visibility – edges of road at 10 in. above ground
– Glare – center of oncoming lane (3 ft. 7 in.)
Dynamic headlight test setup
800 ft. radius
500 ft. radius
straightaway
direction of travel
Light sensorarray

Low beam illumination on straight roadh
alo
gen
ha
loge
n
ha
loge
n
ha
loge
n
ha
loge
n
ha
loge
n
ha
loge
n
LED
HID
ha
loge
n LED
ha
loge
n
ha
loge
n
ha
loge
n
ha
loge
n
ha
loge
n
LED
LED HID
LED
HID
ha
loge
n
HID
HID h
alo
gen
LED
LED
LED
LED
HID
HID
0
100
200
300
400
500
600
2016Nissan
Maxima
2015Cadillac
ATS
2016HondaAccord
2016Subaru
Outback
2015NissanAltima
2016Mazda 6
2016Lincoln
MKZ
2016Mercedes
C300
2015Infiniti
Q50
2016SubaruLegacy
2015Chrysler
200
2016AcuraTLX
2015Chevrolet
Malibu
2016Buick
Verano
2016Ford
Fusion
2016VolvoS60
2016Mercedes
CLA250
5 lu
x di
stan
ce (
ft.)
not curve-adaptive system
curve-adaptive system
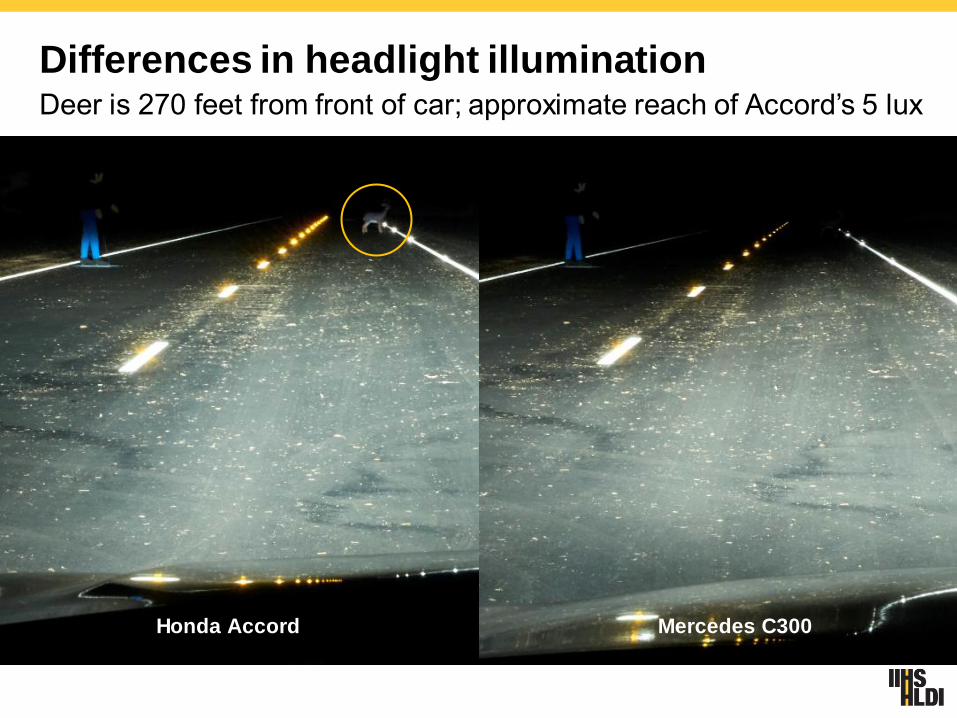
Differences in headlight illuminationDeer is 270 feet from front of car; approximate reach of Accord’s 5 lux
Honda Accord Mercedes C300

Translating test results to ratings
Rating based on:
– Straightaway and curve visibility (weighting roughly 60/40)
– Low and high beams (weighting roughly 75/25)
– Acceptable glare
Bonus given for automatic high beams (“high beam assist”)
Results of all tests will be combined into an overall demerit score
with rating boundaries applied
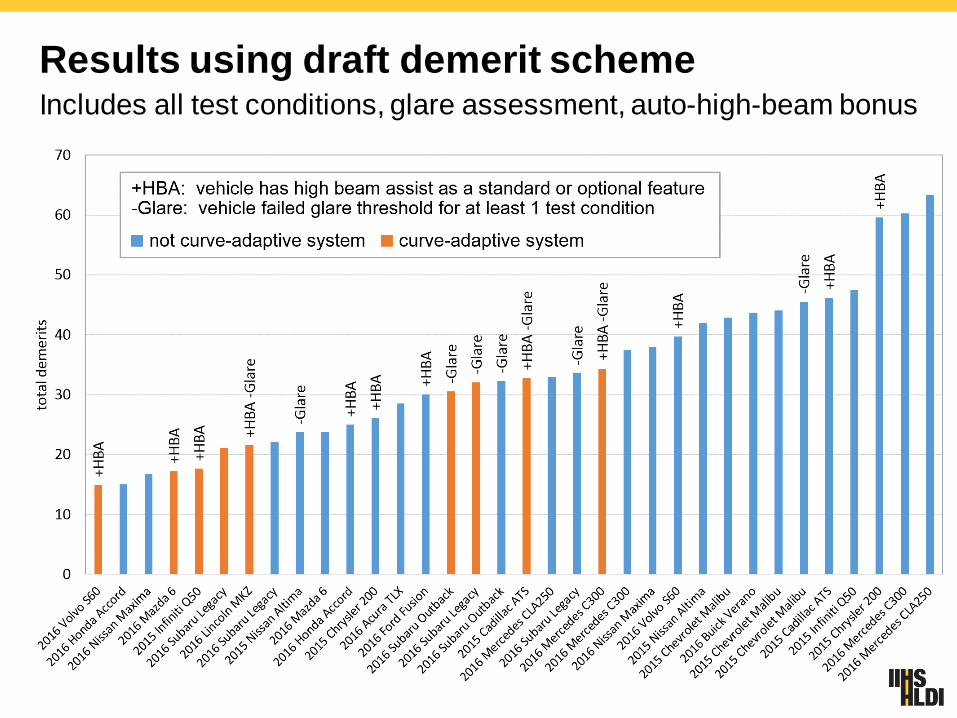
Results using draft demerit schemeIncludes all test conditions, glare assessment, auto-high-beam bonus

Feat(ure)s for Fleets

TOP SAFETY PICKs

Requirements for 2016 TOP SAFETY PICK awards
Good rating in moderate overlap front, small overlap front,
side, roof strength and head restraint tests
Basic rating for front crash prevention
meet TOP SAFETY PICK criteria
&Advanced or Superior rating for front crash prevention
&
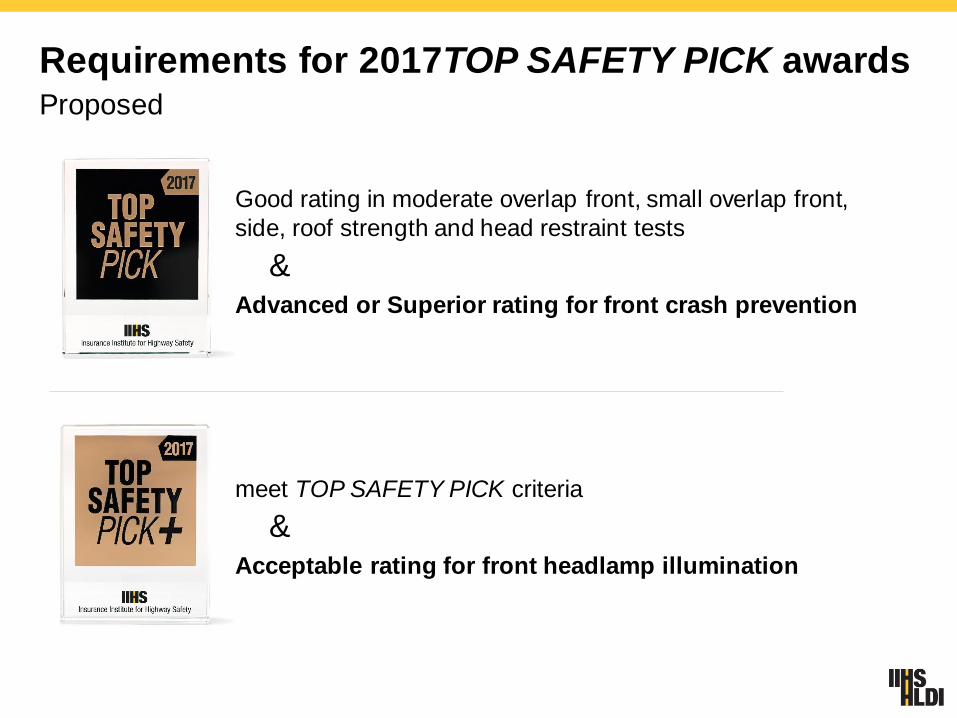
Requirements for 2017TOP SAFETY PICK awardsProposed
Good rating in moderate overlap front, small overlap front,
side, roof strength and head restraint tests
Advanced or Superior rating for front crash prevention
meet TOP SAFETY PICK criteria
&Acceptable rating for front headlamp illumination
&

Effects of increasing belt use in 2014Belt use was estimated at 87% in 2014
target %
belt use
lives
saved
90% 1,057
95% 2,818
100% 4,579

General Motors Seat Belt Assurance System
GM introduced an industry-first Seat Belt Assurance System
(SBAS) in 2014.
This Fleet SBAS feature is available to fleet purchasers as an
option on the 2016 Chevrolet Cruze, Silverado, and Colorado, and
the 2016 GMC Sierra pickup trucks.

General Motors fleet SBAS feature
The Fleet SBAS feature is a seat belt
interlock that prevents the driver from
shifting out of ‘park’ if the driver or a
detected front passenger is unbelted.
The driver will receive a message in the
Driver Information Center indicating that
the shifter is locked, and a seatbelt
needs to be buckled.

General Motors fleet SBAS feature
The Fleet SBAS feature utilizes the driver and front passenger
seat belt buckle switches, the front passenger occupant detection
system, the brake transmission shift interlock, the Driver
Information Center, and the vehicle sensing diagnostic module.

Customer clinic resultsOverall acceptance (with 99% Z-confidence interval for the Mean and StDev = 1.547)
High level of overall
acceptance (92%)
8% felt system was
less than acceptable
Please rate the extent to which you agree with the following statement. Not being
able to shift before both front occupants were buckled was acceptable to me
1 2 3 4 5 6 7
strongly
disagree
neutral strongly
agree
num
be
r o
f p
art
icip
ants
acceptance rating

27 OCTOBER 2016
VIRGINIA, USA
GLOBAL NCAP FLEET SAFETY OPEN DAY
SAVE THE DATE

iihs.org
More information and links to our YouTube channeland Twitter feed at iihs.org