Embed Size (px)
Citation preview
25
FEATURE STORYFEATURE STORY
24 MISSION: WATER Who’s Minding the Planet?
ON ICESTEVE WERBLOW
Stream Flow Data Improve Greenland Ice Melt Models
GREENLAND
ICELAND
NUUK Capital
pop. 18,000
Study Site Mid-Abalation Zone
3,205 m
the helicopter lifted a net full of camping supplies off the ice, turning to carry it to a safer location. On the windblown landscape, a small knot of scientists watched it leave. The day before, the group had chosen the site as their base of operations for a bold, multi-day study of the flow of meltwater across the surface of the Greenland Ice Sheet. But when they arrived with the chopper that morning, they realized a flash flood had occurred while they were gone, strewing car-sized chunks of ice across the area. Clearly, the site was not as safe as it had seemed when they chose it by analyzing satellite photos and flying over it the previous day.
The pilot promised to be back in a few hours for the team. "Watching him fly away was like, 'what have we done?'" laughs Brandon Overstreet, a University of Wyoming graduate student. He kept an anxious eye on a cloud bank on the horizon, hoping it wouldn't blow in and delay the chopper's return.
A few feet away, University of California, Los Angeles (UCLA) graduate student Lincoln Pitcher reveled in the adventure of being surrounded by miles of ice, his team's only link to distant civilization a satellite phone in his pack.
"Where else can you do that?" he asks.
ABLATION ZONE Elevation breaks the glaciers that comprise the Greenland Ice Sheet into distinct zones. In the frigid higher elevations, glaciers have accumulation zones covered with snow and firn, the dense, compacted old snow that represents the middle ground between snow and glacial ice. At lower elevations, ambient temperatures are warm enough to melt away the snow and firn, leaving a bare aBlation zone where ice melts, evaporates or sublimates in the sun. A team led by UCLA’s Laurence C. Smith worked in the mid-ablation zone, where runoff is high—just right for studying the evolution of the ice sheet and beginning to understand the future of glacial melting in a changing climate.
A team of scientists watches from its camp on the Greenland Ice Sheet as its helicopter lifts off. Photo Courtesy: Lincoln Pitcher
27MISSION: WATER26
FEATURE STORYFEATURE STORY
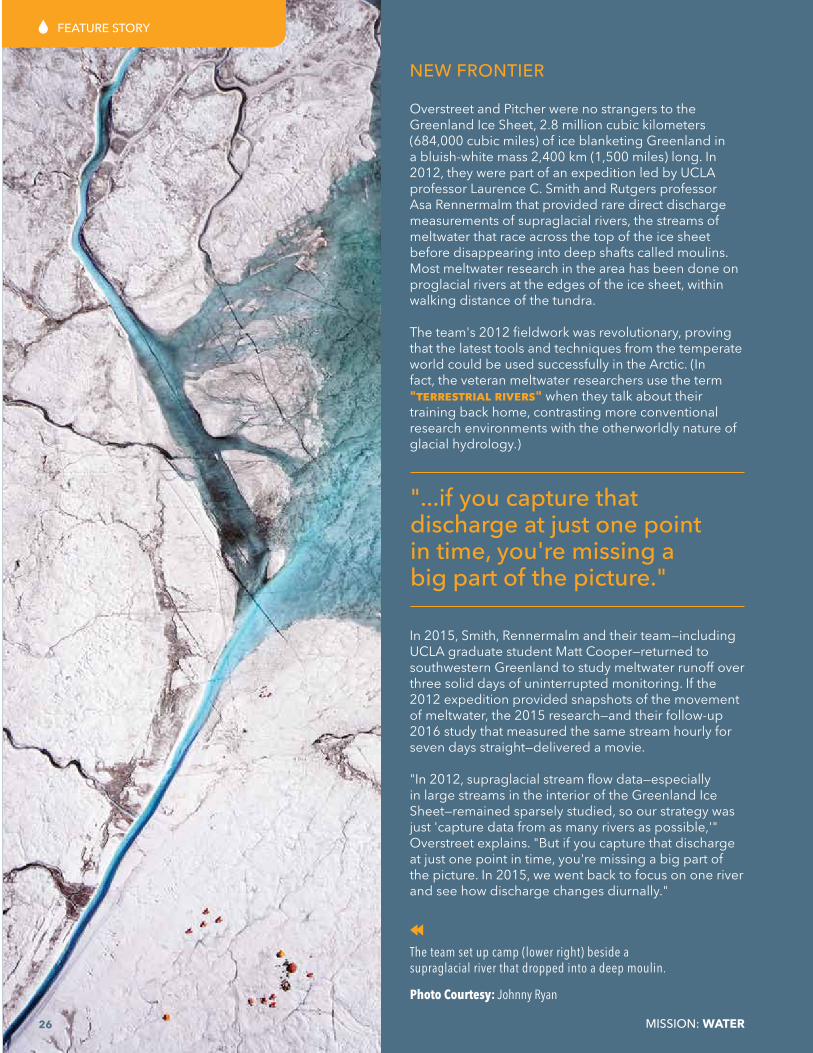
NEW FRONTIER Overstreet and Pitcher were no strangers to the Greenland Ice Sheet, 2.8 million cubic kilometers (684,000 cubic miles) of ice blanketing Greenland in a bluish-white mass 2,400 km (1,500 miles) long. In 2012, they were part of an expedition led by UCLA professor Laurence C. Smith and Rutgers professor Asa Rennermalm that provided rare direct discharge measurements of supraglacial rivers, the streams of meltwater that race across the top of the ice sheet before disappearing into deep shafts called moulins. Most meltwater research in the area has been done on proglacial rivers at the edges of the ice sheet, within walking distance of the tundra. The team's 2012 fieldwork was revolutionary, proving that the latest tools and techniques from the temperate world could be used successfully in the Arctic. (In fact, the veteran meltwater researchers use the term "terrestrial rivers" when they talk about their training back home, contrasting more conventional research environments with the otherworldly nature of glacial hydrology.)
In 2015, Smith, Rennermalm and their team—including UCLA graduate student Matt Cooper—returned to southwestern Greenland to study meltwater runoff over three solid days of uninterrupted monitoring. If the 2012 expedition provided snapshots of the movement of meltwater, the 2015 research—and their follow-up 2016 study that measured the same stream hourly for seven days straight—delivered a movie. "In 2012, supraglacial stream flow data—especially in large streams in the interior of the Greenland Ice Sheet—remained sparsely studied, so our strategy was just 'capture data from as many rivers as possible,'" Overstreet explains. "But if you capture that discharge at just one point in time, you're missing a big part of the picture. In 2015, we went back to focus on one river and see how discharge changes diurnally."
GROUND TRUTHING Measuring diurnal changes in the flow of meltwater provided critical insight into the accuracy of mathematical models of glacial melting, as well as vital data that will help improve those models. Scientists engaged in a wide range of climate science disciplines rely on surface mass balance models that predict the effects of temperature, solar radiation and the reflectance of the ice surface on the rate of glacial melting. Until the 1980s or '90s, most of the mass deposited into the ocean from the Greenland Ice Sheet was the result of dynamical flow, the slow movement of the glacier as the weight of ice and snow causes it to deform and creep to the sea. At the end of their journey, the leading edges of the glaciers crumble into the sea, contributing water to the ocean as melting icebergs.
However, in the past 20 to 30 years, glacial melting has eclipsed dynamical flow as the main source of water conveyance from glaciers to the ocean, says Cooper. He adds that meltwater flowing into moulins also affects the rate of dynamical flow. If meltwater makes its way to the base of the glacier through narrow channels, it can become so pressurized that it lifts the glacier like a hydraulic jack, Cooper says, speeding the glacier's slide to the sea and increasing the rate of iceberg calving. But if the meltwater runoff increases to the point that it creates a bigger, more efficient conveyance network, a higher rate of melting could actually reduce the pressure at the base of the glacier and slow the movement of the ice.
So whether the question is how quickly meltwater is running into the ocean or how it may be speeding or
slowing the movement of the glacier itself, surface mass balance glacial melting models are crucial tools in estimating the answers and predicting their results. To find out, the Smith/Rennermalm team chose a supraglacial river to study, which they named rio Behar after a colleague. For 72 hours straight, they measured stream flow, as well as detailed weather readings, building a huge, real-life database of water movement and conditions at the site. They then teamed up with modeling teams who ran models with meteorological data from the site to compare their field data with the model outputs. The team found that the surface mass balance models overestimated the runoff by 21 to 58 percent. The team also noted a lag time of 0.4 to 9.5 hours between periods of high melting and increases in river discharge that was not reflected in the model predictions.
The team set up camp (lower right) beside a supraglacial river that dropped into a deep moulin. Photo Courtesy: Johnny Ryan
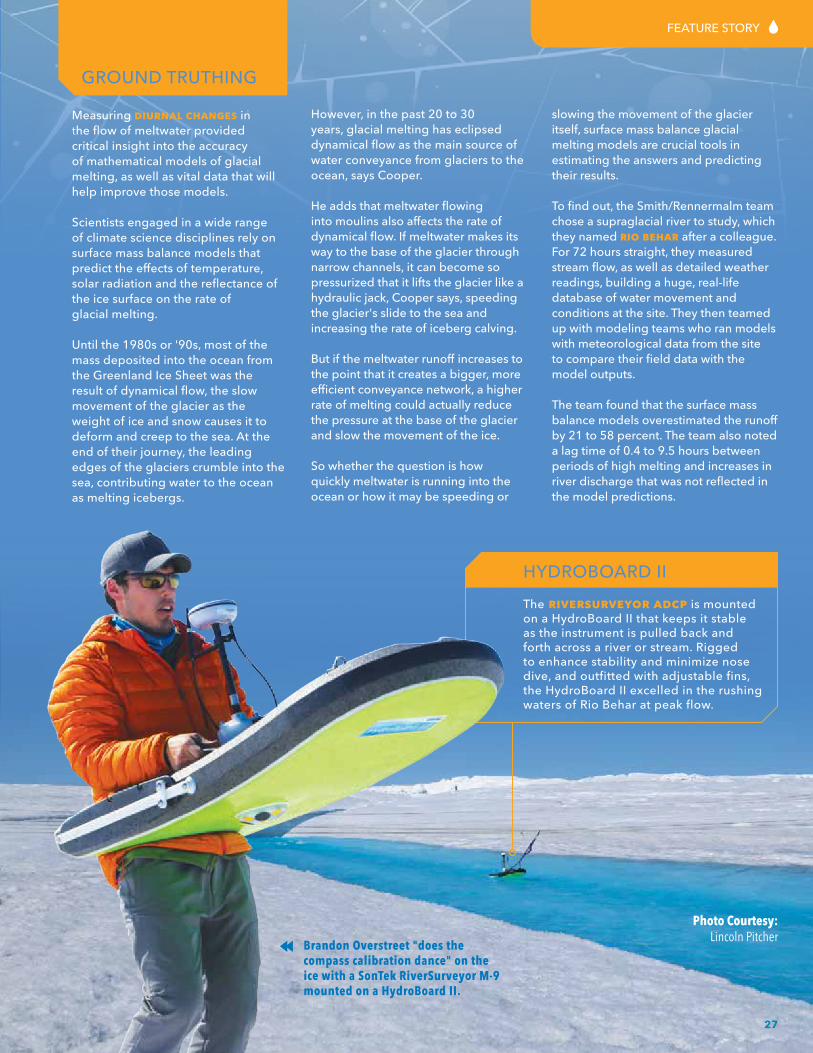
Brandon Overstreet "does the compass calibration dance" on the ice with a SonTek RiverSurveyor M-9 mounted on a HydroBoard II.
"...if you capture that discharge at just one point in time, you're missing a big part of the picture." HYDROBOARD II
The riversurveyor adcp is mounted on a HydroBoard II that keeps it stable as the instrument is pulled back and forth across a river or stream. Rigged to enhance stability and minimize nose dive, and outfitted with adjustable fins, the HydroBoard II excelled in the rushing waters of Rio Behar at peak flow.
Photo Courtesy: Lincoln Pitcher
27MISSION: WATER26
FEATURE STORYFEATURE STORY
NEW FRONTIER Overstreet and Pitcher were no strangers to the Greenland Ice Sheet, 2.8 million cubic kilometers (684,000 cubic miles) of ice blanketing Greenland in a bluish-white mass 2,400 km (1,500 miles) long. In 2012, they were part of an expedition led by UCLA professor Laurence C. Smith and Rutgers professor Asa Rennermalm that provided rare direct discharge measurements of supraglacial rivers, the streams of meltwater that race across the top of the ice sheet before disappearing into deep shafts called moulins. Most meltwater research in the area has been done on proglacial rivers at the edges of the ice sheet, within walking distance of the tundra. The team's 2012 fieldwork was revolutionary, proving that the latest tools and techniques from the temperate world could be used successfully in the Arctic. (In fact, the veteran meltwater researchers use the term "terrestrial rivers" when they talk about their training back home, contrasting more conventional research environments with the otherworldly nature of glacial hydrology.)
In 2015, Smith, Rennermalm and their team—including UCLA graduate student Matt Cooper—returned to southwestern Greenland to study meltwater runoff over three solid days of uninterrupted monitoring. If the 2012 expedition provided snapshots of the movement of meltwater, the 2015 research—and their follow-up 2016 study that measured the same stream hourly for seven days straight—delivered a movie. "In 2012, supraglacial stream flow data—especially in large streams in the interior of the Greenland Ice Sheet—remained sparsely studied, so our strategy was just 'capture data from as many rivers as possible,'" Overstreet explains. "But if you capture that discharge at just one point in time, you're missing a big part of the picture. In 2015, we went back to focus on one river and see how discharge changes diurnally."
GROUND TRUTHING Measuring diurnal changes in the flow of meltwater provided critical insight into the accuracy of mathematical models of glacial melting, as well as vital data that will help improve those models. Scientists engaged in a wide range of climate science disciplines rely on surface mass balance models that predict the effects of temperature, solar radiation and the reflectance of the ice surface on the rate of glacial melting. Until the 1980s or '90s, most of the mass deposited into the ocean from the Greenland Ice Sheet was the result of dynamical flow, the slow movement of the glacier as the weight of ice and snow causes it to deform and creep to the sea. At the end of their journey, the leading edges of the glaciers crumble into the sea, contributing water to the ocean as melting icebergs.
However, in the past 20 to 30 years, glacial melting has eclipsed dynamical flow as the main source of water conveyance from glaciers to the ocean, says Cooper. He adds that meltwater flowing into moulins also affects the rate of dynamical flow. If meltwater makes its way to the base of the glacier through narrow channels, it can become so pressurized that it lifts the glacier like a hydraulic jack, Cooper says, speeding the glacier's slide to the sea and increasing the rate of iceberg calving. But if the meltwater runoff increases to the point that it creates a bigger, more efficient conveyance network, a higher rate of melting could actually reduce the pressure at the base of the glacier and slow the movement of the ice.
So whether the question is how quickly meltwater is running into the ocean or how it may be speeding or
slowing the movement of the glacier itself, surface mass balance glacial melting models are crucial tools in estimating the answers and predicting their results. To find out, the Smith/Rennermalm team chose a supraglacial river to study, which they named rio Behar after a colleague. For 72 hours straight, they measured stream flow, as well as detailed weather readings, building a huge, real-life database of water movement and conditions at the site. They then teamed up with modeling teams who ran models with meteorological data from the site to compare their field data with the model outputs. The team found that the surface mass balance models overestimated the runoff by 21 to 58 percent. The team also noted a lag time of 0.4 to 9.5 hours between periods of high melting and increases in river discharge that was not reflected in the model predictions.
The team set up camp (lower right) beside a supraglacial river that dropped into a deep moulin. Photo Courtesy: Johnny Ryan
Brandon Overstreet "does the compass calibration dance" on the ice with a SonTek RiverSurveyor M-9 mounted on a HydroBoard II.
"...if you capture that discharge at just one point in time, you're missing a big part of the picture." HYDROBOARD II
The riversurveyor adcp is mounted on a HydroBoard II that keeps it stable as the instrument is pulled back and forth across a river or stream. Rigged to enhance stability and minimize nose dive, and outfitted with adjustable fins, the HydroBoard II excelled in the rushing waters of Rio Behar at peak flow.
Photo Courtesy: Lincoln Pitcher
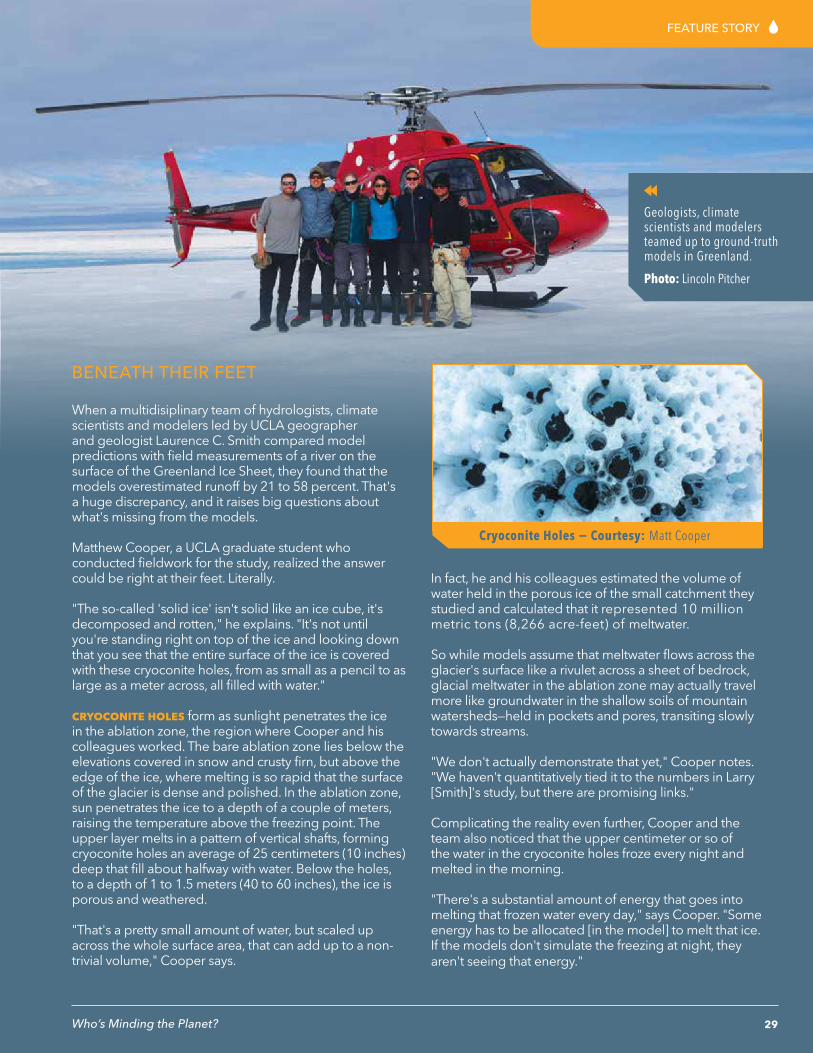
BENEATH THEIR FEET When a multidisiplinary team of hydrologists, climate scientists and modelers led by UCLA geographer and geologist Laurence C. Smith compared model predictions with field measurements of a river on the surface of the Greenland Ice Sheet, they found that the models overestimated runoff by 21 to 58 percent. That's a huge discrepancy, and it raises big questions about what's missing from the models. Matthew Cooper, a UCLA graduate student who conducted fieldwork for the study, realized the answer could be right at their feet. Literally. "The so-called 'solid ice' isn't solid like an ice cube, it's decomposed and rotten," he explains. "It's not until you're standing right on top of the ice and looking down that you see that the entire surface of the ice is covered with these cryoconite holes, from as small as a pencil to as large as a meter across, all filled with water."
cryoconite holes form as sunlight penetrates the ice in the ablation zone, the region where Cooper and his colleagues worked. The bare ablation zone lies below the elevations covered in snow and crusty firn, but above the edge of the ice, where melting is so rapid that the surface of the glacier is dense and polished. In the ablation zone, sun penetrates the ice to a depth of a couple of meters, raising the temperature above the freezing point. The upper layer melts in a pattern of vertical shafts, forming cryoconite holes an average of 25 centimeters (10 inches) deep that fill about halfway with water. Below the holes, to a depth of 1 to 1.5 meters (40 to 60 inches), the ice is porous and weathered. "That's a pretty small amount of water, but scaled up across the whole surface area, that can add up to a non-trivial volume," Cooper says.
In fact, he and his colleagues estimated the volume of water held in the porous ice of the small catchment they studied and calculated that it represented 10 million metric tons (8,266 acre-feet) of meltwater.
So while models assume that meltwater flows across the glacier's surface like a rivulet across a sheet of bedrock, glacial meltwater in the ablation zone may actually travel more like groundwater in the shallow soils of mountain watersheds—held in pockets and pores, transiting slowly towards streams. "We don't actually demonstrate that yet," Cooper notes. "We haven't quantitatively tied it to the numbers in Larry [Smith]'s study, but there are promising links." Complicating the reality even further, Cooper and the team also noticed that the upper centimeter or so of the water in the cryoconite holes froze every night and melted in the morning. "There's a substantial amount of energy that goes into melting that frozen water every day," says Cooper. "Some energy has to be allocated [in the model] to melt that ice. If the models don't simulate the freezing at night, they aren't seeing that energy."
Cryoconite Holes − Courtesy: Matt Cooper
Geologists, climate scientists and modelers teamed up to ground-truth models in Greenland. Photo: Lincoln Pitcher
MISSION: WATER28 29
FEATURE STORYFEATURE STORY
Who’s Minding the Planet?
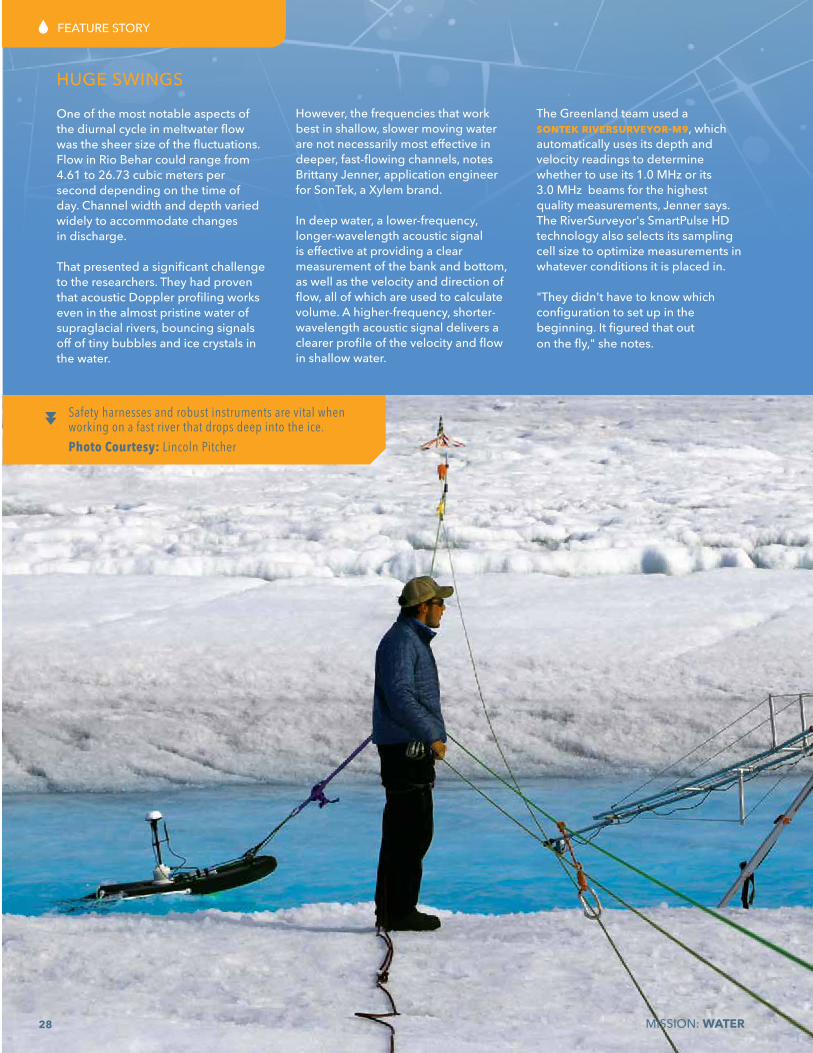
HUGE SWINGS One of the most notable aspects of the diurnal cycle in meltwater flow was the sheer size of the fluctuations. Flow in Rio Behar could range from 4.61 to 26.73 cubic meters per second depending on the time of day. Channel width and depth varied widely to accommodate changes in discharge. That presented a significant challenge to the researchers. They had proven that acoustic Doppler profiling works even in the almost pristine water of supraglacial rivers, bouncing signals off of tiny bubbles and ice crystals in the water.
However, the frequencies that work best in shallow, slower moving water are not necessarily most effective in deeper, fast-flowing channels, notes Brittany Jenner, application engineer for SonTek, a Xylem brand. In deep water, a lower-frequency, longer-wavelength acoustic signal is effective at providing a clear measurement of the bank and bottom, as well as the velocity and direction of flow, all of which are used to calculate volume. A higher-frequency, shorter-wavelength acoustic signal delivers a clearer profile of the velocity and flow in shallow water.
The Greenland team used a sontek riversurveyor-m9, which automatically uses its depth and velocity readings to determine whether to use its 1.0 MHz or its 3.0 MHz beams for the highest quality measurements, Jenner says. The RiverSurveyor's SmartPulse HD technology also selects its sampling cell size to optimize measurements in whatever conditions it is placed in. "They didn't have to know which configuration to set up in the beginning. It figured that out on the fly," she notes.
Safety harnesses and robust instruments are vital when working on a fast river that drops deep into the ice. Photo Courtesy: Lincoln Pitcher
BENEATH THEIR FEET When a multidisiplinary team of hydrologists, climate scientists and modelers led by UCLA geographer and geologist Laurence C. Smith compared model predictions with field measurements of a river on the surface of the Greenland Ice Sheet, they found that the models overestimated runoff by 21 to 58 percent. That's a huge discrepancy, and it raises big questions about what's missing from the models. Matthew Cooper, a UCLA graduate student who conducted fieldwork for the study, realized the answer could be right at their feet. Literally. "The so-called 'solid ice' isn't solid like an ice cube, it's decomposed and rotten," he explains. "It's not until you're standing right on top of the ice and looking down that you see that the entire surface of the ice is covered with these cryoconite holes, from as small as a pencil to as large as a meter across, all filled with water."
cryoconite holes form as sunlight penetrates the ice in the ablation zone, the region where Cooper and his colleagues worked. The bare ablation zone lies below the elevations covered in snow and crusty firn, but above the edge of the ice, where melting is so rapid that the surface of the glacier is dense and polished. In the ablation zone, sun penetrates the ice to a depth of a couple of meters, raising the temperature above the freezing point. The upper layer melts in a pattern of vertical shafts, forming cryoconite holes an average of 25 centimeters (10 inches) deep that fill about halfway with water. Below the holes, to a depth of 1 to 1.5 meters (40 to 60 inches), the ice is porous and weathered. "That's a pretty small amount of water, but scaled up across the whole surface area, that can add up to a non-trivial volume," Cooper says.
In fact, he and his colleagues estimated the volume of water held in the porous ice of the small catchment they studied and calculated that it represented 10 million metric tons (8,266 acre-feet) of meltwater.
So while models assume that meltwater flows across the glacier's surface like a rivulet across a sheet of bedrock, glacial meltwater in the ablation zone may actually travel more like groundwater in the shallow soils of mountain watersheds—held in pockets and pores, transiting slowly towards streams. "We don't actually demonstrate that yet," Cooper notes. "We haven't quantitatively tied it to the numbers in Larry [Smith]'s study, but there are promising links." Complicating the reality even further, Cooper and the team also noticed that the upper centimeter or so of the water in the cryoconite holes froze every night and melted in the morning. "There's a substantial amount of energy that goes into melting that frozen water every day," says Cooper. "Some energy has to be allocated [in the model] to melt that ice. If the models don't simulate the freezing at night, they aren't seeing that energy."
Cryoconite Holes − Courtesy: Matt Cooper
Geologists, climate scientists and modelers teamed up to ground-truth models in Greenland. Photo: Lincoln Pitcher
MISSION: WATER28 29
FEATURE STORYFEATURE STORY
Who’s Minding the Planet?
HUGE SWINGS One of the most notable aspects of the diurnal cycle in meltwater flow was the sheer size of the fluctuations. Flow in Rio Behar could range from 4.61 to 26.73 cubic meters per second depending on the time of day. Channel width and depth varied widely to accommodate changes in discharge. That presented a significant challenge to the researchers. They had proven that acoustic Doppler profiling works even in the almost pristine water of supraglacial rivers, bouncing signals off of tiny bubbles and ice crystals in the water.
However, the frequencies that work best in shallow, slower moving water are not necessarily most effective in deeper, fast-flowing channels, notes Brittany Jenner, application engineer for SonTek, a Xylem brand. In deep water, a lower-frequency, longer-wavelength acoustic signal is effective at providing a clear measurement of the bank and bottom, as well as the velocity and direction of flow, all of which are used to calculate volume. A higher-frequency, shorter-wavelength acoustic signal delivers a clearer profile of the velocity and flow in shallow water.
The Greenland team used a sontek riversurveyor-m9, which automatically uses its depth and velocity readings to determine whether to use its 1.0 MHz or its 3.0 MHz beams for the highest quality measurements, Jenner says. The RiverSurveyor's SmartPulse HD technology also selects its sampling cell size to optimize measurements in whatever conditions it is placed in. "They didn't have to know which configuration to set up in the beginning. It figured that out on the fly," she notes.
Safety harnesses and robust instruments are vital when working on a fast river that drops deep into the ice. Photo Courtesy: Lincoln Pitcher
We would like to thank the UCLA Greenland team for sharing their study and photography through Mission: Water magazine.
MISSION: WATER 3130 Who’s Minding the Planet?
HEADLINEFEATURE STORY
A LOT AT STAKE During the survey, the RiverSurveyor-M9 was mounted on a HydroBoard, which is pulled from bank to bank to gather data along a transect. The Greenland team gathered at least four transects each hour. That was a challenge in itself—the river banks were nearly vertical, and a few hundred meters downstream, the river dropped into a moulin that would have swallowed the RiverSurveyor forever.
"We knew if we lost it, it wasn't coming back," says Pitcher, who worked with Overstreet and HydroBoard II designer Bob Carlson on designing and rigging an anchoring system that could be operated from one side of the unfordable stream and would remain rooted in place as the surface of the ice dropped up to 5 centimeters (2 inches) per day due to melting and sublimation.
"Once we set up on a river, we only had access to one side," Pitcher explains. The helicopter that ferried the team and their gear could shuttle Pitcher and the rest of the set-up crew across the river a time or two, but once the chopper left, there was no way to cross again.
For a short deployment, ice screws could suffice. But as a day wore on, the metal screws would have conducted solar energy into the ice and melted their anchorages. Instead, Pitcher and Overstreet borrowed a trick from ice climbers, drilling a meter-deep "V" into the dense ice below the crumbing surface and threading thick webbing through the channel to anchor the rigging that secured and controlled the floating RiverSurveyor.
The team also planted an upright bamboo pole deep into the ice to serve as a stable, known georeferencing point for periodic calibration of location tracking data.
IMPROVING THE SCIENCE In late 2017, the team published its 2015 Rio Behar data alongside the predictions generated by five leading ice melt models. The authors of the paper, which was published in the Proceedings of the National Academy of Sciences, represented a large and diverse group of investigators—not only geologists and hydrologists like Smith, Rennermalm, and the hardy grad students who gathered the measurements, but also Jenner and a group of other leaders in climate science and modeling. "This isn't 'our camp against their camp,'" emphasizes Pitcher. "This is a big collaboration. They're interested in how our ground truth data can be used to improve and explain what they're modeling." For Brandon Overstreet, multiple trips to the Greenland Ice Sheet sum up the value—and the thrill—of fieldwork. It's a level of detail that can't be found in satellite imagery or fly-By science. "My initial impression of the Greenland Ice Sheet was a large, featureless landscape that was only exciting at the edges where the icebergs were calving," he says. "But on the ice surface, you have this incredible, dynamic system of rivers that behave like terrestrial rivers—in some ways, that are terrestrial rivers in overdrive. "I don't want to live in a world where you collect everything you need by looking at a satellite image," he adds.
"I don't want to live in a world where you collect everything [with] a satellite image."
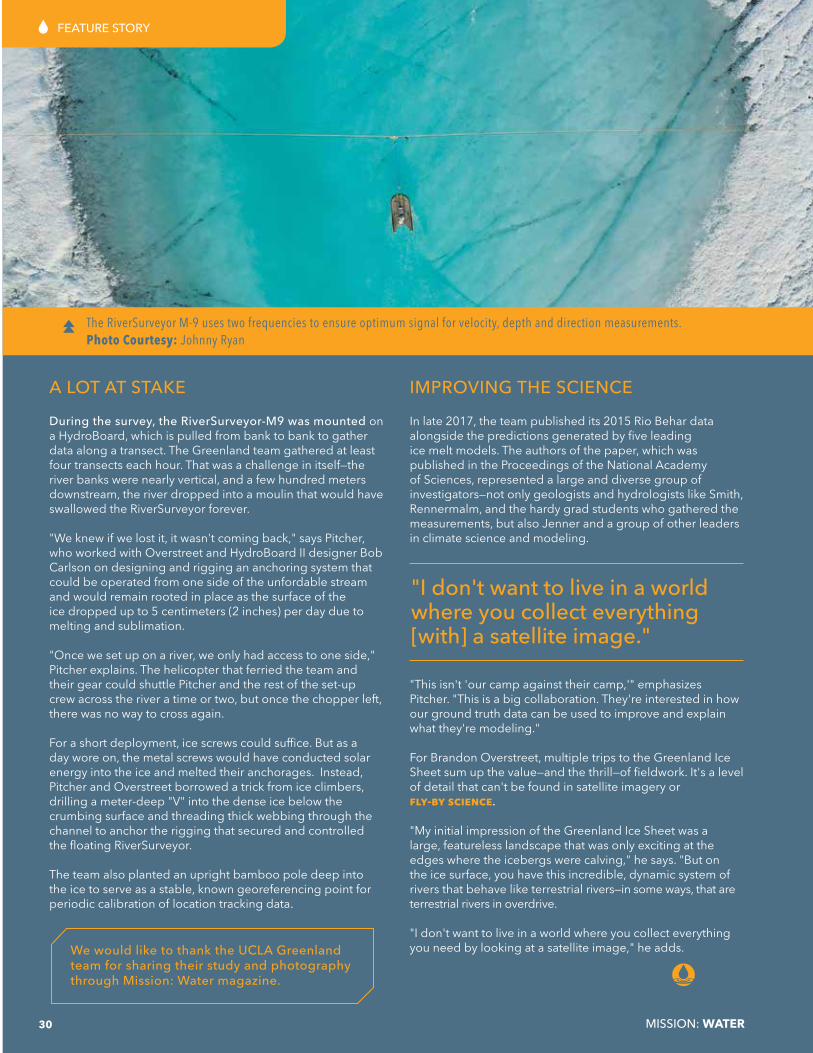
The RiverSurveyor M-9 uses two frequencies to ensure optimum signal for velocity, depth and direction measurements. Photo Courtesy: Johnny Ryan
learn about acoustic Doppler instrumentation from top experts. Benefit from the shared experience of intermediate to advanced ADP/ADV users.
David Mueller, USGS QRev and Improving the Quality of Measurements
Marian Muste, University of IowaHysteresis in streamflow ratings happens! Here’s how!
Lincoln Pitcher, UCLA Greenland Ice Sheet Study
and many more speakers eXpected!
OCTOBER 2nd - 4th, 2018 THE DRISKILL HOTEL
AUSTIN, TEXAS
RODEO REGATTASonTek International Users Conference and
RODEO REGATTA
Register or submit an abstract: Sontek.com/Rodeo2018
other guest speakers
OCTOBER 2nd & 3Rd
Explore, learn, and lean in on a broad range of water monitoring topics in a classroom setting.
OCTOBER 4Th Get out in the field with SonTek specialists and
enjoy some hands-on time with the gear!
Author. Surface water hydrologist. Flood inundation expert.
Abstract: Hurricane Harvey and Flood Emergency Response in Texas
David R. Maidment University of Texas at Austin
keynote speaker