Embed Size (px)
Citation preview
Page 1
Commercial-in-Confidence
FEATURE ARTICLE
1.
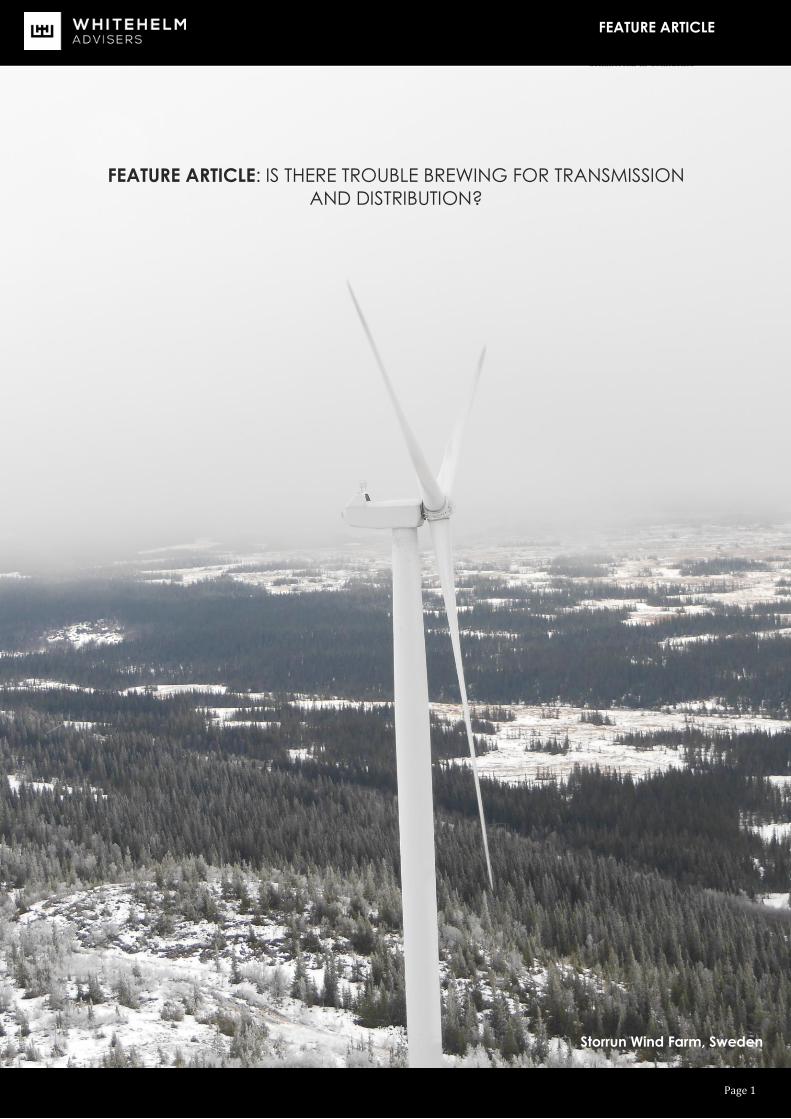
FEATURE ARTICLE: IS THERE TROUBLE BREWING FOR TRANSMISSION
AND DISTRIBUTION?
Storrun Wind Farm, Sweden
Page 2
Commercial-in-Confidence
FEATURE ARTICLE
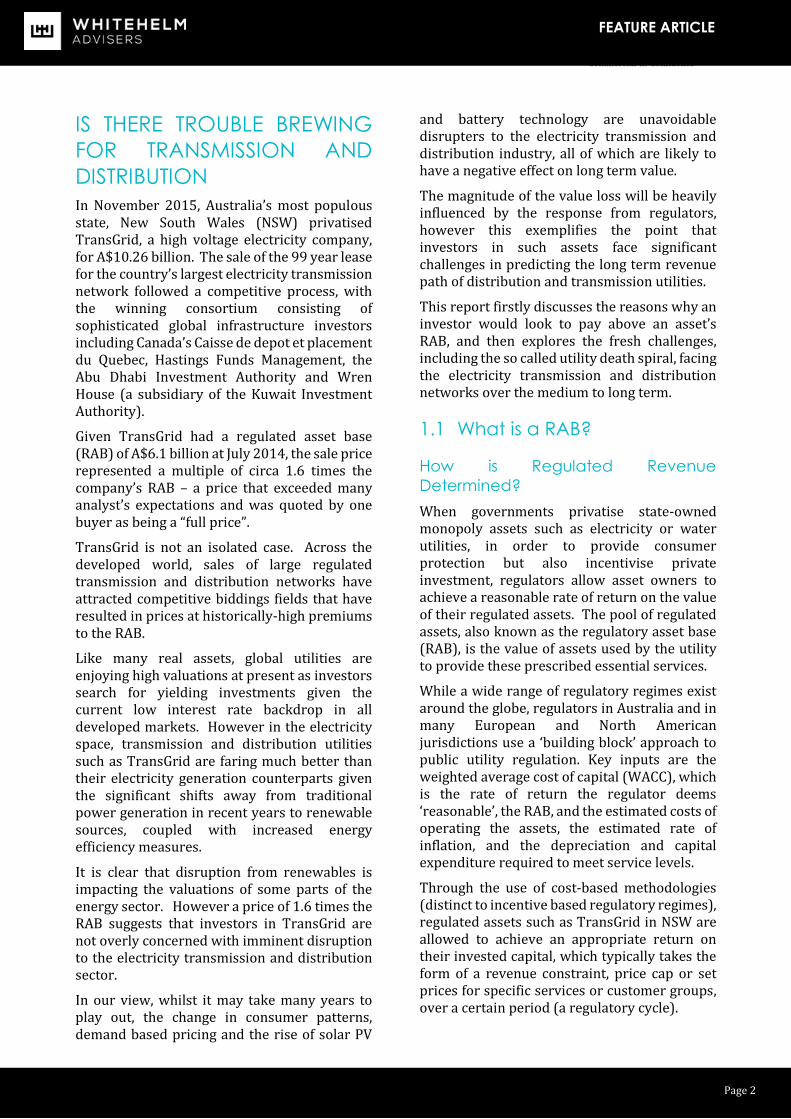
IS THERE TROUBLE BREWING
FOR TRANSMISSION AND
DISTRIBUTION
In November 2015, Australia’s most populous state, New South Wales (NSW) privatised TransGrid, a high voltage electricity company, for A$10.26 billion. The sale of the 99 year lease for the country’s largest electricity transmission network followed a competitive process, with the winning consortium consisting of sophisticated global infrastructure investors including Canada’s Caisse de depot et placement du Quebec, Hastings Funds Management, the Abu Dhabi Investment Authority and Wren House (a subsidiary of the Kuwait Investment Authority).
Given TransGrid had a regulated asset base (RAB) of A$6.1 billion at July 2014, the sale price represented a multiple of circa 1.6 times the company’s RAB – a price that exceeded many analyst’s expectations and was quoted by one buyer as being a “full price”.
TransGrid is not an isolated case. Across the developed world, sales of large regulated transmission and distribution networks have attracted competitive biddings fields that have resulted in prices at historically-high premiums to the RAB.
Like many real assets, global utilities are enjoying high valuations at present as investors search for yielding investments given the current low interest rate backdrop in all developed markets. However in the electricity space, transmission and distribution utilities such as TransGrid are faring much better than their electricity generation counterparts given the significant shifts away from traditional power generation in recent years to renewable sources, coupled with increased energy efficiency measures.
It is clear that disruption from renewables is impacting the valuations of some parts of the energy sector. However a price of 1.6 times the RAB suggests that investors in TransGrid are not overly concerned with imminent disruption to the electricity transmission and distribution sector.
In our view, whilst it may take many years to play out, the change in consumer patterns, demand based pricing and the rise of solar PV
and battery technology are unavoidable disrupters to the electricity transmission and distribution industry, all of which are likely to have a negative effect on long term value.
The magnitude of the value loss will be heavily influenced by the response from regulators, however this exemplifies the point that investors in such assets face significant challenges in predicting the long term revenue path of distribution and transmission utilities.
This report firstly discusses the reasons why an investor would look to pay above an asset’s RAB, and then explores the fresh challenges, including the so called utility death spiral, facing the electricity transmission and distribution networks over the medium to long term.
1.1 What is a RAB?
How is Regulated Revenue
Determined?
When governments privatise state-owned monopoly assets such as electricity or water utilities, in order to provide consumer protection but also incentivise private investment, regulators allow asset owners to achieve a reasonable rate of return on the value of their regulated assets. The pool of regulated assets, also known as the regulatory asset base (RAB), is the value of assets used by the utility to provide these prescribed essential services.
While a wide range of regulatory regimes exist around the globe, regulators in Australia and in many European and North American jurisdictions use a ‘building block’ approach to public utility regulation. Key inputs are the weighted average cost of capital (WACC), which is the rate of return the regulator deems ‘reasonable’, the RAB, and the estimated costs of operating the assets, the estimated rate of inflation, and the depreciation and capital expenditure required to meet service levels.
Through the use of cost-based methodologies (distinct to incentive based regulatory regimes), regulated assets such as TransGrid in NSW are allowed to achieve an appropriate return on their invested capital, which typically takes the form of a revenue constraint, price cap or set prices for specific services or customer groups, over a certain period (a regulatory cycle).
Page 3
Commercial-in-Confidence
FEATURE ARTICLE
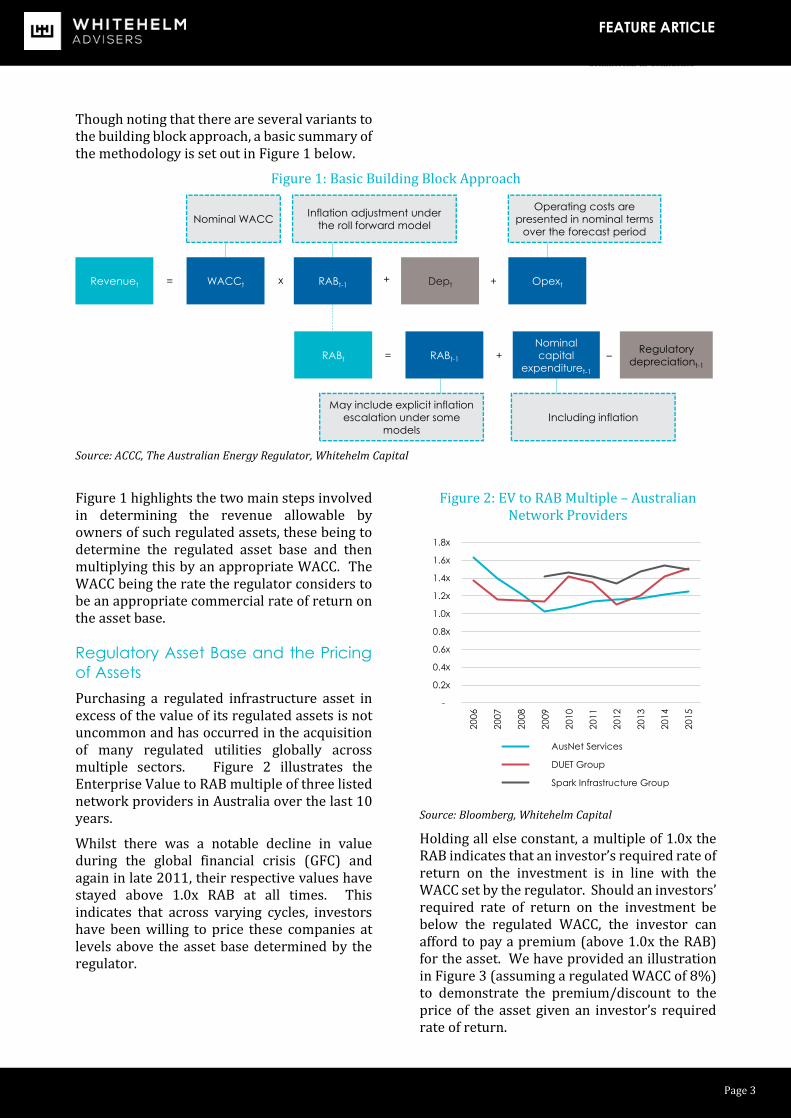
Though noting that there are several variants to the building block approach, a basic summary of the methodology is set out in Figure 1 below.
Figure 1: Basic Building Block Approach
Source: ACCC, The Australian Energy Regulator, Whitehelm Capital
Figure 1 highlights the two main steps involved in determining the revenue allowable by owners of such regulated assets, these being to determine the regulated asset base and then multiplying this by an appropriate WACC. The WACC being the rate the regulator considers to be an appropriate commercial rate of return on the asset base.
Regulatory Asset Base and the Pricing
of Assets
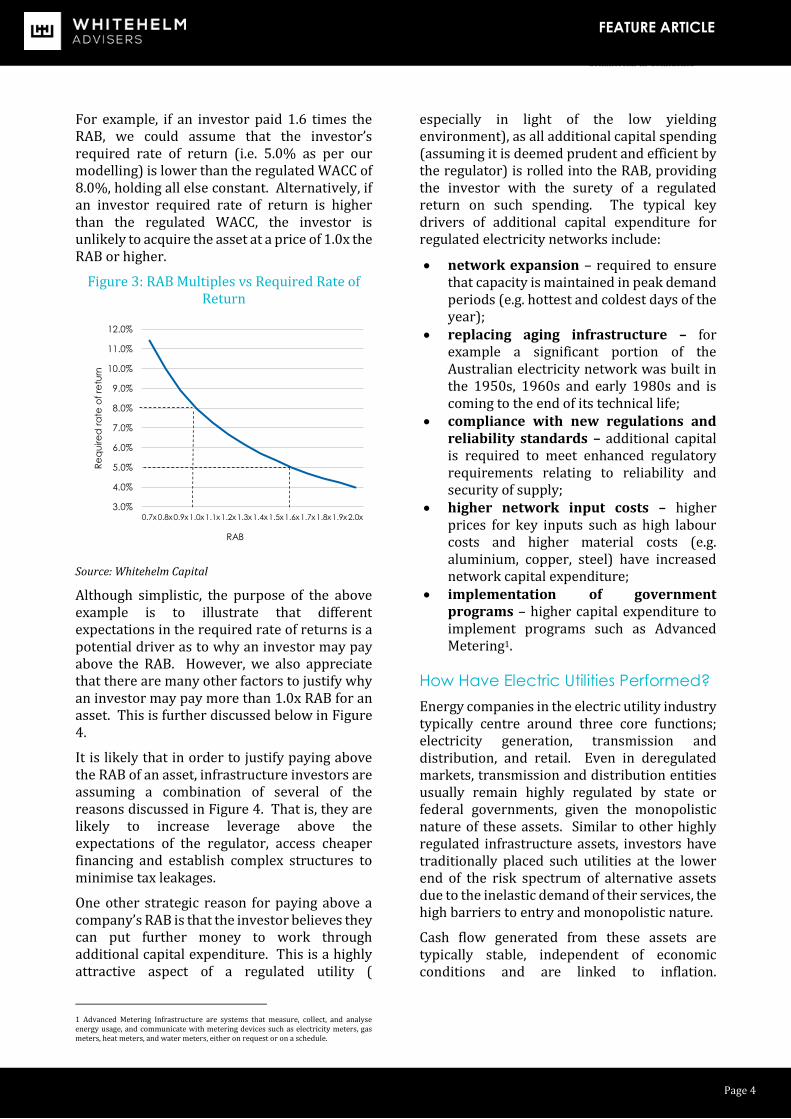
Purchasing a regulated infrastructure asset in excess of the value of its regulated assets is not uncommon and has occurred in the acquisition of many regulated utilities globally across multiple sectors. Figure 2 illustrates the Enterprise Value to RAB multiple of three listed network providers in Australia over the last 10 years.
Whilst there was a notable decline in value during the global financial crisis (GFC) and again in late 2011, their respective values have stayed above 1.0x RAB at all times. This indicates that across varying cycles, investors have been willing to price these companies at levels above the asset base determined by the regulator.
Figure 2: EV to RAB Multiple – Australian Network Providers
Source: Bloomberg, Whitehelm Capital
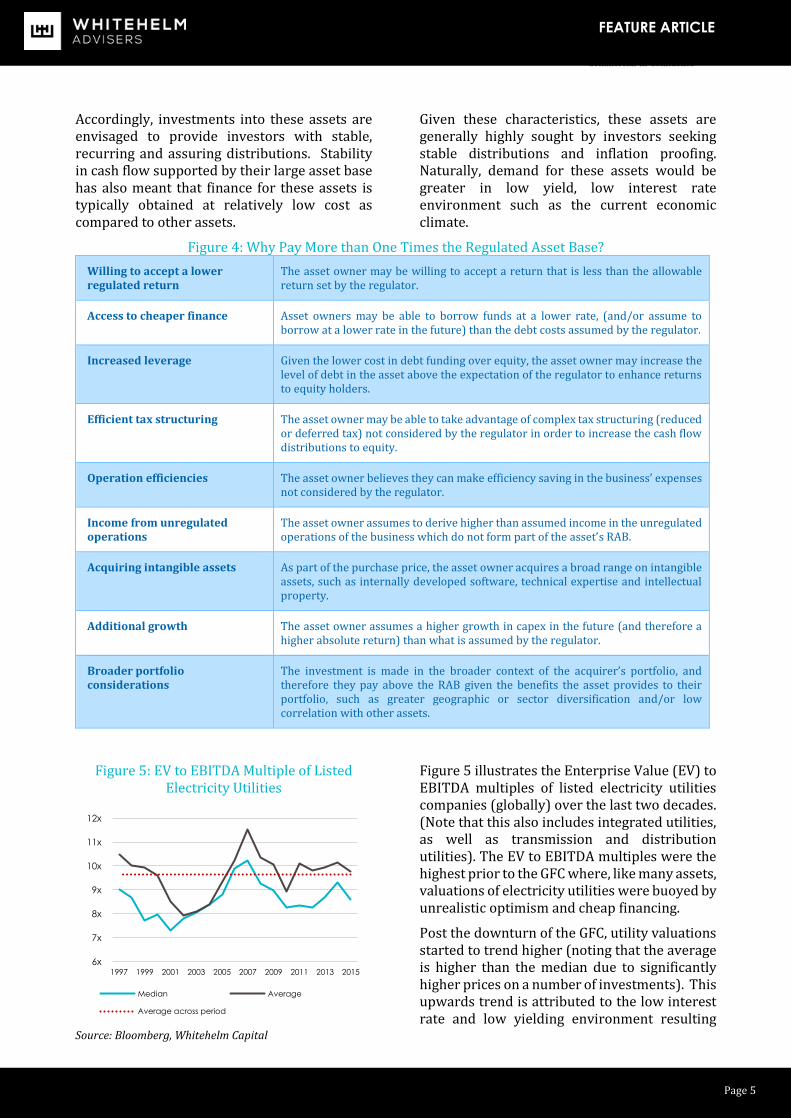
Holding all else constant, a multiple of 1.0x the RAB indicates that an investor’s required rate of return on the investment is in line with the WACC set by the regulator. Should an investors’ required rate of return on the investment be below the regulated WACC, the investor can afford to pay a premium (above 1.0x the RAB) for the asset. We have provided an illustration in Figure 3 (assuming a regulated WACC of 8%) to demonstrate the premium/discount to the price of the asset given an investor’s required rate of return.
Revenuet WACCt RABt-1 Dept Opext
RABt RABt-1
Nominal
capital
expendituret-1
Regulatory
depreciationt-1
Nominal WACC
Operating costs are
presented in nominal terms
over the forecast period
Inflation adjustment under
the roll forward model
= x + +
+ –=
May include explicit inflation
escalation under some
models
Including inflation
-
0.2x
0.4x
0.6x
0.8x
1.0x
1.2x
1.4x
1.6x
1.8x
20
06
20
07
20
08
20
09
20
10
20
11
20
12
20
13
20
14
20
15
AusNet Services
DUET Group
Spark Infrastructure Group
Page 4
Commercial-in-Confidence
FEATURE ARTICLE
For example, if an investor paid 1.6 times the RAB, we could assume that the investor’s required rate of return (i.e. 5.0% as per our modelling) is lower than the regulated WACC of 8.0%, holding all else constant. Alternatively, if an investor required rate of return is higher than the regulated WACC, the investor is unlikely to acquire the asset at a price of 1.0x the RAB or higher.
Figure 3: RAB Multiples vs Required Rate of Return
Source: Whitehelm Capital
Although simplistic, the purpose of the above example is to illustrate that different expectations in the required rate of returns is a potential driver as to why an investor may pay above the RAB. However, we also appreciate that there are many other factors to justify why an investor may pay more than 1.0x RAB for an asset. This is further discussed below in Figure 4.
It is likely that in order to justify paying above the RAB of an asset, infrastructure investors are assuming a combination of several of the reasons discussed in Figure 4. That is, they are likely to increase leverage above the expectations of the regulator, access cheaper financing and establish complex structures to minimise tax leakages.
One other strategic reason for paying above a company’s RAB is that the investor believes they can put further money to work through additional capital expenditure. This is a highly attractive aspect of a regulated utility (
1 Advanced Metering Infrastructure are systems that measure, collect, and analyse energy usage, and communicate with metering devices such as electricity meters, gas meters, heat meters, and water meters, either on request or on a schedule.
especially in light of the low yielding environment), as all additional capital spending (assuming it is deemed prudent and efficient by the regulator) is rolled into the RAB, providing the investor with the surety of a regulated return on such spending. The typical key drivers of additional capital expenditure for regulated electricity networks include:
network expansion – required to ensure that capacity is maintained in peak demand periods (e.g. hottest and coldest days of the year);
replacing aging infrastructure – for example a significant portion of the Australian electricity network was built in the 1950s, 1960s and early 1980s and is coming to the end of its technical life;
compliance with new regulations and reliability standards – additional capital is required to meet enhanced regulatory requirements relating to reliability and security of supply;
higher network input costs – higher prices for key inputs such as high labour costs and higher material costs (e.g. aluminium, copper, steel) have increased network capital expenditure;
implementation of government programs – higher capital expenditure to implement programs such as Advanced Metering1.
How Have Electric Utilities Performed?
Energy companies in the electric utility industry typically centre around three core functions; electricity generation, transmission and distribution, and retail. Even in deregulated markets, transmission and distribution entities usually remain highly regulated by state or federal governments, given the monopolistic nature of these assets. Similar to other highly regulated infrastructure assets, investors have traditionally placed such utilities at the lower end of the risk spectrum of alternative assets due to the inelastic demand of their services, the high barriers to entry and monopolistic nature.
Cash flow generated from these assets are typically stable, independent of economic conditions and are linked to inflation.
3.0%
4.0%
5.0%
6.0%
7.0%
8.0%
9.0%
10.0%
11.0%
12.0%
0.7x0.8x0.9x1.0x1.1x1.2x1.3x1.4x1.5x1.6x1.7x1.8x1.9x2.0x
Re
qu
ire
d r
ate
of
retu
rn
RAB
Page 5
Commercial-in-Confidence
FEATURE ARTICLE
Accordingly, investments into these assets are envisaged to provide investors with stable, recurring and assuring distributions. Stability in cash flow supported by their large asset base has also meant that finance for these assets is typically obtained at relatively low cost as compared to other assets.
Given these characteristics, these assets are generally highly sought by investors seeking stable distributions and inflation proofing. Naturally, demand for these assets would be greater in low yield, low interest rate environment such as the current economic climate.
Figure 4: Why Pay More than One Times the Regulated Asset Base?
Willing to accept a lower regulated return
The asset owner may be willing to accept a return that is less than the allowable return set by the regulator.
Access to cheaper finance Asset owners may be able to borrow funds at a lower rate, (and/or assume to borrow at a lower rate in the future) than the debt costs assumed by the regulator.
Increased leverage Given the lower cost in debt funding over equity, the asset owner may increase the level of debt in the asset above the expectation of the regulator to enhance returns to equity holders.
Efficient tax structuring The asset owner may be able to take advantage of complex tax structuring (reduced or deferred tax) not considered by the regulator in order to increase the cash flow distributions to equity.
Operation efficiencies The asset owner believes they can make efficiency saving in the business’ expenses not considered by the regulator.
Income from unregulated operations
The asset owner assumes to derive higher than assumed income in the unregulated operations of the business which do not form part of the asset’s RAB.
Acquiring intangible assets As part of the purchase price, the asset owner acquires a broad range on intangible assets, such as internally developed software, technical expertise and intellectual property.
Additional growth The asset owner assumes a higher growth in capex in the future (and therefore a higher absolute return) than what is assumed by the regulator.
Broader portfolio considerations
The investment is made in the broader context of the acquirer’s portfolio, and therefore they pay above the RAB given the benefits the asset provides to their portfolio, such as greater geographic or sector diversification and/or low correlation with other assets.
Figure 5: EV to EBITDA Multiple of Listed Electricity Utilities
Source: Bloomberg, Whitehelm Capital
Figure 5 illustrates the Enterprise Value (EV) to EBITDA multiples of listed electricity utilities companies (globally) over the last two decades. (Note that this also includes integrated utilities, as well as transmission and distribution utilities). The EV to EBITDA multiples were the highest prior to the GFC where, like many assets, valuations of electricity utilities were buoyed by unrealistic optimism and cheap financing.
Post the downturn of the GFC, utility valuations started to trend higher (noting that the average is higher than the median due to significantly higher prices on a number of investments). This upwards trend is attributed to the low interest rate and low yielding environment resulting
6x
7x
8x
9x
10x
11x
12x
2015 2013 2011 2009 2007 2005 2003 2001 1999 1997
Median Average
Average across period

Page 6
Commercial-in-Confidence
FEATURE ARTICLE
from the unprecedented quantitative easing from global central banks.
Figure 6 shows how the EV/EBITDA of two of Australia’s network providers have fared.
Figure 6: EV to EBITDA Multiple of Two Network Providers (Australia)
Source: Bloomberg, Whitehelm Capital
Although the EV to EBITDA multiples of the two Australian entities generally appeared higher than the average multiple of global listed electricity utilities in Figure 5, the two charts show that the multiples have started to increase in the periods following the GFC.
Despite the higher valuation of network providers in the current market, we are faced with the challenge of understanding whether the increased valuations have factored in major changes (or disruptions) that are likely to occur in the industry.
As illustrated in the following section, technologic and manufacturing improvements in the renewable sector has directly impacted on the value of traditional electricity generation companies. The question is, will this improvement in technology and changes in consumers’ consumption patterns also have a negative impact on network providers in the medium to long term.
Disruption and its Impact on Value
To illustrate the impact that disruption from renewables can have on the value of electricity utility companies, we have looked at electricity utilities in the United States and Europe, where the impact of disruption on the power
2 The Economist 2013, “How to lose half a trillion euro’s: Europe’s
electricity existential treat.”
generation industry is considered to be more advanced than in Australia.
The significant shifts away from traditional power generation in recent years towards renewable sources, coupled with increased energy efficiency measures and reduced demand from recessionary economic environments, has materially affected the traditional power generation producers and electricity utilities who are exposed to merchant power. The Economist stated that Europe’s top 20 electricity utilities lost roughly half their value, or half a trillion euros, from September 2008 to October 20132.
However, fully regulated network providers (i.e. transmission and distribution networks) have to date been insulated from this change.
In regards to the United States, Figure 7 details the EV to EBITDA multiple of ITC Holdings (a transmission and distribution only entity) against the average multiple of vertically integrated electricity companies (includes power generation and retail entities).
Figure 7 shows that regulated network providers trade at a premium to vertically integrated electric entities. The premium is likely attributed to the stable cash flow (due to regulation) achieved by network providers and the fact that network providers are currently still insulated from impact of the disruption in the energy generation industry (i.e. the rise of alternative energy such as gas and renewables).
Figure 7: EV to EBITDA US Electricity Utilities
Source: Bloomberg, Whitehelm Capital
6x
7x
8x
9x
10x
11x
12x
13x
14x
15x
2006 2007 2008 2009 2010 2011 2012 2013 2014 2015
AusNet Services DUET Group
Average across period
4x
6x
8x
10x
12x
14x
16x
18x
2008 2009 2010 2011 2012 2013 2014 2015 2016
ITC
Electricity, Regulated
Electricity, Less Regulated
Page 7
Commercial-in-Confidence
FEATURE ARTICLE
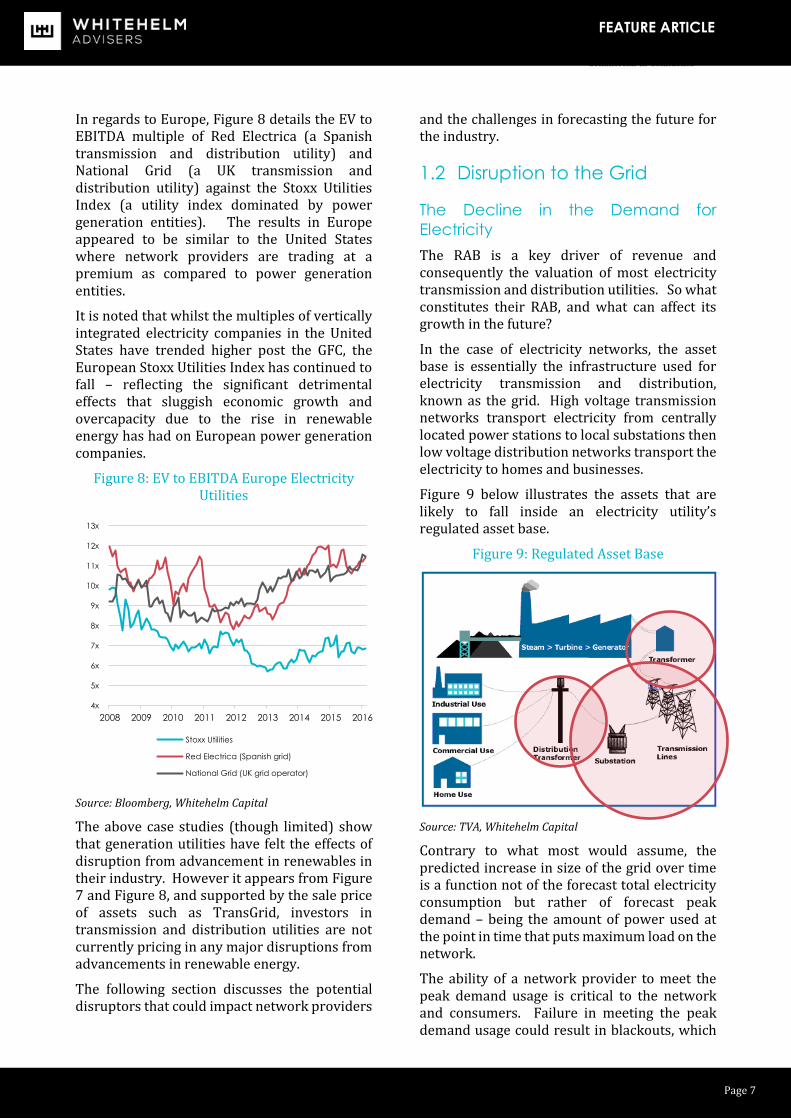
In regards to Europe, Figure 8 details the EV to EBITDA multiple of Red Electrica (a Spanish transmission and distribution utility) and National Grid (a UK transmission and distribution utility) against the Stoxx Utilities Index (a utility index dominated by power generation entities). The results in Europe appeared to be similar to the United States where network providers are trading at a premium as compared to power generation entities.
It is noted that whilst the multiples of vertically integrated electricity companies in the United States have trended higher post the GFC, the European Stoxx Utilities Index has continued to fall – reflecting the significant detrimental effects that sluggish economic growth and overcapacity due to the rise in renewable energy has had on European power generation companies.
Figure 8: EV to EBITDA Europe Electricity Utilities
Source: Bloomberg, Whitehelm Capital
The above case studies (though limited) show that generation utilities have felt the effects of disruption from advancement in renewables in their industry. However it appears from Figure 7 and Figure 8, and supported by the sale price of assets such as TransGrid, investors in transmission and distribution utilities are not currently pricing in any major disruptions from advancements in renewable energy.
The following section discusses the potential disruptors that could impact network providers
and the challenges in forecasting the future for the industry.
1.2 Disruption to the Grid
The Decline in the Demand for
Electricity
The RAB is a key driver of revenue and consequently the valuation of most electricity transmission and distribution utilities. So what constitutes their RAB, and what can affect its growth in the future?
In the case of electricity networks, the asset base is essentially the infrastructure used for electricity transmission and distribution, known as the grid. High voltage transmission networks transport electricity from centrally located power stations to local substations then low voltage distribution networks transport the electricity to homes and businesses.
Figure 9 below illustrates the assets that are likely to fall inside an electricity utility’s regulated asset base.
Figure 9: Regulated Asset Base
Source: TVA, Whitehelm Capital
Contrary to what most would assume, the predicted increase in size of the grid over time is a function not of the forecast total electricity consumption but rather of forecast peak demand – being the amount of power used at the point in time that puts maximum load on the network.
The ability of a network provider to meet the peak demand usage is critical to the network and consumers. Failure in meeting the peak demand usage could result in blackouts, which
4x
5x
6x
7x
8x
9x
10x
11x
12x
13x
2008 2009 2010 2011 2012 2013 2014 2015 2016
Stoxx Utilities
Red Electrica (Spanish grid)
National Grid (UK grid operator)

Page 8
Commercial-in-Confidence
FEATURE ARTICLE
would impact on the networks reliability and ultimately its business. Accordingly, to ensure the reliability of the network, regulators allow utilities to spend capital (and receive an allowable return) to ensure that networks can handle peak demand periods. In order to accurately forecast future capital expenditure
requirements, accurate forecast on future peak demand is imperative.
Figure 10 below tracks the level of total demand and peak demand across the largest Australian states connected to the National Electricity Market (NEM) since the turn of the century.
Figure 10: Australian Peak Demand Vs Actual Demand (Year 2000 = 100)
Source: Grattan Institute, AEMO
Historically, the trend for both total and peak demand have been similar. However, from 2000 to 2009 this broke down as consumers embraced air conditioners and other energy intensive consumer goods, and peak demand grew much faster than total demand. As a result, large investments in expanding grid capacity were allowed by the regulators, and these cost resulted in higher electricity bills for consumers.
However from 2010 this trend went into reverse. New technologies, such as the adoption of solar photovoltaics (PV), combined with energy efficiency improvements has seen both peak and total electricity demand decline.
Figure 10 highlights that driven by reduced manufacturing, an increased take-up of solar PV
and more efficient appliances and lighting, total electricity consumption in Australia’s two most populous states (NSW and Victoria) retracted back to where it was 15 years ago. Total demand has also reduced in South Australia over the last 15 years. Whilst Australia’s third most populous state, Queensland has experienced a growth in electricity consumption over the last 15 years, such growth has been tracking at a very modest level of 1.3% year on year.
Figure 10 also shows that peak demand started to fall across all states in recent years. This decline was not been well anticipated by the industry or regulators, leading to current networks being larger than required and costing consumers (as price increases are
2000 2007 2014
100
114
101
NSW
Peak Demand
Total Consumption
2000 2007 2014
100
127
101
VIC
2000 2007 2014
100
135
119
QLD
2000 2007 2014
100
114
96
SA
Page 9
Commercial-in-Confidence
FEATURE ARTICLE
largely passed to consumers) more than they should.
The fall in both peak demand and total demand, the accelerated adaptation of new energy efficient technologies and the political impacts associated with rising electricity prices could mean that it may be more challenging than ever for network providers to obtain approval for increasing their RAB in the future. This in turn makes it harder to predict the growth in future capital expenditure (which directly impacts their revenue) that will be required.
The Rise of Solar PV
As discussed, a key reason for the fall in overall consumption and peak demand has been attributed to the rise of solar PV. Generous Commonwealth and State backed subsidies, coupled with a continual fall in the production cost of solar PV has led to a strong rise in domestic rooftop installations in Australia and many other countries in the last decade.
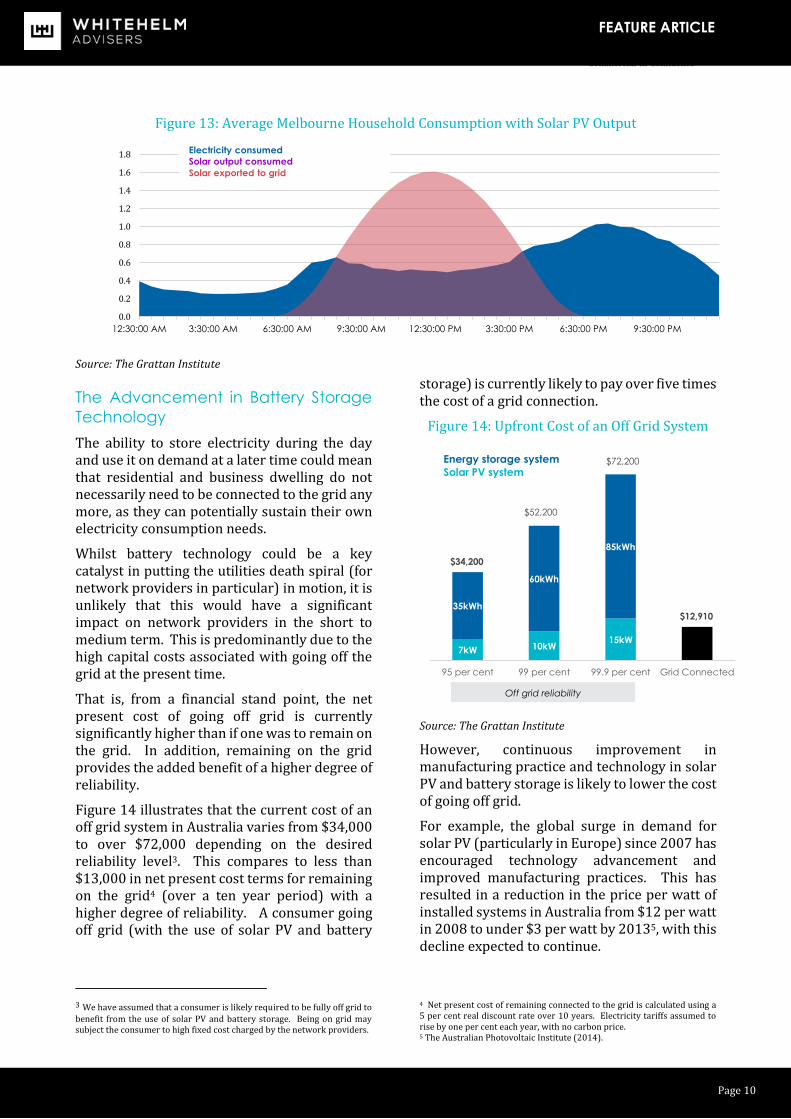
Figure 11 below shows how installations of solar PV increased from just over 3000 at the end of 2007 to close to 1.4 million installations by the end of 2014.
Figure 11: Cumulative Small Scale Solar PV Installations (2007 to 2014)
Source: The Clean Energy Regulator
This increase in solar PV installations has led to a significant amount of literature in recent years focussed on the concept of the ‘utility death spiral’. But is it something network investors should be concerned about?
Is the Death Spiral a Likely Scenario?
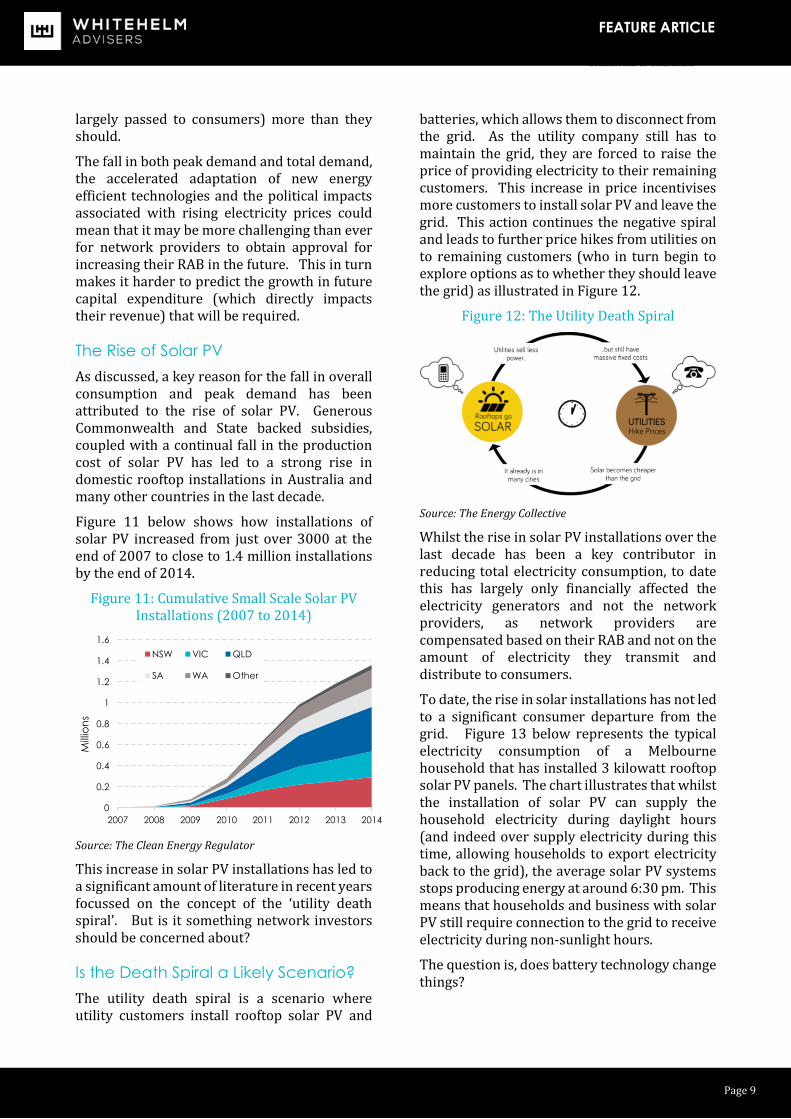
The utility death spiral is a scenario where utility customers install rooftop solar PV and
batteries, which allows them to disconnect from the grid. As the utility company still has to maintain the grid, they are forced to raise the price of providing electricity to their remaining customers. This increase in price incentivises more customers to install solar PV and leave the grid. This action continues the negative spiral and leads to further price hikes from utilities on to remaining customers (who in turn begin to explore options as to whether they should leave the grid) as illustrated in Figure 12.
Figure 12: The Utility Death Spiral
Source: The Energy Collective
Whilst the rise in solar PV installations over the last decade has been a key contributor in reducing total electricity consumption, to date this has largely only financially affected the electricity generators and not the network providers, as network providers are compensated based on their RAB and not on the amount of electricity they transmit and distribute to consumers.
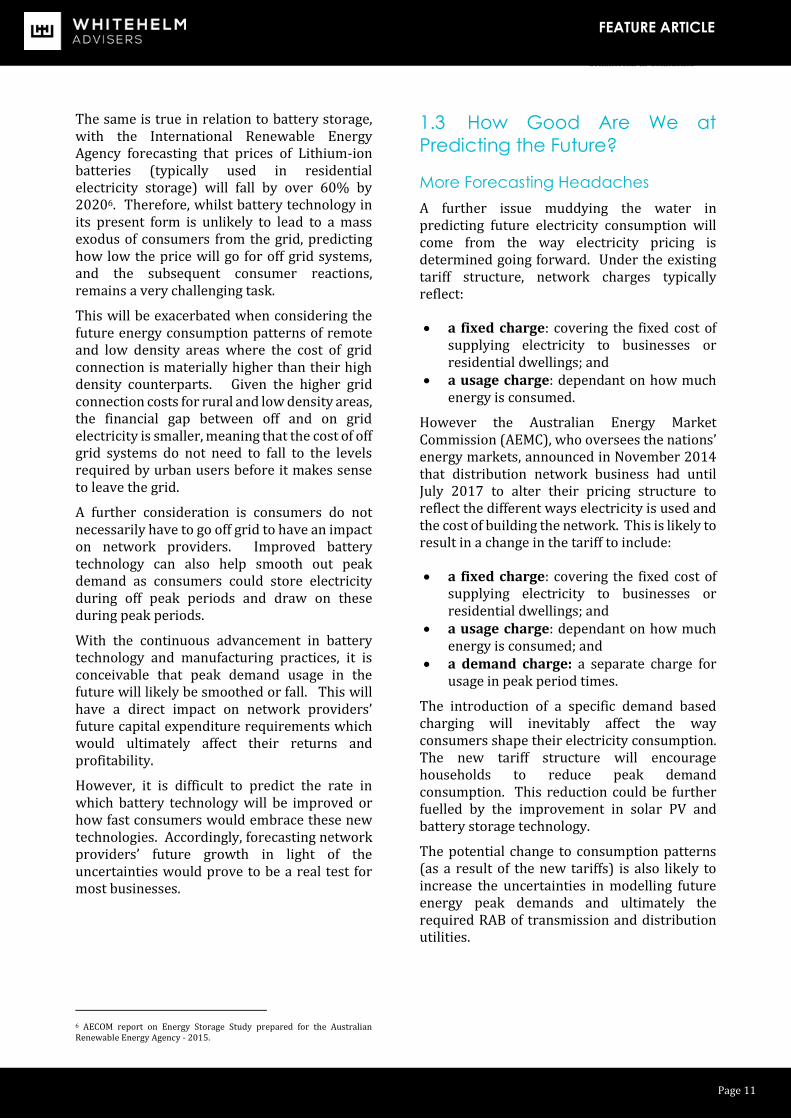
To date, the rise in solar installations has not led to a significant consumer departure from the grid. Figure 13 below represents the typical electricity consumption of a Melbourne household that has installed 3 kilowatt rooftop solar PV panels. The chart illustrates that whilst the installation of solar PV can supply the household electricity during daylight hours (and indeed over supply electricity during this time, allowing households to export electricity back to the grid), the average solar PV systems stops producing energy at around 6:30 pm. This means that households and business with solar PV still require connection to the grid to receive electricity during non-sunlight hours.
The question is, does battery technology change things?
0
0.2
0.4
0.6
0.8
1
1.2
1.4
1.6
2007 2008 2009 2010 2011 2012 2013 2014
Mill
ion
s
NSW VIC QLD
SA WA Other
Page 10
Commercial-in-Confidence
FEATURE ARTICLE
Figure 13: Average Melbourne Household Consumption with Solar PV Output
Source: The Grattan Institute
The Advancement in Battery Storage
Technology
The ability to store electricity during the day and use it on demand at a later time could mean that residential and business dwelling do not necessarily need to be connected to the grid any more, as they can potentially sustain their own electricity consumption needs.
Whilst battery technology could be a key catalyst in putting the utilities death spiral (for network providers in particular) in motion, it is unlikely that this would have a significant impact on network providers in the short to medium term. This is predominantly due to the high capital costs associated with going off the grid at the present time.
That is, from a financial stand point, the net present cost of going off grid is currently significantly higher than if one was to remain on the grid. In addition, remaining on the grid provides the added benefit of a higher degree of reliability.
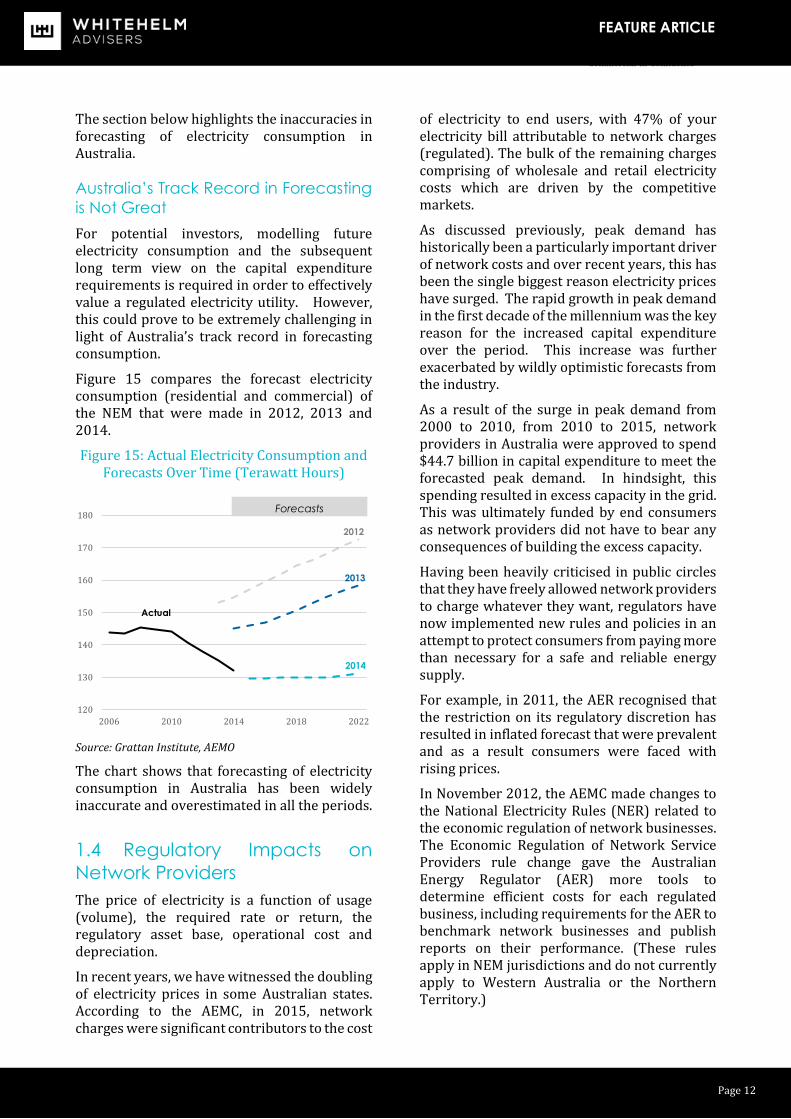
Figure 14 illustrates that the current cost of an off grid system in Australia varies from $34,000 to over $72,000 depending on the desired reliability level3. This compares to less than $13,000 in net present cost terms for remaining on the grid4 (over a ten year period) with a higher degree of reliability. A consumer going off grid (with the use of solar PV and battery
3 We have assumed that a consumer is likely required to be fully off grid to
benefit from the use of solar PV and battery storage. Being on grid may subject the consumer to high fixed cost charged by the network providers.
storage) is currently likely to pay over five times the cost of a grid connection.
Figure 14: Upfront Cost of an Off Grid System
Source: The Grattan Institute
However, continuous improvement in manufacturing practice and technology in solar PV and battery storage is likely to lower the cost of going off grid.
For example, the global surge in demand for solar PV (particularly in Europe) since 2007 has encouraged technology advancement and improved manufacturing practices. This has resulted in a reduction in the price per watt of installed systems in Australia from $12 per watt in 2008 to under $3 per watt by 20135, with this decline expected to continue.
4 Net present cost of remaining connected to the grid is calculated using a 5 per cent real discount rate over 10 years. Electricity tariffs assumed to rise by one per cent each year, with no carbon price. 5 The Australian Photovoltaic Institute (2014).
0.0
0.2
0.4
0.6
0.8
1.0
1.2
1.4
1.6
1.8
12:30:00 AM 3:30:00 AM 6:30:00 AM 9:30:00 AM 12:30:00 PM 3:30:00 PM 6:30:00 PM 9:30:00 PM
Electricity consumed
Solar output consumed
Solar exported to grid
7kW 10kW15kW
35kWh
60kWh
85kWh
$34,200
$52,200
$72,200
$12,910
95 per cent 99 per cent 99.9 per cent Grid Connected
Off grid reliability
Energy storage system
Solar PV system
Page 11
Commercial-in-Confidence
FEATURE ARTICLE
The same is true in relation to battery storage, with the International Renewable Energy Agency forecasting that prices of Lithium-ion batteries (typically used in residential electricity storage) will fall by over 60% by 20206. Therefore, whilst battery technology in its present form is unlikely to lead to a mass exodus of consumers from the grid, predicting how low the price will go for off grid systems, and the subsequent consumer reactions, remains a very challenging task.
This will be exacerbated when considering the future energy consumption patterns of remote and low density areas where the cost of grid connection is materially higher than their high density counterparts. Given the higher grid connection costs for rural and low density areas, the financial gap between off and on grid electricity is smaller, meaning that the cost of off grid systems do not need to fall to the levels required by urban users before it makes sense to leave the grid.
A further consideration is consumers do not necessarily have to go off grid to have an impact on network providers. Improved battery technology can also help smooth out peak demand as consumers could store electricity during off peak periods and draw on these during peak periods.
With the continuous advancement in battery technology and manufacturing practices, it is conceivable that peak demand usage in the future will likely be smoothed or fall. This will have a direct impact on network providers’ future capital expenditure requirements which would ultimately affect their returns and profitability.
However, it is difficult to predict the rate in which battery technology will be improved or how fast consumers would embrace these new technologies. Accordingly, forecasting network providers’ future growth in light of the uncertainties would prove to be a real test for most businesses.
6 AECOM report on Energy Storage Study prepared for the Australian Renewable Energy Agency - 2015.
1.3 How Good Are We at
Predicting the Future?
More Forecasting Headaches
A further issue muddying the water in predicting future electricity consumption will come from the way electricity pricing is determined going forward. Under the existing tariff structure, network charges typically reflect:
a fixed charge: covering the fixed cost of supplying electricity to businesses or residential dwellings; and
a usage charge: dependant on how much energy is consumed.
However the Australian Energy Market Commission (AEMC), who oversees the nations’ energy markets, announced in November 2014 that distribution network business had until July 2017 to alter their pricing structure to reflect the different ways electricity is used and the cost of building the network. This is likely to result in a change in the tariff to include:
a fixed charge: covering the fixed cost of supplying electricity to businesses or residential dwellings; and
a usage charge: dependant on how much energy is consumed; and
a demand charge: a separate charge for usage in peak period times.
The introduction of a specific demand based charging will inevitably affect the way consumers shape their electricity consumption. The new tariff structure will encourage households to reduce peak demand consumption. This reduction could be further fuelled by the improvement in solar PV and battery storage technology.
The potential change to consumption patterns (as a result of the new tariffs) is also likely to increase the uncertainties in modelling future energy peak demands and ultimately the required RAB of transmission and distribution utilities.
Page 12
Commercial-in-Confidence
FEATURE ARTICLE
The section below highlights the inaccuracies in forecasting of electricity consumption in Australia.
Australia’s Track Record in Forecasting
is Not Great
For potential investors, modelling future electricity consumption and the subsequent long term view on the capital expenditure requirements is required in order to effectively value a regulated electricity utility. However, this could prove to be extremely challenging in light of Australia’s track record in forecasting consumption.
Figure 15 compares the forecast electricity consumption (residential and commercial) of the NEM that were made in 2012, 2013 and 2014.
Figure 15: Actual Electricity Consumption and Forecasts Over Time (Terawatt Hours)
Source: Grattan Institute, AEMO
The chart shows that forecasting of electricity consumption in Australia has been widely inaccurate and overestimated in all the periods.
1.4 Regulatory Impacts on
Network Providers
The price of electricity is a function of usage (volume), the required rate or return, the regulatory asset base, operational cost and depreciation.
In recent years, we have witnessed the doubling of electricity prices in some Australian states. According to the AEMC, in 2015, network charges were significant contributors to the cost
of electricity to end users, with 47% of your electricity bill attributable to network charges (regulated). The bulk of the remaining charges comprising of wholesale and retail electricity costs which are driven by the competitive markets.
As discussed previously, peak demand has historically been a particularly important driver of network costs and over recent years, this has been the single biggest reason electricity prices have surged. The rapid growth in peak demand in the first decade of the millennium was the key reason for the increased capital expenditure over the period. This increase was further exacerbated by wildly optimistic forecasts from the industry.
As a result of the surge in peak demand from 2000 to 2010, from 2010 to 2015, network providers in Australia were approved to spend $44.7 billion in capital expenditure to meet the forecasted peak demand. In hindsight, this spending resulted in excess capacity in the grid. This was ultimately funded by end consumers as network providers did not have to bear any consequences of building the excess capacity.
Having been heavily criticised in public circles that they have freely allowed network providers to charge whatever they want, regulators have now implemented new rules and policies in an attempt to protect consumers from paying more than necessary for a safe and reliable energy supply.
For example, in 2011, the AER recognised that the restriction on its regulatory discretion has resulted in inflated forecast that were prevalent and as a result consumers were faced with rising prices.
In November 2012, the AEMC made changes to the National Electricity Rules (NER) related to the economic regulation of network businesses. The Economic Regulation of Network Service Providers rule change gave the Australian Energy Regulator (AER) more tools to determine efficient costs for each regulated business, including requirements for the AER to benchmark network businesses and publish reports on their performance. (These rules apply in NEM jurisdictions and do not currently apply to Western Australia or the Northern Territory.)
120
130
140
150
160
170
180
2006 2010 2014 2018 2022
2012
2013
2014
Forecasts
Actual
Page 13
Commercial-in-Confidence
FEATURE ARTICLE
These new arrangements improve the way economic regulation is applied to network businesses through three broad changes:
• allowing greater use of incentives by the AER to encourage network businesses to invest capital efficiently;
• improving the AER's ability to determine the rate of return; and
• clarifying the AER's ability to use efficiency benchmarks when determining revenue allowances.
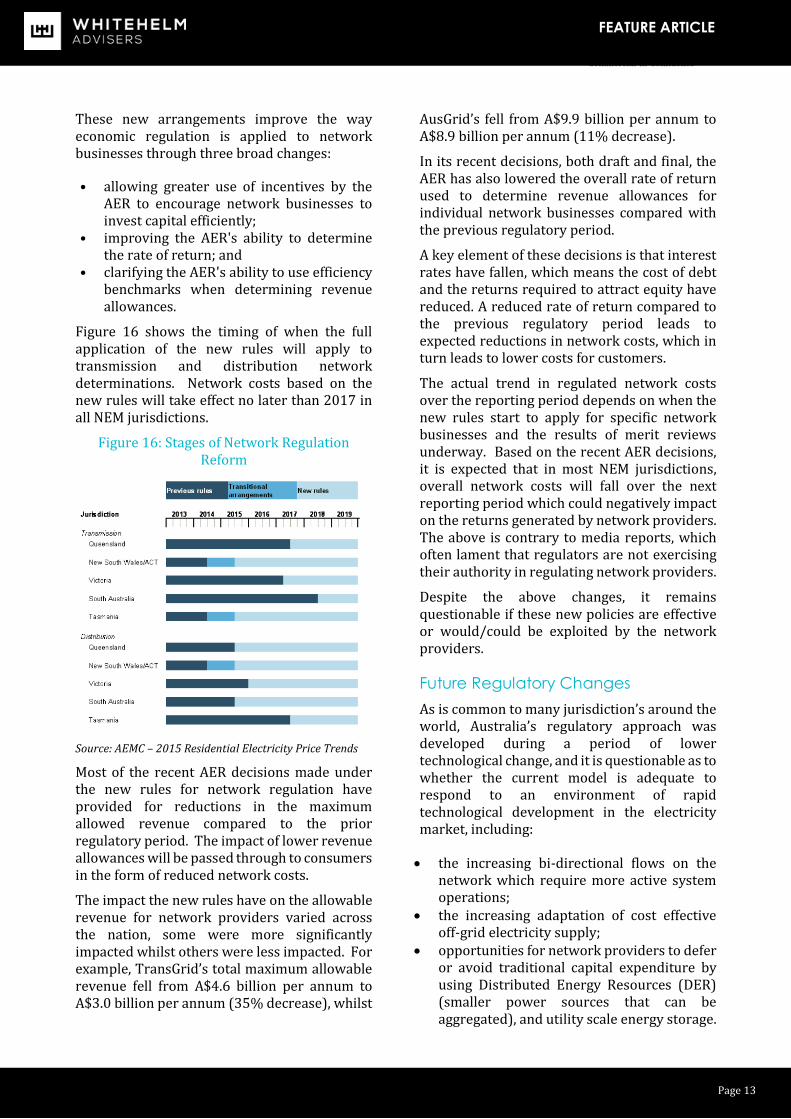
Figure 16 shows the timing of when the full application of the new rules will apply to transmission and distribution network determinations. Network costs based on the new rules will take effect no later than 2017 in all NEM jurisdictions.
Figure 16: Stages of Network Regulation Reform
Source: AEMC – 2015 Residential Electricity Price Trends
Most of the recent AER decisions made under the new rules for network regulation have provided for reductions in the maximum allowed revenue compared to the prior regulatory period. The impact of lower revenue allowances will be passed through to consumers in the form of reduced network costs.
The impact the new rules have on the allowable revenue for network providers varied across the nation, some were more significantly impacted whilst others were less impacted. For example, TransGrid’s total maximum allowable revenue fell from A$4.6 billion per annum to A$3.0 billion per annum (35% decrease), whilst
AusGrid’s fell from A$9.9 billion per annum to A$8.9 billion per annum (11% decrease).
In its recent decisions, both draft and final, the AER has also lowered the overall rate of return used to determine revenue allowances for individual network businesses compared with the previous regulatory period.
A key element of these decisions is that interest rates have fallen, which means the cost of debt and the returns required to attract equity have reduced. A reduced rate of return compared to the previous regulatory period leads to expected reductions in network costs, which in turn leads to lower costs for customers.
The actual trend in regulated network costs over the reporting period depends on when the new rules start to apply for specific network businesses and the results of merit reviews underway. Based on the recent AER decisions, it is expected that in most NEM jurisdictions, overall network costs will fall over the next reporting period which could negatively impact on the returns generated by network providers. The above is contrary to media reports, which often lament that regulators are not exercising their authority in regulating network providers.
Despite the above changes, it remains questionable if these new policies are effective or would/could be exploited by the network providers.
Future Regulatory Changes
As is common to many jurisdiction’s around the world, Australia’s regulatory approach was developed during a period of lower technological change, and it is questionable as to whether the current model is adequate to respond to an environment of rapid technological development in the electricity market, including:
the increasing bi-directional flows on the network which require more active system operations;
the increasing adaptation of cost effective off-grid electricity supply;
opportunities for network providers to defer or avoid traditional capital expenditure by using Distributed Energy Resources (DER) (smaller power sources that can be aggregated), and utility scale energy storage.
Page 14
Commercial-in-Confidence
FEATURE ARTICLE
the advancement of accurate and timely data on electricity usage that is accessible; and
the change in consumers’ consumption patterns and adaptation of new technology.
Given the above, it is likely that regulators will have to review and revise the regulatory framework and rules considering these changes. Examples of recent regulatory changes considering the changing landscape include:
several states in the United States have decoupled integrated utility revenue from volume;
globally, regulators have been allowing higher fixed charges to compensate providers for reduced volume; and
increasing the level of incentives offered for utility scale storage.
Given the stakeholders, the political and commercial implications, it is difficult to predict how the regulatory framework and rules will change and what impact they will have on network providers and ultimately their investors.
1.5 Portfolio Considerations
Energy infrastructure, in particular network providers, are seen as low risk businesses with stable cash flows. Whilst we believe this statement remains true today it is clear the industry is going through a period of major change with the advancement of technology, rise of renewable power and the change in consumers’ consumption patterns.
While the short term impact may be limited, there are considerable uncertainties facing the industry over the medium to longer term.
At one extreme, the utility death spiral is allowed to occur, the grid becomes smaller (resulting in a smaller RAB) which is detrimental to all current investors.
On the other end of the spectrum, current investors could be positively rewarded if network providers can capitalise on such changes as electricity car prominence and providing a more interconnected grid.
Given this longer term uncertainly, we consider listed network providers to be more attractive investment opportunities when compared to their unlisted counterparts. The strong liquidity and low transaction costs provided by listed infrastructure assets allows investors to capitalise on the strong short to medium term attributes of network utilities while allowing the flexibility to trade out of these assets in the future if the risk reward trade off does not continue to appear compelling.
Shorter duration investments higher up the capital structure may also be considered as a sound investment opportunity as network providers are likely to remain low risk in the near future.
However with the looming uncertainties, we find it difficult to justify the current valuations of some of the large unlisted network utilities such as the TransGrid sale price, especially given their long dated illiquid nature coupled with high transaction costs. Despite this, we still believe that unlisted transmission and distribution companies can play a part in our clients’ infrastructure portfolios, but only when we believe that the appropriate risks have been priced in.