Embed Size (px)
Citation preview
Vol.:(0123456789)1 3
Journal of Petroleum Exploration and Production Technology (2020) 10:2559–2573 https://doi.org/10.1007/s13202-020-00879-4
ORIGINAL PAPER - PRODUCTION ENGINEERING
Feasibility study and numerical simulation to design the steam flooding pilot test patterns
Husham A. Elbaloula1 · Chen Jin’e2 · Tang Zichang2 · Wang Yu2 · Mohammed Abdelmajeed1 · Mosab F. Hamd3
Received: 3 February 2020 / Accepted: 7 April 2020 / Published online: 11 May 2020 © The Author(s) 2020
AbstractSteam flooding is a method of injecting steam to heat the oil and decrease its viscosity so that it will be easy to flow from injector to producer. Fula North East oil field is a massive edge and bottom water reservoir with good properties and high viscosity of crude oil. As of March 2018, the oil field has been fully commissioned in steam stimulation for 3 years and the water cut rises rapidly and the oil rate declines seriously. In this paper, through comprehensive analysis of the geological properties of reservoir, production dynamics of single well and cement quality of wellbore, the steam flooding pilot test area under different well groups is screened out. Advanced thermal enhanced oil recovery simulator has been used to build the model of 279, 888 cells to design and optimize steam flooding pilot area for this field. The best well space and development program are optimized; this paper supplies a theoretical foundation for the next step of steam flooding in the whole field. The results show that the optimum steam flooding parameters for this area are steam injection temperature of 270 °C, with 5–7 MPa injection pressure, steam injection quality of more than 0.6 and steam injection rate of 1.6 m3/day/ha/m, and the final recovery ratio will reach 32.3%.
Keywords Numerical simulation · Thermal EOR · Steam flooding Sudanese oil fields
List of symbols% PercentageAG Abu GhabraB1a Bentiu 1aB1a + b Bentiu 1a + Bentiu 1bBbl BarrelBbl/day Barrel per daycP CentipoiseCAPEX Capital costCSS Cyclic steam stimulationCum. CumulativeDNC Do-nothing caseDX Dimension in X-directionDY Dimension in Y-directionDZ Dimension in Z-directionE&P Exploration and production
EA Areal sweep efficiencyED Displacement efficiencyEOR Enhanced oil recoveryEV Vertical sweep efficiencyFNE Fula North EastIRR Internal rate of returnkJ/kg Kilojoule per kilogramM3 Cubic meterm3/day m Cubic meter per day per meterm3/day Cubic meter/daym3/day/ha/m Cubic meter per day per hectare per meterMax MaximummD Meli DarcyMin MinimumMM$ Million dollarsMMm3 Million cubic meterMMSTB Million stock tank barrelMOPM Ministry of Petroleum and MiningMPa MegapascalNP Cumulative oil producedNPV Net present valueNS Initial oil in place at the start of the flood°C Degree CelsiusOEPA Oil Exploration and Production Authority
* Husham A. Elbaloula [email protected]
1 Perto-Energy E&P Co. Ltd, Khartoum, Sudan2 Geophysical Research Institute, BGP, CNPC, Zhuozhou,
China3 Ministry of Petroleum & Mining - OEPA, Khartoum, Sudan
2560 Journal of Petroleum Exploration and Production Technology (2020) 10:2559–2573
1 3
OPEX Operating costOSR Oil–steam ratioPE Petro-energyPi Initial pressurePro. ProductionPsi Pound-force per square inchRF Recovery factorSF Steam floodingSF#2 Steam flooding phase number twoSPE Society of Petroleum EngineeringSTB Stock tank barrelUS United StatesWIT Water injection total
Introduction
Thermal enhanced oil recovery (TEOR) is a family of ter-tiary processes defined as “any process in which heat is introduced intentionally into a subsurface accumulation of organic compounds for the purpose of recovering fuels through well.”
Thermal methods of EOR entail the application of heat to the oil well. Thermal methods have been tested since 1950s, and they are the most advanced among EOR methods, as far as field experience and technology are concerned. They are best suited for heavy oils (10–20° API) and tar sands (≤ 10° API). They have the ability to lower the viscosity of the oil and thus increase the mobility ratio. These methods are typi-cally employed in relatively shallow oil wells with higher viscosity such as tar sands and heavy oil. Thermal methods of EOR have been highly successful in the USA, Canada, Venezuela and Indonesia and have also been used in China and Brazil. Within the USA, thermal methods account for around 40% of EOR production (Prats 1982).
Types of thermal EOR
• Steam flooding.• Cyclic steam stimulation (CSS).• Steam-assisted gravity drainage (SAGD).• In situ combustion (ISC).• Solar EOR.• Electro-EOR (EEOR).• Heated annulus steam drive (HASD).• Steam and solvent processes.
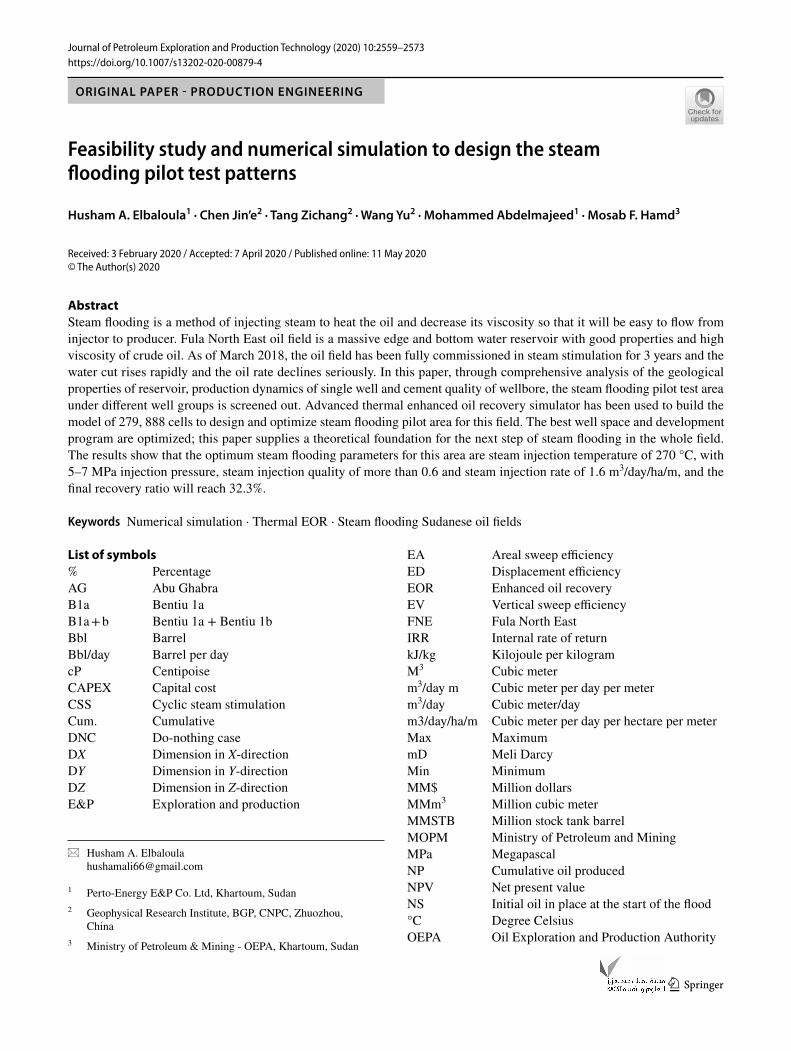
FNE field is located about 9 km away from the North East of Fula field in Fula Sub-basin in Sudan; it is structurally subdivided into three main blocks, which are FNE-1, FNE-3 and FNE-N. There are three proved hydrocarbon-bearing formations (Aradaiba, Bentiu and AG), among which Bentiu is the main pay zone. Figure 1 shows the location of FNE.
FNE oil field is considered as heavy oil field and it has shallow reservoir, and Bentiu reservoir is affected by strong bottom water. The reservoir of FNE oil field is characterized by normal temperature and pressure system at 529 m depth. The average pressure is 576 psi and the average temperature is 43.9 °C. FNE has conventional heavy oil in both Ara-daiba and Bentiu, and Bentiu reservoir has a relatively good quality with porosity ranging from 17 to 40%, permeability ranging from 100 to 11000 mD and viscosity of about 840 cP (Elbaloula et al. 2016).
The oil field put into production in 2010 with cold pro-duction and cyclic steam stimulation. By March 2018, a total of 117 wells had been drilled, including one horizontal well; 116 wells have been put into operation, of which 21 wells are producing as cold, 82 wells for steam stimulation and 13 wells for steam flooding. One hundred and eleven wells were opened with a daily oil production of 489 6bbl, a daily fluid production of 10,145 bbl, water cut of 54%, the total original oil in place of 332MM STB, and the up-to-date recovery factor of reservoirs of 0.8%.
Literature review and screening
Years of production shows that the daily oil production for steam stimulation is almost three times of the cold wells, indicating that injection steam into well bottom can heat the reservoir and reduce viscosity of the heavy oil to increase production capacity. Currently, the oil fields used for steam flooding include China’s Liaohe oil field, US Kern River oil field, Indonesian Dori oil field and so on (Jones et al. 1995).
From screening, the Qi 40 of Liaohe oil field which put into steam flooding has been selected early as a reference example to illustrate the feasibility of steam flooding in FNE oil field. Qi 40 reservoir was put into operation in 1983 by steam stimulation with oil take-off rate of 15.3%. During
Fig. 1 FNE location map (Elbaloula et al. 2016)
2561Journal of Petroleum Exploration and Production Technology (2020) 10:2559–2573
1 3
the period of 1990–2000, the steam flooding test was car-ried out. In 2001, intermittent steam flooding was officially started. The well pattern was anti-9 spot with well space of 100 meters. As of December 2003, the oil take-off rate increased to 41.4%, highlighting the superiority of steam flooding for heavy oil reservoirs (Jiu-quan et al. 2006).
By comparing the reservoir properties for each oil field and the applicability of steam flooding and comparing SPE table for EOR screening (Taber et al. 1997), as given in Table 1, it is considered that the Sudan FNE oil field is suit-able for steam flooding, and this paper well covers the steam flooding screening, pilot area selection, pilot simulation and designing as well as optimization.
Methodology
The geological data, reservoir data and production data for FNE oil field have been collected and used for analysis to identify the situation of the field, and it is suitable for con-ducting steam injection and full-field implementation.
Advanced thermal EOR simulator software has been used to build the dynamic model and to design and opti-mize steam flooding injection and production parameters for FNE oil field.
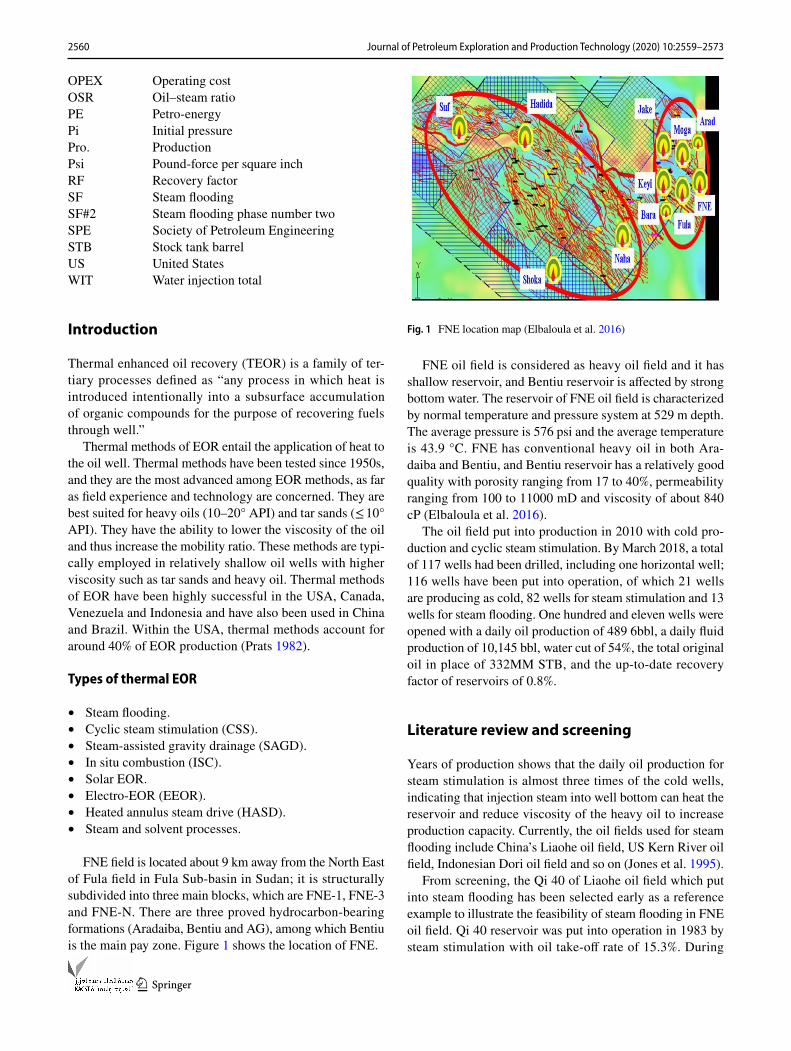
The steps in Fig. 2) are used in this paper.
Results and discussion
The thermal recovery is essential for this field, and the first pilot has been conducted in FNE-16 well and the results showed that the CSS has the ability to double the production,
and then, additional wells have been added at each phase. Up to 2016, the total CSS wells are 67 including 37 wells are under the first and second cycles, 24 wells under the third and fourth cycles and 6 wells under the fifth cycle.
The average daily oil production for this field has been increased from 5300 bbl./day as of December 2014 to 8300 bbl./day as of September, 2016, and the peak oil production has been recorded in 2016 as 9000 bbl./day. The CSS is very successful, and the average oil rate is almost 1.6 times compared to cold production. The CSS only can increase the recovery percent from 32.5 to 34.2%, which makes it more attractive as development scenario for FNE oil field (Elbaloula 2017).
The steam flooding pilot has been implemented in Sep-tember 2015, and the results encourage to go for the second steam flooding pilot in this field in order to get full picture of full-field implementation as given in Table 2.
Table 1 Reservoir properties of each oil field using steam flooding (Elbaloula et al. 2016; Pearce and Megginson 1991; Jones et al. 1995; Taber et al. 1997)
Item Qi 40 Shu175 Wa 38 Cruse E Kern River
FNE SPE (Taber)
Reservoir type Tectonic–lithology with edge–bottom water
Tectonic–lithology with edge–bottom water
Sand with good con-nectivity
Sand with good con-nectivity
Sand Tectonic–lithol-ogy with bottom water
Depth (m) 625–1025 1240–1430 548 543 < 1524Net pay (m) 37.7 47.8 21.5 36.6 29.5 44 > 6Pi (psi) 1232.5 1508 435–580 564T (°C) 36.8 55 44Porosity (%) 31.5 25.6 22.3 32Permeability (mD) 2062 1500 1066 3200 > 200Viscosity@50 °C
(mPa s3100-4600 10,000 15,000 712–2543 < 100,000
Well pattern Anti-9 Anti-9 Anti-5 Anti-9 Anti-5SF period recovery
(%)20.9–37.4 23.4 37 Study > 20
Fig. 2 The steps and workflow for this study
2562 Journal of Petroleum Exploration and Production Technology (2020) 10:2559–2573
1 3
Pilot area selection analysis
In order to select the best location for pilot, screening of FNE oil field with steam flooding has been conducted; the following factors are considered:-
1. The pilot area must have abundant reservoir resources, and then, the properties can represent the general level of the whole oil field.
2. The sand body between the producer and the injector must have good connectivity and a uniform oil–water contact, and the interlayer should be fully considered to make sure that the injected steam plays a more desirable role.
3. At present, the daily oil production of some wells is in a decreasing stage, and the water cut is relatively high.
Dynamic analysis needs to be conducted to assist opti-mization.
4. The producers have experienced at least one cycle of high-temperature steam injection and soaking, and even four–six cycles. The cementing facility of some wells becomes damaged. Therefore, it is necessary to check the well cementing and propose workover before steam flooding.
Block 1 is located at a high structure with 16 wells, including 2 cold wells and 14 steam simulation wells. Two cold wells and three CSS wells were put into production in 2010 and 11 steam simulation wells in 2015. The main perforation layers are B1a and B1b. Block 2 is located in a relatively low structure with 11 wells, including three cold wells commissioned in 2010 and eight steam wells commis-sioned in 2015.
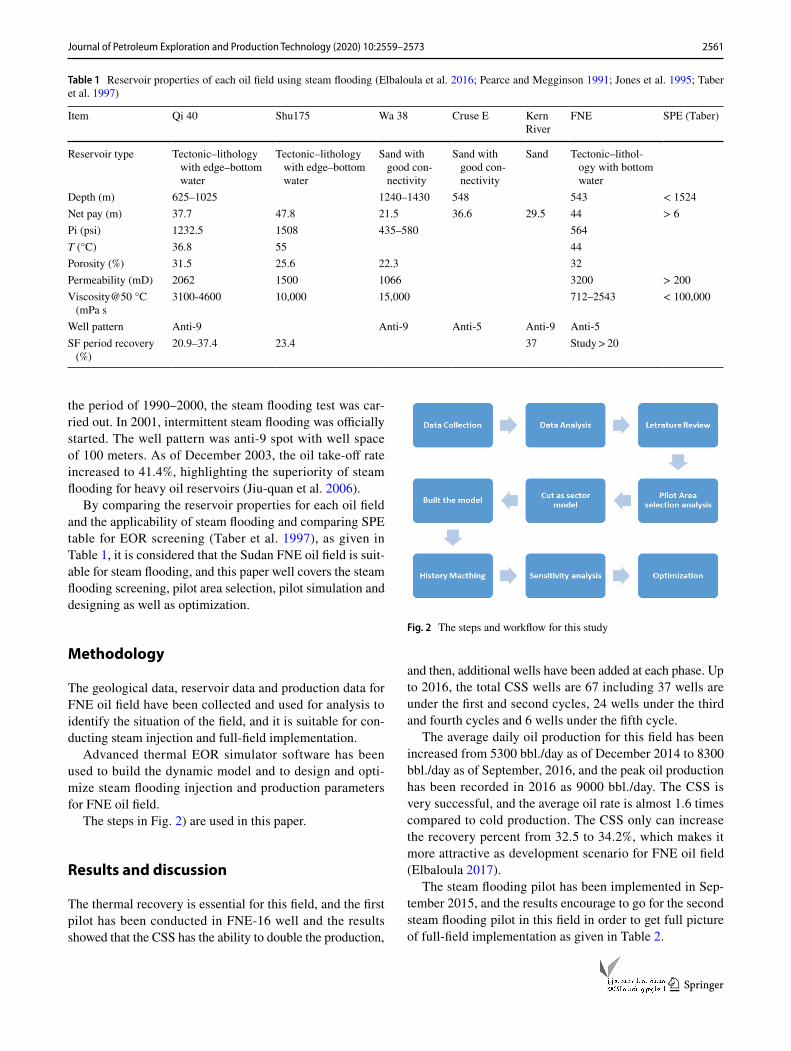
According to above screening principle and considering the block structure, the effective thickness of the reservoir (Fig. 3), the cementing quality and the current production status, the selected block 1 is selected as the steam flooding pilot area to carry out the next numerical simulation and development plan prediction.
Building the numerical model
Advanced thermal process reservoir simulator has been used which includes options such as chemical/polymer flooding, thermal applications, steam injection, horizontal wells, dual
Table 2 Screening criteria for thermal recovery and development (Elbaloula et al. 2016)
Item CSS SF FNE
Pay depth (m) < 1700 < 1300 550Pay thickness (m) 10–35 7–60 30NTG 0.35 > 0.4 0.6Horizontal perm. (md) > 200 >200 4000Porosity % > 20 > 20 32Oil saturation % > 60 > 45 70Dead oil viscosity, mPa s / < 10,000 661 (50°)Reservoir pres (Psi) < 1885 < 725 610
Fig. 3 Reservoir properties and pilot area
2563Journal of Petroleum Exploration and Production Technology (2020) 10:2559–2573
1 3
porosity/permeability, directional permeability, flexible grids, fireflood and many more.
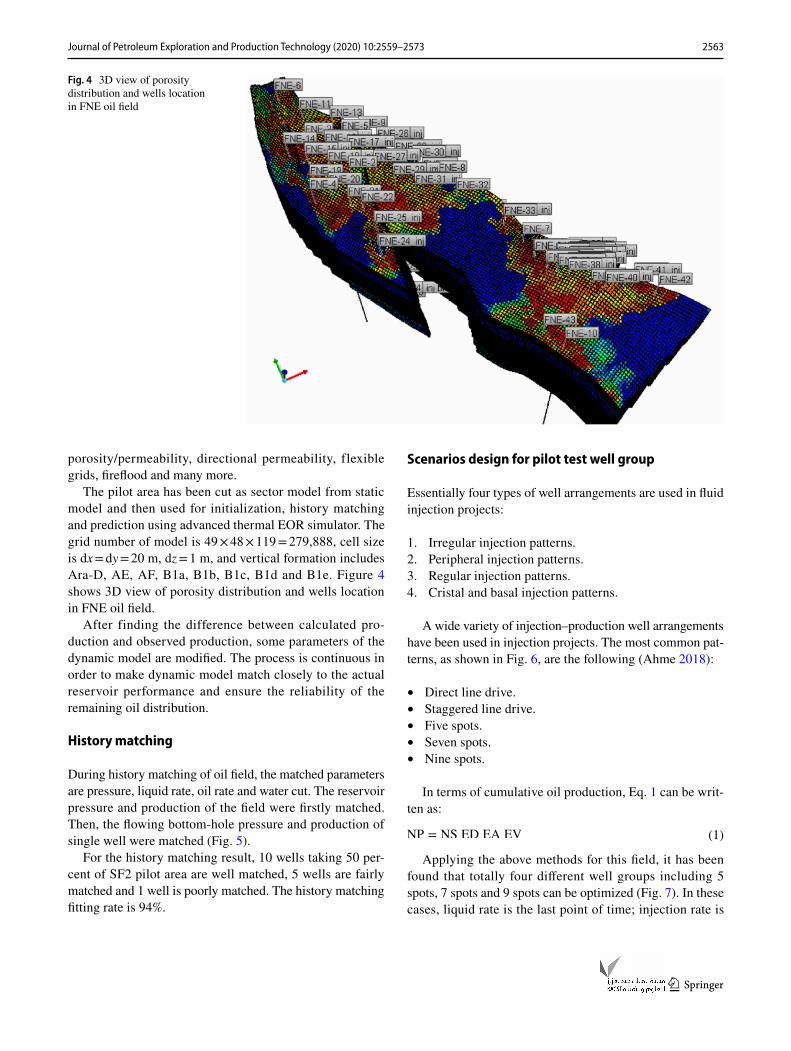
The pilot area has been cut as sector model from static model and then used for initialization, history matching and prediction using advanced thermal EOR simulator. The grid number of model is 49 × 48 × 119 = 279,888, cell size is dx = dy = 20 m, dz = 1 m, and vertical formation includes Ara-D, AE, AF, B1a, B1b, B1c, B1d and B1e. Figure 4 shows 3D view of porosity distribution and wells location in FNE oil field.
After finding the difference between calculated pro-duction and observed production, some parameters of the dynamic model are modified. The process is continuous in order to make dynamic model match closely to the actual reservoir performance and ensure the reliability of the remaining oil distribution.
History matching
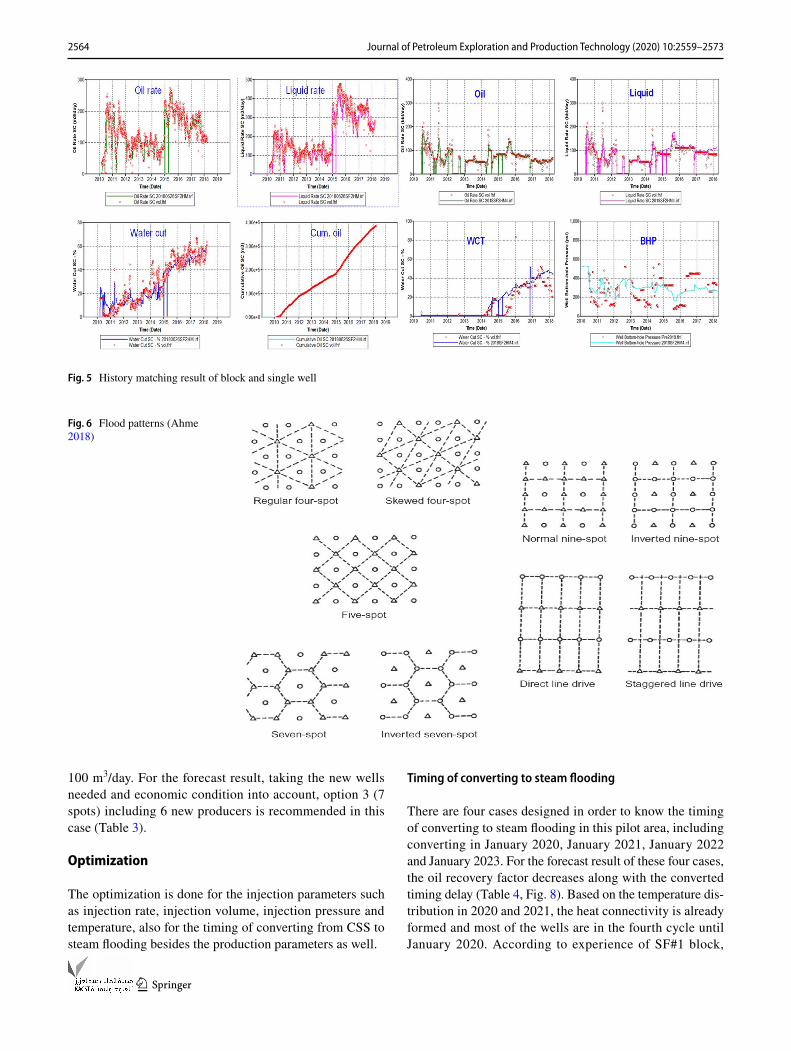
During history matching of oil field, the matched parameters are pressure, liquid rate, oil rate and water cut. The reservoir pressure and production of the field were firstly matched. Then, the flowing bottom-hole pressure and production of single well were matched (Fig. 5).
For the history matching result, 10 wells taking 50 per-cent of SF2 pilot area are well matched, 5 wells are fairly matched and 1 well is poorly matched. The history matching fitting rate is 94%.
Scenarios design for pilot test well group
Essentially four types of well arrangements are used in fluid injection projects:
1. Irregular injection patterns.2. Peripheral injection patterns.3. Regular injection patterns.4. Cristal and basal injection patterns.
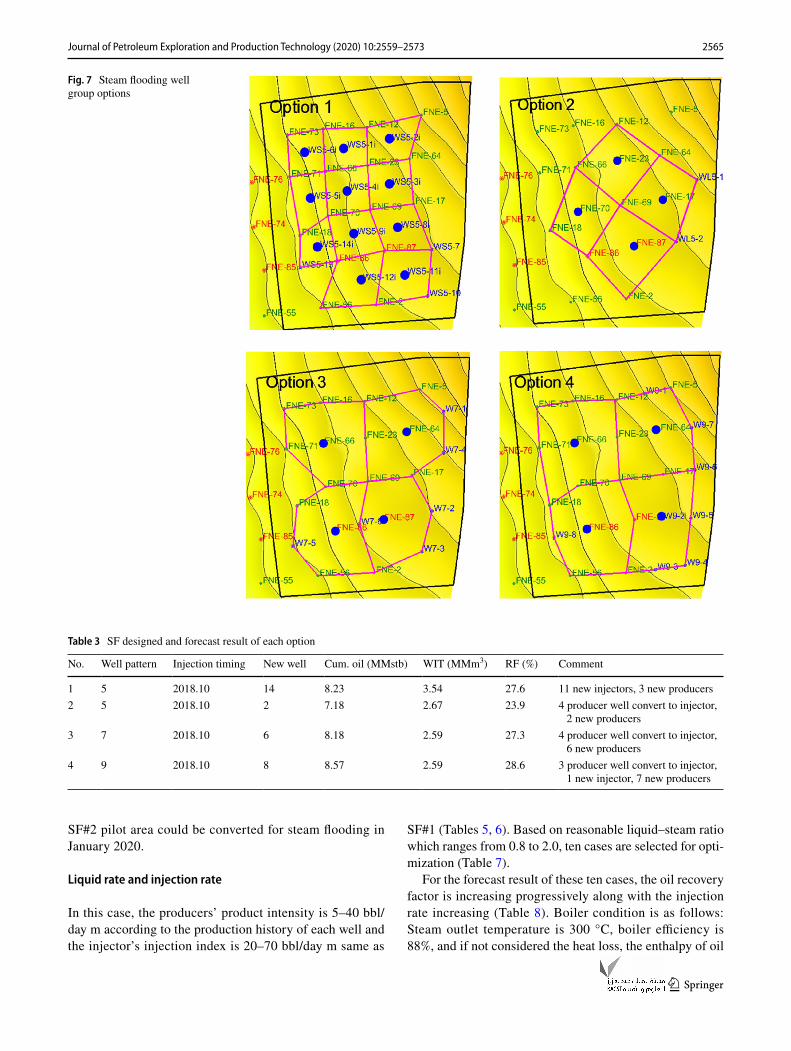
A wide variety of injection–production well arrangements have been used in injection projects. The most common pat-terns, as shown in Fig. 6, are the following (Ahme 2018):
• Direct line drive.• Staggered line drive.• Five spots.• Seven spots.• Nine spots.
In terms of cumulative oil production, Eq. 1 can be writ-ten as:
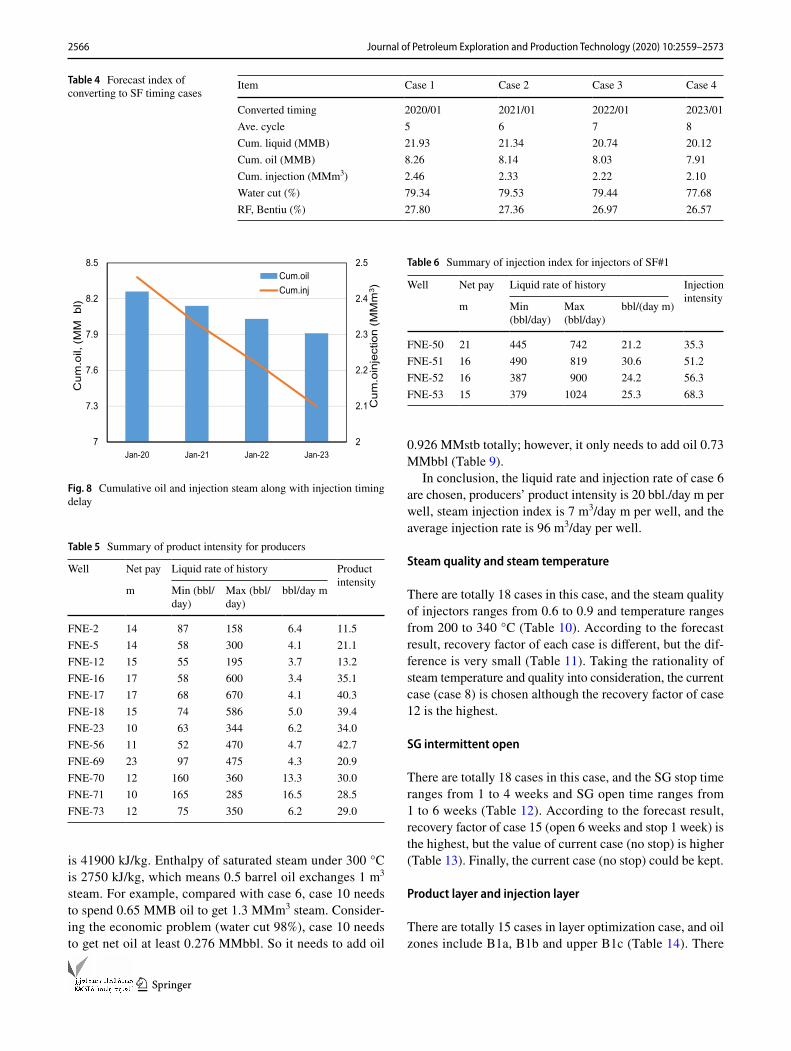
Applying the above methods for this field, it has been found that totally four different well groups including 5 spots, 7 spots and 9 spots can be optimized (Fig. 7). In these cases, liquid rate is the last point of time; injection rate is
(1)NP = NS ED EA EV
Fig. 4 3D view of porosity distribution and wells location in FNE oil field
2564 Journal of Petroleum Exploration and Production Technology (2020) 10:2559–2573
1 3
100 m3/day. For the forecast result, taking the new wells needed and economic condition into account, option 3 (7 spots) including 6 new producers is recommended in this case (Table 3).
Optimization
The optimization is done for the injection parameters such as injection rate, injection volume, injection pressure and temperature, also for the timing of converting from CSS to steam flooding besides the production parameters as well.
Timing of converting to steam flooding
There are four cases designed in order to know the timing of converting to steam flooding in this pilot area, including converting in January 2020, January 2021, January 2022 and January 2023. For the forecast result of these four cases, the oil recovery factor decreases along with the converted timing delay (Table 4, Fig. 8). Based on the temperature dis-tribution in 2020 and 2021, the heat connectivity is already formed and most of the wells are in the fourth cycle until January 2020. According to experience of SF#1 block,
Fig. 5 History matching result of block and single well
Fig. 6 Flood patterns (Ahme 2018)
2565Journal of Petroleum Exploration and Production Technology (2020) 10:2559–2573
1 3
SF#2 pilot area could be converted for steam flooding in January 2020.
Liquid rate and injection rate
In this case, the producers’ product intensity is 5–40 bbl/day m according to the production history of each well and the injector’s injection index is 20–70 bbl/day m same as
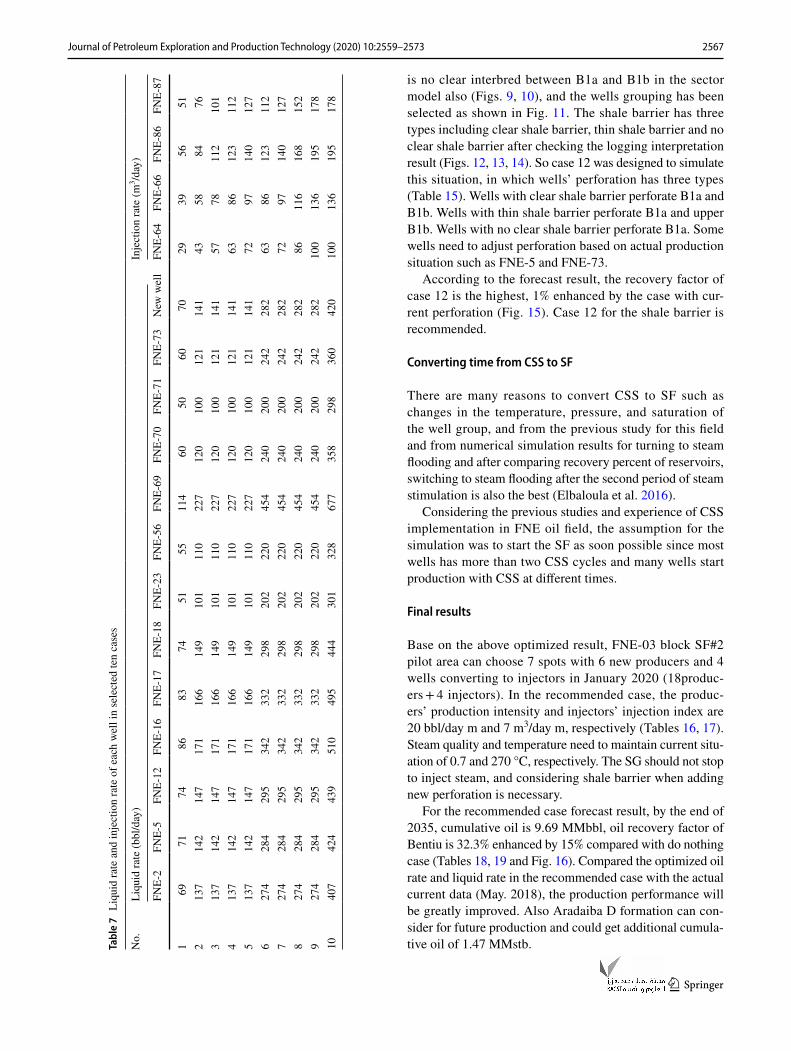
SF#1 (Tables 5, 6). Based on reasonable liquid–steam ratio which ranges from 0.8 to 2.0, ten cases are selected for opti-mization (Table 7).
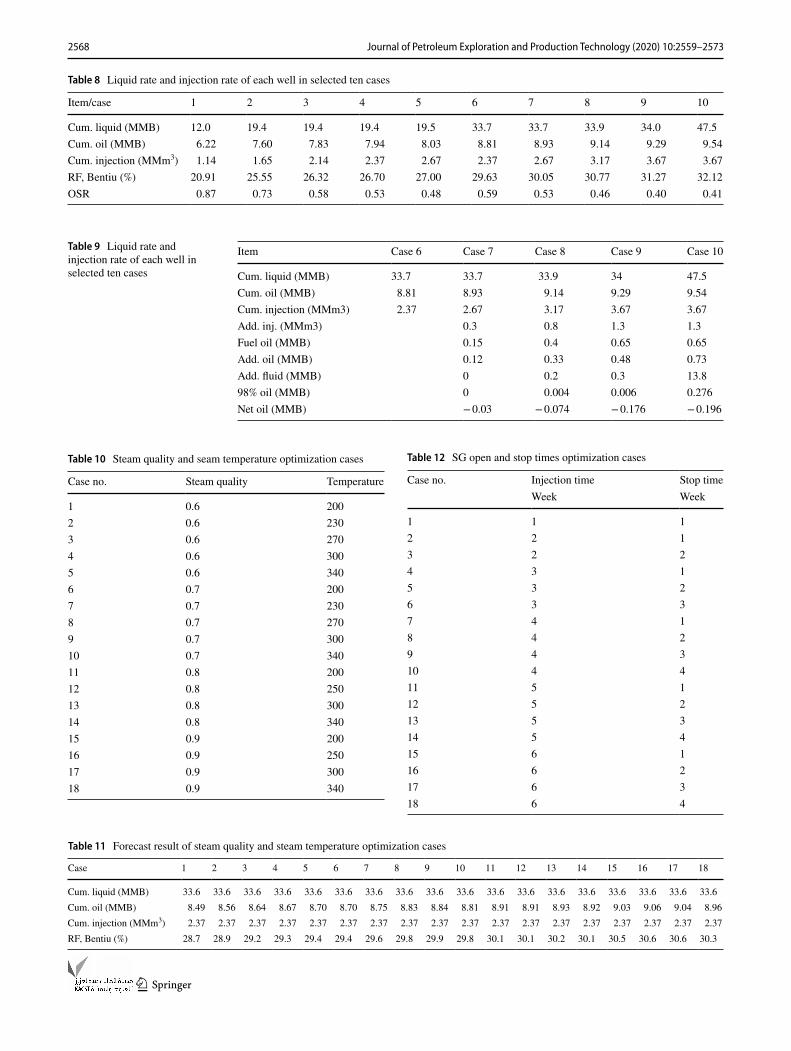
For the forecast result of these ten cases, the oil recovery factor is increasing progressively along with the injection rate increasing (Table 8). Boiler condition is as follows: Steam outlet temperature is 300 °C, boiler efficiency is 88%, and if not considered the heat loss, the enthalpy of oil
Fig. 7 Steam flooding well group options
Table 3 SF designed and forecast result of each option
No. Well pattern Injection timing New well Cum. oil (MMstb) WIT (MMm3) RF (%) Comment
1 5 2018.10 14 8.23 3.54 27.6 11 new injectors, 3 new producers2 5 2018.10 2 7.18 2.67 23.9 4 producer well convert to injector,
2 new producers3 7 2018.10 6 8.18 2.59 27.3 4 producer well convert to injector,
6 new producers4 9 2018.10 8 8.57 2.59 28.6 3 producer well convert to injector,
1 new injector, 7 new producers
2566 Journal of Petroleum Exploration and Production Technology (2020) 10:2559–2573
1 3
is 41900 kJ/kg. Enthalpy of saturated steam under 300 °C is 2750 kJ/kg, which means 0.5 barrel oil exchanges 1 m3 steam. For example, compared with case 6, case 10 needs to spend 0.65 MMB oil to get 1.3 MMm3 steam. Consider-ing the economic problem (water cut 98%), case 10 needs to get net oil at least 0.276 MMbbl. So it needs to add oil
0.926 MMstb totally; however, it only needs to add oil 0.73 MMbbl (Table 9).
In conclusion, the liquid rate and injection rate of case 6 are chosen, producers’ product intensity is 20 bbl./day m per well, steam injection index is 7 m3/day m per well, and the average injection rate is 96 m3/day per well.
Steam quality and steam temperature
There are totally 18 cases in this case, and the steam quality of injectors ranges from 0.6 to 0.9 and temperature ranges from 200 to 340 °C (Table 10). According to the forecast result, recovery factor of each case is different, but the dif-ference is very small (Table 11). Taking the rationality of steam temperature and quality into consideration, the current case (case 8) is chosen although the recovery factor of case 12 is the highest.
SG intermittent open
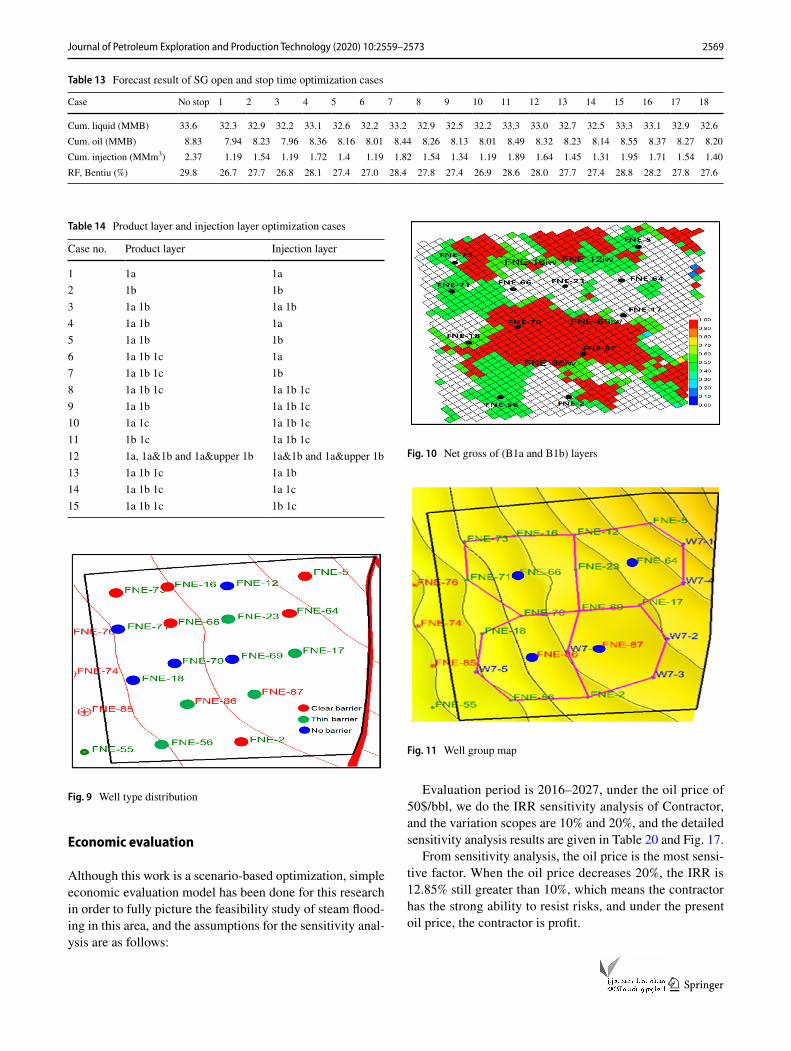
There are totally 18 cases in this case, and the SG stop time ranges from 1 to 4 weeks and SG open time ranges from 1 to 6 weeks (Table 12). According to the forecast result, recovery factor of case 15 (open 6 weeks and stop 1 week) is the highest, but the value of current case (no stop) is higher (Table 13). Finally, the current case (no stop) could be kept.
Product layer and injection layer
There are totally 15 cases in layer optimization case, and oil zones include B1a, B1b and upper B1c (Table 14). There
Table 4 Forecast index of converting to SF timing cases
Item Case 1 Case 2 Case 3 Case 4
Converted timing 2020/01 2021/01 2022/01 2023/01Ave. cycle 5 6 7 8Cum. liquid (MMB) 21.93 21.34 20.74 20.12Cum. oil (MMB) 8.26 8.14 8.03 7.91Cum. injection (MMm3) 2.46 2.33 2.22 2.10Water cut (%) 79.34 79.53 79.44 77.68RF, Bentiu (%) 27.80 27.36 26.97 26.57
Fig. 8 Cumulative oil and injection steam along with injection timing delay
Table 5 Summary of product intensity for producers
Well Net pay Liquid rate of history Product intensity
m Min (bbl/day)
Max (bbl/day)
bbl/day m
FNE-2 14 87 158 6.4 11.5FNE-5 14 58 300 4.1 21.1FNE-12 15 55 195 3.7 13.2FNE-16 17 58 600 3.4 35.1FNE-17 17 68 670 4.1 40.3FNE-18 15 74 586 5.0 39.4FNE-23 10 63 344 6.2 34.0FNE-56 11 52 470 4.7 42.7FNE-69 23 97 475 4.3 20.9FNE-70 12 160 360 13.3 30.0FNE-71 10 165 285 16.5 28.5FNE-73 12 75 350 6.2 29.0
Table 6 Summary of injection index for injectors of SF#1
Well Net pay Liquid rate of history Injection intensity
m Min (bbl/day)
Max (bbl/day)
bbl/(day m)
FNE-50 21 445 742 21.2 35.3FNE-51 16 490 819 30.6 51.2FNE-52 16 387 900 24.2 56.3FNE-53 15 379 1024 25.3 68.3
2567Journal of Petroleum Exploration and Production Technology (2020) 10:2559–2573
1 3
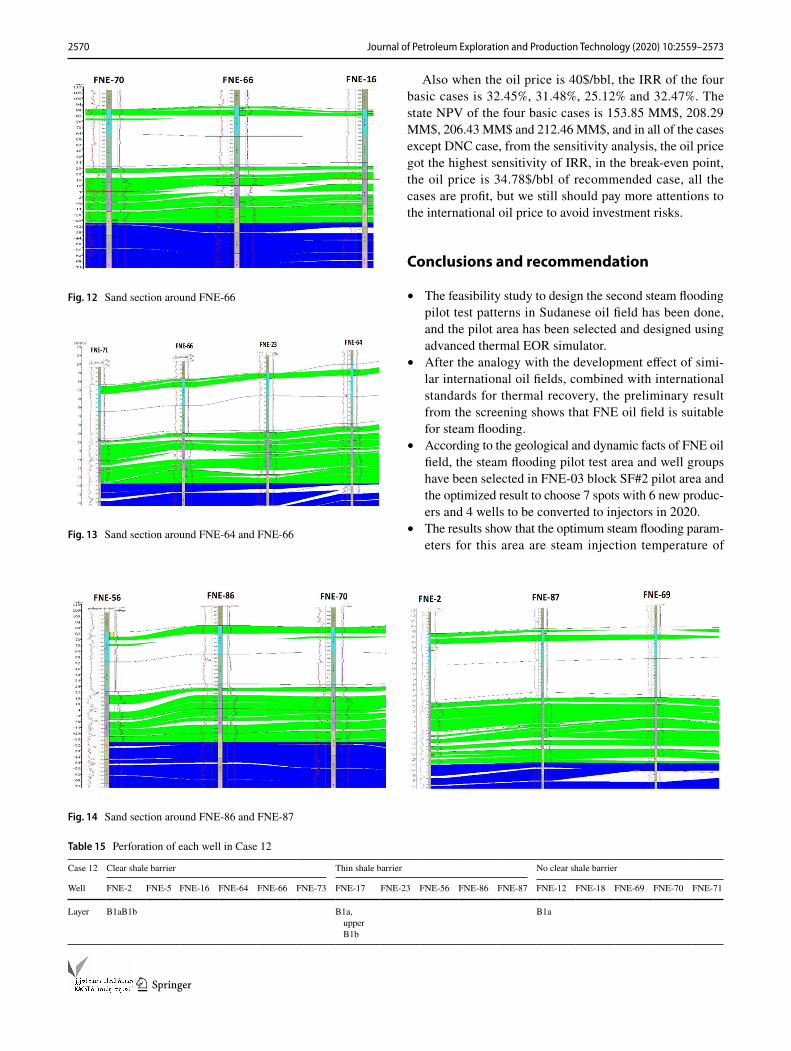
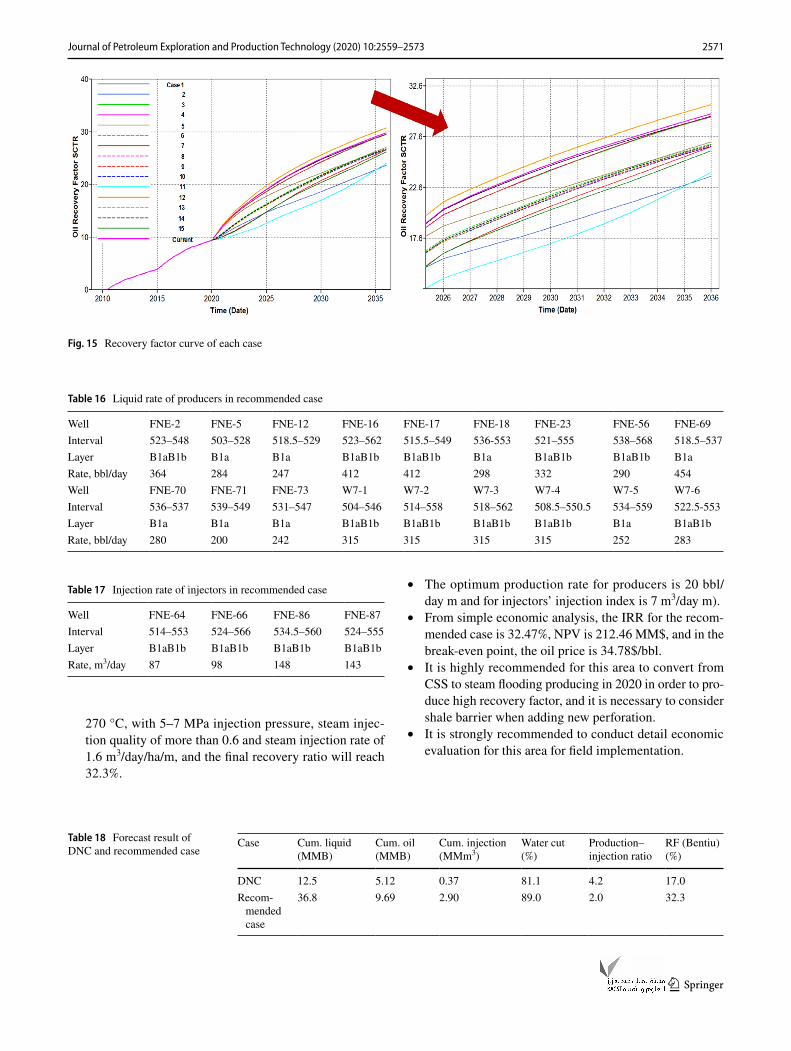
is no clear interbred between B1a and B1b in the sector model also (Figs. 9, 10), and the wells grouping has been selected as shown in Fig. 11. The shale barrier has three types including clear shale barrier, thin shale barrier and no clear shale barrier after checking the logging interpretation result (Figs. 12, 13, 14). So case 12 was designed to simulate this situation, in which wells’ perforation has three types (Table 15). Wells with clear shale barrier perforate B1a and B1b. Wells with thin shale barrier perforate B1a and upper B1b. Wells with no clear shale barrier perforate B1a. Some wells need to adjust perforation based on actual production situation such as FNE-5 and FNE-73.
According to the forecast result, the recovery factor of case 12 is the highest, 1% enhanced by the case with cur-rent perforation (Fig. 15). Case 12 for the shale barrier is recommended.
Converting time from CSS to SF
There are many reasons to convert CSS to SF such as changes in the temperature, pressure, and saturation of the well group, and from the previous study for this field and from numerical simulation results for turning to steam flooding and after comparing recovery percent of reservoirs, switching to steam flooding after the second period of steam stimulation is also the best (Elbaloula et al. 2016).
Considering the previous studies and experience of CSS implementation in FNE oil field, the assumption for the simulation was to start the SF as soon possible since most wells has more than two CSS cycles and many wells start production with CSS at different times.
Final results
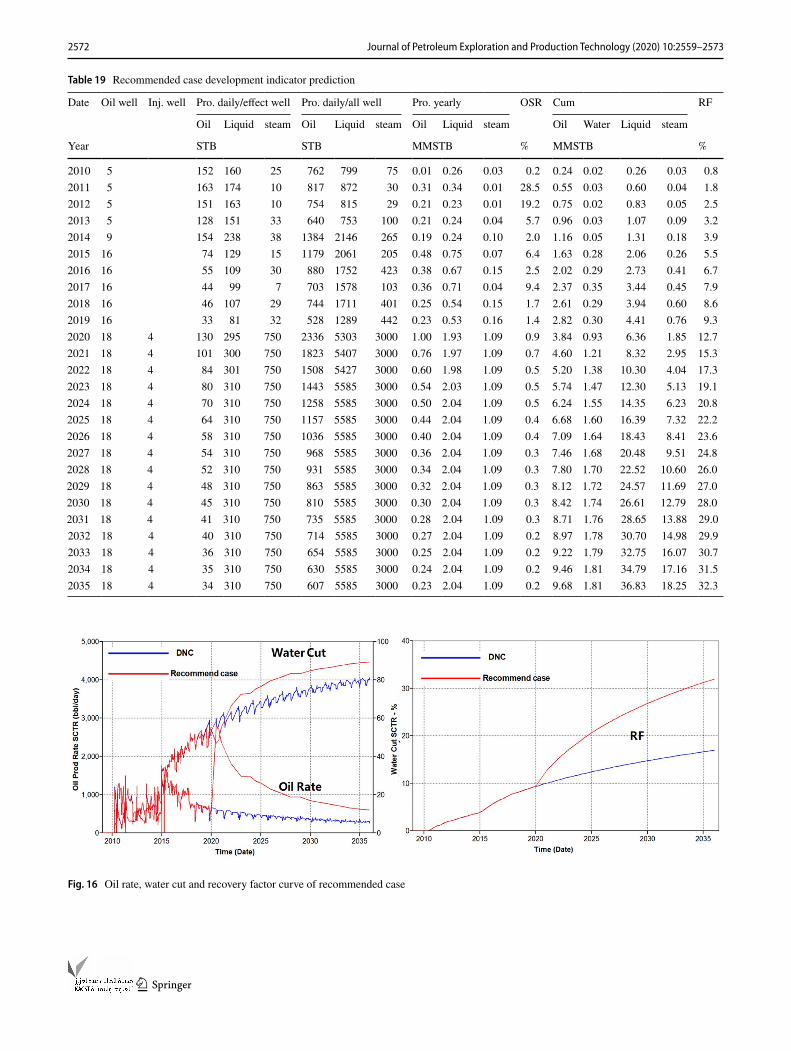
Base on the above optimized result, FNE-03 block SF#2 pilot area can choose 7 spots with 6 new producers and 4 wells converting to injectors in January 2020 (18produc-ers + 4 injectors). In the recommended case, the produc-ers’ production intensity and injectors’ injection index are 20 bbl/day m and 7 m3/day m, respectively (Tables 16, 17). Steam quality and temperature need to maintain current situ-ation of 0.7 and 270 °C, respectively. The SG should not stop to inject steam, and considering shale barrier when adding new perforation is necessary.
For the recommended case forecast result, by the end of 2035, cumulative oil is 9.69 MMbbl, oil recovery factor of Bentiu is 32.3% enhanced by 15% compared with do nothing case (Tables 18, 19 and Fig. 16). Compared the optimized oil rate and liquid rate in the recommended case with the actual current data (May. 2018), the production performance will be greatly improved. Also Aradaiba D formation can con-sider for future production and could get additional cumula-tive oil of 1.47 MMstb.Ta
ble
7 L
iqui
d ra
te a
nd in
ject
ion
rate
of e
ach
wel
l in
sele
cted
ten
case
s
No.
Liqu
id ra
te (b
bl/d
ay)
Inje
ctio
n ra
te (m
3 /day
)
FNE-
2FN
E-5
FNE-
12FN
E-16
FNE-
17FN
E-18
FNE-
23FN
E-56
FNE-
69FN
E-70
FNE-
71FN
E-73
New
wel
lFN
E-64
FNE-
66FN
E-86
FNE-
87
169
7174
8683
7451
5511
460
5060
7029
3956
512
137
142
147
171
166
149
101
110
227
120
100
121
141
4358
8476
313
714
214
717
116
614
910
111
022
712
010
012
114
157
7811
210
14
137
142
147
171
166
149
101
110
227
120
100
121
141
6386
123
112
513
714
214
717
116
614
910
111
022
712
010
012
114
172
9714
012
76
274
284
295
342
332
298
202
220
454
240
200
242
282
6386
123
112
727
428
429
534
233
229
820
222
045
424
020
024
228
272
9714
012
78
274
284
295
342
332
298
202
220
454
240
200
242
282
8611
616
815
29
274
284
295
342
332
298
202
220
454
240
200
242
282
100
136
195
178
1040
742
443
951
049
544
430
132
867
735
829
836
042
010
013
619
517
8
2568 Journal of Petroleum Exploration and Production Technology (2020) 10:2559–2573
1 3
Table 8 Liquid rate and injection rate of each well in selected ten cases
Item/case 1 2 3 4 5 6 7 8 9 10
Cum. liquid (MMB) 12.0 19.4 19.4 19.4 19.5 33.7 33.7 33.9 34.0 47.5Cum. oil (MMB) 6.22 7.60 7.83 7.94 8.03 8.81 8.93 9.14 9.29 9.54Cum. injection (MMm3) 1.14 1.65 2.14 2.37 2.67 2.37 2.67 3.17 3.67 3.67RF, Bentiu (%) 20.91 25.55 26.32 26.70 27.00 29.63 30.05 30.77 31.27 32.12OSR 0.87 0.73 0.58 0.53 0.48 0.59 0.53 0.46 0.40 0.41
Table 9 Liquid rate and injection rate of each well in selected ten cases
Item Case 6 Case 7 Case 8 Case 9 Case 10
Cum. liquid (MMB) 33.7 33.7 33.9 34 47.5Cum. oil (MMB) 8.81 8.93 9.14 9.29 9.54Cum. injection (MMm3) 2.37 2.67 3.17 3.67 3.67Add. inj. (MMm3) 0.3 0.8 1.3 1.3Fuel oil (MMB) 0.15 0.4 0.65 0.65Add. oil (MMB) 0.12 0.33 0.48 0.73Add. fluid (MMB) 0 0.2 0.3 13.898% oil (MMB) 0 0.004 0.006 0.276Net oil (MMB) − 0.03 − 0.074 − 0.176 − 0.196
Table 10 Steam quality and seam temperature optimization cases
Case no. Steam quality Temperature
1 0.6 2002 0.6 2303 0.6 2704 0.6 3005 0.6 3406 0.7 2007 0.7 2308 0.7 2709 0.7 30010 0.7 34011 0.8 20012 0.8 25013 0.8 30014 0.8 34015 0.9 20016 0.9 25017 0.9 30018 0.9 340
Table 11 Forecast result of steam quality and steam temperature optimization cases
Case 1 2 3 4 5 6 7 8 9 10 11 12 13 14 15 16 17 18
Cum. liquid (MMB) 33.6 33.6 33.6 33.6 33.6 33.6 33.6 33.6 33.6 33.6 33.6 33.6 33.6 33.6 33.6 33.6 33.6 33.6Cum. oil (MMB) 8.49 8.56 8.64 8.67 8.70 8.70 8.75 8.83 8.84 8.81 8.91 8.91 8.93 8.92 9.03 9.06 9.04 8.96Cum. injection (MMm3) 2.37 2.37 2.37 2.37 2.37 2.37 2.37 2.37 2.37 2.37 2.37 2.37 2.37 2.37 2.37 2.37 2.37 2.37RF, Bentiu (%) 28.7 28.9 29.2 29.3 29.4 29.4 29.6 29.8 29.9 29.8 30.1 30.1 30.2 30.1 30.5 30.6 30.6 30.3
Table 12 SG open and stop times optimization cases
Case no. Injection time Stop timeWeek Week
1 1 12 2 13 2 24 3 15 3 26 3 37 4 18 4 29 4 310 4 411 5 112 5 213 5 314 5 415 6 116 6 217 6 318 6 4
2569Journal of Petroleum Exploration and Production Technology (2020) 10:2559–2573
1 3
Economic evaluation
Although this work is a scenario-based optimization, simple economic evaluation model has been done for this research in order to fully picture the feasibility study of steam flood-ing in this area, and the assumptions for the sensitivity anal-ysis are as follows:
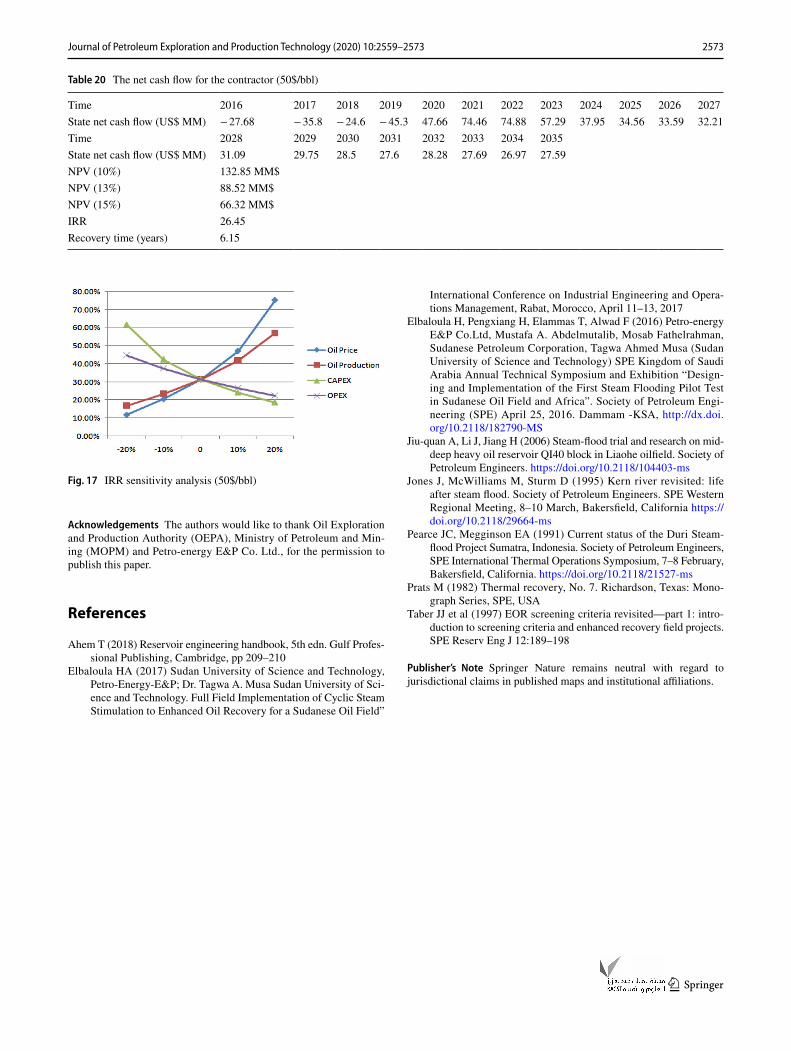
Evaluation period is 2016–2027, under the oil price of 50$/bbl, we do the IRR sensitivity analysis of Contractor, and the variation scopes are 10% and 20%, and the detailed sensitivity analysis results are given in Table 20 and Fig. 17.
From sensitivity analysis, the oil price is the most sensi-tive factor. When the oil price decreases 20%, the IRR is 12.85% still greater than 10%, which means the contractor has the strong ability to resist risks, and under the present oil price, the contractor is profit.
Table 13 Forecast result of SG open and stop time optimization cases
Case No stop 1 2 3 4 5 6 7 8 9 10 11 12 13 14 15 16 17 18
Cum. liquid (MMB) 33.6 32.3 32.9 32.2 33.1 32.6 32.2 33.2 32.9 32.5 32.2 33.3 33.0 32.7 32.5 33.3 33.1 32.9 32.6Cum. oil (MMB) 8.83 7.94 8.23 7.96 8.36 8.16 8.01 8.44 8.26 8.13 8.01 8.49 8.32 8.23 8.14 8.55 8.37 8.27 8.20Cum. injection (MMm3) 2.37 1.19 1.54 1.19 1.72 1.4 1.19 1.82 1.54 1.34 1.19 1.89 1.64 1.45 1.31 1.95 1.71 1.54 1.40RF, Bentiu (%) 29.8 26.7 27.7 26.8 28.1 27.4 27.0 28.4 27.8 27.4 26.9 28.6 28.0 27.7 27.4 28.8 28.2 27.8 27.6
Table 14 Product layer and injection layer optimization cases
Case no. Product layer Injection layer
1 1a 1a2 1b 1b3 1a 1b 1a 1b4 1a 1b 1a5 1a 1b 1b6 1a 1b 1c 1a7 1a 1b 1c 1b8 1a 1b 1c 1a 1b 1c9 1a 1b 1a 1b 1c10 1a 1c 1a 1b 1c11 1b 1c 1a 1b 1c12 1a, 1a&1b and 1a&upper 1b 1a&1b and 1a&upper 1b13 1a 1b 1c 1a 1b14 1a 1b 1c 1a 1c15 1a 1b 1c 1b 1c
Fig. 9 Well type distribution
Fig. 10 Net gross of (B1a and B1b) layers
Fig. 11 Well group map
2570 Journal of Petroleum Exploration and Production Technology (2020) 10:2559–2573
1 3
Also when the oil price is 40$/bbl, the IRR of the four basic cases is 32.45%, 31.48%, 25.12% and 32.47%. The state NPV of the four basic cases is 153.85 MM$, 208.29 MM$, 206.43 MM$ and 212.46 MM$, and in all of the cases except DNC case, from the sensitivity analysis, the oil price got the highest sensitivity of IRR, in the break-even point, the oil price is 34.78$/bbl of recommended case, all the cases are profit, but we still should pay more attentions to the international oil price to avoid investment risks.
Conclusions and recommendation
• The feasibility study to design the second steam flooding pilot test patterns in Sudanese oil field has been done, and the pilot area has been selected and designed using advanced thermal EOR simulator.
• After the analogy with the development effect of simi-lar international oil fields, combined with international standards for thermal recovery, the preliminary result from the screening shows that FNE oil field is suitable for steam flooding.
• According to the geological and dynamic facts of FNE oil field, the steam flooding pilot test area and well groups have been selected in FNE-03 block SF#2 pilot area and the optimized result to choose 7 spots with 6 new produc-ers and 4 wells to be converted to injectors in 2020.
• The results show that the optimum steam flooding param-eters for this area are steam injection temperature of
Fig. 12 Sand section around FNE-66
Fig. 13 Sand section around FNE-64 and FNE-66
Fig. 14 Sand section around FNE-86 and FNE-87
Table 15 Perforation of each well in Case 12
Case 12 Clear shale barrier Thin shale barrier No clear shale barrier
Well FNE-2 FNE-5 FNE-16 FNE-64 FNE-66 FNE-73 FNE-17 FNE-23 FNE-56 FNE-86 FNE-87 FNE-12 FNE-18 FNE-69 FNE-70 FNE-71
Layer B1aB1b B1a, upper B1b
B1a
2571Journal of Petroleum Exploration and Production Technology (2020) 10:2559–2573
1 3
270 °C, with 5–7 MPa injection pressure, steam injec-tion quality of more than 0.6 and steam injection rate of 1.6 m3/day/ha/m, and the final recovery ratio will reach 32.3%.
• The optimum production rate for producers is 20 bbl/day m and for injectors’ injection index is 7 m3/day m).
• From simple economic analysis, the IRR for the recom-mended case is 32.47%, NPV is 212.46 MM$, and in the break-even point, the oil price is 34.78$/bbl.
• It is highly recommended for this area to convert from CSS to steam flooding producing in 2020 in order to pro-duce high recovery factor, and it is necessary to consider shale barrier when adding new perforation.
• It is strongly recommended to conduct detail economic evaluation for this area for field implementation.
Fig. 15 Recovery factor curve of each case
Table 16 Liquid rate of producers in recommended case
Well FNE-2 FNE-5 FNE-12 FNE-16 FNE-17 FNE-18 FNE-23 FNE-56 FNE-69Interval 523–548 503–528 518.5–529 523–562 515.5–549 536-553 521–555 538–568 518.5–537Layer B1aB1b B1a B1a B1aB1b B1aB1b B1a B1aB1b B1aB1b B1aRate, bbl/day 364 284 247 412 412 298 332 290 454Well FNE-70 FNE-71 FNE-73 W7-1 W7-2 W7-3 W7-4 W7-5 W7-6Interval 536–537 539–549 531–547 504–546 514–558 518–562 508.5–550.5 534–559 522.5-553Layer B1a B1a B1a B1aB1b B1aB1b B1aB1b B1aB1b B1a B1aB1bRate, bbl/day 280 200 242 315 315 315 315 252 283
Table 17 Injection rate of injectors in recommended case
Well FNE-64 FNE-66 FNE-86 FNE-87Interval 514–553 524–566 534.5–560 524–555Layer B1aB1b B1aB1b B1aB1b B1aB1bRate, m3/day 87 98 148 143
Table 18 Forecast result of DNC and recommended case
Case Cum. liquid (MMB)
Cum. oil (MMB)
Cum. injection (MMm3)
Water cut (%)
Production–injection ratio
RF (Bentiu) (%)
DNC 12.5 5.12 0.37 81.1 4.2 17.0Recom-
mended case
36.8 9.69 2.90 89.0 2.0 32.3
2572 Journal of Petroleum Exploration and Production Technology (2020) 10:2559–2573
1 3
Table 19 Recommended case development indicator prediction
Date Oil well Inj. well Pro. daily/effect well Pro. daily/all well Pro. yearly OSR Cum RF
Oil Liquid steam Oil Liquid steam Oil Liquid steam Oil Water Liquid steam
Year STB STB MMSTB % MMSTB %
2010 5 152 160 25 762 799 75 0.01 0.26 0.03 0.2 0.24 0.02 0.26 0.03 0.82011 5 163 174 10 817 872 30 0.31 0.34 0.01 28.5 0.55 0.03 0.60 0.04 1.82012 5 151 163 10 754 815 29 0.21 0.23 0.01 19.2 0.75 0.02 0.83 0.05 2.52013 5 128 151 33 640 753 100 0.21 0.24 0.04 5.7 0.96 0.03 1.07 0.09 3.22014 9 154 238 38 1384 2146 265 0.19 0.24 0.10 2.0 1.16 0.05 1.31 0.18 3.92015 16 74 129 15 1179 2061 205 0.48 0.75 0.07 6.4 1.63 0.28 2.06 0.26 5.52016 16 55 109 30 880 1752 423 0.38 0.67 0.15 2.5 2.02 0.29 2.73 0.41 6.72017 16 44 99 7 703 1578 103 0.36 0.71 0.04 9.4 2.37 0.35 3.44 0.45 7.92018 16 46 107 29 744 1711 401 0.25 0.54 0.15 1.7 2.61 0.29 3.94 0.60 8.62019 16 33 81 32 528 1289 442 0.23 0.53 0.16 1.4 2.82 0.30 4.41 0.76 9.32020 18 4 130 295 750 2336 5303 3000 1.00 1.93 1.09 0.9 3.84 0.93 6.36 1.85 12.72021 18 4 101 300 750 1823 5407 3000 0.76 1.97 1.09 0.7 4.60 1.21 8.32 2.95 15.32022 18 4 84 301 750 1508 5427 3000 0.60 1.98 1.09 0.5 5.20 1.38 10.30 4.04 17.32023 18 4 80 310 750 1443 5585 3000 0.54 2.03 1.09 0.5 5.74 1.47 12.30 5.13 19.12024 18 4 70 310 750 1258 5585 3000 0.50 2.04 1.09 0.5 6.24 1.55 14.35 6.23 20.82025 18 4 64 310 750 1157 5585 3000 0.44 2.04 1.09 0.4 6.68 1.60 16.39 7.32 22.22026 18 4 58 310 750 1036 5585 3000 0.40 2.04 1.09 0.4 7.09 1.64 18.43 8.41 23.62027 18 4 54 310 750 968 5585 3000 0.36 2.04 1.09 0.3 7.46 1.68 20.48 9.51 24.82028 18 4 52 310 750 931 5585 3000 0.34 2.04 1.09 0.3 7.80 1.70 22.52 10.60 26.02029 18 4 48 310 750 863 5585 3000 0.32 2.04 1.09 0.3 8.12 1.72 24.57 11.69 27.02030 18 4 45 310 750 810 5585 3000 0.30 2.04 1.09 0.3 8.42 1.74 26.61 12.79 28.02031 18 4 41 310 750 735 5585 3000 0.28 2.04 1.09 0.3 8.71 1.76 28.65 13.88 29.02032 18 4 40 310 750 714 5585 3000 0.27 2.04 1.09 0.2 8.97 1.78 30.70 14.98 29.92033 18 4 36 310 750 654 5585 3000 0.25 2.04 1.09 0.2 9.22 1.79 32.75 16.07 30.72034 18 4 35 310 750 630 5585 3000 0.24 2.04 1.09 0.2 9.46 1.81 34.79 17.16 31.52035 18 4 34 310 750 607 5585 3000 0.23 2.04 1.09 0.2 9.68 1.81 36.83 18.25 32.3
Fig. 16 Oil rate, water cut and recovery factor curve of recommended case
2573Journal of Petroleum Exploration and Production Technology (2020) 10:2559–2573
1 3
Acknowledgements The authors would like to thank Oil Exploration and Production Authority (OEPA), Ministry of Petroleum and Min-ing (MOPM) and Petro-energy E&P Co. Ltd., for the permission to publish this paper.
References
Ahem T (2018) Reservoir engineering handbook, 5th edn. Gulf Profes-sional Publishing, Cambridge, pp 209–210
Elbaloula HA (2017) Sudan University of Science and Technology, Petro-Energy-E&P; Dr. Tagwa A. Musa Sudan University of Sci-ence and Technology. Full Field Implementation of Cyclic Steam Stimulation to Enhanced Oil Recovery for a Sudanese Oil Field”
International Conference on Industrial Engineering and Opera-tions Management, Rabat, Morocco, April 11–13, 2017
Elbaloula H, Pengxiang H, Elammas T, Alwad F (2016) Petro-energy E&P Co.Ltd, Mustafa A. Abdelmutalib, Mosab Fathelrahman, Sudanese Petroleum Corporation, Tagwa Ahmed Musa (Sudan University of Science and Technology) SPE Kingdom of Saudi Arabia Annual Technical Symposium and Exhibition “Design-ing and Implementation of the First Steam Flooding Pilot Test in Sudanese Oil Field and Africa”. Society of Petroleum Engi-neering (SPE) April 25, 2016. Dammam -KSA, http://dx.doi.org/10.2118/18279 0-MS
Jiu-quan A, Li J, Jiang H (2006) Steam-flood trial and research on mid-deep heavy oil reservoir QI40 block in Liaohe oilfield. Society of Petroleum Engineers. https ://doi.org/10.2118/10440 3-ms
Jones J, McWilliams M, Sturm D (1995) Kern river revisited: life after steam flood. Society of Petroleum Engineers. SPE Western Regional Meeting, 8–10 March, Bakersfield, California https ://doi.org/10.2118/29664 -ms
Pearce JC, Megginson EA (1991) Current status of the Duri Steam-flood Project Sumatra, Indonesia. Society of Petroleum Engineers, SPE International Thermal Operations Symposium, 7–8 February, Bakersfield, California. https ://doi.org/10.2118/21527 -ms
Prats M (1982) Thermal recovery, No. 7. Richardson, Texas: Mono-graph Series, SPE, USA
Taber JJ et al (1997) EOR screening criteria revisited—part 1: intro-duction to screening criteria and enhanced recovery field projects. SPE Reserv Eng J 12:189–198
Publisher’s Note Springer Nature remains neutral with regard to jurisdictional claims in published maps and institutional affiliations.
Table 20 The net cash flow for the contractor (50$/bbl)
Time 2016 2017 2018 2019 2020 2021 2022 2023 2024 2025 2026 2027State net cash flow (US$ MM) − 27.68 − 35.8 − 24.6 − 45.3 47.66 74.46 74.88 57.29 37.95 34.56 33.59 32.21Time 2028 2029 2030 2031 2032 2033 2034 2035State net cash flow (US$ MM) 31.09 29.75 28.5 27.6 28.28 27.69 26.97 27.59NPV (10%) 132.85 MM$NPV (13%) 88.52 MM$NPV (15%) 66.32 MM$IRR 26.45Recovery time (years) 6.15
Fig. 17 IRR sensitivity analysis (50$/bbl)