Embed Size (px)
Citation preview
1
Feasibility study on magnetic enhanced flocculation for mitigating
membrane fouling
Jie Wanga, b, *, , Jun Yangb, Hongwei Zhanga, Wenshan Guoc, Huu-Hao Ngoc
a State Key Laboratory of Hollow Fiber Membrane Materials and Processes, Tianjin Polytechnic University,
Tianjin 300387, China
b School of Environmental and Chemical Engineering, Tianjin Polytechnic University, Tianjin 300387, China
c Centre for Technology in Water and Wastewater, School of Civil and Environmental Engineering, University
of Technology Sydney, NSW 2007, Australia
* Corresponding author at: State Key Laboratory of Hollow Fiber Membrane Materials and Processes & School
of Environmental and Chemical Engineering, Tianjin Polytechnic University, Tianjin 300387, China.
Tel.: +86 22 8395 5673.
E-mail address: [email protected] (J. Wang)
Abstract
During coagulation/flocculation-membrane filtration (CF-MF) process, membrane fouling
was alleviated more significantly through magnetic enhanced flocculation-membrane
filtration (MEF-MF) in the presence of ferromagnetic seeds in coagulants. Porous cake layer
with flocs of large size was able to alleviate decline rate of membrane flux. Foulant analysis
proved that magnetic enhanced flocculation (MEF) pretreatment was more efficient for the
reductions of low and mid-molecular weight (MW) organic structures than CF-MF.
Biopolymers with high molecular weight were also effectively removed before filtration.
Overall, MEF-MF could provide a novel alternative approach to mitigate membrane fouling
for surface water treatment.
Keywords: drinking water treatment; membrane filtration; magnetic enhance flocculation;
membrane fouling
Abbreviations: MEF-MF, magnetic enhanced flocculation membrane filtration; CF-
MF,coagulation/flocculation membrane filtration; MEF, magnetic enhanced flocculation;
2
TMP, transmembrane pressure; DOM, dissolved organic matter; COD, chemical oxygen
demand; SS, suspended solid; BSA, bovine serum albumin; DOC, dissolved organic
carbon; ZP, zeta potential; PVDF, polyvinylidene fluoride; FC, ferric chloride;
EEM, fluorescence excitation emission matrix; GPC, gel permeation chromatography;
MWD, molecular weight distribution; FTIR, Fourier transform infrared spectroscopy; Df,
fractal dimension
Introduction
Membrane fouling is the major constraint in the implementation of membrane processes for
drinking water treatment [1], as fouling increases operational costs, reduces permeate
production and/or increases transmembrane pressure (TMP) [2] and [3]. Researches showed
that pretreatment of surface water was very important to alleviate membrane
fouling [4] and [5]. Although there were evidences in the literature to demonstrate that
conventional flocculation could remove colloidal and dissolved organic matter (DOM) during
microfiltration [6] and [7], significant membrane fouling was still observed according to
seasonal conditions with pre-flocculation [8].
Enhanced flocculation pretreatment is one of the efficient techniques for mitigating
membrane fouling [7]. It was found that non-reactive chemical additives such as zeolite,
chitosan, activated carbon and cationic polymers were applied in pretreatment to reduce the
concentrations of foulants in raw water, so as to mitigate membrane fouling [9]. Leo et
al. [10] reported that embedded zeolite reduced the fouling by humic acid initiated pore
blocking. About 80% permeate flux of membrane was maintained during the filtration of
humic acid solution. Lee et al. [11] observed that coagulation using chitosan could remove
chlorella vulgaris effectively, which was helpful for membrane fouling reduction. Moreover,
pretreatment by coagulation with powdered activated carbon before membrane filtration
could form larger and more porous flocs than those formed during conventional
coagulation [12]. Overall, the effect on membrane fouling mitigation was achieved by the
adsorption of non-reactive chemical additives.
Ferromagnetic seeds enhanced flocculation can rapidly separate compounds from mixtures
with high efficiency and minimal initial investment by the magnetic characteristic. The
application of magnetic seeding flocculation enhances the collision efficiency and collision
frequency of colloidal particles, as well as makes colloidal particles to aggregate into larger
3
flocs due to the decrease of colloidal stability [13]. Thus, the magnetic enhanced flocculation
was been applied in wastewater treatment to remove foulants [13], [14], [15], [16] and [17].
It was found that MEF was efficient to remove COD (94%) and SS (71%) in treating mine
water with high turbidity [18]. Liu et al. [19] reported that magnetic-coagulation separation
could rapidly and effectively remove algae, chlorophyll-a and other foulants from freshwater.
Semblante also applied porous micro-sized magnetite to achieve a maximum adsorption of
5.18 mg/g bovine serum albumin (BSA) and successfully inhibited the protein-induced
fouling of a commercial polyvinylidene fluoride (PVDF) membrane [20]. In addition,
magnetic nanoparticles in inorganic coagulants and their coagulation performances were
studied by Zhang [21]. The performance of magnetic poly-aluminum chloride of basicity 2.0
(MPACl2.0) was better than that of PAC on turbidity and DOC removals. Moreover, large,
loose and weak flocs were produced by MPACl2.0, which were preferable to recycle
magnetic nanoparticles.
To remove COD, SS, and turbidity, which are main constituents of membrane foulants, MEF
process was first designed and applied to mitigate membrane fouling in the ultrafiltration for
drinking water treatment. In the study, the performance of PVDF hollow fiber membrane
with the addition of magnetic enhanced flocculation was examined for treating surface water.
The mechanisms of MEF on mitigating membrane were investigated from the perspective of
microcosmic morphology. Furthermore, the characteristics and formation of flocs were
investigated to analysis the performance of cake layer and membrane fouling mitigation.
Materials and methods
Characteristics of natural surface water
The raw water was collected from Luan River in Tianjin, China. The characteristics of the
surface water are presented in Table 1.
4
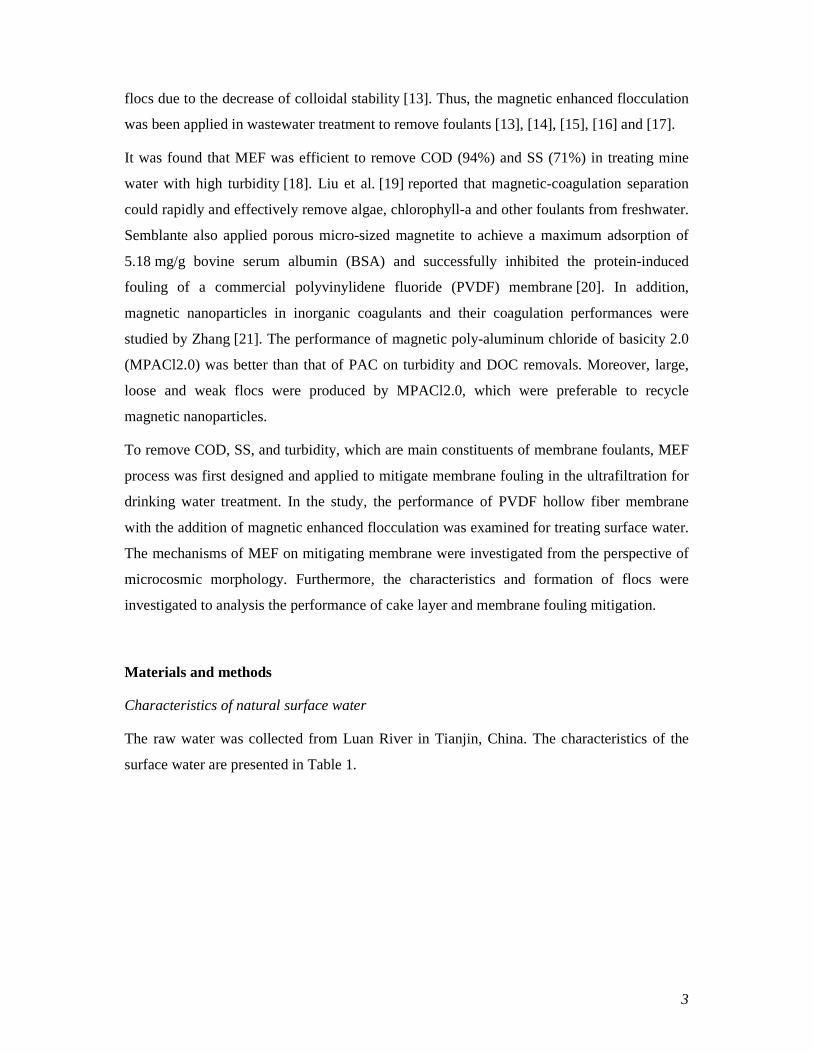
Table 1. The characteristics of natural surface water.
Parameter Unit Value pH – 7.25 ± 0.53 UV254 (abs) cm−1 0.074 ± 0.008 TOC mg/L 8.05 ± 1.78 DOC mg/L 6.65 ± 0.38 TSS mg/L 3.85 ± 0.45 Zeta potential mV −30.5 ± 0.97 Turbidity NTU 3.64 ± 0.44 Temperature °C 18 ± 3 Fe3+ mg/L 0.57 ± 0.05
Experimental apparatus and preparation
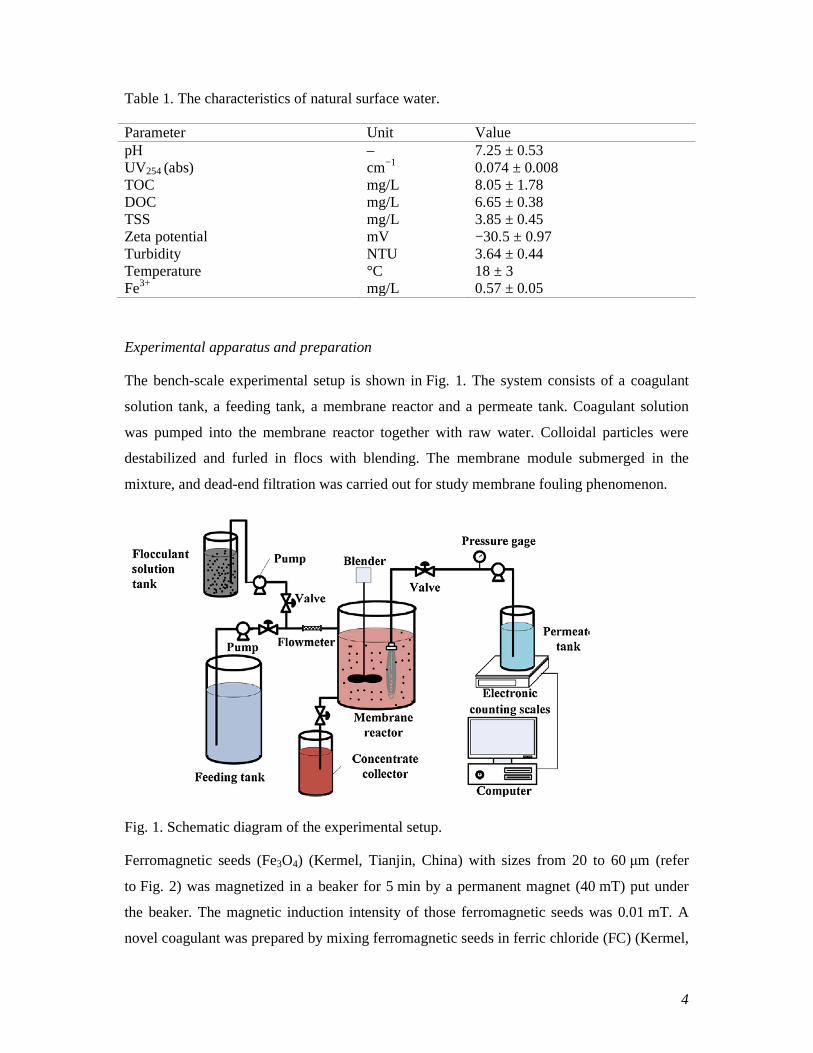
The bench-scale experimental setup is shown in Fig. 1. The system consists of a coagulant
solution tank, a feeding tank, a membrane reactor and a permeate tank. Coagulant solution
was pumped into the membrane reactor together with raw water. Colloidal particles were
destabilized and furled in flocs with blending. The membrane module submerged in the
mixture, and dead-end filtration was carried out for study membrane fouling phenomenon.
Fig. 1. Schematic diagram of the experimental setup.
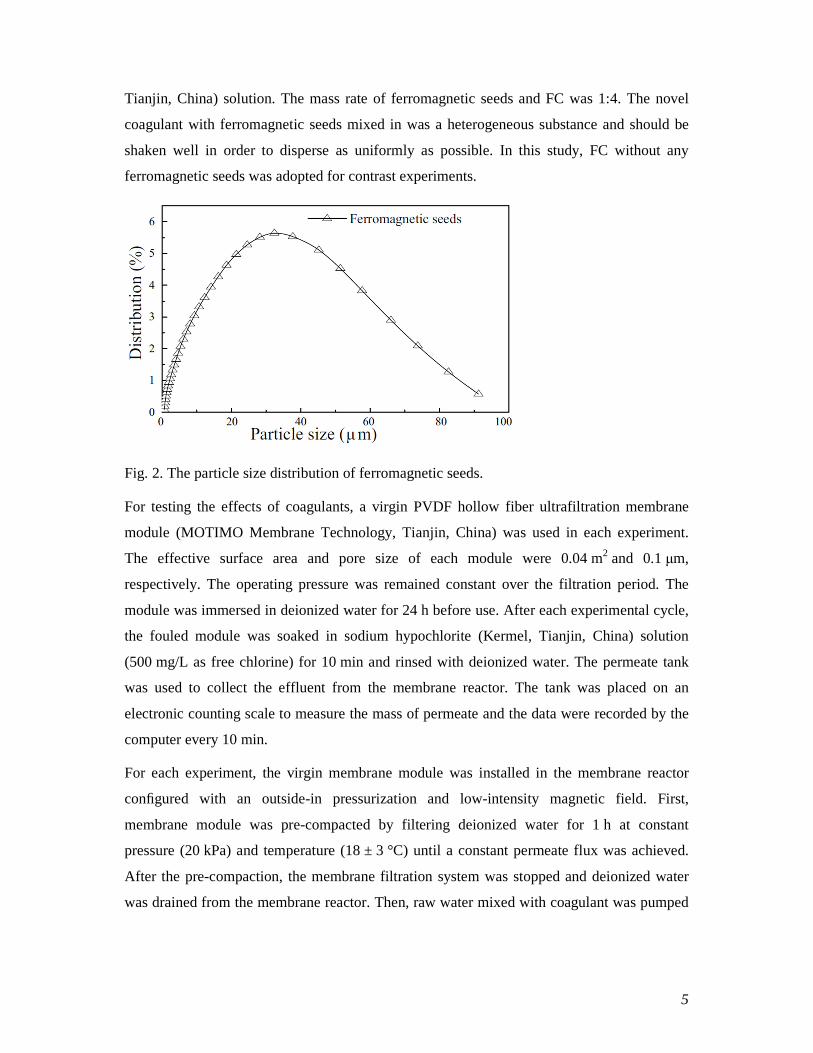
Ferromagnetic seeds (Fe3O4) (Kermel, Tianjin, China) with sizes from 20 to 60 µm (refer
to Fig. 2) was magnetized in a beaker for 5 min by a permanent magnet (40 mT) put under
the beaker. The magnetic induction intensity of those ferromagnetic seeds was 0.01 mT. A
novel coagulant was prepared by mixing ferromagnetic seeds in ferric chloride (FC) (Kermel,
5
Tianjin, China) solution. The mass rate of ferromagnetic seeds and FC was 1:4. The novel
coagulant with ferromagnetic seeds mixed in was a heterogeneous substance and should be
shaken well in order to disperse as uniformly as possible. In this study, FC without any
ferromagnetic seeds was adopted for contrast experiments.
Fig. 2. The particle size distribution of ferromagnetic seeds.
For testing the effects of coagulants, a virgin PVDF hollow fiber ultrafiltration membrane
module (MOTIMO Membrane Technology, Tianjin, China) was used in each experiment.
The effective surface area and pore size of each module were 0.04 m2 and 0.1 µm,
respectively. The operating pressure was remained constant over the filtration period. The
module was immersed in deionized water for 24 h before use. After each experimental cycle,
the fouled module was soaked in sodium hypochlorite (Kermel, Tianjin, China) solution
(500 mg/L as free chlorine) for 10 min and rinsed with deionized water. The permeate tank
was used to collect the effluent from the membrane reactor. The tank was placed on an
electronic counting scale to measure the mass of permeate and the data were recorded by the
computer every 10 min.
For each experiment, the virgin membrane module was installed in the membrane reactor
configured with an outside-in pressurization and low-intensity magnetic field. First,
membrane module was pre-compacted by filtering deionized water for 1 h at constant
pressure (20 kPa) and temperature (18 ± 3 °C) until a constant permeate flux was achieved.
After the pre-compaction, the membrane filtration system was stopped and deionized water
was drained from the membrane reactor. Then, raw water mixed with coagulant was pumped
6
into the membrane reactor continuously. After that, the membrane system was restarted and
operated for 6 h under the same operating conditions as those in the pre-compaction run.
Analysis of iron ion concentrations
The concentrations of iron ion in the two coagulants and permeates were investigated. The
concentrations of iron ion for each coagulants solution and permeate are listed inTable 2. The
results showed that values obtained in the experiment were well consistent with those of dosage.
The addition of ferromagnetic seeds didn’t increase the concentration of iron ion for both of
coagulants. Thus, the ferromagnetic seeds were quite stable in coagulants solution and flocculation
solution.
Table 2. The concentration of Fe3+ (mg/L) in surface water, coagulant solution (20 mg/L) and
permeate.
Coagulant Unit Coagulant solution
Permeate Surface water Measured
values Theoretical
values Ferromagnetic
seeding mixed FC mg/L 5.54 ± 0.073 5.51 0.15 ± 0.042
0.57 ± 0.059 FC mg/L 6.91 ± 0.068 6.89 0.2 ± 0.048
Analytical methods
Dissolved organic carbon of water samples, turbidity, UV254 absorbance, concentration of
iron ion (Fe3+) and the magnetic field intensity were measured using a combustion-type
organic carbon analyzer (TOC-Vcph analyzer, Shimadzu, Kyoto, Japan), a turbidimeter
(2100N, Hach, Colorado, USA), an ultraviolet spectrophotometer (T6, PERSEE, Beijing,
China), inductive coupled plasma emission spectrometer (ICP) (715-ES, Varian, California,
USA), and teslameter (HT20, Shanghai, China), respectively.
Molecular weight distribution of dissolved organic matter in water samples was determined
by liquid chromatography (Waters 2695, Waters, Massachusetts, USA) with differential
refractive index detectors (Waters 2414, Waters, Massachusetts, USA). The detectors had
three size exclusion chromatography columns in order to separate organic molecules
according to their molecular size. The columns used were Ultrahydrogel™500,200,120
arranged in series (TSK-GEL, Waters, Massachusetts, USA) and were able to detect a wider
range in molecular weight (150–400 thousand Da). The column temperature, detector
temperature and the mobile phase, water flow rate were kept at 55 °C, 50 °C and 0.6 mL/min,
7
respectively. Sodium polystyrene sulfonates and polyethylene glycols were used as molecular
weight calibration standards.
The particle size of ferromagnetic seeds and floc size were measured by laser particle analyzer
(Mastersize2000, Malvern, Worcestershire, UK). The surface morphological features of the
virgin and fouled membranes were investigated using a scanning electron microscope (SEM)
(S-4800, Hitachi, Tokyo, Japan).The functional groups of foulants were analyzed by Fourier
transform infrared spectroscopy (FTIR) (NICOLET6700, Thermo Fisher, Massachusetts,
USA).
The fluorescence excitation emission matrix (EEM) spectroscopy of raw water and permeates
of MEF-MF and CF-MF were detected by fluorescence spectrophotometer (F-7000, Hitachi,
Tokyo, Japan). Prior to analysis, samples were filtered through a microfiltration membrane
(0.45 µm) for removing all the insoluble organic particles.
Zeta potential of solution and diameter of colloid particle were determined by a Malvern
Instruments (Zetasizer Nano, Malvern, Worcestershire, UK). Surface ZP (zeta potential) was
characterized by streaming potential [22] and [23]. The streaming potential across the
membrane was measured with a pair of commercial Ag/AgCl reference electrodes placed on
the permeate sides and retentate sides close to the membrane module under the pressure
gradients from 10 to 70 kPa. The measurement was performed with a KCl electrolyte at
1 × 10⁻³ mol/L at the pH of 7.2. Before the measurements of zetal potential, the electrostatic
charges were stabilized for 1 h by flowing the KCl electrolyte solution through the
membrane. The potential difference between the electrodes was measured and displayed on
an oscilloscope (54641A, Agilent, California, USA). The surface zeta potential was then
calculated by the Helmoltz–Smoluchowski principle.
Modeling development
In order to characterize membrane fouling, a simple membrane fouling index normalized flux
(FN) was used, which is generally defined as follows:
(1)
where JS0 in Eq. (1) is the constant permeate flux (L/(m2 h)) obtained from filtering deionized
water; JS is gained flux by filtering the raw water after flocculation pretreatment. The
normalized flux curve can reflect the tendency of membrane fouling with time.
8
Fractal dimension was applied to character flocs properties [24] and [25], which can be
calculated using the following equation:
A=αLD f (2)
where A is the projection area of floc (m2); L is maximum length of projection (m); α is
proportionality constant, Df is the fractal dimension of flocs in 2D space. The bigger fractal
dimension of flocs the better effect of flocculation performs.
Results and discussions
Membrane filtration performance
Membrane permeate flux decline
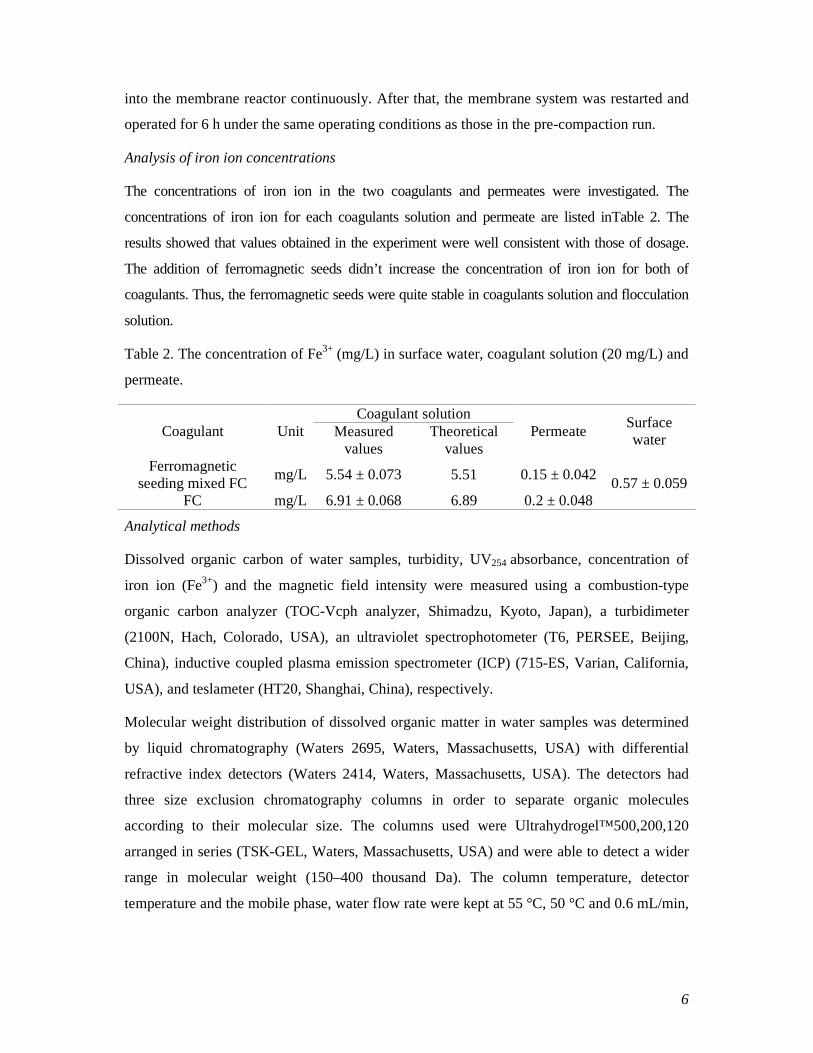
The flux decline curves for CF-MF and MEF-MF processes over the entire filtration period are
shown in Fig. 3. Both of the processes were operated for 6 h at 0.02 MPa with the coagulants of
FC and ferromagnetic seeds mixed FC at 20 mg/L, respectively. The filtration curves of raw
water and ferromagnetic seeds were also plotted to provide good baselines on flux
performance.
Fig. 3. Normalized flux variation through time with different coagulants. The raw water was
pretreated by (a) MEF, (b) flocculation, (c) ferromagnetic seeds and (d) nothing, respectively.
In each pretreatment the dosage of coagulant was 20 mg/L.
As can be seen from Fig. 3, the membrane flux in the process of raw water direct
ultrafiltration without any pretreatment presented a gradual decline rate after a dramatic
decline in the initial filtration stage. The similar phenomenon of membranes flux decline rate
also appeared in the ferromagnetic seeds pretreatment process. Whereas, the flux decline of
the MEF pretreatment was relatively moderate over the filtration time. The fluxes of the raw

9
water and ferromagnetic seeds decreased about 85% and 80% after 360 min filtration,
respectively. However, the flux declined less than 50% when the ferromagnetic seeds were
mixed together with coagulant. It was apparent that ferromagnetic seeds could not sustain the
flux effectively without combining with coagulant. Therefore, FC mixed with ferromagnetic
seeds as coagulant was more effective on mitigating fouling than using FC alone.
10
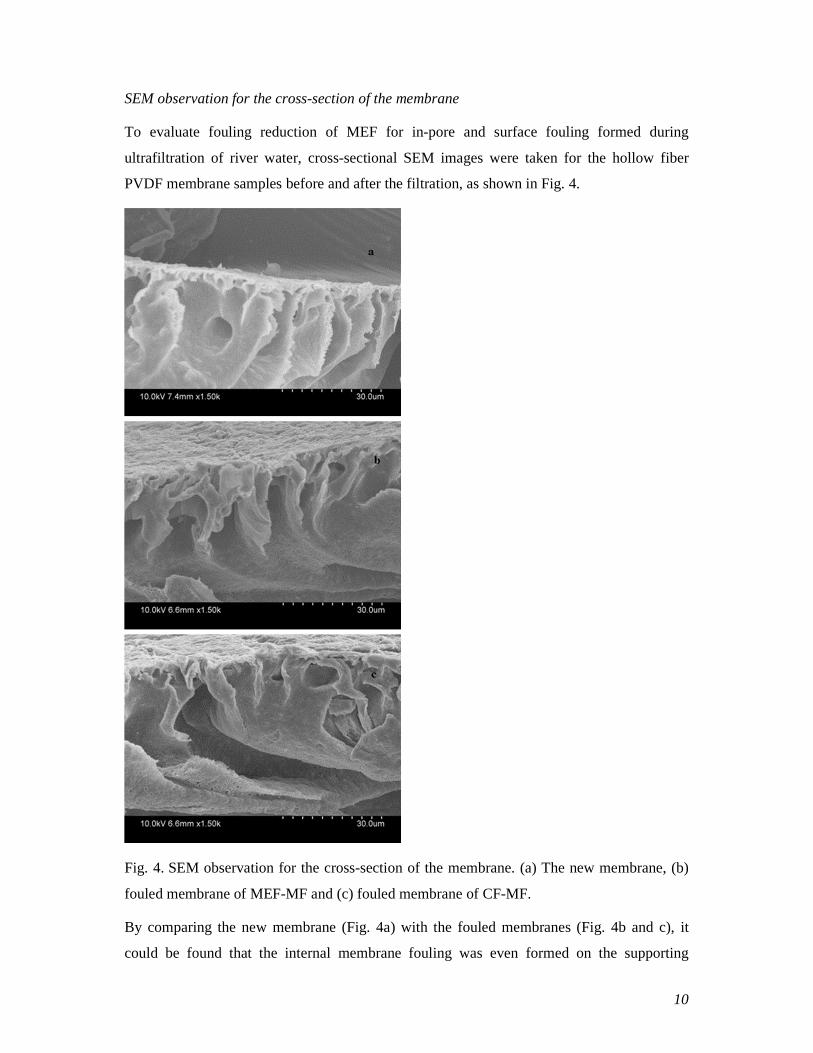
SEM observation for the cross-section of the membrane
To evaluate fouling reduction of MEF for in-pore and surface fouling formed during
ultrafiltration of river water, cross-sectional SEM images were taken for the hollow fiber
PVDF membrane samples before and after the filtration, as shown in Fig. 4.
Fig. 4. SEM observation for the cross-section of the membrane. (a) The new membrane, (b)
fouled membrane of MEF-MF and (c) fouled membrane of CF-MF.
By comparing the new membrane (Fig. 4a) with the fouled membranes (Fig. 4b and c), it
could be found that the internal membrane fouling was even formed on the supporting
11
material under the active filtration layers of the membranes. The channels on the supporting
layer became narrow and obscured near the membrane surface. Compared with fouled
membrane of CF-MF, it can be seen clearly that the portion of the internal foulants deposited
on the fouled membrane of MEF-MF was slighter. The cake layer on membrane surface of
MEF-MF was also thinner than that of CF-MF. The results of microscopic observation
demonstrated that the internal fouling induced by deposition or blockage in membrane pores
of CF-MF was much more serious than that of MEF-MF, which compared favorably with the
results of the membrane flux decline.
MEF for mitigating membrane fouling
As shown in Fig. 3 and Fig. 4, the MEF pretreatment could mitigate membrane fouling more
effectively than flocculation pretreatment. When comparing virgin membrane and two fouled
membrane that ran in CF-MF and MEF-MF, the mechanisms of membrane fouling mitigation
were explained based on microcosmic morphology.
Floc characterization
The ordinary explanation for membrane fouling mitigation is the increase in particle size as a
result of the flocculation process [26], which prevents internal fouling and produces a cake
layer with lower hydraulic resistance. Some studies reported that formation of loose, porous
flocs and reduction of small colloidal particles in longer flocculation time led to higher flux.
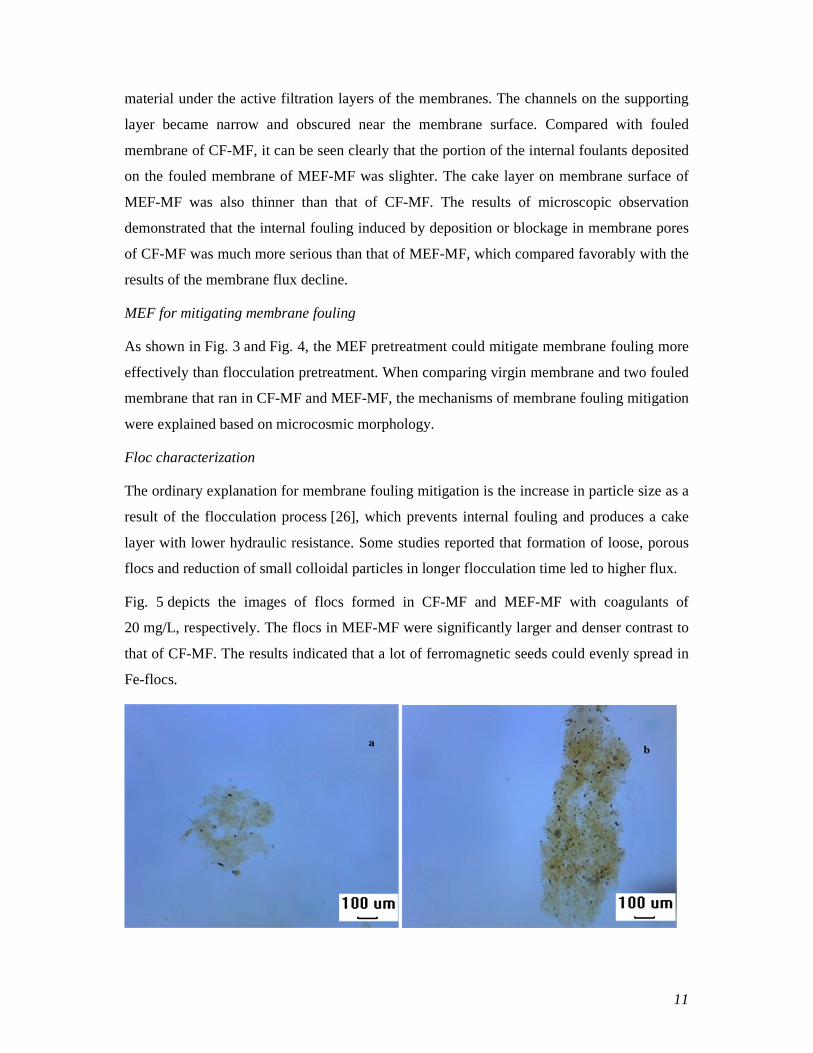
Fig. 5 depicts the images of flocs formed in CF-MF and MEF-MF with coagulants of
20 mg/L, respectively. The flocs in MEF-MF were significantly larger and denser contrast to
that of CF-MF. The results indicated that a lot of ferromagnetic seeds could evenly spread in
Fe-flocs.
12
Fig. 5. Images of flocs in different pretreatments process: (a) coagulation/flocculation, (b)
MEF. The dosage of coagulant in each pretreatments process was 20 mg/L.
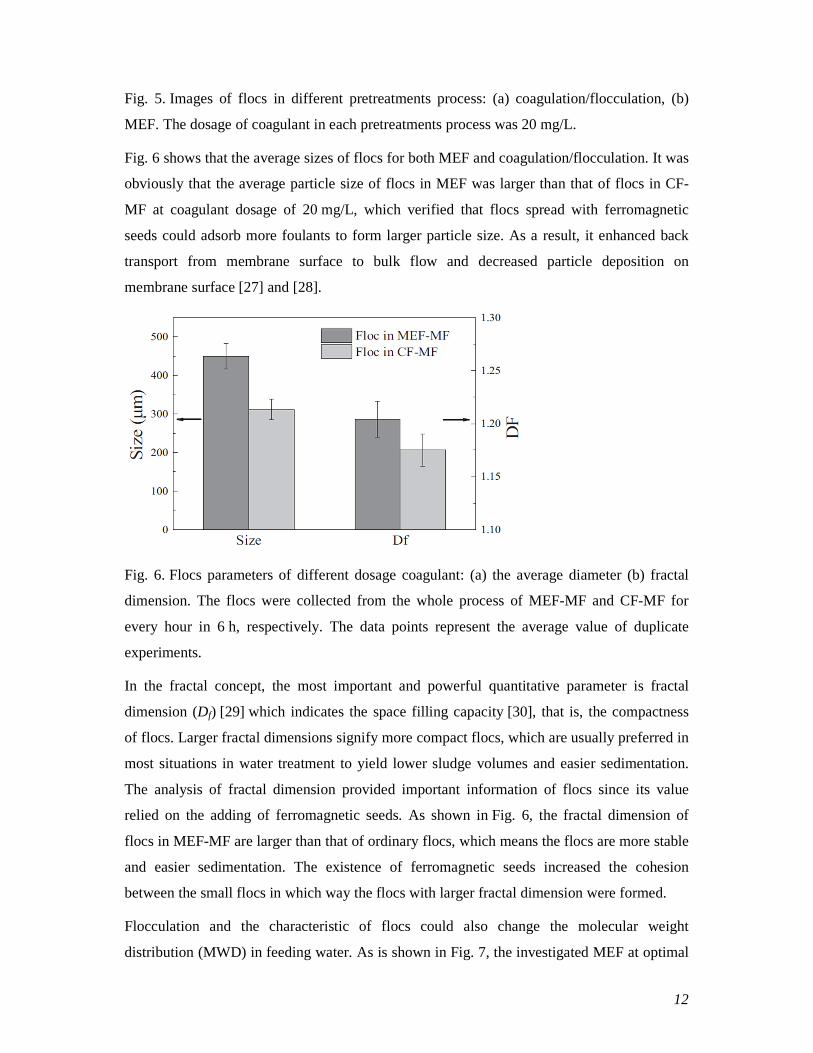
Fig. 6 shows that the average sizes of flocs for both MEF and coagulation/flocculation. It was
obviously that the average particle size of flocs in MEF was larger than that of flocs in CF-
MF at coagulant dosage of 20 mg/L, which verified that flocs spread with ferromagnetic
seeds could adsorb more foulants to form larger particle size. As a result, it enhanced back
transport from membrane surface to bulk flow and decreased particle deposition on
membrane surface [27] and [28].
Fig. 6. Flocs parameters of different dosage coagulant: (a) the average diameter (b) fractal
dimension. The flocs were collected from the whole process of MEF-MF and CF-MF for
every hour in 6 h, respectively. The data points represent the average value of duplicate
experiments.
In the fractal concept, the most important and powerful quantitative parameter is fractal
dimension (Df) [29] which indicates the space filling capacity [30], that is, the compactness
of flocs. Larger fractal dimensions signify more compact flocs, which are usually preferred in
most situations in water treatment to yield lower sludge volumes and easier sedimentation.
The analysis of fractal dimension provided important information of flocs since its value
relied on the adding of ferromagnetic seeds. As shown in Fig. 6, the fractal dimension of
flocs in MEF-MF are larger than that of ordinary flocs, which means the flocs are more stable
and easier sedimentation. The existence of ferromagnetic seeds increased the cohesion
between the small flocs in which way the flocs with larger fractal dimension were formed.
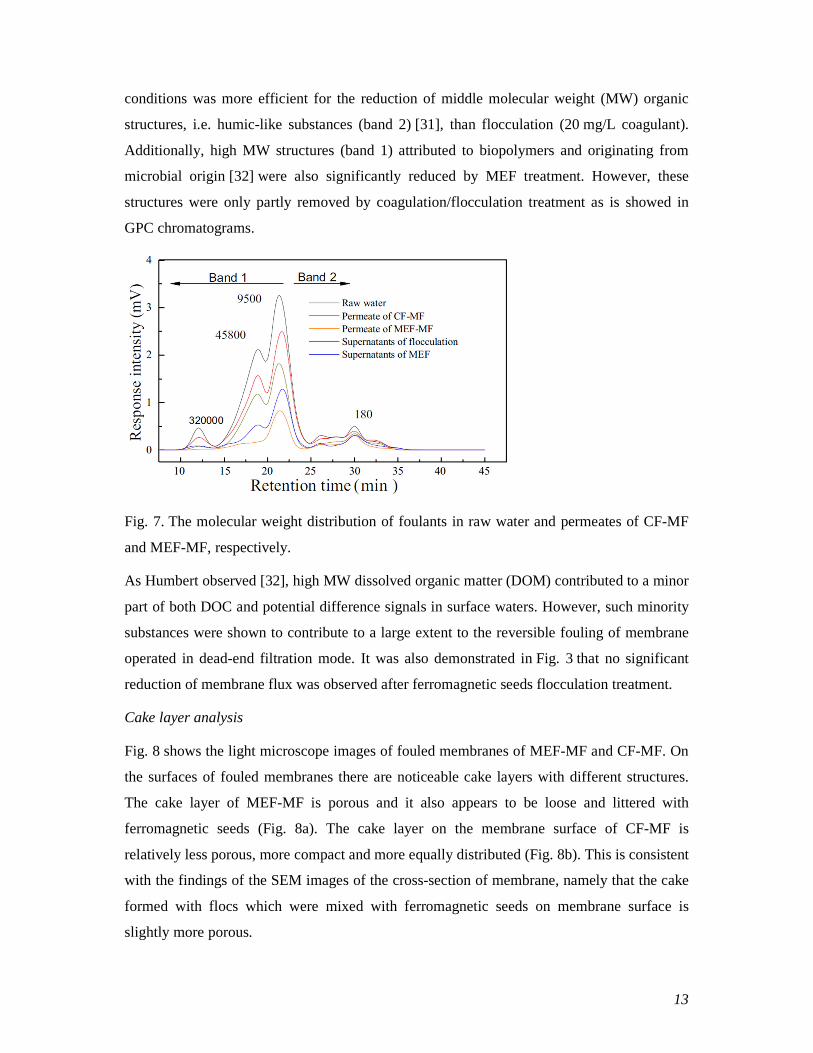
Flocculation and the characteristic of flocs could also change the molecular weight
distribution (MWD) in feeding water. As is shown in Fig. 7, the investigated MEF at optimal
13
conditions was more efficient for the reduction of middle molecular weight (MW) organic
structures, i.e. humic-like substances (band 2) [31], than flocculation (20 mg/L coagulant).
Additionally, high MW structures (band 1) attributed to biopolymers and originating from
microbial origin [32] were also significantly reduced by MEF treatment. However, these
structures were only partly removed by coagulation/flocculation treatment as is showed in
GPC chromatograms.
Fig. 7. The molecular weight distribution of foulants in raw water and permeates of CF-MF
and MEF-MF, respectively.
As Humbert observed [32], high MW dissolved organic matter (DOM) contributed to a minor
part of both DOC and potential difference signals in surface waters. However, such minority
substances were shown to contribute to a large extent to the reversible fouling of membrane
operated in dead-end filtration mode. It was also demonstrated in Fig. 3 that no significant
reduction of membrane flux was observed after ferromagnetic seeds flocculation treatment.
Cake layer analysis
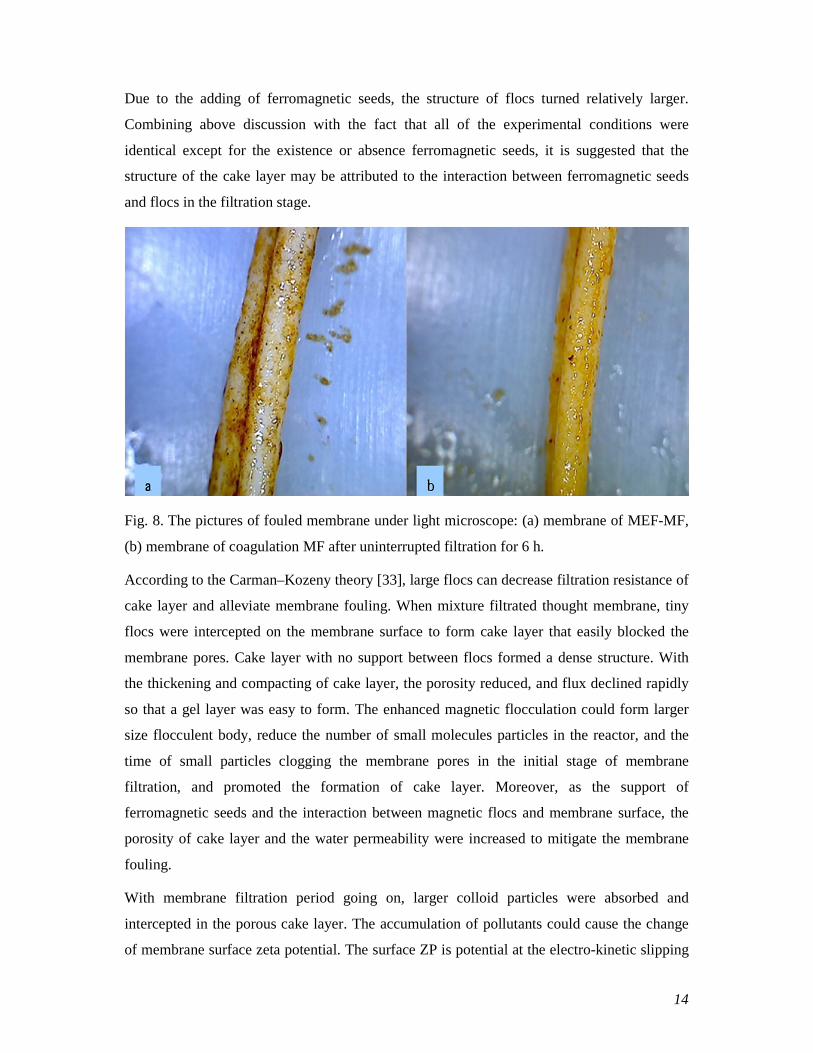
Fig. 8 shows the light microscope images of fouled membranes of MEF-MF and CF-MF. On
the surfaces of fouled membranes there are noticeable cake layers with different structures.
The cake layer of MEF-MF is porous and it also appears to be loose and littered with
ferromagnetic seeds (Fig. 8a). The cake layer on the membrane surface of CF-MF is
relatively less porous, more compact and more equally distributed (Fig. 8b). This is consistent
with the findings of the SEM images of the cross-section of membrane, namely that the cake
formed with flocs which were mixed with ferromagnetic seeds on membrane surface is
slightly more porous.
14
Due to the adding of ferromagnetic seeds, the structure of flocs turned relatively larger.
Combining above discussion with the fact that all of the experimental conditions were
identical except for the existence or absence ferromagnetic seeds, it is suggested that the
structure of the cake layer may be attributed to the interaction between ferromagnetic seeds
and flocs in the filtration stage.
Fig. 8. The pictures of fouled membrane under light microscope: (a) membrane of MEF-MF,
(b) membrane of coagulation MF after uninterrupted filtration for 6 h.
According to the Carman–Kozeny theory [33], large flocs can decrease filtration resistance of
cake layer and alleviate membrane fouling. When mixture filtrated thought membrane, tiny
flocs were intercepted on the membrane surface to form cake layer that easily blocked the
membrane pores. Cake layer with no support between flocs formed a dense structure. With
the thickening and compacting of cake layer, the porosity reduced, and flux declined rapidly
so that a gel layer was easy to form. The enhanced magnetic flocculation could form larger
size flocculent body, reduce the number of small molecules particles in the reactor, and the
time of small particles clogging the membrane pores in the initial stage of membrane
filtration, and promoted the formation of cake layer. Moreover, as the support of
ferromagnetic seeds and the interaction between magnetic flocs and membrane surface, the
porosity of cake layer and the water permeability were increased to mitigate the membrane
fouling.
With membrane filtration period going on, larger colloid particles were absorbed and
intercepted in the porous cake layer. The accumulation of pollutants could cause the change
of membrane surface zeta potential. The surface ZP is potential at the electro-kinetic slipping
15
plane between the membrane surface and solution when relative motion occurs between
them [34] and [35]. It has often been used in membranes to infer the charge of surface and
pores. The surface ZP is an important property that affected membrane fouling.
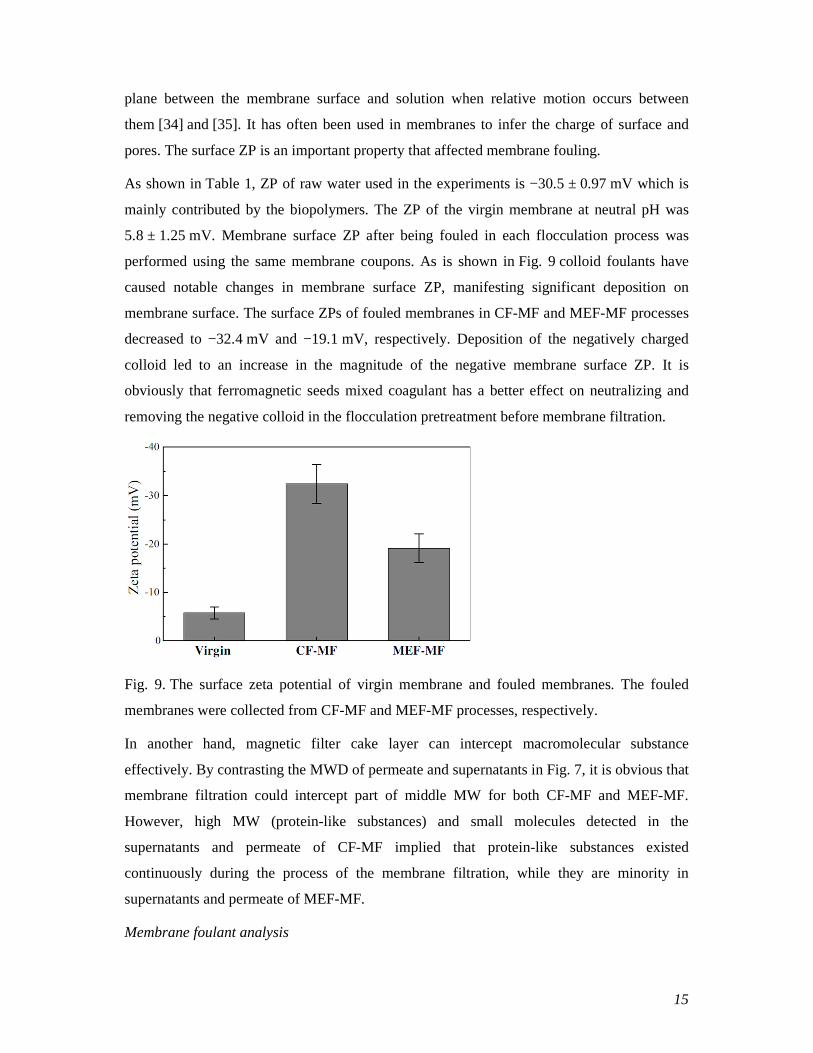
As shown in Table 1, ZP of raw water used in the experiments is −30.5 ± 0.97 mV which is
mainly contributed by the biopolymers. The ZP of the virgin membrane at neutral pH was
5.8 ± 1.25 mV. Membrane surface ZP after being fouled in each flocculation process was
performed using the same membrane coupons. As is shown in Fig. 9 colloid foulants have
caused notable changes in membrane surface ZP, manifesting significant deposition on
membrane surface. The surface ZPs of fouled membranes in CF-MF and MEF-MF processes
decreased to −32.4 mV and −19.1 mV, respectively. Deposition of the negatively charged
colloid led to an increase in the magnitude of the negative membrane surface ZP. It is
obviously that ferromagnetic seeds mixed coagulant has a better effect on neutralizing and
removing the negative colloid in the flocculation pretreatment before membrane filtration.
Fig. 9. The surface zeta potential of virgin membrane and fouled membranes. The fouled
membranes were collected from CF-MF and MEF-MF processes, respectively.
In another hand, magnetic filter cake layer can intercept macromolecular substance
effectively. By contrasting the MWD of permeate and supernatants in Fig. 7, it is obvious that
membrane filtration could intercept part of middle MW for both CF-MF and MEF-MF.
However, high MW (protein-like substances) and small molecules detected in the
supernatants and permeate of CF-MF implied that protein-like substances existed
continuously during the process of the membrane filtration, while they are minority in
supernatants and permeate of MEF-MF.
Membrane foulant analysis
16
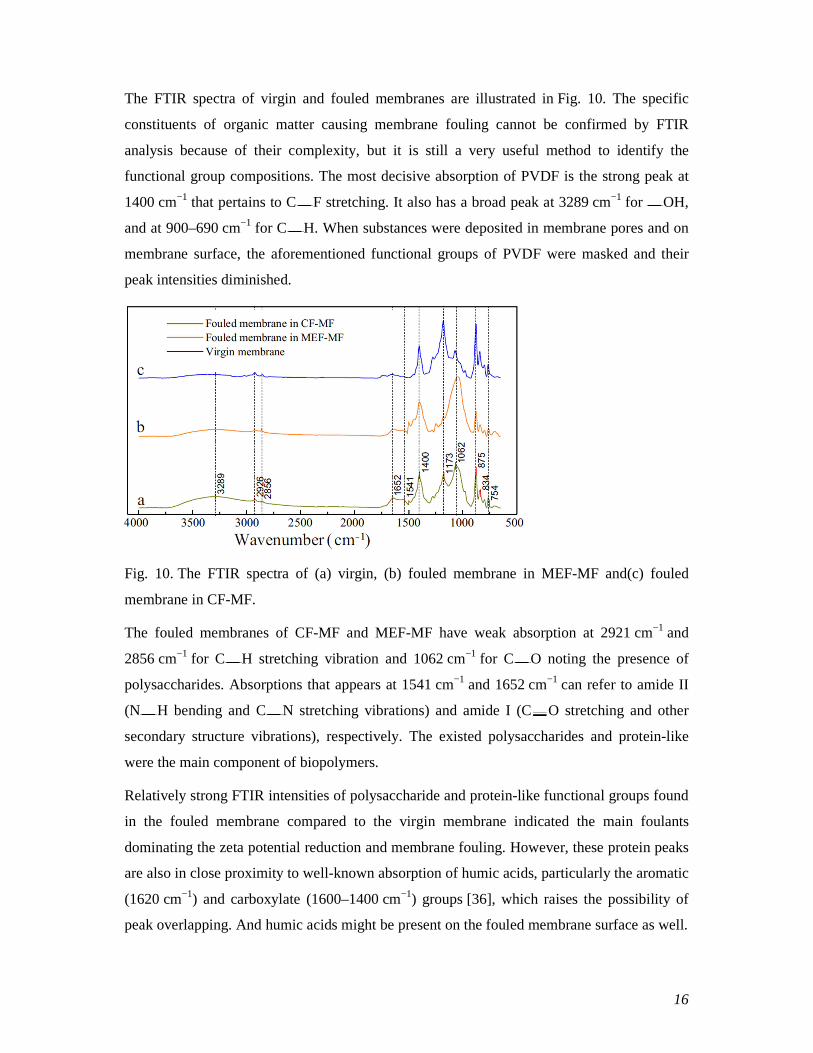
The FTIR spectra of virgin and fouled membranes are illustrated in Fig. 10. The specific
constituents of organic matter causing membrane fouling cannot be confirmed by FTIR
analysis because of their complexity, but it is still a very useful method to identify the
functional group compositions. The most decisive absorption of PVDF is the strong peak at
1400 cm−1 that pertains to C F stretching. It also has a broad peak at 3289 cm−1 for OH,
and at 900–690 cm−1 for C H. When substances were deposited in membrane pores and on
membrane surface, the aforementioned functional groups of PVDF were masked and their
peak intensities diminished.
Fig. 10. The FTIR spectra of (a) virgin, (b) fouled membrane in MEF-MF and(c) fouled
membrane in CF-MF.
The fouled membranes of CF-MF and MEF-MF have weak absorption at 2921 cm−1 and
2856 cm−1 for C H stretching vibration and 1062 cm−1 for C O noting the presence of
polysaccharides. Absorptions that appears at 1541 cm−1 and 1652 cm−1 can refer to amide II
(N H bending and C N stretching vibrations) and amide I (C O stretching and other
secondary structure vibrations), respectively. The existed polysaccharides and protein-like
were the main component of biopolymers.
Relatively strong FTIR intensities of polysaccharide and protein-like functional groups found
in the fouled membrane compared to the virgin membrane indicated the main foulants
dominating the zeta potential reduction and membrane fouling. However, these protein peaks
are also in close proximity to well-known absorption of humic acids, particularly the aromatic
(1620 cm−1) and carboxylate (1600–1400 cm−1) groups [36], which raises the possibility of
peak overlapping. And humic acids might be present on the fouled membrane surface as well.
17
Fluorescence spectroscopy has been widely used to investigate the chemical properties and
source of DOM in natural waters [37], and especially three-dimensional excitation emission
matrix (EEM) fluorescence spectroscopy has been successfully used to probe the chemical
structure of DOM because they can distinguish among different classes of DOM of different
origins [38], [39] and [40]. It has been investigated as a monitoring tool for a range of
application including water quality and pollution monitoring in rivers. In terms of the
subtraction spectrum of fluorescence EEMs between the raw water and permeate, the
removal effect of organic matters can be visually and qualitatively reflected in this study.
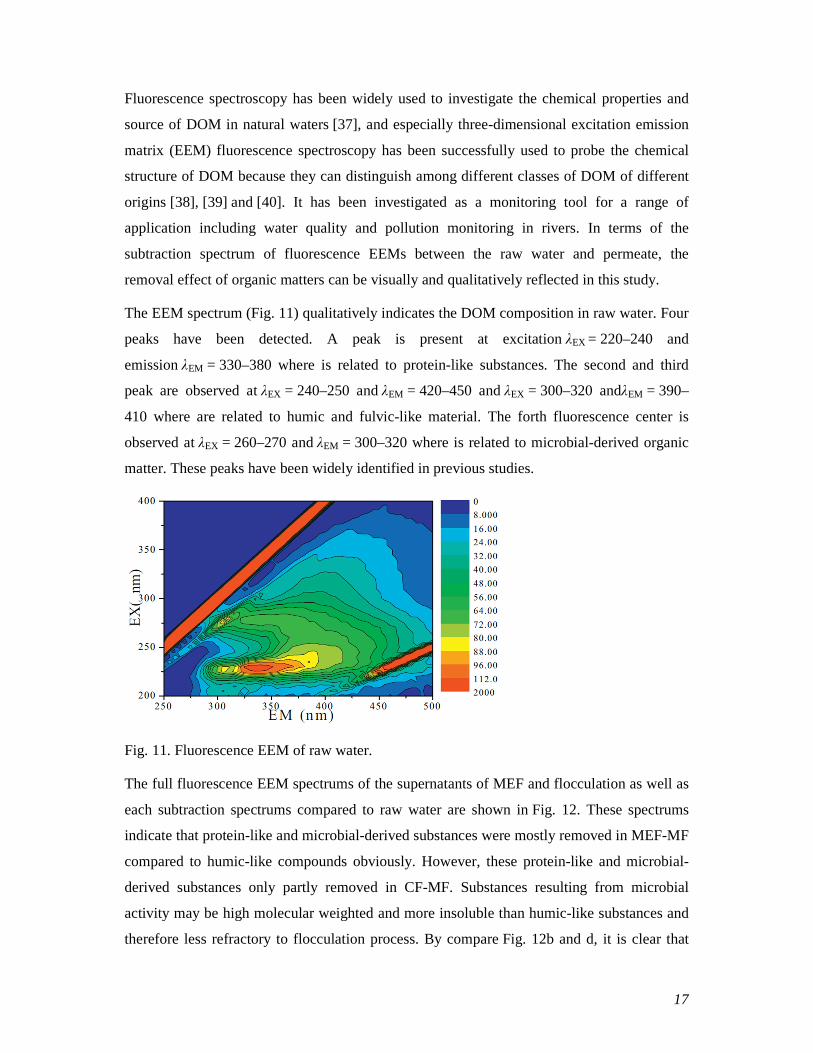
The EEM spectrum (Fig. 11) qualitatively indicates the DOM composition in raw water. Four
peaks have been detected. A peak is present at excitation λEX = 220–240 and
emission λEM = 330–380 where is related to protein-like substances. The second and third
peak are observed at λEX = 240–250 and λEM = 420–450 and λEX = 300–320 andλEM = 390–
410 where are related to humic and fulvic-like material. The forth fluorescence center is
observed at λEX = 260–270 and λEM = 300–320 where is related to microbial-derived organic
matter. These peaks have been widely identified in previous studies.
Fig. 11. Fluorescence EEM of raw water.
The full fluorescence EEM spectrums of the supernatants of MEF and flocculation as well as
each subtraction spectrums compared to raw water are shown in Fig. 12. These spectrums
indicate that protein-like and microbial-derived substances were mostly removed in MEF-MF
compared to humic-like compounds obviously. However, these protein-like and microbial-
derived substances only partly removed in CF-MF. Substances resulting from microbial
activity may be high molecular weighted and more insoluble than humic-like substances and
therefore less refractory to flocculation process. By compare Fig. 12b and d, it is clear that
18
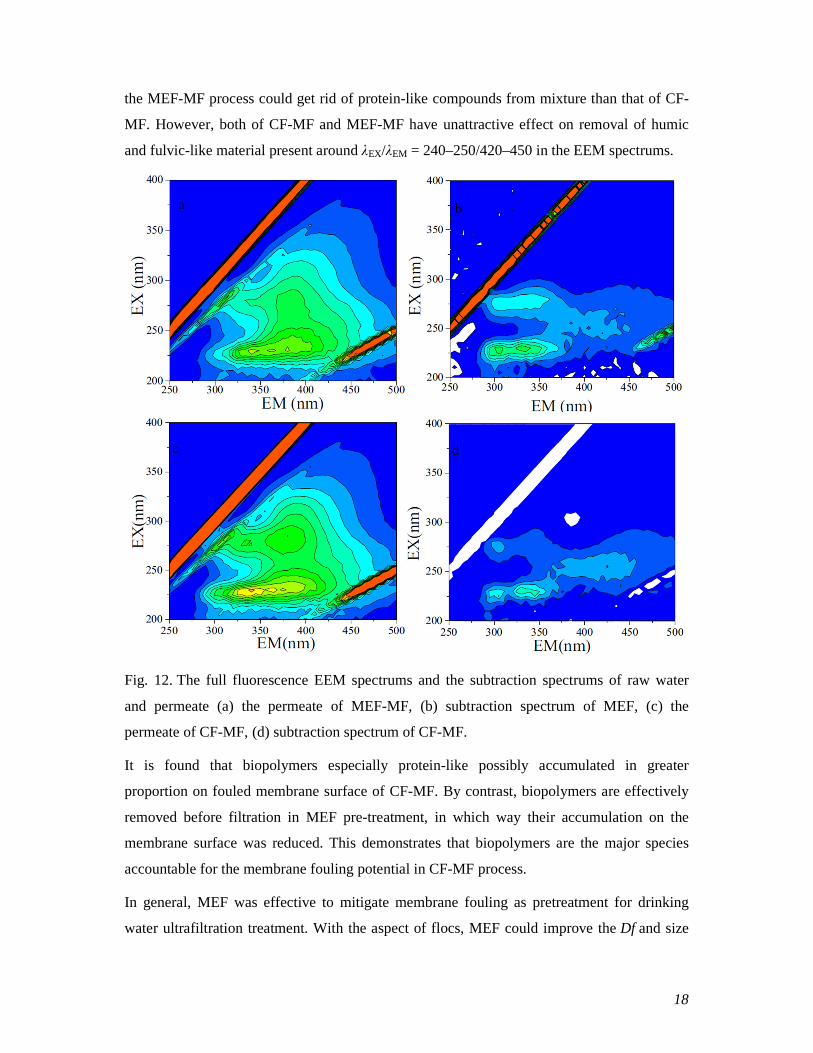
the MEF-MF process could get rid of protein-like compounds from mixture than that of CF-
MF. However, both of CF-MF and MEF-MF have unattractive effect on removal of humic
and fulvic-like material present around λEX/λEM = 240–250/420–450 in the EEM spectrums.
Fig. 12. The full fluorescence EEM spectrums and the subtraction spectrums of raw water
and permeate (a) the permeate of MEF-MF, (b) subtraction spectrum of MEF, (c) the
permeate of CF-MF, (d) subtraction spectrum of CF-MF.
It is found that biopolymers especially protein-like possibly accumulated in greater
proportion on fouled membrane surface of CF-MF. By contrast, biopolymers are effectively
removed before filtration in MEF pre-treatment, in which way their accumulation on the
membrane surface was reduced. This demonstrates that biopolymers are the major species
accountable for the membrane fouling potential in CF-MF process.
In general, MEF was effective to mitigate membrane fouling as pretreatment for drinking
water ultrafiltration treatment. With the aspect of flocs, MEF could improve the Df and size
19
of floc with ferromagnetic seeds. Porous cake layer with flocs of large size and Dfwas helpful
for alleviating the decline rate of membrane flux. As for the foulants, analyses by GPC and
EEM have proved that MEF pretreatment was more efficient for the reduction of low and
mid-MW organic structures, i.e. humic-like material, than flocculation pretreatment. High
MW structures of biopolymers were also significantly reduced by MEF pretreatment. The
zeta potential analysis of the fouled membranes also verified the accumulation of negative
charged colloidal particles on the membrane surface of MEF-MF was less than those of CF-
MF.
The model development of MEF-MF
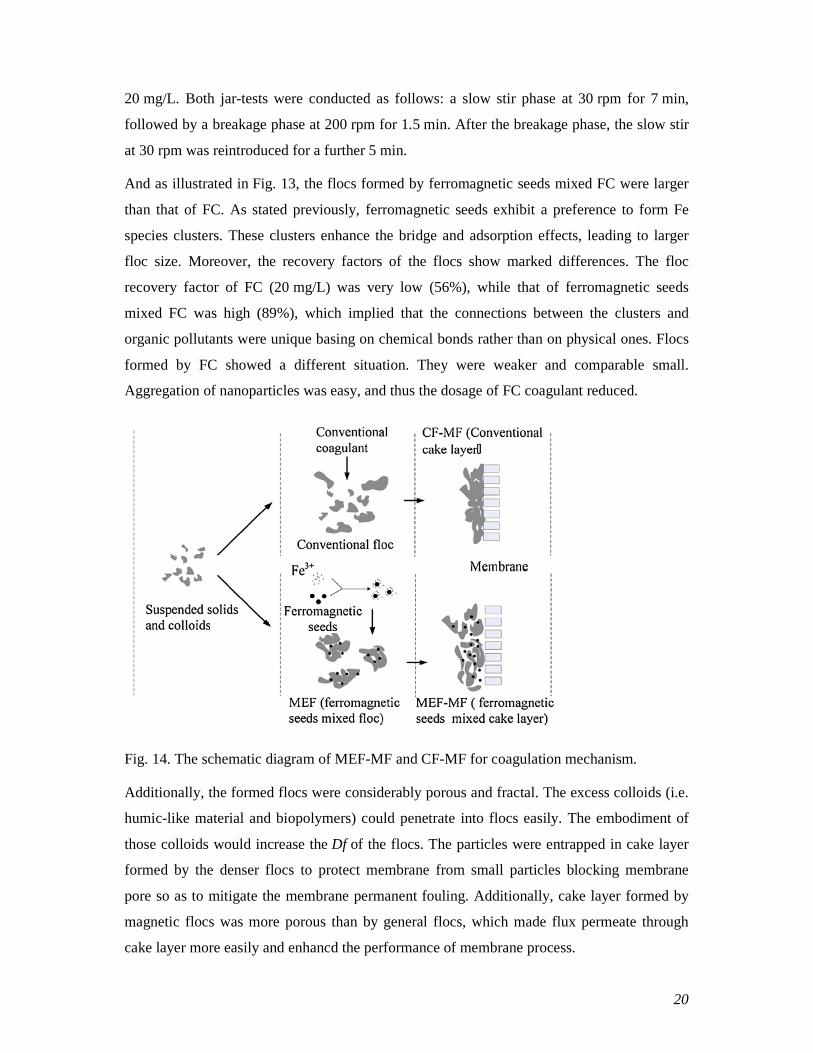
The results of this work indicate that ferromagnetic seeds could play a significant role in
flocculation for mitigating membrane fouling. A reasonable ferromagnetic seeds flocculation
mechanism has been described schematically in Fig. 14. Fe species clusters coated with
hydration layer are formed when ferromagnetic seeds were added. The hydroxyl ( OH) in
hydration layer can form chemical bonds with Fe ions in the FC under a week magnetic field.
The formed clusters would increase the proportion of iron around the ferromagnetic seeds,
which has a great potential to enhance charge neutralization, enmeshment and adsorption
when aggregated with the pollutants. In addition, magnetism is a unique physical property
that independently contributes to flocculation by influencing the physical properties of
contaminants in water. The flocs produced by the coagulants exhibit different characteristics
as shown in Fig. 5.
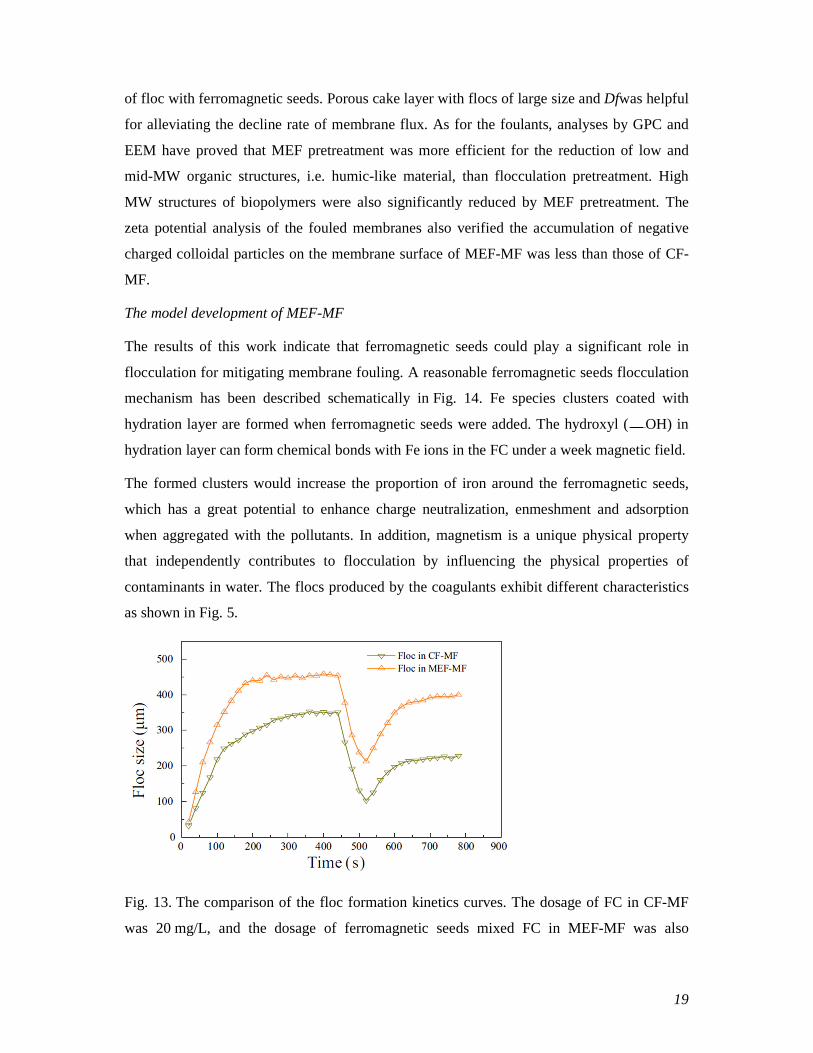
Fig. 13. The comparison of the floc formation kinetics curves. The dosage of FC in CF-MF
was 20 mg/L, and the dosage of ferromagnetic seeds mixed FC in MEF-MF was also
20
20 mg/L. Both jar-tests were conducted as follows: a slow stir phase at 30 rpm for 7 min,
followed by a breakage phase at 200 rpm for 1.5 min. After the breakage phase, the slow stir
at 30 rpm was reintroduced for a further 5 min.
And as illustrated in Fig. 13, the flocs formed by ferromagnetic seeds mixed FC were larger
than that of FC. As stated previously, ferromagnetic seeds exhibit a preference to form Fe
species clusters. These clusters enhance the bridge and adsorption effects, leading to larger
floc size. Moreover, the recovery factors of the flocs show marked differences. The floc
recovery factor of FC (20 mg/L) was very low (56%), while that of ferromagnetic seeds
mixed FC was high (89%), which implied that the connections between the clusters and
organic pollutants were unique basing on chemical bonds rather than on physical ones. Flocs
formed by FC showed a different situation. They were weaker and comparable small.
Aggregation of nanoparticles was easy, and thus the dosage of FC coagulant reduced.
Fig. 14. The schematic diagram of MEF-MF and CF-MF for coagulation mechanism.
Additionally, the formed flocs were considerably porous and fractal. The excess colloids (i.e.
humic-like material and biopolymers) could penetrate into flocs easily. The embodiment of
those colloids would increase the Df of the flocs. The particles were entrapped in cake layer
formed by the denser flocs to protect membrane from small particles blocking membrane
pore so as to mitigate the membrane permanent fouling. Additionally, cake layer formed by
magnetic flocs was more porous than by general flocs, which made flux permeate through
cake layer more easily and enhancd the performance of membrane process.
21
Conclusions
Compared to CF-MF, MEF-MF had a palpable superiority on mitigating membrane fouling.
Higher fractal dimension and larger flocs spread with ferromagnetic seeds were formed in
MEF pretreatment. In the membrane filtration process, porous cake layer was constructed
with the magnetic flocs depositing on membrane surface gradually, which made permeate
flux pass cake layer easier and enhanced the performance of membrane process.
Foulants especially the high MW biopolymers were almost trapped in the ferromagnetic
seeds spread flocs and cake layer, preventing clogging membrane pores. Moreover, low and
mid-MW organic structures, i.e. humic-like materials were also partially removed by MEF
pretreatment. With the accumulation of colloids on membrane surface in CF-MF process, the
membrane potential decreased significantly comparing to that in MEF-MF process.
In consideration of the effect of ferromagnetic seeds on mitigating membrane fouling, MEF-
MF can provide a novel alternative approach for drinking water treatment in the future.
Acknowledgments
This study is financially supported by the National Natural Science Foundation of China
(No.51108314, No.51378349) and China Postdoctoral Science Foundation (2013M541184).
References
[1] D.H. Kim, H.K. Shon, G. Sharma, J. Cho, J. Ind. Eng. Chem. 17 (2011) 109.
[2] T. Zsirai, P. Buzatu, P. Aerts, S. Judd, Water Res. 46 (2012) 4499.
[3] J.Y. Tian, Z.L. Chen, Y.L. Yang, H. Liang, J. Nan, G.B. Li, Water Res. 44 (2010) 59.
[4] A. Bagga, S. Chellam, D.A. Clifford, J. Membr. Sci. 309 (2008) 82.
[5] N.P. Gamage, S. Chellam, J. Membr. Sci. 379 (2011) 97.
[6] R. Bergamasco, L.C. Konradt-Moraes, M.F. Vieira, M.R. Fagundes-Klen, A.M. Sal-cedo Vieira, Chem. Eng. J. 166 (2011) 483.
[7] W.Z. Yu, N. Graham, H.J. Liu, J.H. Qu, Chem. Eng. J. 234 (2013) 158.
[8] R. Mao, Y. Wang, Y. Zhao, B. Gao, M. Dong, Chem. Eng. J. 225 (2013) 387.
[9] S.J. Lee, K.H. Choo, C.H. Lee, J. Ind. Eng. Chem. 6 (2000) 357.
[10] C.P. Leo, N.H.A. Kamil, M.U.M. Junaidi, S.N.M. Kamal, A.L. Ahmad, Sep. Purif. Technol. 103 (2013) 84.
22
[11] D.J. Lee, G.Y. Liao, Y.R. Chang, J.S. Chang, Int. J. Hydrogen Energy 37 (2012) 15643.
[12] Y. Matsui, H. Hasegawa, K. Ohno, T. Matsushita, S. Mima, Y. Kawase, T. Aizawa, Water Res. 43 (2009) 5160.
[13] S. Yiacoumi, D.A. Rountree, C. Tsouris, J. Colloid Interface Sci. 184 (1996) 477.
[14] C. Tsouris, T.C. Scott, J. Colloid Interface Sci. 171 (1995) 319.
[15] J. Svoboda, J. Zofka, J.Colloid Interface Sci. 94 (1983) 37.
[16] Y. Li, J. Wang, Y. Zhao, Z. Luan, Sep. Purif. Technol. 73 (2010) 264.
[17] S. Zakaria, B.H. Ong, T.G.M. van de Ven, Colloids Surf., A: Physicochem. Eng. Aspects 251 (2004) 1.
[18] J. Guo, X. Li, G. Wu, Z. Wang, J. Song, Q. Feng, Adv. Mater. Res. 1867 (2012) 356–360.
[19] D. Liu, P. Wang, G. Wei, W. Dong, F. Hui, Environ. Sci. Pollut. Res. 20 (2013) 60.
[20] G.U. Semblante, S.D.R. Tampubolon, S.J. You, Y.F. Lin, T.C. Chang, F.C. Yen, J. Membr. Sci. 435 (2013) 62.
[21] M. Zhang, F. Xiao, X.Z. Xu, D.S. Wang, Water Res. 46 (2012) 127.
[22] S. Salgin, U. Salgin, N. Soyer, Int. J. Electrochem. Sci. 8 (2013) 4073.
[23] M.C. Wilbert, S. Delagah, J. Pellegrino, J. Membr. Sci. 161 (1999) 247.
[24] Y. Adachi, M. Kobayashi, S. Ooi, J. Colloid Interface Sci. 208 (1998) 353.
[25] K. Xiao, X. Wang, X. Huang, T.D. Waite, X. Wen, J. Membr. Sci. 373 (2011) 140.
[26] W.S. Guo, S. Vigneswaran, H.H. Ngo, Desalination 172 (2005) 53.
[27] S. Kim, H. Park, J. Environ. Eng.-ASCE 128 (2002) 335.
[28] S. Kim, H. Park, J. Environ. Eng.-ASCE 131 (2005) 865.
[29] Y. Zhou, G.V. Franks, Langmuir 22 (2006) 6775.
[30] D.N. Thomas, S.J. Judd, N. Fawcett, Water Res. 33 (1999) 1579.
[31] H. Humbert, H. Gallard, J.P. Croue, Water Res. 46 (2012) 1093.
[32] H. Humbert, H. Gallard, V. Jacquemet, J.-P. Croue, Water Res. 41 (2007) 3803.
[33] P.K. Park, C.H. Lee, S. Lee, Environ. Sci. Technol. 40 (2006) 2699.
[34] Q. Yun-Ren, Q. Jing, J. Membr. Sci. 425–426 (2013) 71.
[35] R. Blank, K.H. Muth, S. Proske-Gerhards, E. Staude, Colloids Surf., A: Physicochem. Eng. Aspects 140 (1998) 3.
[36] A.W. Zularisam, A.F. Ismail, M.R. Salim, M. Sakinah, O. Hiroaki, J. Membr. Sci. 299 (2007) 97.
[37] S. Li, W. Sun, Chem. Eng. J. 237 (2014) 101.
[38] S. Peldszus, C. Halle, R.H. Peiris, M. Hamouda, X. Jin, R.L. Legge, H. Budman, C. Moresoli, P.M. Huck, Water Res. 45 (2011) 5161.
[39] G.A. Baddi, B. Antizar-Ladislao, A. Alcuta, L. Mazeas, T. Li, C. Duquennoi, E. Redon, T. Bouchez, Environ. Eng. Sci. 30 (2013) 232.
23
[40] E.M. Carstea, A. Baker, M. Bieroza, D. Reynolds, Water Res. 44 (2010) 5356.