Embed Size (px)
Citation preview
Prepared For
Mr. David Babatope, Member Mountain View Hospitality LLC
2183 Salem RoadConyers, Georgia 30013
&Peoples Bank
1793 Highway 138 SEConyers, Georgia 30013
Feasibility Study of
Proposed WoodSpring Suites
West Iris Dive in SWQ of I-20 Exit 84
Conyers, Georgia 30013
Prepared By
Shamrock Capital LLC
322 N Forest Boulevard
Lake Mary, Florida 32746
Date of Analysis
October 21, 2016
Date of Report
November 28, 2016
322 N Forest Blvd, Lake Mary, FL 32746 Tel. (407) 402-9042
SHAMROCK CAPITAL LLC
November 28, 2016
Mr. David Babatope, Member Mountain View Hospitality LLC2183 Salem Road&Peoples Bank1793 Highway 138 SEConyers, Georgia 30013
Reference: Feasibility Study
Proposed WoodSpring Suites
West Iris Dive in SWQ of I-20 Exit 84, Conyers, Georgia 30013
Dear Mr. Babatope & Mr. Khanna:
Per your request, on October 21, 2016 we analyzed the Conyers, Georgia lodging market as it
pertains to the proposed WoodSpring Suites. Based on the provided 124-room prototype design
and an all-in project cost of $7,700,000, the subject property should produce a free-and-clear
Internal Rate of Return (IRR) of 10.5%. This return is considered average based on accepted
market returns for similar hotel investments.
Please review the enclosed report and if you have any questions or need additional information,
please feel free to contact us.
Respectfully submitted,
Shamrock Capital LLC
Robert P Hill Christopher M. Keegan
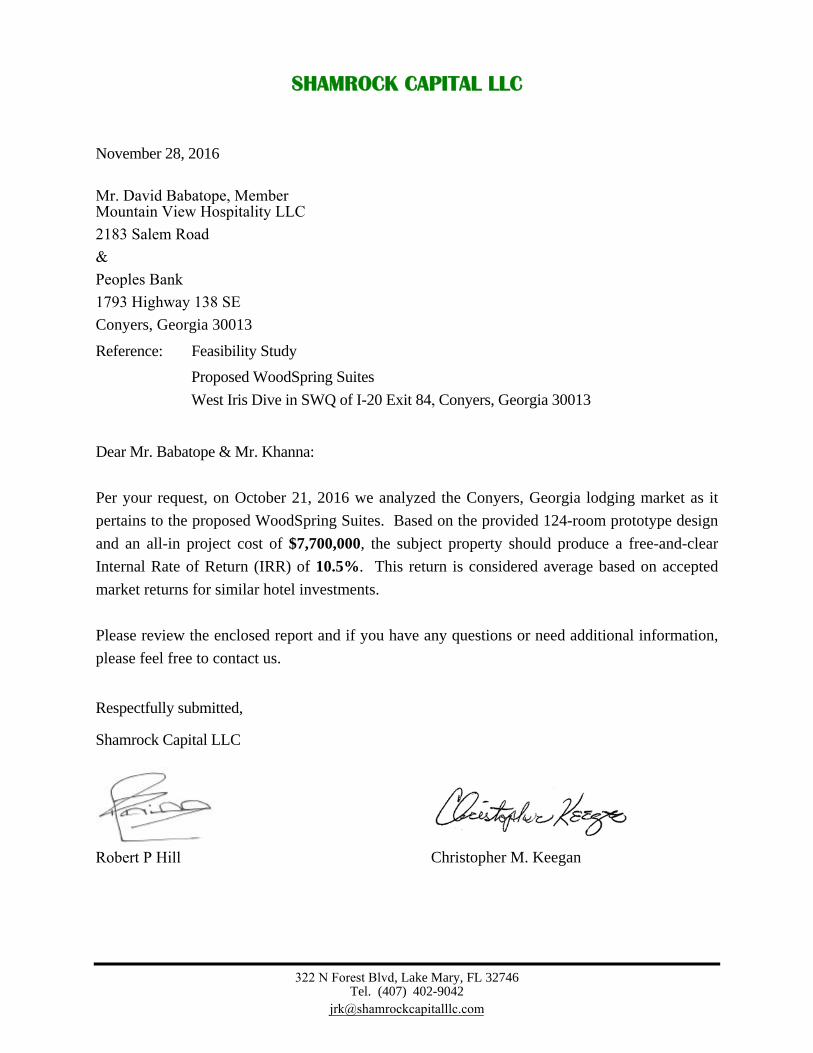
Executive Summary
Proposed WoodSpring Suites Prototype
Project Summary A proposed 124-room prototype WoodSpring Suites extended-stay hotel is contemplated for the vacant parcel at West Iris Drive & Flat Shoals Road, Conyers, Georgia. The proposed WoodSpring will be positioned as an economy-priced extended-stay hotel. Our research indicates that the 124-room proposed design would be suitable for this market.
Client and Intended User The client and intended user of this feasibility study is
Mountain View Hospitality LLC. Mr. David Babatope,
Member, authorized the preparation of this feasibility study
by signing a letter of proposal dated October 17, 2016. Any
use of this report by third parties is unauthorized without the
written consent of the Client and Shamrock Capital LLC.
Client’s Intended Use Financial analysis and decision making as they pertain to the
development of the subject property and to provide
supporting documentation for financing.
Date of Report November 28, 2016
Executive Summary (cont’d)
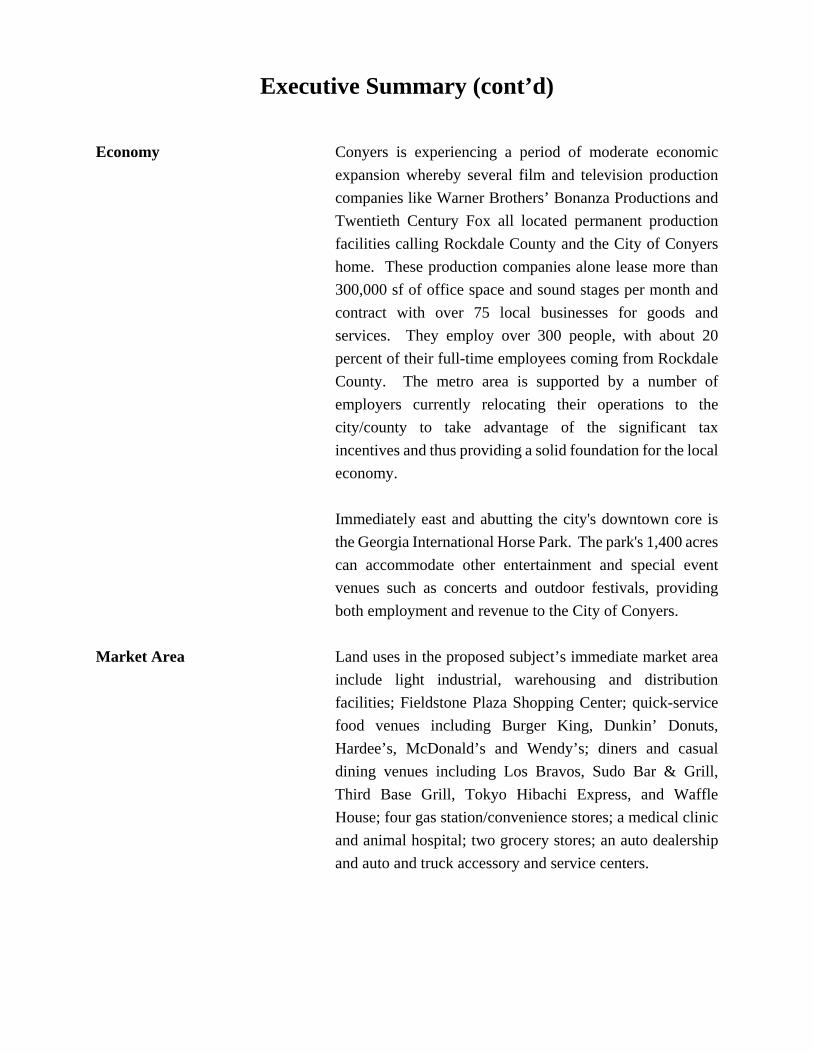
Economy Conyers is experiencing a period of moderate economic
expansion whereby several film and television production
companies like Warner Brothers’ Bonanza Productions and
Twentieth Century Fox all located permanent production
facilities calling Rockdale County and the City of Conyers
home. These production companies alone lease more than
300,000 sf of office space and sound stages per month and
contract with over 75 local businesses for goods and
services. They employ over 300 people, with about 20
percent of their full-time employees coming from Rockdale
County. The metro area is supported by a number of
employers currently relocating their operations to the
city/county to take advantage of the significant tax
incentives and thus providing a solid foundation for the local
economy.
Immediately east and abutting the city's downtown core is
the Georgia International Horse Park. The park's 1,400 acres
can accommodate other entertainment and special event
venues such as concerts and outdoor festivals, providing
both employment and revenue to the City of Conyers.
Market Area Land uses in the proposed subject’s immediate market area
include light industrial, warehousing and distribution
facilities; Fieldstone Plaza Shopping Center; quick-service
food venues including Burger King, Dunkin’ Donuts,
Hardee’s, McDonald’s and Wendy’s; diners and casual
dining venues including Los Bravos, Sudo Bar & Grill,
Third Base Grill, Tokyo Hibachi Express, and Waffle
House; four gas station/convenience stores; a medical clinic
and animal hospital; two grocery stores; an auto dealership
and auto and truck accessory and service centers.
Executive Summary (cont’d)
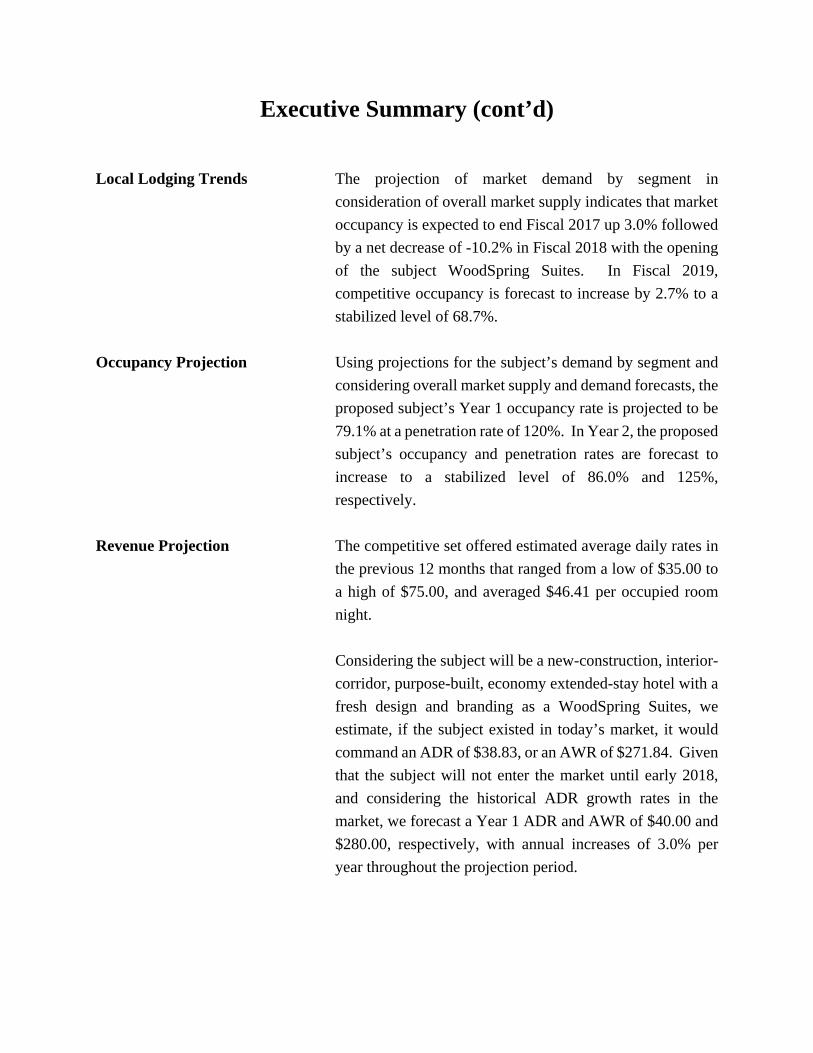
Local Lodging Trends The projection of market demand by segment in
consideration of overall market supply indicates that market
occupancy is expected to end Fiscal 2017 up 3.0% followed
by a net decrease of -10.2% in Fiscal 2018 with the opening
of the subject WoodSpring Suites. In Fiscal 2019,
competitive occupancy is forecast to increase by 2.7% to a
stabilized level of 68.7%.
Occupancy Projection Using projections for the subject’s demand by segment and
considering overall market supply and demand forecasts, the
proposed subject’s Year 1 occupancy rate is projected to be
79.1% at a penetration rate of 120%. In Year 2, the proposed
subject’s occupancy and penetration rates are forecast to
increase to a stabilized level of 86.0% and 125%,
respectively.
Revenue Projection The competitive set offered estimated average daily rates in
the previous 12 months that ranged from a low of $35.00 to
a high of $75.00, and averaged $46.41 per occupied room
night.
Considering the subject will be a new-construction, interior-
corridor, purpose-built, economy extended-stay hotel with a
fresh design and branding as a WoodSpring Suites, we
estimate, if the subject existed in today’s market, it would
command an ADR of $38.83, or an AWR of $271.84. Given
that the subject will not enter the market until early 2018,
and considering the historical ADR growth rates in the
market, we forecast a Year 1 ADR and AWR of $40.00 and
$280.00, respectively, with annual increases of 3.0% per
year throughout the projection period.
Executive Summary (cont’d)
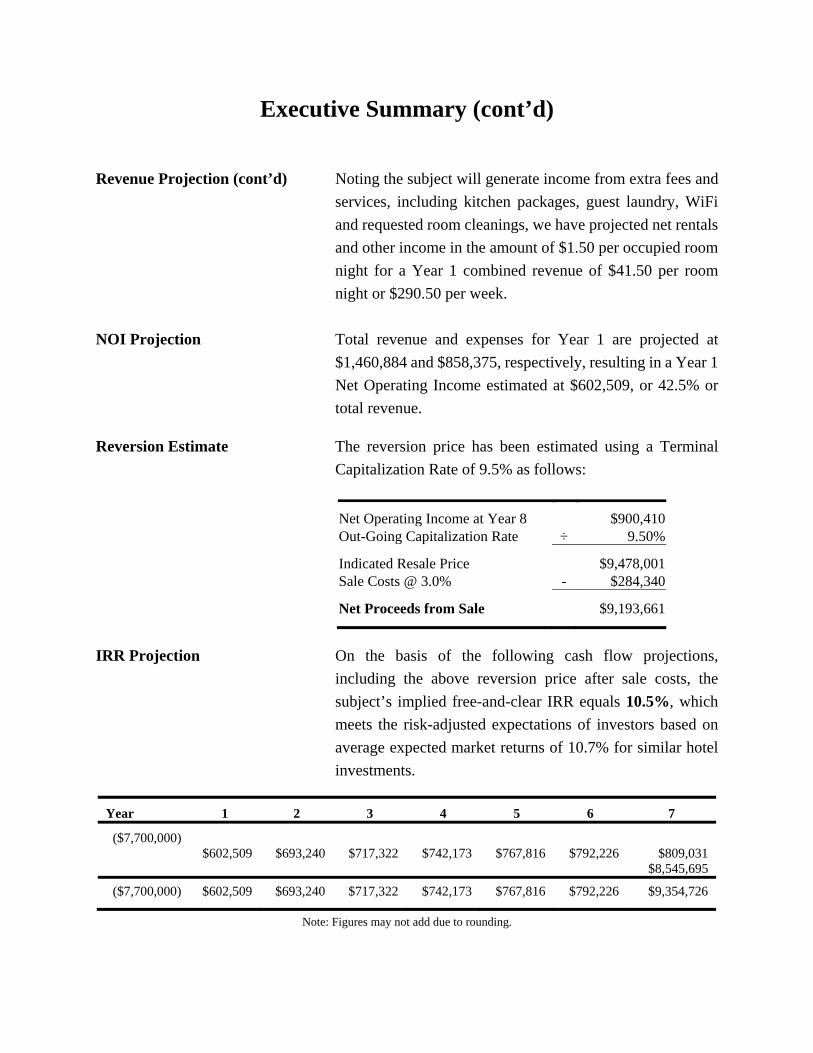
Revenue Projection (cont’d) Noting the subject will generate income from extra fees and
services, including kitchen packages, guest laundry, WiFi
and requested room cleanings, we have projected net rentals
and other income in the amount of $1.50 per occupied room
night for a Year 1 combined revenue of $41.50 per room
night or $290.50 per week.
NOI Projection Total revenue and expenses for Year 1 are projected at
$1,460,884 and $858,375, respectively, resulting in a Year 1
Net Operating Income estimated at $602,509, or 42.5% or
total revenue.
Reversion Estimate The reversion price has been estimated using a Terminal
Capitalization Rate of 9.5% as follows:
Net Operating Income at Year 8 $900,410 Out-Going Capitalization Rate ÷ 9.50%
Indicated Resale Price $9,478,001 Sale Costs @ 3.0% - $284,340
Net Proceeds from Sale $9,193,661
IRR Projection On the basis of the following cash flow projections,
including the above reversion price after sale costs, the
subject’s implied free-and-clear IRR equals 10.5%, which
meets the risk-adjusted expectations of investors based on
average expected market returns of 10.7% for similar hotel
investments.
Year 1 2 3 4 5 6 7
($7,700,000)$602,509 $693,240 $717,322 $742,173 $767,816 $792,226 $809,031
$8,545,695
($7,700,000) $602,509 $693,240 $717,322 $742,173 $767,816 $792,226 $9,354,726
Note: Figures may not add due to rounding.
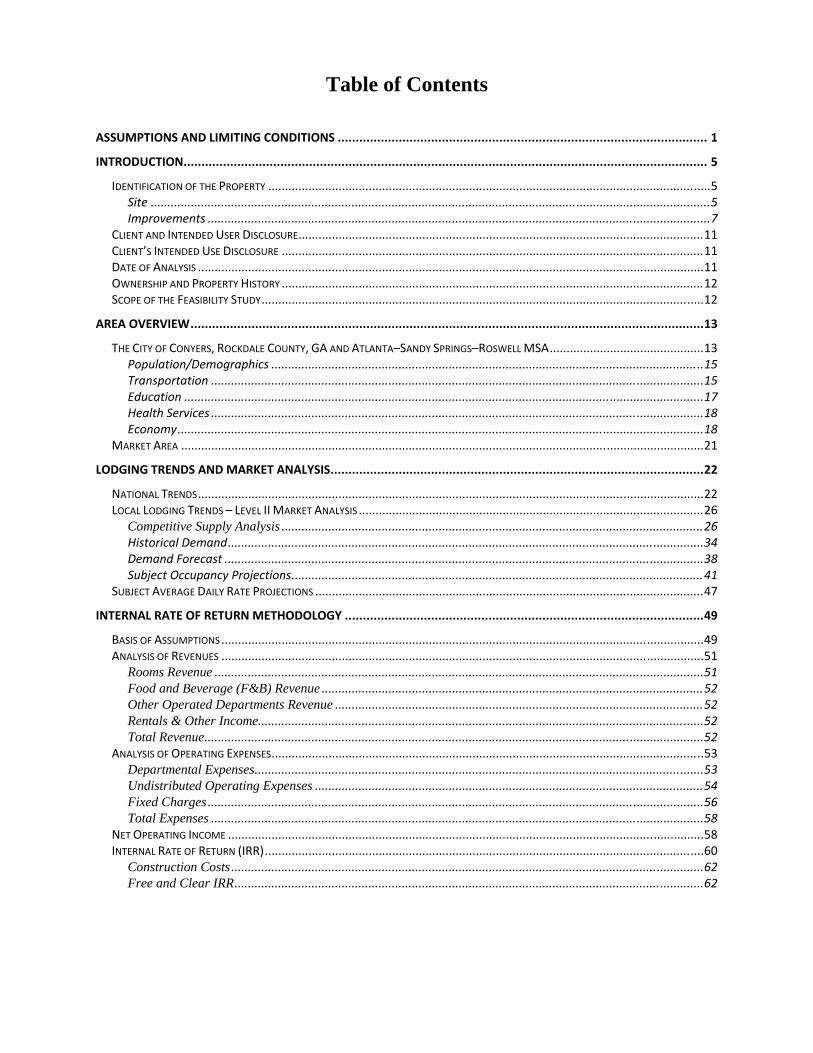
Table of Contents
ASSUMPTIONS AND LIMITING CONDITIONS ....................................................................................................... 1
INTRODUCTION.................................................................................................................................................. 5
IDENTIFICATION OF THE PROPERTY .................................................................................................................................... 5 Site ....................................................................................................................................................................... 5 Improvements ...................................................................................................................................................... 7
CLIENT AND INTENDED USER DISCLOSURE ......................................................................................................................... 11 CLIENT’S INTENDED USE DISCLOSURE .............................................................................................................................. 11 DATE OF ANALYSIS ....................................................................................................................................................... 11 OWNERSHIP AND PROPERTY HISTORY .............................................................................................................................. 12 SCOPE OF THE FEASIBILITY STUDY .................................................................................................................................... 12
AREA OVERVIEW ............................................................................................................................................... 13
THE CITY OF CONYERS, ROCKDALE COUNTY, GA AND ATLANTA–SANDY SPRINGS–ROSWELL MSA .............................................. 13 Population/Demographics ................................................................................................................................. 15 Transportation ................................................................................................................................................... 15 Education ........................................................................................................................................................... 17 Health Services ................................................................................................................................................... 18 Economy ............................................................................................................................................................. 18
MARKET AREA ............................................................................................................................................................ 21
LODGING TRENDS AND MARKET ANALYSIS ........................................................................................................ 22
NATIONAL TRENDS ....................................................................................................................................................... 22 LOCAL LODGING TRENDS – LEVEL II MARKET ANALYSIS ....................................................................................................... 26
Competitive Supply Analysis .............................................................................................................................. 26 Historical Demand .............................................................................................................................................. 34 Demand Forecast ............................................................................................................................................... 38 Subject Occupancy Projections ........................................................................................................................... 41
SUBJECT AVERAGE DAILY RATE PROJECTIONS .................................................................................................................... 47
INTERNAL RATE OF RETURN METHODOLOGY .................................................................................................... 49
BASIS OF ASSUMPTIONS ................................................................................................................................................ 49 ANALYSIS OF REVENUES ................................................................................................................................................ 51
Rooms Revenue .................................................................................................................................................. 51 Food and Beverage (F&B) Revenue .................................................................................................................. 52 Other Operated Departments Revenue .............................................................................................................. 52 Rentals & Other Income..................................................................................................................................... 52 Total Revenue ..................................................................................................................................................... 52
ANALYSIS OF OPERATING EXPENSES ................................................................................................................................. 53 Departmental Expenses ...................................................................................................................................... 53 Undistributed Operating Expenses .................................................................................................................... 54 Fixed Charges .................................................................................................................................................... 56 Total Expenses ................................................................................................................................................... 58
NET OPERATING INCOME .............................................................................................................................................. 58 INTERNAL RATE OF RETURN (IRR) ................................................................................................................................... 60
Construction Costs ............................................................................................................................................. 62 Free and Clear IRR ............................................................................................................................................ 62
CONCLUSION .................................................................................................................................................... 66
Free-and-Clear IRR ........................................................................................................................................... 66 Investment Caveats ............................................................................................................................................ 66 Investment Considerations ................................................................................................................................. 67
ANALYSTS’ CERTIFICATION ................................................................................................................................ 69
ADDENDA
ENGAGEMENT LETTER SURVEY SITE PLAN CUSTOM SMITH TRAVEL TREND REPORT PROPERTY PHOTOGRAPHS QUALIFICATIONS OF ANALYSTS
Assumptions and Limiting Conditions
Proposed WoodSpring Suites Shamrock Capital LLC Conyers, Georgia Page 1 Feasibility Report
Assumptions and Limiting Conditions
1. The analysts certify that, to the best of our knowledge and belief, the statements contained in this
report, subject to the limiting conditions set forth below are correct; also that this report has been
made in conformity with the accepted practices of the Appraisal Institute.
2. This property has been analyzed as though free of all liens and encumbrances, unless otherwise
stated herein. No responsibility is assumed for matters legal in nature, nor is any opinion of title
rendered herewith. Good title is assumed.
3. The analysts herein, by reason of this report, are not required to give testimony in court, with
reference to the property herein appraised, unless arrangements have been previously made.
4. Disclosure of the contents of this feasibility report is governed by the By-Laws and Regulations
of the Appraisal Institute.
5. Neither all nor any part of the contents of this report (especially any conclusions as to value, the
identity of the analysts or the firm with which they are connected, or any reference to the Appraisal
Institute or the MAI or SRA Designation) shall be disseminated to the public through advertising
media, public relations media, news media, sales media, or any other public means of
communication without the prior written consent and approval of the undersigned.
6. Certain information in this report was furnished from sources believed to be reliable; however, such information is
not guaranteed to be correct, although it has been checked insofar as possible and is believed to be correct.
7. We are not familiar with any engineering or geological studies made to determine the bearing capacity of the land or
that indicate any mineral contents of a significant nature. Because improvements in the area appear to be structurally
sound, we assume that soil and subsoil conditions are stable.
8. Plats, maps, and other exhibits in this report are used merely to help the reader visualize the
property and its surroundings, and no responsibility is assumed for their cartographic accuracy.
Assumptions and Limiting Conditions
Proposed WoodSpring Suites Shamrock Capital LLC Conyers, Georgia Page 2 Feasibility Report
9. The value estimates reported herein are under the purpose and land-use premise stated. They are
not valid for any other purpose or premise and must not be used in conjunction with any other
report, appraisal, or intended use.
10. Full compliance with all applicable federal, state, and local environmental regulations is assumed,
as well as all applicable zoning, use, and occupancy regulations and restrictions as stated and
considered in this report.
11. In this assignment, the existence of any hazardous or potentially hazardous material possibly
located on the site thereon, such as urea formaldehyde foam insulation, asbestos, or toxic waste,
etc., was not observed by the inspecting analysts and has not been considered. The analysts have
no knowledge of any such materials on or in the property but are not qualified to detect such
substances. The presence of such materials may have an effect on the value or use of the property.
It is assumed that there are no hazardous material spills, etc. resulting from underground storage
tanks or other causes associated with the subject property. Full compliance with all environmental
laws is assumed. The client is urged to retain an expert in this field if desired.
12. Any projections, forecasts, etc., regarding future patterns of income and/or expenses, prices/values, etc. represent the
analysts’ best estimates of investor anticipations with respect to these items, based on information available at the date
of appraisal or analysis. Such information includes forecasts/projections published by recognized sources such as
economists, financial publications, investor surveys, etc. Economic trends can affect future behavior of income,
expenses, values, etc. Changes in these items caused by future occurrences could result in values different from those
established in this report. We cannot accept responsibility for economic variables in the future that could not have
been known or anticipated at the date of analysis (inflation rates, economic upswings or downturns, fiscal policy
changes, etc.).
13. All mechanical equipment, existing or as proposed, in the building(s) is assumed to be in average to good working
order, unless otherwise stated and treated elsewhere in the report.
Assumptions and Limiting Conditions
Proposed WoodSpring Suites Shamrock Capital LLC Conyers, Georgia Page 3 Feasibility Report
14. The Americans with Disabilities Act (ADA) became effective January 26, 1992 setting strict and
specific standards for disabled access to and within most commercial and public buildings. We
have not made a specific compliance survey and analysis of the proposed property to determine
whether or not it will be in conformity with the various detailed requirements of the ADA. It is
possible that a compliance survey of the property together with a detailed analysis of the
requirements of the ADA could reveal that the proposed property will not be in compliance with
one or more of the requirements of the act. If so, this fact could have a negative effect upon the
value of the property. Since we have no direct evidence relating to this issue, we did not consider
possible noncompliance with the requirements of the ADA in estimating the value of the property.
15. The indicated values are subject to the completion of the property in accordance with the forecast
construction budget and other project information which has been provided by the developer. We assume the construction will be completed with quality materials in a workmanlike, timely and quality manner.
16. The estimated income and expense results are based upon competent, efficient management
and responsible ownership. Other than as set forth in this report, we assume no significant change in the competitive position of the competitive facilities (supply) in the area.
17. It should be noted that the estimated development costs are based on budgets provided by the
developer and on the premise that no atypical unforeseen delays or problems occur. In a construction project of this scope, there are numerous complications that may occur. For example, unexpected drainage problems resulting from soil conditions, springs, or unusual precipitation can complicate and prolong the construction. Similarly, unanticipated environmental issues can cause construction delays or expensive corrective measures. Unexpected weather conditions or other unpredictable factors may also influence the cost of the project. In addition, problems associated with the building or site improvements may occur. Changes in prices or availability of materials or labor can impact costs. Also, problems with timely work, inspections or approvals can slow construction and impact costs. Finally, other events outside of the control of the developer, such as bankruptcy of the general contractor or subcontractors, could cause delays and cost overruns. We have made an inspection of the subject commercial hotel site and have not noted any particular conditions that would indicate problems for the development process. We are not experts on soil conditions, subterranean rock, environmental issues or similar matters, but we simply have pointed out some important factors that can produce unexpected costs to construct a proposed project.
Assumptions and Limiting Conditions
Proposed WoodSpring Suites Shamrock Capital LLC Conyers, Georgia Page 4 Feasibility Report
18. If applicable to the subject’s market, a Trend Response Report from Smith Travel Research
(STR) has been utilized to verify and augment our primary market research. Sole reliance is
not made upon the STR data provided, specifically in instances when a period of non-reporting
has occurred in one or more of the properties in the sample set. Due to the methodology used
by Smith Travel, this situation may result in skewed data as the average of the reporting
properties is assumed for the entire sample, including any non-reporting property or properties.
19. Unless specifically stated otherwise, we assume the subject’s franchise agreement will extend
through the specified holding period and beyond such that it will not affect the marketability or
reversion price(s) forecast within this report. We have assumed that upon completion the hotel
will meet all the requirements of the franchise and no substantial capital improvements will be
required to maintain the agreement over the holding period and beyond.
Introduction
Proposed WoodSpring Suites Shamrock Capital LLC Conyers, Georgia Page 5 Feasibility Report
Introduction
Identification of the Property
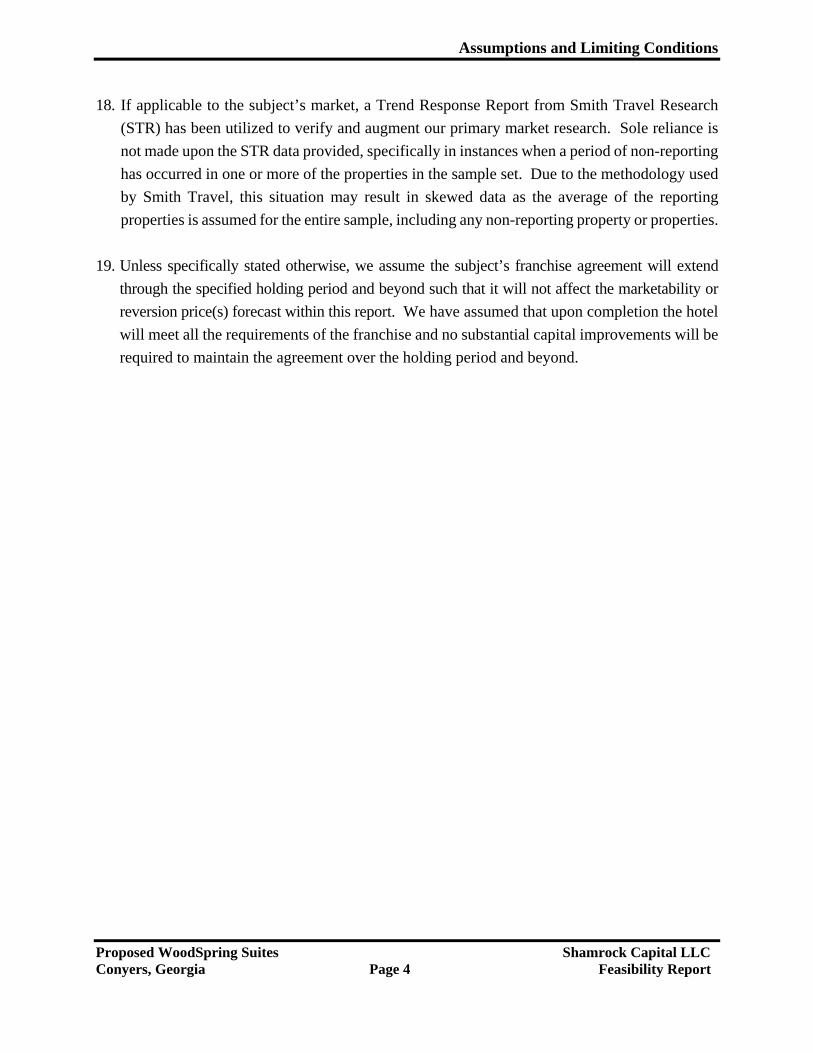
The subject of this feasibility study is a proposed WoodSpring Suites hotel to be located on the
east side of Conyers, Georgia in the southwestern quadrant of Exit 84, the Interstate 20 and Salem
Road interchange. The site has not yet been assigned a formal street address along West Iris Drive
but is identified by the Rockdale County Assessor’s Office as tax parcel number 0760010027. The
site is located in Zip Code 30013 District.
Site
The subject site is bound to the north and east by the I-20 eastbound off-ramp, to the south by
vacant land (part of the parent parcel), and to the west by West Iris Drive. The irregular-shaped
site has good visibility from Interstate 20, Salem Road/Highway 162, and West Iris Drive, along
which it will front.
Aerial View of Exit 84, Interstate 20 and Salem Road Interchange
(Subject hotel site fronts on West Iris Road and is identified by the arrow.)
Source: Google Maps
Introduction
Proposed WoodSpring Suites Shamrock Capital LLC Conyers, Georgia Page 6 Feasibility Report
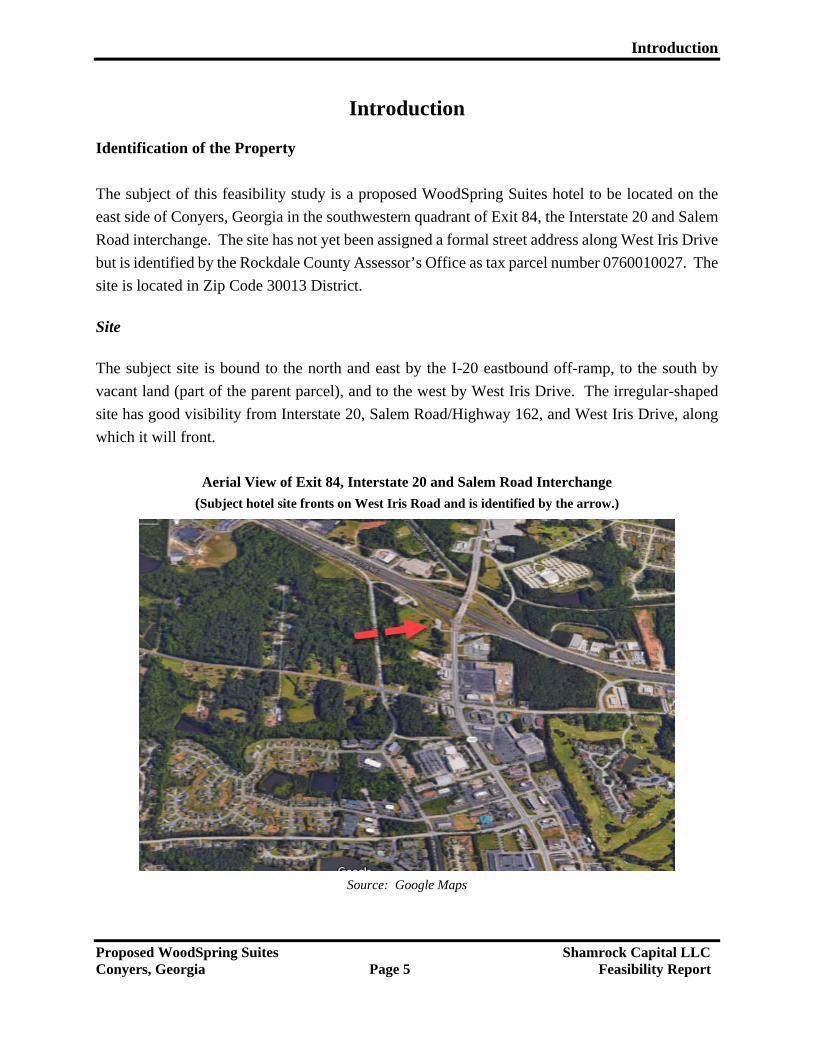
The proposed subject hotel site reportedly will consist of a 3.2-acre parcel of land which, according
to the developers, will be subdivided from the 10.539-acre parent parcel of land depicted below.
Survey of the Subject Site’s Parent Parcel
Source: Patrick & Associates Consulting Engineers
The site is level and at street grade with no apparent drainage problems. Access will be from the
northeast via a two-way curb cut along the West Iris Drive spur. Overall, the physical
characteristics of the site are suitable for development.
Introduction
Proposed WoodSpring Suites Shamrock Capital LLC Conyers, Georgia Page 7 Feasibility Report
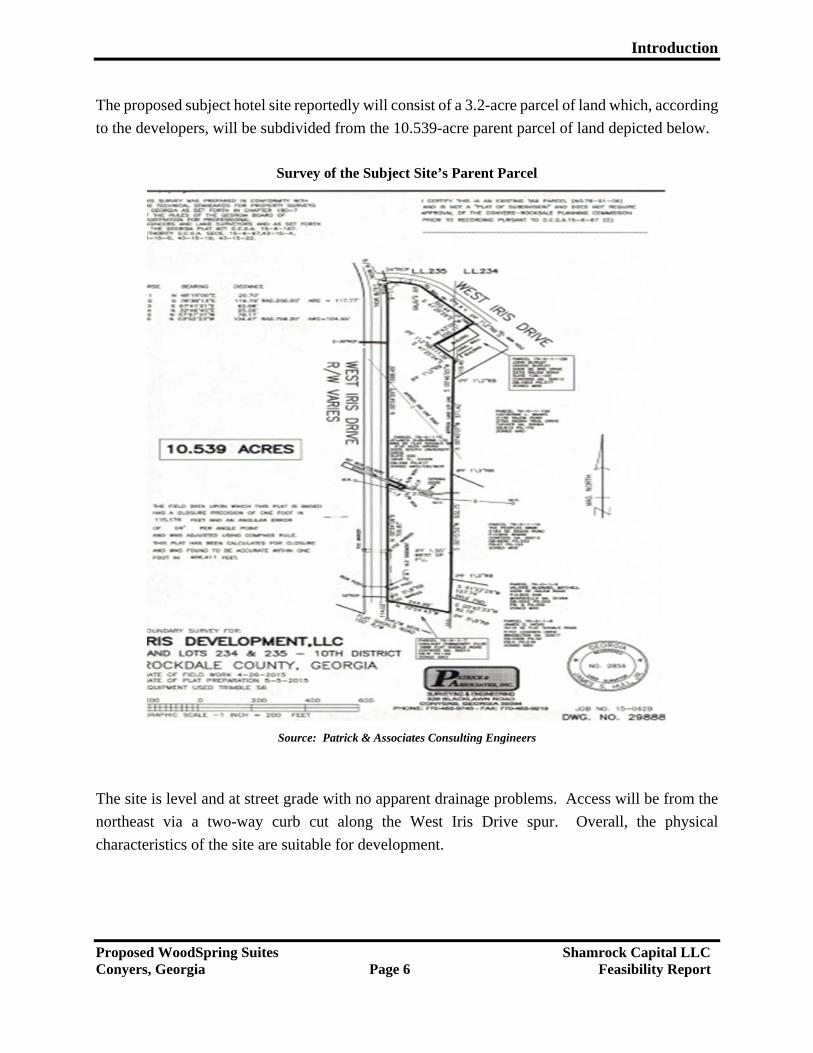
Site Plan
Source: Developers
Improvements
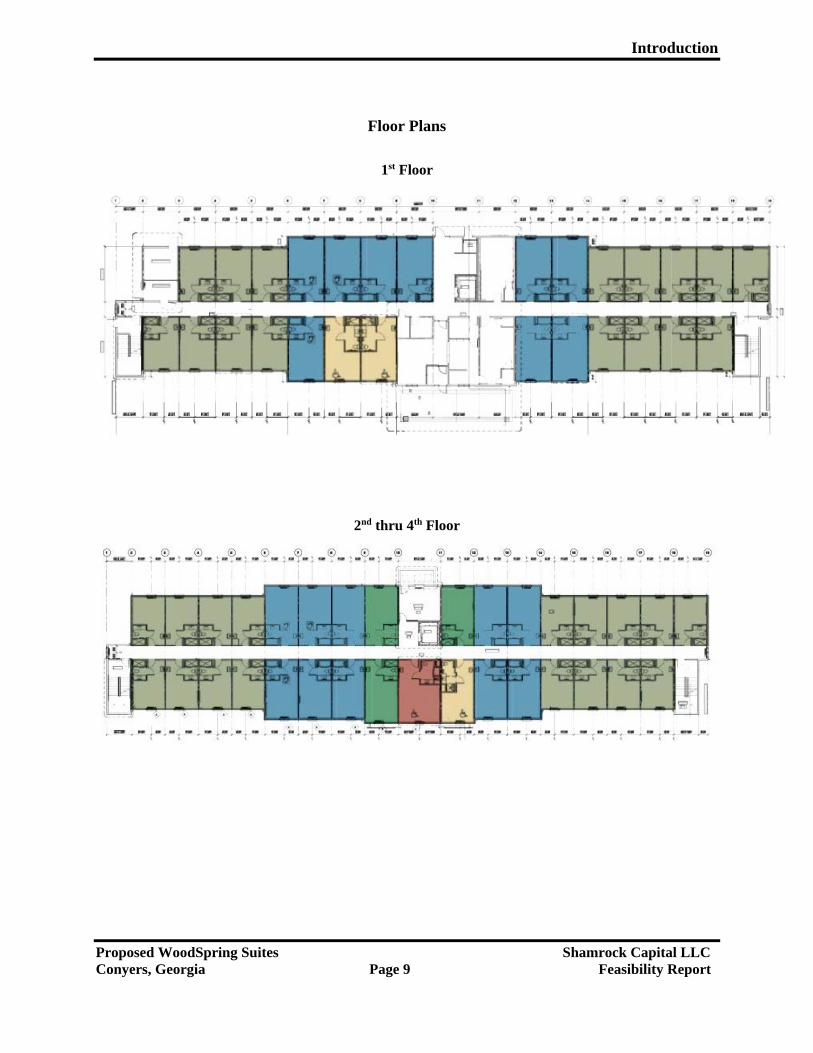
Our research indicates that the proposed 124-room, 4-story, interior-corridor, extended-stay hotel
would be suitable for the market. WoodSpring Suites typically is positioned in the market as an
economy-priced extended-stay hotel. The proposed prototype design will offer a guest laundry
facility and an assumed mix of 78 studios, 40 studio doubles and 6 studio sleepers (pull-out sofas)
with full-size refrigerators, microwaves, and stove-top heating elements. It is noted that two rooms
will be designated for two unspecified employees to provide on-site management and a security
presence, and therefore will be excluded from the subject’s rentable inventory.
Introduction
Proposed WoodSpring Suites Shamrock Capital LLC Conyers, Georgia Page 8 Feasibility Report
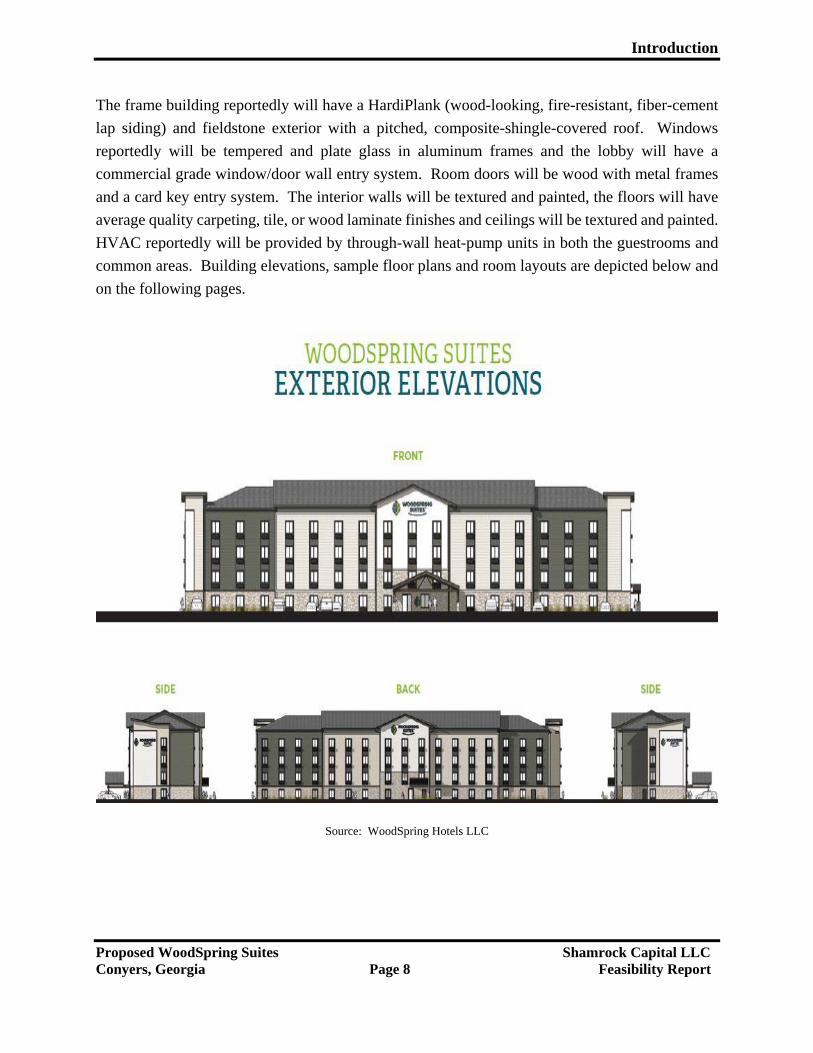
The frame building reportedly will have a HardiPlank (wood-looking, fire-resistant, fiber-cement
lap siding) and fieldstone exterior with a pitched, composite-shingle-covered roof. Windows
reportedly will be tempered and plate glass in aluminum frames and the lobby will have a
commercial grade window/door wall entry system. Room doors will be wood with metal frames
and a card key entry system. The interior walls will be textured and painted, the floors will have
average quality carpeting, tile, or wood laminate finishes and ceilings will be textured and painted.
HVAC reportedly will be provided by through-wall heat-pump units in both the guestrooms and
common areas. Building elevations, sample floor plans and room layouts are depicted below and
on the following pages.
Source: WoodSpring Hotels LLC
Introduction
Proposed WoodSpring Suites Shamrock Capital LLC Conyers, Georgia Page 9 Feasibility Report
Floor Plans
1st Floor
2nd thru 4th Floor
Introduction
Proposed WoodSpring Suites Shamrock Capital LLC Conyers, Georgia Page 10 Feasibility Report
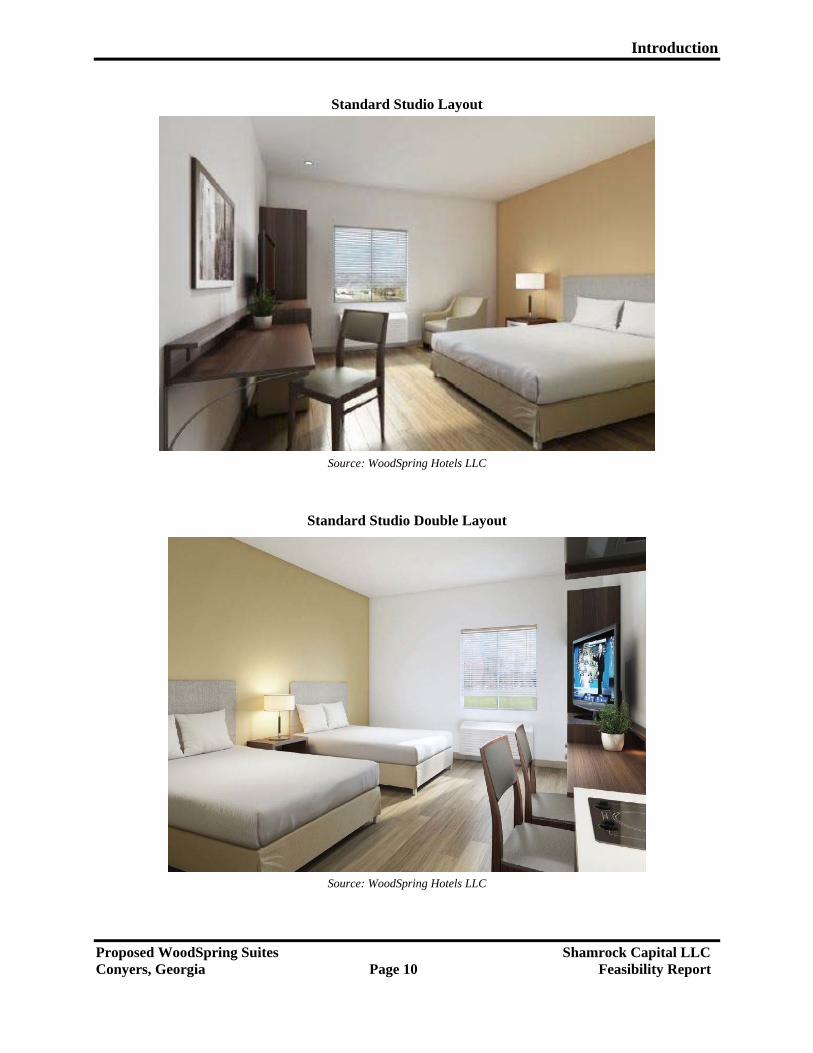
Standard Studio Layout
Source: WoodSpring Hotels LLC
Standard Studio Double Layout
Source: WoodSpring Hotels LLC
Introduction
Proposed WoodSpring Suites Shamrock Capital LLC Conyers, Georgia Page 11 Feasibility Report
Each guestroom and all public restroom areas are assumed to have adequate plumbing fixtures and
electrical supply to serve the needs of the proposed hotel’s clientele. Lighting will be provided by
LED energy-efficient fixtures in the ceilings and lamps throughout the hotel. Fire protection will
be provided by hard-wired smoke detectors and a sprinkler system. Sufficient parking will be
available onsite; hotel grounds will be adequately landscaped. The property will have exterior
wall-mounted signage consistent with brand standards and local zoning ordinances.
The subject is proposed and, according to the Marshall Valuation Service’s construction index,
will have an economic life of 45 years upon completion. For a well-maintained property, the
effective age may be considerably less than its actual age. As proposed, there do not appear to be
any reasons to make deductions in the depreciation category from a functional source. As will be
shown in the income analysis, the proposed improvements will contribute economically to the
property. Given the current market conditions, there is no evidence of economic/external
obsolescence that will negatively affect the property or diminish its value.
Client and Intended User Disclosure
The client and intended user of this feasibility study is Mountain View Hospitality LLC. Mr.
David Babatope, Member, authorized the preparation of this analysis by signing a letter of proposal
dated October 17, 2016. Any use of this report by third parties is unauthorized without the written
consent of the Client and Shamrock Capital LLC.
Client’s Intended Use Disclosure
The intent of this feasibility study is to determine the financial feasibility of the proposed extended-
stay hotel development utilizing market-derived income and expense estimates and developer-
provided construction costs for the Client’s use in internal financial analysis and decision making.
Date of Analysis
The subject market area and proposed site were most recently inspected on October 21, 2016 and
this date will serve as the effective date of our analysis. Based upon information provided by the
developer and our analysis of the market, the project is expected to be completed by January 1,
2018 and reach a stabilized level of occupancy not later than January 1, 2019.
Introduction
Proposed WoodSpring Suites Shamrock Capital LLC Conyers, Georgia Page 12 Feasibility Report
Ownership and Property History
Ownership of the parent parcel of the subject hotel site is vested in the name of Iris Development
LLC. The grantee acquired the parent property on June 22, 2015 from Atlanta Suburbia Ltd for a
disclosed amount of $280,675, as recorded in Deed Book 5719 at Page 16 in the Rockdale County
Board of Assessors’ Office.
Scope of the Feasibility Study
The scope of this feasibility study includes the investigations necessary to gather sufficient data from
which to derive an opinion of market conditions and trends, and encompasses the necessary research
and analysis to prepare a report in accordance with its intended use, the Standards of Professional
Practice of the Appraisal Institute and the Uniform Standards of Professional Appraisal Practice.
An inspection of the property and its neighborhood was conducted to determine the physical
features and condition of the subject site and the environment in which the proposed extended-
stay hotel will be located. When deemed appropriate, contacts were made with municipal
authorities (public works and utilities, zoning administration, planning, etc.) to determine
compliance or noncompliance with local, state, and federal regulations.
The subject property data is based upon information provided by the developer. Properties similar
in important key aspects to the subject were explored throughout the market area to determine
existing/proposed extended-stay and economy limited-service hotel inventory, supply-demand,
and marketability of properties within the subject’s classification. A thorough research effort was
conducted to extract market data to be used in the feasibility study. To the best of our ability, the
research, analysis and interpretation of the information in the marketplace were completed in
accordance with sound analytical principles and the opinions and conclusions are considered to be
reasonable and reliable.
Area Overview
Proposed WoodSpring Suites Shamrock Capital LLC Conyers, Georgia Page 13 Feasibility Report
Area Overview
This analysis summarizes important demographic trends that influence real estate values in a
defined area. This analysis attempts to highlight important facets of the area economy and
illustrates past, current and future growth trends. The general area has first been studied to gain
an insight from a macro level, and then the market area has been studied with regards to
surrounding land uses and growth patterns.
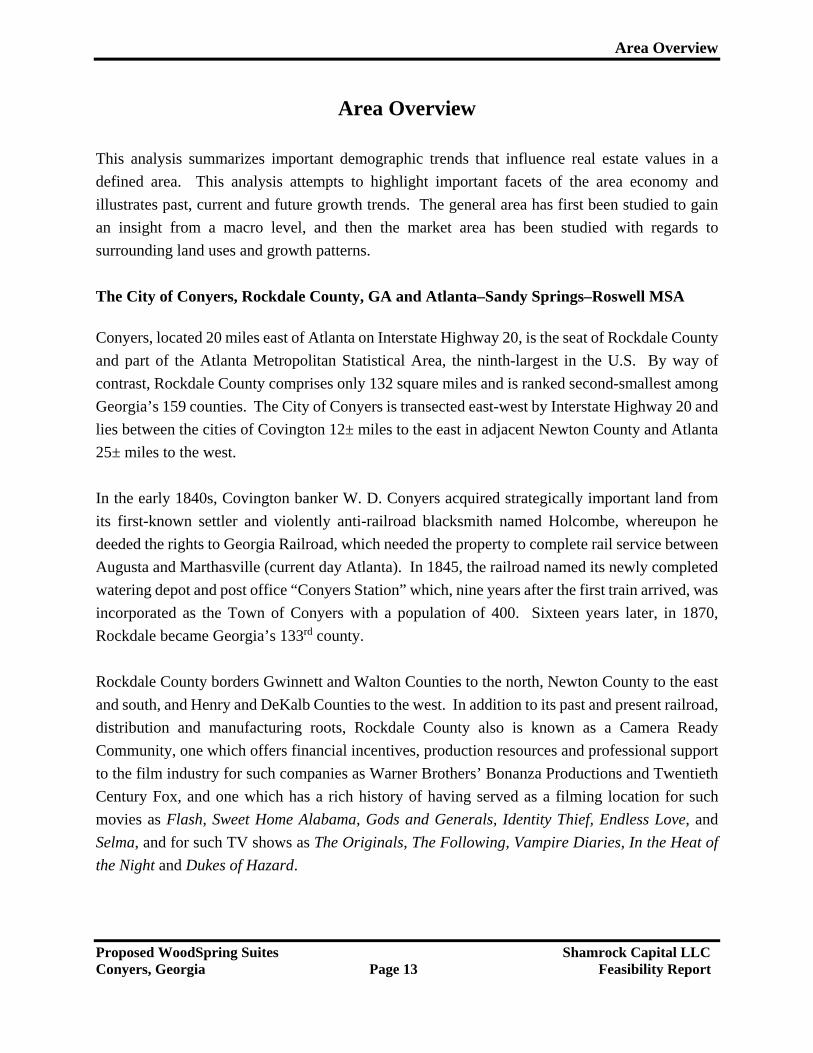
The City of Conyers, Rockdale County, GA and Atlanta–Sandy Springs–Roswell MSA
Conyers, located 20 miles east of Atlanta on Interstate Highway 20, is the seat of Rockdale County
and part of the Atlanta Metropolitan Statistical Area, the ninth-largest in the U.S. By way of
contrast, Rockdale County comprises only 132 square miles and is ranked second-smallest among
Georgia’s 159 counties. The City of Conyers is transected east-west by Interstate Highway 20 and
lies between the cities of Covington 12± miles to the east in adjacent Newton County and Atlanta
25± miles to the west.
In the early 1840s, Covington banker W. D. Conyers acquired strategically important land from
its first-known settler and violently anti-railroad blacksmith named Holcombe, whereupon he
deeded the rights to Georgia Railroad, which needed the property to complete rail service between
Augusta and Marthasville (current day Atlanta). In 1845, the railroad named its newly completed
watering depot and post office “Conyers Station” which, nine years after the first train arrived, was
incorporated as the Town of Conyers with a population of 400. Sixteen years later, in 1870,
Rockdale became Georgia’s 133rd county.
Rockdale County borders Gwinnett and Walton Counties to the north, Newton County to the east
and south, and Henry and DeKalb Counties to the west. In addition to its past and present railroad,
distribution and manufacturing roots, Rockdale County also is known as a Camera Ready
Community, one which offers financial incentives, production resources and professional support
to the film industry for such companies as Warner Brothers’ Bonanza Productions and Twentieth
Century Fox, and one which has a rich history of having served as a filming location for such
movies as Flash, Sweet Home Alabama, Gods and Generals, Identity Thief, Endless Love, and
Selma, and for such TV shows as The Originals, The Following, Vampire Diaries, In the Heat of
the Night and Dukes of Hazard.
Area Overview
Proposed WoodSpring Suites Shamrock Capital LLC Conyers, Georgia Page 14 Feasibility Report
Area Overview
Proposed WoodSpring Suites Shamrock Capital LLC Conyers, Georgia Page 15 Feasibility Report
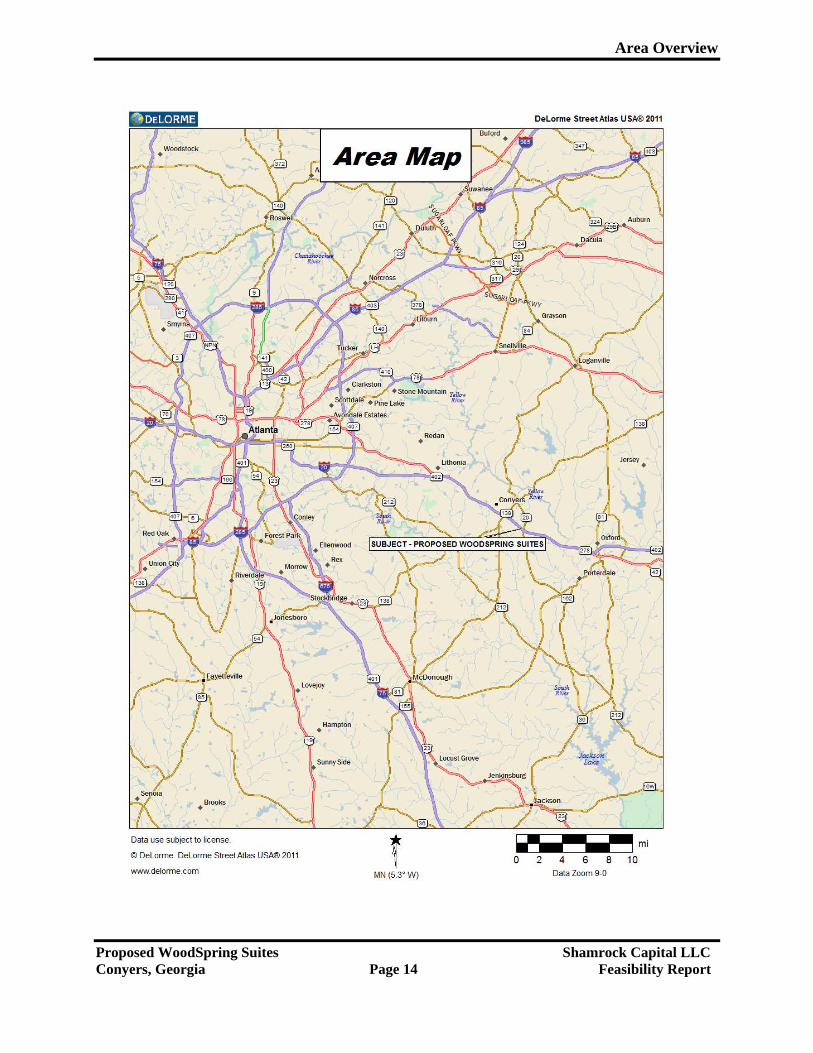
Population/Demographics
In 2015, the population in Rockdale County 88,856. Between 2000 and 2015, the City of Conyers’
population grew at an average annual compound rate of 2.9%, most of which growth occurred
prior to the moratorium on still in effect. The civilian labor force in 2015 was 42,777 with a
participation rate of 65%. Of individuals 25 to 64 in Rockdale County, 27% have a bachelor’s
degree or higher, compared with 27.6% in the U.S. In 2015, the median age, household income,
and house value in Rockdale County household income were 36.9 years, $52,341 and $143,900,
respectively.
According to the 2016 Atlanta Regional Commission (ARC) forecast, the 20-county Atlanta region
will add 2.5 million people by 2040. The region’s core counties of Gwinnett, Fulton, Cobb and
DeKalb will continue to have the most people, but metro Atlanta’s outlying counties, such as
Rockdale, will grow at faster rates.
Population Percent Change: 2010 to 2015 and Compound Annual Growth 2000 to 2015
Area 2000 2010 2015 % Change CAGR-15
Conyers 10,689 15,689 15,875 +4.5% 2.9%
Rockdale County 70,111 85,215 88,856 +4.3% 1.7%
Georgia 8,186,453 9,687,653 10,214,860 +5.4% 1.6%
Sources: U.S. Bureau of Census and Chmura Economics and Analytics, 2016
Transportation
Conyers benefits from the infrastructure of Atlanta and has become a transportation and
distribution hub due to its immediate rail and Interstate Highway 20 access. Conyers has access
the Atlanta International Airport less than one hour west and a deep-water shipping port in
Savannah 4-to-5 hours southeast via interstate highways and freight rail lines.
By Road - With a network of freeways that radiate out from the city of Atlanta, automobiles are
the dominant mode of transportation in the region.
Area Overview
Proposed WoodSpring Suites Shamrock Capital LLC Conyers, Georgia Page 16 Feasibility Report
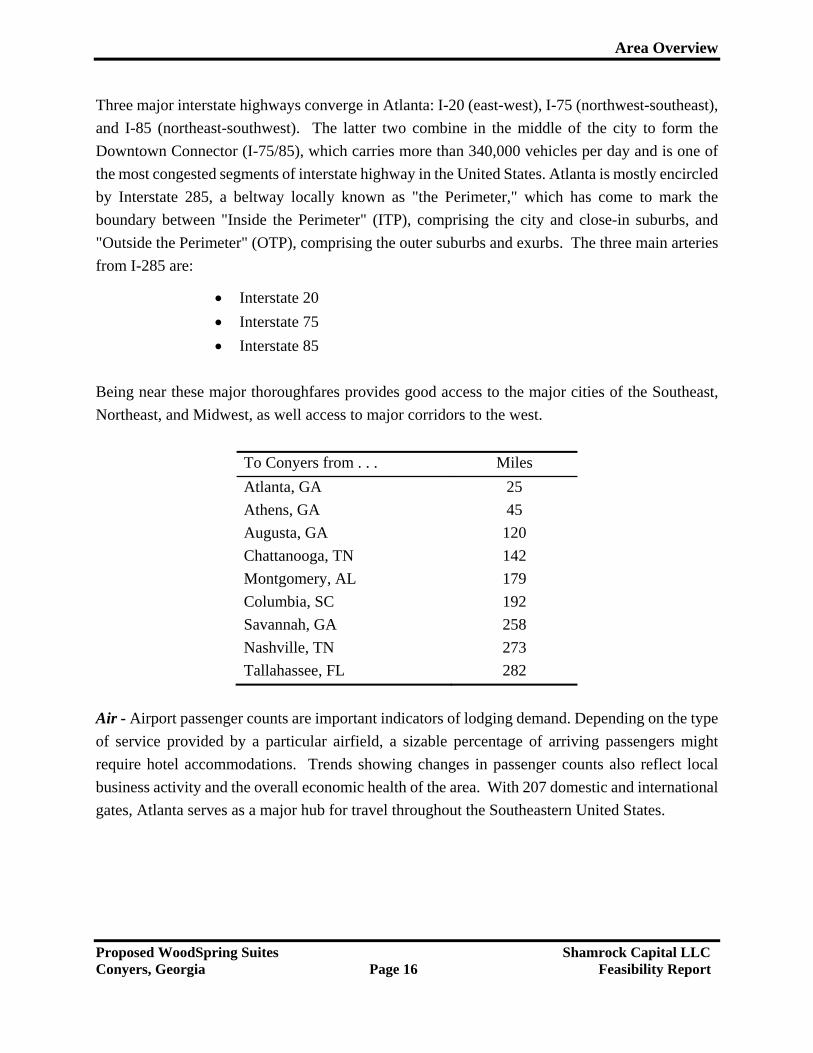
Three major interstate highways converge in Atlanta: I-20 (east-west), I-75 (northwest-southeast),
and I-85 (northeast-southwest). The latter two combine in the middle of the city to form the
Downtown Connector (I-75/85), which carries more than 340,000 vehicles per day and is one of
the most congested segments of interstate highway in the United States. Atlanta is mostly encircled
by Interstate 285, a beltway locally known as "the Perimeter," which has come to mark the
boundary between "Inside the Perimeter" (ITP), comprising the city and close-in suburbs, and
"Outside the Perimeter" (OTP), comprising the outer suburbs and exurbs. The three main arteries
from I-285 are:
Interstate 20
Interstate 75
Interstate 85
Being near these major thoroughfares provides good access to the major cities of the Southeast,
Northeast, and Midwest, as well access to major corridors to the west.
To Conyers from . . . Miles
Atlanta, GA 25
Athens, GA 45
Augusta, GA 120
Chattanooga, TN 142
Montgomery, AL 179
Columbia, SC 192
Savannah, GA 258
Nashville, TN 273
Tallahassee, FL 282
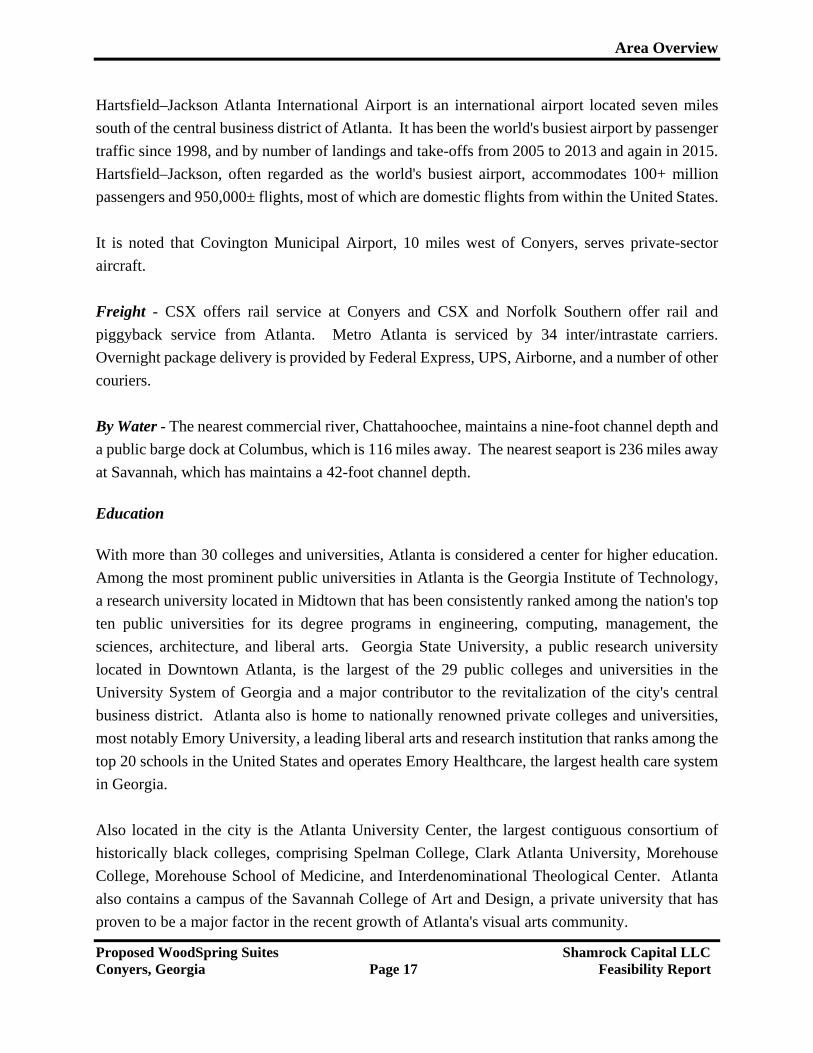
Air - Airport passenger counts are important indicators of lodging demand. Depending on the type
of service provided by a particular airfield, a sizable percentage of arriving passengers might
require hotel accommodations. Trends showing changes in passenger counts also reflect local
business activity and the overall economic health of the area. With 207 domestic and international
gates, Atlanta serves as a major hub for travel throughout the Southeastern United States.
Area Overview
Proposed WoodSpring Suites Shamrock Capital LLC Conyers, Georgia Page 17 Feasibility Report
Hartsfield–Jackson Atlanta International Airport is an international airport located seven miles
south of the central business district of Atlanta. It has been the world's busiest airport by passenger
traffic since 1998, and by number of landings and take-offs from 2005 to 2013 and again in 2015.
Hartsfield–Jackson, often regarded as the world's busiest airport, accommodates 100+ million
passengers and 950,000± flights, most of which are domestic flights from within the United States.
It is noted that Covington Municipal Airport, 10 miles west of Conyers, serves private-sector
aircraft.
Freight - CSX offers rail service at Conyers and CSX and Norfolk Southern offer rail and
piggyback service from Atlanta. Metro Atlanta is serviced by 34 inter/intrastate carriers.
Overnight package delivery is provided by Federal Express, UPS, Airborne, and a number of other
couriers.
By Water - The nearest commercial river, Chattahoochee, maintains a nine-foot channel depth and
a public barge dock at Columbus, which is 116 miles away. The nearest seaport is 236 miles away
at Savannah, which has maintains a 42-foot channel depth.
Education
With more than 30 colleges and universities, Atlanta is considered a center for higher education.
Among the most prominent public universities in Atlanta is the Georgia Institute of Technology,
a research university located in Midtown that has been consistently ranked among the nation's top
ten public universities for its degree programs in engineering, computing, management, the
sciences, architecture, and liberal arts. Georgia State University, a public research university
located in Downtown Atlanta, is the largest of the 29 public colleges and universities in the
University System of Georgia and a major contributor to the revitalization of the city's central
business district. Atlanta also is home to nationally renowned private colleges and universities,
most notably Emory University, a leading liberal arts and research institution that ranks among the
top 20 schools in the United States and operates Emory Healthcare, the largest health care system
in Georgia.
Also located in the city is the Atlanta University Center, the largest contiguous consortium of
historically black colleges, comprising Spelman College, Clark Atlanta University, Morehouse
College, Morehouse School of Medicine, and Interdenominational Theological Center. Atlanta
also contains a campus of the Savannah College of Art and Design, a private university that has
proven to be a major factor in the recent growth of Atlanta's visual arts community.
Area Overview
Proposed WoodSpring Suites Shamrock Capital LLC Conyers, Georgia Page 18 Feasibility Report
Health Services
Atlanta is the health service hub of the region for specialized care. The following local hospitals and facilities provide routine and emergency care.
Rockdale Healthcare Center
Multi-Care Holistic Health Center
Mercy Heart Clinic
Central Home Health Care an Amidases Company
Rockdale Medical Center
Economy
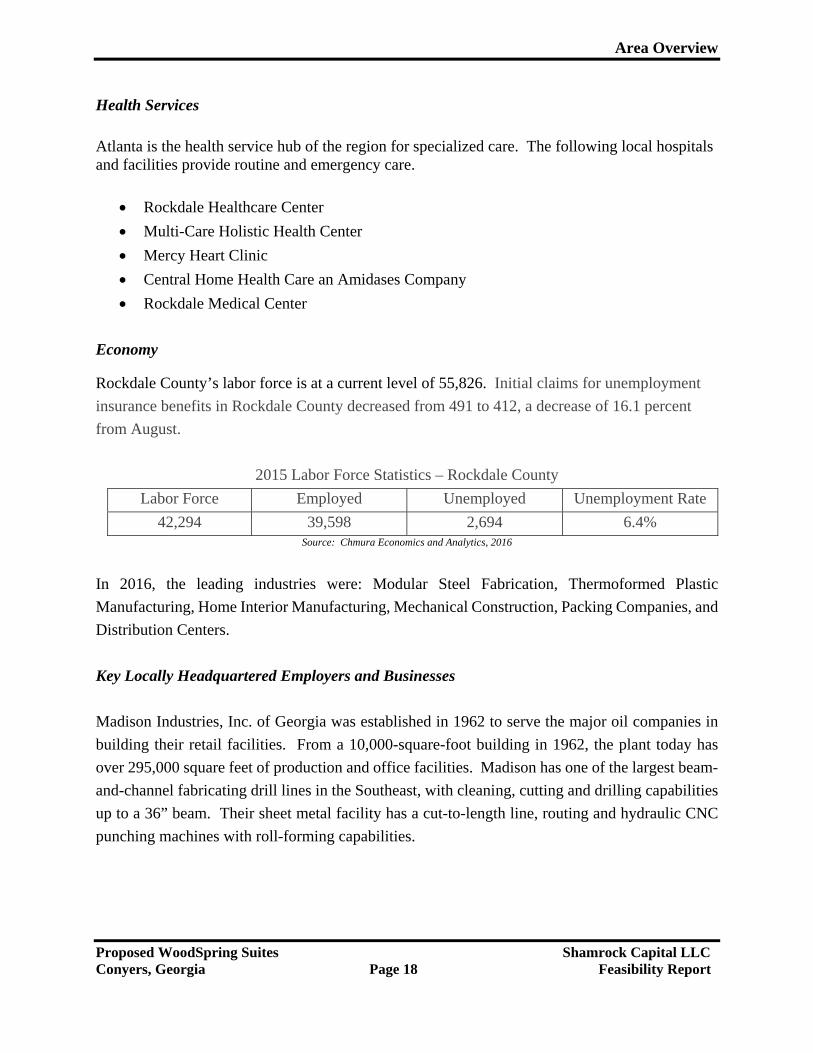
Rockdale County’s labor force is at a current level of 55,826. Initial claims for unemployment
insurance benefits in Rockdale County decreased from 491 to 412, a decrease of 16.1 percent
from August.
2015 Labor Force Statistics – Rockdale County
Labor Force Employed Unemployed Unemployment Rate
42,294 39,598 2,694 6.4% Source: Chmura Economics and Analytics, 2016
In 2016, the leading industries were: Modular Steel Fabrication, Thermoformed Plastic
Manufacturing, Home Interior Manufacturing, Mechanical Construction, Packing Companies, and
Distribution Centers.
Key Locally Headquartered Employers and Businesses
Madison Industries, Inc. of Georgia was established in 1962 to serve the major oil companies in
building their retail facilities. From a 10,000-square-foot building in 1962, the plant today has
over 295,000 square feet of production and office facilities. Madison has one of the largest beam-
and-channel fabricating drill lines in the Southeast, with cleaning, cutting and drilling capabilities
up to a 36” beam. Their sheet metal facility has a cut-to-length line, routing and hydraulic CNC
punching machines with roll-forming capabilities.
Area Overview
Proposed WoodSpring Suites Shamrock Capital LLC Conyers, Georgia Page 19 Feasibility Report
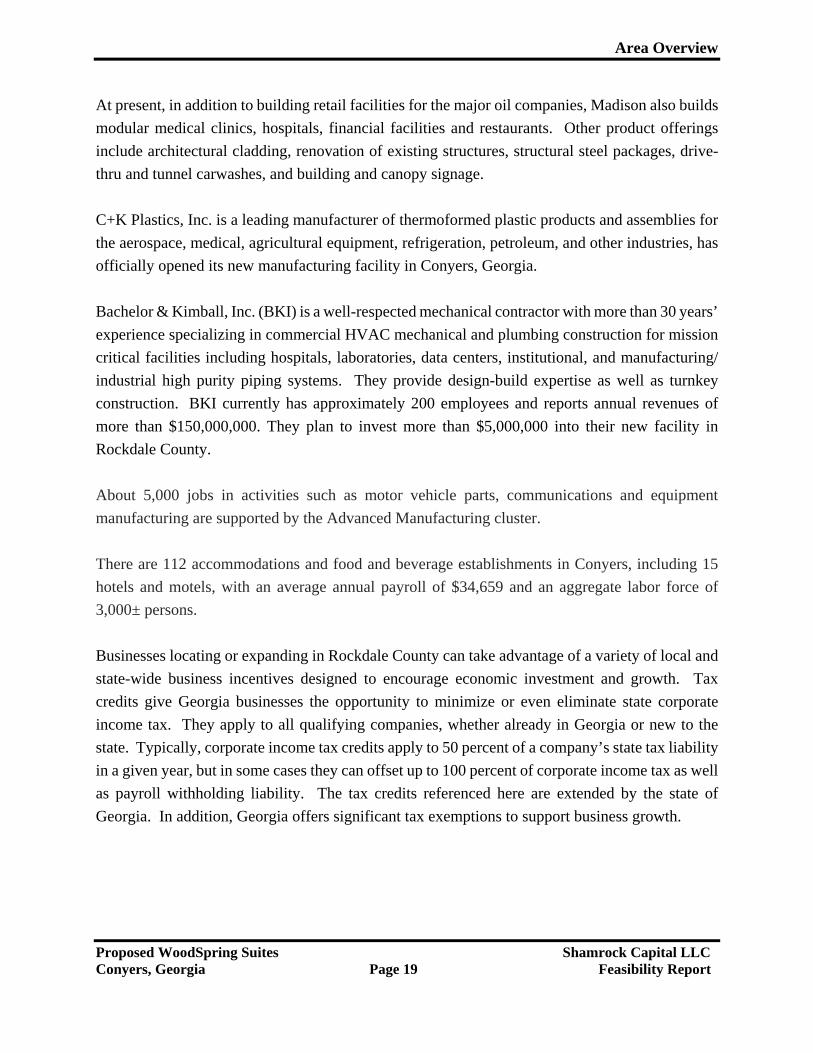
At present, in addition to building retail facilities for the major oil companies, Madison also builds
modular medical clinics, hospitals, financial facilities and restaurants. Other product offerings
include architectural cladding, renovation of existing structures, structural steel packages, drive-
thru and tunnel carwashes, and building and canopy signage.
C+K Plastics, Inc. is a leading manufacturer of thermoformed plastic products and assemblies for
the aerospace, medical, agricultural equipment, refrigeration, petroleum, and other industries, has
officially opened its new manufacturing facility in Conyers, Georgia.
Bachelor & Kimball, Inc. (BKI) is a well-respected mechanical contractor with more than 30 years’
experience specializing in commercial HVAC mechanical and plumbing construction for mission
critical facilities including hospitals, laboratories, data centers, institutional, and manufacturing/
industrial high purity piping systems. They provide design-build expertise as well as turnkey
construction. BKI currently has approximately 200 employees and reports annual revenues of
more than $150,000,000. They plan to invest more than $5,000,000 into their new facility in
Rockdale County.
About 5,000 jobs in activities such as motor vehicle parts, communications and equipment
manufacturing are supported by the Advanced Manufacturing cluster.
There are 112 accommodations and food and beverage establishments in Conyers, including 15
hotels and motels, with an average annual payroll of $34,659 and an aggregate labor force of
3,000± persons.
Businesses locating or expanding in Rockdale County can take advantage of a variety of local and
state-wide business incentives designed to encourage economic investment and growth. Tax
credits give Georgia businesses the opportunity to minimize or even eliminate state corporate
income tax. They apply to all qualifying companies, whether already in Georgia or new to the
state. Typically, corporate income tax credits apply to 50 percent of a company’s state tax liability
in a given year, but in some cases they can offset up to 100 percent of corporate income tax as well
as payroll withholding liability. The tax credits referenced here are extended by the state of
Georgia. In addition, Georgia offers significant tax exemptions to support business growth.
Area Overview
Proposed WoodSpring Suites Shamrock Capital LLC Conyers, Georgia Page 20 Feasibility Report
The Atlanta metropolitan area is the 10th largest metro economy in the United States by real GDP
and the largest in the South, yet living and business costs compare favorably with metro areas of
smaller size. A diverse industrial structure, strong population growth, reasonable business costs,
and high educational attainment sustain Atlanta’s growth potential above the nation’s. Also, its
status as a major transportation and logistics hub makes the metro economy an important factor
throughout the South.
Key Economic Facts
Through October 2016, year-over-year housing market trends for Conyers indicate a 7% rise in
the median sales price of homes and a 0% rise in median rent per month, suggesting there exists
minimal-to-no frictional vacancy in the Conyers market as probable tenants have secured
accommodations elsewhere, at least until the waste water treatment moratorium on new apartment
construction can be lifted (est. 2020). It is noted the Conyers-Rockdale Economic Development
Council in May 2016 indicated that the sewer and water moratorium has impacted building
permits, with fewer than 100 issued year to date.
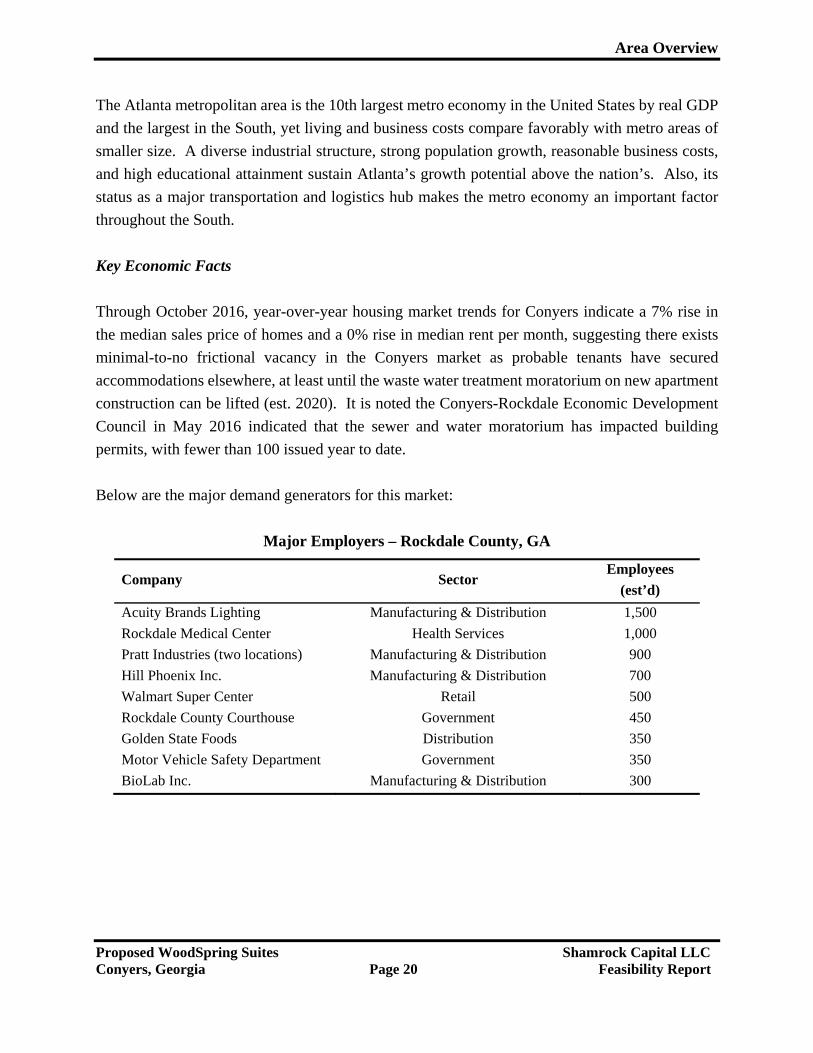
Below are the major demand generators for this market:
Major Employers – Rockdale County, GA
Company Sector Employees
(est’d)
Acuity Brands Lighting Manufacturing & Distribution 1,500
Rockdale Medical Center Health Services 1,000
Pratt Industries (two locations) Manufacturing & Distribution 900
Hill Phoenix Inc. Manufacturing & Distribution 700
Walmart Super Center Retail 500
Rockdale County Courthouse Government 450
Golden State Foods Distribution 350
Motor Vehicle Safety Department Government 350
BioLab Inc. Manufacturing & Distribution 300
Area Overview
Proposed WoodSpring Suites Shamrock Capital LLC Conyers, Georgia Page 21 Feasibility Report
Conclusion
Although Conyers is experiencing a period of moderate economic expansion due in significant
part the film industry and companies from other states relocating to the area, the sewer and water
moratorium continues to put downward pressure on growth. In addition to the film industry and
above-listed employers, the city, county and surrounding area are supported by a number of
employers and expansion projects that provide a solid foundation for the local economy, such as
the planned Baxter Pharma 1,000,000-square foot distribution center which will be completed by
2018. New development, coupled with thriving film and television production companies already
operating within the Conyers/Rockdale County market area, suggest the job and overall economic
outlook are trending positively.
Our analysis of this specific market also considers the broader context of the national economy.
The U.S. economy has experienced economic expansion during the last seven quarters, with the
most recent peak being the 3.7% growth realized in the second quarter of 2015. During the last
two quarters of 2015, growth waned, falling to a 1.0% growth rate during the fourth quarter. In
recent months, increases in personal consumption expenditures (PCE) and residential housing
were the primary factors in the net gain. PCE was up 1.3% and residential housing was up a robust
8.0%.
In the fourth quarter of 2015, both imports and exports declined slightly, and non- residential
investments also were down. U.S. economic growth is anticipated to support continued expansion
of lodging demand; however, as economic growth slows, demand growth may not be as robust in
FY 17 as in the last several years. Nevertheless, the stability in the U.S. economy is maintaining
strong interest in hotel investments by a diverse array of national and international market
participants.
Market Area
Land uses in the proposed subject’s immediate market area include light industrial, warehousing
and distribution facilities; Fieldstone Plaza Shopping Center; quick-service food venues including
Burger King, Dunkin’ Donuts, Hardee’s, McDonald’s and Wendy’s; diners and casual dining
venues including Los Bravos, Sudo Bar & Grill, Third Base Grill, Tokyo Hibachi Express, and
Waffle House; four gas station/convenience stores; a medical clinic and animal hospital; two
grocery stores; an auto dealership and auto and truck accessory and service centers.
Lodging Trends and Market Analysis
Proposed WoodSpring Suites Shamrock Capital LLC Conyers, Georgia Page 22 Feasibility Report
Lodging Trends and Market Analysis
The following analysis will examine hotel/motel supply and demand trends as well as factors that
influence the hotel investment market.
National Trends
The history of the lodging industry is characterized by periods of rapid expansion and
development, followed by periods of adjustment and recovery. The paragraphs that follow discuss
historical and current industry supply and demand, occupancy, average daily rate (ADR) and
revenue per available room (RevPAR). The principal sources for the following discussion on
national lodging industry trends and the U.S. economy include: Smith Travel Research, Hotel
News Now (STR), Pricewaterhouse Coopers, Forbes, and FocusEconomics.
Historical Industry Trends and Future Outlook
The U.S. economy expanded 2.4% in 2015, which matched 2014’s growth rate. However, Q4
GDP expansion slowed to a seasonally adjusted annualized rate of 1%, half of what it had been
the previous quarter. This slowdown is due to (1) a deceleration in domestic demand, as evidenced
by lower private consumption, higher savings, and weaker investment, and (2) a continuing drop-
off in demand for U.S.-manufactured goods attributable to a strong dollar and a slowdown in
global economic activity, a trend which is expected to continue as the Fed increases interest rates
and further strengthens the dollar. Accordingly, economists have revised their 2016 GDP forecast
downward by 0.3 percentage points to a sub-par growth rate of 2.1% year over year.
Following the recession of 2008 and 2009, hotel and resort operating fundamentals from 2010
through 2014 improved and the lodging industry experienced a notable turnaround, with the
breadth of the recovery encompassing the entire spectrum of chain-scale segments, particularly
the luxury, upper upscale and upscale segments, which include increasingly popular select-service
and lifestyle brands. During this period, rooms supply growth remained modest relative to overall
demand growth; however, in 2015 historical industry trends exhibited cautionary signs of change:
supply growth rates reached their highest level since 2011; demand growth remained healthy but
slowed significantly from 2014; occupancy and ADR growth rates decelerated; and Q2 through
Q4 2015 RevPAR growth rates slowed from record highs in 2014 and Q1 2015.
Lodging Trends and Market Analysis
Proposed WoodSpring Suites Shamrock Capital LLC Conyers, Georgia Page 23 Feasibility Report
Room Supply and Demand
On the heels of the 2008 – 2009 recession, when lodging supply growth dangerously outstripped
demand by 4.9% and 9.0%, respectively, regulators, lenders and investors responded and
construction activity slowed significantly. In 2010, the rate of lodging supply growth declined
40% versus 2009, and year over year from 2011 through 2014, supply growth rates remained
below 1%. Notably, annual supply growth is now back over 1%, ending 2015 at 1.1%, its highest
level since 2011.
Though demand growth remained healthy, it slowed noticeably from 4.5% in 2014 to 2.9% in
2015, an estimated year-over-year growth rate decrease of 28%. In 2015, transient/leisure demand
remained strong due in significant part to low oil prices, which sank to an 11-year low in
December. Conversely, group demand subsided rapidly in 2015, reflecting a year of volatility in
the stock market, which finished 2015 flat following a six-year rally. As group demand is largely
corporate driven, this decelerating rate of growth suggests belt-tightening by companies in the face
of slowing U.S. and global economies, as evidenced by declining U.S. exports stemming from a
strong dollar; lower commodity prices due to a slowdown in China’s GDP growth rate and the
weakening of commodities-dependent emerging market economies (EMEs); and a sluggish
European economy hampered by high levels of unemployment (10.7% in 2015). In 2015, the
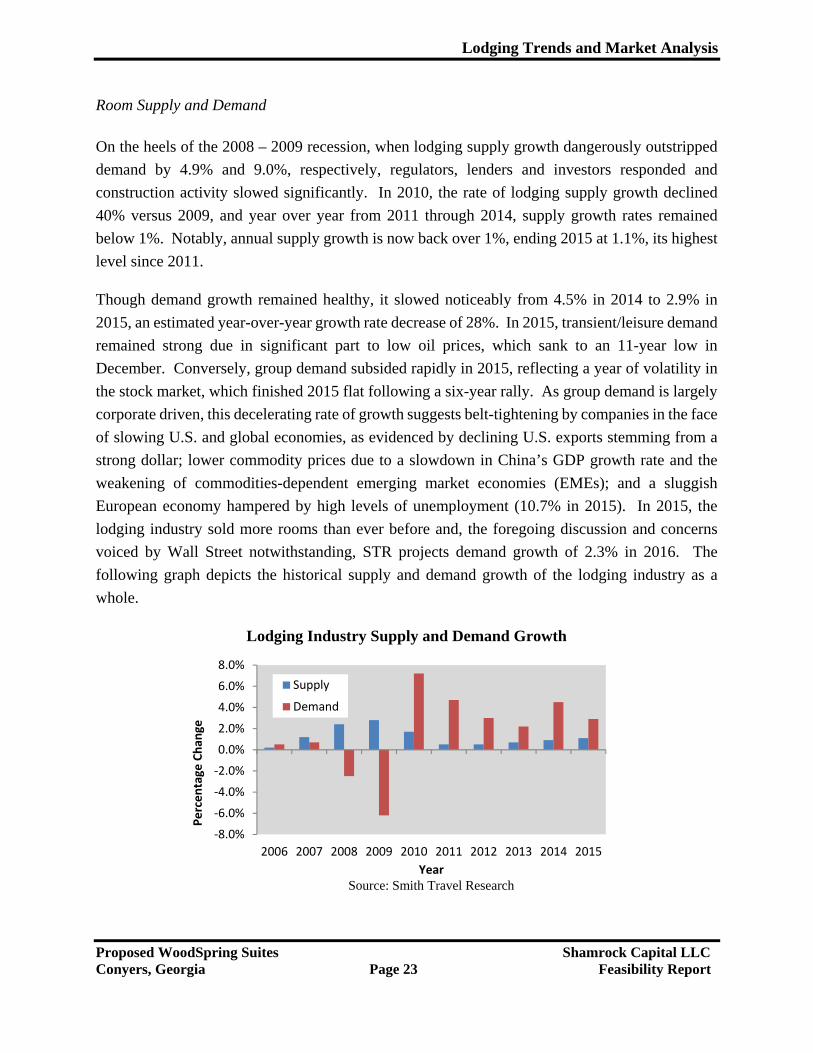
lodging industry sold more rooms than ever before and, the foregoing discussion and concerns
voiced by Wall Street notwithstanding, STR projects demand growth of 2.3% in 2016. The
following graph depicts the historical supply and demand growth of the lodging industry as a
whole.
Lodging Industry Supply and Demand Growth
‐8.0%
‐6.0%
‐4.0%
‐2.0%
0.0%
2.0%
4.0%
6.0%
8.0%
2006 2007 2008 2009 2010 2011 2012 2013 2014 2015
Percentage
Chan
ge
YearSource: Smith Travel Research
Supply
Demand
Lodging Trends and Market Analysis
Proposed WoodSpring Suites Shamrock Capital LLC Conyers, Georgia Page 24 Feasibility Report
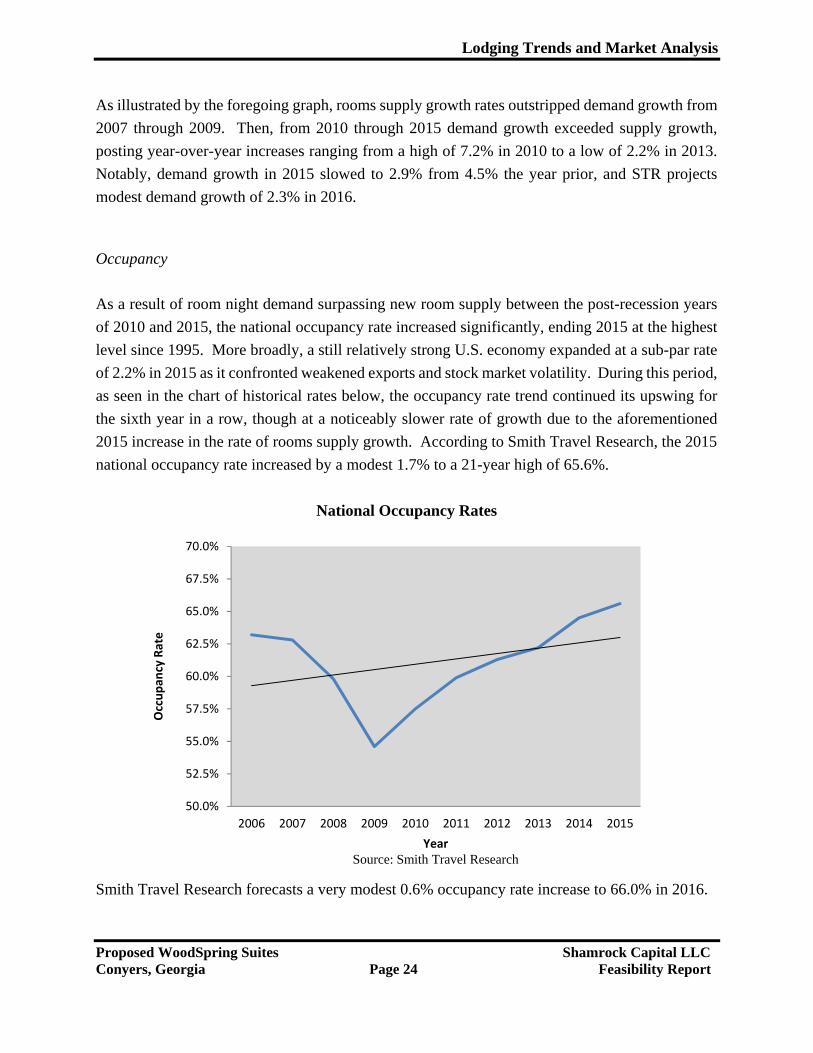
As illustrated by the foregoing graph, rooms supply growth rates outstripped demand growth from
2007 through 2009. Then, from 2010 through 2015 demand growth exceeded supply growth,
posting year-over-year increases ranging from a high of 7.2% in 2010 to a low of 2.2% in 2013.
Notably, demand growth in 2015 slowed to 2.9% from 4.5% the year prior, and STR projects
modest demand growth of 2.3% in 2016.
Occupancy
As a result of room night demand surpassing new room supply between the post-recession years
of 2010 and 2015, the national occupancy rate increased significantly, ending 2015 at the highest
level since 1995. More broadly, a still relatively strong U.S. economy expanded at a sub-par rate
of 2.2% in 2015 as it confronted weakened exports and stock market volatility. During this period,
as seen in the chart of historical rates below, the occupancy rate trend continued its upswing for
the sixth year in a row, though at a noticeably slower rate of growth due to the aforementioned
2015 increase in the rate of rooms supply growth. According to Smith Travel Research, the 2015
national occupancy rate increased by a modest 1.7% to a 21-year high of 65.6%.
National Occupancy Rates
Smith Travel Research forecasts a very modest 0.6% occupancy rate increase to 66.0% in 2016.
50.0%
52.5%
55.0%
57.5%
60.0%
62.5%
65.0%
67.5%
70.0%
2006 2007 2008 2009 2010 2011 2012 2013 2014 2015
Occupan
cy Rate
YearSource: Smith Travel Research
Lodging Trends and Market Analysis
Proposed WoodSpring Suites Shamrock Capital LLC Conyers, Georgia Page 25 Feasibility Report
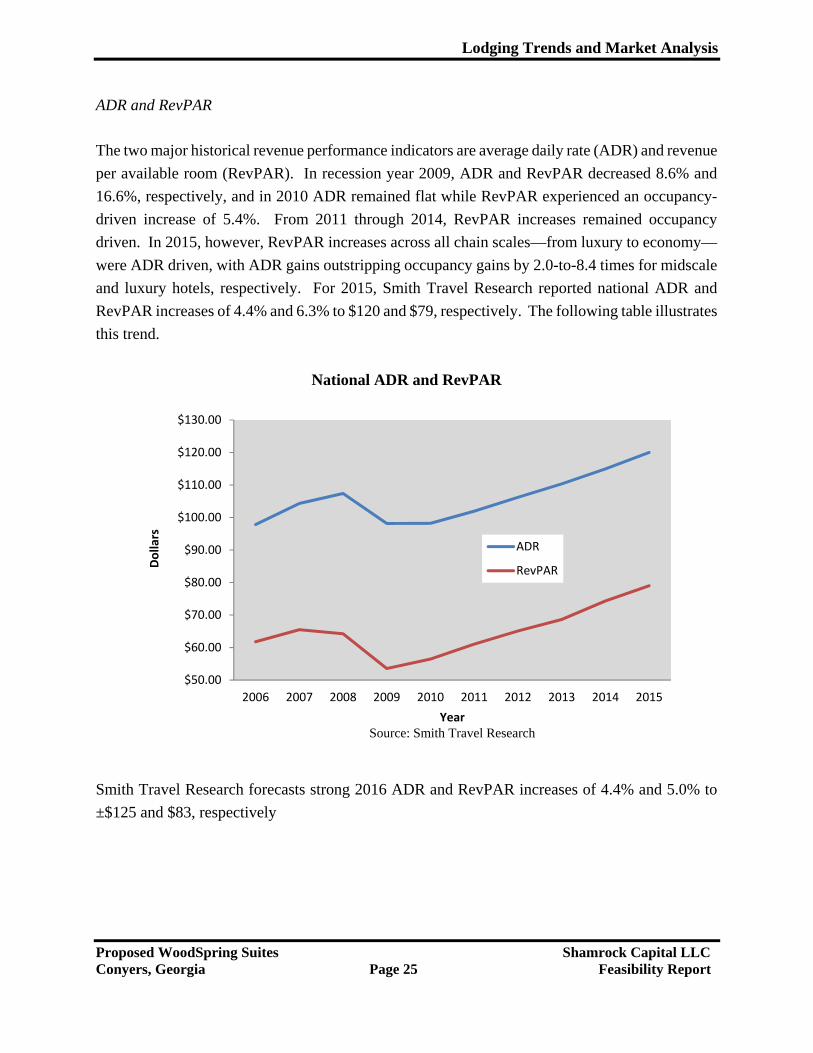
ADR and RevPAR
The two major historical revenue performance indicators are average daily rate (ADR) and revenue
per available room (RevPAR). In recession year 2009, ADR and RevPAR decreased 8.6% and
16.6%, respectively, and in 2010 ADR remained flat while RevPAR experienced an occupancy-
driven increase of 5.4%. From 2011 through 2014, RevPAR increases remained occupancy
driven. In 2015, however, RevPAR increases across all chain scales—from luxury to economy—
were ADR driven, with ADR gains outstripping occupancy gains by 2.0-to-8.4 times for midscale
and luxury hotels, respectively. For 2015, Smith Travel Research reported national ADR and
RevPAR increases of 4.4% and 6.3% to $120 and $79, respectively. The following table illustrates
this trend.
National ADR and RevPAR
Smith Travel Research forecasts strong 2016 ADR and RevPAR increases of 4.4% and 5.0% to
±$125 and $83, respectively
$50.00
$60.00
$70.00
$80.00
$90.00
$100.00
$110.00
$120.00
$130.00
2006 2007 2008 2009 2010 2011 2012 2013 2014 2015
Dollars
YearSource: Smith Travel Research
ADR
RevPAR
Lodging Trends and Market Analysis
Proposed WoodSpring Suites Shamrock Capital LLC Conyers, Georgia Page 26 Feasibility Report
Local Lodging Trends – Level II Market Analysis
The purpose of this section of the report is to give an overview of the major factors influencing the
hospitality industry in the Sacramento market area and also serves to help test the viability of the
proposed economy-extended stay hotel in light of the current supply and demand factors in the
local lodging market.
Competitive Supply Analysis To properly evaluate the competitive lodging market, several supply factors have been considered.
Historic expansion of supply is outlined so as to identify larger submarket trends, most notably
in the general classifications (Resort, Suburban, Urban, Highway, Airport, etc.).
Existing lodging facilities are reviewed to determine those most competitive with the subject.
Proposed lodging facilities are identified and assessed in terms of potential competition with
the subject.
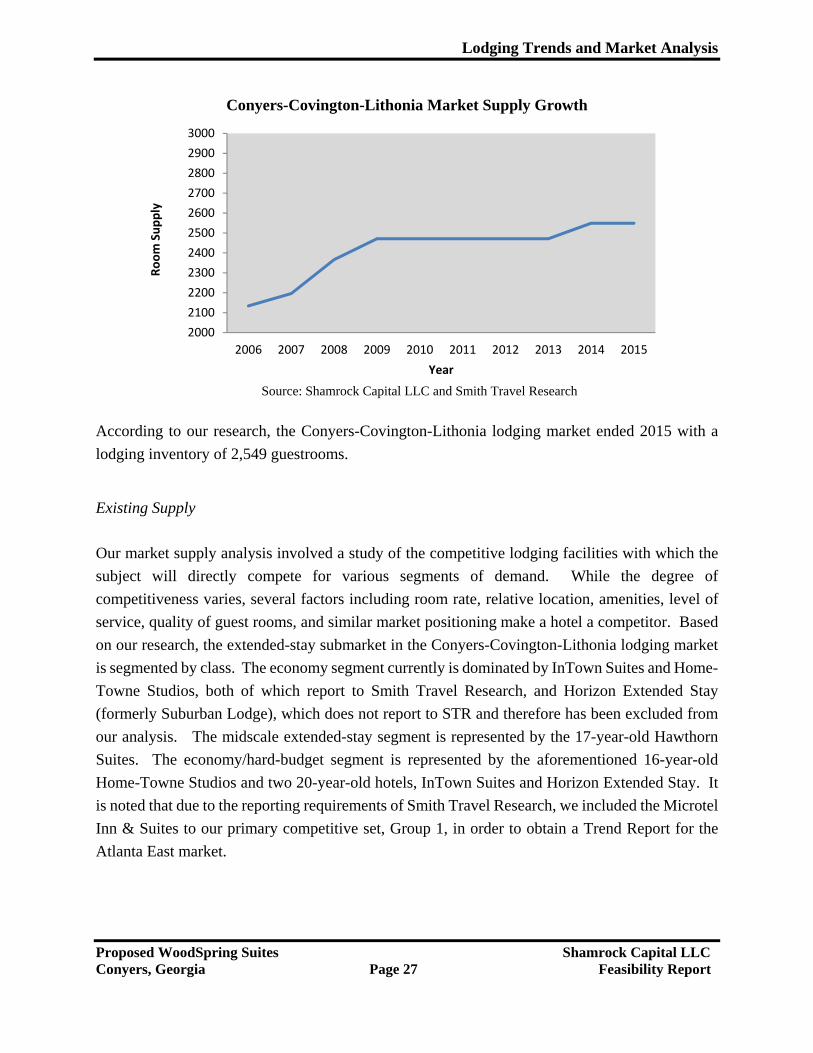
Historical Supply
Similar to many markets, the Conyers-Covington-Lithonia market increased supply before and
into “The Great Recession,” with four hotels opening immediately prior to and three hotels opening
during and immediately after the downturn in the market. Supply increased at an annual compound
average growth rate of 3.2% during the decade ending 2015. No new hotels had been added to the
market between 2009 and 2014 when the 78-room Courtyard opened in Conyers. The graph below
summarizes this market’s historical room supply from 2006 through 2015.
Lodging Trends and Market Analysis
Proposed WoodSpring Suites Shamrock Capital LLC Conyers, Georgia Page 27 Feasibility Report
Conyers-Covington-Lithonia Market Supply Growth
Source: Shamrock Capital LLC and Smith Travel Research
According to our research, the Conyers-Covington-Lithonia lodging market ended 2015 with a
lodging inventory of 2,549 guestrooms.
Existing Supply
Our market supply analysis involved a study of the competitive lodging facilities with which the
subject will directly compete for various segments of demand. While the degree of
competitiveness varies, several factors including room rate, relative location, amenities, level of
service, quality of guest rooms, and similar market positioning make a hotel a competitor. Based
on our research, the extended-stay submarket in the Conyers-Covington-Lithonia lodging market
is segmented by class. The economy segment currently is dominated by InTown Suites and Home-
Towne Studios, both of which report to Smith Travel Research, and Horizon Extended Stay
(formerly Suburban Lodge), which does not report to STR and therefore has been excluded from
our analysis. The midscale extended-stay segment is represented by the 17-year-old Hawthorn
Suites. The economy/hard-budget segment is represented by the aforementioned 16-year-old
Home-Towne Studios and two 20-year-old hotels, InTown Suites and Horizon Extended Stay. It
is noted that due to the reporting requirements of Smith Travel Research, we included the Microtel
Inn & Suites to our primary competitive set, Group 1, in order to obtain a Trend Report for the
Atlanta East market.
2000
2100
2200
2300
2400
2500
2600
2700
2800
2900
3000
2006 2007 2008 2009 2010 2011 2012 2013 2014 2015
Room Supply
Year

Lodging Trends and Market Analysis
Proposed WoodSpring Suites Shamrock Capital LLC Conyers, Georgia Page 28 Feasibility Report
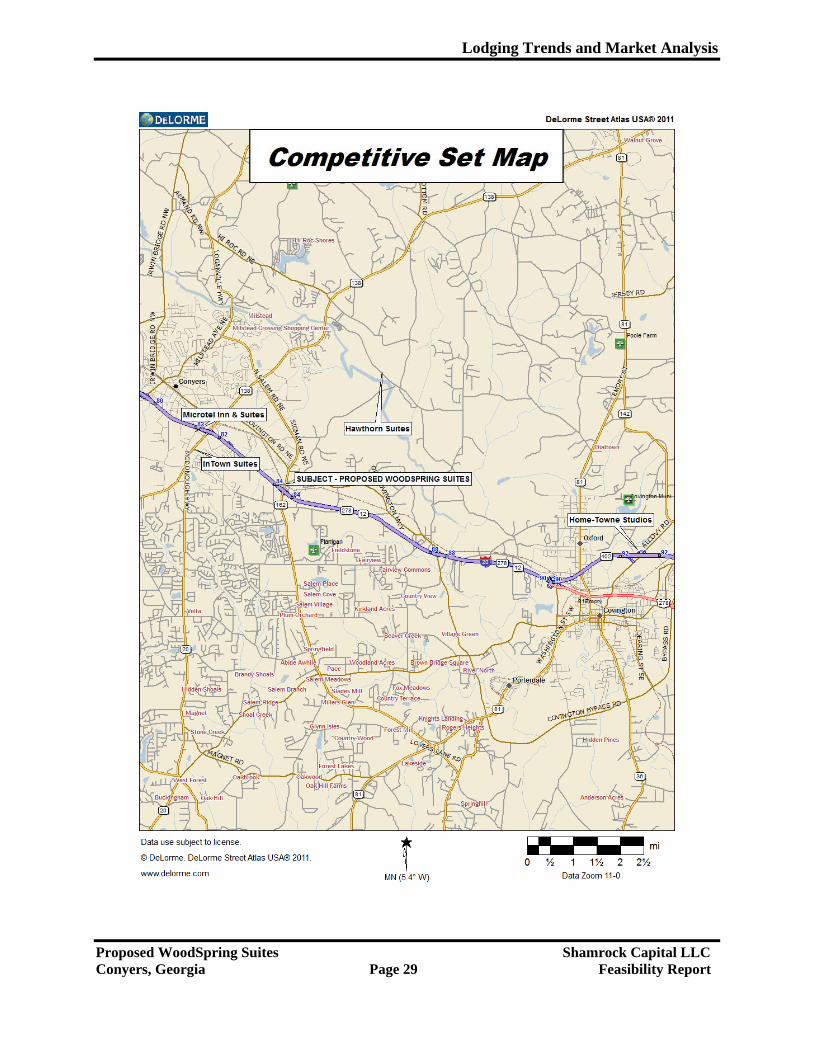
The map on the following page identifies each of the primary competitive properties in relation to
the subject’s location, followed by summary sheets with data based on our on-site interviews with
competitive property managers and other sources.
Lodging Trends and Market Analysis
Proposed WoodSpring Suites Shamrock Capital LLC Conyers, Georgia Page 29 Feasibility Report
Lodging Trends and Market Analysis
Proposed WoodSpring Suites Shamrock Capital LLC Conyers, Georgia Page 30 Feasibility Report
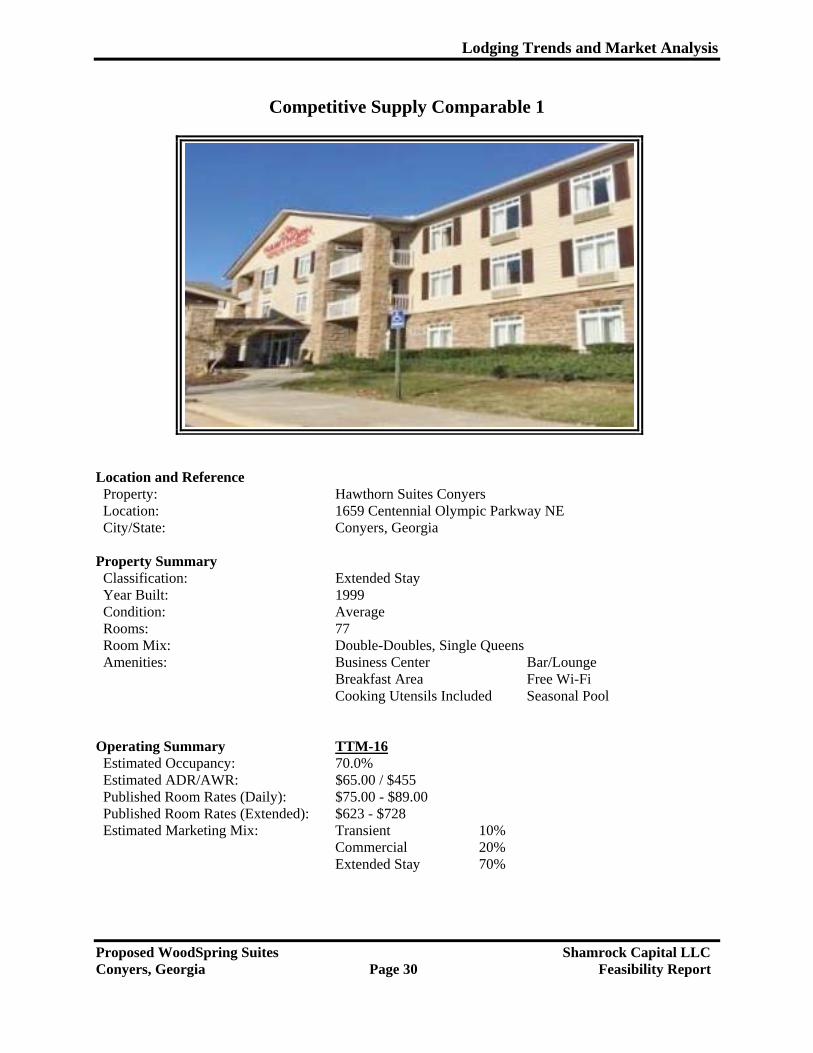
Competitive Supply Comparable 1
Location and Reference Property: Hawthorn Suites Conyers Location: 1659 Centennial Olympic Parkway NE City/State: Conyers, Georgia Property Summary Classification: Extended Stay Year Built: 1999 Condition: Average Rooms: 77 Room Mix: Double-Doubles, Single Queens Amenities: Business Center Bar/Lounge Breakfast Area Free Wi-Fi Cooking Utensils Included Seasonal Pool
Operating Summary TTM-16 Estimated Occupancy: 70.0% Estimated ADR/AWR: $65.00 / $455 Published Room Rates (Daily): $75.00 - $89.00 Published Room Rates (Extended): $623 - $728 Estimated Marketing Mix: Transient 10% Commercial 20% Extended Stay 70%
Lodging Trends and Market Analysis
Proposed WoodSpring Suites Shamrock Capital LLC Conyers, Georgia Page 31 Feasibility Report
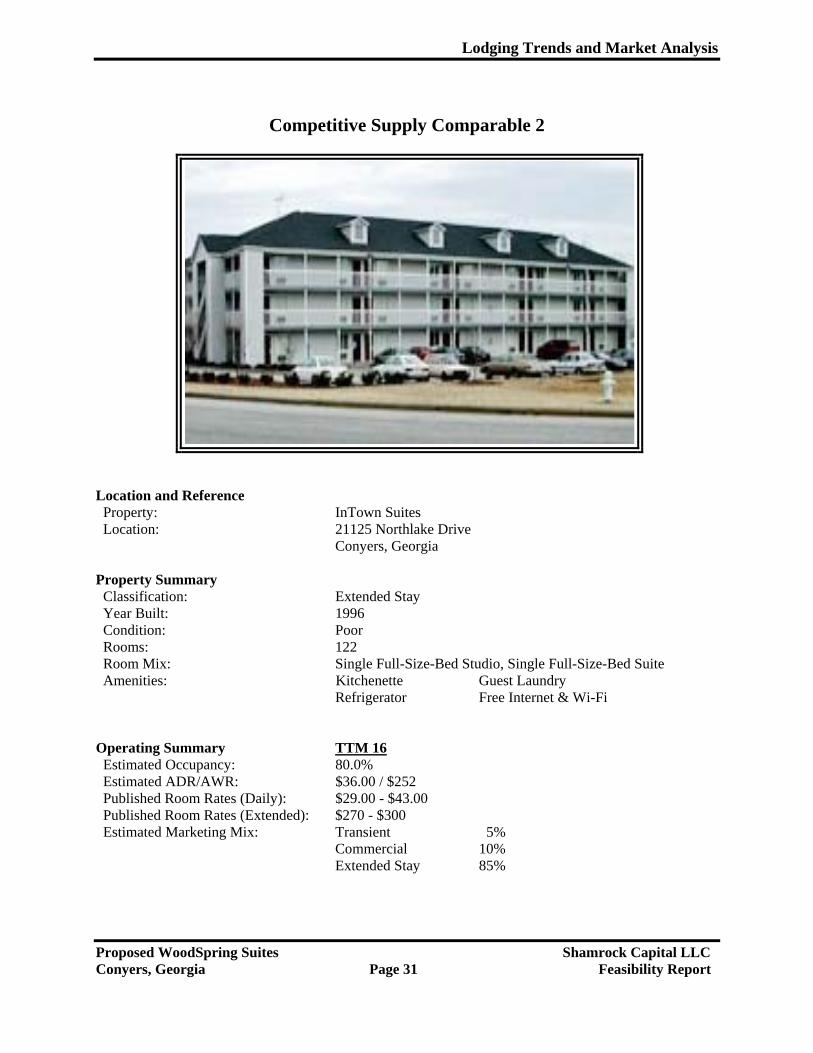
Competitive Supply Comparable 2
Location and Reference Property: InTown Suites Location: 21125 Northlake Drive
Conyers, Georgia
Property Summary Classification: Extended Stay Year Built: 1996 Condition: Poor Rooms: 122 Room Mix: Single Full-Size-Bed Studio, Single Full-Size-Bed Suite Amenities: Kitchenette Guest Laundry
Refrigerator Free Internet & Wi-Fi
Operating Summary TTM 16 Estimated Occupancy: 80.0% Estimated ADR/AWR: $36.00 / $252 Published Room Rates (Daily): $29.00 - $43.00 Published Room Rates (Extended): $270 - $300 Estimated Marketing Mix: Transient 5%
Commercial 10%Extended Stay 85%
Lodging Trends and Market Analysis
Proposed WoodSpring Suites Shamrock Capital LLC Conyers, Georgia Page 32 Feasibility Report
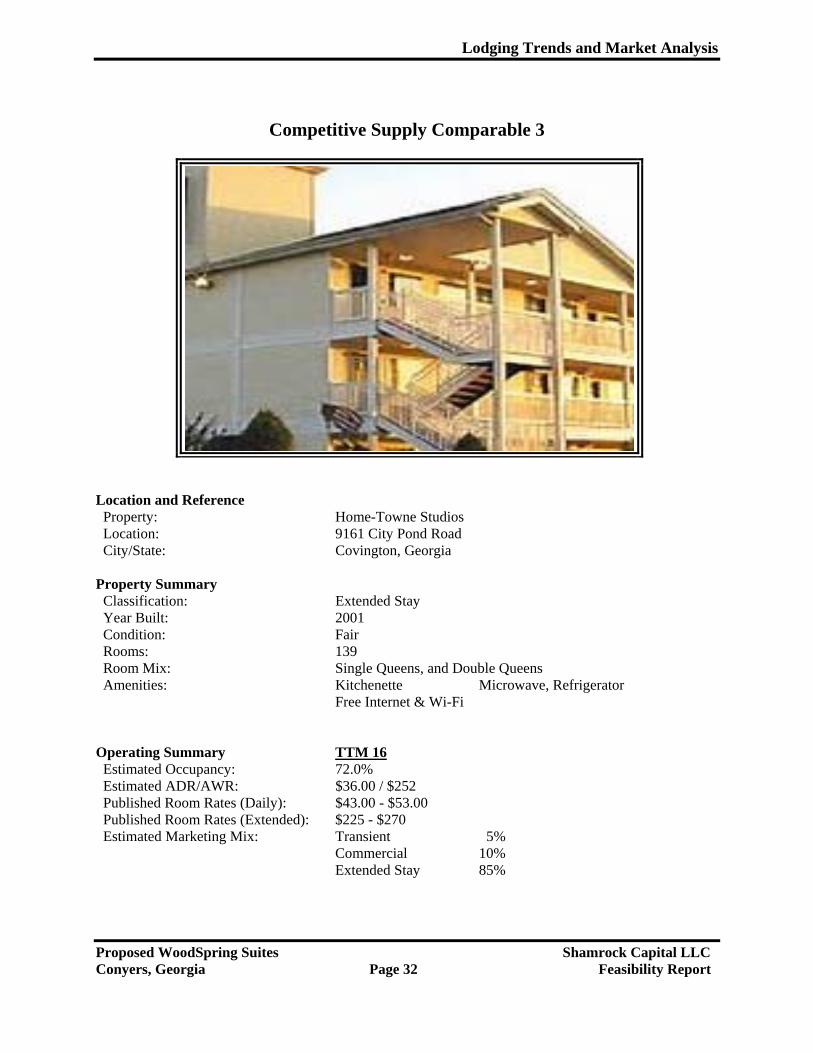
Competitive Supply Comparable 3
Location and Reference Property: Home-Towne Studios Location: 9161 City Pond Road City/State: Covington, Georgia
Property Summary Classification: Extended Stay Year Built: 2001 Condition: Fair Rooms: 139 Room Mix: Single Queens, and Double Queens Amenities: Kitchenette Microwave, Refrigerator
Free Internet & Wi-Fi
Operating Summary TTM 16 Estimated Occupancy: 72.0% Estimated ADR/AWR: $36.00 / $252 Published Room Rates (Daily): $43.00 - $53.00 Published Room Rates (Extended): $225 - $270 Estimated Marketing Mix: Transient 5%
Commercial 10%Extended Stay 85%
Lodging Trends and Market Analysis
Proposed WoodSpring Suites Shamrock Capital LLC Conyers, Georgia Page 33 Feasibility Report
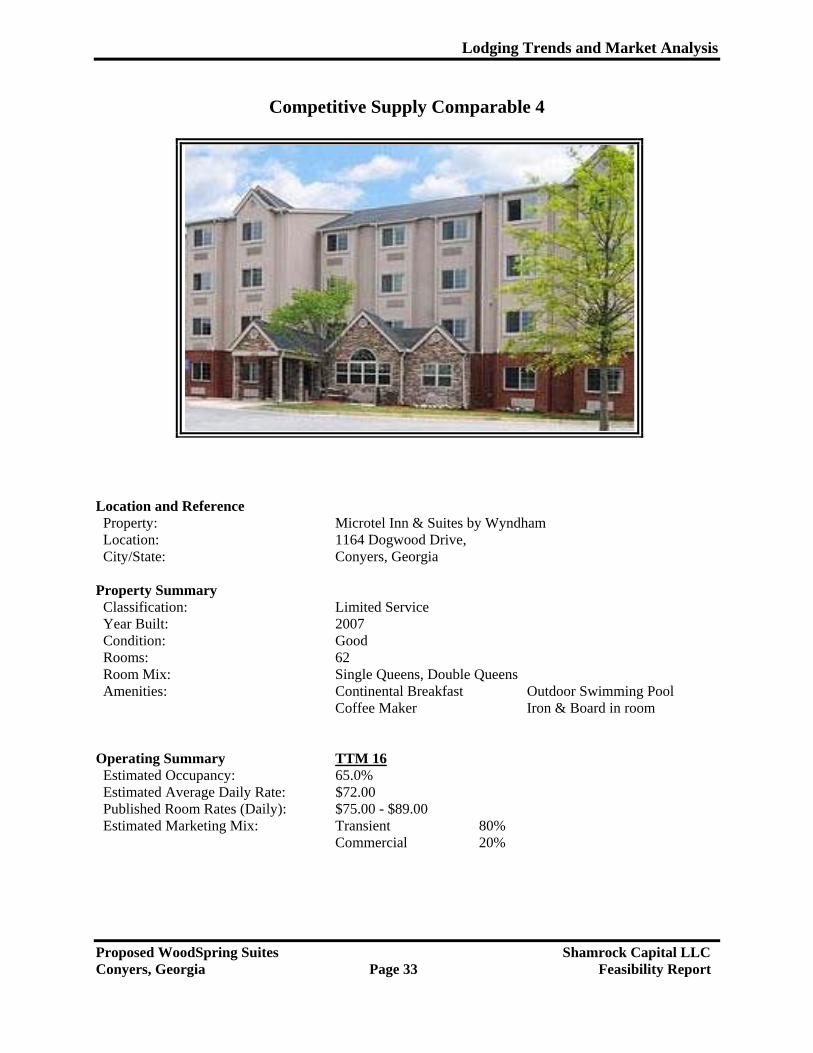
Competitive Supply Comparable 4
Location and Reference Property: Microtel Inn & Suites by Wyndham Location: 1164 Dogwood Drive, City/State: Conyers, Georgia Property Summary Classification: Limited Service Year Built: 2007 Condition: Good Rooms: 62 Room Mix: Single Queens, Double Queens Amenities: Continental Breakfast Outdoor Swimming Pool Coffee Maker Iron & Board in room
Operating Summary TTM 16 Estimated Occupancy: 65.0% Estimated Average Daily Rate: $72.00 Published Room Rates (Daily): $75.00 - $89.00 Estimated Marketing Mix: Transient 80% Commercial 20%
Lodging Trends and Market Analysis
Proposed WoodSpring Suites Shamrock Capital LLC Conyers, Georgia Page 34 Feasibility Report
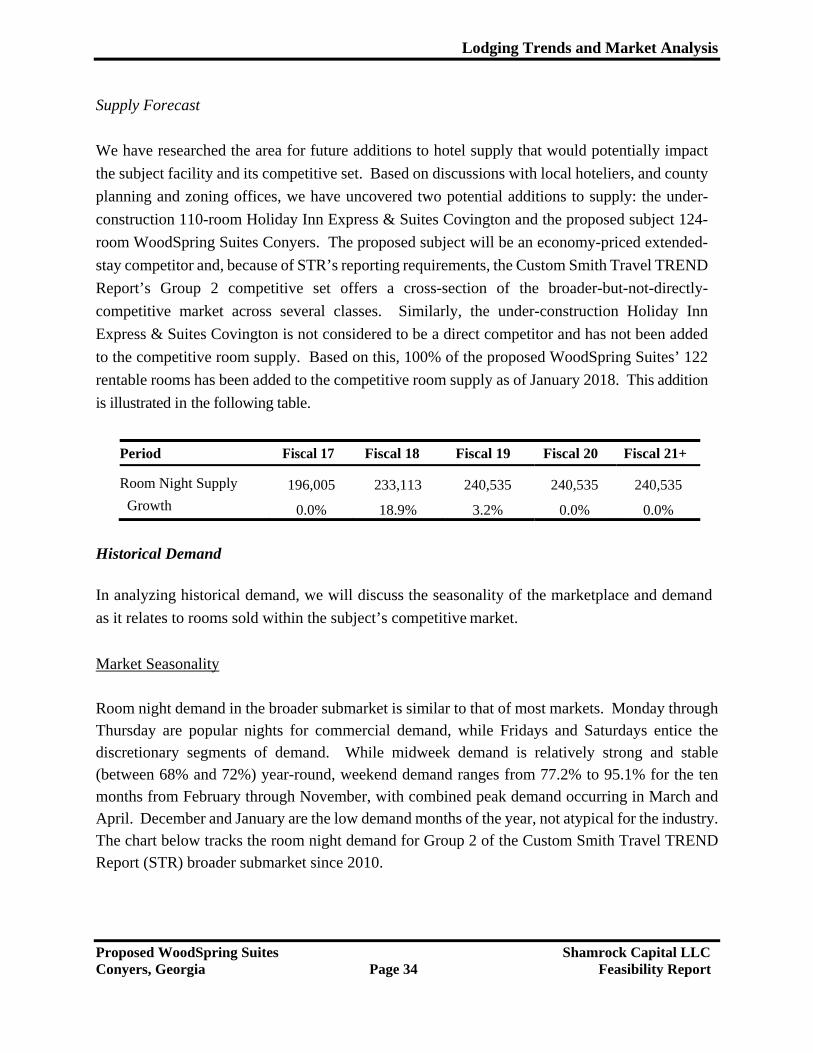
Supply Forecast
We have researched the area for future additions to hotel supply that would potentially impact
the subject facility and its competitive set. Based on discussions with local hoteliers, and county
planning and zoning offices, we have uncovered two potential additions to supply: the under-
construction 110-room Holiday Inn Express & Suites Covington and the proposed subject 124-
room WoodSpring Suites Conyers. The proposed subject will be an economy-priced extended-
stay competitor and, because of STR’s reporting requirements, the Custom Smith Travel TREND
Report’s Group 2 competitive set offers a cross-section of the broader-but-not-directly-
competitive market across several classes. Similarly, the under-construction Holiday Inn
Express & Suites Covington is not considered to be a direct competitor and has not been added
to the competitive room supply. Based on this, 100% of the proposed WoodSpring Suites’ 122
rentable rooms has been added to the competitive room supply as of January 2018. This addition
is illustrated in the following table.
Period Fiscal 17 Fiscal 18 Fiscal 19 Fiscal 20 Fiscal 21+
Room Night Supply 196,005 233,113 240,535 240,535 240,535
Growth 0.0% 18.9% 3.2% 0.0% 0.0%
Historical Demand
In analyzing historical demand, we will discuss the seasonality of the marketplace and demand
as it relates to rooms sold within the subject’s competitive market.
Market Seasonality
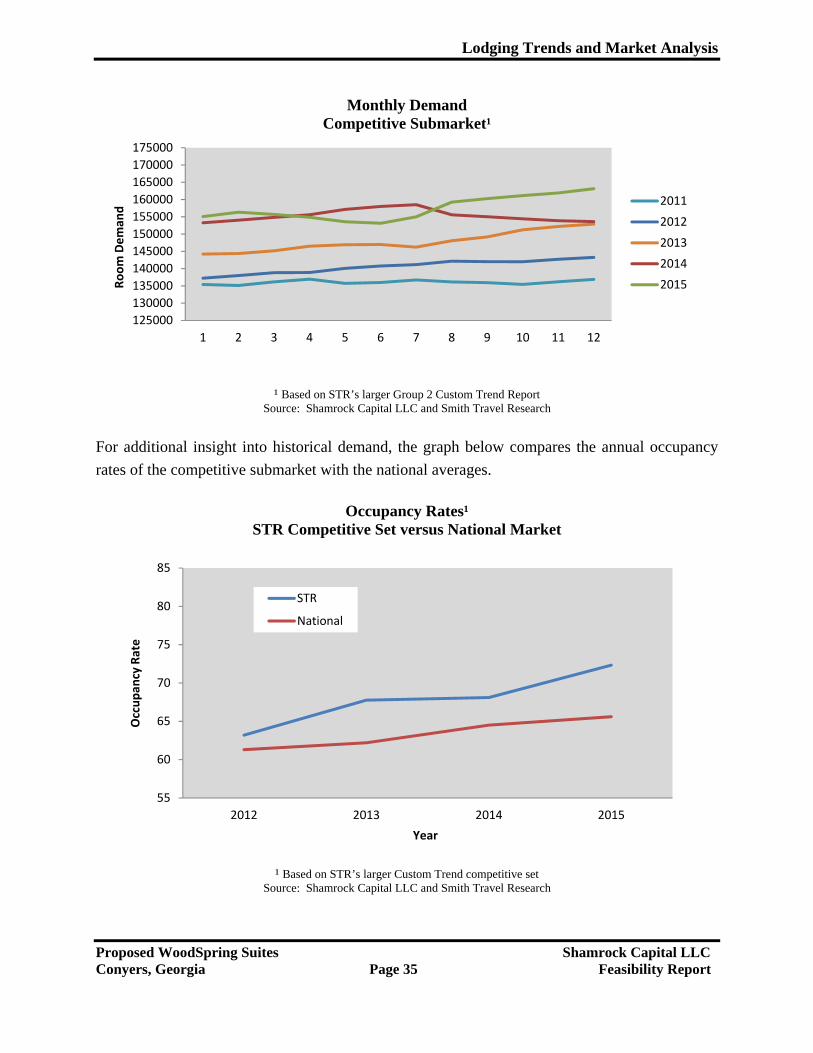
Room night demand in the broader submarket is similar to that of most markets. Monday through Thursday are popular nights for commercial demand, while Fridays and Saturdays entice the discretionary segments of demand. While midweek demand is relatively strong and stable (between 68% and 72%) year-round, weekend demand ranges from 77.2% to 95.1% for the ten months from February through November, with combined peak demand occurring in March and April. December and January are the low demand months of the year, not atypical for the industry. The chart below tracks the room night demand for Group 2 of the Custom Smith Travel TREND Report (STR) broader submarket since 2010.
Lodging Trends and Market Analysis
Proposed WoodSpring Suites Shamrock Capital LLC Conyers, Georgia Page 35 Feasibility Report
Monthly Demand Competitive Submarket¹
¹ Based on STR’s larger Group 2 Custom Trend Report
Source: Shamrock Capital LLC and Smith Travel Research
For additional insight into historical demand, the graph below compares the annual occupancy
rates of the competitive submarket with the national averages.
Occupancy Rates¹
STR Competitive Set versus National Market
¹ Based on STR’s larger Custom Trend competitive set
Source: Shamrock Capital LLC and Smith Travel Research
125000
130000
135000
140000
145000
150000
155000
160000
165000
170000
175000
1 2 3 4 5 6 7 8 9 10 11 12
Room Deman
d
2011
2012
2013
2014
2015
55
60
65
70
75
80
85
2012 2013 2014 2015
Occupan
cy Rate
Year
STR
National
Lodging Trends and Market Analysis
Proposed WoodSpring Suites Shamrock Capital LLC Conyers, Georgia Page 36 Feasibility Report
Between 2012 and 2015 the broader Group 2 STR competitive submarket’s occupancy rate increased from 63.2% to 72.3%, a strong annual compound average growth rate increase of 4.6%. The occupancy trend for the national market has increased steadily over the same timeframe being studied and has exhibited a compound growth rate of 2.3%.
Existing Demand
The following section will analyze the market’s existing demand on the basis of the competitors’
ability to penetrate the market and their existing or accommodated demand mix.
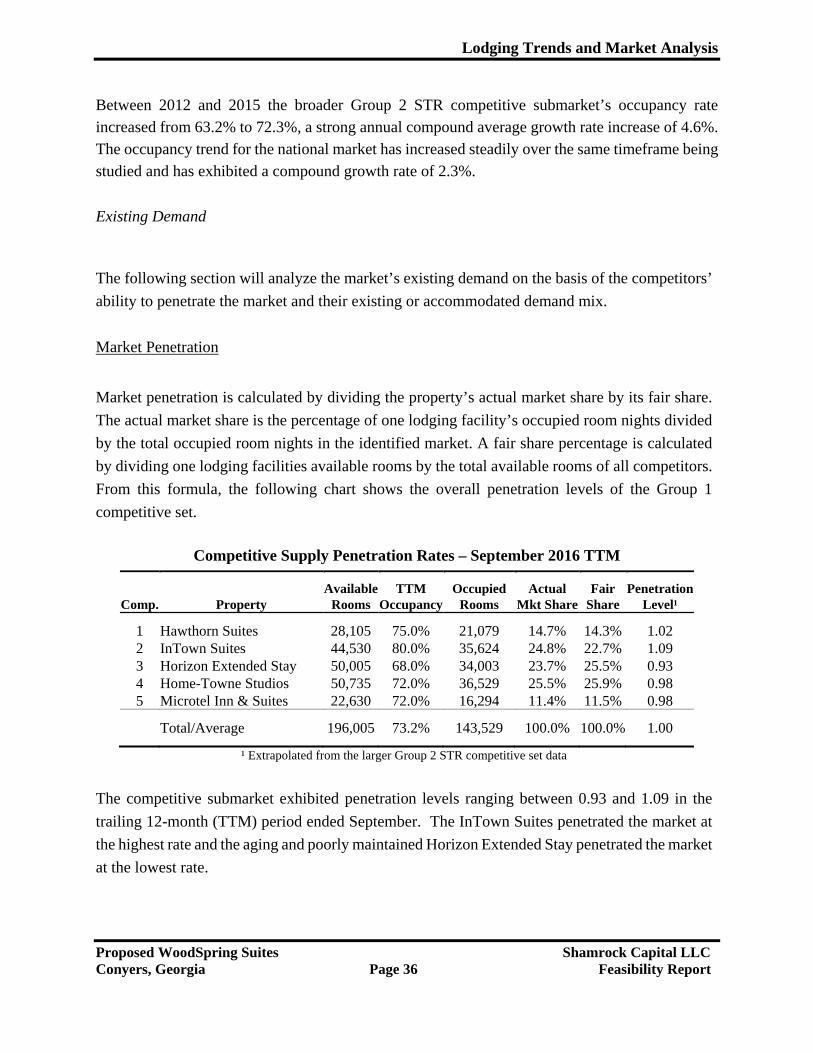
Market Penetration
Market penetration is calculated by dividing the property’s actual market share by its fair share.
The actual market share is the percentage of one lodging facility’s occupied room nights divided
by the total occupied room nights in the identified market. A fair share percentage is calculated
by dividing one lodging facilities available rooms by the total available rooms of all competitors.
From this formula, the following chart shows the overall penetration levels of the Group 1
competitive set.
Competitive Supply Penetration Rates – September 2016 TTM
Available TTM Occupied Actual Fair PenetrationComp. Property Rooms Occupancy Rooms Mkt Share Share Level¹
1 Hawthorn Suites 28,105 75.0% 21,079 14.7% 14.3% 1.02 2 InTown Suites 44,530 80.0% 35,624 24.8% 22.7% 1.09 3 Horizon Extended Stay 50,005 68.0% 34,003 23.7% 25.5% 0.93 4 Home-Towne Studios 50,735 72.0% 36,529 25.5% 25.9% 0.98 5 Microtel Inn & Suites 22,630 72.0% 16,294 11.4% 11.5% 0.98
Total/Average 196,005 73.2% 143,529 100.0% 100.0% 1.00
¹ Extrapolated from the larger Group 2 STR competitive set data
The competitive submarket exhibited penetration levels ranging between 0.93 and 1.09 in the
trailing 12-month (TTM) period ended September. The InTown Suites penetrated the market at
the highest rate and the aging and poorly maintained Horizon Extended Stay penetrated the market
at the lowest rate.
Lodging Trends and Market Analysis
Proposed WoodSpring Suites Shamrock Capital LLC Conyers, Georgia Page 37 Feasibility Report
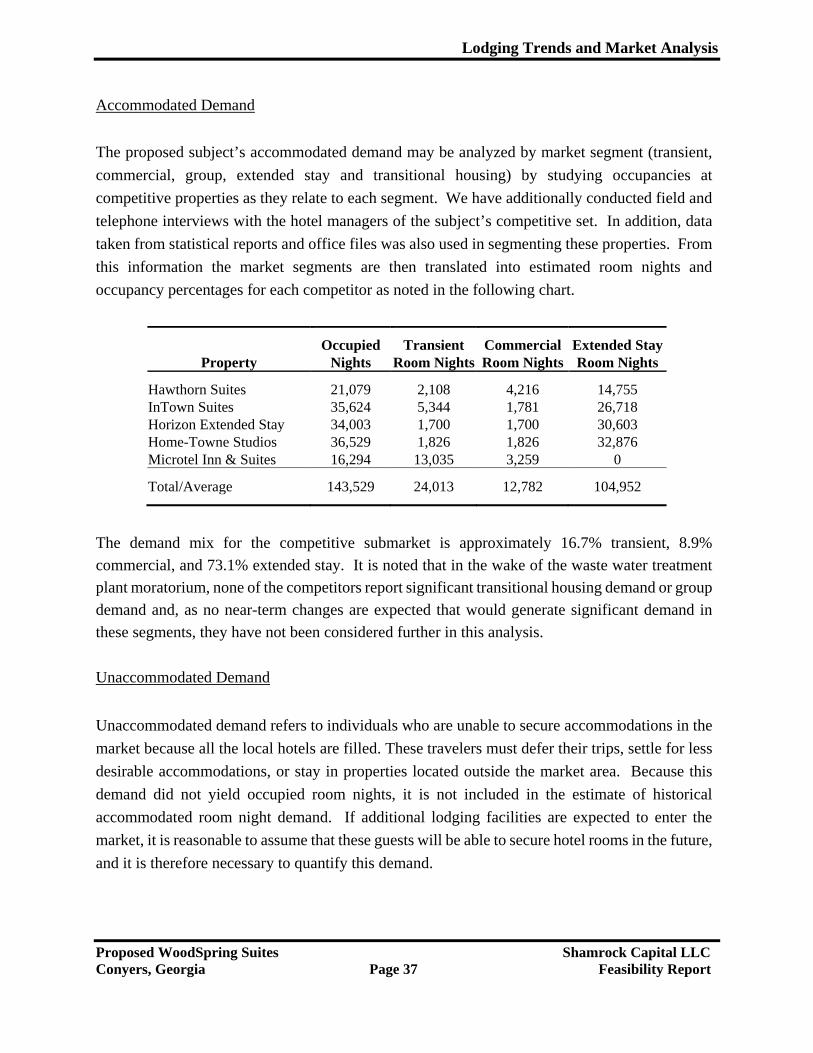
Accommodated Demand
The proposed subject’s accommodated demand may be analyzed by market segment (transient,
commercial, group, extended stay and transitional housing) by studying occupancies at
competitive properties as they relate to each segment. We have additionally conducted field and
telephone interviews with the hotel managers of the subject’s competitive set. In addition, data
taken from statistical reports and office files was also used in segmenting these properties. From
this information the market segments are then translated into estimated room nights and
occupancy percentages for each competitor as noted in the following chart.
Occupied Transient Commercial Extended StayProperty Nights Room Nights Room Nights Room Nights
Hawthorn Suites 21,079 2,108 4,216 14,755 InTown Suites 35,624 5,344 1,781 26,718 Horizon Extended Stay 34,003 1,700 1,700 30,603 Home-Towne Studios 36,529 1,826 1,826 32,876 Microtel Inn & Suites 16,294 13,035 3,259 0
Total/Average 143,529 24,013 12,782 104,952
The demand mix for the competitive submarket is approximately 16.7% transient, 8.9%
commercial, and 73.1% extended stay. It is noted that in the wake of the waste water treatment
plant moratorium, none of the competitors report significant transitional housing demand or group
demand and, as no near-term changes are expected that would generate significant demand in
these segments, they have not been considered further in this analysis.
Unaccommodated Demand
Unaccommodated demand refers to individuals who are unable to secure accommodations in the
market because all the local hotels are filled. These travelers must defer their trips, settle for less
desirable accommodations, or stay in properties located outside the market area. Because this
demand did not yield occupied room nights, it is not included in the estimate of historical
accommodated room night demand. If additional lodging facilities are expected to enter the
market, it is reasonable to assume that these guests will be able to secure hotel rooms in the future,
and it is therefore necessary to quantify this demand.
Lodging Trends and Market Analysis
Proposed WoodSpring Suites Shamrock Capital LLC Conyers, Georgia Page 38 Feasibility Report
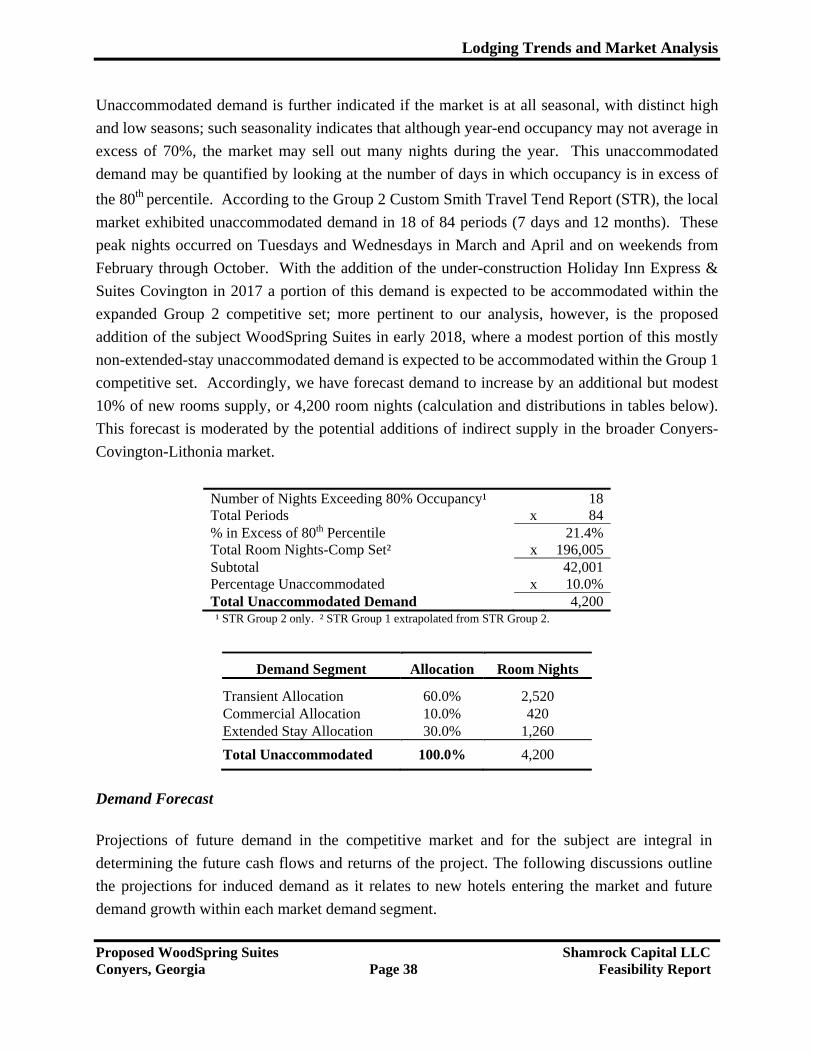
Unaccommodated demand is further indicated if the market is at all seasonal, with distinct high
and low seasons; such seasonality indicates that although year-end occupancy may not average in
excess of 70%, the market may sell out many nights during the year. This unaccommodated
demand may be quantified by looking at the number of days in which occupancy is in excess of
the 80th percentile. According to the Group 2 Custom Smith Travel Tend Report (STR), the local
market exhibited unaccommodated demand in 18 of 84 periods (7 days and 12 months). These
peak nights occurred on Tuesdays and Wednesdays in March and April and on weekends from
February through October. With the addition of the under-construction Holiday Inn Express &
Suites Covington in 2017 a portion of this demand is expected to be accommodated within the
expanded Group 2 competitive set; more pertinent to our analysis, however, is the proposed
addition of the subject WoodSpring Suites in early 2018, where a modest portion of this mostly
non-extended-stay unaccommodated demand is expected to be accommodated within the Group 1
competitive set. Accordingly, we have forecast demand to increase by an additional but modest
10% of new rooms supply, or 4,200 room nights (calculation and distributions in tables below).
This forecast is moderated by the potential additions of indirect supply in the broader Conyers-
Covington-Lithonia market.
Number of Nights Exceeding 80% Occupancy¹ 18 Total Periods x 84 % in Excess of 80th Percentile 21.4% Total Room Nights-Comp Set² x 196,005 Subtotal 42,001 Percentage Unaccommodated x 10.0% Total Unaccommodated Demand 4,200 ¹ STR Group 2 only. ² STR Group 1 extrapolated from STR Group 2.
Demand Segment Allocation Room Nights
Transient Allocation 60.0% 2,520 Commercial Allocation 10.0% 420 Extended Stay Allocation 30.0% 1,260
Total Unaccommodated 100.0% 4,200
Demand Forecast
Projections of future demand in the competitive market and for the subject are integral in
determining the future cash flows and returns of the project. The following discussions outline
the projections for induced demand as it relates to new hotels entering the market and future
demand growth within each market demand segment.
Lodging Trends and Market Analysis
Proposed WoodSpring Suites Shamrock Capital LLC Conyers, Georgia Page 39 Feasibility Report
Induced Demand
Similar to the concept of unaccommodated demand, it is apparent that the inducement of demand
occurs when a new product is added that attracts guests which previously stayed outside the
competitive set due to brand loyalty, or simply because the type of accommodations they prefer
were unavailable in the market area. The subject will be a new construction, purpose-built,
economy extended-stay hotel. Extended-stay and economy extended-stay are product types which
represent 17.9% and 15.0%, respectively, of the existing lodging inventory in the Conyers-
Covington-Lithonia market. The proposed WoodSpring Suites will offer a modern, fresh,
economy extended-stay option in a market whose direct competitors range in age from 15 to 20
years old.
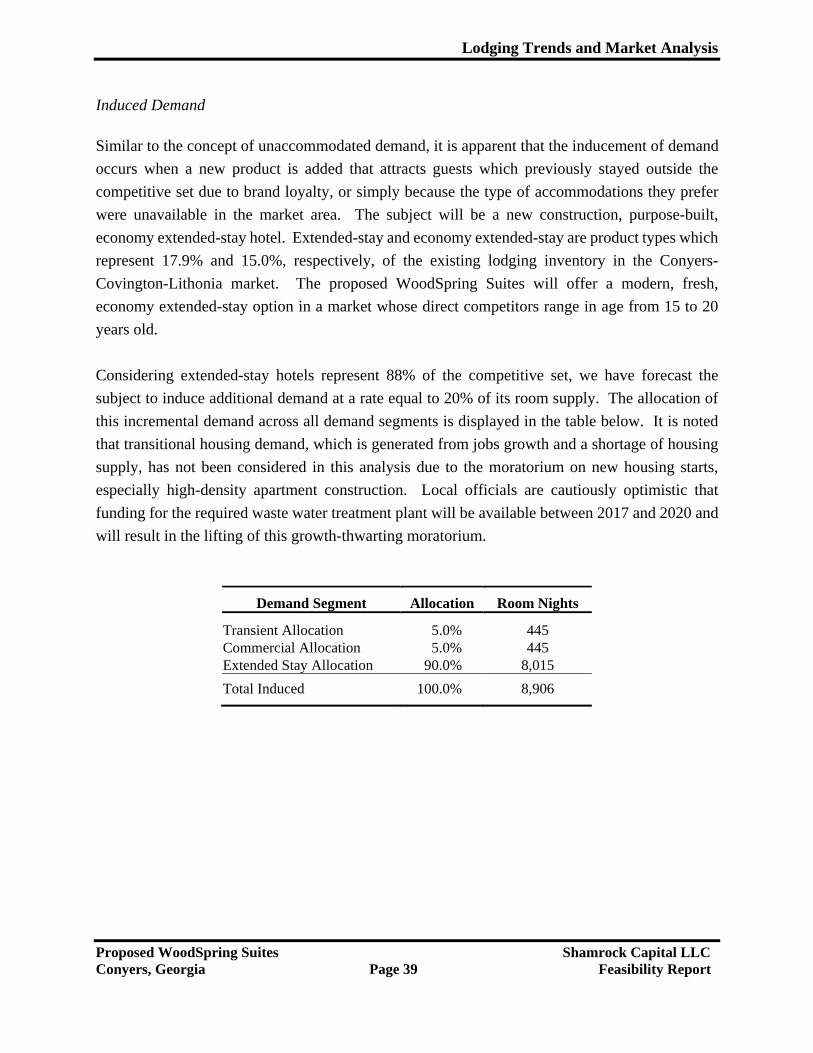
Considering extended-stay hotels represent 88% of the competitive set, we have forecast the
subject to induce additional demand at a rate equal to 20% of its room supply. The allocation of
this incremental demand across all demand segments is displayed in the table below. It is noted
that transitional housing demand, which is generated from jobs growth and a shortage of housing
supply, has not been considered in this analysis due to the moratorium on new housing starts,
especially high-density apartment construction. Local officials are cautiously optimistic that
funding for the required waste water treatment plant will be available between 2017 and 2020 and
will result in the lifting of this growth-thwarting moratorium.
Demand Segment Allocation Room Nights
Transient Allocation 5.0% 445 Commercial Allocation 5.0% 445 Extended Stay Allocation 90.0% 8,015
Total Induced 100.0% 8,906
Lodging Trends and Market Analysis
Proposed WoodSpring Suites Shamrock Capital LLC Conyers, Georgia Page 40 Feasibility Report
Market Demand Growth
The following discussions outline the projections for each market segment pertaining to growth
of room night demand within the competitive submarket.
Transient – This category historically has included persons visiting family, hospitals, and
attractions. The Group 2 Custom STR indicates overall demand has increased each year for
the past five years from 59.6% in 2011 to 72.3% in 2015, a strong compound annual rate of
growth of 5.0%. Transient demand is a tertiary segment within the competitive set and we
have forecast growth at 3.0% per year for fiscal 2017, 2018, and 2019. It is noted that
extended-stay hotels typically won’t accept advance reservations for short-term guests as
those reservations may block potential long-term reservations. As a result, transient demand
is typically forced out of the market to more appropriate accommodations.
Commercial - This segment of demand emanates from sales representatives, corporate
visitors to regional and branch offices, government officials, interviewees, trainees, engineers,
consultants and other business related travel to the area. This segment regularly seeks
accommodations Monday through Thursday and is predominantly single occupancy. The
average stay in the local market for commercial guests is typically one to three nights.
The subject will be located in the southwest quadrant of sparsely developed Exit 84, the I-20 and Salem Road interchange. As previously stated, overall demand has increased at an annual rate of about 5.0% per year over the past five years. At the current occupancy rates, and considering the waste water-induced construction moratorium on new residential and high-density housing, and considering the seasonality in the market, we have forecast commercial demand to increase in fiscal 2017, 2018, and 2019 at a modest rate of 3.0%.
Extended Stay - This segment includes extended-stay demand, which is defined as long-term
stays of one week or more. This demand may take the form of commercial or leisure
individuals who are using the room for an extended period of time. This segment regularly
seeks affordable accommodations with kitchens on a multi-week basis, including work-
related contractors and subcontractors staying in the area for a temporary but extended periods
of time, and persons vacationing or visiting family.
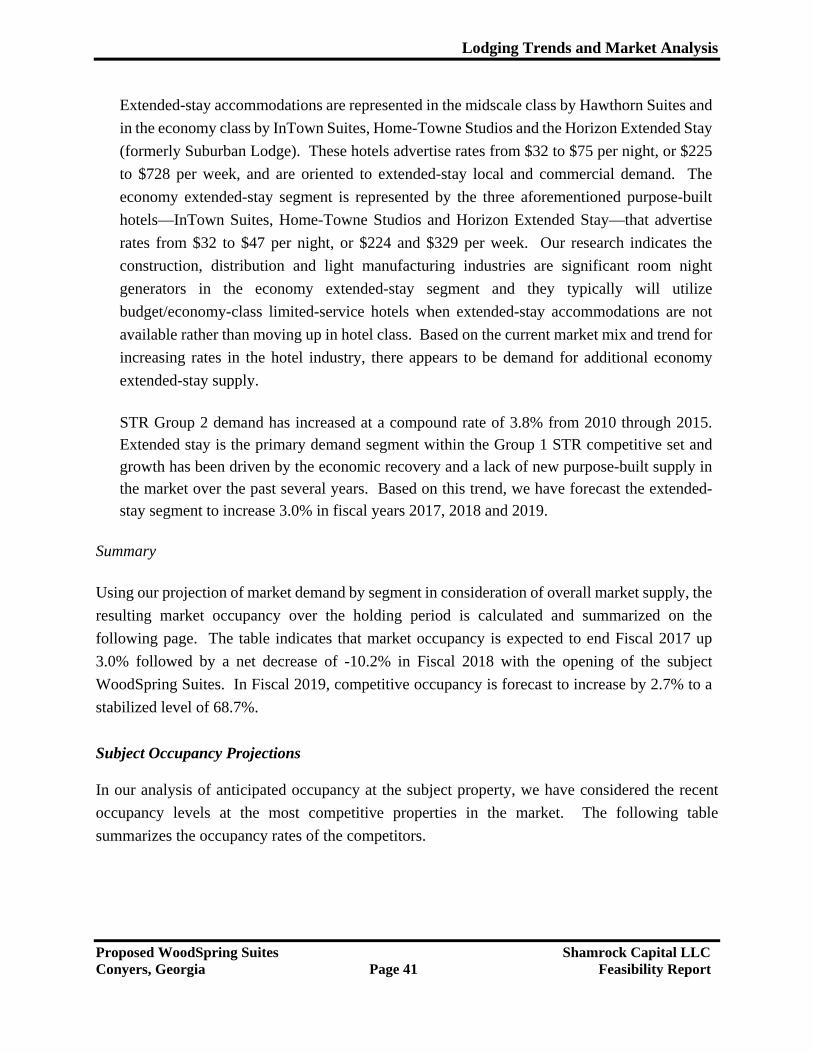
Lodging Trends and Market Analysis
Proposed WoodSpring Suites Shamrock Capital LLC Conyers, Georgia Page 41 Feasibility Report
Extended-stay accommodations are represented in the midscale class by Hawthorn Suites and
in the economy class by InTown Suites, Home-Towne Studios and the Horizon Extended Stay
(formerly Suburban Lodge). These hotels advertise rates from $32 to $75 per night, or $225
to $728 per week, and are oriented to extended-stay local and commercial demand. The
economy extended-stay segment is represented by the three aforementioned purpose-built
hotels—InTown Suites, Home-Towne Studios and Horizon Extended Stay—that advertise
rates from $32 to $47 per night, or $224 and $329 per week. Our research indicates the
construction, distribution and light manufacturing industries are significant room night
generators in the economy extended-stay segment and they typically will utilize
budget/economy-class limited-service hotels when extended-stay accommodations are not
available rather than moving up in hotel class. Based on the current market mix and trend for
increasing rates in the hotel industry, there appears to be demand for additional economy
extended-stay supply.
STR Group 2 demand has increased at a compound rate of 3.8% from 2010 through 2015. Extended stay is the primary demand segment within the Group 1 STR competitive set and growth has been driven by the economic recovery and a lack of new purpose-built supply in the market over the past several years. Based on this trend, we have forecast the extended-stay segment to increase 3.0% in fiscal years 2017, 2018 and 2019.
Summary
Using our projection of market demand by segment in consideration of overall market supply, the
resulting market occupancy over the holding period is calculated and summarized on the
following page. The table indicates that market occupancy is expected to end Fiscal 2017 up
3.0% followed by a net decrease of -10.2% in Fiscal 2018 with the opening of the subject
WoodSpring Suites. In Fiscal 2019, competitive occupancy is forecast to increase by 2.7% to a
stabilized level of 68.7%.
Subject Occupancy Projections
In our analysis of anticipated occupancy at the subject property, we have considered the recent
occupancy levels at the most competitive properties in the market. The following table
summarizes the occupancy rates of the competitors.
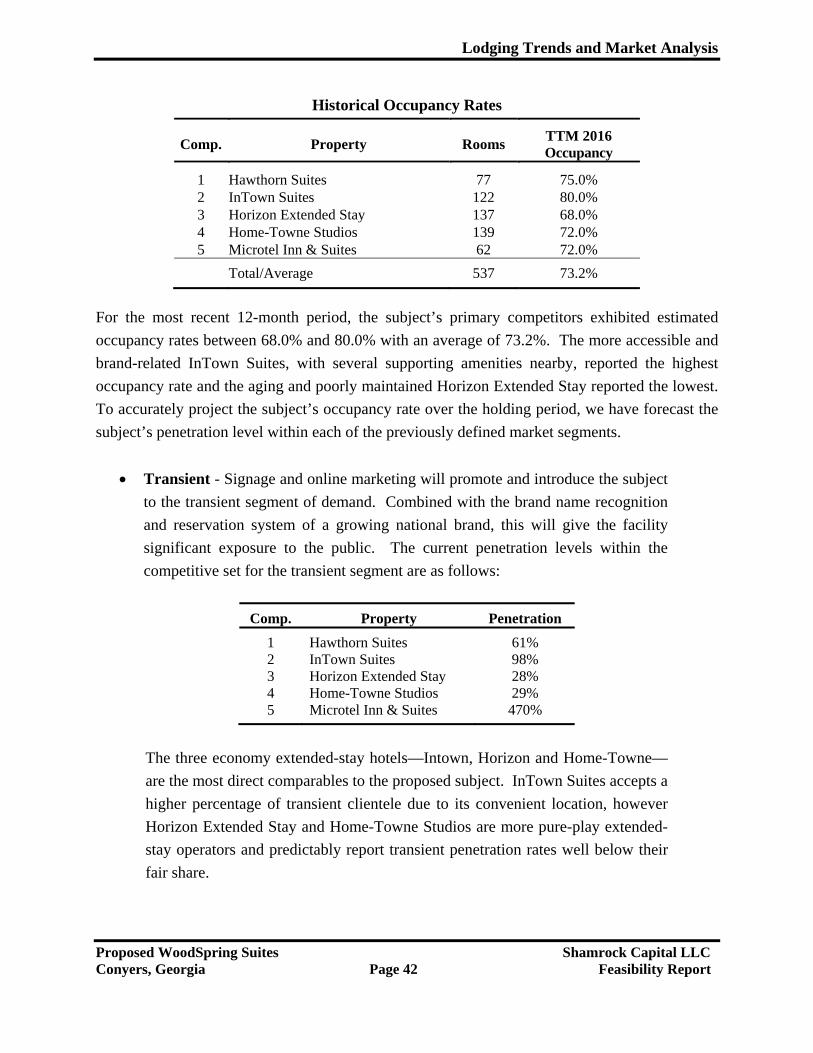
Lodging Trends and Market Analysis
Proposed WoodSpring Suites Shamrock Capital LLC Conyers, Georgia Page 42 Feasibility Report
Historical Occupancy Rates
Comp. Property Rooms TTM 2016 Occupancy
1 Hawthorn Suites 77 75.0% 2 InTown Suites 122 80.0% 3 Horizon Extended Stay 137 68.0% 4 Home-Towne Studios 139 72.0% 5 Microtel Inn & Suites 62 72.0%
Total/Average 537 73.2%
For the most recent 12-month period, the subject’s primary competitors exhibited estimated
occupancy rates between 68.0% and 80.0% with an average of 73.2%. The more accessible and
brand-related InTown Suites, with several supporting amenities nearby, reported the highest
occupancy rate and the aging and poorly maintained Horizon Extended Stay reported the lowest.
To accurately project the subject’s occupancy rate over the holding period, we have forecast the
subject’s penetration level within each of the previously defined market segments.
Transient - Signage and online marketing will promote and introduce the subject
to the transient segment of demand. Combined with the brand name recognition
and reservation system of a growing national brand, this will give the facility
significant exposure to the public. The current penetration levels within the
competitive set for the transient segment are as follows:
Comp. Property Penetration
1 Hawthorn Suites 61% 2 InTown Suites 98% 3 Horizon Extended Stay 28% 4 Home-Towne Studios 29% 5 Microtel Inn & Suites 470%
The three economy extended-stay hotels—Intown, Horizon and Home-Towne—
are the most direct comparables to the proposed subject. InTown Suites accepts a
higher percentage of transient clientele due to its convenient location, however
Horizon Extended Stay and Home-Towne Studios are more pure-play extended-
stay operators and predictably report transient penetration rates well below their
fair share.
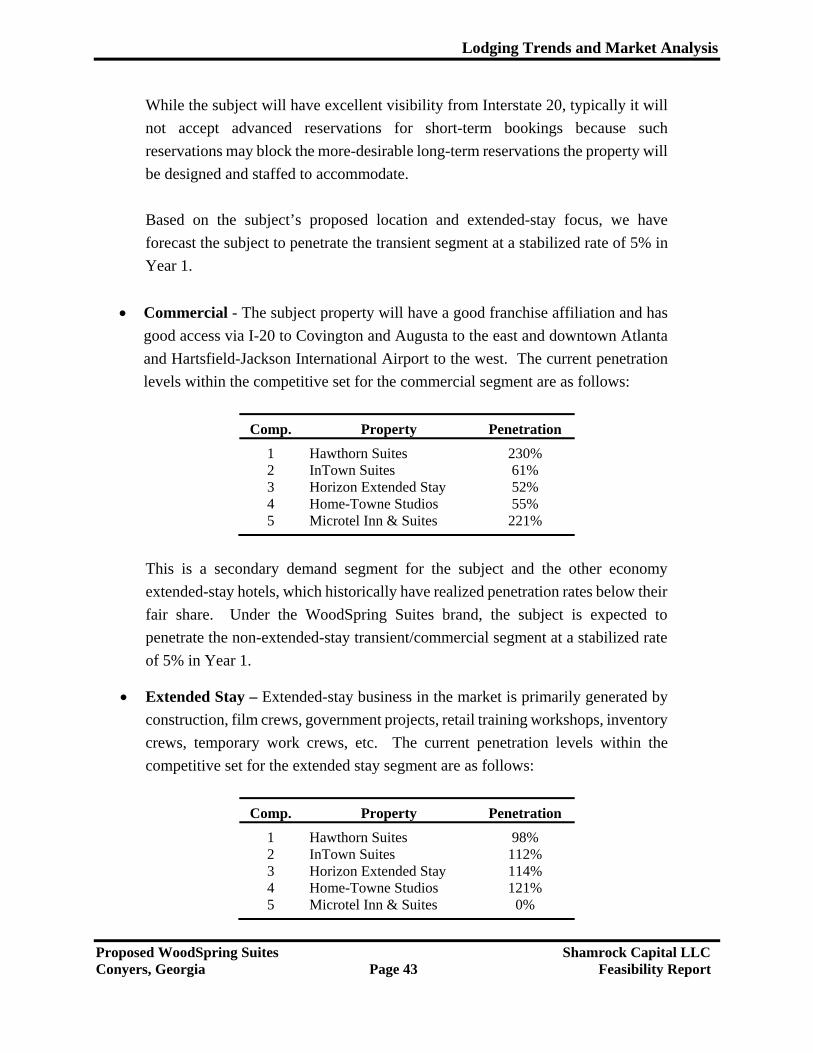
Lodging Trends and Market Analysis
Proposed WoodSpring Suites Shamrock Capital LLC Conyers, Georgia Page 43 Feasibility Report
While the subject will have excellent visibility from Interstate 20, typically it will
not accept advanced reservations for short-term bookings because such
reservations may block the more-desirable long-term reservations the property will
be designed and staffed to accommodate.
Based on the subject’s proposed location and extended-stay focus, we have
forecast the subject to penetrate the transient segment at a stabilized rate of 5% in
Year 1.
Commercial - The subject property will have a good franchise affiliation and has
good access via I-20 to Covington and Augusta to the east and downtown Atlanta
and Hartsfield-Jackson International Airport to the west. The current penetration
levels within the competitive set for the commercial segment are as follows:
Comp. Property Penetration
1 Hawthorn Suites 230% 2 InTown Suites 61% 3 Horizon Extended Stay 52% 4 Home-Towne Studios 55% 5 Microtel Inn & Suites 221%
This is a secondary demand segment for the subject and the other economy
extended-stay hotels, which historically have realized penetration rates below their
fair share. Under the WoodSpring Suites brand, the subject is expected to
penetrate the non-extended-stay transient/commercial segment at a stabilized rate
of 5% in Year 1.
Extended Stay – Extended-stay business in the market is primarily generated by
construction, film crews, government projects, retail training workshops, inventory
crews, temporary work crews, etc. The current penetration levels within the
competitive set for the extended stay segment are as follows:
Comp. Property Penetration
1 Hawthorn Suites 98% 2 InTown Suites 112% 3 Horizon Extended Stay 114% 4 Home-Towne Studios 121% 5 Microtel Inn & Suites 0%
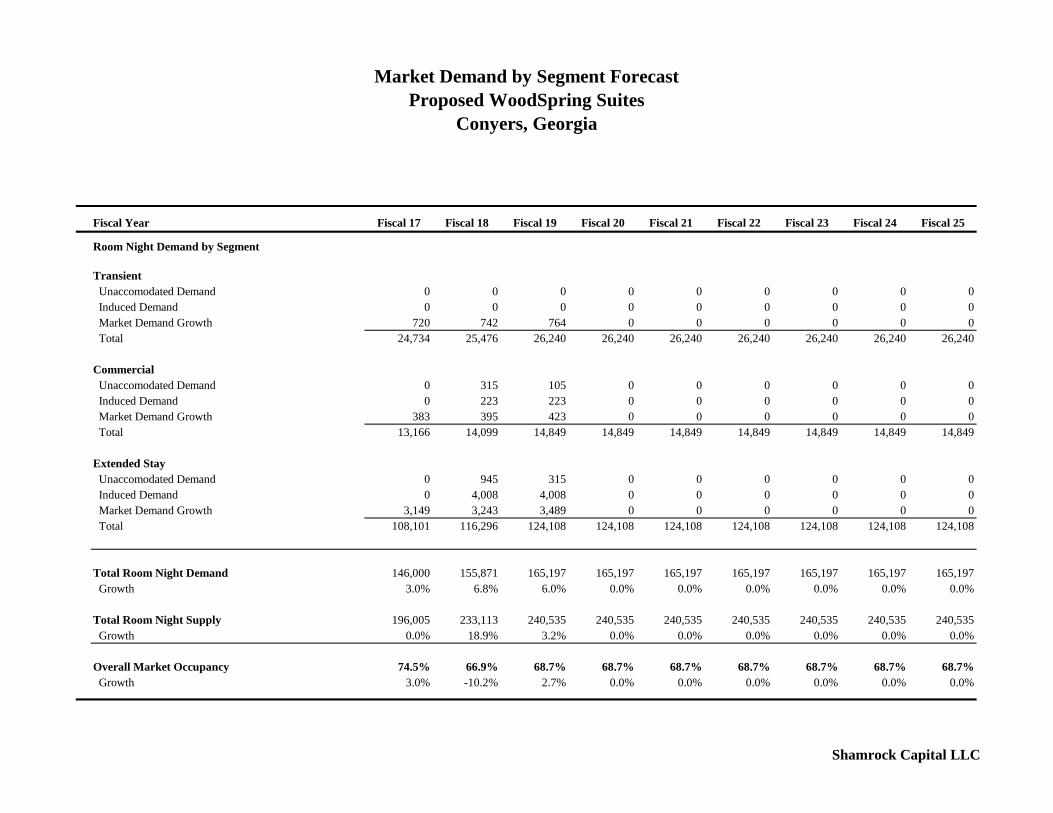
Fiscal Year Fiscal 17 Fiscal 18 Fiscal 19 Fiscal 20 Fiscal 21 Fiscal 22 Fiscal 23 Fiscal 24 Fiscal 25
Room Night Demand by Segment
Transient
Unaccomodated Demand 0 0 0 0 0 0 0 0 0
Induced Demand 0 0 0 0 0 0 0 0 0
Market Demand Growth 720 742 764 0 0 0 0 0 0
Total 24,734 25,476 26,240 26,240 26,240 26,240 26,240 26,240 26,240
Commercial
Unaccomodated Demand 0 315 105 0 0 0 0 0 0
Induced Demand 0 223 223 0 0 0 0 0 0
Market Demand Growth 383 395 423 0 0 0 0 0 0
Total 13,166 14,099 14,849 14,849 14,849 14,849 14,849 14,849 14,849
Extended Stay
Unaccomodated Demand 0 945 315 0 0 0 0 0 0
Induced Demand 0 4,008 4,008 0 0 0 0 0 0
Market Demand Growth 3,149 3,243 3,489 0 0 0 0 0 0
Total 108,101 116,296 124,108 124,108 124,108 124,108 124,108 124,108 124,108
Total Room Night Demand 146,000 155,871 165,197 165,197 165,197 165,197 165,197 165,197 165,197
Growth 3.0% 6.8% 6.0% 0.0% 0.0% 0.0% 0.0% 0.0% 0.0%
Total Room Night Supply 196,005 233,113 240,535 240,535 240,535 240,535 240,535 240,535 240,535
Growth 0.0% 18.9% 3.2% 0.0% 0.0% 0.0% 0.0% 0.0% 0.0%
Overall Market Occupancy 74.5% 66.9% 68.7% 68.7% 68.7% 68.7% 68.7% 68.7% 68.7%
Growth 3.0% -10.2% 2.7% 0.0% 0.0% 0.0% 0.0% 0.0% 0.0%
Market Demand by Segment Forecast
Proposed WoodSpring Suites
Conyers, Georgia
Shamrock Capital LLC
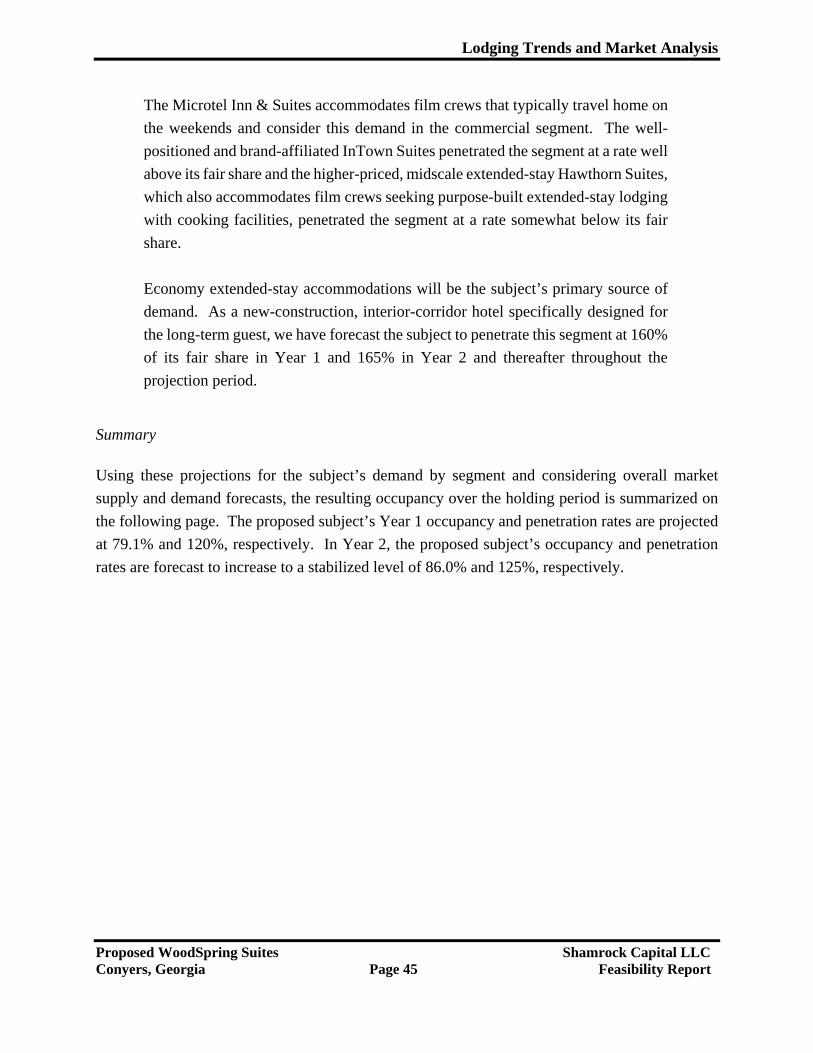
Lodging Trends and Market Analysis
Proposed WoodSpring Suites Shamrock Capital LLC Conyers, Georgia Page 45 Feasibility Report
The Microtel Inn & Suites accommodates film crews that typically travel home on
the weekends and consider this demand in the commercial segment. The well-
positioned and brand-affiliated InTown Suites penetrated the segment at a rate well
above its fair share and the higher-priced, midscale extended-stay Hawthorn Suites,
which also accommodates film crews seeking purpose-built extended-stay lodging
with cooking facilities, penetrated the segment at a rate somewhat below its fair
share.
Economy extended-stay accommodations will be the subject’s primary source of
demand. As a new-construction, interior-corridor hotel specifically designed for
the long-term guest, we have forecast the subject to penetrate this segment at 160%
of its fair share in Year 1 and 165% in Year 2 and thereafter throughout the
projection period.
Summary
Using these projections for the subject’s demand by segment and considering overall market
supply and demand forecasts, the resulting occupancy over the holding period is summarized on
the following page. The proposed subject’s Year 1 occupancy and penetration rates are projected
at 79.1% and 120%, respectively. In Year 2, the proposed subject’s occupancy and penetration
rates are forecast to increase to a stabilized level of 86.0% and 125%, respectively.
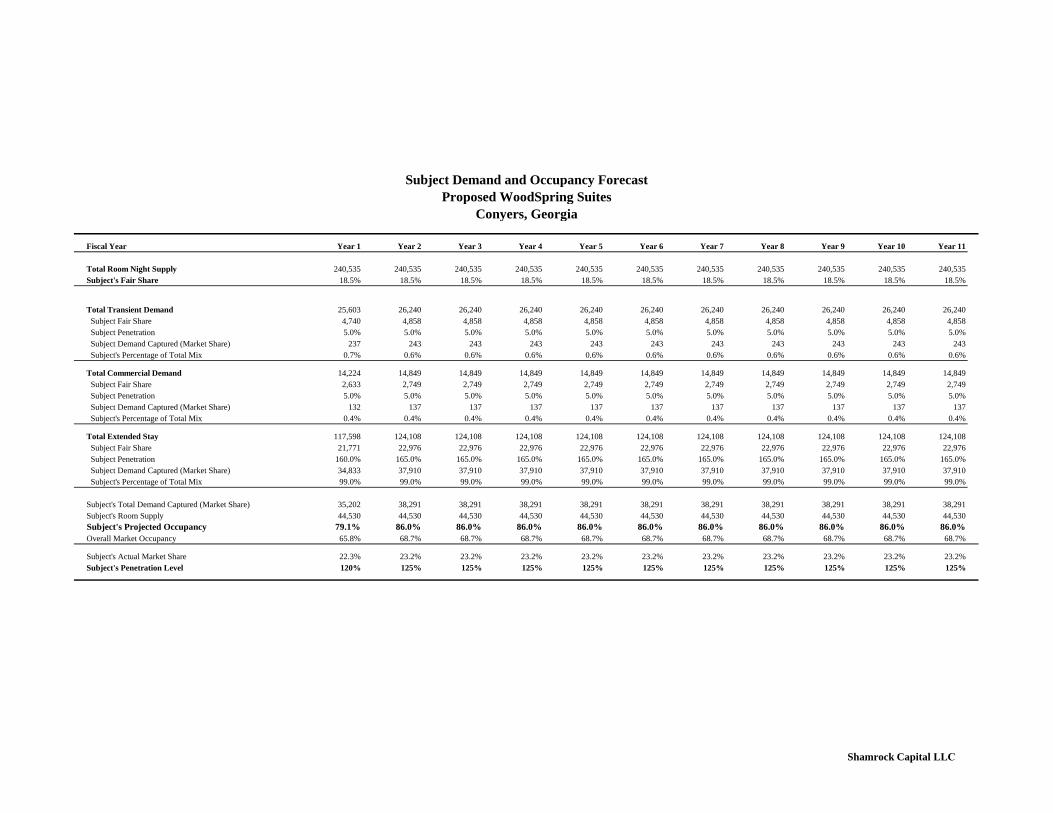
Fiscal Year Year 1 Year 2 Year 3 Year 4 Year 5 Year 6 Year 7 Year 8 Year 9 Year 10 Year 11
Total Room Night Supply 240,535 240,535 240,535 240,535 240,535 240,535 240,535 240,535 240,535 240,535 240,535
Subject's Fair Share 18.5% 18.5% 18.5% 18.5% 18.5% 18.5% 18.5% 18.5% 18.5% 18.5% 18.5%
Total Transient Demand 25,603 26,240 26,240 26,240 26,240 26,240 26,240 26,240 26,240 26,240 26,240
Subject Fair Share 4,740 4,858 4,858 4,858 4,858 4,858 4,858 4,858 4,858 4,858 4,858
Subject Penetration 5.0% 5.0% 5.0% 5.0% 5.0% 5.0% 5.0% 5.0% 5.0% 5.0% 5.0%
Subject Demand Captured (Market Share) 237 243 243 243 243 243 243 243 243 243 243
Subject's Percentage of Total Mix 0.7% 0.6% 0.6% 0.6% 0.6% 0.6% 0.6% 0.6% 0.6% 0.6% 0.6%
Total Commercial Demand 14,224 14,849 14,849 14,849 14,849 14,849 14,849 14,849 14,849 14,849 14,849
Subject Fair Share 2,633 2,749 2,749 2,749 2,749 2,749 2,749 2,749 2,749 2,749 2,749
Subject Penetration 5.0% 5.0% 5.0% 5.0% 5.0% 5.0% 5.0% 5.0% 5.0% 5.0% 5.0%
Subject Demand Captured (Market Share) 132 137 137 137 137 137 137 137 137 137 137
Subject's Percentage of Total Mix 0.4% 0.4% 0.4% 0.4% 0.4% 0.4% 0.4% 0.4% 0.4% 0.4% 0.4%
Total Extended Stay 117,598 124,108 124,108 124,108 124,108 124,108 124,108 124,108 124,108 124,108 124,108
Subject Fair Share 21,771 22,976 22,976 22,976 22,976 22,976 22,976 22,976 22,976 22,976 22,976
Subject Penetration 160.0% 165.0% 165.0% 165.0% 165.0% 165.0% 165.0% 165.0% 165.0% 165.0% 165.0%
Subject Demand Captured (Market Share) 34,833 37,910 37,910 37,910 37,910 37,910 37,910 37,910 37,910 37,910 37,910
Subject's Percentage of Total Mix 99.0% 99.0% 99.0% 99.0% 99.0% 99.0% 99.0% 99.0% 99.0% 99.0% 99.0%
Subject's Total Demand Captured (Market Share) 35,202 38,291 38,291 38,291 38,291 38,291 38,291 38,291 38,291 38,291 38,291
Subject's Room Supply 44,530 44,530 44,530 44,530 44,530 44,530 44,530 44,530 44,530 44,530 44,530
Subject's Projected Occupancy 79.1% 86.0% 86.0% 86.0% 86.0% 86.0% 86.0% 86.0% 86.0% 86.0% 86.0%
Overall Market Occupancy 65.8% 68.7% 68.7% 68.7% 68.7% 68.7% 68.7% 68.7% 68.7% 68.7% 68.7%
Subject's Actual Market Share 22.3% 23.2% 23.2% 23.2% 23.2% 23.2% 23.2% 23.2% 23.2% 23.2% 23.2%
Subject's Penetration Level 120% 125% 125% 125% 125% 125% 125% 125% 125% 125% 125%
Subject Demand and Occupancy Forecast
Proposed WoodSpring Suites
Conyers, Georgia
Shamrock Capital LLC
Lodging Trends and Market Analysis
Proposed WoodSpring Suites Shamrock Capital LLC Conyers, Georgia Page 47 Feasibility Report
Subject Average Daily Rate Projections
To forecast the subject’s average daily rate, we have developed the following table summarizing the ADR and RevPAR for the competitive set.
Comparable ADR and RevPAR Rates
2016 TTMComp. Property Rooms ADR RevPAR
1 Hawthorn Suites 77 $75.00 $56.25 2 InTown Suites 122 $38.00 $30.40 3 Horizon Extended Stay 137 $35.00 $23.80 4 Home-Towne Studios 139 $36.00 $25.92 5 Microtel Inn & Suites 62 $75.00 $54.00
Total/Average 537 $46.41 $33.99
The competitive set offered average daily rates in the previous 12 months that ranged from a low
of $35.00 to a high of $75.00, and averaged $46.41 per occupied room night. It is noted that the
ADRs of the three economy extended-stay hotels most similar to the proposed subject do not
include daily cleaning/linen service and certain other commonly provided hotel amenities. Instead
of charging for such amenities in the room rate (ADR), they are accounted for as other income.
Data in the following table compares the average daily rates of the national hotel market to the
STR Group 2 competitive market and subject submarket, STR Group 1.
Period 2012 2013 2014 2015 2016 YTD
National ADR¹ $106.21 $110.33 $115.32 $120.00 Growth 4.2% 3.9% 4.5% 4.4%
STR Group 2ADR¹ $48.87 $52.85 $55.86 $58.32 Growth 2.2% 8.1% 5.7% 4.4%
STR Group 1 ADR - YTD² $42.06 $46.43Growth 10.4%
¹ National and most of STR Group 2 ADRs include daily cleaning, linen service, free WiFi, etc. ² 88% of STR Group 1 ADRs (YTD Sept only) do NOT include daily cleaning, linen service, free WiFi, etc.
Source: Smith Travel and Shamrock Capital LLC
Lodging Trends and Market Analysis
Proposed WoodSpring Suites Shamrock Capital LLC Conyers, Georgia Page 48 Feasibility Report
The subject will be a new-construction, interior-corridor, purpose-built, economy extended-stay
hotel with a fresh design and branding as a WoodSpring Suites. Based on this, considering STR
Group 1 ADRs are upwardly influenced by midscale competitor Hawthorn Suites and limited-
service Microtel Inn & Suites, we estimate that if the subject existed in today’s market, it would
command an ADR of $38.83 per night, or an AWR of $271.84. Given that the subject will not
enter the market until 2018, and considering the historical ADR growth rates in the market, we
forecast a Year 1 ADR and AWR of $40.00 and $280.00, respectively, with annual increases of
3.0% per year.
Internal Rate of Return
Proposed WoodSpring Suites Shamrock Capital LLC Conyers, Georgia Page 49 Feasibility Report
Internal Rate of Return Methodology
This feasibility study estimates the internal rate of return on the investment in the proposed 124-room/studio prototype extended-stay hotel that will operate as a 123-room hotel, as one room is allocated to a guest attendant. Fundamental to the estimates of operating results is an assumption of competent and efficient management at the property. Among the primary duties of management are the maintenance of the quality of the facility and the execution of appropriate marketing efforts.
The detailed discussion of room revenues in this section is followed by a description of other revenue sources and expense categories. The Uniform System of Accounts for Hotels, as adopted by the American Hotel & Motel Association, has been used in the classification of revenues and expenses in this report for comparison purposes. Certain expenses typically shown in audited financial reports are considered capital-related and are not included in this operating forecast. These expenses consist of depreciation, interest expense, amortization, capital gains (losses) and income taxes.
Basis of Assumptions
In order to accurately estimate the subject’s potential income, we have surveyed other economy
extended-stay facilities relative to their location, amenities, nearby restaurants, occupancy rates
and average daily/weekly rates. The estimate of future operating results is based on a projected
stabilized occupancy and average daily rate. These are estimates of investor expectations that
could be achieved in a typical year with proper marketing, as shown in the Lodging Trends section
of this report.
In the Projected Income and Expense statement, we have used actual income and expense ratios
from four comparable extended stay hotel facilities as a means of forecasting major operating
expenses. These statements have been reconstructed on the following page for the reader’s
reference. Due to the confidential nature of the operating statements, individual identifications of
the comparable hotels are kept in the analysts’ files.
The use of the stabilized year of operations in determining value is important, as it provides an estimate of the annual operating results in current dollars as if it were operating at a level considered representative of its long-term potential. If stabilization is projected to occur in a year other than Year 1, there will be some differences in the stabilized year income and expense statement in relation to the projected Year 1 income statement. These differences primarily are due to differing bases for some expense categories, with expenses variously based on the number of occupied rooms, the number of available rooms and/or a percentage of departmental or total revenues.
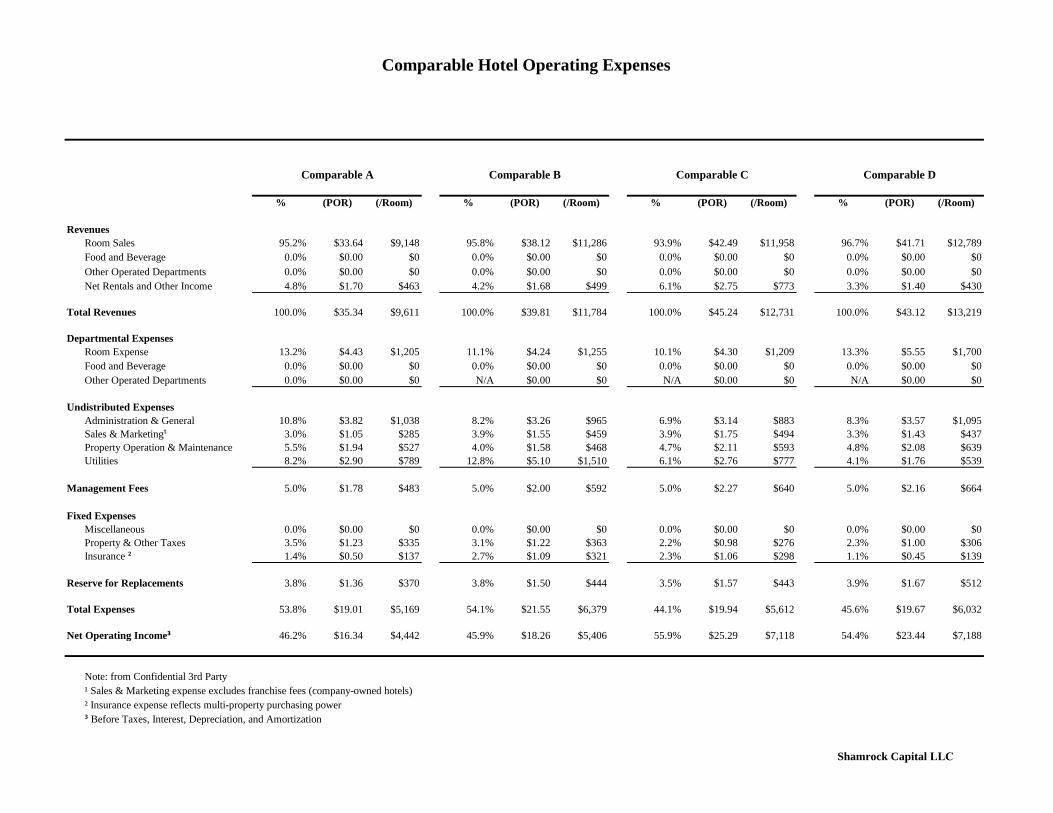
Comparable Hotel Operating Expenses
% (POR) (/Room) % (POR) (/Room) % (POR) (/Room) % (POR) (/Room)
Revenues
Room Sales 95.2% $33.64 $9,148 95.8% $38.12 $11,286 93.9% $42.49 $11,958 96.7% $41.71 $12,789
Food and Beverage 0.0% $0.00 $0 0.0% $0.00 $0 0.0% $0.00 $0 0.0% $0.00 $0
Other Operated Departments 0.0% $0.00 $0 0.0% $0.00 $0 0.0% $0.00 $0 0.0% $0.00 $0
Net Rentals and Other Income 4.8% $1.70 $463 4.2% $1.68 $499 6.1% $2.75 $773 3.3% $1.40 $430
Total Revenues 100.0% $35.34 $9,611 100.0% $39.81 $11,784 100.0% $45.24 $12,731 100.0% $43.12 $13,219
Departmental Expenses
Room Expense 13.2% $4.43 $1,205 11.1% $4.24 $1,255 10.1% $4.30 $1,209 13.3% $5.55 $1,700
Food and Beverage 0.0% $0.00 $0 0.0% $0.00 $0 0.0% $0.00 $0 0.0% $0.00 $0
Other Operated Departments 0.0% $0.00 $0 N/A $0.00 $0 N/A $0.00 $0 N/A $0.00 $0
Undistributed Expenses
Administration & General 10.8% $3.82 $1,038 8.2% $3.26 $965 6.9% $3.14 $883 8.3% $3.57 $1,095
Sales & Marketing¹ 3.0% $1.05 $285 3.9% $1.55 $459 3.9% $1.75 $494 3.3% $1.43 $437
Property Operation & Maintenance 5.5% $1.94 $527 4.0% $1.58 $468 4.7% $2.11 $593 4.8% $2.08 $639
Utilities 8.2% $2.90 $789 12.8% $5.10 $1,510 6.1% $2.76 $777 4.1% $1.76 $539
Management Fees 5.0% $1.78 $483 5.0% $2.00 $592 5.0% $2.27 $640 5.0% $2.16 $664
Fixed Expenses
Miscellaneous 0.0% $0.00 $0 0.0% $0.00 $0 0.0% $0.00 $0 0.0% $0.00 $0
Property & Other Taxes 3.5% $1.23 $335 3.1% $1.22 $363 2.2% $0.98 $276 2.3% $1.00 $306
Insurance ² 1.4% $0.50 $137 2.7% $1.09 $321 2.3% $1.06 $298 1.1% $0.45 $139
Reserve for Replacements 3.8% $1.36 $370 3.8% $1.50 $444 3.5% $1.57 $443 3.9% $1.67 $512
Total Expenses 53.8% $19.01 $5,169 54.1% $21.55 $6,379 44.1% $19.94 $5,612 45.6% $19.67 $6,032
Net Operating Income³ 46.2% $16.34 $4,442 45.9% $18.26 $5,406 55.9% $25.29 $7,118 54.4% $23.44 $7,188
Note: from Confidential 3rd Party
¹ Sales & Marketing expense excludes franchise fees (company-owned hotels)
² Insurance expense reflects multi-property purchasing power
³ Before Taxes, Interest, Depreciation, and Amortization
Comparable A Comparable B Comparable C Comparable D
Shamrock Capital LLC
Internal Rate of Return
Proposed WoodSpring Suites Shamrock Capital LLC Conyers, Georgia Page 51 Feasibility Report
We also have considered the anticipated effects of inflation, business development and occupancy levels for the projection period. The underlying rationale and assumptions used in preparing these estimates are presented in the paragraphs that follow the stabilized-year income and expense statement.
Analysis of Revenues Revenue sources for hotels typically include room sales, food and beverage, telephone, minor operated departments, rentals and other income.
Rooms Revenue There are two major factors to estimate when considering the rooms revenue for the income statement: the average daily room rate and a projection of the occupancy curve for the facility. Various features of a particular hotel affect the rate and occupancy levels that can be achieved. These include proximity to local demand generators, rate structure in relation to the competitive market, seasonality, supply of competitive properties, and the different hotel amenities that are offered.
Occupancy Rate
As discussed in the Lodging Trends section of this report, we have estimated the projected room
occupancy for the anticipated projection period. We also have identified the competitive supply
in the market and related their estimated operating statistics to the subject property. Based on our
estimate of penetration levels within each demand segment, we have estimated that the subject
property will attain a Year 1 occupancy rate of 79.1%, stabilizing at 86.0% in Year 2. These
estimates are based on the occupancy levels and absorption rates in the competitive market over
the last few years and current supply and demand factors in the local market.
Average Daily/Weekly Rate
As discussed in the Lodging Trends section, and for projection purposes, we believe the subject
property will be able to attain an estimated average daily/weekly rate of $60.00/$420.00 in Year 1
(2018), with increases of +3.0% annually over the remainder of the projection period.
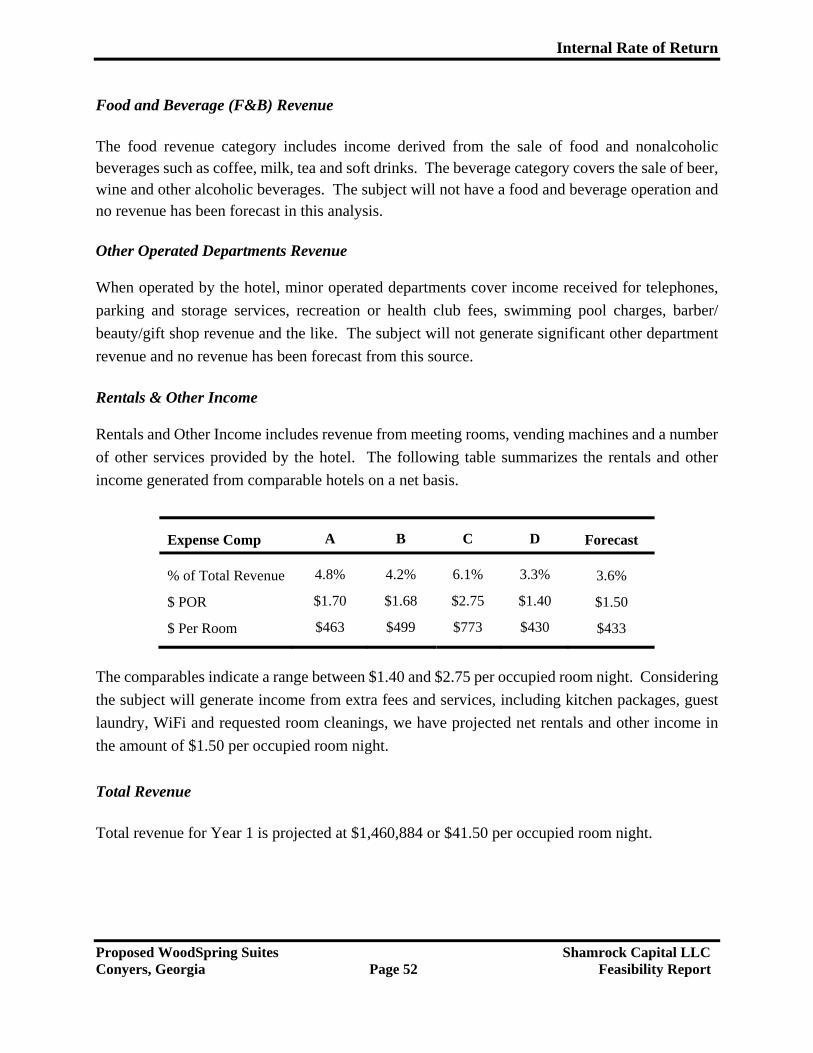
Internal Rate of Return
Proposed WoodSpring Suites Shamrock Capital LLC Conyers, Georgia Page 52 Feasibility Report
Food and Beverage (F&B) Revenue
The food revenue category includes income derived from the sale of food and nonalcoholic beverages such as coffee, milk, tea and soft drinks. The beverage category covers the sale of beer, wine and other alcoholic beverages. The subject will not have a food and beverage operation and no revenue has been forecast in this analysis.
Other Operated Departments Revenue
When operated by the hotel, minor operated departments cover income received for telephones,
parking and storage services, recreation or health club fees, swimming pool charges, barber/
beauty/gift shop revenue and the like. The subject will not generate significant other department
revenue and no revenue has been forecast from this source.
Rentals & Other Income
Rentals and Other Income includes revenue from meeting rooms, vending machines and a number
of other services provided by the hotel. The following table summarizes the rentals and other
income generated from comparable hotels on a net basis.
Expense Comp A B C D Forecast
% of Total Revenue 4.8% 4.2% 6.1% 3.3% 3.6%
$ POR $1.70 $1.68 $2.75 $1.40 $1.50
$ Per Room $463 $499 $773 $430 $433
The comparables indicate a range between $1.40 and $2.75 per occupied room night. Considering
the subject will generate income from extra fees and services, including kitchen packages, guest
laundry, WiFi and requested room cleanings, we have projected net rentals and other income in
the amount of $1.50 per occupied room night.
Total Revenue
Total revenue for Year 1 is projected at $1,460,884 or $41.50 per occupied room night.
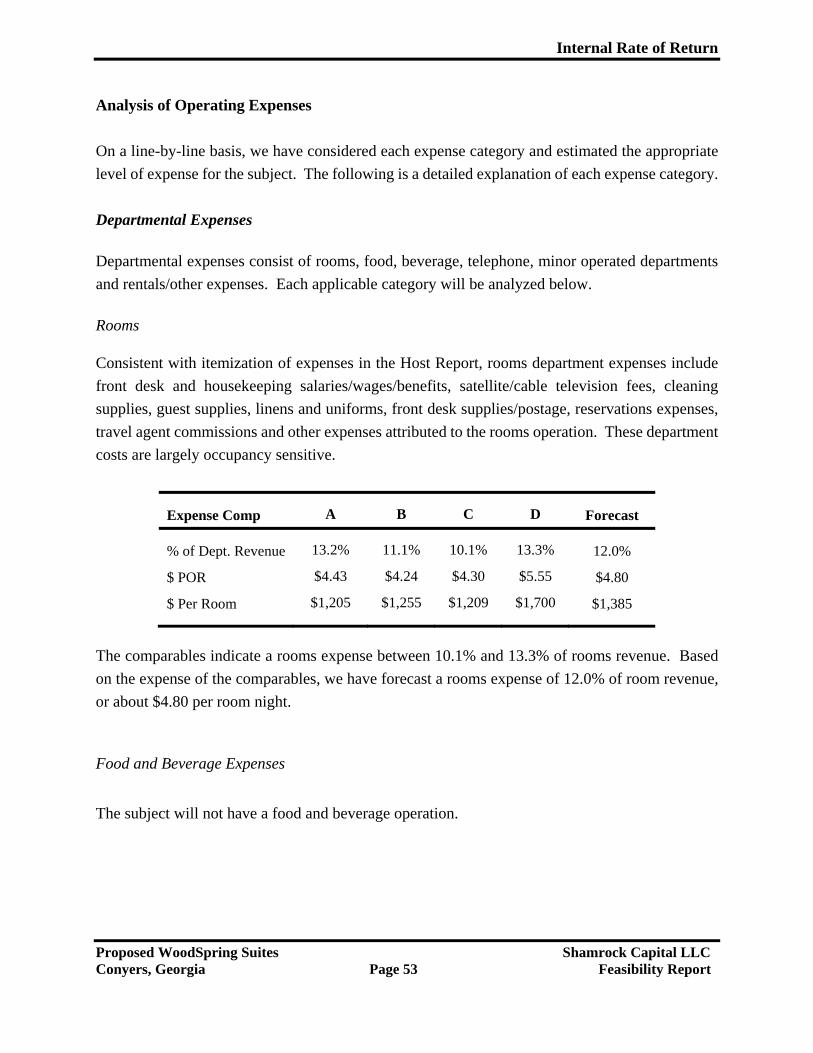
Internal Rate of Return
Proposed WoodSpring Suites Shamrock Capital LLC Conyers, Georgia Page 53 Feasibility Report
Analysis of Operating Expenses
On a line-by-line basis, we have considered each expense category and estimated the appropriate
level of expense for the subject. The following is a detailed explanation of each expense category.
Departmental Expenses
Departmental expenses consist of rooms, food, beverage, telephone, minor operated departments
and rentals/other expenses. Each applicable category will be analyzed below.
Rooms
Consistent with itemization of expenses in the Host Report, rooms department expenses include
front desk and housekeeping salaries/wages/benefits, satellite/cable television fees, cleaning
supplies, guest supplies, linens and uniforms, front desk supplies/postage, reservations expenses,
travel agent commissions and other expenses attributed to the rooms operation. These department
costs are largely occupancy sensitive.
Expense Comp A B C D Forecast
% of Dept. Revenue 13.2% 11.1% 10.1% 13.3% 12.0%
$ POR $4.43 $4.24 $4.30 $5.55 $4.80
$ Per Room $1,205 $1,255 $1,209 $1,700 $1,385
The comparables indicate a rooms expense between 10.1% and 13.3% of rooms revenue. Based
on the expense of the comparables, we have forecast a rooms expense of 12.0% of room revenue,
or about $4.80 per room night.
Food and Beverage Expenses
The subject will not have a food and beverage operation.
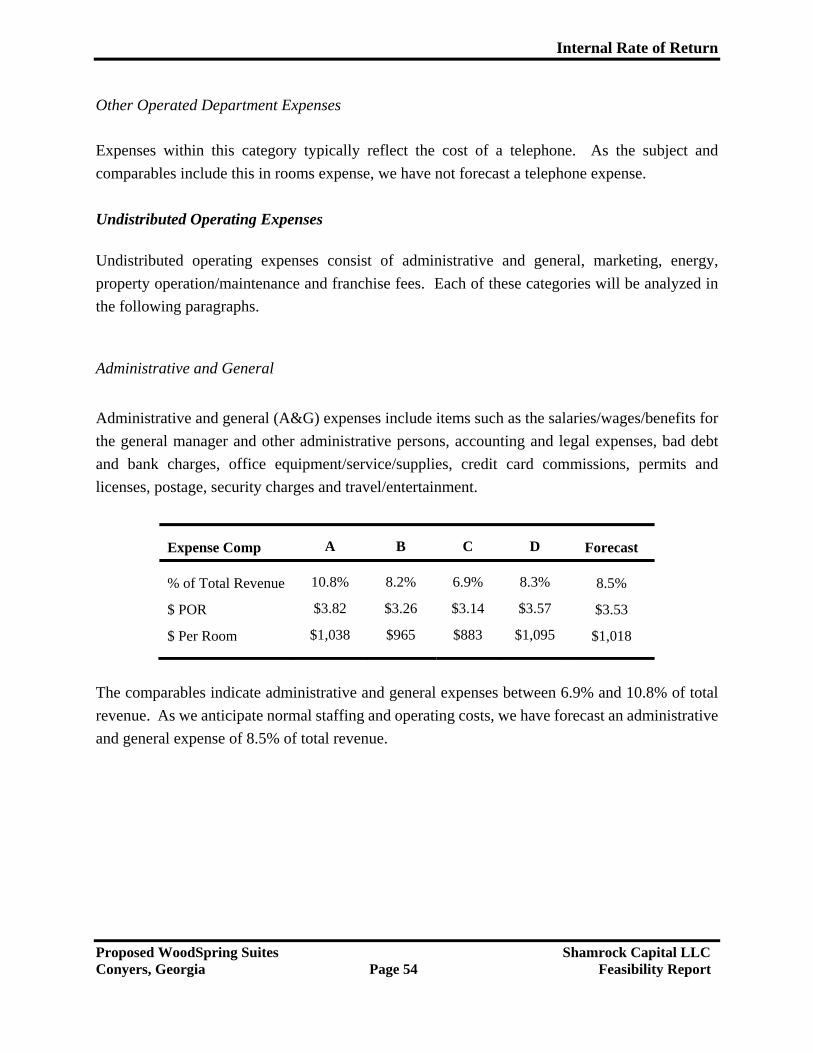
Internal Rate of Return
Proposed WoodSpring Suites Shamrock Capital LLC Conyers, Georgia Page 54 Feasibility Report
Other Operated Department Expenses
Expenses within this category typically reflect the cost of a telephone. As the subject and
comparables include this in rooms expense, we have not forecast a telephone expense.
Undistributed Operating Expenses
Undistributed operating expenses consist of administrative and general, marketing, energy,
property operation/maintenance and franchise fees. Each of these categories will be analyzed in
the following paragraphs.
Administrative and General
Administrative and general (A&G) expenses include items such as the salaries/wages/benefits for
the general manager and other administrative persons, accounting and legal expenses, bad debt
and bank charges, office equipment/service/supplies, credit card commissions, permits and
licenses, postage, security charges and travel/entertainment.
Expense Comp A B C D Forecast
% of Total Revenue 10.8% 8.2% 6.9% 8.3% 8.5%
$ POR $3.82 $3.26 $3.14 $3.57 $3.53
$ Per Room $1,038 $965 $883 $1,095 $1,018
The comparables indicate administrative and general expenses between 6.9% and 10.8% of total
revenue. As we anticipate normal staffing and operating costs, we have forecast an administrative
and general expense of 8.5% of total revenue.
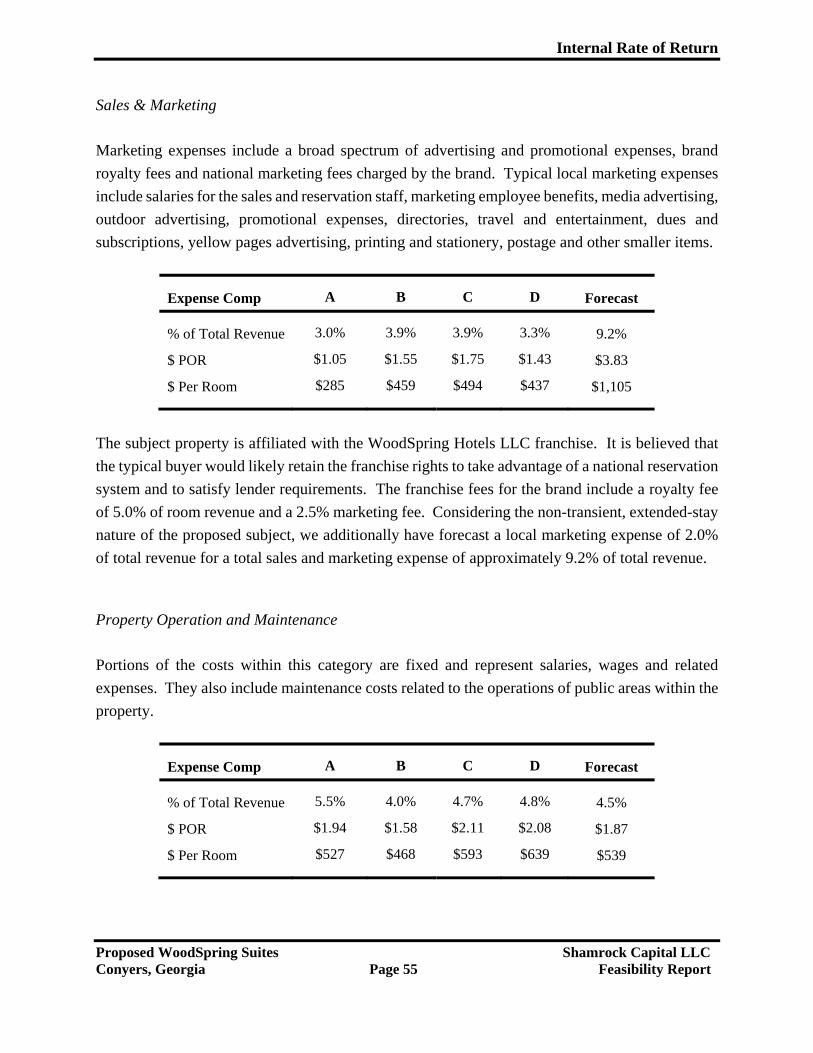
Internal Rate of Return
Proposed WoodSpring Suites Shamrock Capital LLC Conyers, Georgia Page 55 Feasibility Report
Sales & Marketing
Marketing expenses include a broad spectrum of advertising and promotional expenses, brand
royalty fees and national marketing fees charged by the brand. Typical local marketing expenses
include salaries for the sales and reservation staff, marketing employee benefits, media advertising,
outdoor advertising, promotional expenses, directories, travel and entertainment, dues and
subscriptions, yellow pages advertising, printing and stationery, postage and other smaller items.
Expense Comp A B C D Forecast
% of Total Revenue 3.0% 3.9% 3.9% 3.3% 9.2%
$ POR $1.05 $1.55 $1.75 $1.43 $3.83
$ Per Room $285 $459 $494 $437 $1,105
The subject property is affiliated with the WoodSpring Hotels LLC franchise. It is believed that
the typical buyer would likely retain the franchise rights to take advantage of a national reservation
system and to satisfy lender requirements. The franchise fees for the brand include a royalty fee
of 5.0% of room revenue and a 2.5% marketing fee. Considering the non-transient, extended-stay
nature of the proposed subject, we additionally have forecast a local marketing expense of 2.0%
of total revenue for a total sales and marketing expense of approximately 9.2% of total revenue.
Property Operation and Maintenance
Portions of the costs within this category are fixed and represent salaries, wages and related
expenses. They also include maintenance costs related to the operations of public areas within the
property.
Expense Comp A B C D Forecast
% of Total Revenue 5.5% 4.0% 4.7% 4.8% 4.5%
$ POR $1.94 $1.58 $2.11 $2.08 $1.87
$ Per Room $527 $468 $593 $639 $539
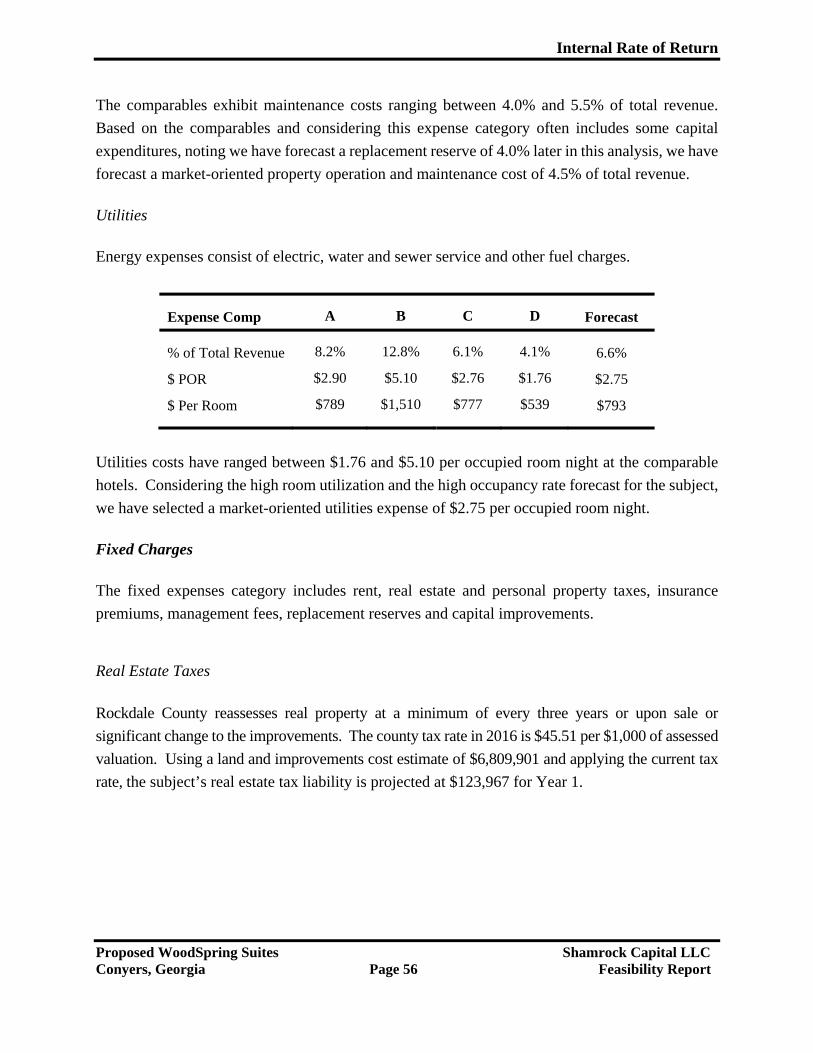
Internal Rate of Return
Proposed WoodSpring Suites Shamrock Capital LLC Conyers, Georgia Page 56 Feasibility Report
The comparables exhibit maintenance costs ranging between 4.0% and 5.5% of total revenue.
Based on the comparables and considering this expense category often includes some capital
expenditures, noting we have forecast a replacement reserve of 4.0% later in this analysis, we have
forecast a market-oriented property operation and maintenance cost of 4.5% of total revenue.
Utilities
Energy expenses consist of electric, water and sewer service and other fuel charges.
Expense Comp A B C D Forecast
% of Total Revenue 8.2% 12.8% 6.1% 4.1% 6.6%
$ POR $2.90 $5.10 $2.76 $1.76 $2.75
$ Per Room $789 $1,510 $777 $539 $793
Utilities costs have ranged between $1.76 and $5.10 per occupied room night at the comparable
hotels. Considering the high room utilization and the high occupancy rate forecast for the subject,
we have selected a market-oriented utilities expense of $2.75 per occupied room night.
Fixed Charges
The fixed expenses category includes rent, real estate and personal property taxes, insurance
premiums, management fees, replacement reserves and capital improvements.
Real Estate Taxes
Rockdale County reassesses real property at a minimum of every three years or upon sale or
significant change to the improvements. The county tax rate in 2016 is $45.51 per $1,000 of assessed
valuation. Using a land and improvements cost estimate of $6,809,901 and applying the current tax
rate, the subject’s real estate tax liability is projected at $123,967 for Year 1.
Internal Rate of Return
Proposed WoodSpring Suites Shamrock Capital LLC Conyers, Georgia Page 57 Feasibility Report
Personal Property Taxes
Rockdale County levies a tax on business furniture, fixtures and equipment based on the declared
depreciated value of the FF&E at the same 40% taxable value and $45.51 per $1,000 tax rate as
real property. Based on this, the subject’s Year 1 personal property tax liability is estimated at
$10,522.
Insurance
Insurance expenses included under fixed charges represent insurance premiums to be paid for
property and casualty insurance.
Expense Comp A B C D Forecast*
% of Total Revenue 1.4% 2.7% 2.3% 1.1% 2.1%
$ POR $0.50 $1.09 $1.06 $0.45 $0.88
$ Per Room $137 $321 $298 $139 $255
*Insurance is budgeted at $250 times 124 total units but the forecast calculates using 122 rentable units.
With the expense comparables showing a range from $137 to $321 per room, considering they
reflect allocated premiums based on a multi-property, multi-state purchase of coverages, and
noting the subject’s franchise (versus corporate) ownership, we have forecast a moderate single-
property insurance expense of $255 per rentable room or $31,110. Noting two rooms will be used
for a franchise-required guest attendant and another employee, this estimate is based on 124
guestrooms.
Management Fees
In the hotel management industry, a management fee of 2.0% to 5.0% of total revenues is typical.
Recognizing the location in which the facility operates, we have projected 3.0% of total revenues
as a reasonable market-oriented management fee. This reflects the need for professional and
adaptable management for an extended-stay property such as the subject.
Internal Rate of Return
Proposed WoodSpring Suites Shamrock Capital LLC Conyers, Georgia Page 58 Feasibility Report
Replacement Reserves
An expensive component of the operation of a property such as the subject is the maintenance of kitchen appliances, quality case goods, public area furnishings and other short-lived items. As the property will be a new extended-stay hotel expected to experience high utilization, we have used a replacement reserve of 4.0% of total revenues throughout the projection period. We believe most respondents in this segment actually do reserve, however, based upon our experience, this has rarely been enough to cover needed replacements.
Total Expenses
Incorporating all of the expense estimates outlined above into the operating statement, total
expenses for Year 1 are projected at $858,375 or 58.8% of total revenue.
Net Operating Income
The exhibit on the previous page summarizes all revenue and expense estimates described in this
section. The Year 1 Net Operating Income to be generated by the subject is estimated at $602,509
to include deductions for replacement reserves.
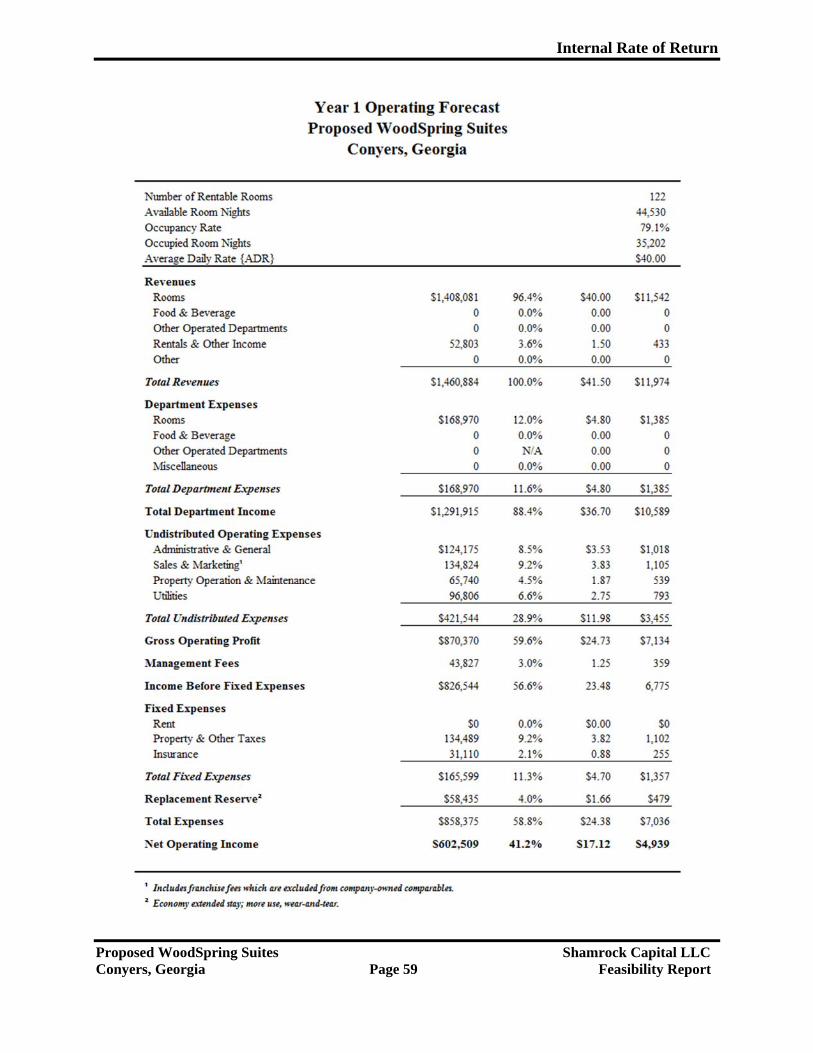
Internal Rate of Return
Proposed WoodSpring Suites Shamrock Capital LLC Conyers, Georgia Page 59 Feasibility Report
Internal Rate of Return
Proposed WoodSpring Suites Shamrock Capital LLC Conyers, Georgia Page 60 Feasibility Report
Internal Rate of Return (IRR)
Hotel and resort properties typically require higher internal rates of return than typical investment
real estate such as office buildings, shopping centers, apartment complexes, etc. This is due to the
fact that the risk level is generally perceived as being greater, largely due to the labor component
and uncertainty associated with hospitality operations. Investors recognize the uncertainty as a
higher risk factor requiring a higher yield on investment. Hotel and resort properties are subject
to constant changes in customer tastes and require significant expenditures to continually update.
Given such continually changing tastes, investors recognize the higher risk level, which also
translates into an appropriately higher rate of return than other forms of investment real estate. In
addition, financing on these properties is not always readily available.
Investment parameters have been based on the results of surveys of investment criteria, which have
been published by several hotel and real estate consulting companies. The nature, complexity and
location of the proposed subject property, the current desirability of hotel investments and the level
of risk involved indicate a rate of return that should be similar to the prevailing expectations of
investors for this type of investment-grade property. The hotel investor surveys indicate a seven-
year holding period as being typical. Therefore, the table on the following page summarizes the
proposed subject’s projected cash flow over this seven-year period.
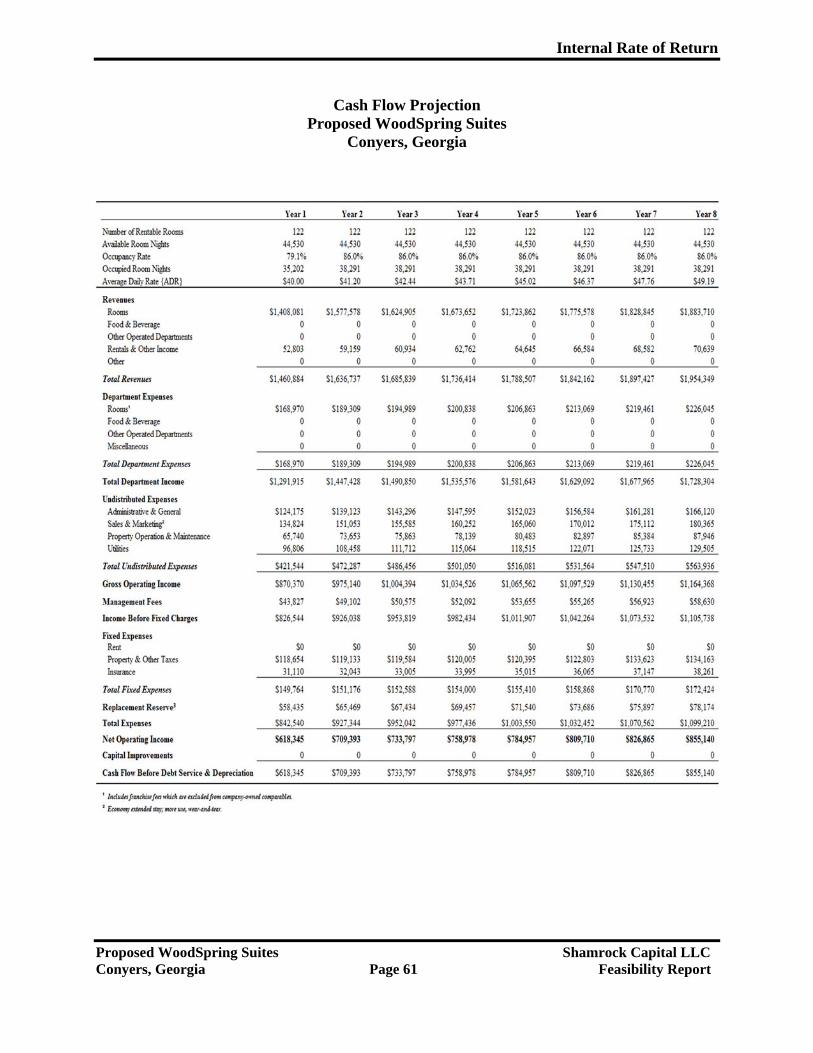
Internal Rate of Return
Proposed WoodSpring Suites Shamrock Capital LLC Conyers, Georgia Page 61 Feasibility Report
Cash Flow Projection Proposed WoodSpring Suites
Conyers, Georgia
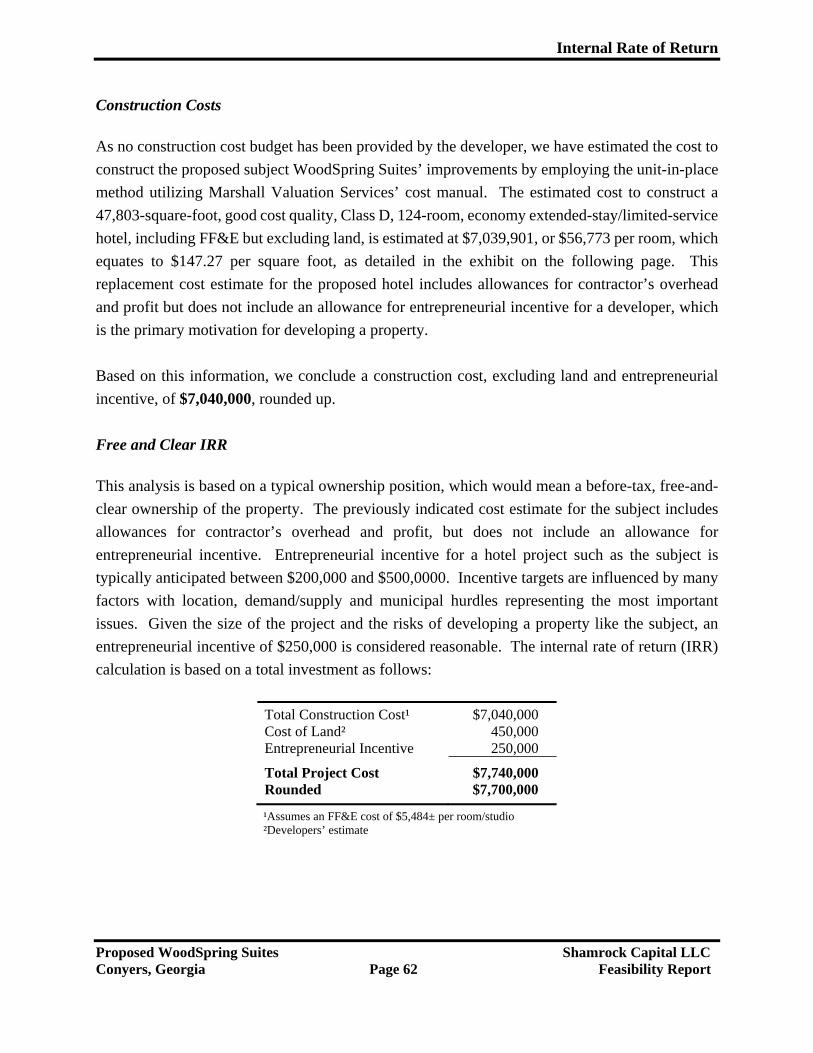
Internal Rate of Return
Proposed WoodSpring Suites Shamrock Capital LLC Conyers, Georgia Page 62 Feasibility Report
Construction Costs
As no construction cost budget has been provided by the developer, we have estimated the cost to
construct the proposed subject WoodSpring Suites’ improvements by employing the unit-in-place
method utilizing Marshall Valuation Services’ cost manual. The estimated cost to construct a
47,803-square-foot, good cost quality, Class D, 124-room, economy extended-stay/limited-service
hotel, including FF&E but excluding land, is estimated at $7,039,901, or $56,773 per room, which
equates to $147.27 per square foot, as detailed in the exhibit on the following page. This
replacement cost estimate for the proposed hotel includes allowances for contractor’s overhead
and profit but does not include an allowance for entrepreneurial incentive for a developer, which
is the primary motivation for developing a property.
Based on this information, we conclude a construction cost, excluding land and entrepreneurial
incentive, of $7,040,000, rounded up.
Free and Clear IRR
This analysis is based on a typical ownership position, which would mean a before-tax, free-and-
clear ownership of the property. The previously indicated cost estimate for the subject includes
allowances for contractor’s overhead and profit, but does not include an allowance for
entrepreneurial incentive. Entrepreneurial incentive for a hotel project such as the subject is
typically anticipated between $200,000 and $500,0000. Incentive targets are influenced by many
factors with location, demand/supply and municipal hurdles representing the most important
issues. Given the size of the project and the risks of developing a property like the subject, an
entrepreneurial incentive of $250,000 is considered reasonable. The internal rate of return (IRR)
calculation is based on a total investment as follows:
Total Construction Cost¹ $7,040,000 Cost of Land² 450,000 Entrepreneurial Incentive 250,000
Total Project Cost $7,740,000 Rounded $7,700,000
¹Assumes an FF&E cost of $5,484± per room/studio ²Developers’ estimate
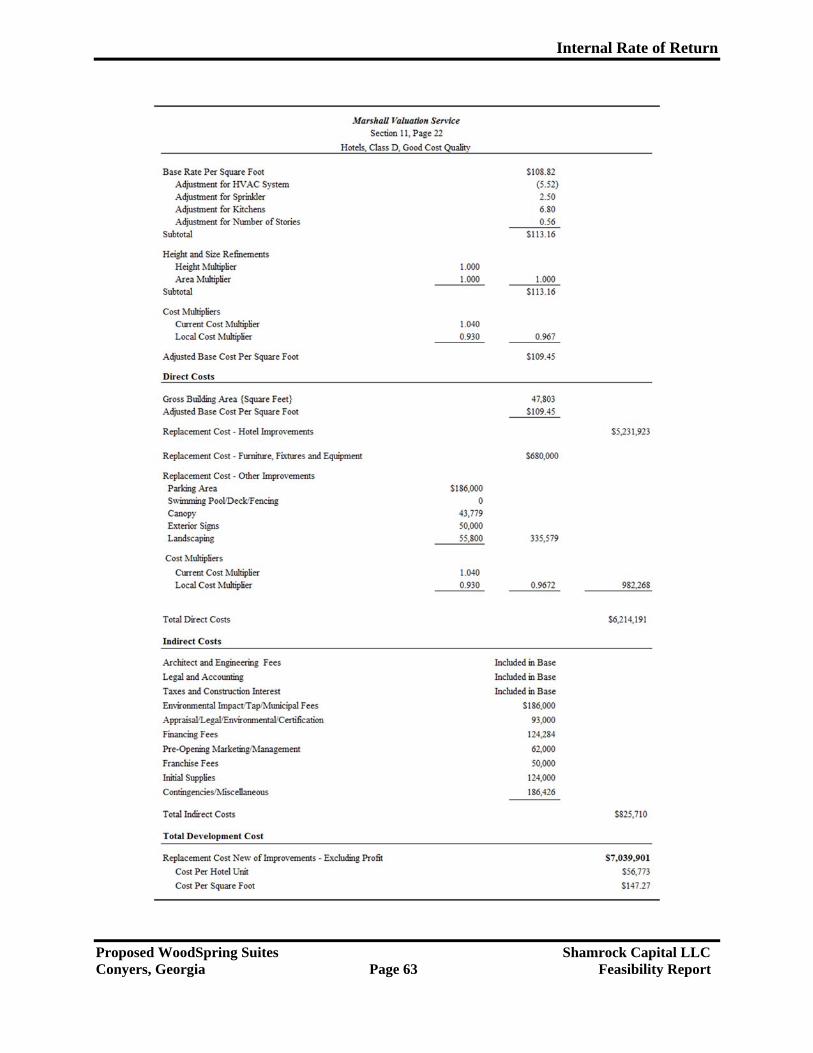
Internal Rate of Return
Proposed WoodSpring Suites Shamrock Capital LLC Conyers, Georgia Page 63 Feasibility Report
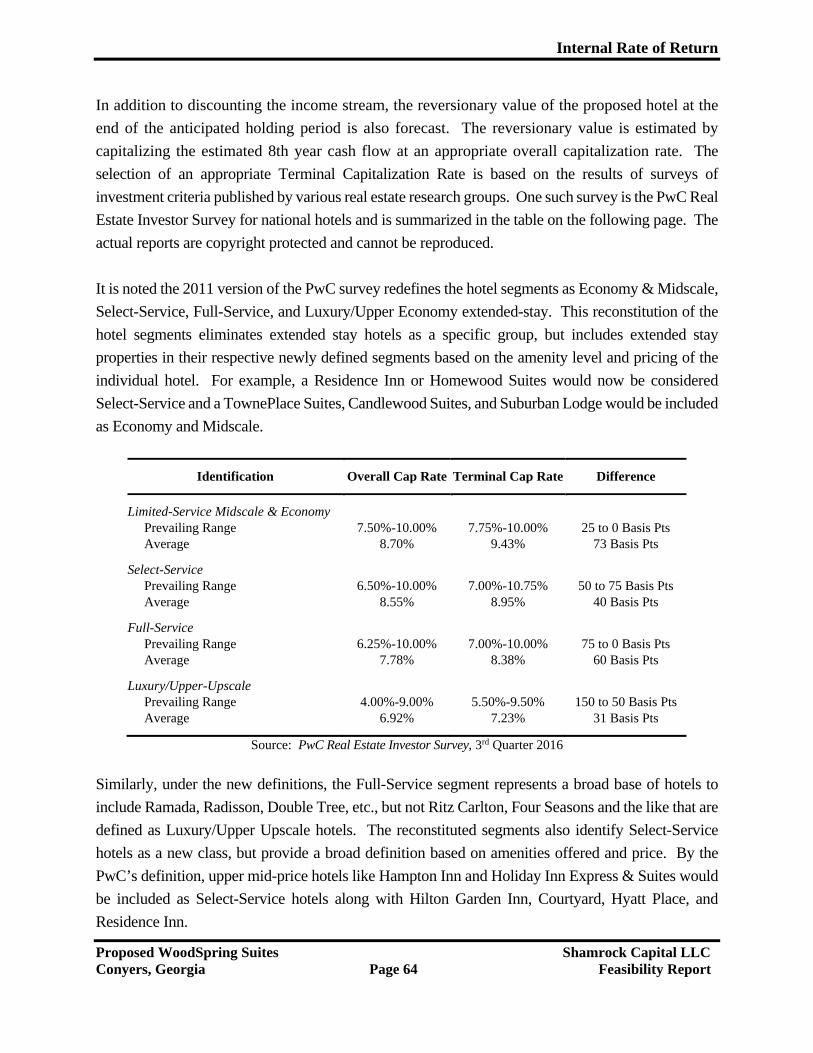
Internal Rate of Return
Proposed WoodSpring Suites Shamrock Capital LLC Conyers, Georgia Page 64 Feasibility Report
In addition to discounting the income stream, the reversionary value of the proposed hotel at the
end of the anticipated holding period is also forecast. The reversionary value is estimated by
capitalizing the estimated 8th year cash flow at an appropriate overall capitalization rate. The
selection of an appropriate Terminal Capitalization Rate is based on the results of surveys of
investment criteria published by various real estate research groups. One such survey is the PwC Real
Estate Investor Survey for national hotels and is summarized in the table on the following page. The
actual reports are copyright protected and cannot be reproduced.
It is noted the 2011 version of the PwC survey redefines the hotel segments as Economy & Midscale,
Select-Service, Full-Service, and Luxury/Upper Economy extended-stay. This reconstitution of the
hotel segments eliminates extended stay hotels as a specific group, but includes extended stay
properties in their respective newly defined segments based on the amenity level and pricing of the
individual hotel. For example, a Residence Inn or Homewood Suites would now be considered
Select-Service and a TownePlace Suites, Candlewood Suites, and Suburban Lodge would be included
as Economy and Midscale.
Identification Overall Cap Rate Terminal Cap Rate Difference
Limited-Service Midscale & Economy Prevailing Range 7.50%-10.00% 7.75%-10.00% 25 to 0 Basis Pts Average 8.70% 9.43% 73 Basis Pts
Select-Service Prevailing Range 6.50%-10.00% 7.00%-10.75% 50 to 75 Basis Pts Average 8.55% 8.95% 40 Basis Pts
Full-Service Prevailing Range 6.25%-10.00% 7.00%-10.00% 75 to 0 Basis Pts Average 7.78% 8.38% 60 Basis Pts
Luxury/Upper-Upscale Prevailing Range 4.00%-9.00% 5.50%-9.50% 150 to 50 Basis Pts Average 6.92% 7.23% 31 Basis Pts
Source: PwC Real Estate Investor Survey, 3rd Quarter 2016
Similarly, under the new definitions, the Full-Service segment represents a broad base of hotels to
include Ramada, Radisson, Double Tree, etc., but not Ritz Carlton, Four Seasons and the like that are
defined as Luxury/Upper Upscale hotels. The reconstituted segments also identify Select-Service
hotels as a new class, but provide a broad definition based on amenities offered and price. By the
PwC’s definition, upper mid-price hotels like Hampton Inn and Holiday Inn Express & Suites would
be included as Select-Service hotels along with Hilton Garden Inn, Courtyard, Hyatt Place, and
Residence Inn.
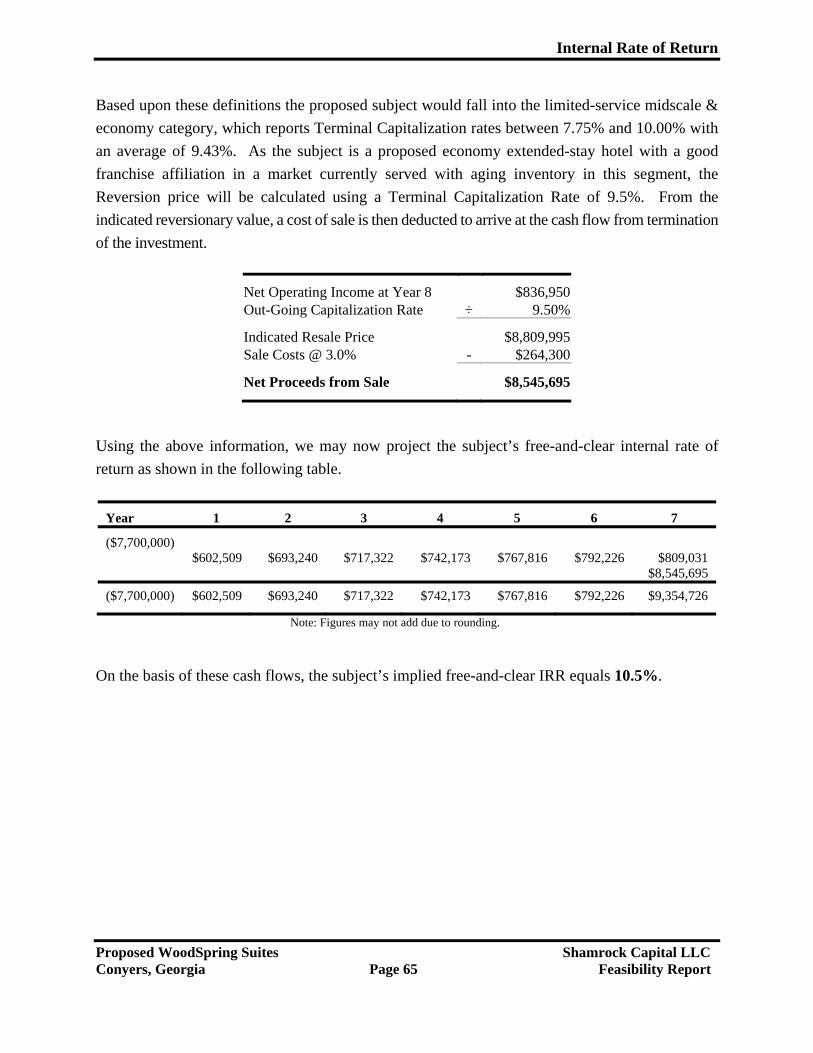
Internal Rate of Return
Proposed WoodSpring Suites Shamrock Capital LLC Conyers, Georgia Page 65 Feasibility Report
Based upon these definitions the proposed subject would fall into the limited-service midscale &
economy category, which reports Terminal Capitalization rates between 7.75% and 10.00% with
an average of 9.43%. As the subject is a proposed economy extended-stay hotel with a good
franchise affiliation in a market currently served with aging inventory in this segment, the
Reversion price will be calculated using a Terminal Capitalization Rate of 9.5%. From the
indicated reversionary value, a cost of sale is then deducted to arrive at the cash flow from termination
of the investment.
Net Operating Income at Year 8 $836,950 Out-Going Capitalization Rate ÷ 9.50%
Indicated Resale Price $8,809,995 Sale Costs @ 3.0% - $264,300
Net Proceeds from Sale $8,545,695
Using the above information, we may now project the subject’s free-and-clear internal rate of
return as shown in the following table.
Year 1 2 3 4 5 6 7
($7,700,000)$602,509 $693,240 $717,322 $742,173 $767,816 $792,226 $809,031
$8,545,695
($7,700,000) $602,509 $693,240 $717,322 $742,173 $767,816 $792,226 $9,354,726
Note: Figures may not add due to rounding.
On the basis of these cash flows, the subject’s implied free-and-clear IRR equals 10.5%.
Conclusion
Proposed WoodSpring Suites Shamrock Capital LLC Conyers, Georgia Page 66 Feasibility Report
Conclusion
Free-and-Clear IRR
The free-and-clear investment in the subject property implies an IRR of 10.5%. The 3rd quarter
2016 PwC survey indicates required discount rates (IRRs) for limited-service midscale & economy
hotels currently range from 8.5% to 12.0% with an average of 10.55%. Therefore, the indicated
unleveraged return of 10.5% for the proposed subject hotel meets the risk-adjusted expectations
of investors based on accepted market returns for similar hotel investments.
Investment Caveats
The conclusions in this report are based on the preceding revenue and expense projections and the
assumptions stated herein. Any investment decision must be considered in the context of the risk
of the investment. The salient considerations of the investment in the proposed hotel can be
summarized as follows:
1. The subject hotel is proposed; therefore, the improvements have not been built. This
analysis is based on the premise that the property can be developed with a total investment
of $7,700,000, including land. If the improvements, including site work, construction,
FF&E and indirect costs, cannot be completed within budget, the estimated internal rate of
return would be diminished; conversely, if savings can be achieved, the rate of return will
be increased. The indicated return on this estimated total investment is acceptable based
on market expectations.
2. We have projected the proposed subject to stabilize in Year 2 at an occupancy rate of 86.0%
and an average daily/weekly rate of $41.20/$288.40. This level of utilization produces an
average free-and-clear internal rate of return of 10.5%. Changes in the economy extended-
stay hotel market could influence the results of this analysis.
3. Although we have estimated an acceptable internal rate of return for this investment, this
not an appraisal and no value estimate has been concluded.
Conclusion
Proposed WoodSpring Suites Shamrock Capital LLC Conyers, Georgia Page 67 Feasibility Report
Investment Considerations
The salient considerations of an investment in the proposed hotel can be summarized as follows:
1. As part of the nation’s largest economy extended-stay hotel brand, WoodSpring Hotels, inan exurb of a major metro market with aging competitors, the proposed subject’s 122rentable hotel rooms/studios are expected to compete favorably for intermediate- and long-stay guests, including film crews, who prefer affordable, purpose-built, extended-stay/transitional housing accommodations with kitchens over the current marketalternatives of non-purpose-built lodging venues or the one higher-priced extended stayhotel in the market.
2. Within 10 minutes by car from the site of the proposed hotel are such important amenitiesas:
a. automobile service centers and gas stationsb. big-box retail storesc. drug storesd. grocery storese. nationally affiliated casual dining venuesf. nationally affiliated fast food restaurant venuesg. regional shopping mallh. satellite malls/strip centersi. Georgia International Horse Parkj. small industrial parksk. apartment complexesl. health services facilitiesm. hotels (franchise & independent)
3. The Trends section of this report details the market demand for an economy extended-stayhotel such as the proposed WoodSpring Suites. It also discusses the prospects foracceptance of the proposed hotel. In our view, the following will be required ofmanagement to ensure the success of this investment:
a. Implement a weekly-rate pricing strategy that will appeal to two major demand
segments—construction and film crew-related extended stay.
Conclusion
Proposed WoodSpring Suites Shamrock Capital LLC Conyers, Georgia Page 68 Feasibility Report
b. Initiate a strong pre-opening outreach and familiarization marketing effort focused
on regional general contractors and subcontractors, film companies, medical and
assisted-living facilities (existing and proposed), local apartment complexes,
business parks and proposed construction projects.
c. Considering the subject’s proposed location, we would suggest the inclusion of the
brand’s optional convenience store as a significant competitive advantage over
others in the market.
Analyst Certification
Proposed WoodSpring Suites Shamrock Capital LLC Conyers, Georgia Page 69 Feasibility Report
Analysts’ Certification
We certify that, to the best of our knowledge and belief,
1. The statements of fact contained in this report are true and correct.
2. The reported analyses, opinions and conclusions are limited only by the reported assumptions
and limiting conditions, and are our personal, unbiased, professional analyses, opinions and
conclusions.
3. We have no present or prospective interest in the property that is the subject of this report, and
we have no personal interest or bias with respect to the parties involved.
4. We have no bias with respect to the property that is the subject of this report or to the parties
involved in this assignment.
5. Our engagement in this assignment was not contingent upon developing or reporting
predetermined results.
6. Our compensation for completing this assignment is not contingent upon the development or
reporting of a predetermined value or direction in value that favors the cause of the Client, the
amount of the value opinion, the attainment of a stipulated result, or the occurrence of a
subsequent event directly related to the intended use of this market study.
7. Our analyses, opinions and conclusions were developed, and this report has been prepared, in
conformity with the Uniform Standards of Professional Appraisal Practice (USPAP).
8. The use of this report is subject to the requirements of the Appraisal Institute relating to review
by its duly authorized representatives.
9. No one other than the undersigned have provided professional assistance in the preparation of
this report and the analyses herein.
10. As of the date of this report, Christopher M. Keegan has completed the requirements under
the continuing education program of the Appraisal Institute for Candidates.
Analyst Certification
Proposed WoodSpring Suites Shamrock Capital LLC Conyers, Georgia Page 70 Feasibility Report
Analysts’ Certification (Continued)
11. The analysts have performed within the context of the competency provision of the Uniform
Standards of Professional Appraisal Practice.
12. Our contractual arrangement with the Client does not authorize the out-of-context quoting
from or partial reprinting of this report, nor does it permit all or any part of this report to be
disseminated to the general public by the use of media for public communication without our
written consent.
Shamrock Capital LLC
Robert P. Hill Christopher M. Keegan

ADDENDA

ENGAGEMENT LETTER
322 N Forest Boulevard, Lake Mary, FL 32746 [email protected] ● (407) 732.6228
SHAMROCK CAPITAL ASSOCIATES
October 17, 2016
Mountain View Hospitality, LLC
c/o Mr. David Babatope
RE/MAX Paramount Properties
1605 Mansell Road, Suite C
Alpharetta, Georgia 30009
Re: Feasibility Study
Proposed WoodSpring Suites
2000 West Iris Drive
Conyers, Georgia 30013
Dear Mr. Babatope,
We are pleased to submit this proposal for professional services in connection with a feasibility
study for the above-referenced property. This study will assist you and your client, Mountain
View Hospitality, LLC, in your analysis of this project for investment and financing purposes and
serve as the foundation for estimating future revenues and expenses. The study would include:
Site Analysis
We will analyze the topography, access, visibility, ambiance and advantages/disadvantages of the
subject site in comparison to competitive facilities. Environmental issues such as wetlands,
wildlife and water consumption will be considered, but we are not experts in this area, and we
recommend retaining an environmental expert to study these issues.
Area Review
We will gather and summarize demographic and other relevant data regarding the market area to
document the economic environment of the market. We will examine key economic factors that
influence demand for rooms and housing. Specific emphasis will be given to the trends in the
market segments, which potentially comprise the principal target markets for the hotel.
Shamrock Capital Associates
Page 2
October 17, 2016
Primary Research
We will perform primary market research to gather the most recent and pertinent data about the
area hotel and apartment markets. This will include an inspection and interviews at competitive
facilities and discussions with managers and marketing staff knowledgeable about the competitive
market. Those we might interview could include:
managers of competitive hotels and/or apartment complexes
marketing personnel at competitive hotels and/or apartment complexes
hotel and/or apartment developers
Convention & Visitors Bureau
representatives of relevant companies and associations
city/county planning, zoning, economic development and transportation officials
Our survey of competitive and comparable hotels/apartments in the market area will address the
types of facilities, amenities available, and average daily/weekly/monthly rates offered and/or
realized.
Supply and Demand Analysis
Based on our area review and primary research, we will estimate potential growth in the demand
for and the supply of competitive hotels and/or apartments in the local and regional market area.
We will evaluate each of the principal segments of demand; describe its characteristics, the
market’s historical performance and anticipated future performance based on demographics and
the economics of the market from which the proposed hotel will attract guests.
We will relate the proposed hotel to the competitive supply to determine its theoretical “fair share”
ratio. Then we will compare the proposed hotel to its competitive supply based on such identifiable
attributes demanded of market participants as location and proximity to demand generators;
proximity to amenities, retail corridors and highway/interstate access points; affordability, rental
terms, ambiance and product quality. Based on our comparative analysis, we will then forecast
the proposed hotel’s expected capture/penetration rate vis à vis its fair share.
Shamrock Capital Associates
Page 3
October 17, 2016
Fees and Study Timetable
Our professional fee is based on the anticipated time of the individual(s) assigned to the
engagement and includes direct expenses. Our fee and date of delivery of the report will be as
follows:
Feasibility Study & Report ………………………………………….. $6,500
Delivery Date …………………………………………………………. 4-5 weeks¹
¹ from date of receipt of retainer
A retainer of fifty percent (50%) of the total fee for the Feasibility Study and Report is required
for work to commence. The balance is due and payable before delivery of the completed report.
Limitations of the Study
1. The conclusions reached will be based on our knowledge of the hotel and/or apartment
market in the competitive area as of the time of completion of our fieldwork.
2. As in all studies of this type, the estimated annual operating results, if included, are based
upon competent and efficient management and presume no significant change in the
competitive position of the competitive facilities in the area from those set forth in our
study.
3. Estimated operating results are also based on an evaluation of the present general economy
of the area and do not take into account, or make provisions for, the effect of any sharp rise
or decline in local or general economic conditions which may occur. To the extent that
wages and other operating expenses may advance over the economic life of the property,
it is expected that rates, fees and related services will be adjusted to offset such advances.
Shamrock Capital Associates
Page 4
October 17, 2016
4. The prospective financial information included in our reports will be based on estimates,
assumptions and information developed from research of the market, knowledge of the
industry and meetings with the property management. The sources of information and
bases of the estimates and assumptions would be stated in the reports. Some assumptions
inevitably would not materialize, and unanticipated events and circumstances may occur;
therefore, actual results achieved during the period covered by the prospective financial
analysis would vary from the estimates, and the variations may be material. Our reports
will contain a statement to that effect.
5. The terms of this engagement are such that we have no obligation to revise the report or
the prospective financial information to reflect events or conditions which occur
subsequent to the date of the report, which will be the day we complete our fieldwork.
However, we will be available to discuss the necessity for revision in view of changes, if
any, in the economic or market factors affecting the project.
6. Our report and the prospective financial information included therein will be intended
solely for your information and in support of financing. Neither the report nor its contents
may be referred to or quoted in any offering circular or registration statement, prospectus,
sales brochure, loan, appraisal or other agreement or document without our prior consent,
which will be granted only upon meeting certain conditions. Our report will contain a
statement to that effect.
7. Any drafts or preliminary information communicated to you during the course of the
assignment are for internal management use only, and may not be disclosed to any outside
third parties without our prior written consent.
8. Further, we will neither evaluate management’s effectiveness nor be responsible for future
marketing efforts and other management actions upon which actual results would depend,
and we would so state in our reports.

Shamrock Capital Associates
Page 5
October 17, 2016
In the event the Client cancels this agreement before a report is tendered, then Client agrees to pay
Appraiser, at Appraiser’s then existing external billing rates, for all time and expenses expended
on the project, giving over and above that to which the retainer has been applied. Shamrock Capital
Associates is authorized to commence work upon the signing of the agreement. If this account is
turned over to an attorney or collection agency, all charges, including reasonable attorney’s fees
and/or court costs, will be added to the balance due and be paid by the Client. The parties hereby
agree to confer jurisdiction and venue in the State and Federal Courts situated in Seminole County,
Florida.
It is agreed that the liability of Shamrock Capital Associates to the Client is limited to the amount of
the fee paid for the completion of the consulting assignment. Shamrock Capital Associates limits
their responsibility to the Client and any use of the feasibility study by third parties shall be at the risk
of the Client and/or said third parties. The Client, by the execution of this agreement, acknowledges
that he has read and agrees to the terms and conditions of this contract and agrees to the inclusion of
a standard set of General Assumptions and Limiting Conditions in the report.
The evaluations and analyses in the report will be the opinion of Shamrock Capital Associates and
the fee or the payment thereof is in no way contingent upon any particular conclusions. The fee
for this study is for the service rendered and not necessarily for the time spent on the physical
report. This agreement is subject to receipt of this fully executed document and the information
requested on or before 7 days from the date of this proposal.
Shamrock Capital Associates (Client/Entity Name)
(Company)
(Signature)
(Signature)
October 17, 2016 (Date of Signature) (Date of Signature)

SURVEY
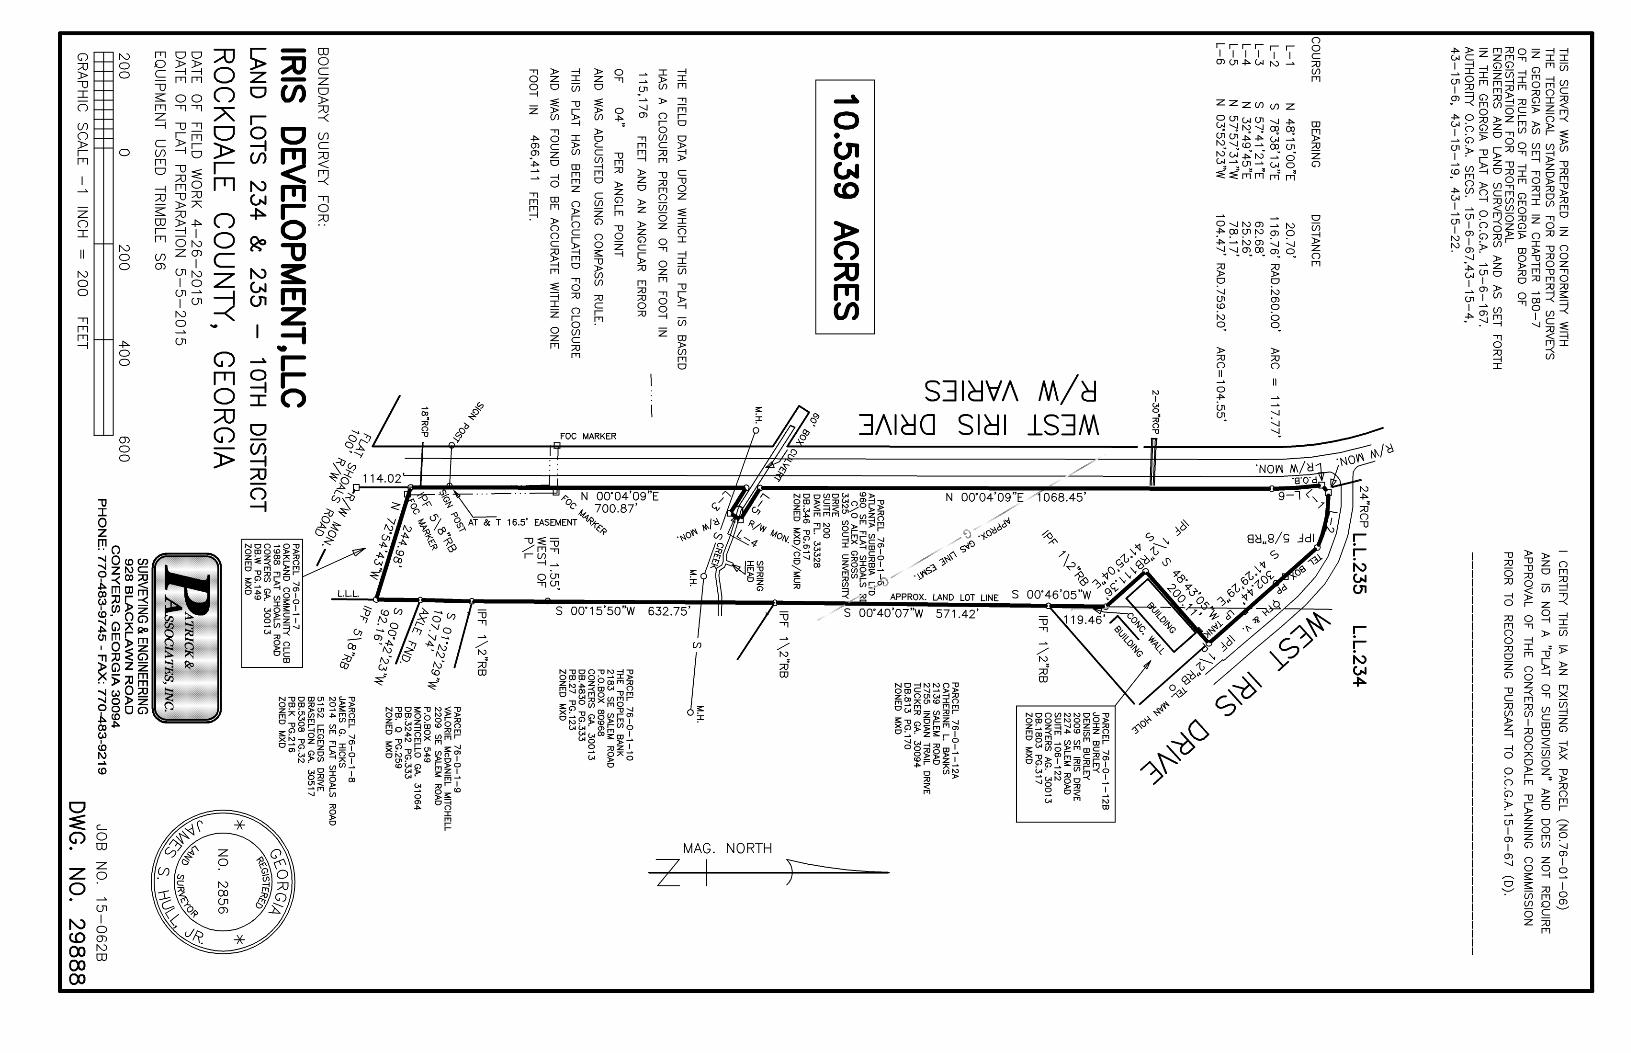

SITE PLAN
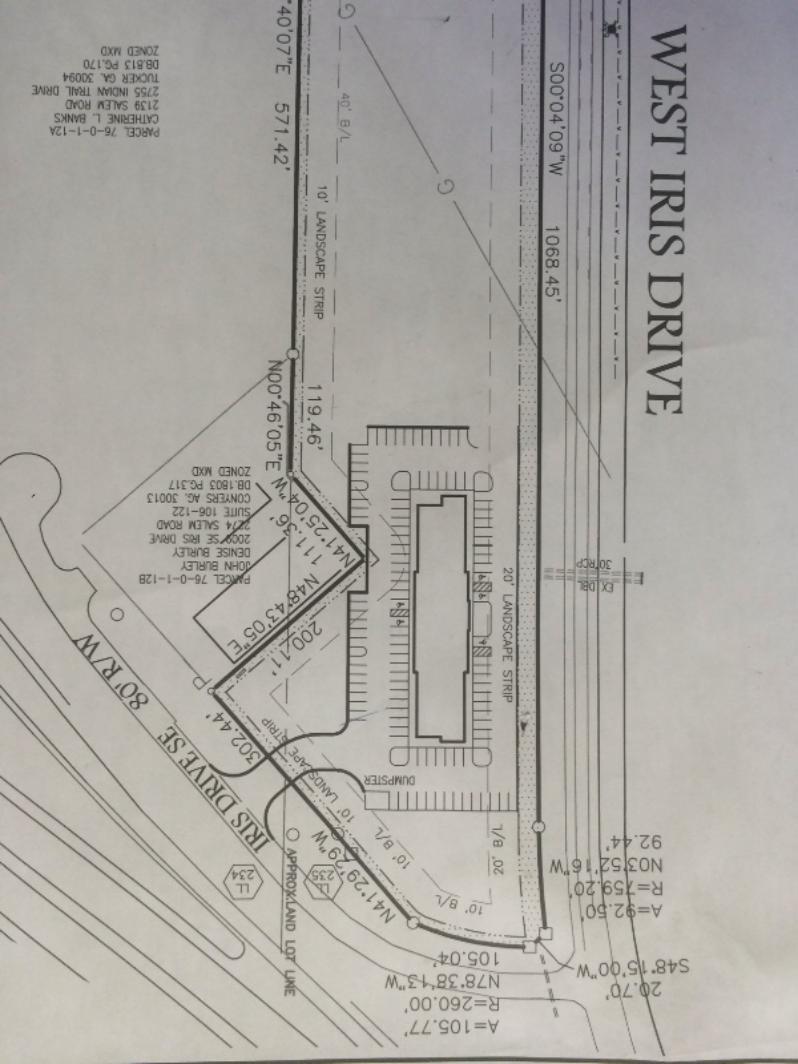

CUSTOM SMITH TRAVEL TREND REPORT
Trend # 829959_CADIMADIM / Created November 16, 2016
Table of Contents 1
Year to Date and Total Year 2
Data by Month 3
Classic 4
Percent Change from Previous Year 5
Twelve Month Moving Average 6
Analysis by Day of Week 7
Response Report - Group1 8
Response Report - Group2 9
Help 10
Terms and Conditions 11
735 East Main Street, Hendersonville, TN 37075 Blue Fin Building, 110 Southwark Street, London SE1 OTA
T: +1 615 824 8664 T: +44 (0)20 7922 1930
[email protected] www.str.com [email protected] www.str.com
Trend Report - Conyers, GA Area Selected Properties vs Conyers, GA Area Selected
Properties
The STR Trend Report is a publication of STR, Inc. and STR Global, Ltd., and is intended solely for use by paid subscribers. Reproduction or distribution of the STR Trend Report, in whole or part, without written permission
is prohibited and subject to legal action. If you have received this report and are NOT a subscriber to the STR Trend report, please contact us immediately. Source: 2016 STR, Inc. / STR Global, Ltd. trading as “STR”.
January 2010 to September 2016 Currency : USD - US Dollar
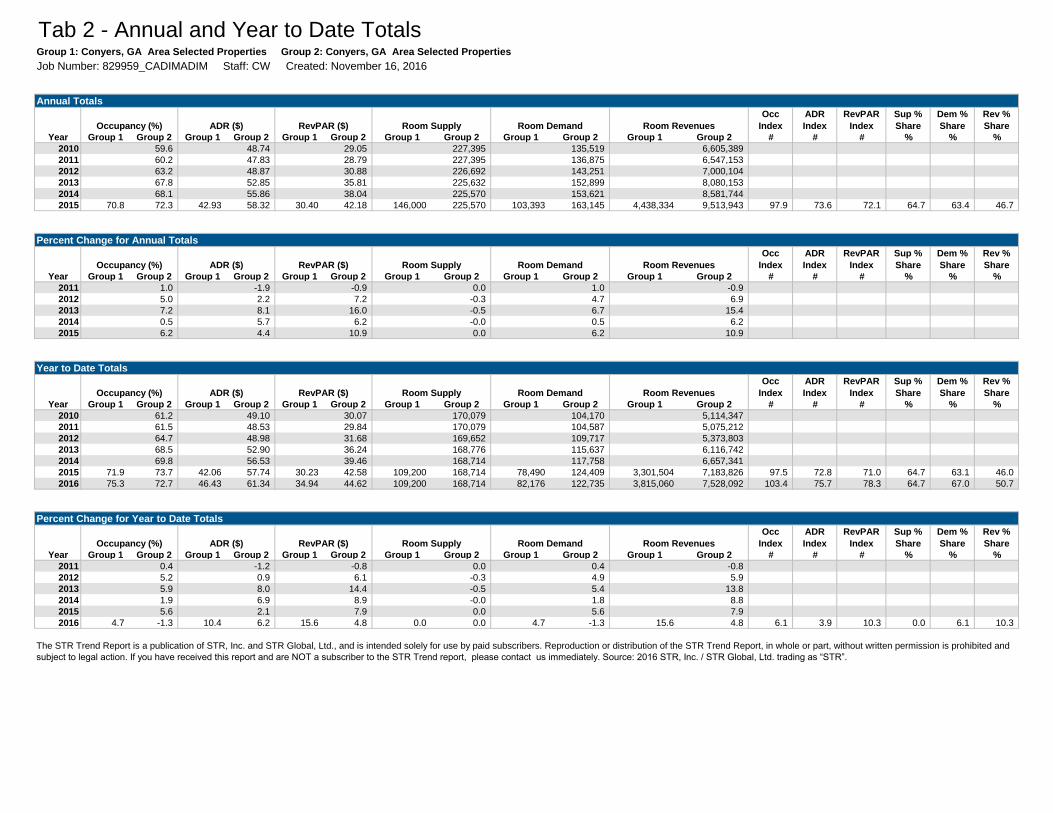
Tab 2 - Annual and Year to Date TotalsGroup 1: Conyers, GA Area Selected Properties Group 2: Conyers, GA Area Selected Properties
Job Number: 829959_CADIMADIM Staff: CW Created: November 16, 2016
Annual Totals
Occ
Index
ADR
Index
RevPAR
Index
Sup %
Share
Dem %
Share
Rev %
Share
Year Group 1 Group 2 Group 1 Group 2 Group 1 Group 2 Group 1 Group 2 Group 1 Group 2 Group 1 Group 2 # # # % % %
2010 59.6 48.74 29.05 227,395 135,519 6,605,389
2011 60.2 47.83 28.79 227,395 136,875 6,547,153
2012 63.2 48.87 30.88 226,692 143,251 7,000,104
2013 67.8 52.85 35.81 225,632 152,899 8,080,153
2014 68.1 55.86 38.04 225,570 153,621 8,581,744
2015 70.8 72.3 42.93 58.32 30.40 42.18 146,000 225,570 103,393 163,145 4,438,334 9,513,943 97.9 73.6 72.1 64.7 63.4 46.7
Percent Change for Annual Totals
Occ
Index
ADR
Index
RevPAR
Index
Sup %
Share
Dem %
Share
Rev %
Share
Year Group 1 Group 2 Group 1 Group 2 Group 1 Group 2 Group 1 Group 2 Group 1 Group 2 Group 1 Group 2 # # # % % %
2011 1.0 -1.9 -0.9 0.0 1.0 -0.9
2012 5.0 2.2 7.2 -0.3 4.7 6.9
2013 7.2 8.1 16.0 -0.5 6.7 15.4
2014 0.5 5.7 6.2 -0.0 0.5 6.2
2015 6.2 4.4 10.9 0.0 6.2 10.9
Year to Date Totals
Occ
Index
ADR
Index
RevPAR
Index
Sup %
Share
Dem %
Share
Rev %
Share
Year Group 1 Group 2 Group 1 Group 2 Group 1 Group 2 Group 1 Group 2 Group 1 Group 2 Group 1 Group 2 # # # % % %
2010 61.2 49.10 30.07 170,079 104,170 5,114,347
2011 61.5 48.53 29.84 170,079 104,587 5,075,212
2012 64.7 48.98 31.68 169,652 109,717 5,373,803
2013 68.5 52.90 36.24 168,776 115,637 6,116,742
2014 69.8 56.53 39.46 168,714 117,758 6,657,341
2015 71.9 73.7 42.06 57.74 30.23 42.58 109,200 168,714 78,490 124,409 3,301,504 7,183,826 97.5 72.8 71.0 64.7 63.1 46.0
2016 75.3 72.7 46.43 61.34 34.94 44.62 109,200 168,714 82,176 122,735 3,815,060 7,528,092 103.4 75.7 78.3 64.7 67.0 50.7
Percent Change for Year to Date Totals
Occ
Index
ADR
Index
RevPAR
Index
Sup %
Share
Dem %
Share
Rev %
Share
Year Group 1 Group 2 Group 1 Group 2 Group 1 Group 2 Group 1 Group 2 Group 1 Group 2 Group 1 Group 2 # # # % % %
2011 0.4 -1.2 -0.8 0.0 0.4 -0.8
2012 5.2 0.9 6.1 -0.3 4.9 5.9
2013 5.9 8.0 14.4 -0.5 5.4 13.8
2014 1.9 6.9 8.9 -0.0 1.8 8.8
2015 5.6 2.1 7.9 0.0 5.6 7.9
2016 4.7 -1.3 10.4 6.2 15.6 4.8 0.0 0.0 4.7 -1.3 15.6 4.8 6.1 3.9 10.3 0.0 6.1 10.3
The STR Trend Report is a publication of STR, Inc. and STR Global, Ltd., and is intended solely for use by paid subscribers. Reproduction or distribution of the STR Trend Report, in whole or part, without written permission is prohibited and
subject to legal action. If you have received this report and are NOT a subscriber to the STR Trend report, please contact us immediately. Source: 2016 STR, Inc. / STR Global, Ltd. trading as “STR”.
Occupancy (%) ADR ($) RevPAR ($) Room Supply Room Demand Room Revenues
Occupancy (%) ADR ($) RevPAR ($) Room Supply Room Demand Room Revenues
Occupancy (%) ADR ($) RevPAR ($) Room Supply Room Demand Room Revenues
Occupancy (%) ADR ($) RevPAR ($) Room Supply Room Demand Room Revenues
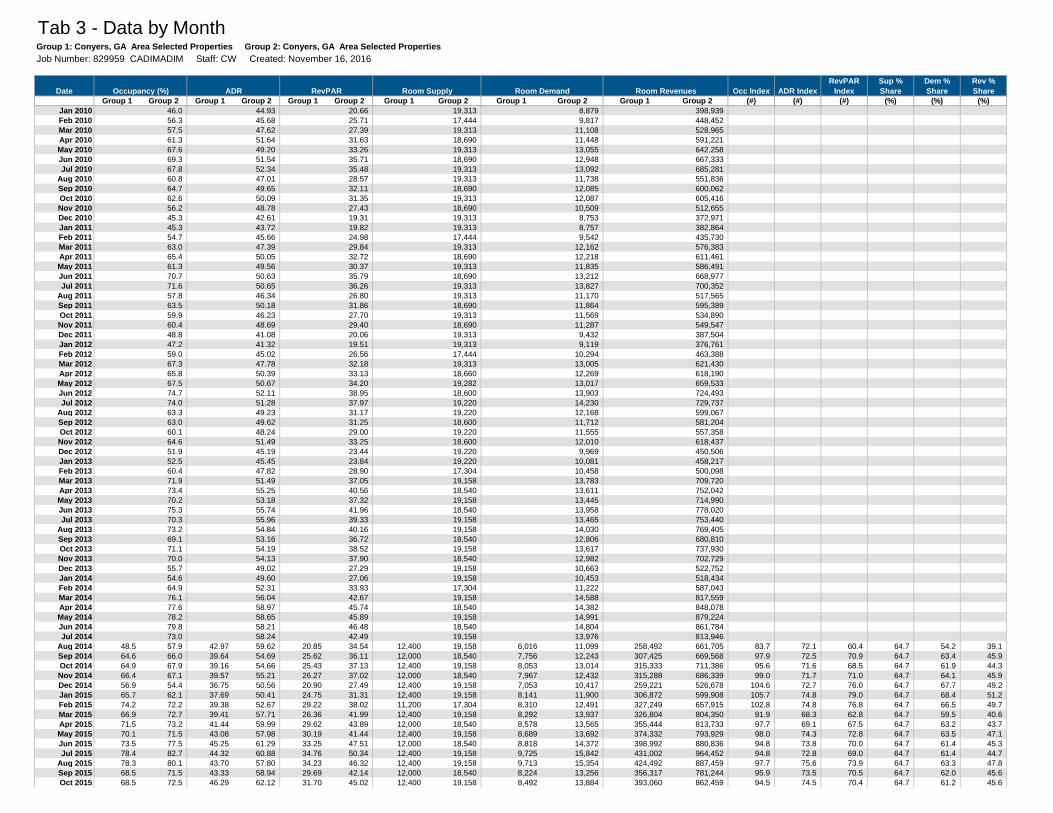
Tab 3 - Data by MonthGroup 1: Conyers, GA Area Selected Properties Group 2: Conyers, GA Area Selected Properties
Job Number: 829959_CADIMADIM Staff: CW Created: November 16, 2016
Date Occupancy (%) ADR RevPAR Room Supply Room Demand Room Revenues Occ Index ADR Index
RevPAR
Index
Sup %
Share
Dem %
Share
Rev %
Share
Group 1 Group 2 Group 1 Group 2 Group 1 Group 2 Group 1 Group 2 Group 1 Group 2 Group 1 Group 2 (#) (#) (#) (%) (%) (%)
Jan 2010 46.0 44.93 20.66 19,313 8,879 398,939
Feb 2010 56.3 45.68 25.71 17,444 9,817 448,452
Mar 2010 57.5 47.62 27.39 19,313 11,108 528,965
Apr 2010 61.3 51.64 31.63 18,690 11,448 591,221
May 2010 67.6 49.20 33.26 19,313 13,055 642,258
Jun 2010 69.3 51.54 35.71 18,690 12,948 667,333
Jul 2010 67.8 52.34 35.48 19,313 13,092 685,281
Aug 2010 60.8 47.01 28.57 19,313 11,738 551,836
Sep 2010 64.7 49.65 32.11 18,690 12,085 600,062
Oct 2010 62.6 50.09 31.35 19,313 12,087 605,416
Nov 2010 56.2 48.78 27.43 18,690 10,509 512,655
Dec 2010 45.3 42.61 19.31 19,313 8,753 372,971
Jan 2011 45.3 43.72 19.82 19,313 8,757 382,864
Feb 2011 54.7 45.66 24.98 17,444 9,542 435,730
Mar 2011 63.0 47.39 29.84 19,313 12,162 576,383
Apr 2011 65.4 50.05 32.72 18,690 12,218 611,461
May 2011 61.3 49.56 30.37 19,313 11,835 586,491
Jun 2011 70.7 50.63 35.79 18,690 13,212 668,977
Jul 2011 71.6 50.65 36.26 19,313 13,827 700,352
Aug 2011 57.8 46.34 26.80 19,313 11,170 517,565
Sep 2011 63.5 50.18 31.86 18,690 11,864 595,389
Oct 2011 59.9 46.23 27.70 19,313 11,569 534,890
Nov 2011 60.4 48.69 29.40 18,690 11,287 549,547
Dec 2011 48.8 41.08 20.06 19,313 9,432 387,504
Jan 2012 47.2 41.32 19.51 19,313 9,119 376,761
Feb 2012 59.0 45.02 26.56 17,444 10,294 463,388
Mar 2012 67.3 47.78 32.18 19,313 13,005 621,430
Apr 2012 65.8 50.39 33.13 18,660 12,269 618,190
May 2012 67.5 50.67 34.20 19,282 13,017 659,533
Jun 2012 74.7 52.11 38.95 18,600 13,903 724,493
Jul 2012 74.0 51.28 37.97 19,220 14,230 729,737
Aug 2012 63.3 49.23 31.17 19,220 12,168 599,067
Sep 2012 63.0 49.62 31.25 18,600 11,712 581,204
Oct 2012 60.1 48.24 29.00 19,220 11,555 557,358
Nov 2012 64.6 51.49 33.25 18,600 12,010 618,437
Dec 2012 51.9 45.19 23.44 19,220 9,969 450,506
Jan 2013 52.5 45.45 23.84 19,220 10,081 458,217
Feb 2013 60.4 47.82 28.90 17,304 10,458 500,098
Mar 2013 71.9 51.49 37.05 19,158 13,783 709,720
Apr 2013 73.4 55.25 40.56 18,540 13,611 752,042
May 2013 70.2 53.18 37.32 19,158 13,445 714,990
Jun 2013 75.3 55.74 41.96 18,540 13,958 778,020
Jul 2013 70.3 55.96 39.33 19,158 13,465 753,440
Aug 2013 73.2 54.84 40.16 19,158 14,030 769,405
Sep 2013 69.1 53.16 36.72 18,540 12,806 680,810
Oct 2013 71.1 54.19 38.52 19,158 13,617 737,930
Nov 2013 70.0 54.13 37.90 18,540 12,982 702,729
Dec 2013 55.7 49.02 27.29 19,158 10,663 522,752
Jan 2014 54.6 49.60 27.06 19,158 10,453 518,434
Feb 2014 64.9 52.31 33.93 17,304 11,222 587,043
Mar 2014 76.1 56.04 42.67 19,158 14,588 817,559
Apr 2014 77.6 58.97 45.74 18,540 14,382 848,078
May 2014 78.2 58.65 45.89 19,158 14,991 879,224
Jun 2014 79.8 58.21 46.48 18,540 14,804 861,784
Jul 2014 73.0 58.24 42.49 19,158 13,976 813,946
Aug 2014 48.5 57.9 42.97 59.62 20.85 34.54 12,400 19,158 6,016 11,099 258,492 661,705 83.7 72.1 60.4 64.7 54.2 39.1
Sep 2014 64.6 66.0 39.64 54.69 25.62 36.11 12,000 18,540 7,756 12,243 307,425 669,568 97.9 72.5 70.9 64.7 63.4 45.9
Oct 2014 64.9 67.9 39.16 54.66 25.43 37.13 12,400 19,158 8,053 13,014 315,333 711,386 95.6 71.6 68.5 64.7 61.9 44.3
Nov 2014 66.4 67.1 39.57 55.21 26.27 37.02 12,000 18,540 7,967 12,432 315,288 686,339 99.0 71.7 71.0 64.7 64.1 45.9
Dec 2014 56.9 54.4 36.75 50.56 20.90 27.49 12,400 19,158 7,053 10,417 259,221 526,678 104.6 72.7 76.0 64.7 67.7 49.2
Jan 2015 65.7 62.1 37.69 50.41 24.75 31.31 12,400 19,158 8,141 11,900 306,872 599,908 105.7 74.8 79.0 64.7 68.4 51.2
Feb 2015 74.2 72.2 39.38 52.67 29.22 38.02 11,200 17,304 8,310 12,491 327,249 657,915 102.8 74.8 76.8 64.7 66.5 49.7
Mar 2015 66.9 72.7 39.41 57.71 26.36 41.99 12,400 19,158 8,292 13,937 326,804 804,350 91.9 68.3 62.8 64.7 59.5 40.6
Apr 2015 71.5 73.2 41.44 59.99 29.62 43.89 12,000 18,540 8,578 13,565 355,444 813,733 97.7 69.1 67.5 64.7 63.2 43.7
May 2015 70.1 71.5 43.08 57.98 30.19 41.44 12,400 19,158 8,689 13,692 374,332 793,929 98.0 74.3 72.8 64.7 63.5 47.1
Jun 2015 73.5 77.5 45.25 61.29 33.25 47.51 12,000 18,540 8,818 14,372 398,992 880,836 94.8 73.8 70.0 64.7 61.4 45.3
Jul 2015 78.4 82.7 44.32 60.88 34.76 50.34 12,400 19,158 9,725 15,842 431,002 964,452 94.8 72.8 69.0 64.7 61.4 44.7
Aug 2015 78.3 80.1 43.70 57.80 34.23 46.32 12,400 19,158 9,713 15,354 424,492 887,459 97.7 75.6 73.9 64.7 63.3 47.8
Sep 2015 68.5 71.5 43.33 58.94 29.69 42.14 12,000 18,540 8,224 13,256 356,317 781,244 95.9 73.5 70.5 64.7 62.0 45.6
Oct 2015 68.5 72.5 46.29 62.12 31.70 45.02 12,400 19,158 8,492 13,884 393,060 862,459 94.5 74.5 70.4 64.7 61.2 45.6
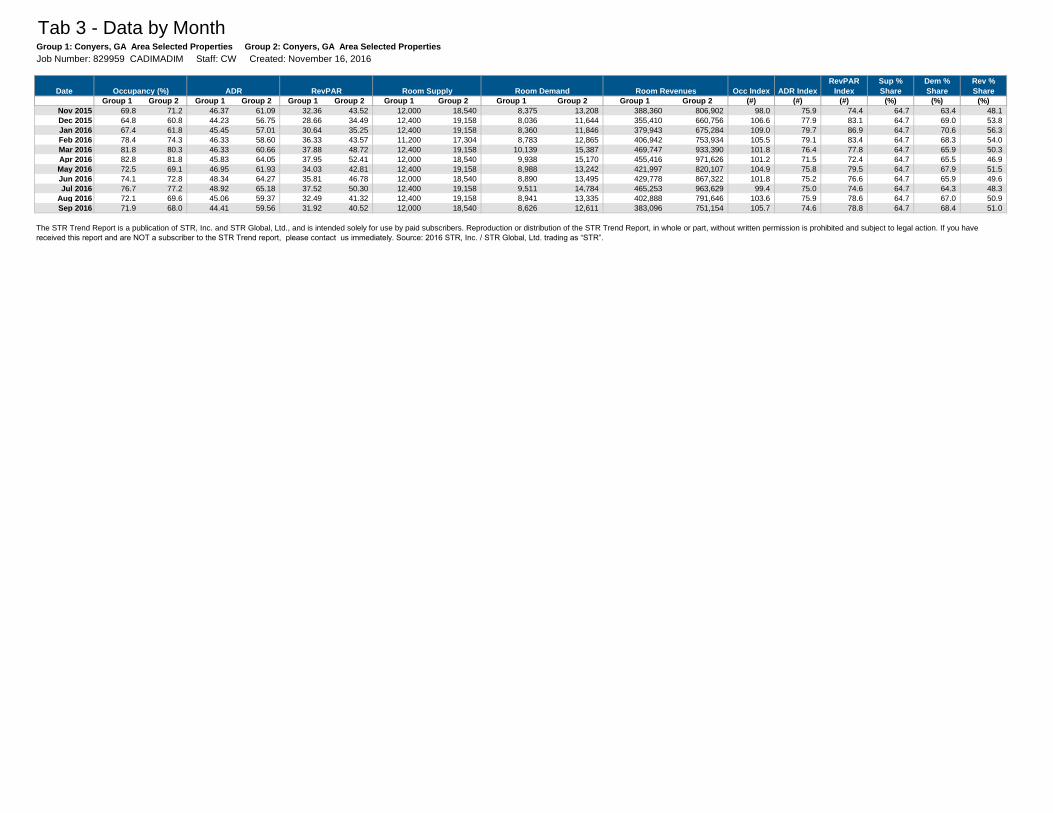
Tab 3 - Data by MonthGroup 1: Conyers, GA Area Selected Properties Group 2: Conyers, GA Area Selected Properties
Job Number: 829959_CADIMADIM Staff: CW Created: November 16, 2016
Date Occupancy (%) ADR RevPAR Room Supply Room Demand Room Revenues Occ Index ADR Index
RevPAR
Index
Sup %
Share
Dem %
Share
Rev %
Share
Group 1 Group 2 Group 1 Group 2 Group 1 Group 2 Group 1 Group 2 Group 1 Group 2 Group 1 Group 2 (#) (#) (#) (%) (%) (%)
Nov 2015 69.8 71.2 46.37 61.09 32.36 43.52 12,000 18,540 8,375 13,208 388,360 806,902 98.0 75.9 74.4 64.7 63.4 48.1
Dec 2015 64.8 60.8 44.23 56.75 28.66 34.49 12,400 19,158 8,036 11,644 355,410 660,756 106.6 77.9 83.1 64.7 69.0 53.8
Jan 2016 67.4 61.8 45.45 57.01 30.64 35.25 12,400 19,158 8,360 11,846 379,943 675,284 109.0 79.7 86.9 64.7 70.6 56.3
Feb 2016 78.4 74.3 46.33 58.60 36.33 43.57 11,200 17,304 8,783 12,865 406,942 753,934 105.5 79.1 83.4 64.7 68.3 54.0
Mar 2016 81.8 80.3 46.33 60.66 37.88 48.72 12,400 19,158 10,139 15,387 469,747 933,390 101.8 76.4 77.8 64.7 65.9 50.3
Apr 2016 82.8 81.8 45.83 64.05 37.95 52.41 12,000 18,540 9,938 15,170 455,416 971,626 101.2 71.5 72.4 64.7 65.5 46.9
May 2016 72.5 69.1 46.95 61.93 34.03 42.81 12,400 19,158 8,988 13,242 421,997 820,107 104.9 75.8 79.5 64.7 67.9 51.5
Jun 2016 74.1 72.8 48.34 64.27 35.81 46.78 12,000 18,540 8,890 13,495 429,778 867,322 101.8 75.2 76.6 64.7 65.9 49.6
Jul 2016 76.7 77.2 48.92 65.18 37.52 50.30 12,400 19,158 9,511 14,784 465,253 963,629 99.4 75.0 74.6 64.7 64.3 48.3
Aug 2016 72.1 69.6 45.06 59.37 32.49 41.32 12,400 19,158 8,941 13,335 402,888 791,646 103.6 75.9 78.6 64.7 67.0 50.9
Sep 2016 71.9 68.0 44.41 59.56 31.92 40.52 12,000 18,540 8,626 12,611 383,096 751,154 105.7 74.6 78.8 64.7 68.4 51.0
The STR Trend Report is a publication of STR, Inc. and STR Global, Ltd., and is intended solely for use by paid subscribers. Reproduction or distribution of the STR Trend Report, in whole or part, without written permission is prohibited and subject to legal action. If you have
received this report and are NOT a subscriber to the STR Trend report, please contact us immediately. Source: 2016 STR, Inc. / STR Global, Ltd. trading as “STR”.
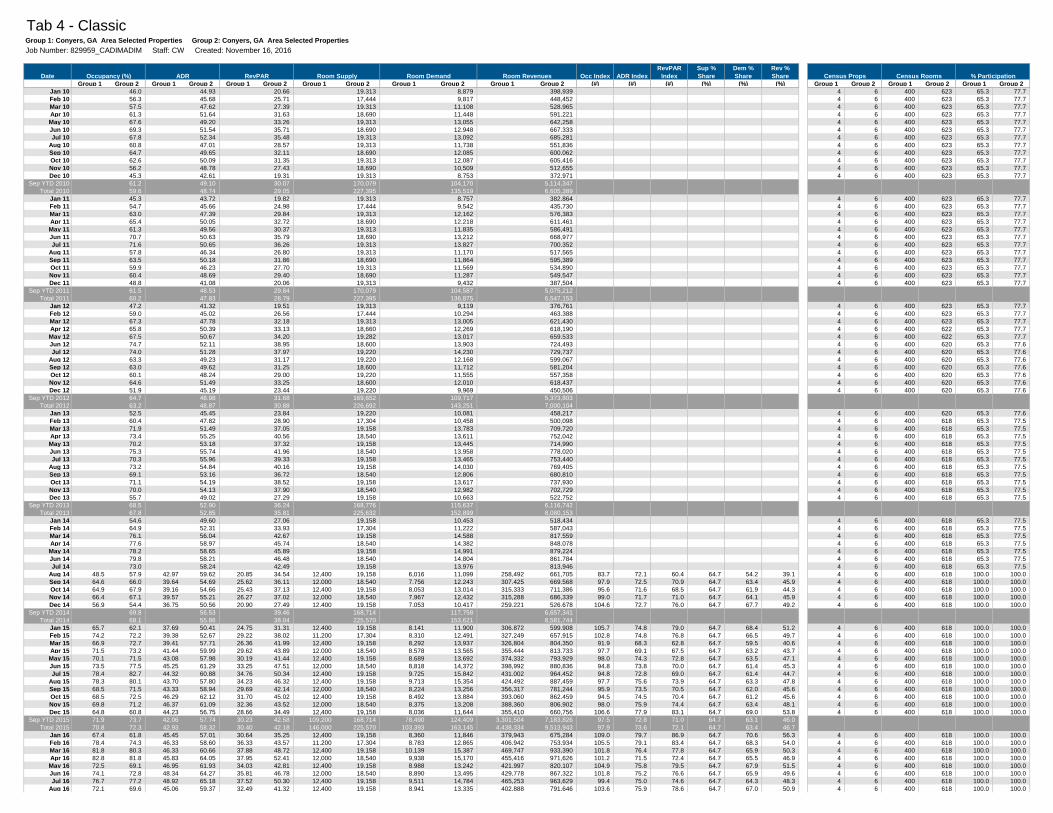
Tab 4 - ClassicGroup 1: Conyers, GA Area Selected Properties Group 2: Conyers, GA Area Selected Properties
Job Number: 829959_CADIMADIM Staff: CW Created: November 16, 2016
Date Occupancy (%) ADR RevPAR Room Supply Room Demand Room Revenues Occ Index ADR Index
RevPAR
Index
Sup %
Share
Dem %
Share
Rev %
Share Census Props Census Rooms % Participation
Group 1 Group 2 Group 1 Group 2 Group 1 Group 2 Group 1 Group 2 Group 1 Group 2 Group 1 Group 2 (#) (#) (#) (%) (%) (%) Group 1 Group 2 Group 1 Group 2 Group 1 Group 2
Jan 10 46.0 44.93 20.66 19,313 8,879 398,939 4 6 400 623 65.3 77.7
Feb 10 56.3 45.68 25.71 17,444 9,817 448,452 4 6 400 623 65.3 77.7
Mar 10 57.5 47.62 27.39 19,313 11,108 528,965 4 6 400 623 65.3 77.7
Apr 10 61.3 51.64 31.63 18,690 11,448 591,221 4 6 400 623 65.3 77.7
May 10 67.6 49.20 33.26 19,313 13,055 642,258 4 6 400 623 65.3 77.7
Jun 10 69.3 51.54 35.71 18,690 12,948 667,333 4 6 400 623 65.3 77.7
Jul 10 67.8 52.34 35.48 19,313 13,092 685,281 4 6 400 623 65.3 77.7
Aug 10 60.8 47.01 28.57 19,313 11,738 551,836 4 6 400 623 65.3 77.7
Sep 10 64.7 49.65 32.11 18,690 12,085 600,062 4 6 400 623 65.3 77.7
Oct 10 62.6 50.09 31.35 19,313 12,087 605,416 4 6 400 623 65.3 77.7
Nov 10 56.2 48.78 27.43 18,690 10,509 512,655 4 6 400 623 65.3 77.7
Dec 10 45.3 42.61 19.31 19,313 8,753 372,971 4 6 400 623 65.3 77.7
Sep YTD 2010 61.2 49.10 30.07 170,079 104,170 5,114,347
Total 2010 59.6 48.74 29.05 227,395 135,519 6,605,389
Jan 11 45.3 43.72 19.82 19,313 8,757 382,864 4 6 400 623 65.3 77.7
Feb 11 54.7 45.66 24.98 17,444 9,542 435,730 4 6 400 623 65.3 77.7
Mar 11 63.0 47.39 29.84 19,313 12,162 576,383 4 6 400 623 65.3 77.7
Apr 11 65.4 50.05 32.72 18,690 12,218 611,461 4 6 400 623 65.3 77.7
May 11 61.3 49.56 30.37 19,313 11,835 586,491 4 6 400 623 65.3 77.7
Jun 11 70.7 50.63 35.79 18,690 13,212 668,977 4 6 400 623 65.3 77.7
Jul 11 71.6 50.65 36.26 19,313 13,827 700,352 4 6 400 623 65.3 77.7
Aug 11 57.8 46.34 26.80 19,313 11,170 517,565 4 6 400 623 65.3 77.7
Sep 11 63.5 50.18 31.86 18,690 11,864 595,389 4 6 400 623 65.3 77.7
Oct 11 59.9 46.23 27.70 19,313 11,569 534,890 4 6 400 623 65.3 77.7
Nov 11 60.4 48.69 29.40 18,690 11,287 549,547 4 6 400 623 65.3 77.7
Dec 11 48.8 41.08 20.06 19,313 9,432 387,504 4 6 400 623 65.3 77.7
Sep YTD 2011 61.5 48.53 29.84 170,079 104,587 5,075,212
Total 2011 60.2 47.83 28.79 227,395 136,875 6,547,153
Jan 12 47.2 41.32 19.51 19,313 9,119 376,761 4 6 400 623 65.3 77.7
Feb 12 59.0 45.02 26.56 17,444 10,294 463,388 4 6 400 623 65.3 77.7
Mar 12 67.3 47.78 32.18 19,313 13,005 621,430 4 6 400 623 65.3 77.7
Apr 12 65.8 50.39 33.13 18,660 12,269 618,190 4 6 400 622 65.3 77.7
May 12 67.5 50.67 34.20 19,282 13,017 659,533 4 6 400 622 65.3 77.7
Jun 12 74.7 52.11 38.95 18,600 13,903 724,493 4 6 400 620 65.3 77.6
Jul 12 74.0 51.28 37.97 19,220 14,230 729,737 4 6 400 620 65.3 77.6
Aug 12 63.3 49.23 31.17 19,220 12,168 599,067 4 6 400 620 65.3 77.6
Sep 12 63.0 49.62 31.25 18,600 11,712 581,204 4 6 400 620 65.3 77.6
Oct 12 60.1 48.24 29.00 19,220 11,555 557,358 4 6 400 620 65.3 77.6
Nov 12 64.6 51.49 33.25 18,600 12,010 618,437 4 6 400 620 65.3 77.6
Dec 12 51.9 45.19 23.44 19,220 9,969 450,506 4 6 400 620 65.3 77.6
Sep YTD 2012 64.7 48.98 31.68 169,652 109,717 5,373,803
Total 2012 63.2 48.87 30.88 226,692 143,251 7,000,104
Jan 13 52.5 45.45 23.84 19,220 10,081 458,217 4 6 400 620 65.3 77.6
Feb 13 60.4 47.82 28.90 17,304 10,458 500,098 4 6 400 618 65.3 77.5
Mar 13 71.9 51.49 37.05 19,158 13,783 709,720 4 6 400 618 65.3 77.5
Apr 13 73.4 55.25 40.56 18,540 13,611 752,042 4 6 400 618 65.3 77.5
May 13 70.2 53.18 37.32 19,158 13,445 714,990 4 6 400 618 65.3 77.5
Jun 13 75.3 55.74 41.96 18,540 13,958 778,020 4 6 400 618 65.3 77.5
Jul 13 70.3 55.96 39.33 19,158 13,465 753,440 4 6 400 618 65.3 77.5
Aug 13 73.2 54.84 40.16 19,158 14,030 769,405 4 6 400 618 65.3 77.5
Sep 13 69.1 53.16 36.72 18,540 12,806 680,810 4 6 400 618 65.3 77.5
Oct 13 71.1 54.19 38.52 19,158 13,617 737,930 4 6 400 618 65.3 77.5
Nov 13 70.0 54.13 37.90 18,540 12,982 702,729 4 6 400 618 65.3 77.5
Dec 13 55.7 49.02 27.29 19,158 10,663 522,752 4 6 400 618 65.3 77.5
Sep YTD 2013 68.5 52.90 36.24 168,776 115,637 6,116,742
Total 2013 67.8 52.85 35.81 225,632 152,899 8,080,153
Jan 14 54.6 49.60 27.06 19,158 10,453 518,434 4 6 400 618 65.3 77.5
Feb 14 64.9 52.31 33.93 17,304 11,222 587,043 4 6 400 618 65.3 77.5
Mar 14 76.1 56.04 42.67 19,158 14,588 817,559 4 6 400 618 65.3 77.5
Apr 14 77.6 58.97 45.74 18,540 14,382 848,078 4 6 400 618 65.3 77.5
May 14 78.2 58.65 45.89 19,158 14,991 879,224 4 6 400 618 65.3 77.5
Jun 14 79.8 58.21 46.48 18,540 14,804 861,784 4 6 400 618 65.3 77.5
Jul 14 73.0 58.24 42.49 19,158 13,976 813,946 4 6 400 618 65.3 77.5
Aug 14 48.5 57.9 42.97 59.62 20.85 34.54 12,400 19,158 6,016 11,099 258,492 661,705 83.7 72.1 60.4 64.7 54.2 39.1 4 6 400 618 100.0 100.0
Sep 14 64.6 66.0 39.64 54.69 25.62 36.11 12,000 18,540 7,756 12,243 307,425 669,568 97.9 72.5 70.9 64.7 63.4 45.9 4 6 400 618 100.0 100.0
Oct 14 64.9 67.9 39.16 54.66 25.43 37.13 12,400 19,158 8,053 13,014 315,333 711,386 95.6 71.6 68.5 64.7 61.9 44.3 4 6 400 618 100.0 100.0
Nov 14 66.4 67.1 39.57 55.21 26.27 37.02 12,000 18,540 7,967 12,432 315,288 686,339 99.0 71.7 71.0 64.7 64.1 45.9 4 6 400 618 100.0 100.0
Dec 14 56.9 54.4 36.75 50.56 20.90 27.49 12,400 19,158 7,053 10,417 259,221 526,678 104.6 72.7 76.0 64.7 67.7 49.2 4 6 400 618 100.0 100.0
Sep YTD 2014 69.8 56.53 39.46 168,714 117,758 6,657,341
Total 2014 68.1 55.86 38.04 225,570 153,621 8,581,744
Jan 15 65.7 62.1 37.69 50.41 24.75 31.31 12,400 19,158 8,141 11,900 306,872 599,908 105.7 74.8 79.0 64.7 68.4 51.2 4 6 400 618 100.0 100.0
Feb 15 74.2 72.2 39.38 52.67 29.22 38.02 11,200 17,304 8,310 12,491 327,249 657,915 102.8 74.8 76.8 64.7 66.5 49.7 4 6 400 618 100.0 100.0
Mar 15 66.9 72.7 39.41 57.71 26.36 41.99 12,400 19,158 8,292 13,937 326,804 804,350 91.9 68.3 62.8 64.7 59.5 40.6 4 6 400 618 100.0 100.0
Apr 15 71.5 73.2 41.44 59.99 29.62 43.89 12,000 18,540 8,578 13,565 355,444 813,733 97.7 69.1 67.5 64.7 63.2 43.7 4 6 400 618 100.0 100.0
May 15 70.1 71.5 43.08 57.98 30.19 41.44 12,400 19,158 8,689 13,692 374,332 793,929 98.0 74.3 72.8 64.7 63.5 47.1 4 6 400 618 100.0 100.0
Jun 15 73.5 77.5 45.25 61.29 33.25 47.51 12,000 18,540 8,818 14,372 398,992 880,836 94.8 73.8 70.0 64.7 61.4 45.3 4 6 400 618 100.0 100.0
Jul 15 78.4 82.7 44.32 60.88 34.76 50.34 12,400 19,158 9,725 15,842 431,002 964,452 94.8 72.8 69.0 64.7 61.4 44.7 4 6 400 618 100.0 100.0
Aug 15 78.3 80.1 43.70 57.80 34.23 46.32 12,400 19,158 9,713 15,354 424,492 887,459 97.7 75.6 73.9 64.7 63.3 47.8 4 6 400 618 100.0 100.0
Sep 15 68.5 71.5 43.33 58.94 29.69 42.14 12,000 18,540 8,224 13,256 356,317 781,244 95.9 73.5 70.5 64.7 62.0 45.6 4 6 400 618 100.0 100.0
Oct 15 68.5 72.5 46.29 62.12 31.70 45.02 12,400 19,158 8,492 13,884 393,060 862,459 94.5 74.5 70.4 64.7 61.2 45.6 4 6 400 618 100.0 100.0
Nov 15 69.8 71.2 46.37 61.09 32.36 43.52 12,000 18,540 8,375 13,208 388,360 806,902 98.0 75.9 74.4 64.7 63.4 48.1 4 6 400 618 100.0 100.0
Dec 15 64.8 60.8 44.23 56.75 28.66 34.49 12,400 19,158 8,036 11,644 355,410 660,756 106.6 77.9 83.1 64.7 69.0 53.8 4 6 400 618 100.0 100.0
Sep YTD 2015 71.9 73.7 42.06 57.74 30.23 42.58 109,200 168,714 78,490 124,409 3,301,504 7,183,826 97.5 72.8 71.0 64.7 63.1 46.0
Total 2015 70.8 72.3 42.93 58.32 30.40 42.18 146,000 225,570 103,393 163,145 4,438,334 9,513,943 97.9 73.6 72.1 64.7 63.4 46.7
Jan 16 67.4 61.8 45.45 57.01 30.64 35.25 12,400 19,158 8,360 11,846 379,943 675,284 109.0 79.7 86.9 64.7 70.6 56.3 4 6 400 618 100.0 100.0
Feb 16 78.4 74.3 46.33 58.60 36.33 43.57 11,200 17,304 8,783 12,865 406,942 753,934 105.5 79.1 83.4 64.7 68.3 54.0 4 6 400 618 100.0 100.0
Mar 16 81.8 80.3 46.33 60.66 37.88 48.72 12,400 19,158 10,139 15,387 469,747 933,390 101.8 76.4 77.8 64.7 65.9 50.3 4 6 400 618 100.0 100.0
Apr 16 82.8 81.8 45.83 64.05 37.95 52.41 12,000 18,540 9,938 15,170 455,416 971,626 101.2 71.5 72.4 64.7 65.5 46.9 4 6 400 618 100.0 100.0
May 16 72.5 69.1 46.95 61.93 34.03 42.81 12,400 19,158 8,988 13,242 421,997 820,107 104.9 75.8 79.5 64.7 67.9 51.5 4 6 400 618 100.0 100.0
Jun 16 74.1 72.8 48.34 64.27 35.81 46.78 12,000 18,540 8,890 13,495 429,778 867,322 101.8 75.2 76.6 64.7 65.9 49.6 4 6 400 618 100.0 100.0
Jul 16 76.7 77.2 48.92 65.18 37.52 50.30 12,400 19,158 9,511 14,784 465,253 963,629 99.4 75.0 74.6 64.7 64.3 48.3 4 6 400 618 100.0 100.0
Aug 16 72.1 69.6 45.06 59.37 32.49 41.32 12,400 19,158 8,941 13,335 402,888 791,646 103.6 75.9 78.6 64.7 67.0 50.9 4 6 400 618 100.0 100.0
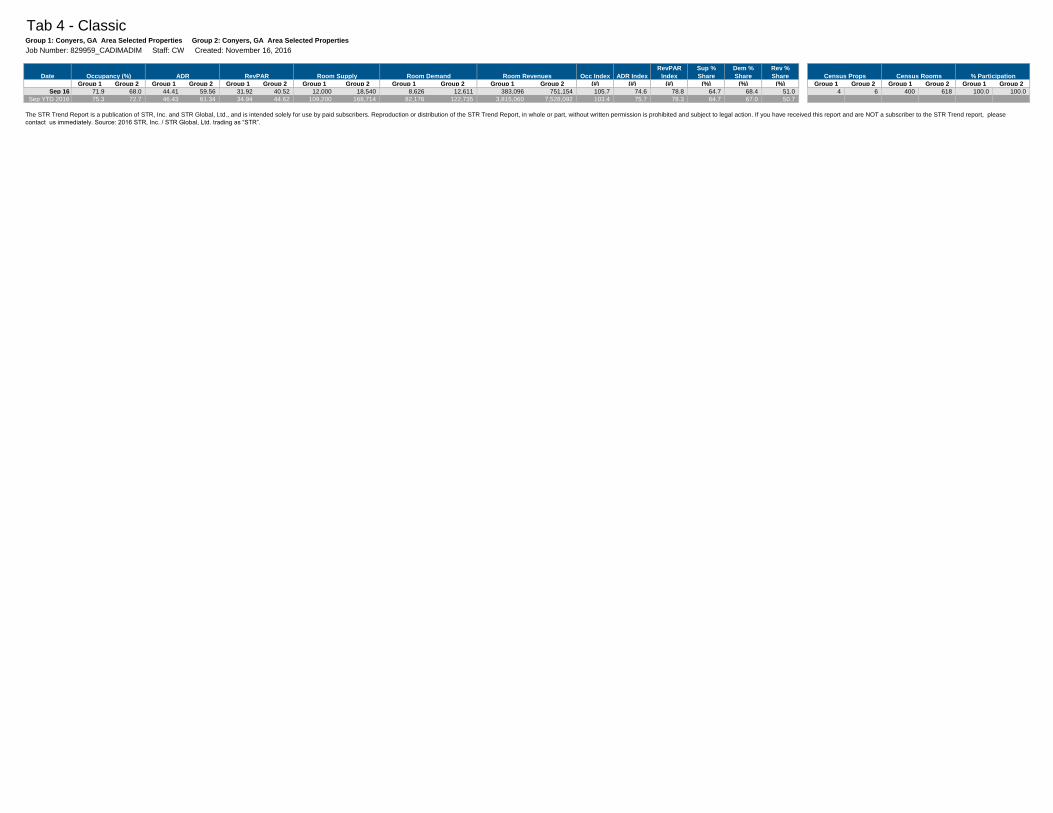
Tab 4 - ClassicGroup 1: Conyers, GA Area Selected Properties Group 2: Conyers, GA Area Selected Properties
Job Number: 829959_CADIMADIM Staff: CW Created: November 16, 2016
Date Occupancy (%) ADR RevPAR Room Supply Room Demand Room Revenues Occ Index ADR Index
RevPAR
Index
Sup %
Share
Dem %
Share
Rev %
Share Census Props Census Rooms % Participation
Group 1 Group 2 Group 1 Group 2 Group 1 Group 2 Group 1 Group 2 Group 1 Group 2 Group 1 Group 2 (#) (#) (#) (%) (%) (%) Group 1 Group 2 Group 1 Group 2 Group 1 Group 2
Sep 16 71.9 68.0 44.41 59.56 31.92 40.52 12,000 18,540 8,626 12,611 383,096 751,154 105.7 74.6 78.8 64.7 68.4 51.0 4 6 400 618 100.0 100.0
Sep YTD 2016 75.3 72.7 46.43 61.34 34.94 44.62 109,200 168,714 82,176 122,735 3,815,060 7,528,092 103.4 75.7 78.3 64.7 67.0 50.7
The STR Trend Report is a publication of STR, Inc. and STR Global, Ltd., and is intended solely for use by paid subscribers. Reproduction or distribution of the STR Trend Report, in whole or part, without written permission is prohibited and subject to legal action. If you have received this report and are NOT a subscriber to the STR Trend report, please
contact us immediately. Source: 2016 STR, Inc. / STR Global, Ltd. trading as “STR”.
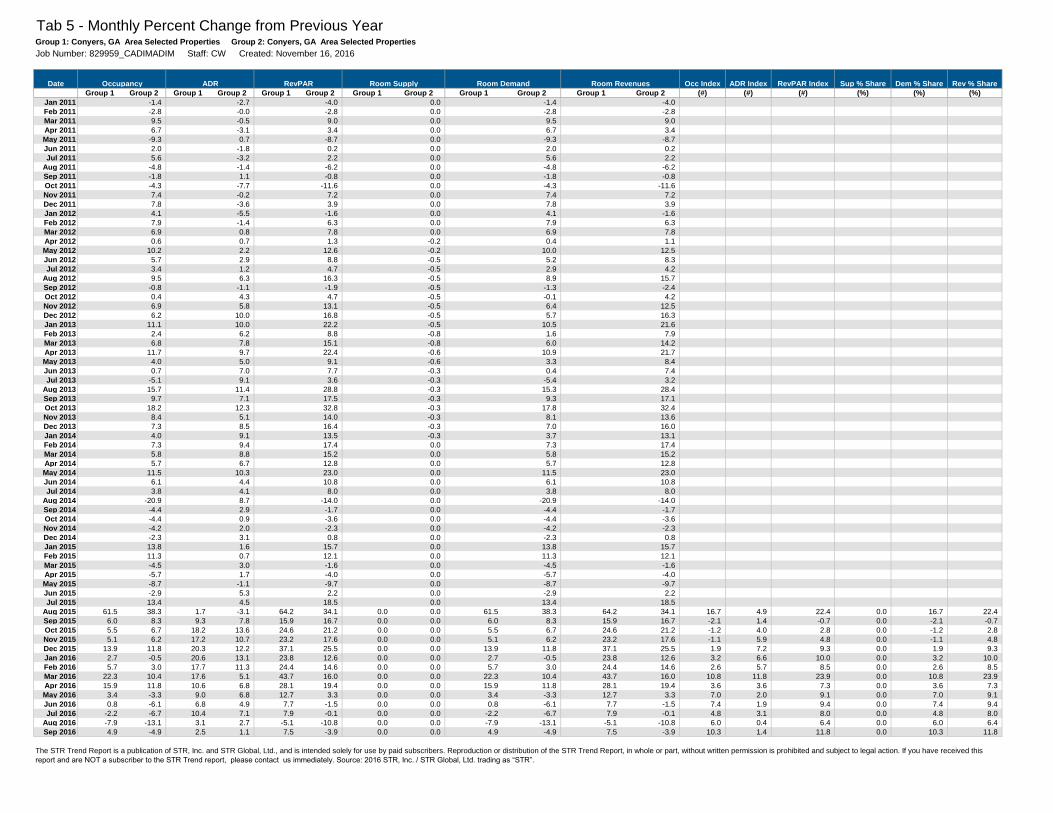
Tab 5 - Monthly Percent Change from Previous YearGroup 1: Conyers, GA Area Selected Properties Group 2: Conyers, GA Area Selected Properties
Job Number: 829959_CADIMADIM Staff: CW Created: November 16, 2016
Date Occupancy ADR RevPAR Room Supply Room Demand Room Revenues Occ Index ADR Index RevPAR Index Sup % Share Dem % Share Rev % Share
Group 1 Group 2 Group 1 Group 2 Group 1 Group 2 Group 1 Group 2 Group 1 Group 2 Group 1 Group 2 (#) (#) (#) (%) (%) (%)
Jan 2011 -1.4 -2.7 -4.0 0.0 -1.4 -4.0
Feb 2011 -2.8 -0.0 -2.8 0.0 -2.8 -2.8
Mar 2011 9.5 -0.5 9.0 0.0 9.5 9.0
Apr 2011 6.7 -3.1 3.4 0.0 6.7 3.4
May 2011 -9.3 0.7 -8.7 0.0 -9.3 -8.7
Jun 2011 2.0 -1.8 0.2 0.0 2.0 0.2
Jul 2011 5.6 -3.2 2.2 0.0 5.6 2.2
Aug 2011 -4.8 -1.4 -6.2 0.0 -4.8 -6.2
Sep 2011 -1.8 1.1 -0.8 0.0 -1.8 -0.8
Oct 2011 -4.3 -7.7 -11.6 0.0 -4.3 -11.6
Nov 2011 7.4 -0.2 7.2 0.0 7.4 7.2
Dec 2011 7.8 -3.6 3.9 0.0 7.8 3.9
Jan 2012 4.1 -5.5 -1.6 0.0 4.1 -1.6
Feb 2012 7.9 -1.4 6.3 0.0 7.9 6.3
Mar 2012 6.9 0.8 7.8 0.0 6.9 7.8
Apr 2012 0.6 0.7 1.3 -0.2 0.4 1.1
May 2012 10.2 2.2 12.6 -0.2 10.0 12.5
Jun 2012 5.7 2.9 8.8 -0.5 5.2 8.3
Jul 2012 3.4 1.2 4.7 -0.5 2.9 4.2
Aug 2012 9.5 6.3 16.3 -0.5 8.9 15.7
Sep 2012 -0.8 -1.1 -1.9 -0.5 -1.3 -2.4
Oct 2012 0.4 4.3 4.7 -0.5 -0.1 4.2
Nov 2012 6.9 5.8 13.1 -0.5 6.4 12.5
Dec 2012 6.2 10.0 16.8 -0.5 5.7 16.3
Jan 2013 11.1 10.0 22.2 -0.5 10.5 21.6
Feb 2013 2.4 6.2 8.8 -0.8 1.6 7.9
Mar 2013 6.8 7.8 15.1 -0.8 6.0 14.2
Apr 2013 11.7 9.7 22.4 -0.6 10.9 21.7
May 2013 4.0 5.0 9.1 -0.6 3.3 8.4
Jun 2013 0.7 7.0 7.7 -0.3 0.4 7.4
Jul 2013 -5.1 9.1 3.6 -0.3 -5.4 3.2
Aug 2013 15.7 11.4 28.8 -0.3 15.3 28.4
Sep 2013 9.7 7.1 17.5 -0.3 9.3 17.1
Oct 2013 18.2 12.3 32.8 -0.3 17.8 32.4
Nov 2013 8.4 5.1 14.0 -0.3 8.1 13.6
Dec 2013 7.3 8.5 16.4 -0.3 7.0 16.0
Jan 2014 4.0 9.1 13.5 -0.3 3.7 13.1
Feb 2014 7.3 9.4 17.4 0.0 7.3 17.4
Mar 2014 5.8 8.8 15.2 0.0 5.8 15.2
Apr 2014 5.7 6.7 12.8 0.0 5.7 12.8
May 2014 11.5 10.3 23.0 0.0 11.5 23.0
Jun 2014 6.1 4.4 10.8 0.0 6.1 10.8
Jul 2014 3.8 4.1 8.0 0.0 3.8 8.0
Aug 2014 -20.9 8.7 -14.0 0.0 -20.9 -14.0
Sep 2014 -4.4 2.9 -1.7 0.0 -4.4 -1.7
Oct 2014 -4.4 0.9 -3.6 0.0 -4.4 -3.6
Nov 2014 -4.2 2.0 -2.3 0.0 -4.2 -2.3
Dec 2014 -2.3 3.1 0.8 0.0 -2.3 0.8
Jan 2015 13.8 1.6 15.7 0.0 13.8 15.7
Feb 2015 11.3 0.7 12.1 0.0 11.3 12.1
Mar 2015 -4.5 3.0 -1.6 0.0 -4.5 -1.6
Apr 2015 -5.7 1.7 -4.0 0.0 -5.7 -4.0
May 2015 -8.7 -1.1 -9.7 0.0 -8.7 -9.7
Jun 2015 -2.9 5.3 2.2 0.0 -2.9 2.2
Jul 2015 13.4 4.5 18.5 0.0 13.4 18.5
Aug 2015 61.5 38.3 1.7 -3.1 64.2 34.1 0.0 0.0 61.5 38.3 64.2 34.1 16.7 4.9 22.4 0.0 16.7 22.4
Sep 2015 6.0 8.3 9.3 7.8 15.9 16.7 0.0 0.0 6.0 8.3 15.9 16.7 -2.1 1.4 -0.7 0.0 -2.1 -0.7
Oct 2015 5.5 6.7 18.2 13.6 24.6 21.2 0.0 0.0 5.5 6.7 24.6 21.2 -1.2 4.0 2.8 0.0 -1.2 2.8
Nov 2015 5.1 6.2 17.2 10.7 23.2 17.6 0.0 0.0 5.1 6.2 23.2 17.6 -1.1 5.9 4.8 0.0 -1.1 4.8
Dec 2015 13.9 11.8 20.3 12.2 37.1 25.5 0.0 0.0 13.9 11.8 37.1 25.5 1.9 7.2 9.3 0.0 1.9 9.3
Jan 2016 2.7 -0.5 20.6 13.1 23.8 12.6 0.0 0.0 2.7 -0.5 23.8 12.6 3.2 6.6 10.0 0.0 3.2 10.0
Feb 2016 5.7 3.0 17.7 11.3 24.4 14.6 0.0 0.0 5.7 3.0 24.4 14.6 2.6 5.7 8.5 0.0 2.6 8.5
Mar 2016 22.3 10.4 17.6 5.1 43.7 16.0 0.0 0.0 22.3 10.4 43.7 16.0 10.8 11.8 23.9 0.0 10.8 23.9
Apr 2016 15.9 11.8 10.6 6.8 28.1 19.4 0.0 0.0 15.9 11.8 28.1 19.4 3.6 3.6 7.3 0.0 3.6 7.3
May 2016 3.4 -3.3 9.0 6.8 12.7 3.3 0.0 0.0 3.4 -3.3 12.7 3.3 7.0 2.0 9.1 0.0 7.0 9.1
Jun 2016 0.8 -6.1 6.8 4.9 7.7 -1.5 0.0 0.0 0.8 -6.1 7.7 -1.5 7.4 1.9 9.4 0.0 7.4 9.4
Jul 2016 -2.2 -6.7 10.4 7.1 7.9 -0.1 0.0 0.0 -2.2 -6.7 7.9 -0.1 4.8 3.1 8.0 0.0 4.8 8.0
Aug 2016 -7.9 -13.1 3.1 2.7 -5.1 -10.8 0.0 0.0 -7.9 -13.1 -5.1 -10.8 6.0 0.4 6.4 0.0 6.0 6.4
Sep 2016 4.9 -4.9 2.5 1.1 7.5 -3.9 0.0 0.0 4.9 -4.9 7.5 -3.9 10.3 1.4 11.8 0.0 10.3 11.8
The STR Trend Report is a publication of STR, Inc. and STR Global, Ltd., and is intended solely for use by paid subscribers. Reproduction or distribution of the STR Trend Report, in whole or part, without written permission is prohibited and subject to legal action. If you have received this
report and are NOT a subscriber to the STR Trend report, please contact us immediately. Source: 2016 STR, Inc. / STR Global, Ltd. trading as “STR”.
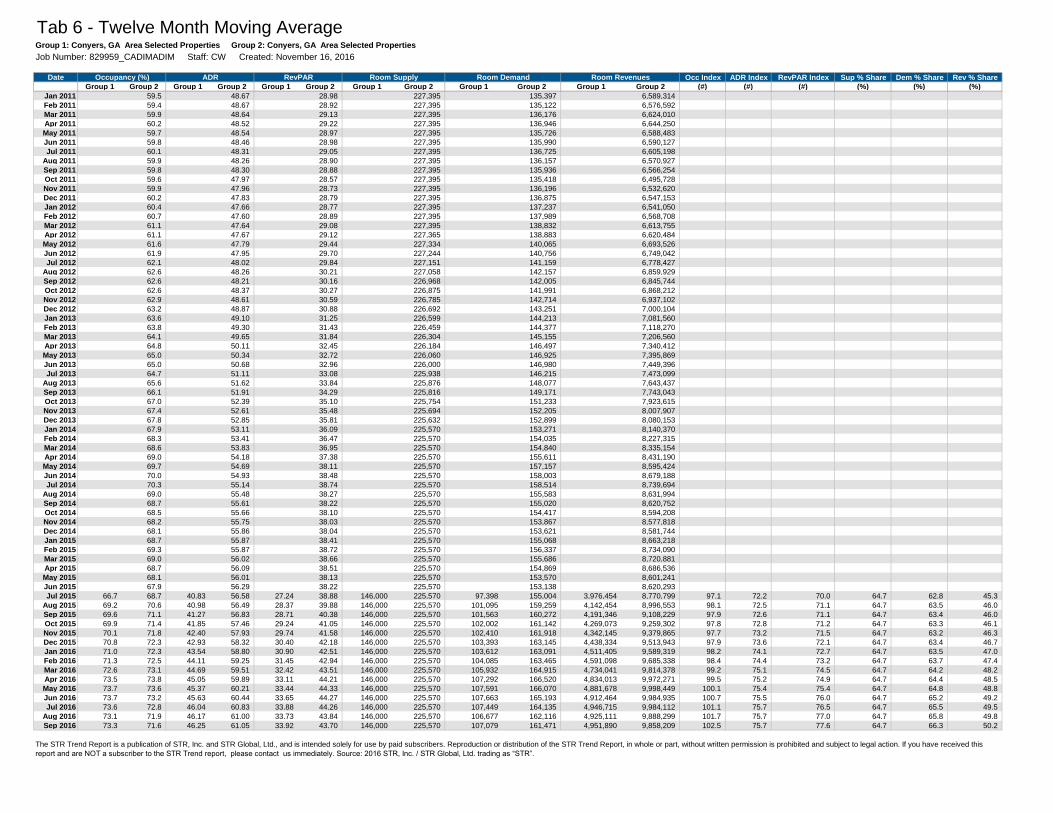
Tab 6 - Twelve Month Moving AverageGroup 1: Conyers, GA Area Selected Properties Group 2: Conyers, GA Area Selected Properties
Job Number: 829959_CADIMADIM Staff: CW Created: November 16, 2016
Date Occupancy (%) ADR RevPAR Room Supply Room Demand Room Revenues Occ Index ADR Index RevPAR Index Sup % Share Dem % Share Rev % Share
Group 1 Group 2 Group 1 Group 2 Group 1 Group 2 Group 1 Group 2 Group 1 Group 2 Group 1 Group 2 (#) (#) (#) (%) (%) (%)
Jan 2011 59.5 48.67 28.98 227,395 135,397 6,589,314
Feb 2011 59.4 48.67 28.92 227,395 135,122 6,576,592
Mar 2011 59.9 48.64 29.13 227,395 136,176 6,624,010
Apr 2011 60.2 48.52 29.22 227,395 136,946 6,644,250
May 2011 59.7 48.54 28.97 227,395 135,726 6,588,483
Jun 2011 59.8 48.46 28.98 227,395 135,990 6,590,127
Jul 2011 60.1 48.31 29.05 227,395 136,725 6,605,198
Aug 2011 59.9 48.26 28.90 227,395 136,157 6,570,927
Sep 2011 59.8 48.30 28.88 227,395 135,936 6,566,254
Oct 2011 59.6 47.97 28.57 227,395 135,418 6,495,728
Nov 2011 59.9 47.96 28.73 227,395 136,196 6,532,620
Dec 2011 60.2 47.83 28.79 227,395 136,875 6,547,153
Jan 2012 60.4 47.66 28.77 227,395 137,237 6,541,050
Feb 2012 60.7 47.60 28.89 227,395 137,989 6,568,708
Mar 2012 61.1 47.64 29.08 227,395 138,832 6,613,755
Apr 2012 61.1 47.67 29.12 227,365 138,883 6,620,484
May 2012 61.6 47.79 29.44 227,334 140,065 6,693,526
Jun 2012 61.9 47.95 29.70 227,244 140,756 6,749,042
Jul 2012 62.1 48.02 29.84 227,151 141,159 6,778,427
Aug 2012 62.6 48.26 30.21 227,058 142,157 6,859,929
Sep 2012 62.6 48.21 30.16 226,968 142,005 6,845,744
Oct 2012 62.6 48.37 30.27 226,875 141,991 6,868,212
Nov 2012 62.9 48.61 30.59 226,785 142,714 6,937,102
Dec 2012 63.2 48.87 30.88 226,692 143,251 7,000,104
Jan 2013 63.6 49.10 31.25 226,599 144,213 7,081,560
Feb 2013 63.8 49.30 31.43 226,459 144,377 7,118,270
Mar 2013 64.1 49.65 31.84 226,304 145,155 7,206,560
Apr 2013 64.8 50.11 32.45 226,184 146,497 7,340,412
May 2013 65.0 50.34 32.72 226,060 146,925 7,395,869
Jun 2013 65.0 50.68 32.96 226,000 146,980 7,449,396
Jul 2013 64.7 51.11 33.08 225,938 146,215 7,473,099
Aug 2013 65.6 51.62 33.84 225,876 148,077 7,643,437
Sep 2013 66.1 51.91 34.29 225,816 149,171 7,743,043
Oct 2013 67.0 52.39 35.10 225,754 151,233 7,923,615
Nov 2013 67.4 52.61 35.48 225,694 152,205 8,007,907
Dec 2013 67.8 52.85 35.81 225,632 152,899 8,080,153
Jan 2014 67.9 53.11 36.09 225,570 153,271 8,140,370
Feb 2014 68.3 53.41 36.47 225,570 154,035 8,227,315
Mar 2014 68.6 53.83 36.95 225,570 154,840 8,335,154
Apr 2014 69.0 54.18 37.38 225,570 155,611 8,431,190
May 2014 69.7 54.69 38.11 225,570 157,157 8,595,424
Jun 2014 70.0 54.93 38.48 225,570 158,003 8,679,188
Jul 2014 70.3 55.14 38.74 225,570 158,514 8,739,694
Aug 2014 69.0 55.48 38.27 225,570 155,583 8,631,994
Sep 2014 68.7 55.61 38.22 225,570 155,020 8,620,752
Oct 2014 68.5 55.66 38.10 225,570 154,417 8,594,208
Nov 2014 68.2 55.75 38.03 225,570 153,867 8,577,818
Dec 2014 68.1 55.86 38.04 225,570 153,621 8,581,744
Jan 2015 68.7 55.87 38.41 225,570 155,068 8,663,218
Feb 2015 69.3 55.87 38.72 225,570 156,337 8,734,090
Mar 2015 69.0 56.02 38.66 225,570 155,686 8,720,881
Apr 2015 68.7 56.09 38.51 225,570 154,869 8,686,536
May 2015 68.1 56.01 38.13 225,570 153,570 8,601,241
Jun 2015 67.9 56.29 38.22 225,570 153,138 8,620,293
Jul 2015 66.7 68.7 40.83 56.58 27.24 38.88 146,000 225,570 97,398 155,004 3,976,454 8,770,799 97.1 72.2 70.0 64.7 62.8 45.3
Aug 2015 69.2 70.6 40.98 56.49 28.37 39.88 146,000 225,570 101,095 159,259 4,142,454 8,996,553 98.1 72.5 71.1 64.7 63.5 46.0
Sep 2015 69.6 71.1 41.27 56.83 28.71 40.38 146,000 225,570 101,563 160,272 4,191,346 9,108,229 97.9 72.6 71.1 64.7 63.4 46.0
Oct 2015 69.9 71.4 41.85 57.46 29.24 41.05 146,000 225,570 102,002 161,142 4,269,073 9,259,302 97.8 72.8 71.2 64.7 63.3 46.1
Nov 2015 70.1 71.8 42.40 57.93 29.74 41.58 146,000 225,570 102,410 161,918 4,342,145 9,379,865 97.7 73.2 71.5 64.7 63.2 46.3
Dec 2015 70.8 72.3 42.93 58.32 30.40 42.18 146,000 225,570 103,393 163,145 4,438,334 9,513,943 97.9 73.6 72.1 64.7 63.4 46.7
Jan 2016 71.0 72.3 43.54 58.80 30.90 42.51 146,000 225,570 103,612 163,091 4,511,405 9,589,319 98.2 74.1 72.7 64.7 63.5 47.0
Feb 2016 71.3 72.5 44.11 59.25 31.45 42.94 146,000 225,570 104,085 163,465 4,591,098 9,685,338 98.4 74.4 73.2 64.7 63.7 47.4
Mar 2016 72.6 73.1 44.69 59.51 32.42 43.51 146,000 225,570 105,932 164,915 4,734,041 9,814,378 99.2 75.1 74.5 64.7 64.2 48.2
Apr 2016 73.5 73.8 45.05 59.89 33.11 44.21 146,000 225,570 107,292 166,520 4,834,013 9,972,271 99.5 75.2 74.9 64.7 64.4 48.5
May 2016 73.7 73.6 45.37 60.21 33.44 44.33 146,000 225,570 107,591 166,070 4,881,678 9,998,449 100.1 75.4 75.4 64.7 64.8 48.8
Jun 2016 73.7 73.2 45.63 60.44 33.65 44.27 146,000 225,570 107,663 165,193 4,912,464 9,984,935 100.7 75.5 76.0 64.7 65.2 49.2
Jul 2016 73.6 72.8 46.04 60.83 33.88 44.26 146,000 225,570 107,449 164,135 4,946,715 9,984,112 101.1 75.7 76.5 64.7 65.5 49.5
Aug 2016 73.1 71.9 46.17 61.00 33.73 43.84 146,000 225,570 106,677 162,116 4,925,111 9,888,299 101.7 75.7 77.0 64.7 65.8 49.8
Sep 2016 73.3 71.6 46.25 61.05 33.92 43.70 146,000 225,570 107,079 161,471 4,951,890 9,858,209 102.5 75.7 77.6 64.7 66.3 50.2
The STR Trend Report is a publication of STR, Inc. and STR Global, Ltd., and is intended solely for use by paid subscribers. Reproduction or distribution of the STR Trend Report, in whole or part, without written permission is prohibited and subject to legal action. If you have received this
report and are NOT a subscriber to the STR Trend report, please contact us immediately. Source: 2016 STR, Inc. / STR Global, Ltd. trading as “STR”.
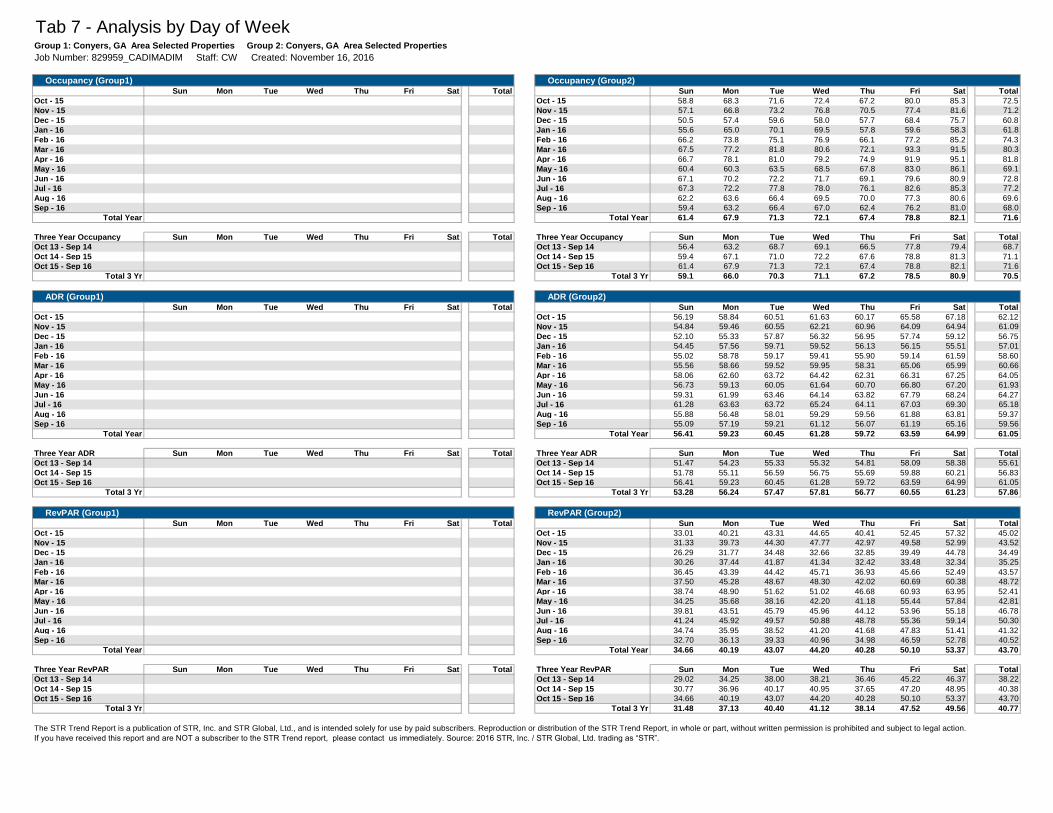
Tab 7 - Analysis by Day of WeekGroup 1: Conyers, GA Area Selected Properties Group 2: Conyers, GA Area Selected Properties
Job Number: 829959_CADIMADIM Staff: CW Created: November 16, 2016
Occupancy (Group1) Occupancy (Group2)Sun Mon Tue Wed Thu Fri Sat Total Sun Mon Tue Wed Thu Fri Sat Total
Oct - 15 Oct - 15 58.8 68.3 71.6 72.4 67.2 80.0 85.3 72.5
Nov - 15 Nov - 15 57.1 66.8 73.2 76.8 70.5 77.4 81.6 71.2
Dec - 15 Dec - 15 50.5 57.4 59.6 58.0 57.7 68.4 75.7 60.8
Jan - 16 Jan - 16 55.6 65.0 70.1 69.5 57.8 59.6 58.3 61.8
Feb - 16 Feb - 16 66.2 73.8 75.1 76.9 66.1 77.2 85.2 74.3
Mar - 16 Mar - 16 67.5 77.2 81.8 80.6 72.1 93.3 91.5 80.3
Apr - 16 Apr - 16 66.7 78.1 81.0 79.2 74.9 91.9 95.1 81.8
May - 16 May - 16 60.4 60.3 63.5 68.5 67.8 83.0 86.1 69.1
Jun - 16 Jun - 16 67.1 70.2 72.2 71.7 69.1 79.6 80.9 72.8
Jul - 16 Jul - 16 67.3 72.2 77.8 78.0 76.1 82.6 85.3 77.2
Aug - 16 Aug - 16 62.2 63.6 66.4 69.5 70.0 77.3 80.6 69.6
Sep - 16 Sep - 16 59.4 63.2 66.4 67.0 62.4 76.2 81.0 68.0
Total Year Total Year 61.4 67.9 71.3 72.1 67.4 78.8 82.1 71.6
Three Year Occupancy Sun Mon Tue Wed Thu Fri Sat Total Three Year Occupancy Sun Mon Tue Wed Thu Fri Sat Total
Oct 13 - Sep 14 Oct 13 - Sep 14 56.4 63.2 68.7 69.1 66.5 77.8 79.4 68.7
Oct 14 - Sep 15 Oct 14 - Sep 15 59.4 67.1 71.0 72.2 67.6 78.8 81.3 71.1
Oct 15 - Sep 16 Oct 15 - Sep 16 61.4 67.9 71.3 72.1 67.4 78.8 82.1 71.6
Total 3 Yr Total 3 Yr 59.1 66.0 70.3 71.1 67.2 78.5 80.9 70.5
ADR (Group1) ADR (Group2)Sun Mon Tue Wed Thu Fri Sat Total Sun Mon Tue Wed Thu Fri Sat Total
Oct - 15 Oct - 15 56.19 58.84 60.51 61.63 60.17 65.58 67.18 62.12
Nov - 15 Nov - 15 54.84 59.46 60.55 62.21 60.96 64.09 64.94 61.09
Dec - 15 Dec - 15 52.10 55.33 57.87 56.32 56.95 57.74 59.12 56.75
Jan - 16 Jan - 16 54.45 57.56 59.71 59.52 56.13 56.15 55.51 57.01
Feb - 16 Feb - 16 55.02 58.78 59.17 59.41 55.90 59.14 61.59 58.60
Mar - 16 Mar - 16 55.56 58.66 59.52 59.95 58.31 65.06 65.99 60.66
Apr - 16 Apr - 16 58.06 62.60 63.72 64.42 62.31 66.31 67.25 64.05
May - 16 May - 16 56.73 59.13 60.05 61.64 60.70 66.80 67.20 61.93
Jun - 16 Jun - 16 59.31 61.99 63.46 64.14 63.82 67.79 68.24 64.27
Jul - 16 Jul - 16 61.28 63.63 63.72 65.24 64.11 67.03 69.30 65.18
Aug - 16 Aug - 16 55.88 56.48 58.01 59.29 59.56 61.88 63.81 59.37
Sep - 16 Sep - 16 55.09 57.19 59.21 61.12 56.07 61.19 65.16 59.56
Total Year Total Year 56.41 59.23 60.45 61.28 59.72 63.59 64.99 61.05
Three Year ADR Sun Mon Tue Wed Thu Fri Sat Total Three Year ADR Sun Mon Tue Wed Thu Fri Sat Total
Oct 13 - Sep 14 Oct 13 - Sep 14 51.47 54.23 55.33 55.32 54.81 58.09 58.38 55.61
Oct 14 - Sep 15 Oct 14 - Sep 15 51.78 55.11 56.59 56.75 55.69 59.88 60.21 56.83
Oct 15 - Sep 16 Oct 15 - Sep 16 56.41 59.23 60.45 61.28 59.72 63.59 64.99 61.05
Total 3 Yr Total 3 Yr 53.28 56.24 57.47 57.81 56.77 60.55 61.23 57.86
RevPAR (Group1) RevPAR (Group2)Sun Mon Tue Wed Thu Fri Sat Total Sun Mon Tue Wed Thu Fri Sat Total
Oct - 15 Oct - 15 33.01 40.21 43.31 44.65 40.41 52.45 57.32 45.02
Nov - 15 Nov - 15 31.33 39.73 44.30 47.77 42.97 49.58 52.99 43.52
Dec - 15 Dec - 15 26.29 31.77 34.48 32.66 32.85 39.49 44.78 34.49
Jan - 16 Jan - 16 30.26 37.44 41.87 41.34 32.42 33.48 32.34 35.25
Feb - 16 Feb - 16 36.45 43.39 44.42 45.71 36.93 45.66 52.49 43.57
Mar - 16 Mar - 16 37.50 45.28 48.67 48.30 42.02 60.69 60.38 48.72
Apr - 16 Apr - 16 38.74 48.90 51.62 51.02 46.68 60.93 63.95 52.41
May - 16 May - 16 34.25 35.68 38.16 42.20 41.18 55.44 57.84 42.81
Jun - 16 Jun - 16 39.81 43.51 45.79 45.96 44.12 53.96 55.18 46.78
Jul - 16 Jul - 16 41.24 45.92 49.57 50.88 48.78 55.36 59.14 50.30
Aug - 16 Aug - 16 34.74 35.95 38.52 41.20 41.68 47.83 51.41 41.32
Sep - 16 Sep - 16 32.70 36.13 39.33 40.96 34.98 46.59 52.78 40.52
Total Year Total Year 34.66 40.19 43.07 44.20 40.28 50.10 53.37 43.70
Three Year RevPAR Sun Mon Tue Wed Thu Fri Sat Total Three Year RevPAR Sun Mon Tue Wed Thu Fri Sat Total
Oct 13 - Sep 14 Oct 13 - Sep 14 29.02 34.25 38.00 38.21 36.46 45.22 46.37 38.22
Oct 14 - Sep 15 Oct 14 - Sep 15 30.77 36.96 40.17 40.95 37.65 47.20 48.95 40.38
Oct 15 - Sep 16 Oct 15 - Sep 16 34.66 40.19 43.07 44.20 40.28 50.10 53.37 43.70
Total 3 Yr Total 3 Yr 31.48 37.13 40.40 41.12 38.14 47.52 49.56 40.77
The STR Trend Report is a publication of STR, Inc. and STR Global, Ltd., and is intended solely for use by paid subscribers. Reproduction or distribution of the STR Trend Report, in whole or part, without written permission is prohibited and subject to legal action.
If you have received this report and are NOT a subscriber to the STR Trend report, please contact us immediately. Source: 2016 STR, Inc. / STR Global, Ltd. trading as “STR”.
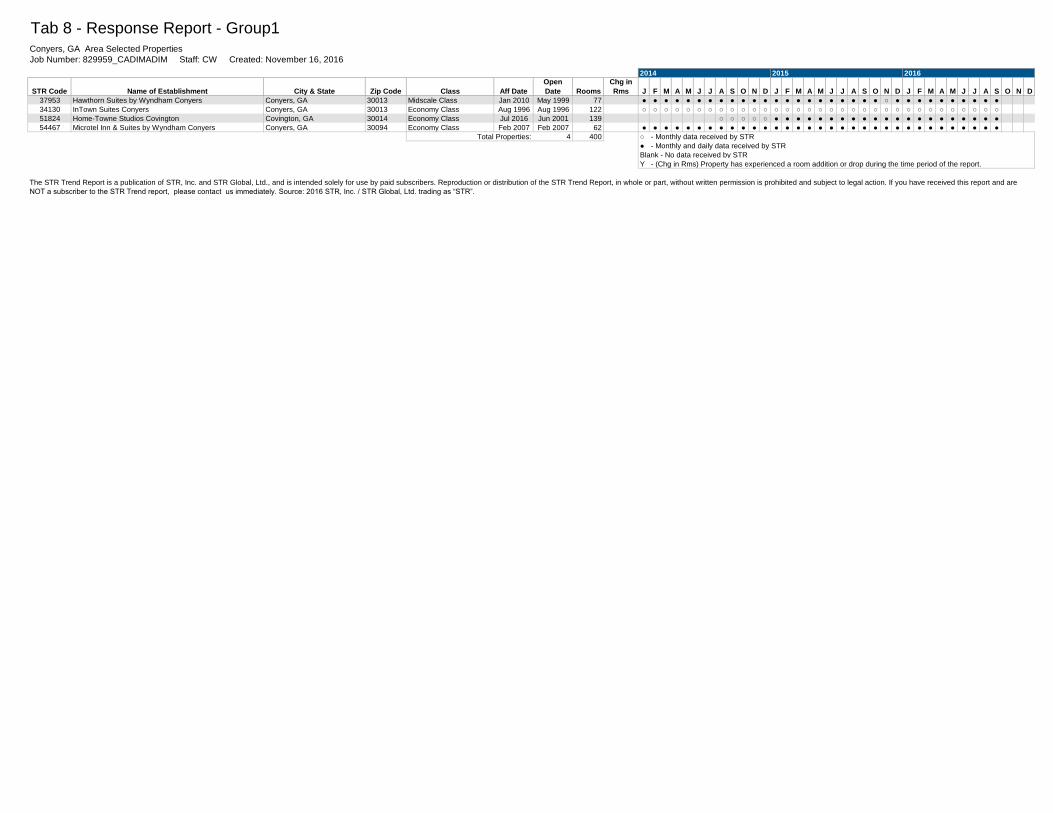
Tab 8 - Response Report - Group1Conyers, GA Area Selected Properties
Job Number: 829959_CADIMADIM Staff: CW Created: November 16, 2016
STR Code Name of Establishment City & State Zip Code Class Aff Date
Open
Date Rooms
Chg in
Rms J F M A M J J A S O N D J F M A M J J A S O N D J F M A M J J A S O N D
37953 Hawthorn Suites by Wyndham Conyers Conyers, GA 30013 Midscale Class Jan 2010 May 1999 77 ● ● ● ● ● ● ● ● ● ● ● ● ● ● ● ● ● ● ● ● ● ● ○ ● ● ● ● ● ● ● ● ● ●
34130 InTown Suites Conyers Conyers, GA 30013 Economy Class Aug 1996 Aug 1996 122 ○ ○ ○ ○ ○ ○ ○ ○ ○ ○ ○ ○ ○ ○ ○ ○ ○ ○ ○ ○ ○ ○ ○ ○ ○ ○ ○ ○ ○ ○ ○ ○ ○
51824 Home-Towne Studios Covington Covington, GA 30014 Economy Class Jul 2016 Jun 2001 139 ○ ○ ○ ○ ○ ● ● ● ● ● ● ● ● ● ● ● ● ● ● ● ● ● ● ● ● ●
54467 Microtel Inn & Suites by Wyndham Conyers Conyers, GA 30094 Economy Class Feb 2007 Feb 2007 62 ● ● ● ● ● ● ● ● ● ● ● ● ● ● ● ● ● ● ● ● ● ● ● ● ● ● ● ● ● ● ● ● ●
Total Properties: 4 400 ○ - Monthly data received by STR
● - Monthly and daily data received by STR
Blank - No data received by STR
Y - (Chg in Rms) Property has experienced a room addition or drop during the time period of the report.
201620152014
The STR Trend Report is a publication of STR, Inc. and STR Global, Ltd., and is intended solely for use by paid subscribers. Reproduction or distribution of the STR Trend Report, in whole or part, without written permission is prohibited and subject to legal action. If you have received this report and are
NOT a subscriber to the STR Trend report, please contact us immediately. Source: 2016 STR, Inc. / STR Global, Ltd. trading as “STR”.
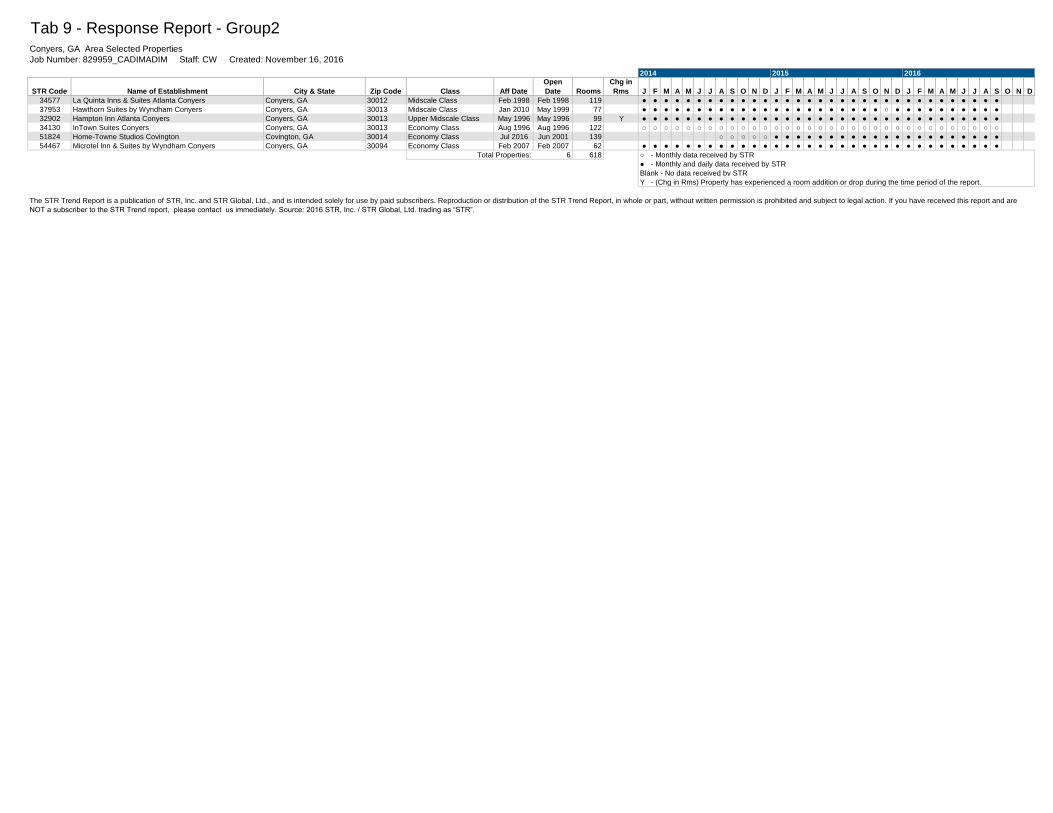
Tab 9 - Response Report - Group2Conyers, GA Area Selected Properties
Job Number: 829959_CADIMADIM Staff: CW Created: November 16, 2016
STR Code Name of Establishment City & State Zip Code Class Aff Date
Open
Date Rooms
Chg in
Rms J F M A M J J A S O N D J F M A M J J A S O N D J F M A M J J A S O N D
34577 La Quinta Inns & Suites Atlanta Conyers Conyers, GA 30012 Midscale Class Feb 1998 Feb 1998 119 ● ● ● ● ● ● ● ● ● ● ● ● ● ● ● ● ● ● ● ● ● ● ● ● ● ● ● ● ● ● ● ● ●
37953 Hawthorn Suites by Wyndham Conyers Conyers, GA 30013 Midscale Class Jan 2010 May 1999 77 ● ● ● ● ● ● ● ● ● ● ● ● ● ● ● ● ● ● ● ● ● ● ○ ● ● ● ● ● ● ● ● ● ●
32902 Hampton Inn Atlanta Conyers Conyers, GA 30013 Upper Midscale Class May 1996 May 1996 99 Y ● ● ● ● ● ● ● ● ● ● ● ● ● ● ● ● ● ● ● ● ● ● ● ● ● ● ● ● ● ● ● ● ●
34130 InTown Suites Conyers Conyers, GA 30013 Economy Class Aug 1996 Aug 1996 122 ○ ○ ○ ○ ○ ○ ○ ○ ○ ○ ○ ○ ○ ○ ○ ○ ○ ○ ○ ○ ○ ○ ○ ○ ○ ○ ○ ○ ○ ○ ○ ○ ○
51824 Home-Towne Studios Covington Covington, GA 30014 Economy Class Jul 2016 Jun 2001 139 ○ ○ ○ ○ ○ ● ● ● ● ● ● ● ● ● ● ● ● ● ● ● ● ● ● ● ● ●
54467 Microtel Inn & Suites by Wyndham Conyers Conyers, GA 30094 Economy Class Feb 2007 Feb 2007 62 ● ● ● ● ● ● ● ● ● ● ● ● ● ● ● ● ● ● ● ● ● ● ● ● ● ● ● ● ● ● ● ● ●
Total Properties: 6 618 ○ - Monthly data received by STR
● - Monthly and daily data received by STR
Blank - No data received by STR
Y - (Chg in Rms) Property has experienced a room addition or drop during the time period of the report.
201620152014
The STR Trend Report is a publication of STR, Inc. and STR Global, Ltd., and is intended solely for use by paid subscribers. Reproduction or distribution of the STR Trend Report, in whole or part, without written permission is prohibited and subject to legal action. If you have received this report and are
NOT a subscriber to the STR Trend report, please contact us immediately. Source: 2016 STR, Inc. / STR Global, Ltd. trading as “STR”.

PROPERTY PHOTOGRAPHS
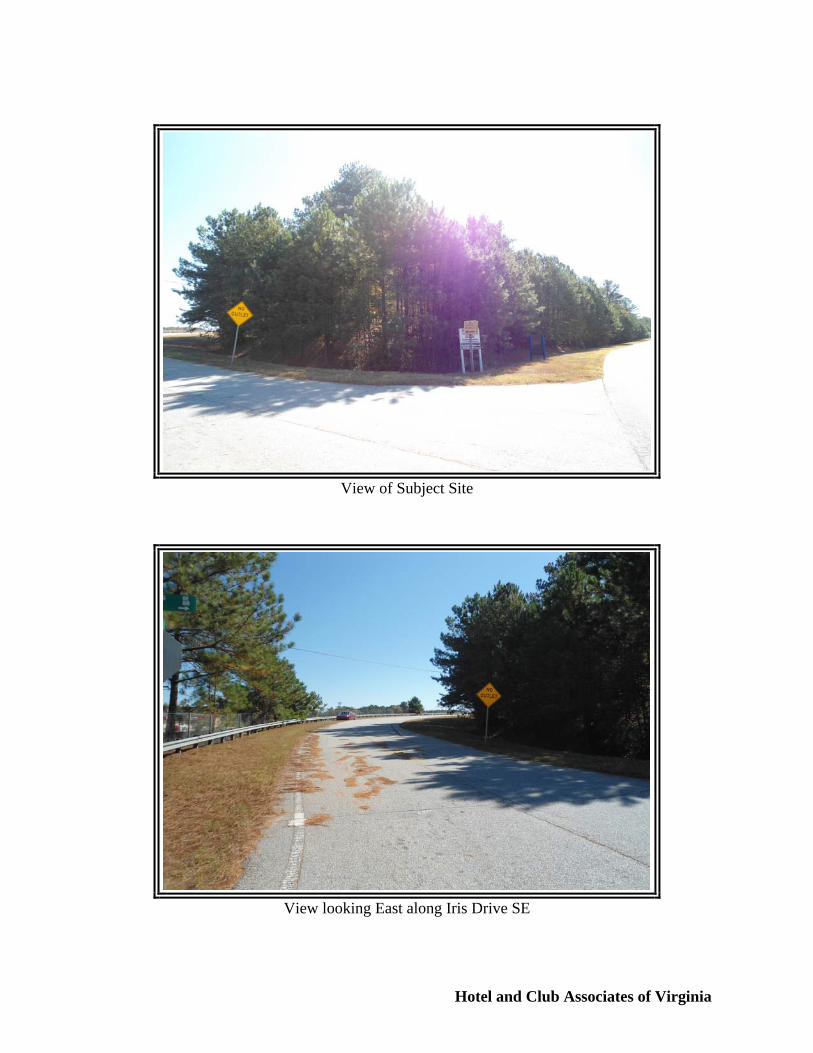
Hotel and Club Associates of Virginia
View of Subject Site
View looking East along Iris Drive SE
Hotel and Club Associates of Virginia
View looking Northwest along W. Iris Drive
View looking South along W. Iris Drive

QUALIFICATIONS OF ANALYSTS
QUALIFICATIONS
J. Richard Keegan Shamrock Capital Associates
311 Dorchester Square Lake Mary, Florida 32746
V: (407) 902-9042 E: [email protected]
EDUCATION & LICENSES
University of Wisconsin Master of Business Administration Degree (MBA) Bachelor of Arts Degree (BA)
Appraisal Licenses Certified General Appraiser, Florida No. RZ3657 Certified General Appraiser, Virginia No. 016790
Appraisal Courses Completed
Basic Appraisal Principles Basic Appraisal Procedures Business Practices & Ethics Florida Law and Rules General Appraiser Income Approach I General Appraiser Income Approach II General Market Analysis and Highest & Best Use General Report Writing & Case Studies General Sales Comparison Approach General Site Valuation & Cost Approach Real Estate Statistics, Modeling and Finance Residential Sales Comparison & Income Approach Uniform Standards of Professional Appraisal Practice (USPAP)
MEMBERSHIPS
o Associate Member of the Appraisal Institute o East Florida Chapter of the Appraisal Institute
PROFESSIONAL HISTORY Shamrock Capital Associates – Lake Mary, Florida and Hotel and Club Associates of Virginia – Norfolk, Virginia Appraiser: February 2011 – Present
Perform complex valuations for existing and proposed hotel properties Perform market demand and feasibility studies for hotel and resort developments Perform valuations of income-producing properties, specifically hotels, resorts and restaurants
Shamrock Capital Associates – Lake Mary, Florida Licensed Mortgage Broker: 2005 – 2011
Arranged hotel debt and equity financing; prepared investment and underwriting packages Analyzed market forecasts, cash flow projections, rates of return and debt servicing capabilities
Sun Development & Management Corporation – Indianapolis, Indiana Executive Vice President – Acquisitions & Development: 2001 – 2005
Directed acquisitions and development—land & hotels
QUALIFICATIONS
Christopher M. Keegan Shamrock Capital Associates
311 Dorchester Square Lake Mary, Florida 32746
Tel: (757) 822-8149 E. [email protected]
Appraisal Institute
Course 100, Basic Appraisal Principles Course 101, Basic Appraisal Practices Course 202, Residential Sales Comparison & Income Approaches Course 310, Basic Income Capitalization Course 405G, General Appraiser Report Writing and Case Studies Course 410, National Uniform Standards of Professional Appraisal Practice (USPAP) – 15 Hours Course N420DM, Business Practices and Ethics Course 500GD Advanced Market Analysis and Highest & Best Use Course 503GD, Advanced Concepts and Case Studies Course 510, Advanced Income Capitalization
MAJOR PROJECTS
Hotel & Club Associates of Virginia Perform complex valuations and evaluations for proposed and existing hotel properties throughout the
continental United States Perform market demand and feasibility studies for hotel developments throughout the continental United
States Perform valuations and evaluations of income producing property. Appraisal and evaluation assignments have
included restaurants and vacant land. MEMBERSHIPS & LICENSES
Associate Member of the Appraisal Institute East Florida Chapter of the Appraisal Institute Licensed Certified General Real Estate Appraiser in the States of Florida, Georgia, Virginia, Pennsylvania, and
North Carolina PROFESSIONAL HISTORY May 2005 – Jan 2015 Senior Appraiser Hotel and Club Associates of Virginia Norfolk, Virginia Feb 2015 – Present Managing Partner Shamrock Capital Associates Lake Mary, Florida