Embed Size (px)
Citation preview
International Journal of Optomechatronics, 4: 195–214, 2010Copyright © Taylor & Francis Group, LLCISSN: 1559-9612 print/1559-9620 onlineDOI: 10.1080/15599612.2010.484520
FEASIBILITY STUDY OF OPTICAL DETECTIONOF CHATTER VIBRATION DURING MILLING
Andras Eppel, Eniko T. Enikov, Tamas Insperger,and Stepan GaborDepartment of Aerospace and Mechanical Engineering,University of Arizona, Tucson, Arizona, USA
This article introduces an optical device for measuring and recording the vibrations
during milling. The constructed apparatus is able to discriminate between stable cutting
and chatter vibration. A review of various chatter detection methods is presented. It lists
basic numerical approximation methods to predict chatter and the devices used to
detect unstable cutting. A discussion on the importance of experimental detection versus
theoretical predictions is also included. The article further presents the measurement
setup, its basic components, and their parameters along with the basic principles of the
measurements and the theoretical framework of the stability analysis. The theoretical
framework is then applied to show the chatter determining frequencies and to determine
what has to be detected during the measurements. Experimental results for slotting and
down milling with different immersion ratios are also presented. These include stability
maps based on the power spectrum density (PSD) graphs of the collected data and
confirmed by photographs of the cut surfaces. The conclusion summarizes the results,
and describes advantages and disadvantages of the setup.
Keywords: chatter vibration, milling, optical detection
1. INTRODUCTION
Machining operations, like cutting, drilling, and milling are one of themost commonly used manufacturing processes. These have been carried out usingexperience-based approaches. The optimum cutting conditions are determinedafter extensive shop-floor tests over a long time. With the increase of industrialcompetition, the need of higher accuracy and lower production costs has becomeapparent. At the same time, the quality of the manufactured products has to bemaintained. During a milling process, one of the most disturbing phenomena is theso-called chatter vibration. This is a dynamic instability resulting in low surfacequality that can also lead to workpiece and tool damage. Self-excited vibrationsof the cutter, holder, spindle, or machine cause chatter resulting in very large chipthickness variations as each tooth of the cutter passes through the cut. The vibrationcontinues to grow until the chip thickness is exceeded and the cutter jumps out
Address correspondence to Eniko T. Enikov, Department of Aerospace and MechanicalEngineering, University of Arizona, 1130 N. Mountain Ave., Tucson, Arizona 85721, USA. E-mail:[email protected]
195
196 A. EPPEL ET AL.
NOMENCLATURE
�1 natural frequency of the mill bit, first mode� perturbationC modal dampingF cutting forceG stationary cutting force vectorH force variation matrixK modal stiffnessM modal massxp forced chatter free motion of the mill bitx deflection of mill bit� critical multiplier� characteristic multiplier� mass density� tooth passing period, 1/rpmA horizontal distance of the real previous and real current tooth passes, mma radial immersion of mill bit, mmap cutting depths of latheB vertical distances of the real previous and real current tooth passes, mmbw bandwidth of oscilloscopeD diameter of mill bitE Young’s modulusex excentricity of mill bit, �mF estimated reaction force on mill bitf1 natural frequency of the mill bit, first modefH characteristic frequency refers to the secondary Hopf bifurcation, Hzfs sampling frequency, Hzfz controled feed rate of lathe, mm/toothFjn normal component of cutting forceFjt tangential component of cutting forceFjx vertical component of cutting forceFjy horizontal component of cutting forcefPD characteristic frequency refers to period doubling, HzfTPE tooth path frequency, Hzfz feed per tooth, mmg screen functionh instantaneous chip thickness, mmI moment of inertia of the cross sectionIi currents on OPD subareasKn linear normal cutting coefficientKt linear tangential cutting coefficientL constant for OPD, mmLf overall length of mill bitN� z number of teethR� r radius of mill bitS area of cross sectiont distance between point of reflection and OPDvf feed speed, m/sx horizontal deflection of light on the OPDY estimation functiony vertical deflection of light on the OPD� angle between incident laser light and vertical� angle between vertical axes before and after deflection of mill bit
DETECTION OF CHATTER VIBRATION DURING MILLING 197
NOMENCLATURE
Rr real position sensitivity, �mRt position resolution of OPD, �ms deflection of laser beam on OPDsmax maximal deflection of laser beam on OPDx deflection of mill bit spindle speed of lathe, rpm�j angular position of the jth cutting edge, radDDE delay differential equationFFT fast Fourier transformationLDS laser distance triangulation sensorLDV laser doppler vibrometerLI laser interferometerOPD optical position detectorPSD power spectrum densitySDM semi-discretisation methodZOA zeroth order approximation
of the cut. In the past decade, extensive research was conducted to develop accuratedynamic machining models to map all of the stable and unstable cutting conditions.The work of Tlustý et al. (1962) and Tobias (1965) led to the development of thestability lobe diagram, that plots the boundary between stable and unstable cutsas a function of spindle speed. The stability analysis of such a system can onlybe performed by applying approximated numerical methods such as time-domainsimulations, frequency-domain simulations, or delay-differential equation (DDE)based methods. Recently, several time-domain simulations of a milling processwere proposed (Campomanes and Altintas 2003). For a given combination ofcutting parameters, the vibrations of the milling process are numerically simulatedby discretizing the process describing DDEs system with Euler, Runge Kutta,or Tustin‘s approximations. The stability of the system is assessed by evaluatingthe time behavior of the vibrations. This approach is very time consuming, andthe applicability in the industry is limited. On the other hand, it is capable ofmodeling the effective kinematics of milling, and some important nonlinear effects.Therefore, the results of the time-domain simulations are often used as a referencefor other methods. The first effective frequency-domain method was derived byAltintas and Budak (1995b). It is called zeroth order approximation (ZOA). Theapplicability of this method is limited to the slot milling configurations. It isnot capable of representing highly intermittent milling processes with small radialimmersions, whose cutting force trends require more harmonics to be approximated.Other methods for chatter prediction are based on the delay differential equation(DDE) theory. In 2004, Insperger and Stépán developed the semi-discretisationmethod (SDM) (Insperger and Stépán 2002, 2004). Here, the delayed terms andthe time periodic coefficients of the governing time periodic DDE are discretized,while the actual time domain terms and their derivatives are left in the originalform. This approximation provides a series of ordinary differential equationsthat can be solved in each semi-discretization step. Solution of these equationswith matching initial conditions results in a finite dimensional Floquet transitionmatrix. If the eigenvalues, the characteristic multipliers of this matrix, are in
198 A. EPPEL ET AL.
modulo less than 1 then the process is stable, otherwise, it is unstable and chatterarises. The predictive capabilities of SDM are satisfactory, but the computationis generally time-consuming since the number of discretization intervals requiredfor good accuracy is high. The methods described above, perform the analysis ondeterministic models which are usually simplified and inaccurate.
Another issue is that the stability lobe diagrams are based on the frequencyresponse function of the system. An instrumented hammer is used to excite thesystem and the response is measured with the aid of an accelerometer. The measuredresponse is then exported to additional software for mathematical computations tocreate stability diagrams. Model parameters uncertainties due to this modal testingprocedure can also lead to discrepancies between the real system behavior andthe theoretical model. Moreover, a stability lobe diagram is only accurate for onespecific tool, holder, spindle, machine, and workpiece combination, so one has tomake the hammer test for each combination.
Because of these reasons, there is still a need for in-process detection methodsto predict and avoid chatter frequencies during milling processes. There are severalsetup types for measuring the vibrations on rotating machines. Since accelerometerscannot be applied on the spindle shaft itself, the first option is to measurethe vibration transmitted from the spindle into a nonrotating part. Noncontactposition transducers, such as capacitive and inductive displacement sensors arepossible measurement methods but these kinds of sensors are limited to be veryclose to the rotating part. Other noncontact measurement devices such as laserdistance triangulation sensors (LDS), TV-holography, laser doppler vibrometers(LDV), or laser interferometer (LI) may be used. The most sensitive, accurate,and precise optical device for measuring distance or displacement is the laserinterferometer. This apparatus uses interference to make measurements of distances.These vibrometers are expensive devices. Errors occur when the contrast of theinterferometer signal is not perfect and when the phase-shifted signal is not shiftedby exactly 90�. Besides, the price of these devices is far higher than the price of thedevice shown here. An inexpensive method would be to detect chatter with the helpof a microphone (Schmitz 2003). During chatter, besides the tooth path frequenciesother frequencies arise. Although these would be detectable with a microphone,in a laboratory or a machine shop a microphone could collect a large amount ofnoise; one would have to filter these out permanently, and this would make themeasurements more difficult, and less reliable.
The objective of this project is to build a low cost optical measurementapparatus that is able to record the displacement of a rotating mill bit duringa cutting process, and to determine at what spindle speed and cutting depth theprocess becomes unstable. During a stable milling process, the data should showonly the frequencies associated with the teeth passing through the workpiece.During an unstable cut, the characteristics of the graphs should show a noticeablechange, where additional vibrational frequencies associated with chatter will appear.This is discussed in section 5.
2. MEASUREMENT SETUP
Figure 1 shows the optical setup mounted on the lathe. The basic parts of thesetup are labeled in the figure. It consist of several mounting brackets, laser source,
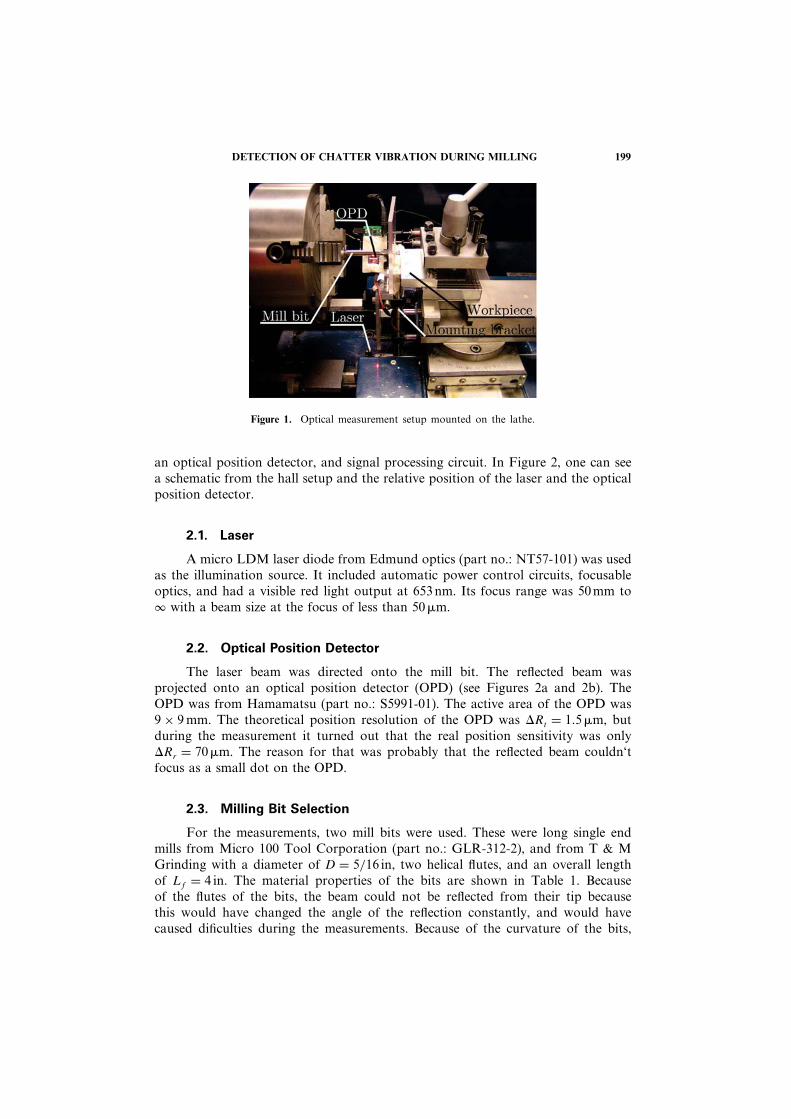
DETECTION OF CHATTER VIBRATION DURING MILLING 199
Figure 1. Optical measurement setup mounted on the lathe.
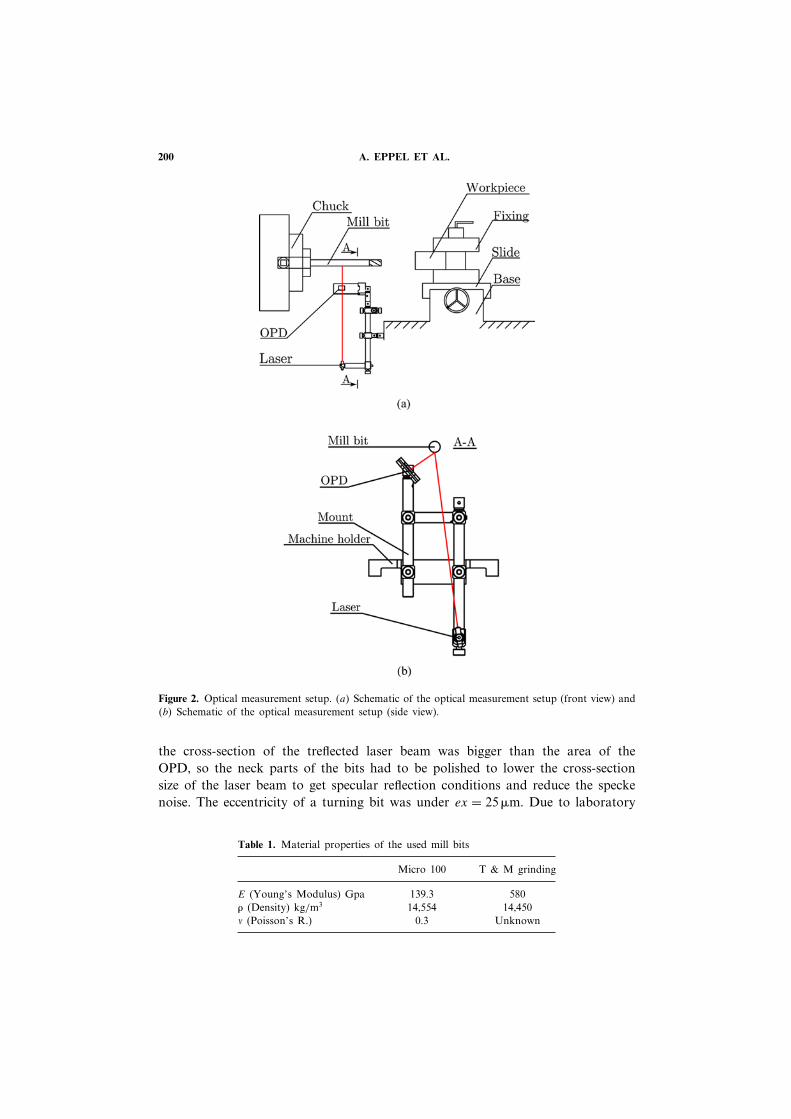
an optical position detector, and signal processing circuit. In Figure 2, one can seea schematic from the hall setup and the relative position of the laser and the opticalposition detector.
2.1. Laser
A micro LDM laser diode from Edmund optics (part no.: NT57-101) was usedas the illumination source. It included automatic power control circuits, focusableoptics, and had a visible red light output at 653nm. Its focus range was 50mm to� with a beam size at the focus of less than 50�m.
2.2. Optical Position Detector
The laser beam was directed onto the mill bit. The reflected beam wasprojected onto an optical position detector (OPD) (see Figures 2a and 2b). TheOPD was from Hamamatsu (part no.: S5991-01). The active area of the OPD was9× 9mm. The theoretical position resolution of the OPD was Rt = 1�5�m, butduring the measurement it turned out that the real position sensitivity was onlyRr = 70�m. The reason for that was probably that the reflected beam couldn‘tfocus as a small dot on the OPD.
2.3. Milling Bit Selection
For the measurements, two mill bits were used. These were long single endmills from Micro 100 Tool Corporation (part no.: GLR-312-2), and from T & MGrinding with a diameter of D = 5/16 in, two helical flutes, and an overall lengthof Lf = 4 in. The material properties of the bits are shown in Table 1. Becauseof the flutes of the bits, the beam could not be reflected from their tip becausethis would have changed the angle of the reflection constantly, and would havecaused dificulties during the measurements. Because of the curvature of the bits,
200 A. EPPEL ET AL.
Figure 2. Optical measurement setup. a� Schematic of the optical measurement setup (front view) and b� Schematic of the optical measurement setup (side view).
the cross-section of the treflected laser beam was bigger than the area of theOPD, so the neck parts of the bits had to be polished to lower the cross-sectionsize of the laser beam to get specular reflection conditions and reduce the speckenoise. The eccentricity of a turning bit was under ex = 25�m. Due to laboratory
Table 1. Material properties of the used mill bits
Micro 100 T & M grinding
E (Young’s Modulus) Gpa 139.3 580� (Density) kg/m3 14,554 14,450� (Poisson’s R.) 0.3 Unknown
DETECTION OF CHATTER VIBRATION DURING MILLING 201
limitation, a lathe (Enco Type: # 308–0233) was used to emulate a milling machineby interchanging the positions of the workpiece and the working tool. The mill bitwas fixed into the spindle of the lathe and the probe, and an aluminum brick wasplaced on the place of the cutting knife. Measurements were made with spindlespeeds of = 385, 510, 585, 770, 900, 1,170, and, 1,800 rpm, with axial cuttingdepths of ap = 1–6mm with a constant increase of 0�5mm, and with a constantfrom the lathe-controled feed rate of fz = 0�078 = mm/tooth. Due to the limitationsof the lathe, no high speed cutting processes were investigated.
A digital oscilloscope (Link Instruments Type: DSO – 8500) was connectedto a laptop (Dell Latitude D610). The OPD was connected to the oscilloscope.The frequency bandwidth of the optical system was equal with the bandwidth ofthe oscilloscope, and this was bw = 100MHz. A manufacturer-suggested currentsensing circuit was used to measure the position of the reflected beam (seeFigures 2a and 2b). The position of the beam was determined according to thefollowing formulas.
I2 + I3�− I1 + I4�
I1 + I2 + I3 + I4= 2x
L(1)
I2 + I4�− I1 + I3�
I1 + I2 + I3 + I4= 2y
L� (2)
where Ii values are the currents on the four subareas of the OPD, x and y are theperpendicular deflections on the OPD, and L is L = 10mm for S5991-01. Theseformulas were provided from the manufacturer and can be dound on the data sheetof the OPD.
Two output signals were collected on the two channels of the oscilloscopeconnected to the laptop through a usb data port, and processed with a Matlabprogram. The laser and the OPD were attached to mounting tools from Thorlabs;these posts and clamps are specifically designed for optical measurements. Toavoid constructing a separate stand for the laser and the OPD, they were attachedthrough mounting posts and clamps from Thorlabs directly to the main slide ofthe lathe. The posts and clamps are designed for optical measurements. Because ofthis mounting method, it had to be checked to see if the vibrations of the latheitself would influence the measurement. Tests with rotating spindle but withoutcutting showed that the vibrations of the machine were negligible compared to thevibrations of the mill bit during cutting. Figure 2b shows the relative position of thelaser and the OPD to the mill bit.
3. MEASUREMENT PRINCIPLES
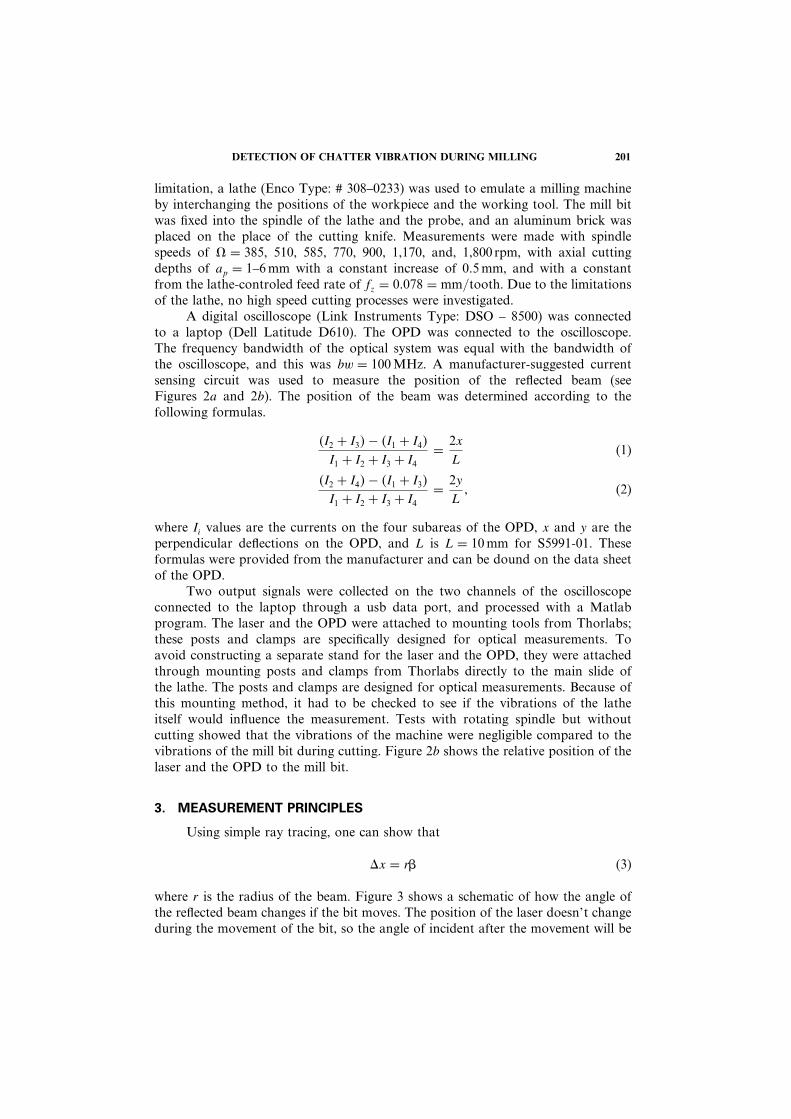
Using simple ray tracing, one can show that
x = r� (3)
where r is the radius of the beam. Figure 3 shows a schematic of how the angle ofthe reflected beam changes if the bit moves. The position of the laser doesn’t changeduring the movement of the bit, so the angle of incident after the movement will be
202 A. EPPEL ET AL.
Figure 3. Laser beam reflection diagram.
�+ �. It is easy to see that the angle between the reflected rays before and after themovement will be 2�. For small deflections s will be
s = 2t� (4)
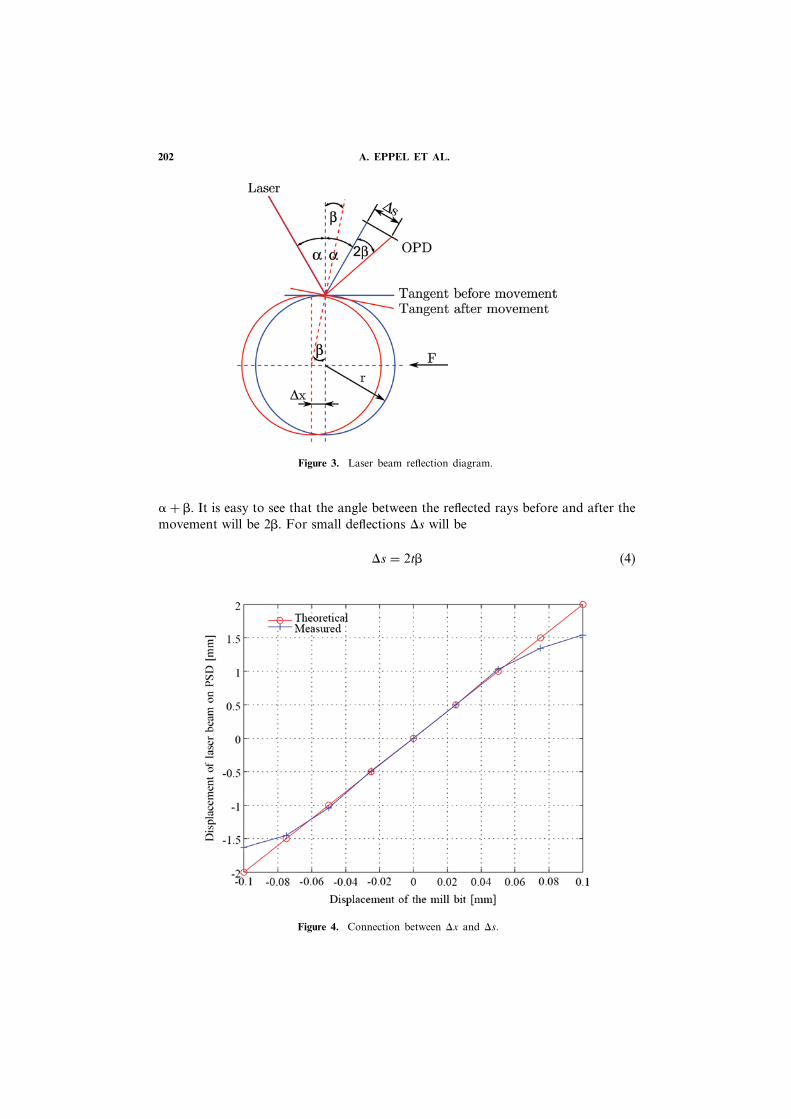
Figure 4. Connection between x and s.
DETECTION OF CHATTER VIBRATION DURING MILLING 203
Therefore, the connection between the deflection of the bit and the reflected lightspot on the OPD will be
s = 2trx (5)
The bit size was chosen according to its known material properties, such thatfor an estimated reaction force of F = 80N, (Mann et al. 2002), the maximaldeflection on the OPD (Type: 5990-01) is smax = 4mm. Validation of Eq. (5) wasperformed using a micro-positioner moving the bit with prescribed displacement.The calibration showed that the definition in Eq. (5) of the connection between thebit movement and the reflected beam movement on the OPD is precise enough.Moreover, it also shown that the measured displacement on the OPD differs fromthe theoretical (Figure 4), this had to be considered during the calculations andprogramming of the Matlab code. The diameter of the chosen bit was D = 5/16in and the distance between the bit and the OPD was t = 40mm. This means anamplification of the bit displacement to the displacement of the reflected beam onthe OPD is by 10. With these parameters, the difference between the displacementon the OPD due to the calibration (in the measured point x = 0�025mm, y =0�49mm) and the counted displacement was about 3%.
4. MEASUREMENTS
First, the natural frequency of the bit (from T & M Grinding) was measured.An estimation was made according to the Rayleigh method. The first mode can beestimated with the following expression.
�21 =
IE∫ l
0 Y′′2 x�dx
�S∫ l
0 Y2 x�dx
[1s2
](6)
where I is the inertia of moment of the bit, E is the Young’s modulus, � is thedensity, S is the area of the cross-section, and Y is an estimation function. This isa simple polynomial function Y = x3 + a2x
2 + a1x + a0. The constants a1, a2, anda3 were calculated due to the edge conditions Y 0� = 0, Y ′ 0� = 0, and Y ′′ l� = 0,where l is the total length of the beam. According to the calculations, the firstmode of the bit was f1 = �1/2� = 1�109�9Hz. The calculation was also checkedwith a simple FEM model created in Ansys. The calculated first mode was heref1 = 1�125�7Hz. The sampling frequency with the oscilloscope was fs = 1MHz. Themeasured self-vibration was f1 = 1�162Hz, which compares well with the estimatedvalues. The measurements were repeated during cutting. During the processes, nolubricants were used. The laser and the OPD was covered with a plexi plate, sothe chips produced during cutting could not damage them and could not affect themeasurements.
So-called full immersion cutting or slotting was done. Here, the immersionratio was a/D = 1, where a is the radial immersion and D is the diameter of the bit.The experiments did not show chatter on the frequency spectrum. A second set ofmeasurements was made with an immersion ratio of a/D = 0�25 and a/D = 0�5. Allof these measurements were made as down milling cutting processes. The parameters
204 A. EPPEL ET AL.
of the measured points are described in section 2 and subsection 2.3, the onlydifference is that the maximal cut depth ap was reduced to 4mm. Besides collectingthe data, photographs were made of the work pieces and the cuts. Stability mapswere made according to the stored data and according to the photos, and thesewere compared afterwards. The stored data was processed with a Matlab programcalculating the Fourier (FFT) and power spectrum density (PSD) graphs. The PSDgraphs showed characteristic changes when a cut was unstable. The interpretationof these results requires an in-depth analysis of the chatter phenomenon.
5. ANALYSIS OF CHATTER
5.1. Mechanical Model
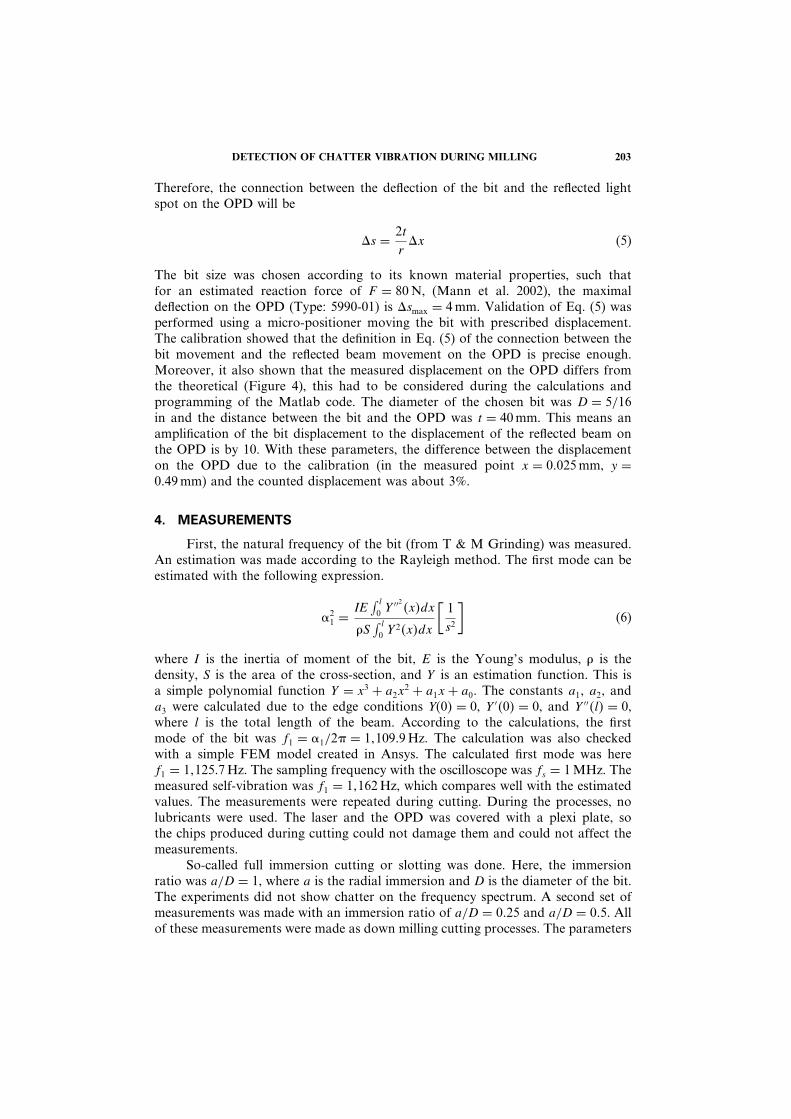
The mathematical model describing a milling process is a delay-differentialequation (DDE) with infinite dimensional state space. For continuous cuttingoperations, like turning, the governing equation is autonomous and the stabilityconditions can be given in closed form. The study of nonlinear phenomena inthe cutting process showed that the chatter frequencies are related to unstableperiodic motions about the stable stationary cutting, i.e., a so-called subcritical Hopfbifurcation occurs, as proven experimentally by Shi and Tobias (1984), and lateranalytically by Stépán and Kalmár-Nagy (1997).
The theoretical explanation in this section is based on Insperger et al. (2006).The standard 2-DOF (degree of freedom) mechanical model of end milling is shownin Figure 5. The tool is assumed to be flexible relative to the rigid workpiece. The
Figure 5. Schematic of 2-DOF milling model.
DETECTION OF CHATTER VIBRATION DURING MILLING 205
2-DOF oscillator is excited by the cutting force F t�. The governing equation hasthe following form.
Mx t�+ Cx t�+ Kx t� = F t� (7)
where
x t� =[x t�y t�
]� F t� =
[Fx t�Fy t�
](8)
The x and y components of the cutting force are given as
Fjx t� = Fjt t� cos�j t�+ Fjn t� sin�j t� (9)
Fjy t� = −Fjt t� sin�j t�+ Fjn t� cos�j t�� (10)
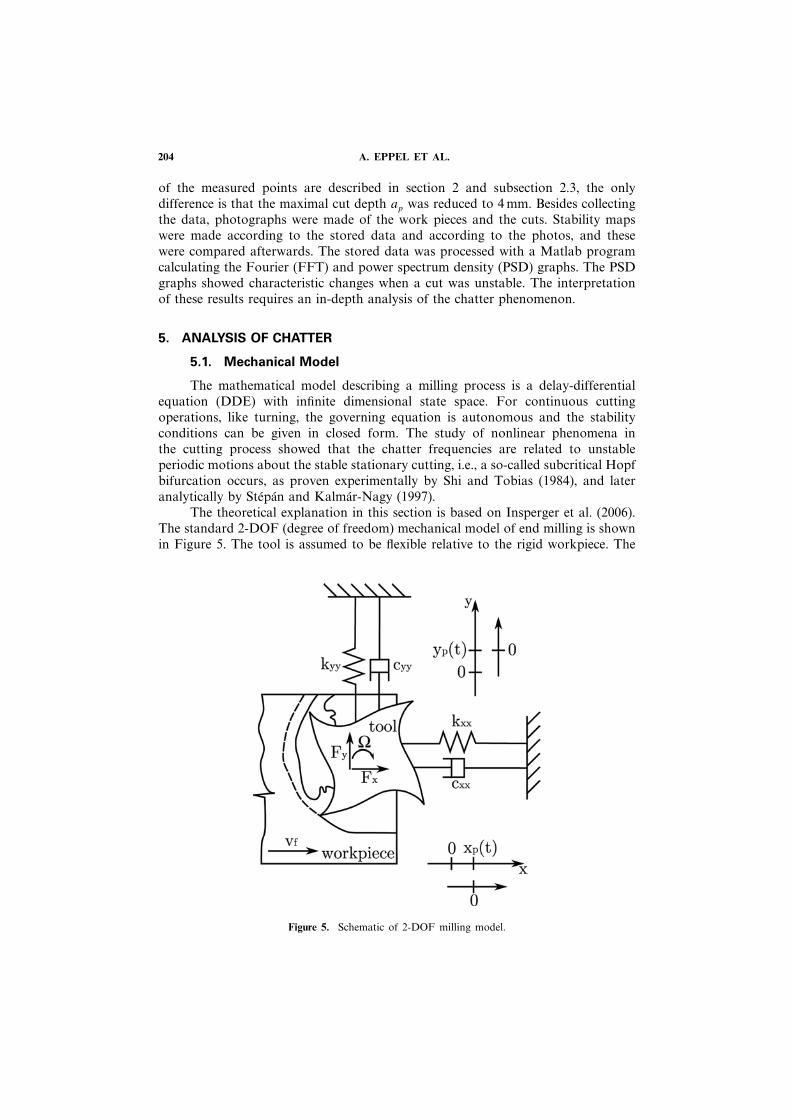
where Fjt t� and Fjn t� are the normal and tangential forces acting on jth tooth,respectively, and �j t� is the angular position of the jth cutting edge. Let the feedper tooth be denoted by fz = vf � where vf is the feed speed and � = 60/ N� is thetooth passing period. If fz � R, where R is the radius of the tool and A and B are thehorizontal and vertical distances of the real previous and real current tooth passes,then the instantaneous chip thickness can be expressed according to Figure 6 as
h t� ≈ A sin�j t�+ B cos�j t�
= �fz + x t − ��− x t�� sin�j t�+ �y t − ��− y t�� cos�j t� (11)
Figure 6. Chip thickness.
206 A. EPPEL ET AL.
The resultant cutting forces are the sum of the forces acting on the teeth.
Fx t� =N∑j=1
Fjx t�
=N∑j=1
g��j t���Kt cos�j t�+ Kn sin�j t��aph t�
(12)
Fy t� =N∑j=1
Fjy t�
=N∑j=1
g��j t���−Kt sin�j t�+ Kn cos�j t��aph t�
where g��j t�� is a screen function, which is 1 when the jth tooth is cutting and 0when not. Kt and Kn are the linear tangential and linear normal cutting coefficients.So, the equation of motion can be written in the following form.
Mx t�+ Cx t�+ Kx t� = apH t��x t − ��− x t��+G t� (13)
where H t� is the force variation matrix (Altintas and Budak 1995a). G t� is thestationary cutting force vector
Gt x� = apfzHxx t� (14)
Gt y� = apfzHyx t� (15)
5.2. Forced and Self-Excited Motion of the Tool
The motion of the workpiece is decomposed in the form:
x t� = xp t�+ � t� =[xp t�yp t�
]+
[� t�� t�
](16)
where xp t� = xp t − �� is the forced chatter free motion of the tool, and � t� is aperturbation corresponding to the self-excited vibrations of the tool. Substitution ofEq. (16) into Eq. (13) results in
Mxp t�+ Cxp t�+ Kxp t�+M� t�+ C� t�+ K� t� = apH t��� t − ��− � t��+G t�(17)
For the ideal case, when no chatter arises, � t� = 0, and the motion is describedby x t� = xp t�, the corresponding equation of motion is an ordinary differentialequation.
Mxp t�+ Cxp t�+ Kxp t� = G t� (18)
DETECTION OF CHATTER VIBRATION DURING MILLING 207
For linear stability analysis the variational system of Eq. (13) is determined aroundthe periodic chatter-free motion xp t�. Equations (17) and (18) imply the equation
M� t�+ C� t�+ K� t� = apH t��� t − ��− � t�� (19)
If the cutting process is stable, the component � t� corresponds to the chatter signaldecays, and the tool moves according to the periodic chatter–free motion describedby xp t�. If the process is unstable, � t� increases exponentially, and the resultantmotion x t� = xp t�+ � t� will also obtain exponential growth.
For unstable machining, the nonlinear phenomena also plays an importantrole in the system’s dynamics. Due to its large vibrations, the tool leaves the cutand the cutting force instantly drops to zero. This nonlinearity actually stops theexponential amplitude growth so that in practice, the tool vibrations during unstablemachining still have a finite amplitude (Stépán et al. 2005).
The linear stability of the milling process is described by Eq. (19). The stabilityanalysis of this time periodic DDE can be determined by the semidiscretizationmethod (Insperger et al. 2003). The critical multipliers can be located three ways.
1) They are a complex pair located on the unit circle, ��� = 1. This case istopologically equivalent to the Hopf bifurcation of autonomous systems.
2) � = 1. The associated bifurcation is topologically equivalent to the saddle-nodebifurcation of autonomous systems and is called a period one bifurcation.
3) � = −1. This case is called period doubling or flip bifurcation. There is notopologically equivalent type of bifurcation for autonomous systems.
According to Davies et al. (2002), in milling processes only cases 1) and 3) can beobserved. First, when � is a complex pair then characteristic frequencies arise in thevibration signal. These frequencies can be defined as
fnH =
{± �
2�+ n
z
60
}[Hz] n = � � � �−1� 0� 1� � � � (20)
and refer to the secondary Hopf bifurcation. Second, when � < −1; � ∈ R, thenanother type of characteristic frequencies arise in the measured signal. Thesefrequencies can be defined as
fnPD = z
120+ n
z
60[Hz] n = � � � �−1� 0� 1� � � � (21)
� = Im ln��/� where � is the characteristic multipliers, z is the number of teeth,and is the spindle speed of the machine.
During a stable milling operation, the excited frequencies are related to allcomponents of x t� defined by Eq. (16). The periodic motion xp t� contains thecharacteristic frequencies defined as
fnTPE = nz
60[Hz] n = 1� 2� 3� � � � (22)
Because of the runout of the bit the period, doubling frequencies (fnPD) turn into
tooth path frequencies (fnTPE) because the principal period changes from � = z /60�
208 A. EPPEL ET AL.
to T = z� (Insperger et al. 2008). Runout is a phenomenon where the loads on thecutting teeth of the mill bit are not equal. This comes out of the asymmetry of themultiflute bits.
Run out typically arises in machining with bits that have more than one flutesbecause the tool is never ideally symmetric. During a stable process, peaks shouldbe visible only at the fn
TPE and fnPD frequencies. The expected changes on the graphs
during an unstable cut were that peaks arise not only at these frequencies but
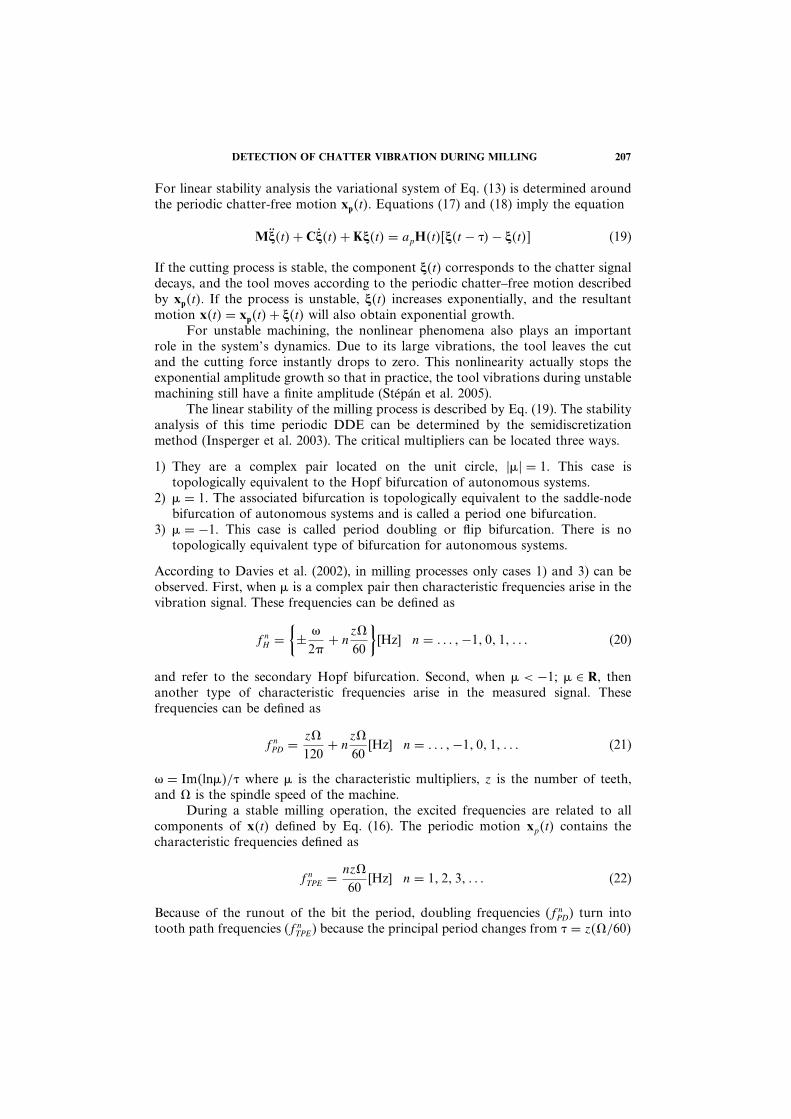
Figure 7. Stability maps according to data (top) and according to photos (bottom).
DETECTION OF CHATTER VIBRATION DURING MILLING 209
Table 2. Characteristic frequencies
(rpm) fnTPE (Hz)
n 1 2 3
385 13�7 27�4 41�1510 18�3 36�6 54�9585 20�9 41�7 62�6770 27�4 54�7 82�1900 31�7 63�3 951,170 41�6 83�3 124�91,800 63�1 126�1 189�2
fnPD (Hz)
385 20�5 34�3 48510 27�5 45�7 64585 31�3 52�2 73770 41 68�4 95�8900 47�5 79�2 110�8
1,170 62�5 104�1 145�71,800 94�6 157�7 220�7
also in between those. Contrary to this, we observed that during an unstable cutthe fn
PD frequencies disappeared. Although the changes on the PSD graph of anunstable cut related to a stable cut were not expected ones, the dissapearance of thefnPD frequencies is ovious, so the observations of the PSD graphs still give reliableinformation about the stability of a cutting process.
The first map was made according to a/D = 0�5. For these, the comparisonbetween photographs and vibration frequency peaks showed some differences.
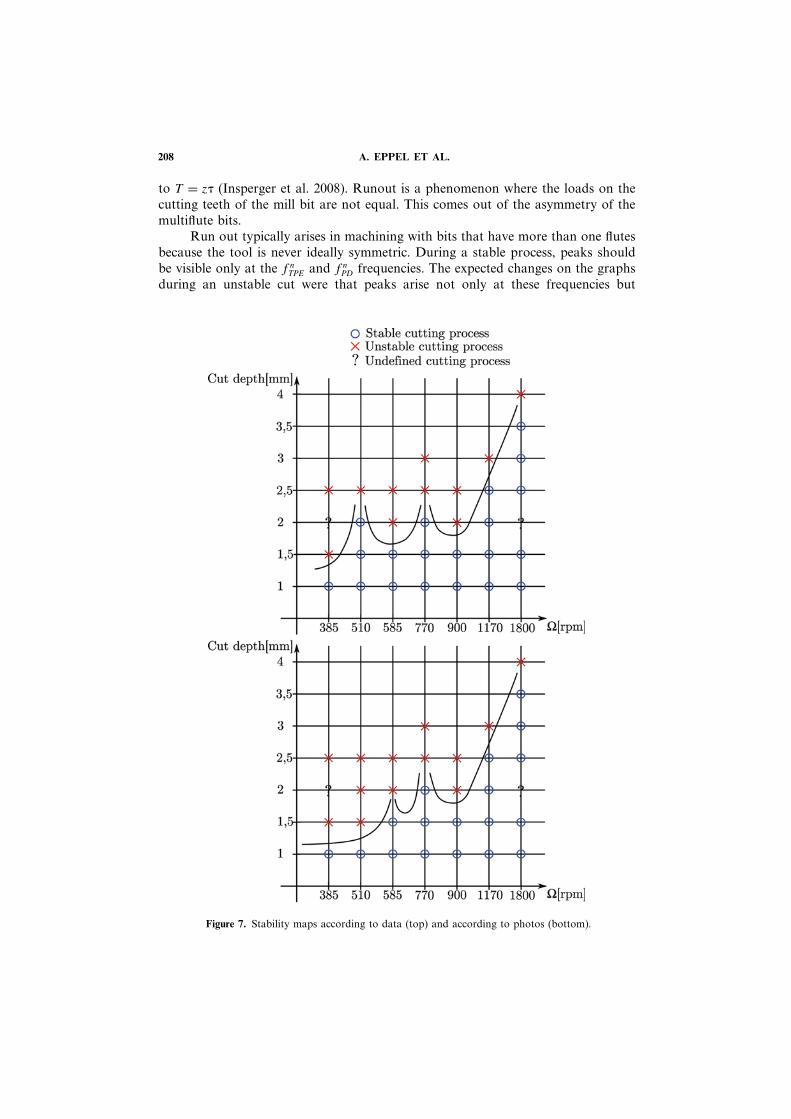
Figure 8. Power spectrum graph of a stable cut.
210 A. EPPEL ET AL.
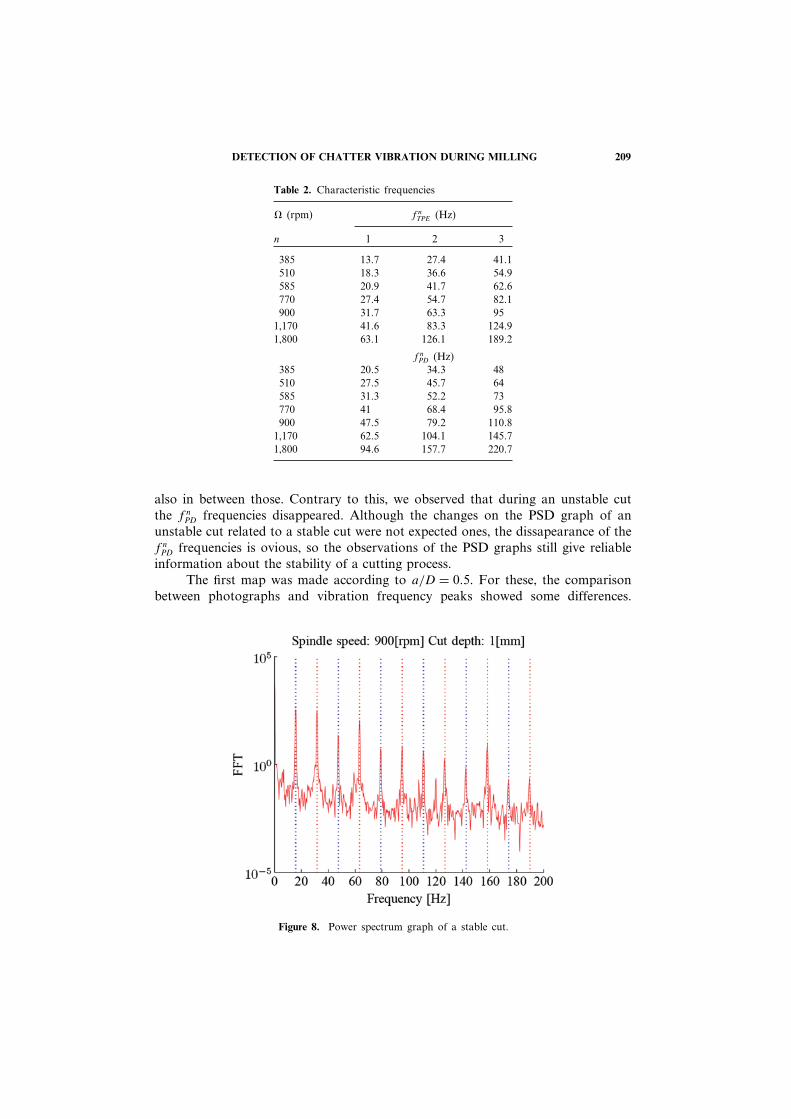
Figure 9. Power spectrum graph of an unstable cut.
The graphs didn’t match each other completely. This was because the chosensampling frequency was wrong. The oscilloscope used is able to store 524,200points. The chosen sampling frequency was fs = 50KHz and fs = 100KHz. Atlower spindle speeds, this caused a too short measuring window and the unstablevibrations weren’t recorded. Figure 7 shows the maps made according to themeasurements and the photos. The difference is at = 510 rpm, ap = 1�5mm, = 510 rpm, and ap = 2mm on the two graphs. The boundary lines for stableand unstable processes are estimations and sketches, no calculations were done todetermine the stability lobes. Figures 8 and 9 show the PSD graphs of the powerspectrum of the measured displacement. The red and blue dotted vertical lines show
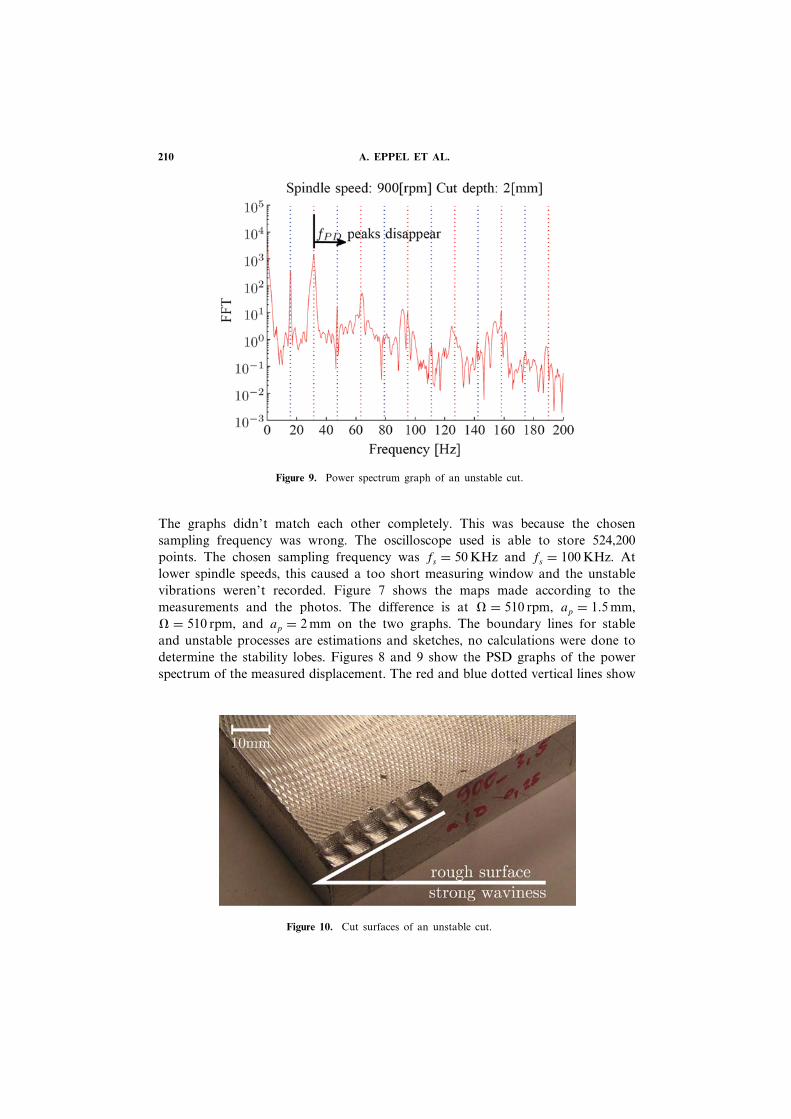
Figure 10. Cut surfaces of an unstable cut.
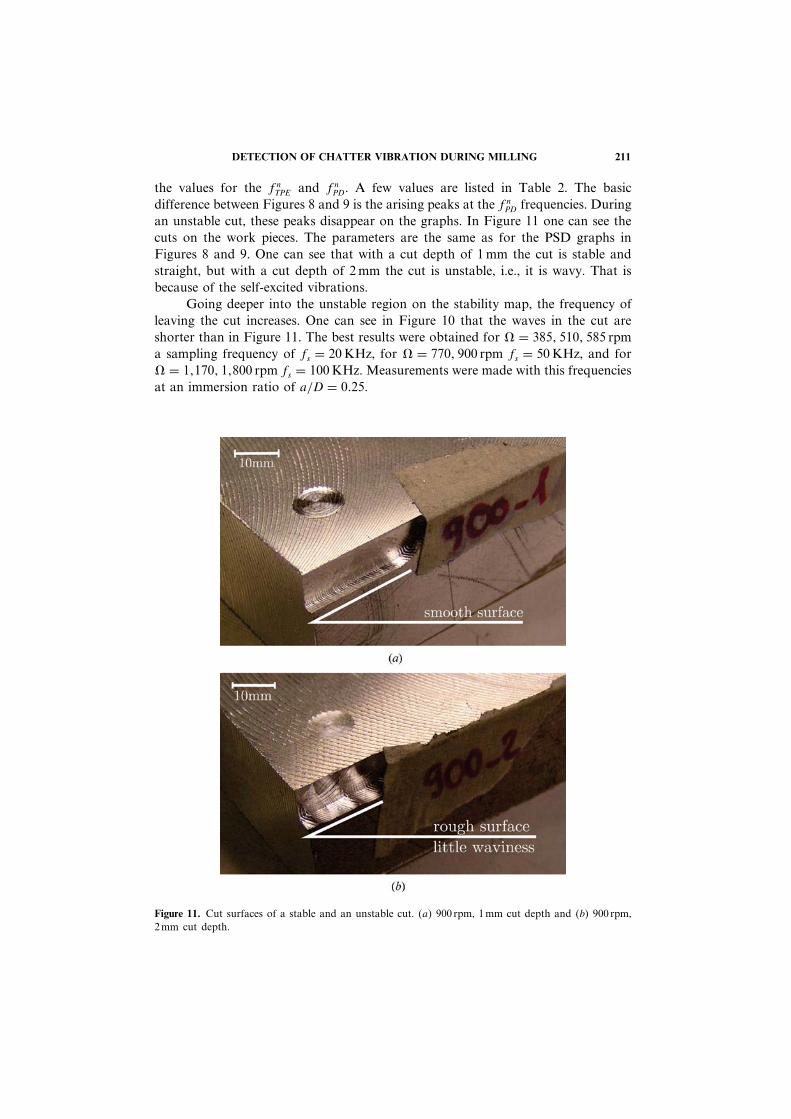
DETECTION OF CHATTER VIBRATION DURING MILLING 211
the values for the fnTPE and fn
PD. A few values are listed in Table 2. The basicdifference between Figures 8 and 9 is the arising peaks at the fn
PD frequencies. Duringan unstable cut, these peaks disappear on the graphs. In Figure 11 one can see thecuts on the work pieces. The parameters are the same as for the PSD graphs inFigures 8 and 9. One can see that with a cut depth of 1mm the cut is stable andstraight, but with a cut depth of 2mm the cut is unstable, i.e., it is wavy. That isbecause of the self-excited vibrations.
Going deeper into the unstable region on the stability map, the frequency ofleaving the cut increases. One can see in Figure 10 that the waves in the cut areshorter than in Figure 11. The best results were obtained for = 385� 510� 585 rpma sampling frequency of fs = 20KHz, for = 770� 900 rpm fs = 50KHz, and for = 1�170� 1�800 rpm fs = 100KHz. Measurements were made with this frequenciesat an immersion ratio of a/D = 0�25.
Figure 11. Cut surfaces of a stable and an unstable cut. a� 900 rpm, 1mm cut depth and b� 900 rpm,2mm cut depth.
212 A. EPPEL ET AL.
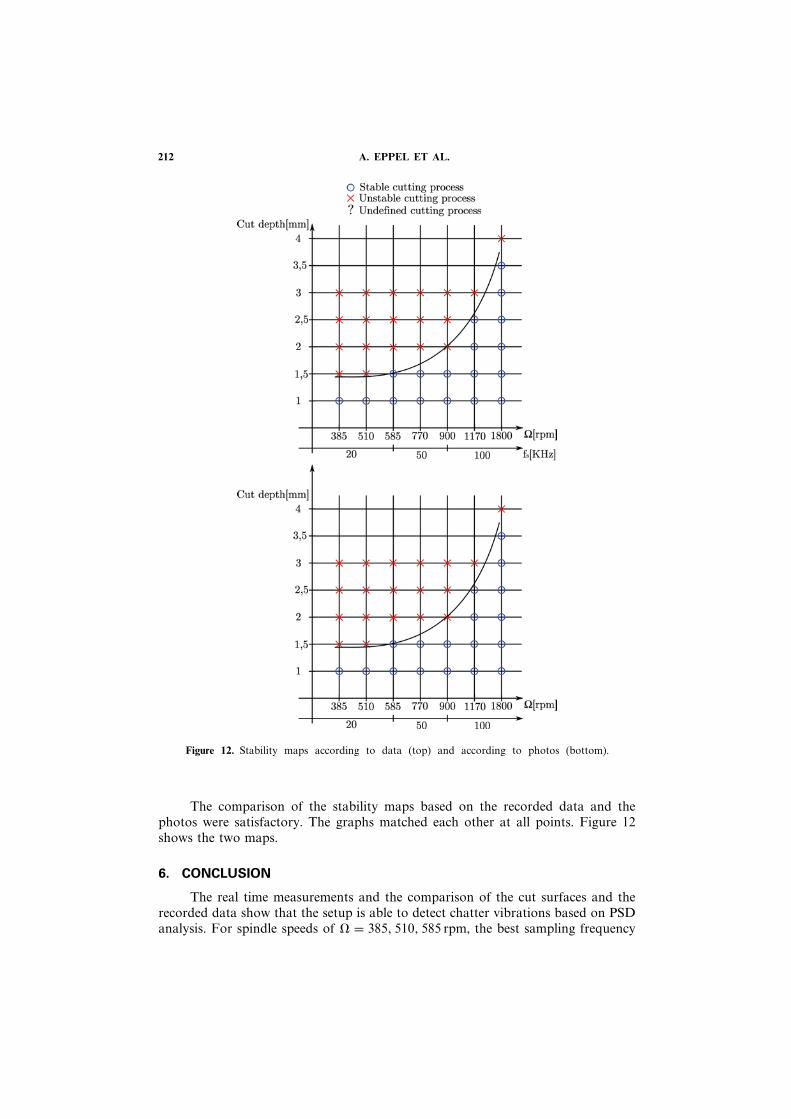
Figure 12. Stability maps according to data (top) and according to photos (bottom).
The comparison of the stability maps based on the recorded data and thephotos were satisfactory. The graphs matched each other at all points. Figure 12shows the two maps.
6. CONCLUSION
The real time measurements and the comparison of the cut surfaces and therecorded data show that the setup is able to detect chatter vibrations based on PSDanalysis. For spindle speeds of = 385� 510� 585 rpm, the best sampling frequency
DETECTION OF CHATTER VIBRATION DURING MILLING 213
was fs = 20KHz. The oscilloscope was able to store a maximum number of 524,200points. At a high sampling rate at these spindle speeds, the resulting measuringwindow was too short to capture the instability developement. For spindle speedsof = 770� 900 rpm the best sampling frequency was fs = 50KHz. For spindlespeeds of = 1�170� 1�800 rpm, the best sampling frequency was fs = 100KHz.A lower frequency caused too long of a measurement. After about 10 s, the slideof the machine reached its limits, and the length of the measurement with fs =50KHz was about 16 s. Because of the two flutes on the bit and the runout duringa stable cutting process, the fn
TPE peaks turned into fnPD peaks like those in Figure 8.
The measuring method can be adapted on a vertical CNC machine. Connecting asecond laser, the horizontal deflections could also be detected and a two-dimensionaldeflection analysis can be done.
6.1. Advantages of the System
• The setup is quite flexible. The parts are not limited to be very close to therotating bit, as in the case of the capacitive and inductive displacement sensors.One can mount the laser and the OPD onto the machine itself if the housing isstiff enough, or build a separate stand for them.
• It is not as sensible as the laser interferometer because its work principles are notbased on the phase shift of the laser light.
• The setup itself is really simple; it is built only out of a few parts. The mainelements are the laser and the OPD.
• Compared to most of the other devices, this setup is quite inexpensive.
6.2. Disadvantages of the System
• The surface where one wants to reflect the laser beam has to be polished, and inthe case of a rotating mill, the roundness of the bit has to be ensured to avoidspeckle noise.
• The OPD is sensible against all kinds of dirt and impurities. If the setup is builtclose to the bit, one has to cover it so that no chips of the workpiece fall onto itbecause this would damage the OPD.
• The device is not measuring the vibrations on the tool tip but at the neck part ofa bit, so the results don‘t show the vibrations arising at the cutting point.
ACKNOWLEDGMENTS
This article is based on a thesis, written by Andras Eppel at the University ofArizona, Department of Aerospace and Mechanical Engineering. The project wassupported by a bilateral grant from the U.S. Dept. of Education (#P116J080016),the Atlantis program of the European Commission (2008-1767/001-001 CPTUSMOBI), and by a grant from NSF (DUE# 0633312).
REFERENCES
Altintas, Y. and E. Budak. 1995a. Chatter instability in milling systems with flexible rotatingspindles — A new theoretical approach. ASME J. Manuf. Sci. Eng. 123(1):1–9.
214 A. EPPEL ET AL.
Altintas, Y. and E. Budak. 1995b. Analytical prediction of stability lobes in milling. Annalsof the CIRP 44(1):357–362.
Campomanes, M. L. and Y. Altintas. 2003. An improved time domain simulation fordynamic milling at small radial immersions. Manufacturing and Engineering and Science125(3):29–38.
Davies, M. A., J. R. Pratt, B. Dutterer, and J. Burns. 2002. Stability prediction for low radialimmersion milling. Journal of Manufacturing Science and Engineering 124(2):217–225.
Insperger, T. and G. Stépán. 2002. Semi-discretization method for delayed systems. Int. J.Numer. Methods Eng. 55(5):503–518.
Insperger, T. and G. Stépán. 2004. Updated semi-discretization method for delayed systems.Int. J. Numer. Methods Eng. 61(1):117–141.
Insperger, T., J. Gradisek, M. Kalveram, G. Stépán, K. Winert, and E. Govekar. 2006.Machine tool chatter and surface location error in milling. Journal of ManufacturingScience and Engineering 128(4):913–920.
Insperger, T., P. V. Bayly, G. Stépán, and B. P. Mann. 2003. Multiple chatter frequencies inmilling processes. Journal of Sound and Vibration 262(2):333–345.
Insperger, T., B. P. Mann, T. Surmann, and G. Stépán. 2008. On the chatter frequenciesof milling processes with runout. International Journal of Machine Tools & Manufacture48(10):1081–1089.
Mann, B. P., T. Insperger, P. V. Bayly, and G. Stépán. 2002. Stability of up-milling, anddown-milling, part 2: experimental verification. International Journal of Machine Tools &Manufacture 43(1):35-40.
Schmitz, T. L. (2003). Chatter recognition by a statistical evaluation of the synchronouslysampled audio signal. Journal of Sound and Vibration 262(3):721–730.
Shi, H. M. and S. A. Tobias. 1984. Theory of finite amplitude machine tool instability.International Journal of Machine Tool Design and Research 24(1):45–69.
Stépán, G. and T. Kalmár-Nagy. 1997. Nonlinear regenerative machine tool vibration.Proceedings of the 1997 ASME Design Engineering Technical Conferences, Sacramento,California, pp. DETC97/VIB-4021 (CD-ROM).
Stépán, G., R. Szalai, B. P. Mann, P. V. Baily, T. Insperger, J. Gradisek, and E. Govekar.2005. Nonlinear dynamics of high-speed milling-analyses, numerics and experiments.ASME J. Vibr. Acoust. 127(2):197–203.
Tlustý, J., A. Polacek, C. Danek, and J. Spacek. 1962. Selbsterregte Schwingungen anWerkzeugmaschinen. Berlin: VEB Verlag Technik.
Tobias, S. A. 1965. Machine Tool Vibration. London: Blackie.