Embed Size (px)
Citation preview

Feasibility study of electron beamwelding of spent nuclear fuel canisters
A SandersonT F SzluhaJ L TurnerR H Leggatt
The Welding Institute Cambridge,The United Kingdom April 1983

v
FEASIBILITY STUDY OF ELECTRON BEAM WELDING
OF SPENT NUCLEAR FUEL CANISTERS
A SandersonT F SzluhaJ L TurnerR H Leggatt
The Welding InstituteCambridge, The United Kingdom April 1983
This report concerns a study which was conductedfor SKBF/KBS. The conclusions and viewpointspresented in the report are those of the author(s)and do not necessarily coincide with those ofthe client.
A list of other reports published in thisseries during 1983 is attached at the endof this report. Information on KBS technicalreports from 1977-1978 (TR 121), 1979 (TR 79-28),1980 (TR 80-26), 1981 (TR 81-17) and 1982(TR 82-28) is available through SKBF/KBS.

FEASIBILITY STUDY OF ELECTRON BEAM WELDING
OF SPENT NUCLEAR FUEL CANISTERS
The Welding Institute
Abington Hall, Abington Cambridge, The United Kingdom
April 1983
1. Feasibility Study of EB Welding of Spent
NucTear Fuel Canisters - Phase I
; mderson
2. Fusibility Study of Electron Beam Welding
i Spent Nuclear Fuel Canisters -
hases II and III
A Sanderson, T F Szluha and J L Turner
3. Appendix: Residual Stress Measurements in
an EB Welded Copper Disc
R H Leggatt
v
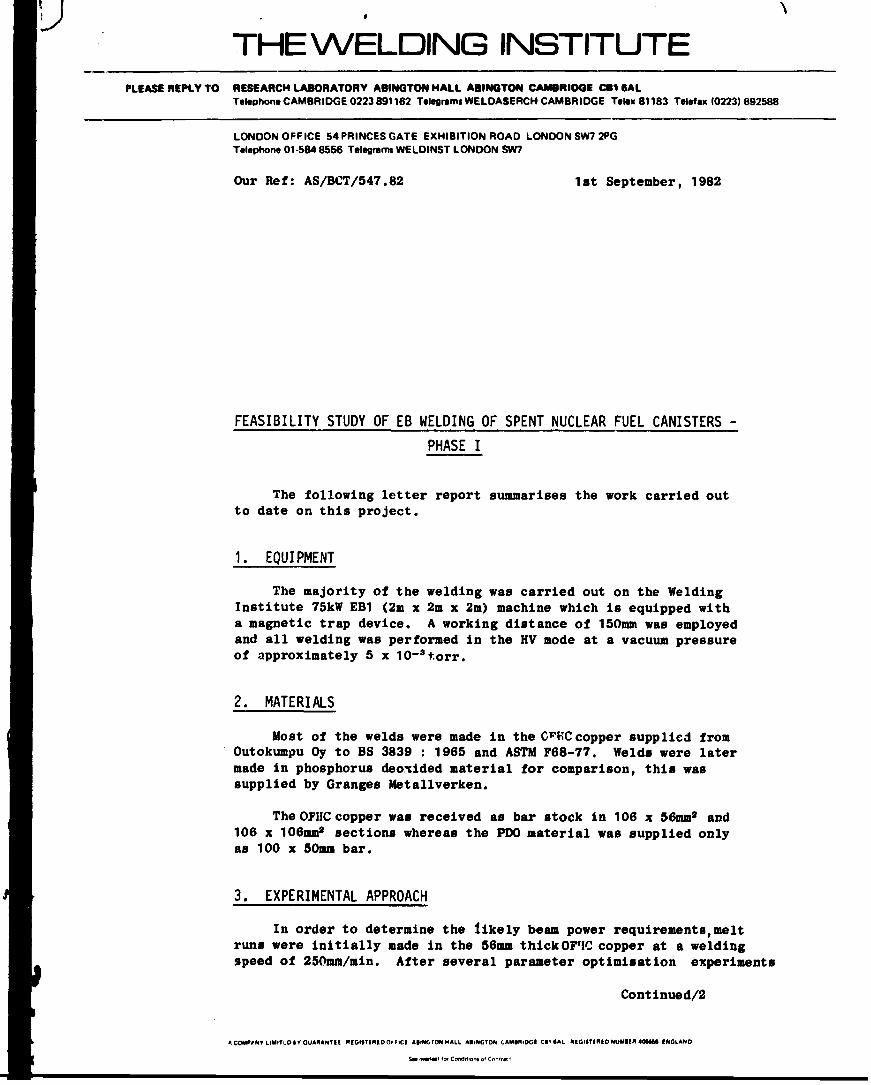
SUMMARY
A thick walled copper container is presently the primeSwedish alternative for encapsulation of spent nuclearfuel. In order to demonstrate the feasibility ofencapsulating high-level nuclear waste in copper con-tainers, a study of electron beam welding of thickcopper has been performed. Two copper qualities havebeen investigated, oxygen free high conductivity (OFHC)copper and phosphorous desoxydized high conductivitycopper (PDO). The findings in this study are summarizedbelow.
In 100 mm thick copper penetration can be achieved atpower level of about 75 kW (typically 150 kV x 500 mA)at welding speed of 100 mm/min. The welds in OFHCcopper made under these conditions are free from majordefects during constant welding conditions. The weldsin PDO copper show a microporosity level considerablyhigher than those in OFHC copper, but no major defectsare produced in the welds in PDO copper.
In the ending of the weld (ie the fade out) it is stillnot possible to completely eliminate root and cold-shutdefects.
A semi-full-scale lid weld has been performed success-fully.
Automatic ultrasonic C-scan has been shown to be usefulin detecting and displaying defects, but some problemsstill remain with defect sizing. The differentspecimens of OFHS copper had different attenuation ofthe ultrasonic signal, forged copper showing a farlower attenuation than hot extruded copper, indicatingthat attention must be paid in choosing copper thatallows accurate ultrasonic testing.
Residual stresses in the welded zone has been measuredand are found to lie in the range -32N/mm2 to +36N/mm2.The peak stress was less than half the assumed value ofthe proof stress of the fused metal.
vTHE WELDING INSTITUTE
PLEASE REPLY TO RESEARCH LABORATORY ABINGTON HALL ABINGTON CAMBRIDGE CB1 6ALTelephone CAMBRIDGE 0223 891162 Telegrams WELDASERCH CAMBRIDGE Telex 81183 Telefax (0223) 892588
LONDON OFFICE 54 PRINCES GATE EXHIBITION ROAD LONDON SW7 2PGTelephone 01-584 8556 Telegrams WELDINST LONDON SW7
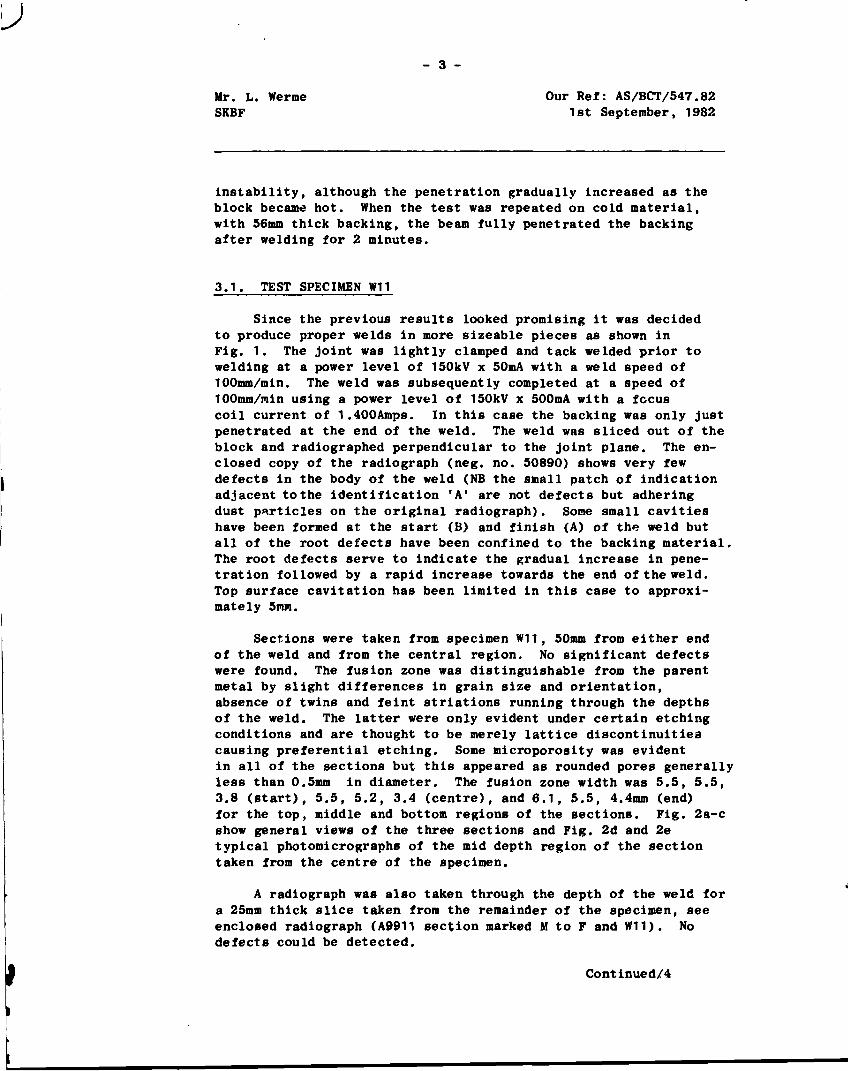
Our Ref: AS/BCT/547.82 1st September, 1982
FEASIBILITY STUDY OF EB WELDING OF SPENT NUCLEAR FUEL CANISTERS -
PHASE I
The following letter report summarises the work carried outto date on this project.
1. EQUIPMENT
The majority of the welding was carried out on the WeldingInstitute 75kW EB1 (2m x 2m x 2m) machine which is equipped witha magnetic trap device. A working distance of 150mm was employedand all welding was performed in the HV mode at a vacuum pressureof approximately 5 x 10⁻³fcorr.
2. MATERIALS
Most of the welds were made in the C K C copper supplied fromOutokumpu Oy to BS 3839 : 1965 and ASTM F68-77. Welds were latermade in phosphorus deotided material for comparison, this wassupplied by Granges Metallverken.
The OFHC copper was received as bar stock in 106 x 56mm2 and106 x 106mm3 sections whereas the PDO material was supplied onlyas 100 x 50mm bar.
3. EXPERIMENTAL APPROACH
In order to determine the likely beam power requirements,meltruns were Initially made in the 56mm thickOF'IC copper at a weldingspeed of 250mm/min. After several parameter optimisation experiments
Continued/2
»C« l««VL I *HT i .O« r GUARANTEE REOIfTEREDOMICE AIIMCroN HALL AIINGTON CAMBRIDGE C11 »AL REGIITIREDNUMURMMM ENGLAND
SMmwKt' ft* Cortdrfionio'ConfricT

v- 2 -
Mr. L. Werme,SKBF
Our Ref: AS/BCT/547.821st September, 1982
it was established that a power level of at least 150kV x 240mAwas required to just penetrate this thickness, but to produce amelted zone of any appreciable width a power of 150kV x 350mAwas necessary. Some experiments were also made at this stageusing transverse square-wave oscillation in an attempt to preventundercutting on the top bead but no significant progress was made.A typical section taken of one of these melt runs indicated soundweld metal but a slightly tapered fusion zone.
Melt runs were subsequently made in the OFHC materialthrough the 106mm thickness. Specimen size was initially106 x 56 x 330mm. After optimising focus coil current, penetra-tion was just achieved with a power level of 150kV x 500mA ata speed of 250mm/min. A metallographic section indicated afairly parallel fusion zone with a mid-section width of approxi-mately 5mm.
The body of the weld was free from significant defects butroot porosity extended for some 20mm into the thickness of thematerial. This illustrated that in order to achieve greaterpenetration depth, combined with a more parallel fusion zone,whilst avoiding root defects, lower welding speeds would benecessary combined with backing material.
Some melt run trials were carried out on the Welding InstituteEB2 installation which embodies a double focussing lens systemenabling better control of beam profile. The results were quitepromising but unfortunately traverse problems made it necessaryto curtail the work.
When work was continued on the EB1 machine attempts weremade to increase penetration by the use of longitudinal oscilla-tion at a frequency of 2KHz. Oscillation amplitudes of between2 and 7.5mm were tried. No significant increase in penetrationwas noted. It was therefore decided to explore the possibilityof welding at lower speeds. Normally for high conductivity materialssuch as copper,fairly high welding speeds are usually used so thatthe bulk heat flow does not exceed the weld-pool motion, otherwisepreheating of the material occurs which can result in thermalrunaway. Under these conditions the weld width and penetrationdepth can gradually increase to the point where the weld-poolbecomes unstable. However, for 'backed' material, where thethickness of the backing can be very large as in the case of thecopper canisters, it was thought this problem might not arise.Trials were therefore carried out at welding speeds of 50mm/ainand 100mo/fflin. Remarkably the first melt runs made on 106 x 56 x330mm3 blocks did not show any great tendency for weld-pool
Continued/3
- 3 -
Mr. L. Werme Our Ref: AS/BCT/547.82SKBF 1st September, 1982
instability, although the penetration gradually increased as theblock became hot. When the test was repeated on cold material,with 56mm thick backing, the beam fully penetrated the backingafter welding for 2 minutes.
3.1. TEST SPECIMEN W11
Since the previous results looked promising it was decidedto produce proper welds in more sizeable pieces as shown inFig. 1. The joint was lightly clamped and tack welded prior towelding at a power level of 150kV x 50mA with a weld speed of100mm/min. The weld was subsequently completed at a speed of100mm/nin using a power level of 150kV x 500mA with a fccuscoil current of 1.400Amps. In this case the backing was only justpenetrated at the end of the weld. The weld was sliced out of theblock and radiographed perpendicular to the joint plane. The en-closed copy of the radiograph (neg. no. 50890) shows very fewdefects in the body of the weld (NB the small patch of indicationadjacent tothe identification 'A* are not defects but adheringdust particles on the original radiograph). Some small cavitieshave been formed at the start (B) and finish (A) of the weld butall of the root defects have been confined to the backing material.The root defects serve to indicate the gradual increase in pene-tration followed by a rapid increase towards the end of the weld.Top surface cavitation has been limited in this case to approxi-mately 5mm.
Sections were taken from specimen W11, 50mm from either endof the weld and from the central region. No significant defectswere found. The fusion zone was distinguishable from the parentmetal by slight differences in grain size and orientation,absence of twins and feint striations running through the depthsof the weld. The latter were only evident under certain etchingconditions and are thought to be merely lattice discontinuitiescausing preferential etching. Some microporosity was evidentin all of the sections but this appeared as rounded pores generallyless than 0.5mm in diameter. The fusion zone width was 5.5, 5.5,3.8 (start), 5.5, 5.2, 3.4 (centre), and 6.1, 5.5, 4.4mm (end)for the top, middle and bottom regions of the sections. Fig. 2a-cshow general views of the three sections and Fig. 2d and 2etypical photomicrographs of the mid depth region of the sectiontaken from the centre of the specimen.
A radiograph was also taken through the depth of the weld fora 25mm thick slice taken from the remainder of the specimen, seeenclosed radiograph (A9911 section marked M to F and W11). Nodefects could be detected.
Continued/4

- 4 -
Mr. L. Werme, Our Ref: AS/BCT/547.82SKBF 1st September, 1982
3.2. TEST SPECIMEN W12
When the weld was repeated at 50mm/min (specimen W12) in theOFHC copper although penetration increased, so did the defect levelsee copy of radiograph (neg. no. 50892). Also top surface cavita-tion extended to 10-20mm. It was therefore concluded that forthis size of specimen, at least,a welding speed of 50mm/min wastoo low.
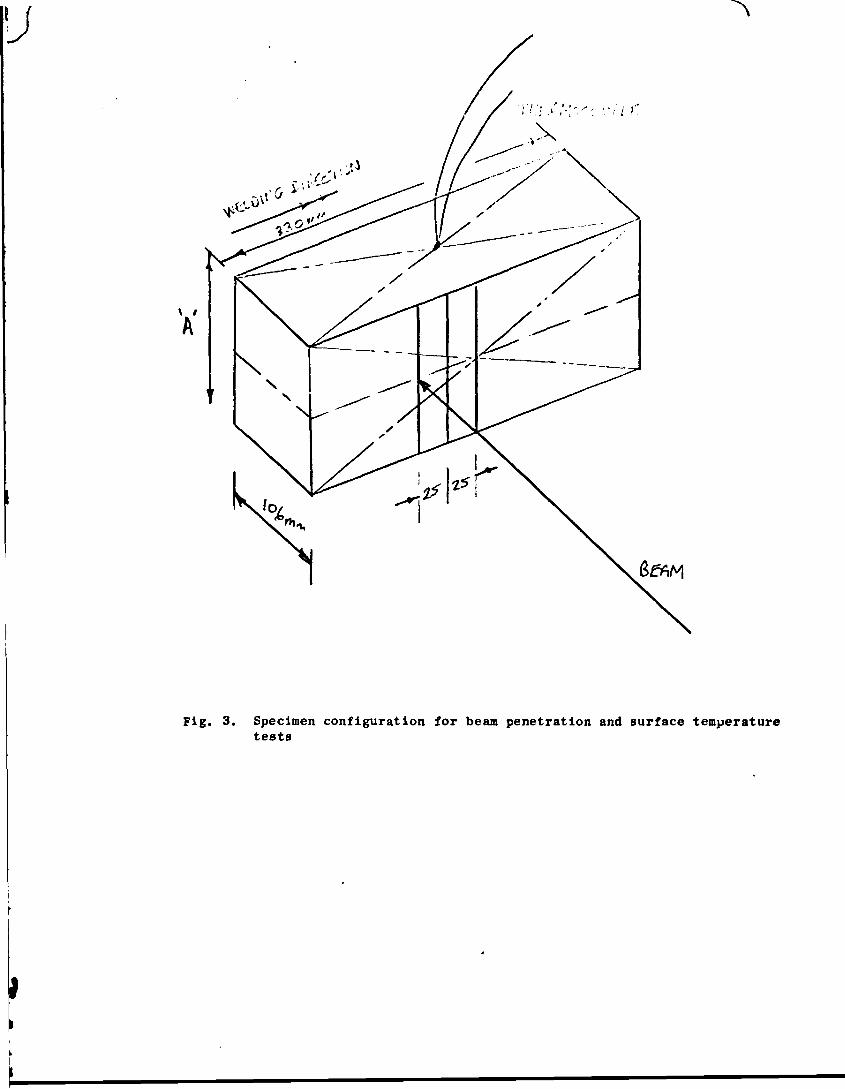
Specimen W11 was considered to be our best result to date,but because of the heat build up effect, we began to wonderwhether or not we were getting a true indication of penetration.It became obvious that we must carry out some thermocouple teststo deduce what size of specimen,and after what duration of weldingtime,the penetration depth could be assumed to be realistic.
Thermocouples were attached to the surface of the copper blockas shown in Fig. 3. Welding was commenced 50mm from the centre ofthe block. This was done to simulate better the situation incircumferential welding where the heat sink always extends behindand before the weld pool. In addition a beam slope up time of15 seconds was selected giving an expected full current condition25mm after initiation. In practice for 106 x 106mm section mat-erial, penetration was achieved after 22 seconds and the temper-ature rise recorded was 110°C. In comparison, when the blockdimension 'A' was increased to 212mm, 106mm penetration was achievedin 18.5 seconds (note slightly reduced time may have resulted fromthe fact that in this case a joint was being made, whereas theprevious 106 x 106mm specimen test was strictly a melt run). On theother hand, for the large block the temperature rise was onlysome 5°C. It was therefore concluded that at a power of 150kV x500mA and a welding speed of 100mm/min, 106mm penetration couldbe achieved irrespective of block size.
3.3. PHOSPHORUS DEOXIDISED MATERIAL; SPECIMEN W20
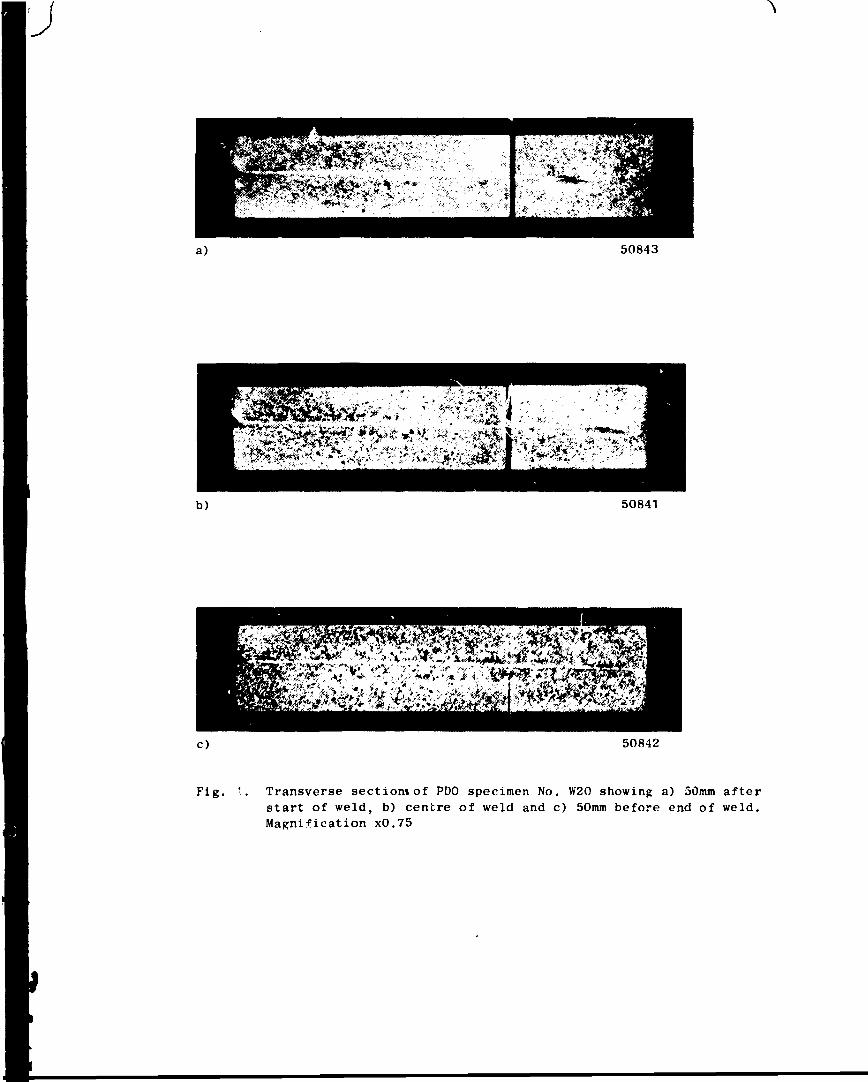
Multiple welds were made between slabs of 50 x 100mm2 PDOmaterial to build up a test specimen of comparable size to that ofspecimen W11. Finally weld (W20) was made using identical weldingconditions. The radiograph taken perpendicular to the welding plane(see enclosed neg. no. 50891) showed a fine dispersion of micro-porosity but no major defects in the body of the weld (NB 'A* int!-.-.3 case depicts start of weld). This was also confirmed bymicrosections, see Fig. 4a-d. The microsections show a much higherlevel of microporosity than the OFHC material but the largest poreseen in the three sections taken (start, middle and finish of weld)
Continued/5
v- 5 -
Hr. L. WermeSKBF
Our Ref: AS/BCr/547.821st September, 1982
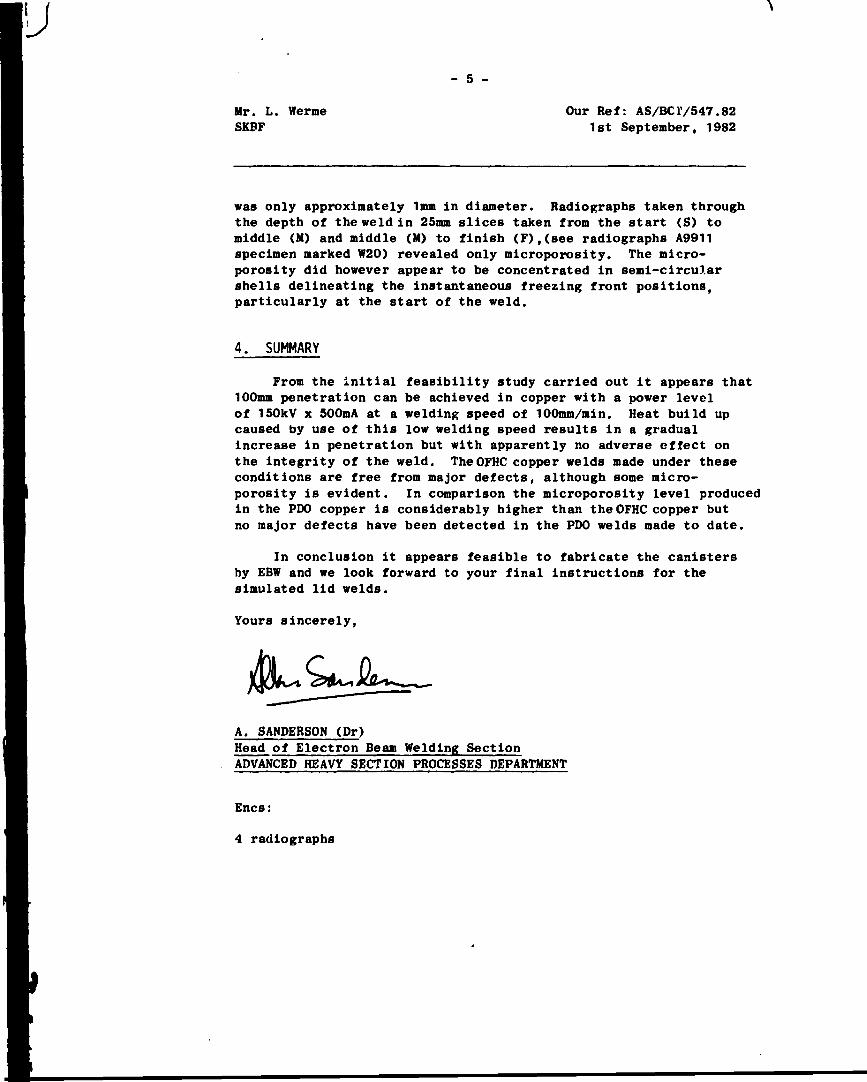
was only approximately 1mm in diameter. Radiographs taken throughthe depth of the weld in 25mm slices taken from the start (S) tomiddle (M) and middle (M) to finish (F),(see radiographs A9911specimen marked W20) revealed only microporosity. The micro-porosity did however appear to be concentrated in semi-circularshells delineating the instantaneous freezing front positions,particularly at the start of the weld.
4. SUMMARY
From the initial feasibility study carried out it appears that100mm penetration can be achieved in copper with a power levelof 150kV x 500mA at a welding speed of 100mm/min. Heat build upcaused by use of this low welding speed results in a gradualincrease in penetration but with apparently no adverse effect onthe integrity of the weld. TheOFHC copper welds made under theseconditions are free from major defects, although some micro-porosity is evident. In comparison the microporosity level producedin the PDO copper is considerably higher than the OFHC copper butno major defects have been detected in the PDO welds made to date.
In conclusion it appears feasible to fabricate the canistersby EBW and we look forward to your final instructions for thesimulated lid welds.
Yours sincerely,
A. SANDERSON (Dr)Head of Electron Beam Welding SectionADVANCED HEAVY SECTION PROCESSES DEPARTMENT
Encs:
4 radiographs

Fig. 1. Specimen configuration for W1I, W12

5084ti
50845
Transverse sections of OFHC specimen No. W11 showing a) 50mm afterstart of weld b) centre of weld and c) 50mm before end of weld.

J
'V
d) OS 2616
• y
<* -^
e) OS 2615
Fig. 2 Continued. Photomicrographs showing structure detail in centralregion of OFHC specimen W11M d) x5 and e) x12
- , - I • . ' ' • , , . • • 1 -
' • , ; > i - , / :' '. ! i } .
Fig. 3. Specimen configuration for beam penetration and surface temperaturetests
v
50843
50841
c) 50842
Fig. '. Transverse section*of PDO specimen No. W20 showing a) 50mm afterstart of weld, b) centre of weld and c) 50mm before end of weld.Magnification x0.75

OS 2617
e) OS 2614
Fig. 4. Continued. Photomicrographs showing a structure detail in centralregion of PDO specimen W20M d) x5 and e) x 12

LD 22821/22965
FEASIBILITY STUDY OF ELECTRON BEAM WELDING OF SPENT NUCLEAR FUELCANISTERS - PHASES II AND III
By: A. Sanderson, T.F. Szluha and J.L. Turner
1. GENERAL INTRODUCTION
In the work reported earlier (see letter report 1st September, 1982,Our Ref: AS/BCT/547.82) an account was given of the development of weld-ing conditions for 100mm thick OFHC and PDO copper in the form of barstock. In the work reported here an attempt was made to establishsuitable weld overlap and beam fade out conditions for the envisagedcircumferential lid joints. For relatively thin components, that iswith a wall thickness of up to some 50mm, sound EB welds can often beachieved by merely gradually decaying the beam current after the weldoverlap has taken place. When thicknesses of the order of 100mm areinvolved, it has been found necessary not only to decay the bean currentbut also to slope-up the beam focus position. Much of the work reportedhere has been concerned with optimising the combined beam current andfocus parameters. X-radiography perpendicular to the welding planehave been used as the primary means of assessing the merit of eachapproach tried, but since ultrasonics provides the only viable NDTtechnique which can be used on the canisters in practice, a goodselection of the samples produced have been inspected by both means.
As far as can be ascertained, little or no work has been carried out onthe ultrasonic inspection of EB welds in thick section copper using anyof the accepted NDT techniques, so the investigation performed herebreaks new ground in establishing methods and procedures for an unusualwelding situation.
2. ELECTRON BEAM WELDING EQUIPMENT
All the work was carried out in The Welding Institute's 75k'.V EB1(2m x 2m x 2m) machine equipped with a magnetic trap device. A workingdistance of 150mm was employed and all the welding was performed in theHV mode at a vacuum pressure of approximately 5 x 10~3 torr. A nominalaccelerating voltage of 150kV was used throughout, but recent carefulcalibration of EHT has repealed that the actual voltage used for allthis work and Phase I was 143kV.
3. MATERIALS
Linear welding trials were performed entirely on 50 and 100mm OFHCcopper bar stock supplied from Outokumpu Oy to BS 3839:1965 and ASTM

F63-77. The £OOmm diameter simulated lid OFHC copper components werealso supplied by Outokumpu Oy and machined by Rauma Repola Oy.
4. DEVELOPMENT OF FADE-OUT CONDITIONS
The standard copper block assembly used for the weld overlap and beamfade-out trials is shown in Fig. 1. A thermocouple was inserted in thecentre of the upper block top face. The general welding procedureadopted was as follows:-
i. joint tack welded at a current of 50 to 75mA;ii. blocks welded with beam current of 500mA (72kW);iii. blocks allowed to cool in vacuum chamber until temperature attained
approximately 350°C;iv. Second pass commenced 50mm from end of block; beam parameters
varied according to Fig. 2.
A UV recorder was used to monitor beam current and focus coil sloperates. This data was also checked and supplemented by manually notingthe beam current and focus meter readings at set time intervals. Weldswere subsequently sliced out and radiographed transverse to the jointplane.
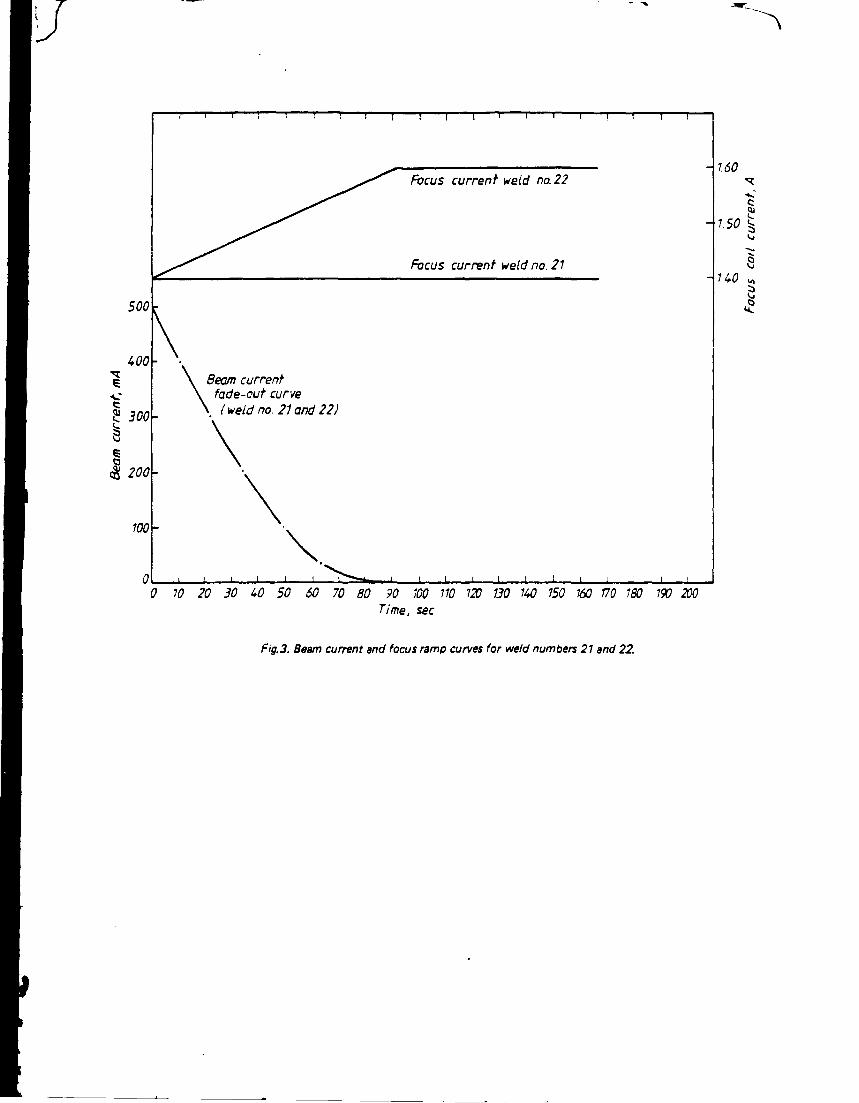
Table I summarises the tests and results achieved using this approach.To commence, the beam current was decayed from 500nA to zero in 90 secondswith a fairly linear slope whilst maintaining a constant focus coilcurrent of 1.400, see Table I run number 21 and Fig. 3. This gave riseto a steeply rising almost continuous train of root defects accompaniedby medium sized rounded pores, Fig. 4. Also the weld top bead showed abadly undercut profile, the maximum depth of undercutting was some1 3mm.
In an attempt to reduce the defect level, the beam focus was ramped upfrom 1.40 to 1.60A in sympathy with the decaying beam current, weldNo. 22 Fig. 5. This would have the effect of drawing the focus closerto the top plate surface as the depth of penetration of the beam wasreduced. In this case the focus ramp was linear (slope shape curve 5).The result of this exercise can be seen in Fig. 5. The defect and theundercut level were somewhat reduced and the root defects were lessprominent although the chain was still almost continuous. For weldruns 21 and 22 the backing material was left on, but in subsequentruns the backing was removed to simplify cutting and radiography.
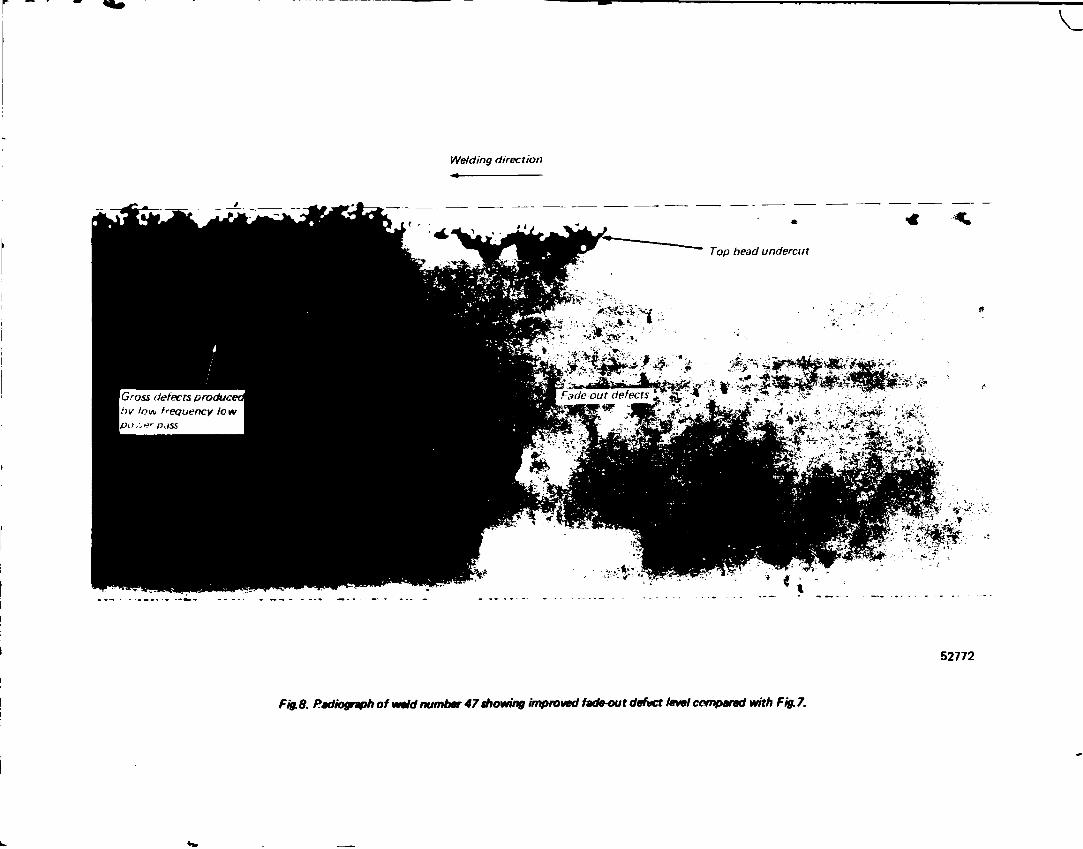
In the remaining tests of this series, the beam current fade out timewas increased to 200 seconds. For weld numbers 46 and 47 the linearbeam focus slope shape (curve 5) was retained but the focus rampinitiation was delayed, Fig. 6. The weld undercut was large in bothcases Fig. 7 and 8, also the defects were larger and appeared in agreater quantity. An attempt was made to reduce the undercut on weldnumber 47 by using a defocussed 'cosmetic pass'. A beam current ofbetween 50-80mA was tried on the first 200mm length with a 20Hzcircular oscillation amplitude of 3mm. The beam was ?lso defocussed

by setting a coil current of 1.40A. This unfortunately did not appearto be beneficial and in fact probably resulted in increased undercut.For the last 110mm of weld the oscillation amplitude was increased to9mm. On the surface, this appeared to fill the undercut but radio-graphs indicated the generation of a large area of defects, Fig. 8.
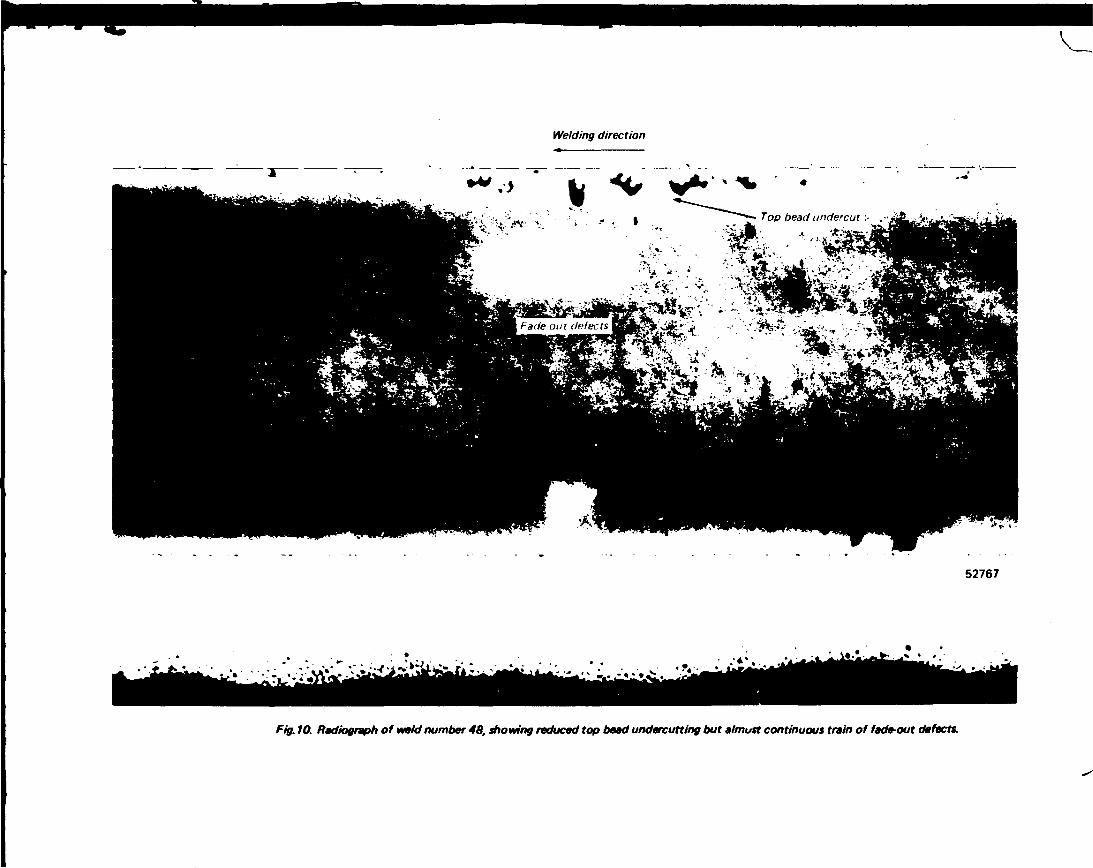
Weld number 48 was made with identi al conditions to number 47 exceptthe focus slope shape was modified to a convex form (slope shape 9),Fig. 9. This approach appeared to improve the depth of weld undercutbut the train of root defects was still quite prominent, Fig. 10.
At this stage it was suggested that beam current ripple, which is knownto amount to some 8% (peak to peak) from the supply used for the workcould be partly responsible for root defect formation. The theory wasthat fluctuations in beam current could cause a stitching action andadverse metal flow conditions in the weld cavity. To test this analternative EHT supply which has a ripple level of approximately 2%was tried and weld number 49 made with nominally identical conditionsto number 48. This showed no significant improvement, Fig. 11 cfFig. 10.
For weld numbers 52 and 53 the beam focus fade-out time delay (T4),after the initiation of beam current decay was altered, see Table I,and Fig. 9.
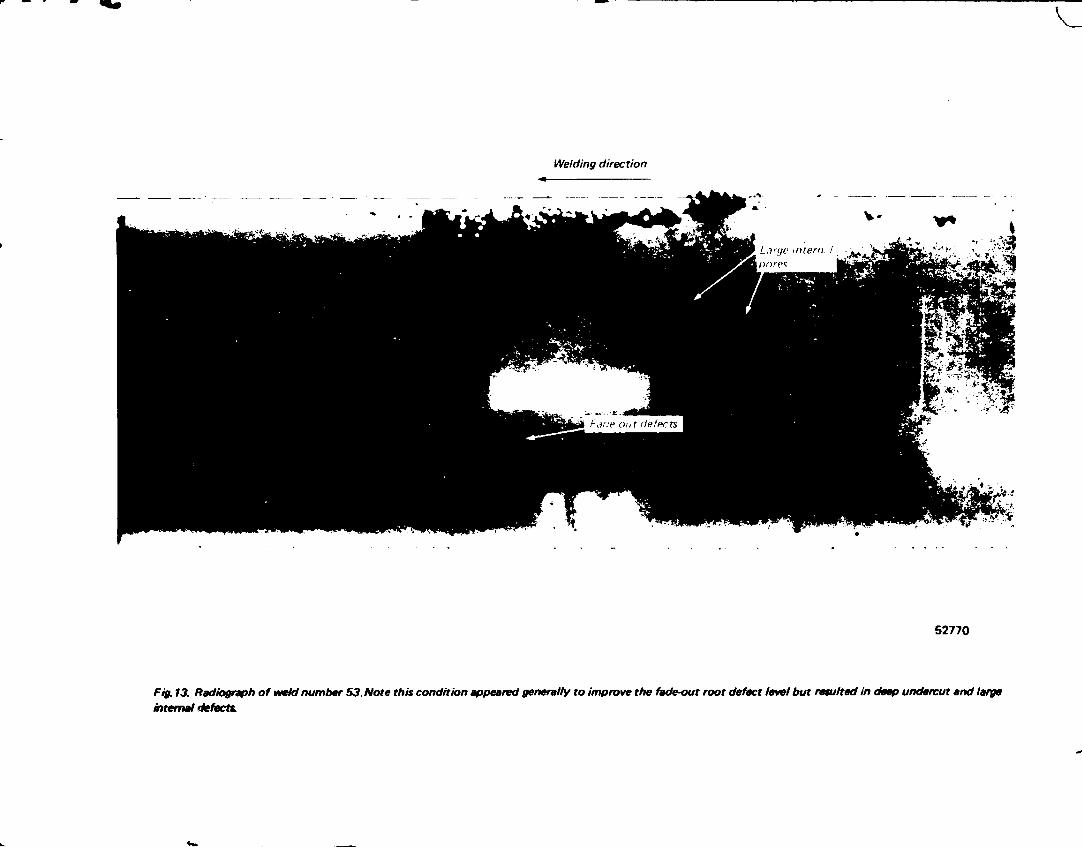
With a time delay of 40 seconds (weld number 52) the weld root defectswere not as continuous. However, when this time was reduced to 20seconds, although the root defects were almost eliminated, large roundedpores occurred just prior to loss of penetration through the 100mm thickplate and the top surface undercut reached a maximum of some 24mm.All of the tests listed in Table I were made with no beam oscillationexcept for run numbers W46 and W47 in which a Y amplitude of 0.5mmwas applied at 140Hz.
4.1. Control of Root Defects
In parallel with the standard test block programme described above asecond programme of development was run. In this the penetrationdepth was generally limited to less than 100mm by holding the beamcurrent constant, so that the effect of various beam control parameterscould be studied. Without special techniques the top of the penetrationfinger tends to be very narrow and pointed. Particularly in highconductivity materials such as copper the liquid metal freezesprematurely. There is insufficient time for the keyhole to be completelyfilled with liquid metal as the beam progresses along the joint line.The results are as seen for example in Figs. 4 and 5, i.e. a train of'cold shut* defects and associated pores.
In principle it ought to be possible to prolong the time for which themetal remains molten to facilitate filling. To this end various tech-niques were explored.

4.1.1. Castellated Y Oscillation Pattern
4.1.1.1. Effect of Y Oscillation Amplitude and Focus Position
In the first series, a castellated Y (across the joint line) beanoscillation pattern was tried. This effectively splits the beam intothree beams. Oscillation amplitude and focus position were varied asshown in Table II. The root defects as indicated by transverse radio-graphs were rated in severity using an arbitrary scale of 0 to 10 wherea value of 0 would represent a continuous train of large pores extend-ing fully depth of the penetration finger. A value of 5 indicates analmost continuous train of prominent defects some 20mm deep and avalue of 10 represents complete freedom from defects. To commence abeam current of 300mA was applied (specimen number 23A-C) this gaverise to intermittent full penetration of the 100mm thick block makingdefect assessment difficult. Therefore, in subsequent runs the currentwas reduced to 200mA which generally gave a penetration depth of some70mm.
From Table III, it can be seen that in this case increasing oscillationamplitude has a deleterious effect particularly at focus coil currentlevels of 1.46 and 1.48A, but at 1.50A this effect is less significant.Also the results indicate a general trend of improvement as the focuscoil current was increased. A focus coil current of 1.50A correspondsto a beam focused approximately 50mm below the top surface. Remarkablyrun 24A was apparently almost completely free of defects, but a sectiontaken of this weld indicated a root defect extending for a depth ofsome 7mm albeit with a width of less than 0.3mm. Once again thissection indicated the need to increase the width and roundness of thetip of the penetration finger, Fig. 14. On the other hand, althoughmicrosections of run numbers 23E and 25E showed some general increasein fusion zone width, the penetration tip width was still too narrowand sharp.
4.1.1.2. Effect of Frequency
In this test series freqencies of 14, 140, 1400 and 2800Hz were usedat Y amplitudes of 4mm and 2mm, Table III. Generally the defectswere more evident in run number 26 made with the higher oscillationamplitude. Also at the lowest frequency tried, i.e. 14Hz,very largeclusters of defects were produced when the amplitude was 4mm. Thebest results were produced at a frequency of 140Hz and for the higheramplitude the defects were significantly shorter although of greaterwidth. Sections taken through runs 26B and particularly 27A showedthree distinct penetration fingers extending over a depth of some15mm in the latter case. Evidently there was insufficiest residualpower in the 'three' beam cores to cause merging of the separatefusion zones, Fig, 16. In the former case (26B) the penetrationfinger tip shape was broader, Fig. 15, but there was a localisedregion of cold shuts and pores.
In a subsequent test (run 28) the Y-oscillation amplitude and frequencywere fixed at 4mm and 140Hz respectively and focus levels of 1.4, 1.45,

1.50, and 1.55 amps were applied. All welds showed good bead profilebut the defect level varied as shown in Table IV.
4.1.2. Triangular Y Oscillation Pattern
In this test series the Y oscillation amplitude was fixed at 2mm and fourdifferent frequency levels were tried, Table V. The overall effect wasto produce very fine, but deep defects. The best results wereachieved at a frequency of 70H2.
4.1.3. X-Y Raster
In a further attempt to broaden the fusion zone, X and Y oscillationswere combined to produce a 'block heat source* or raster, Table VI.For a 2 x 2mm3 raster the defect level was low but as raster X lengthwas increased, very deep defects appeared. When the raster size wasextended to 5 x 2mm2 the weldpool became unstable giving rise to 3-4mmfull penetration depth cavities separated approximately by only acavity width.
4.1.4. Figure of Eight Pattern
4.1.4.1. Effect of Amplitude
A figure of eight lissajous pattern was applied with the long axiscoincident with the jointline, Table VII. Once again, gradually increas-ing oscillation amplitude was seen to progressively increase the severityof the defects.
4.1.5. Very High Frequency Deflection
Recently a special purpose 236kHz concentric circle pa+tern generatorhas been produced for weldbead and spatter control. It was thoughtthat this might possibly provide a more diffuse spread of the heatsource. The parameters used are given in Table VIII.
Because of the need to fit additional deflection coils it was necessaryto increase the working distance. A focus coil current of 1.34A wasthen used to provide comparable focus conditions to previous tests.Although this approach was only briefly explored, no major improvementswere noted.
4.1.6. Increased Welding Speed
In these trials the welding speed was increased in steps as an altern-ative means of reducing penetration after the weld overlap. A focuscoil current of 1.4A was adopted, Table IX. The penetration depth at500mA was approximately 100, 90, 70 and 60mm at 1000, 750, 500 and

250nm/min speeds respectively. The defects in this case were quitesevere, consisting of virtually continuous trains of large pore clusters.
Later the concept of increasing welding speed combined with decayingbeam current was studied. This, however, showed no particular promise;in the region where the speed was at 250mm/min for a beam current rangeof 156 to 67mA, an almost continuous train of defects were detectedbetween a depth of 50mm and 10mm.
4.2. Discussion
A fairly wide range of oscillation patterns and amplitudes has beenexplored. It is evident from the results that magnetic deflection ofthe beam influences the way in which the weld metal flows and solidi-fies in the region of the penetration tip. Large deflection amplitudeshowever, generally have a deleterious effect, resulting in weldpoolinstability and gross cavity formation. No particular benefit appearedto accure from the use of high or low frequency oscillation and generallythe best results were obtained for frequencies of approximately 140Hz,with simple Y oscillation patterns. Some benefit has been seen withcertain deflection patterns but a pattern has yet to be establishedwhich produces a rounded penetration finger with no cold shut defects.On the other hand, the combination of patterns tried in this work canbe, by no means,considered exhaustive.
Regarding the use of increasing welding speed to effect fade-out, thisappeared to aggravate the root defect problem even when combined withnormal beam current fade-out. In contrast focus position apparentlyhas a fairly large effect on defect formation and providing the beamcurrent fade-out rate is relatively slow the defect occurrence can beminimised if not eliminated.
In view of these difficulties it was decided that beam oscillationtechnique had not shown sufficient improvement to use them on thefirst simulated lid weld, so the beam and focus fade-out conditionssimilar to run number 52 Table I were adopted.
5. ELECTRON BEAM WELDING OF SIMULATED LID WELD
The configuration of the simulated lid weld is shown in Fig. 17. Sinceit was convenient to use 100mm copper plate the lid comprised a discand a ring. The disc represented the neck of the lid and provided thebacking material. For ease of welding the component was inverted androtated around a vertical a: is. A surface welding speed of 120mm/minwas selected so that the speed at depths of 50 and 100mm was 100 and80mm/min respectively. The joint interfaces of the components werecleaned with a fine emery wheel and degreased immediately prior towelding. The assembly was placed on a 58mm thick steel base plate anda 20mm diameter steel stud with a 28mm thick steel top plate were usedto clamp the components together. Thermocouples were embedded in thesurface of the copper ring which simulated the canister wall, Fig. 17b.

The full welding parameters are given in Table X. Before commencing themain weld the joint was tack welded at 75mA. The first tack weld wasmade 60mm long followed by a 120mm long tack placed diametrically oppositeThe third tack weld, 120mm long, was placed at 90° to the start of thefirst two tack welds followed by a continuous full revolution tack starteddiametrically opposite the third tack. This approach was adopted toavoid any possibility of the joint gap opening up.
A complete video recording of the welding was made, and a continuousrecord of temperature changes. Welding progressed satisfactorily forthe first 695 seconds. At this point the power supply inexplicablyshut down. The component was reversed for approximately 30mm and thebeam 're-faded-in' after a total delay of 2mins. After a further20 seconds of welding a second supply 'shut down' occurred some 10mmafter overlapping the first. The weld was re-initiated from this pointafter a subsequent delay of 2mins and successfully completed; no furtherattempt was made to repair the damage caused by supply 'shut down'. Fig.17b indicates the orientation of the various events.
Figure 18 shows a general view of the welded lid. As with trial weldsthere was a tendency for the weld metal to pour out. The average weldundercut was 3 to 4mm.
Figure 19 shows the temperature data produced during welding. To alignthe unfocused 1.400A beam with the joint it was necessary to useapproximately 40mA. This caused a small initial temperature rise.Tack welding produced a family of 4 peaks on the thermocouple plotsraising the peak temperature to 90°C. During the main weld the maximumtemperature attained was 525°C, but after 10 minutes equalisation ofheat by conduction had dropped the average temperature to less than 400°C.This is in good agreement with the theoretical prediction. The resultof the power supply 'shut down' difficulties can be seen as a doubleinflexion and delay in peaking, of the thermocouple no. 4. Afterremoval from the traverse the lid components were allowed to coolnaturally in air. Residual stress measurements were carried out byDr. R.H. Leggatt (see letter RHL/CFH/0665.83 (LD 22967)and subsequentreport).
The weld beads were then removed by machining and it was found necessaryto reduce the radius by 5.8mm to clean-up the entire periphery (apartfrom that caused by the fade-out region and 'shut down' defects). Afterultrasonic tests see section 6, and further residual stress measurementsthe component was then cut into four quadrants as indicated in Fig. 17b.The cutting axes were rotated approximately 13° with respect to thestart to ensure the entire fade-out region was contained in one quadrantOne face of quadrant BOC was polished and etched and then returned toSKBF for further ultrasonic tests. Quadrant AOD was retained in tactfor further residual stress measurements and the welds in quadrant ACBand DOC were cut out longitudinally in 27mm slices for X-ray examination.Transverse metallographic sections were taken later as described insection 8.

6. ULTRASONIC INSPECTION
6.1. Introduction
There were three main considerations in applying ultrasonic techniquesto the 100mm thick lid weld,viz:-
a) Acoustic Attenuation
The attenuation of the ultrasonic waves in copper is much higherthan that of steel (for example), and has varied widely fromspecimen to specimen in this project. This has caused correspond-ingly large variations in the sensitivity of the ultrasonicprobes to defects located within the specimens. In addition,if the attenuation is too high then a visible reduction in themean frequency of the returning pulse occurs (particularly for thehigher frequency probes used) which must be taken into account inselecting the flaw detector bandwidth setting.
b) Choice of Equipment and technique
The high ultrasonic attenuation exercises a considerable influenceon the choice of probe crystal diameter and frequency. It alsogoverns whether the ultrasonic inspection should be conducted withthe probe in contact with the specimen, or in an immersion tankwith a water path between the probe and specimen surface. Wherepossible, the latter technique was preferred, since it could beperformed on our automatic C-Scan facility. In addition, itreduces problems arising from coupling variations between probeand specimen which are difficult to ignore when performing amanual contact scan.
c) Defect Sizing
To assist defect sizing a solid copper test block of dimensions330 x 105 x 100mm was made with four 5mm deep flat bottomedholes of diameter 13, 8, 4 and 2mm drilled into one of the330 x 105mm2 faces. It transpired that the attenuation in thisblock was so high that it was only barely possible to detect the2mm hole with the largest immersion probe used (a Panametrics2.25mHz probe with a 38am diameter crystal). When probes withsuch large crystals are used, they produce beams which are con-siderably larger in diameter than the defects themselves, whichmakes sizing of the defects from the C-Scan plots extremelyinaccurate. This problem was not made any easier by the factthat the main defects apparent (i.e. those in the beam fade-outregion of the welded specimens), consisted of closely-spacedcollections of pores and cavities. This meant that several ofthese defects would appear within the area of the beam, therebymaking discrimination difficult.

6.2. Results
6.2.1. Welds in Copper Blocks - 100mm Thick
As related during the visit by SKBF representatives to The WeldingInstitute on 9th December, 1982, it was apparent that, on the basisof the specimens (W21 and W22) inspected up to that point, immersionscanning did not appear to provide the most promising prospect forsuccess. The majority of the ultrasonic scans had subsequently beenperformed manually with probes of crystal diameter 10-15mm and fre-quencies of 1.25, 2.5 and 4-MHz used in contact with the specimens. Inall cases, the weld zone was 100mm below the scanning surface. Higherfrequencies (e.g. 4MHz) offered greater resolution owing to reducedbeam divergence, but care had to be taken to ensure that sensitivitieswere not too low due to the high attenuation encountered.
Of the welded specimens produced thereafter, two (W46 and W47) wereinspected manually using a KB Aerotech (Gamma series) 19mm diameter,2.25MHz probe. After these had been sectioned and X-rayed, the sections(about 20mm thick) were placed in the immersion tank and the sameprobe used to produce C-Scans. The results obtained by the twotechniques showed a fair amount of agreement, with the fade-out defectsbeing clearly apparent in both cases.
On the whole, the X-radiographs showed all the fade-out defects detect-ed ultrasonically, but made the detailed structure and size of thedefects much more clearly apparent.
The fade-out defects nearly always registered as the strongest indic-ations in the case of both ultrasonic and X-ray techniques. However,some ultrasonic indications (albeit at a somewhat lower level) appearedoutside the fade-out region that were not apparent on the radiographs.
6.2.2. 600mm Diameter Simulated Lid Weld (Specimen W55)
The thickness of both the cap and ring were 100mm thick at the circum-ference, and the depth of the welded zone was 100mm.
At first it was decided to perform a contact scan from the undersideof the ring (Fig. 20) using the KB Aerotech 19mm diameter,2.25MHz probedriven by a Sonic Mark IV Flaw Detector. A rapid scan all round theannular surface of the ring showed that the majority of defects wereconcentrated between the fade-in' point and the end of the fade-outzone, that is in quadrant AOB of the ring (Fig. 17b). Hence it wasdecided to start detailed inspection on this portion of the ring.Fig. 21 shows the results of this, with the fade-out defects clearlyshown in a spiral band between the inner and outer diameter of the ring.
During the course of the inspection it was discovered that this part-icular copper specimen had a much lower acoustic attenuation than pre-vious testpieces. Consequently, it seemed that this specimen might bea good candidate for immersion testing.

The specimen was set up in the immersion tank to enable scanning tobe carried out with the same probe positionedsuch that there was a90mm water path between the transducer element and the surface of thecap (Fig. 22). Scanning through the cap meant that it might be possibleto view any defects arising from electron beam penetration beyond the weldzone into the parent material of the cap itself. The results of thisscan are shown in Fig. 23.
It will be noted that the location and extent of the fade-out defectsagrees closely with that apparent in Fig. 21, despite the fact thatscans were conducted from opposite sides.
The arrowed point on the C-Scan plot indicates that the area fromwhich the largest signal was observed. The darkest level of greyrepresents regions where signal amplitudes were no more than 6IB belowthe maximum signal. Similarly, the two following lighter shades ofgrey indicate successive 6d£ drops in intensity. Thus the C-Scandisplays an 18dB range of signal amplitudes.
Clearly shown on Fig. 23 are the fade-out defects (and on the otherside of the ring) a radial defect arising from shut down of the beam.Since the test cap consisted of an assembly of two components (Fig. 22)the interface between them obviously hampers the penetration of ultra-sound into the lower part of the cap. Therefore, it would be unreason-able to expect a representative scan of this particular region of thefusion zone. However it was found that if scan sensitivity was increas-ed by, say, 6dB (Fig. 24), then areas of. the region within the capbecame visible.
Despite the relatively poor resolution of the transducer used in theC-Scans presented here, it is still possible to obtain some estimateof the size of the major defects observed. Considering the parametersof the particular probe used, one can calculate the angular divergenceof the beam in a zone where the radiated intensity is within 6dB ofthe maximum value (which is presumed to be along the axis of the beam).This implies that the beam has a diameter of approximately 14mm inthe region of the weld. Since this is of the same order as the widthof the darkest band of grey observed in the fade-out zone, then it isreasonable to suppose that the dimension of the defects (along anaxis perpendicular to the band) must be a small fraction of the widthof the beam, i.e. of the order of 1-2mm or less. This is borne outby the X-radiograpbs obtained showing fade-out zone defects in theprevious specimens.
7. X-RAY EXAMINATION OF SIMULATED LID WELD (SPECIMEN W53)
Longitudinal slices were cut from the welded lid quadrants AOB and DOC.X-radiographs of these regions are shown in Fig. 25a and 26o reproducedat X0.7. The 'shut down' defects fig. 25a appear as two needlelikeholes, in one case penetrating the entire wall thickness to a total depthof nearly 160mm. Also associated with this region are a series of poreclusters which could possibly have been caused by 're-fading-in' thebeam and excessive local heat input as a result of the over-lapping weld.Fewer defects occur away from this region. In the fade-out region,
10

vFig. 25b, a string of defects was detected, marking the position ofthe root of the gradually reducing penetration depth. However, the number• nd severity of defects was at least as good as in the linear develop-ment trials (see fig. "1, W52). Just prior to loss of penetration ofthe lOOnm section a group of more randomly dispersed defects occurred.Fig. 25b also allows a comparison to be made of the penetration depthsduring the early stage of welding with that after one completerevolution. In the cold state a depth of some 135mm was achievedwhereas this increased to nearly 200mm in the hot overlap region.
8. METALLOGRAPHIC EXAMINATION
In order to further clarify the nature of the defects revealed byultrasonic and X-ray techniques, four transverse metallographic sectionswere taken as indicated in Fig. 26a and b. Three sections were takenof the fade-out region (specimen numbers 55A/1, 55A/2 and 55A/3) wheredefects were clearly visible on the radiographs and one section in anapparently sound region (specimen number W55B/i,Fig. 26b). Macro-graphs of these sections are shown in Figs. 26a to d. The largedefects in specimen 55A/1 were mainly as predicted but a string ofsmall pores extending from a depth of some 10mm were found runningalong the fusion zone boundary in the upper region of the weld,Fig. 26b. No significant defects were revealed in specimen 55A/3,Fig. 26c, apart from the expected root pcre shown in the radiograph.
The apparently sound weld in specimen 55B/1 was indeed found to becompletely free of defects, Fig. 26d. The position of the four sectionshave also been marked on the C-Scan image and the radiograph.
9. GENERAL DISCUSSION
Good progress has been made in the development of welding conditionsfor 100mm thick copper and it has been shown by linear weld test blocksand the first simulated lid weld that the defect level can be minimisedby the correct combination of the beam current and focus fade-out rates,curve shape and time relationship. However, in spite of substantialefforts to establish a beam oscillation technique to eliminate poro-sity, no major breakthrough can be reported. Oscillation frequencyand pattern affect porosity formation but the key to complet3 weld poolcontrol has not yet been found.
At one stage it was thought that the EHT power supply characteristicscould be affecting the defect problem but no significant differencewas found between welds made using supplies with 2% and 8% peak topeak beam current ripple. Similarly the use of increased welding speedto effect penetration fade out was disappointing.
Nevertheless the first simulated lid weld attempted (specimen number55), was at least as good as the previous trials except in the regionwhere power supply shut down occurred. Fade-out defects consisted ofa discontinuous series of discrete holes with a typical depth of lessthan 10mm.
11
Comparing X-radiograpns and microsections with the ultrasonic scans,it is apparent that the latter technique in its present form gave poorresolution and it was only possible to obtain a rough estimate ofdefect size by estimating the beam width. Another method (untried hereowing to lack of a satisfactory reference reflector in a jest pieceof similar properties to that of the specimen) is to size defectsaccording to the received signal amplitudes, the so-called DGS method.
However, neither of these metaods were well suited to the inspectionsituation discussed here, since the discrete defects were not widelyseparated, but were considerably closer together than the ultrasonicbeam widths involved. This meant that the defect indications over-lapped to create the impression of larger defect zones than wereactually present. This also meant that it was difficult to decidewhether the fade-out zone defects, for instance, were continuous, orclosely spaced and discrete.
In addition, the signal peaks apparent to one side of the shut-downdefects (Fig. 24) tend to blend into the fluctuating background signalobserved here, thereby making location and orientation of any defectindication difficult to discern. The range of sensitivity used inFig. 24, tends to create the alarming impression that there Are smalldefects throughout the entire fusion zone as evidenced by the backgroundsignal.
In reality, the microsection through the region indicated in Fig. 24contained no significant defects, whilst the microsections taken throughthe fade-out region and the X-radiographs revealed discrete non-contin-uous defects. The small defects observed in the vicinity of the shut-down defects, see Fig. 25a, appear to coincide with the signal peaksapparent to one side of the shut-down defects as displayed in Fig. 23.
Some discussion of the probable origin of the fluctuating backgroundsignal observed in Fig. 24 is now in order. This became even moreclearly in evidence when the sensitivity was increased by the maximumavailable amount of 1OdB above that in Fig. 23. A similar backgroundecho was observed in the welds of previous copper specimens, and as arule, did not appear to emanate from defects that were visible in theradiographs. One explanation is that the background echo could resultfrom changes in the orientation of grains in the weld zone, and varia-tions in their size relative to the grains in the surrounding material.Since the fluctuations in the background occur at a considerably lowerlevel (20dB or more) than those from the main defects, it does notin any case appear likely that defects in this region (if any) representanything of the same order of severity as those arising from fade-outand shut-down.
In addition, substantial differences have been noted in the attenuationof the ultrasonic signal for the simulated lid material and the barstock material. This factor could well have an important bearing onthe type of ultrasonic technique (i.e. contact or immersion) to beemployed for canister inspection in practice. The lid material used inthe present trials has been shown to be well suited to immersion
12

T
C-Scanning. Indeed it nay be necessary to closely specify the manu-facturing procedure of the canister (particularly the lid) in orderto facilitate ultrasonic inspection of the weld.
To further improve the resolution of the defects as seen on the C-Scan,ultrasonic transducers with narrower beams need to be used to accuratelyresolve and size the small defects present in the fade-out zone. Onewould require the beam in the region of the weld to have a diameter ofthe same order as the defect size (i.e. 1-2mm). However, the high attenu-ation of the copper and the depth of the weld zone below the surfaceimply that such a stringent requirement could not be met by usingnormal commercially available ultrasonic transducers. Nevertheless,preliminary studies undertaken in the NDT Research Section have shownthat beam widths can be reduced considerably over large ranges byacoustic focussing techniques.
There is no doubt that the beam fade-out region, as with other thickwall circumferential vessel EB welds, is the most critical part of thewelding procedure. The defect level commonly achieved may not be cons-idered tolerable since pores and cold shut defects in close proximitymight lead to premature corrosion of the vessel wall. On the other-hand it is likely with further refinement of the EB welding process thatthe defect level could be reduced. Alternatively, after the overlap,the weld could be continued into the canister lid in a helical fashionbefore fading-out the beam current. This would have the effect oftransferring the fade-out defects into the solid lid component. Therewould still of course be a series of root defects spiralling outwardson an upward helical path, but the potential corrosion paths wouldbe greatly extended. Practically this approach is attractive but againcareful consideration would need to be given to the NDT procedure andacceptance standards since defects would appear over a wide range ofdepths measured from the upper lid surface.
Regarding beam power requirements it appears that 72kW is just sufficientto achieve adequate initial penetration and a sound weld at a mid-thicknesswelding speed of lOOmm/min. For the first lid weld, as the weldprogresses, maximum penetration increased from 135 to 200mm. It isnot expected that the beam power requirement will exceed 1OOkW for thefull scale canister, although the maximum temperature rise will besubstantially less than 400°C a distance of 100mm from the weld.
The possibility of interruptions in the welding process leading todefects, such as those in the first simulated lid weld, must be faced.The magnetic trap device used in this work is well proven as a meansof preventing vapour from entering the electron gun but power supplyshut-down can still occur due to, for example, dust particles enteringthe upper gun column during filament replacement. In the case of thesupply shut-down events which occurred during the first simulated lidweld it is not clear what was the exact cause, but there was no clearevidence on the UV record or from the video recording to suggest thatthe gun had discharged. One possibility is that the current - overloadcircuit of the EHT supply malfunctioned. Finally, it can be mentionedthat good progress has been made with repair techniques and these willbe covered in the next report.
13
1
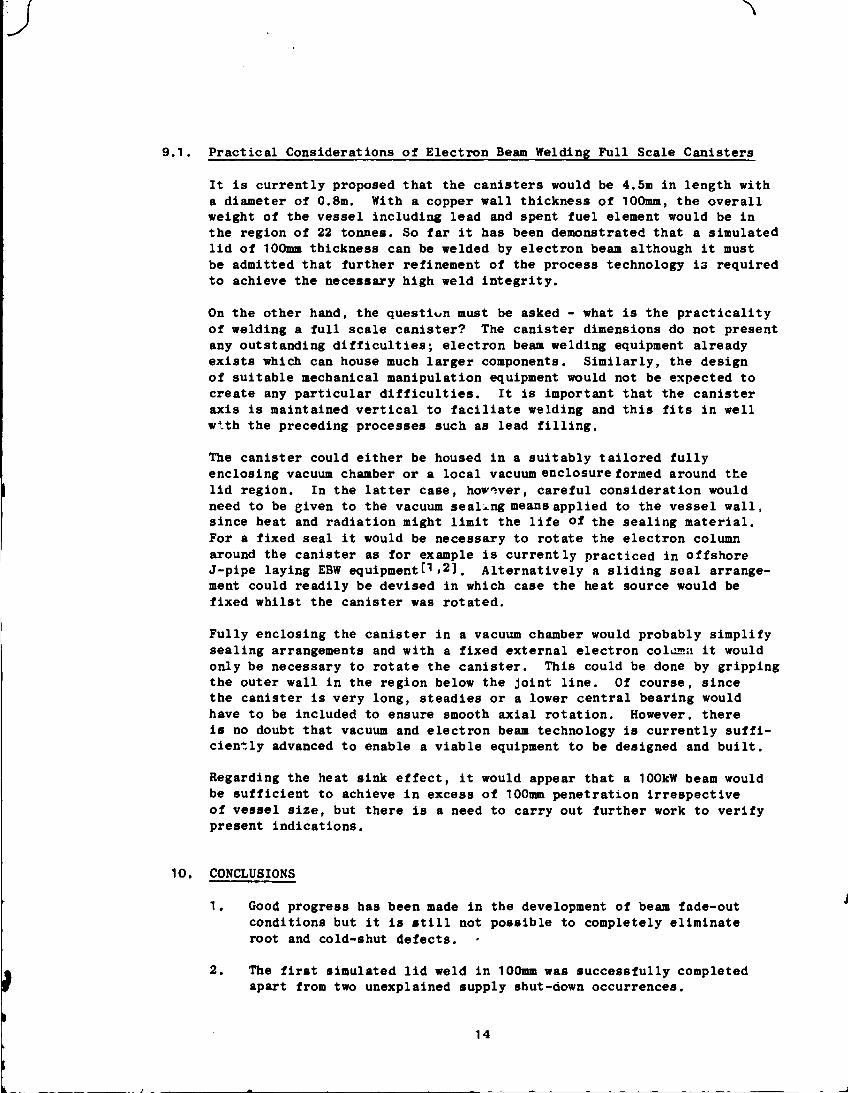
9.1. Practical Considerations of Electron Beam Welding Full Scale Canisters
It is currently proposed that the canisters would be 4.5m in length witha diameter of 0.8m. With a copper wall thickness of 100mm, the overallweight of the vessel including lead and spent fuel element would be inthe region of 22 tonnes. So far it has been demonstrated that a simulatedlid of 100mm thickness can be welded by electron beam although it mustbe admitted that further refinement of the process technology is requiredto achieve the necessary high weld integrity.
On the other hand, the question must be asked - what is the practicalityof welding a full scale canister? The canister dimensions do not presentany outstanding difficulties; electron beam welding equipment alreadyexists which can house much larger components. Similarly, the designof suitable mechanical manipulation equipment would not be expected tocreate any particular difficulties. It is important that the canisteraxis is maintained vertical to faciliate welding and this fits in wellwith the preceding processes such as lead filling.
The canister could either be housed in a suitably tailored fullyenclosing vacuum chamber or a local vacuum enclosure formed around thelid region. In the latter case, however, careful consideration wouldneed to be given to the vacuum sealing means applied to the vessel wall,since heat and radiation might limit the life of the sealing material.For a fixed seal it would be necessary to rotate the electron columnaround the canister as for example is currently practiced in offshoreJ-pipe laying EBW equipmentH,2J# Alternatively a sliding seal arrange-ment could readily be devised in which case the heat source would befixed whilst the canister was rotated.
Fully enclosing the canister in a vacuum chamber would probably simplifysealing arrangements and with a fixed external electron column it wouldonly be necessary to rotate the canister. This could be done by grippingthe outer wall in the region below the joint line. Of course, sincethe canister is very long, steadies or a lower central bearing wouldhave to be included to ensure smooth axial rotation. However, thereis no doubt that vacuum and electron beam technology is currently suffi-ciently advanced to enable a viable equipment to be designed and built.
Regarding the heat sink effect, it would appear that a lOOkW beam wouldbe sufficient to achieve in excess of 100mm penetration irrespectiveof vessel size, but there is a need to carry out further work to verifypresent indications.
10. CONCLUSIONS
1. Good progress has been made in the development of beam fade-outconditions but it is still not possible to completely eliminateroot and cold-shut defects.
2. The first simulated lid weld in 100mm was successfully completedapart from two unexplained supply shut-down occurrences.
14

•J
3. Beam penetration at 72kW for a mid-thickness welding speed of100mm/min was some 135mm initially, rising to a maximum of 200mmtowards the end of the weld.
4. The maximum temperature recorded for the lid components, 100mmfrom the weld was 525°C, but the temperature fell to below 400°C,4 minutes after the welding was completed.
5. The present welding procedure leads to an average undercut levelof some 4mm but in the beam fade-out region the maximum undercutreached approximately 8mm.
6. Automated ultrasonic C-Scan has been shown to be useful in detect-ing and displaying defects, but some problems still remain withdefect sizing.
7. The OFHC lid copper supplied by the Outokumpu Oy appears toattenuate ultrasonic signal far less than the bar stock suppliedby the same company. This is undoubtedly related to the manufactur-ing processes involved in the production of the two types ofspecimen.
8. The design and manufacture of an electron beam installation capableof the handling the proposed full scale 4.5m x 0.8m 0 canisteris currently technically feasible.
11 . SUGGESTIONS FOR FUTURE WORK
There appear to be several remaining areas which require more researchand development effort. These can be listed as follows:-
1 . Further refinement of beam fade-out techniques to reduce defectlevels.
2. Study of effect of heat sink size on beam power versus penetration.
3. Continuation of the development of repair procedures (this isalready underway and will be reported on in the near future).
4. Investigation of the effect of copper grain structure on ultra-sonic attenuation. This, in turn, needs to be linked to the manu-facturing processes involved in material production. In thefinal analysis, a range of acceptable attenuation values for theultrasonic test procedure adopted would have to be specified.
5. Further development of the ultrasonic transducers to improveresolution of defects. This would be an extension of the work (onacoustic focussing techniques) mentioned in section 6.
•
15

'J
12. REFERENCES
1. BRUNO DE SIVRY, SUDREAU, G. 'A new concept for pipelines :electron beam welding1, paper OTC 4101, pp 299-303, 13th AnnualOffshore Tech. Conference, Houston Texas, May 4th-7th 1981.
2. SUDREAU, G., BRUNO DE SIVRY, ANSELME, O.R. 'Electron beamweldability for deep sea pipelines' Paper OTC 4102, pp 311-316,13th Annual Offshore Tech. Conference, Houston Texas, May 4th-7th 1981.
16
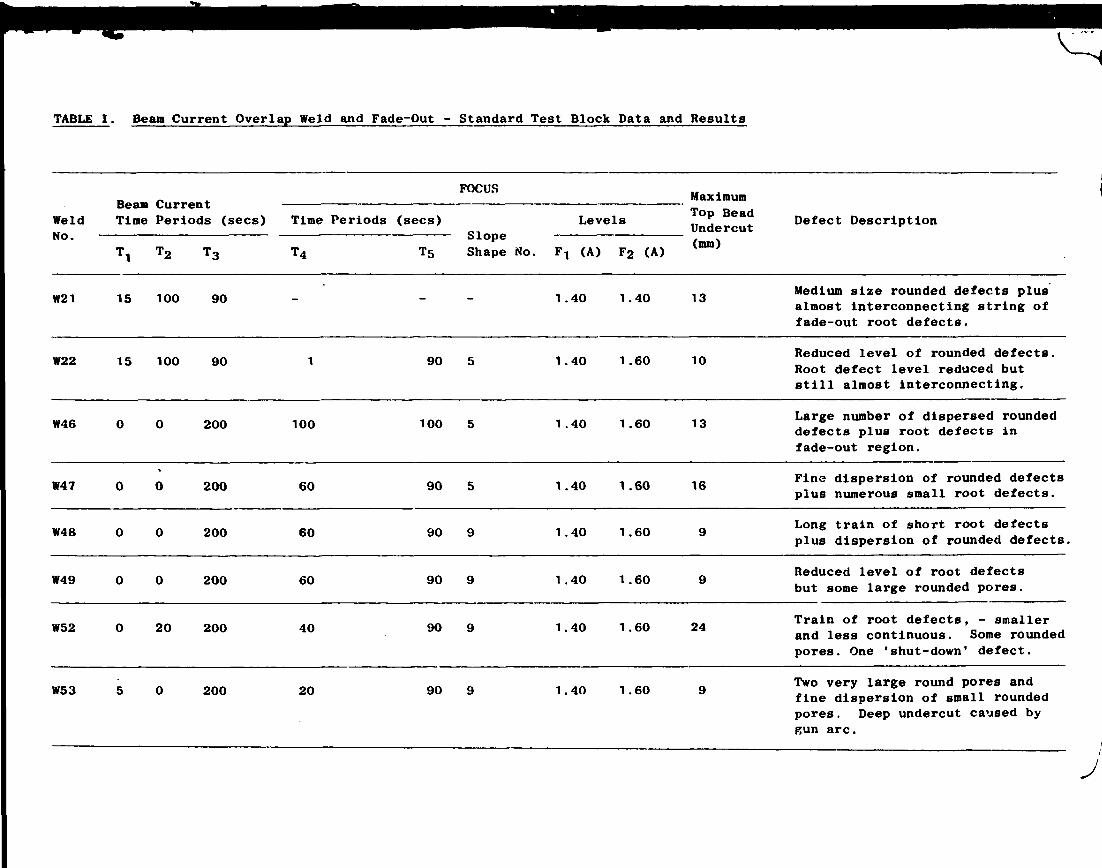
TABLE I. Beam Current Overlap Weld and Fade-Out - Standard Test Block Data and Results
WeldNo.
Beam CurrentTime Periods (sees)
FOCUS
Time Periods (sees)
T5
SlopeShape No.
Levels
(A) F2 (A)
MaximumTop BeadUndercut(mm)
Defect Description
W21 15 100 90 1.40 1.40 13Medium size rounded defects plusalmost interconnecting string offade-out root defects.
W22 15 100 90 90 1 .40 1 .60 10Reduced level of rounded defects.Root defect level reduced butstill almost interconnecting.
W46
W52
200
20 200
100
40
100 1 .40 1.60 13
90 1.40 1 .60 24
Large number of dispersed roundeddefects plus root defects infade-out region.
W47
W48
W49
0
0
0
0
0
0
200
200
200
60
60
60
90
90
90
5
9
9
1.40
1.40
1.40
1.60
1.60
1 .60
16
9
9
Fine dispersion of rounded defectsplus numerous small root defects.
Long train of short root defectsplus dispersion of rounded defects
Reduced level of root defectsbut some large rounded pores.
Train of root defects, - smallerand less continuous. Some roundedpores. One 'shut-down' defect.
W53 200 20 90 1.40 1.60Two very large round pores andfine dispersion of small roundedpores. Deep undercut caused bygun arc.
J

TABUS II. Effect of Beam Focus and Y Castellated Squareware Qacillation Amplitude on Root Defect Format ion
SpecimenNunber
BeanCurrent(mA)
FocusCoilCurrent(A)
Beam Oscillation
X (along joint) Y (across joint)
mm Hz Pattern mm Hz Pattern
CombinedPattern
RootDefectRating
Comments
23 ABCDEF
300300300200200200
1.46.46.46.46.46
00.5
20002000
1.46
1.0 20001 .5 20002.0 20002.5 2000
Ml/1(8)(6)(4)454
) current) excessive)20mm deep feathery defects20mm deep feathery defects20mm deep feathery defects
24 ABCDEF
200200200200200200
.48
.48
.48
.48
.48
.48
0 20000.5 20001.0 20001.5 20002.0 2000 i2.5 2000J
98.57666.5
No apparent defectsFaint 15mm deep defects15mm deep defects1 intermittent 15 -> 20mm defects
25 ABCDEF
200200200200200200
1.501.501.501.501.501.50
0 20000.5 20001.0 20001 .5 20002.0 20002.5 2000
Ll/ll/l8.5 Very narrow faint defects8 15mm deep feathery defects7 20mm deep feathery defects7 20mm deep feathery defects8 20mm deep feathery defects8 Intermittent defects

TABLE III. Effect of Y Oscillation for Two Amplitudes
SpecimenNumber
26 ABCD
27 ABCD
BeamCurrent
(.ma.)
200200200200
200200200200
FocusCoilCurrent(A)
1.5001.5001.5001.500
1.5001.5001.5001.500
Beam Oscillation
X (along joint) Y (across joint)
mm Hz Pattern mm Hz Pattern
CombinedPattern
RootDefectRating
Comments
4444
2222
1414014002800
1414014002800
1/1 l/l3 Large cluster defects7i 7mm almost cont. defects.6 10mm deep defect7 12mm deep defect
7 Faint deep defects8 10mm deep defects7 12mm deep defects6 15mm deep defects

TABLE IV. Effect of Focus for 4mm Y Castellated Oscillation
SpecimenNumber
28 ABCD
BeamCurrent(•A)
200200200200
FocusCoilCurrent(A)
Beam Oscillation
X (along Joint) Y (across joint)RootDefect
Combined RatingComments
mm Hz Pattern Hz Pattern Pattern
1.4001.4501.5001.550 tfll/1
12-15mm deep defects7mm deep defects
5.5mm deep defects6mm deep defects
TABLE V. Effect of Triangular Oscillation Pattern
BeamCurrent
Specimen (mA)Number
FocusCoilCurrent(A)
Beam Oscillation
X (along Joint) Y (across joint)
mm Hz Pattern nun HzCombined
Pattern Pattern
RootDefectRating
Comments
29 ABCD
200200200200
1.5001.5001.5001.500
2222
50701401210
-MA, M'V4765
35mm deep defectsFaint 10-15mm deep defectsFaint 15-20mm deep defects20-30mm deep defects
J
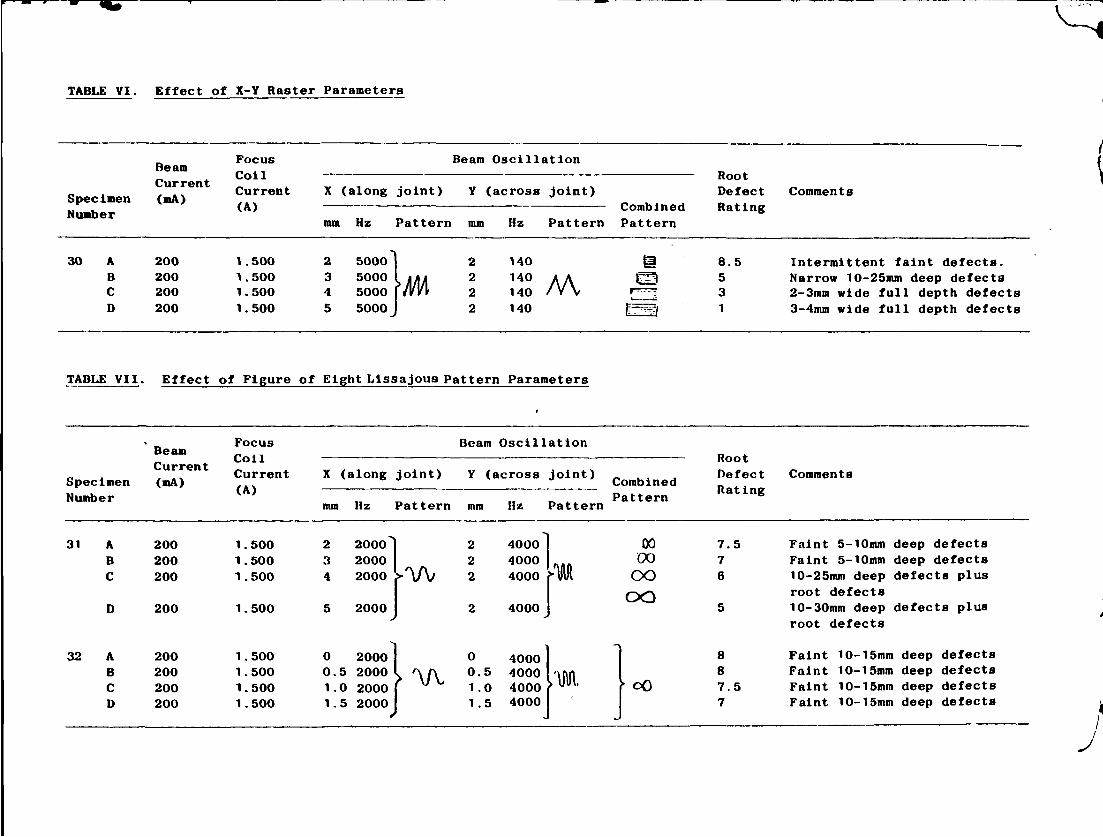
TABLE VI. Effect of X-Y Raster Parameters
SpecimenNumber
30 ABCD
BeamCurrent(mA)
200200200200
FocusCoilCurrent(A)
Beam Oscillation
X (along joint) Y (across joint)
Hz Pattern mm HzCombined
Pattern Pattern
RootDefectRating
Comments
1.5001.5001.5001.500
2345
500015 0 0 0 I lii5000 (JWi5000 J
2222
140140140140M,
8.5 Intermittent faint defects.5 Narrow 10-25mm deep defects3 2-3mm wide full depth defects1 3-4mm wide full depth defects
TABLE VII. Effect of Figure of Eight Lissajoua Pattern Parameters
SpecimenNumber
BeamCurrent(mA)
FocusCoilCurrent(A)
Beam Oscillation
X (along joint) Y (across joint)
mm Hz Pattern mm Hz Pattern
CombinedPattern
RootDefectRating
Comments
31
32
ABC
200200200
200
ABCD
200200200200
1.5001.5001.500
1.500
234
200020002000
2000
1.5001.5001.5001.500
00.1 .1.
505
2000200020002000
222
400040004000
4000
0 40000.5 40001.0 40001.5 4000
0000
ooCO
7.5 Faint 5-10mm deep defects7 Faint 5-10mm deep defects
6 10-25mm deep defects plusroot defects
5 10-30mm deep defects plusroot defects
8 Faint 10-15mm deep defects8 Faint 10-15mm deep defects7.5 Faint 10-15mm deep defects7 Faint 10-15mm deep defects
>
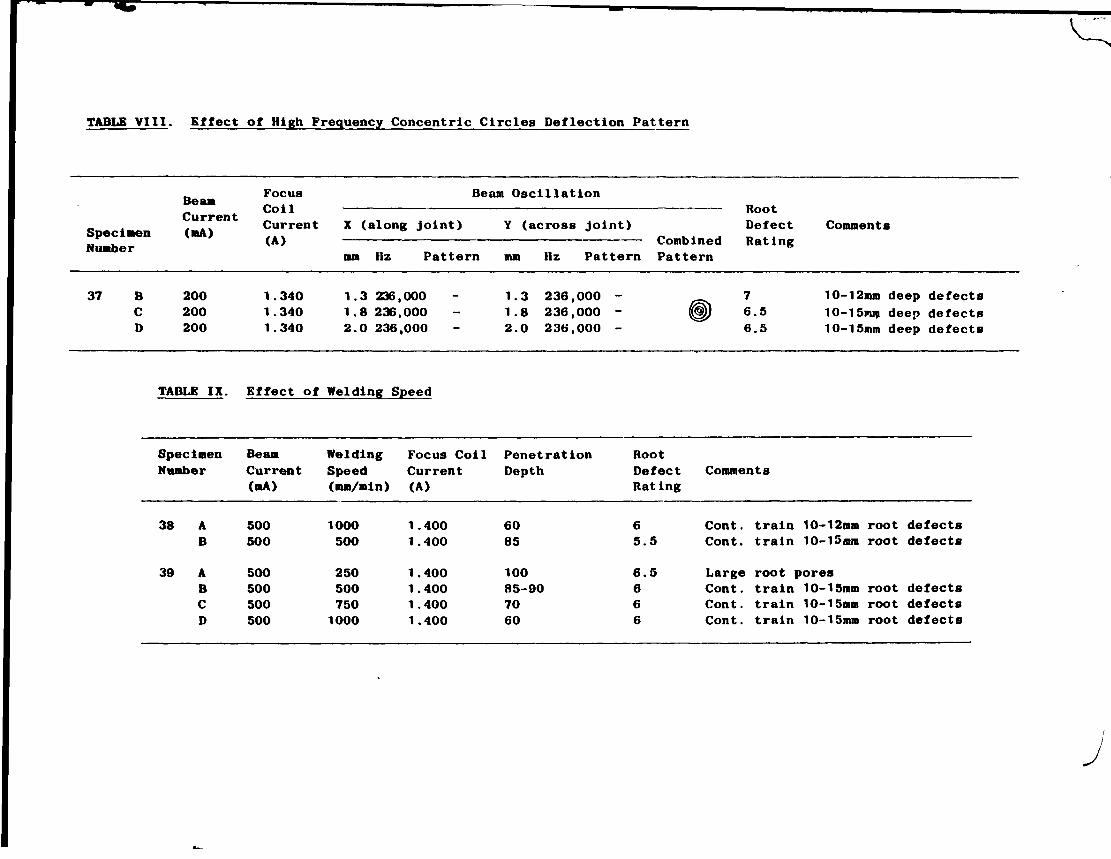
TABLE VIII. Effect of High Frequency Concentric Circles Deflection Pattern
BeamCurrent
SpecimenNimber
FocusCoilCurrent(A)
Beam Oscillation
X (along joint) Y (across joint)RootDefect
Combined RatingHz Pattern mm Hz Pattern Pattern
Comments
37 BCD
200200200
1.3401.3401.340
1.3 236,0001.8 236,0002.0 236,000
1.3 236,0001.8 236,0002.0 236,000
76.56.5
10-12mm deep defects10-15mn deep defects10-15mm deep defects
TABLE IX. Effect of Welding Speed
Sped nenNumber
BeamCurrent(mA)
WeldingSpeed(mm/min)
Focus CoilCurrent(A)
PenetrationDepth
RootDefectRating
Comments
38
39
AB
ABCD
500500
500500500500
1000500
2505007501000
1.4001.400
1 .4001.4001.4001.400
6085
10085-907060
65.5
6.5666
Cont. train 10-12mm root defectsCont. train 10-i5mm root defects
Large root poresCont. train 10-15mm root defectsCont. train 10-15mm root defectsCont. train 10-15mm root defects
i

TABLE X. Welding Conditions Used For First Simulated Lid Weld
SpecimenNumber
W55
Accel.Volt.kV
143
SurfaceTra-versespeedaun/min
120
WorkingDistancemm
150
TackWeldmA
75
Beam Current
MainWeldmA
500
SlopeShapeNo.
5
Time Periods(sees)
Ti
5
T2
997
T3
200
Overlap
60
SlopeShapeNo.
9
Focus
TimePeriods
T4
40
T5
90
LevelsA
F1
1 .400
F2
1.600

Electron beam
500-
Beamcurrent,mA
Fig. 1. Standard copper block assembly used for weld overlap and beam fade-out trials.
Beam current
Focus coil current
F2
Focus catcurrent, A
Time, sec
Fig.2. Time-parameter level relationship between beam current and focus coil current for weld overlap and beam fade-outtrials.
v
500
1g 300
200
100
O
8ea/n currentfade-cut curve(weld no. 21 and 22)
i i i T I I
Focus current weld no. 22
Focus current weld no. 21
160
150
8
0 10 20 30 UO 50 60 70 80 90 W 110 120 130 W 150 160 T70 180 190 200Time, sec
Fig.3. Beam current and focus ramp curves for weld numbers 21 and 22.

52771
Fig.4.'. Radiograph of weld number 21 showing train of root defects in beam fade out-region and other medium sized defects.

Top bedd undercut *
.-..y».»-..
5fl^--"v---^.S?«1* *•:'''-. :*'7V?"*'
. Radiograph of weld number 22 showing reduced defect and undercut level compared with weld number 21, Fig.4.

500)
!CO
200-
100-
/
1 • 1
>
Weld no. U
1 ! i
Beam
o
Weld no U 5,
current
i i
3
10 20 30 UO 50 60 70 W 90 100 110 120 130 %0 150 160 TV ISO 1§0 200
Time, sec
Fig.6. Beam current and focus ramp curves for weld numbers 46 and 47.

Welding direction
52773
Fig. 7. Radiograph of weld number 46, note increased defect and undercut level of Fig.4 and 5.
Welding direction
Gross defects pIon frequency low.'?' pass
'* i .
52772
Fig. 8. Radiograph of weld number 47 showing improved fade-out defect level compared with Fig. 7.
L

i I I
_!^VV» O-
.a-- A .
500
too
I
200
100
s."X,
i i i i i i i
1.600)s
150 ^
r.iö
10 20 30 UO 50 60 70 80 90 100 TIO 120 130 %0 150 160 170 '80 190 200
Time, sec
Fig.9. Beam current and focus ramp curves for weld numbers 48, 52 and 53.
Welding direction
52767
Fig. 10. Radiograph of weld number 48, showing reduced top bead undercutting but a/must continuous train of fade-out defects.

Welding direction
52769
Fig. 11. Radiograph of weld number 49 made with low beam current ripple supply.

Welding direction
52768
Fig. 12. Radiograph of weld number 52 showing improved top bead undercut and fade-out defect level.
Welding direction
I.- ••-, .'ÄT1.
it fane our defects
52770
Fig. 13. Radiograph of weld number S3. Note this condition appeared generally to improve the fade-out root defect level but resulted in deep undercut and largeinternal defects.

Fig. 14. Macrograph of specimen number 24A showing narrow penetration finger tip and root defect, x7.
• • • . t
penetration fingers *• •produced by beam '
f/g'. /5. Macrograph of specimen number 26B showing generally rounded fusion zone tip produced bycastellated oscillation pattern, x7.

F/p. 16. Macrograph of specimen number 27A showing three distinct penetration fingers and porosity, x7.

Thermocouples
Electronbeam ^
(a)
Ring(canisterwall)
Copper backing (iid neck)
Rotationdirection
Shut down defects
C
Fade-outdefects
(b)
Fig. 17. Simulated copper lid assembly:
a) cross-section b) plan (first angle projection)

52481
Fig. 18. Genera! view of simulated lid assembly as-welded.

i
Temperature,0 C
S ,
I !iji 2
£
FirstshutdowneventSecondshutdownevent
^Weldingrestartedfor last time
00
sKo
©v
3
*
a
\ «•
\
\
ii
\\t
v;i•i
_Beam fade-out commenced
-Weld completed

T"
To ultrasonic flaw detector
19mm dia, 2 25MHz probe
100 !approx i
100cpprox.
I 3
— — —
2
1
3 • Weld zone
600 dia.
Fig.20. Contact scanning. Cross-sectional view of specimen. (Dimensions in mm.)

Key.
F== l Si* -70dB
I I 70 -76dB
~_~_~J]76-82dB
Beginning offcce-out
Fig.21. Manual ultrasonic A-scan. Numbers in contours indicate attanuator settings (dB) for echo amplitudeto reach 50% full-screen height.

Scanning of specimen done in traverses 1mm apart
Water path 90mm
19mm dia. 2.25MHzprobe
• Weld zone
Fig.22. Immersion scanning.

SSA/1
é
Key.
0-6dB betow maximum amplitude
6-12dB below maximum amplitude
12-18dB below maximum amplitude
Fig.23. Immersion ultrasonic C scan. Maximum signal amplitude at arrowed point.

r\
-v
o
4
Key
0 -12dB below maximum amplitude
12-WdB below maximum amplitude
18-2UdB béow maximum amplitude
Fig.24. Immersion ultrasonic C-scan. Scan sensitivity increased by 6dB.

;
Fig. 25. Radiographs of simulated lid weld:
a) quadrant DOC showing 'shut-down' and root defects b) quadrant AOB showing 'fade-out' defects.
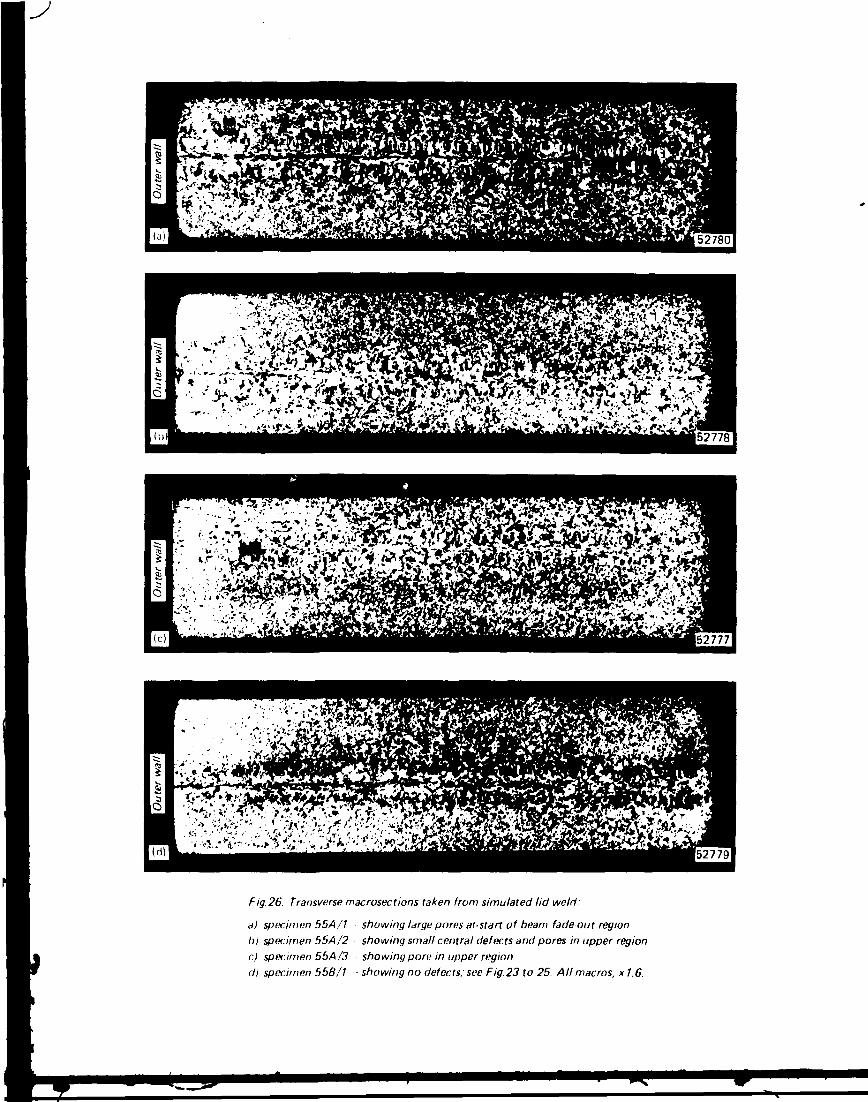
Fig. 26. Transverse macrosections taken from simulated lid weld:
a) specimen 55A/I showing large pores at-start of beam fade out regionhj specimen 554/2 showing small central defects and pores in upper regioncj specimen 55A /3 showing pore in upper regiondj specimen 55B/1 showing no defects; see Fig.23 to 25. All macros, x 1.6.

LD 22967
RESIDUAL STRESS MEASUREMENTS IN AN EB WELDED COPPER DISC
By: R. H. Leggatt
INTRODUCTION
The Welding Institute have carried out a trial electron beam veld on asolid copper disc of diameter 600mn and tctal thickness 200mm. Thesponsors, SKBF, wished to have some information on the residualstresses likely to be present in such a veld. A literature search onthe "Weldasearch" system revealed no relevant data. It was thereforedecided to make some surface stress measurements on the welded copperdiscs using the centre hole technique.
SPECIMEN
The specimen design and welding procedures are described in a separatereport (Ref. LD 22965). The trial weld was intended to model theclosing joint between the lid and body of a heavy section cylindricalcanister. The lid wa» represented by two discs of diameters 600mm and400mm and thickness 100mm each. The smaller disc fitted into a 20mmdeep recess in one face of the larger disc. The body of the canisterwas represented by an annulus of inner diameter 400mm, outer diameter600mm, and thickness (in the axial direction) of 100mm. The annulusfitted over the smaller disc and was welded to the larger disc bymeans of a circumferential EB weld. A cross-section of the joint(after the specimen had been reduced in diameter and sawn into quad-rants) is shown in Fig. Id.
EXPERIMENTAL PROCEDURE
Residual stresses were measured using centre hole rosette gauges. Thehole was formed using a rotating air abrasive jet. The hole diameterand depth were approximately 2.0mm. Full details of the equipment,procedures and calibration factors are given by Beaney [1], who quotesan accuracy of ± 8% for stresses below 65% of yield.
The gauge locations are shown on Fig. 1. Gauges 1 to 5 were attachedto the outer surface of the specimen as-received after welding. Thespecimen was then reduced to a diameter of 588mm on a lathe. Gauges 6to 9 were applied on the machined surface, and gauge 10 on the sideface. Finally, the specimen was cut into four quadrants. The sawnsurface of one quadrant was prepared for gauging by removing materialto a depth of 0.25mm with a band held rotary polisher using a fine gritwheel. This preparation procedure was intended to remove any surfaceeffects induced by sawing. Gauges 11 to 14 were applied to the EB weldmetal on the exposed cross section.

RESULTS
The r e s u l t s were ca lcu la ted us ing a Young's modulus value of118,000 N/mm2 [2] and vK2/K-] = 0 . 3 (vK2/K-| i s a centre hole constantclosely related to Poisson's ra t io ) .
The results are l i s t ed in Table 1 and are plotted on Fig. 2; All themeasured stresses were small, in the range -32 to +36 N/nm2. Thestresses on the disc as-welded were compress!ve, except at the measure-ment point 10mm from the weld where a hoop tens i l e stress of 11 N/mm2
was found.
The stresses measured after machining the outside diameter were in a l lcases more tens i l e than those in the as-welded condition. In the caseof the stresses on the side face of the disc, which was not machined,the stress changes were negl ig ible . However, there were significantstress changes on the outside diameter, averaging +22 N/mm2 in the hoopdirection and +10 N/mm2 in the direction transverse to the weld. Thepeak tens i le stresses were on the weld i t s e l f : 32 N/mm2 in the hoopdirection and 19 N/mm2 in the transverse direction.
The stresses on the weld cross section after cutting the disc assemblyinto quadrants were even smaller than those on the external face, andlay in the range -16 N/mm2 to 3 N/mm2.
DISCUSSION
The possible causes of residual stresses in the welded copper discspecimens are weld shrinkage, non-uniform cooling and machiningstresses . In s t e e l weldments, weld shrinkage usually causes yie ldmagnitude tensi le residual stresses in the weld and adjacent parentmaterial. In the present specimen, the peak tens i l e s tresses werefound in weld metal, and these stresses may be assumed to have beencaused by weld shrinkage. The maximum measured stress was 36 N/mm2,which may be compared with published values oi 0.1% proof stress foroxygen free coppers, which l i e In the range 45 N/mm2 to 320 N/mm2 [2 ] ,depending on condition, product and the degree of hot and cold working.As the fused metal i s e f fect ive ly hot worked as i t t r i e s to contract,i t seems l ikely that i t s proof stress would be similar to that of hotworked products, i . e . 90 N/mm2. The maximum measured residual stresswas significantly lower than t h i s , presumably due to the fact that thedisc specimen reached a mean temperature of about 400°C soon afterwelding was completed. At this temperature the yield stress i s verylow, and large weld shrinkage stresses cannot be sustained. Once auniform temperature i s achieved there i s no further differential weldshrinkage, and no additional weld shrinkage stress can be generated.
However, additional residual stresses can arise i f the disc i s allowedto cool in a non-uniform manner. In' the present instance, air wasallowed into the vacuum chamber whilst the disc was s t i l l at atemperature of about 400°C. Rapid surface cooling can cause the outer

surface of a massive body to yield in tension. On final cooling of thecore the surface layer goes into compression. Fig. 2a shows thatthere were surface compressive stresses in the range -13 to -29 N/mm2
on the side face of the discs. Fig. 2b shows that the stresses on theouter surface before machining were more compressive than thosemeasured after the surface had been removed. The stress differences atparticular locations were in the range -5 to -33 N/mm2. Both resultssuggest that air cooling did cause compressive surface stresses in thedisc. These stresses were superimposed on the weld induced stresses onthe outer diameter. Compressive surface stresses are beneficial ininhibiting any tendency for stress corrosion cracking.
Other possible sources of residual stresses are the machining andpreparation processes applied to the surface prior to application ofthe gauges. Such stresses would mask the effects of weld shrinkage andcooling stresses. In view of the consistency of the surface com-pression effects described above, it appears that the reduction of thediameter on the lathe did not cause any significant machining stresses.
It is not possible to state whether the sawing and polishing applied tothe weld cross-section specimen had any effect on the measured stressesshown on Fig. 2c. Having found a tensile axial stress on the outersurface before sawing (19 N/mm2) it was expected that similar or higherstresses might have been found inside the weld. However, any suchstresses would have been affected both by the sectioning of thespecimen, which relieved the normal and shear stresses on the cutfaces, and by the machining process itself. In spite of these unknownstress changes during cutting it would be expected that any largeinternal axial or radial stresses in the weld would produce significantremnant stresses on the cut face. The measured stresses were in factvery low (maximum 3 N/mm2), which suggests that no large internalstresses were present before cutting.
CONCLUSIONS
The measured residual stresses on the EB welded copper disc lay in therange -32 N/mm2 to +36 N/mm2. The peak tensile stresses were found onthe weld itself after removal of the outer layer of material, and werecaused by weld shrinkage. The peak stress was less than half theassumed value of the proof stress of the fused metal. The surface ofthe specimen contained compressive stresses of up to -29 N/mm2 whichwere probably caused by rapid air cooling after welding.
ACKNOWLEDGEMENTS
The experimental work was carried out by Mr. B. A. Martin of the DesignAdvisory Section. The author is grateful for the co-operation ofDr. A. Sanderson of the EB welding section.

REFERENCES
1. BEANEY, E.M. "Accurate measurement o f r e s idua l s t r e s s e s on anys t e e l us ing the c e n t r e - h o l e method", S t r a i n , July 1976, p . 99 .
2 . STAMFORD, M.S. "Copper data", The Copper Development A s s o c i a t i o n ,Technical Note TN20, .975.
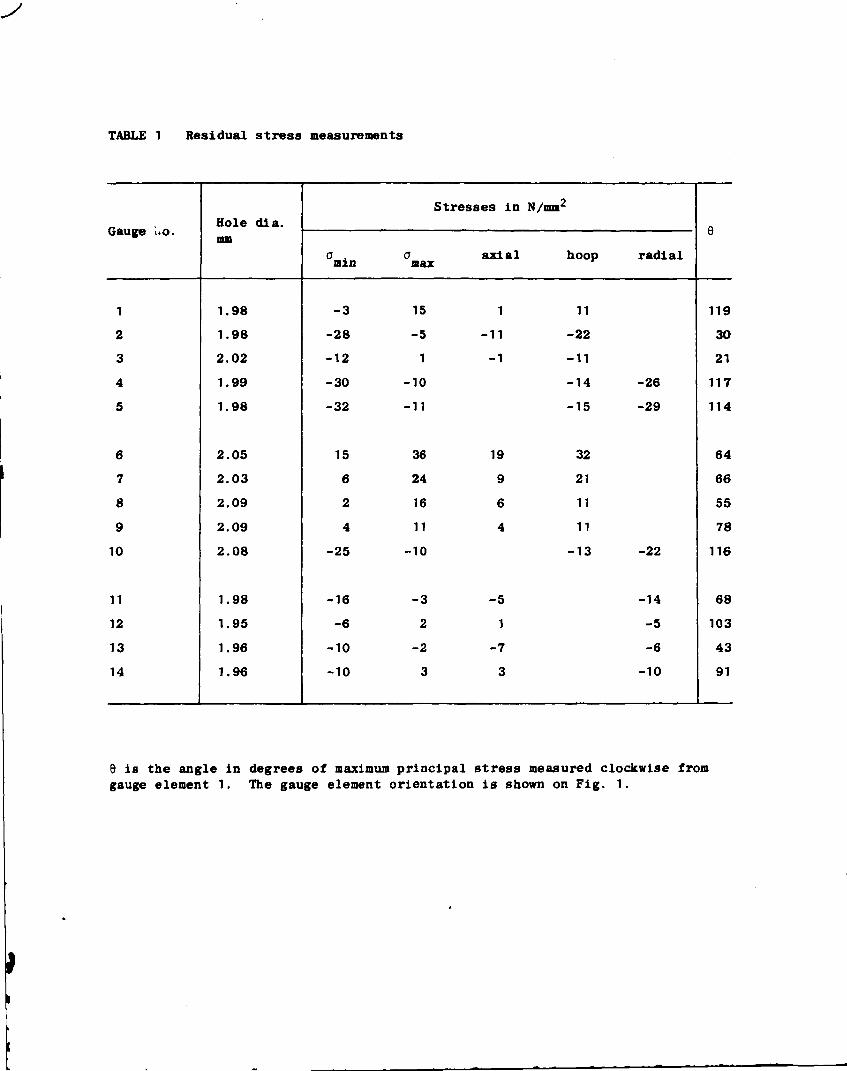
TABLE 1 Residual stress measurements
Gauge uo.
1
2
3
4
5
6
7
8
9
10
11
12
13
14
Hole dia.mm
1.98
1.98
2.02
1.99
1.98
2.05
2.03
2.09
2.09
2.08
1.98
1.95
1.96
1.96
°min
-3
-28
-12
-30
-32
15
6
2
4
-25
-16
-6
-10
-10
Stresses in
amax
15
-5
1
-10
-11
36
24
16
11
-10
-3
2
-2
3
axial
1
-11
-1
19
9
6
4
-5
1
-7
3
N/mm2
hoop
11
-22
-11
-14
-15
32
21
11
11
-13
radial
-26
-29
-22
-14
-5
-6
-10
e
119
30
21
117
114
64
66
55
78
116
68
103
43
91
9 is the angle in degrees of maximum principal stress measured clockwise fromgauge element 1. The gauge element orientation is shown on Fig. 1.

(a)
.Weld overlap250
All dimensions in mmGauge element 1 vertical in allelevations
Fig.1. Centre hole gauge locations:
a) on flat side face b) on outside diameter before machining c) on outside diameter after machiningd) on weld cross-section after sawing into quadrants

6
U l
• » ^
inp.Q
JO
20
10
0
-10
-20
-JO
© V) Gauge no.
machining
>(s -welded
WO 200 300Distance from disc centre, mm
100 200 300(a) Distance from disc centre.mm
Gauge no.
-30
As-welded
-100 -SO 0 SODistnn.e from weld, mm
-30
Aftermachining
As-welded
-100 -SO 0 SO(b) Distance from weld, mm
WO
100Ic)
Gauges ^ tt 12 II 6
100 200 300Distance from disc centre, mm
Gauges U. 13 12 11
WO 200 300Distance from disc centre, mm
Fig.2. Residual stresses before and after machining:
a) on side face b) on outside diameter c) on weld cross-section
vLIST OF KBS's TECHNICAL REPORTS
1977-78
TR 121 KBS Technical Reports .1 - 120.Summaries. Stockholm, May 1979
1979
TR 79-28 The KBS Annual Report 1979.KBS Technical Reports 79-01--79-27.Summaries. Stockholm, March 1980.
1980
TR 80-26 The KBS Annual Report 1980.KBS Technical Reports 80-01—80-25,Summaries. Stockholm, March 1981.
1981
TR 81-17 The KBS Annual Report 1981.KBS Technical Reports 81-01—81-16Summaries. Stockholm, April 1982.
TR 83-01 Radionuclide transport in a single fissureA laboratory studyTrygve E EriksenDepartment of Nuclear ChemistryThe Royal Institute of TechnologyStockholm, Sweden 1983-01-19
TR 83-02 The possible effects of alfa and beta radiolysison the matrix dissolution of spent nuclear fuelI GrentheI PuigdoménechJ BrunoDepartment of Inorganic ChemistryRoyal Institute of TechnologyStockholm, Sweden January 1983

v TR 83-03 Smectite alterationProceedings of a colloquium at State University ofNew York at Buffalo, May 26-27, 1982Compiled by Duwayne M AndersonState University of New York at BuffaloFebruary 15, 1983
TR 83-04 Stability of bentonite gels in crystalline rock -Physical aspectsRoland PuschDivision Soil Mechanics, University of LuleåLuleå, Sweden, 1983-02-20
TR 83-05 Studies in pitting corrosion on archeologicalbronzes - CopperÅke BresleJozef SaorsBirgit ArrheniusArchaeological Research LaboratoryUniversity of StockholmStockholm, Sweden 1983-01-02
TR 83-06 Investigation of the stress corrosion cracking ofpure copperL A BenjaminD HardieR N ParkinsUniversity of Newcastle upon TyneDepartment of Metallurgy and Engineering MaterialsNewcastle upon Tyne, Great Britain, April 1983
TR 83-07 Sorption of radionuclides on geologic media -A literature survey. I: Fission ProductsK AnderssonB AllardDepartment of Nuclear ChemistryChalmers University of TechnologyGöteborg, Sweden 1983-01-31
TR 83-08 Formation and properties of actinide colloidsU OlofssonB AllardM BengtssonB TorstenfeltK AnderssonDepartment of Nuclear ChemistryChalmers University of TechnologyGöteborg, Sweden 1983-01-30
TR 83-09 Complexes of actinides with naturally occurringorganic substances - Literature surveyU OlofssonB AllardDepartment of Nucluear ChemistryChalmers University of TechnologyGöteborg, Sweden 1983-02-15
TR 83-10 Radiolysis in nature:'Evidence from the Oklo natural reactorsDavid B CurtisAlexander J GancarzNew Mexico, USA February 1983
vTR 83-11 Description of recipient areas related to final
storage of unreprocessed spent nuclear fuelBjörn SundbladUlla BergströmStudsvik Energiteknik ABNyköping, Sweden 1983-02-07
TR 83-12 Calculation of activity content and relatedproperties in PWR and BWR fuel using ORIGEN 2Ove EdlundStudsvik Energiteknik ABNyköping, Sweden 198 3-03-07
TR 83-13 Sorption and diffusion studies of Cs and I inconcreteK AnderssonB TorstenfeltB AllardDepartment of Nuclear ChemistryChalmers University of TechnologyGöteborg, Sweden 1983-01-15
TR 83-14 The complexation of Eu(III) by fulvic acidJ A MarinskyState University of New York at Buffalo, Buffalo,NY1983-03-31
TR 83-15 Diffusion measurements in crystalline rocksKristina SkagiusIvars NeretnieksRoyal Institute of TechnologyStockholm, Sweden 1983-03-11
TR 83-16 Stability of deep-sited smectite minerals incrystalline rock - chemical aspectsRoland PuschDivision of Soil Mechanics, University of Luleå1983-03-30
TR 83-17 Analysis of groundwater from deep boreholes inGideå Sif LaurentSwedish Environmental Research InstituteStockholm, Sweden 1983-03-09
TR 83-18 Migration experiments in StudsvikO LandströmStudsvik Energiteknik ABC-E KlockarsO PerssonE-L TullborgS Å LarsonSwedish GeologicalK AnderssonB AllardB TorstenfeltChalmers University of Technology1983-01-31
\JTR 83-19 Analysis of groundwater from deep boreholes in
FjällvedenSif LaurentSwedish Environmental Research InstituteStockholm, Sweden 1983-03-29
TR 83-20 Encapsulation and handling of spent nuclear fuelfor final disposal1 Welded copper canisters2 Pressed copper canisters (HIPOW)3 BWR Channels in ConcreteB Lönnerberg, ASEA-ATOMH Larker, ASEAL Ageskog, VBBMay 1983
TR 83-21 An analysis of the conditions of gas migrationfrom a low-level radioactive waste repositoryC BraesterIsrael Institute of Technology, Haifa, IsraelR ThunvikRoyal Institute of Technology, Stockholm, SwedenNovember 1982
TR 83-22 Calculated temperature field in and around arepository for spent nuclear fuelTaivo Tarandi, VBBStockholm, Sweden April 1983
TR 83-23 Preparation of titanates and zeolites and theiruses in radioactive waste managemen', particularlyin the treatment of spent resinsÅ Hultgren, editorC AirolaStudsvik Energiteknik ABS Forberg, Royal Institute of TechnologyL Faith, University of LundMay 1983
TR 83-24 Corrosion resistance of a copper canister forspent nuclear fuelThe Swedish Corrosion Research Institute and itsreference groupStockholm, Sweden April 1983
TR 83-25 Feasibility study of electron beam welding ofspent nuclear fuel canistersA Sanderson, T F Szluha, J L Turner, R H LeggattThe Welding InstituteCambridge, The United Kingdom April 1983
TR 83-26 The KBS UO2 leaching programSummary Report 1983-02-01Ronald Forsyth, Studsvik Energiteknik ABNyköping, Sweden February 1983
TR 83-27 Radiation effects on the chemical environmentin a radioactive waste repositoryTrygve EriksenRoyal Institute of Technology, StockholmArvid JacobssonUniversity of Luleå, LuleåSweden 1983-07-01

vTR 83-28 An analysis of selected parameters for the
BIOPATH-programU BeraströmA-B WilkensStudsvik Energiteknik ABNyköping, Sweden 1983-06-08
TR 83-29 On the environmental impact of a repository forspent nuclear fuelOtto BrotzenStockholm, Sweden April 1983
TR 83-30 Encapsulation of spent nuclear fuel -Safety AnalysisES-konsult ABStockholm, Sweden April 1983
TR 83-31 Final disposal of spent nuclear fuel -Standard programme for site investigationsCompiled byUlf Thoregren
* Swedish GeologicalApril 1983
TR 83-32 Feasibility study of detection of defects in thickwelded copperTekniska Röntgencentralen ABStockholm, Sweden April 1983
TR 83-33 The interaction of bentonite and glass withaqueous mediaM MosslehiA LambrosaJ A MarinskyState University of New YorkBuffalo, NY, USA April 1983
TR 83-34 Radionuclide diffusion and mobilities in compactedbentoniteB TorstenfeltB AllardK AnderssonH KipatsiL EliassonU OlofssonH PerssonChalmers University of TechnologyGöteborg, Sweden April 1983
TR 83-35 Actinide solution equilibria and solubilities ingeologic systemsB AllardChalmers University of TechnologyGöteborg, Sweden 1983-04-10
TR 83-36 Iron content and reducing capacity of granites andbentoniteB TorstenfeltB AllardW JohanssonT IttnerChalmers University of TechnologyGöteborg, Sweden April 1983
TR 83-37 Surface migration in sorption processesA RasmusonI NeretnieksRoyal Institute of TechnologyStockholm, Sweden March 1983
TR 83-38 Evaluation of some tracer tests in the graniticrock at FinnsjönL MorenoI NeretnieksRoyal Institute of Technology, StockholmC-E KlockarsSwedish Geological, UppsalaApril 1983
TR 83-39 Diffusion in the matrix of granitic rockField test in the Stripa mine. Part 2L BirgerssonI NeretnieksRoyal Institute of TechnologyStockholm, Sweden March 1983
TR 83-40 Redox conditions in groundwaters fromSvartboberget, Gideå, Fjällveden and KamlungeP WikbergI GrentheK AxelsenRoyal Institute of TechnologyStockholm, Sweden 1983-05-10
TR 83-41 Analysis of groundwater from deep boreholes inSvartbobergetSif LaurentSwedish Environmental Research InstituteStockholm, Sweden 1983-06-10
TR 83-42 Final disposal of high-level waste ard spentnuclear fuel - foreign activitiesR GelinStudsvik Energiteknik ABNyköping, Sweden May 1983
TR 83-43 Final disposal of spent nuclear fuel - geological,hydrological and geophysical methods for sitecharacterizationK AhlbomL Carlsson0 OlssonSwedish GeologicalSweden May 1983
TR 83-44 Final disposal of spent nuclear fuel - equipmentfor site characterizationK Almén, K Hansson, B-E Johansson, G NilssonSwedish GeologicalO Andersson, IPA-KonsultP Wikberg, Royal Institute of TechnologyH Åhagen, SKBF/KBSMay 1983
TR 83-46
TR 83-45 Model calculations of the groundwater flow atFinnsjön, Fjällveden, Gideå and KamlungeL CarlssonA WinbergSwedish Geological, GöteborgB GrundfeltKemakta Consultant Company, StockholmMay 1983
Use of clays as buffers in radioactive repositoriesRoland PuschUniversity of LuleåLuleå May 25 1983
TR 83-47 Stress/strain/time properties of highly compactedbentoniteRoland PuschUniversity of LuleåLuleå May 1983
TR 83-48 Model calculations of the migration of radio-nuclides from a repository for spent nuclear fuelA BengtssonKemakta Consultant Company, StockholmM MagnussonI NeretnieksA RasmusonRoyal Institute of Technology, StockholmMay 1983
TR 83-49 Dose and dose commitment calculations from ground-waterborne radioactive elements released from arepository for spent nuclear fuelU BergströmStudsvik Energiteknik ABNyköping, Sweden May 1983
TR 83-50 Calculation of fluxes through a repository causedby a local wellR ThunvikRoyal Institute of TechnologyStockholm, Sweden May 1983
TR 83-51 GWHRT - A finite element solution to the coupledground water flow and heat transport problem inthree dimensionsB GrundfeltKemakta Consultant CompanyStockholm, Sweden May 1983
TR 83-52 Evaluation of the geological, geophysical andhydrogeological conditions at FjällvedenK Ah1bomL CarlssonL-E Carlsten0 DuranN-Å Larsson0 OlssonSwedish GeologicalMay 1983

yTR 83-53 Evaluation of the geological,- geophysical and
hydrogeological conditions at GideåK AhlbpmB AlbinoL CarlssonG Nilsson0 OlssonL StenbergH TimjeSwedish GeologicalMay 1983
TR 83-54 Evaluation of the geological, geophysical andhydrogeological conditions at KamlungeK AhlbomB AlbinoL CarlssonJ DanielssonG Nilsson0 OlssonS SehlstedtV StejskalL StenbergSwedish GeologicalMay 1983
TR 83-55 Evaluation of the geological, geophysical andhydrogeological conditions at SvartbobergetK AhlbomL CarlssonB GentzscheinA Jämtlid0 OlssonS TirénSwedish GeologicalMay 1983
TR 83-56 I:
TR 83-57
Evaluation of the hydrogeological conditionsat Finnsjön
II: Supplementary geophysical investigations ofthe Sternö peninsula
B HesselströmL CarlssonG GidlundSwedish GeologicalMay 1983
Neotectonics in northern Sweden -geophysical investigationsH HenkelK HultL ErikssonGeological Survey of SwedenL JohanssonSwedish GeologicalMay 1983
\JTR 83-58 Neotectonics in northern Sweden - geological
investigationsR LagerbäckF WitschardGeological Survey of SwedenMay 1983
TR 83-59 Chemistry of deep groundwaters from graniticbedrockB AllardChalmers University of TechnologyS Å LarsonE-L TullborgSwedish GeologicalP WikbergRoyal Institute of TechnologyMay 1983
TR 83-60 On the solubility of technetium in geochemicalsystemsB AllardB TorstenfeltChalmers University of TechnologyGöteborg, Sweden 1983-05-05
TR 83-61 Sorption behaviour of well-defined oxidationstatesB AllardU OlofssonB TorstenfeltH KipatsiChalmers University of TechnologyGöteborg, Sweden 1983-05-15
TR 83-62 The distribution coefficient concept and aspectson experimental distribution studiesB AllardK AnderssonB TorstenfeltChalmers University of TechnologyGöteborg, Sweden May 198 3
TR 83-63 Sorption of radionuclides in geologic systemsK AnderssonB TorstenfeltB AllardChalmers University of TechnologyGöteborg, Sweden 1983-06-15
TR 83-64 Ion exchange capacities and surface areas of somemajor components and common fracture fillingmaterials of igneous rocksB AllardM KarlssonChalmers University of TechnologyE-L TullborgS Å LarsonSwedish GeologicalGöteborg, Sweden May 1983

vTR 83-65 Sorption of actinides on uranium dioxide and
zirconium dioxide in connection with leaching ofuranium dioxide fuelB AllardN BernerK AnderssonU OlofssonB TorstenfeltChalmers University of TechnologyR ForsythStudsvik Energiteknik ABMay 1983
TR 83-66 The movement of radionuclides past a redox frontI NeretnieksB ÅslundRoyal Institute of TechnologyStockholm, Sweden 1983-04-22
TR 83-67 Some notes in connection with the studies offinal disposal of spent fuel. Part 2I NeretnieksRoyal Institute of TechnologyStockholm, Sweden May 1983
TR 83-68 Two dimensional movements of a redox frontdownstream from a repository for nuclear wasteI NeretnieksB ÅslundRoyal Institute of TechnologyStockholm, Sweden 1983-06-03
TR 83-69 An approach to modelling radionuclide migration ina medium with strongly varying velocity and blocksizes along the flow pathI NeretnieksA RasmusonRoyal Institute of TechnologyStockholm, Sweden May 1983
TR 83-70 Analysis of groundwater from deep boreholes inKamlungeS LaurentSwedish Environmental Research InstituteStockholm, Sweden May 1983
TR 83-71 Gas migration through bentonite clayRoland PuschThomas ForsbergUniversity of LuleåLuleå, Sweden May 31, 1983
ISSN 0348-7504
AB Teljpljn SOLNA 1983