Embed Size (px)
Citation preview
NREL is a national laboratory of the U.S. Department of Energy, Office of Energy Efficiency & Renewable Energy, operated by the Alliance for Sustainable Energy, LLC.
Contract No. DE-AC36-08GO28308
Feasibility Study of Economics and Performance of Solar Photovoltaics at the Former Fort Ord Army Base Site in Marina, California A Study Prepared in Partnership with the Environmental Protection Agency for the RE-Powering America’s Land Initiative: Siting Renewable Energy on Potentially Contaminated Land and Mine Sites
Blaise Stoltenberg, Craig Konz, and Gail Mosey
Produced under direction of the U.S. Environmental Protection Agency (EPA) by the National Renewable Energy Laboratory (NREL) under Interagency Agreement IAG-09-1751 and Task No. WFD4.1001.
Technical Report NREL/TP-7A30-58242 May 2013
NREL is a national laboratory of the U.S. Department of Energy, Office of Energy Efficiency & Renewable Energy, operated by the Alliance for Sustainable Energy, LLC.
Contract No. DE-AC36-08GO28308
National Renewable Energy Laboratory 15013 Denver West Parkway Golden, CO 80401 303-275-3000 • www.nrel.gov
Feasibility Study of Economics and Performance of Solar Photovoltaics at the Former Fort Ord Army Base Site in Marina, California A Study Prepared in Partnership with the Environmental Protection Agency for the RE-Powering America’s Land Initiative: Siting Renewable Energy on Potentially Contaminated Land and Mine Sites
Blaise Stoltenberg, Craig Konz, and Gail Mosey Prepared under Task No. WFD4.1001
Technical Report NREL/TP-7A30-58242 May 2013
NOTICE This manuscript has been authored by employees of the Alliance for Sustainable Energy, LLC (“Alliance”) under Contract No. DE-AC36-08GO28308 with the U.S. Department of Energy (“DOE”). This report was prepared as an account of work sponsored by an agency of the United States government. Neither the United States government nor any agency thereof, nor any of their employees, makes any warranty, express or implied, or assumes any legal liability or responsibility for the accuracy, completeness, or usefulness of any information, apparatus, product, or process disclosed, or represents that its use would not infringe privately owned rights. Reference herein to any specific commercial product, process, or service by trade name, trademark, manufacturer, or otherwise does not necessarily constitute or imply its endorsement, recommendation, or favoring by the United States government or any agency thereof. The views and opinions of authors expressed herein do not necessarily state or reflect those of the United States government or any agency thereof.
Cover Photos: (left to right) PIX 16416, PIX 17423, PIX 16560, PIX 17613, PIX 17436, PIX 17721
Printed on paper containing at least 50% wastepaper, including 10% post consumer waste.
iii
Acknowledgments The National Renewable Energy Laboratory (NREL) thanks the U.S. Environmental Protection Agency (EPA) for its interest in securing NREL’s technical expertise. In particular, NREL and the assessment team for this project are grateful to the Former Fort Ord Army Base facility managers, engineers, and operators for their generous assistance and cooperation.
Special thanks go to Lura Matthews, Jessica Trice, Shea Jones, and Judy Huang from EPA; Katie Brown, AAAS Science & Technology Policy fellow hosted by EPA; and Jonathan Garcia and Darren McBain from the Fort Ord Reuse Authority for hosting the site visit.
iv
Executive Summary The U.S. Environmental Protection Agency (EPA), in accordance with the RE-Powering America’s Land initiative, selected the Former Fort Ord Army Base (FOAB) site in Marina, California, for a feasibility study of renewable energy production. The National Renewable Energy Laboratory (NREL) provided technical assistance for this project. The purpose of this report is to assess the site for a possible photovoltaic (PV) system installation and estimate the cost, performance, and site impacts of different PV options. In addition, the report recommends financing options that could assist in the implementation of a PV system at the site. This study did not assess environmental conditions at the site.
The 27,800 acre site was a major army training area from 1917–1991 and was added to the EPA Superfund Priorities List in 1990 due to ground water plumes, contaminated soil, and unexploded ordinance. In working with stakeholder groups, the Fort Ord Reuse Authority (FORA) has determined that there is interest in developing solar-energy-generating systems on the site. FORA identified the nine sites shown in Figure ES-1, and NREL completed a micro-climate analysis for PV production across FOAB to help determine the best solar resource and sites relative to coastal fog. Figure ES-2 shows lines of iso-insolation across FOAB that resulted from the micro-climate analysis.
v
Figure ES-1. FORA-identified solar sites
Image created using Google Earth
vi
Figure ES-2. Iso-insolation map of Former Fort Ord
Source: NREL
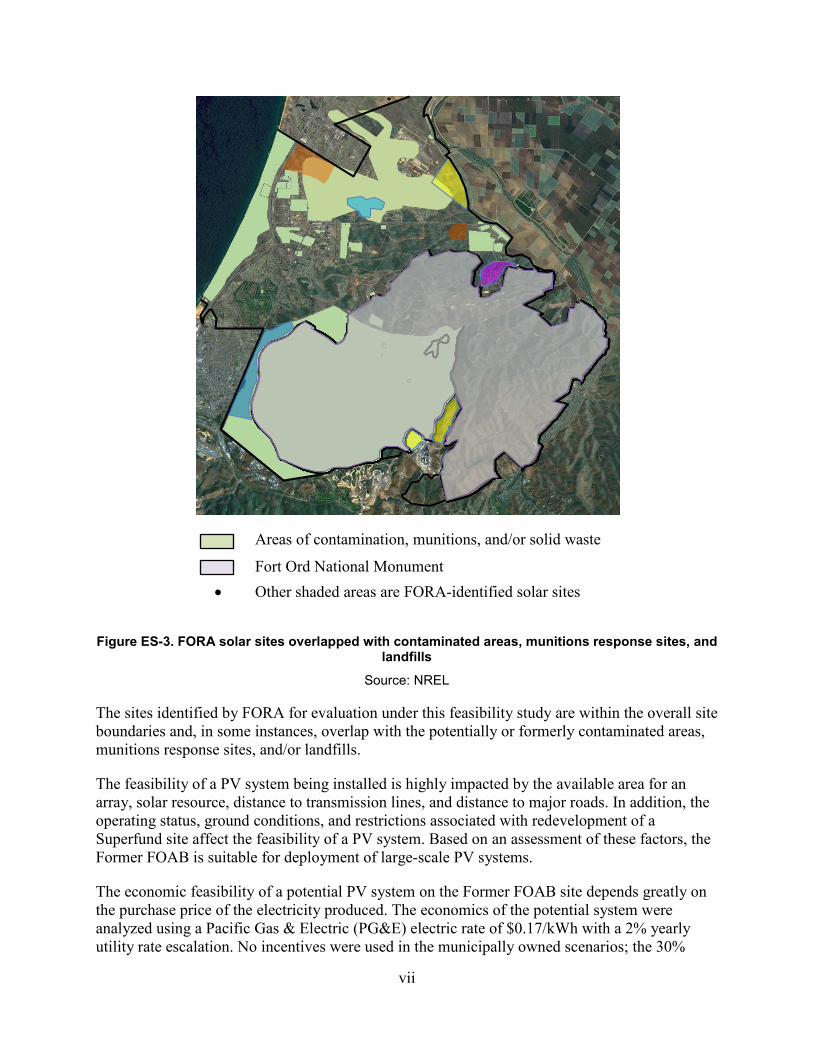
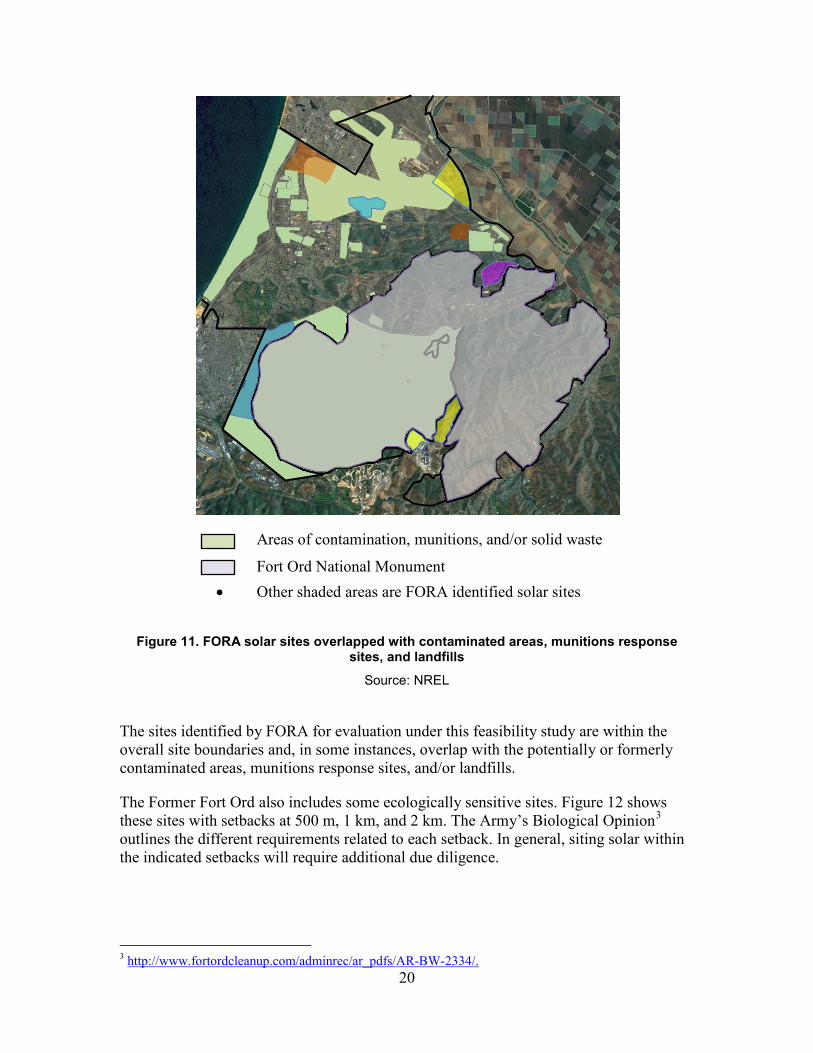
Typically, the EPA lists federal facilities, such as Fort Ord, as whole (“fence to fence”) to the National Priorities List. Within the boundaries of these Superfund sites, there are generally several areas with potential contamination that subsequently undergo remediation. As seen in Figure ES-3, the Fort Ord Superfund site has several areas with contamination, munitions, and/or solid waste.
4.75 kWh/m2/day
4.85 kWh/m2/day 4.95 kWh/m2/day
5.05 kWh/m2/day
vii
Figure ES-3. FORA solar sites overlapped with contaminated areas, munitions response sites, and landfills
Source: NREL
The sites identified by FORA for evaluation under this feasibility study are within the overall site boundaries and, in some instances, overlap with the potentially or formerly contaminated areas, munitions response sites, and/or landfills.
The feasibility of a PV system being installed is highly impacted by the available area for an array, solar resource, distance to transmission lines, and distance to major roads. In addition, the operating status, ground conditions, and restrictions associated with redevelopment of a Superfund site affect the feasibility of a PV system. Based on an assessment of these factors, the Former FOAB is suitable for deployment of large-scale PV systems.
The economic feasibility of a potential PV system on the Former FOAB site depends greatly on the purchase price of the electricity produced. The economics of the potential system were analyzed using a Pacific Gas & Electric (PG&E) electric rate of $0.17/kWh with a 2% yearly utility rate escalation. No incentives were used in the municipally owned scenarios; the 30%
Areas of contamination, munitions, and/or solid waste Fort Ord National Monument • Other shaded areas are FORA-identified solar sites
viii
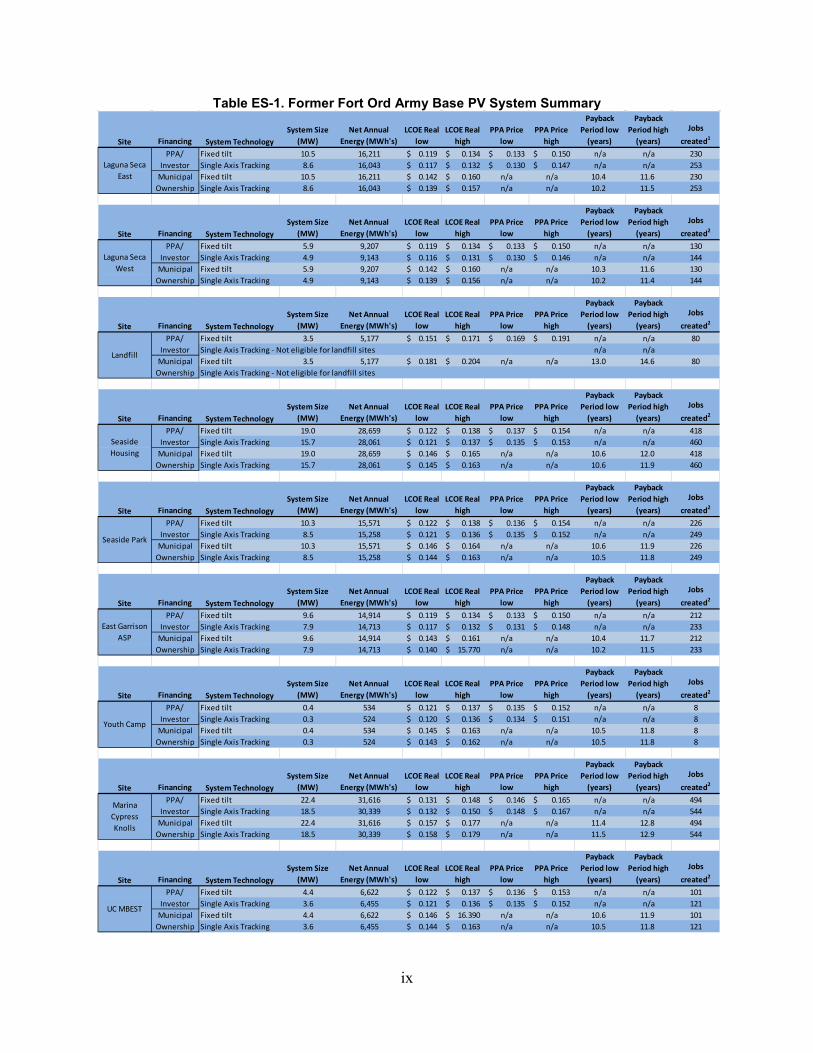
investment tax credit and MACRS depreciation were the only incentives used for the power purchase agreement (PPA) scenarios. Table ES-1 summarizes the system performance and economics of a potential system that would use all available areas that were surveyed at the Former FOAB site. The table shows the annual energy output from the system along with the number of average American households that could be powered off of such a system and estimated job creation.
As indicated in Table ES-1, the different sites are expected to have paybacks ranging from 10–13 years and a levelized cost of energy (LCOE) ranging from $0.13–$0.17/kWh. Most sites could accommodate a single-axis tracking system, but we recommend the landfill use a fixed-tilt ballasted system due to possible surface penetration restrictions. There are tracking ballasted systems, but they have not been deployed widely and therefore, they are not considered here. The PV system sites analyzed could produce a wide range of energy depending on actual installed system sizes. If all the sites are maximized for PV production, the total production is estimated to be 125,713 MWh/yr. The analysis includes the estimated cost of energy, expected installation cost, site solar resource, and existing federal incentives for the proposed PV systems. These savings and paybacks are deemed reasonable and as such, solar PV systems can represent viable reuse depending on each site’s restrictions. All results shown in Table ES-1 are based on maximizing system size based on 20° tilt for fixed-axis and 0° tilt for tracking systems. Energy production and economics were computed using System Advisor Model (SAM) software and jobs impact was analysed using Jobs and Economic Development Impact (JEDI) software.
The system economics presented in this analysis represent the best referenceable information available at the time of the analysis and therefore should be considered best estimates. Only a firm proposal developed by a solar installer or developer will provide a complete picture of the true economics of a system. Accordingly, there are two assumptions that should be addressed specifically. First, no California state or other local incentives were modeled in this economic analysis. At present, even though there does not appear to be incentives available in California, it is likely there will be more in the future that will improve system economics. Second, system cost is based on published data with adjustments for tracking and landfill applications based on industry research. Costs in the solar industry are changing more rapidly than the availability of published data; therefore, the proposed system cost from a solar developer might be considerably less than calculated in this report and could greatly improve system economics.
ix
Table ES-1. Former Fort Ord Army Base PV System Summary
Site Financing System TechnologySystem Size
(MW)Net Annual
Energy (MWh's)LCOE Real
lowLCOE Real
highPPA Price
lowPPA Price
high
Payback Period low
(years)
Payback Period high
(years)Jobs
created1
Fixed tilt 10.5 16,211 0.119$ 0.134$ 0.133$ 0.150$ n/a n/a 230Single Axis Tracking 8.6 16,043 0.117$ 0.132$ 0.130$ 0.147$ n/a n/a 253Fixed tilt 10.5 16,211 0.142$ 0.160$ n/a n/a 10.4 11.6 230Single Axis Tracking 8.6 16,043 0.139$ 0.157$ n/a n/a 10.2 11.5 253
Site Financing System TechnologySystem Size
(MW)Net Annual
Energy (MWh's)LCOE Real
lowLCOE Real
highPPA Price
lowPPA Price
high
Payback Period low
(years)
Payback Period high
(years)Jobs
created2
Fixed tilt 5.9 9,207 0.119$ 0.134$ 0.133$ 0.150$ n/a n/a 130Single Axis Tracking 4.9 9,143 0.116$ 0.131$ 0.130$ 0.146$ n/a n/a 144Fixed tilt 5.9 9,207 0.142$ 0.160$ n/a n/a 10.3 11.6 130Single Axis Tracking 4.9 9,143 0.139$ 0.156$ n/a n/a 10.2 11.4 144
Site Financing System TechnologySystem Size
(MW)Net Annual
Energy (MWh's)LCOE Real
lowLCOE Real
highPPA Price
lowPPA Price
high
Payback Period low
(years)
Payback Period high
(years)Jobs
created2
Fixed tilt 3.5 5,177 0.151$ 0.171$ 0.169$ 0.191$ n/a n/a 80Single Axis Tracking - Not eligible for landfill sites n/a n/aFixed tilt 3.5 5,177 0.181$ 0.204$ n/a n/a 13.0 14.6 80Single Axis Tracking - Not eligible for landfill sites
Site Financing System TechnologySystem Size
(MW)Net Annual
Energy (MWh's)LCOE Real
lowLCOE Real
highPPA Price
lowPPA Price
high
Payback Period low
(years)
Payback Period high
(years)Jobs
created2
Fixed tilt 19.0 28,659 0.122$ 0.138$ 0.137$ 0.154$ n/a n/a 418Single Axis Tracking 15.7 28,061 0.121$ 0.137$ 0.135$ 0.153$ n/a n/a 460Fixed tilt 19.0 28,659 0.146$ 0.165$ n/a n/a 10.6 12.0 418Single Axis Tracking 15.7 28,061 0.145$ 0.163$ n/a n/a 10.6 11.9 460
Site Financing System TechnologySystem Size
(MW)Net Annual
Energy (MWh's)LCOE Real
lowLCOE Real
highPPA Price
lowPPA Price
high
Payback Period low
(years)
Payback Period high
(years)Jobs
created2
Fixed tilt 10.3 15,571 0.122$ 0.138$ 0.136$ 0.154$ n/a n/a 226Single Axis Tracking 8.5 15,258 0.121$ 0.136$ 0.135$ 0.152$ n/a n/a 249Fixed tilt 10.3 15,571 0.146$ 0.164$ n/a n/a 10.6 11.9 226Single Axis Tracking 8.5 15,258 0.144$ 0.163$ n/a n/a 10.5 11.8 249
Site Financing System TechnologySystem Size
(MW)Net Annual
Energy (MWh's)LCOE Real
lowLCOE Real
highPPA Price
lowPPA Price
high
Payback Period low
(years)
Payback Period high
(years)Jobs
created2
Fixed tilt 9.6 14,914 0.119$ 0.134$ 0.133$ 0.150$ n/a n/a 212Single Axis Tracking 7.9 14,713 0.117$ 0.132$ 0.131$ 0.148$ n/a n/a 233Fixed tilt 9.6 14,914 0.143$ 0.161$ n/a n/a 10.4 11.7 212Single Axis Tracking 7.9 14,713 0.140$ 15.770$ n/a n/a 10.2 11.5 233
Site Financing System TechnologySystem Size
(MW)Net Annual
Energy (MWh's)LCOE Real
lowLCOE Real
highPPA Price
lowPPA Price
high
Payback Period low
(years)
Payback Period high
(years)Jobs
created2
Fixed tilt 0.4 534 0.121$ 0.137$ 0.135$ 0.152$ n/a n/a 8Single Axis Tracking 0.3 524 0.120$ 0.136$ 0.134$ 0.151$ n/a n/a 8Fixed tilt 0.4 534 0.145$ 0.163$ n/a n/a 10.5 11.8 8Single Axis Tracking 0.3 524 0.143$ 0.162$ n/a n/a 10.5 11.8 8
Site Financing System TechnologySystem Size
(MW)Net Annual
Energy (MWh's)LCOE Real
lowLCOE Real
highPPA Price
lowPPA Price
high
Payback Period low
(years)
Payback Period high
(years)Jobs
created2
Fixed tilt 22.4 31,616 0.131$ 0.148$ 0.146$ 0.165$ n/a n/a 494Single Axis Tracking 18.5 30,339 0.132$ 0.150$ 0.148$ 0.167$ n/a n/a 544Fixed tilt 22.4 31,616 0.157$ 0.177$ n/a n/a 11.4 12.8 494Single Axis Tracking 18.5 30,339 0.158$ 0.179$ n/a n/a 11.5 12.9 544
Site Financing System TechnologySystem Size
(MW)Net Annual
Energy (MWh's)LCOE Real
lowLCOE Real
highPPA Price
lowPPA Price
high
Payback Period low
(years)
Payback Period high
(years)Jobs
created2
Fixed tilt 4.4 6,622 0.122$ 0.137$ 0.136$ 0.153$ n/a n/a 101Single Axis Tracking 3.6 6,455 0.121$ 0.136$ 0.135$ 0.152$ n/a n/a 121Fixed tilt 4.4 6,622 0.146$ 16.390$ n/a n/a 10.6 11.9 101Single Axis Tracking 3.6 6,455 0.144$ 0.163$ n/a n/a 10.5 11.8 121
Laguna Seca East
UC MBEST
Marina Cypress Knolls
Youth Camp
Municipal Ownership
PPA/ Investor
PPA/ Investor
Municipal Ownership
PPA/ Investor
Municipal Ownership
PPA/ Investor
Municipal Ownership
PPA/ Investor
Municipal Ownership
Municipal Ownership
PPA/ Investor
Municipal Ownership
PPA/ Investor
Municipal Ownership
PPA/ Investor
Municipal Ownership
PPA/ Investor
East Garrison ASP
Seaside Park
Seaside Housing
Landfill
Laguna Seca West
x
Table of Contents 1 Study and Site Background ................................................................................................................. 1 2 Development of a PV System on Superfund Sites ............................................................................ 6 3 PV Systems ........................................................................................................................................... 8
3.1 PV Overview .................................................................................................................................... 8 3.2 Major System Components .............................................................................................................. 9
3.2.1 PV Module .......................................................................................................................... 9 3.2.2 Inverter .............................................................................................................................. 11 3.2.3 Balance-of-System Components ....................................................................................... 12 3.2.4 Operation and Maintenance .............................................................................................. 14
3.3 Siting Considerations ..................................................................................................................... 15 4 Proposed Installation Location Information .................................................................................... 16
4.1 Former Fort Ord Army Base PV Systems ..................................................................................... 16 4.2 Utility-Resource Considerations .................................................................................................... 21 4.3 Useable Acreage for PV System Installation ................................................................................. 23 4.4 PV Site Solar Resource .................................................................................................................. 23 4.5 Former Fort Ord Army Base Energy Usage .................................................................................. 26
4.5.1 Current Energy Use .......................................................................................................... 26 4.5.2 Net Metering ..................................................................................................................... 27 4.5.3 Virtual Net Metering ......................................................................................................... 28
5 Economics and Performance ............................................................................................................ 30 5.1 Assumptions and Input Data for Analysis ..................................................................................... 30 5.2 SAM-Forecasted Economic Performance ...................................................................................... 33 5.3 Job Analysis and Impact ................................................................................................................ 37 5.4 Financing Opportunities................................................................................................................. 38
5.4.1 Owner and Operator Financing ......................................................................................... 38 5.4.2 Third-Party Developers with Power Purchase Agreements .............................................. 38 5.4.3 Third-Party “Flip” Agreements......................................................................................... 39 5.4.4 Hybrid Financial Structures .............................................................................................. 39 5.4.5 Solar Services Agreement and Operating Lease ............................................................... 39 5.4.6 Sales/Leaseback ................................................................................................................ 40 5.4.7 Community Solar/Solar Gardens ...................................................................................... 40
6 Conclusions and Recommendations ............................................................................................... 42 Appendix A. System Size and Production .............................................................................................. 43 Appendix B. Results of the JEDI Model .................................................................................................. 45 Appendix C. Results of the System Advisor Model .............................................................................. 54
xi
List of Figures Figure ES-1. FORA-identified solar sites ........................................................................................v Figure ES-2. Iso-insolation map of Former Fort Ord .................................................................... vi Figure ES-3. FORA solar sites overlapped with contaminated areas, munitions response sites,
and landfills ............................................................................................................................. vii Figure 1. Global horizontal irradiance and production ....................................................................1 Figure 2. FORA-identified solar sites with GHI ..............................................................................2 Figure 3. Generation of electricity from a PV cell ...........................................................................8 Figure 4. Ground-mounted array diagram .......................................................................................9 Figure 5. Mono- and poly-crystalline solar panels ........................................................................10 Figure 6. Thin-film solar panels installed on (left) solar energy cover and (middle/right)
fixed-tilt mounting system .......................................................................................................11 Figure 7. String inverter .................................................................................................................12 Figure 8. Aerial view of the feasible areas for PV (colored) at the Former Fort Ord Army
Base site ...................................................................................................................................17 Figure 9. Views of the nine sites ....................................................................................................18 Figure 10. Iso-insolation map of Former Fort Ord ........................................................................19 Figure 11. FORA solar sites overlapped with contaminated areas, munitions response sites,
and landfills ..............................................................................................................................20 Figure 12. Ecologically sensitive area with setbacks .....................................................................21 Figure C-1. SAM results ................................................................................................................54
List of Tables Table ES-1. Former Fort Ord Army Base PV System Summary .................................................. ix Table 1. Site Classifications, Restrictions, and Development Plans for FORA-Identified Sites .....3 Table 2. FORA-Identified Site Ownership and PV-Related Characteristics ...................................4 Table 3. Energy Density by Panel and System ..............................................................................13 Table 4. FORA-Identified PV Site Areas ......................................................................................16 Table 5. FORA-Identified PV Sites Electrical Interconnection Options .......................................22 Table 6. Annual Production by Site per Kilowatt (kWh/kW) .......................................................24 Table 7. Max System Size (MW) ..................................................................................................24 Table 8. Production by Site Using Maximum System Size (MWH) .............................................25 Table 9. Current and Predicted Electricity Consumption ..............................................................26 Table 10. PG&E Electric Schedule A-1 Small General Service ...................................................27 Table 11. Current PG&E Electric Rates for Residential, Commercial, and Industrial ..................27 Table 12. Installed System Cost Assumptions ...............................................................................31 Table 13. Inputs Used in SAM Modeling ......................................................................................32 Table 14. PV System Summary .....................................................................................................34 Table 15. JEDI Analysis Assumptions ..........................................................................................37 Table A-1. System Size, Production, and Capacity Factor ............................................................43 Table B-1. JEDI Results Laguna Seca East Fixed Tilt ..................................................................45 Table B-2. JEDI Results Laguna Seca East Single-Axis Tracking ...............................................47 Table B-3. JEDI Results for Each FORA-Identified Site ..............................................................49
1
1 Study and Site Background The U.S. Environmental Protection Agency (EPA), in accordance with the RE-Powering America’s Land initiative, selected the Former Fort Ord Army Base (FOAB) site in Marina, California, for a feasibility study of renewable energy production. The National Renewable Energy Laboratory (NREL) provided technical assistance for this project. The purpose of this report is to assess the site for a possible photovoltaic (PV) system installation and estimate the cost, performance, and site impacts of different PV options. In addition, the report recommends financing options that could assist in the implementation of a PV system at the site. This study did not assess environmental conditions at the site.
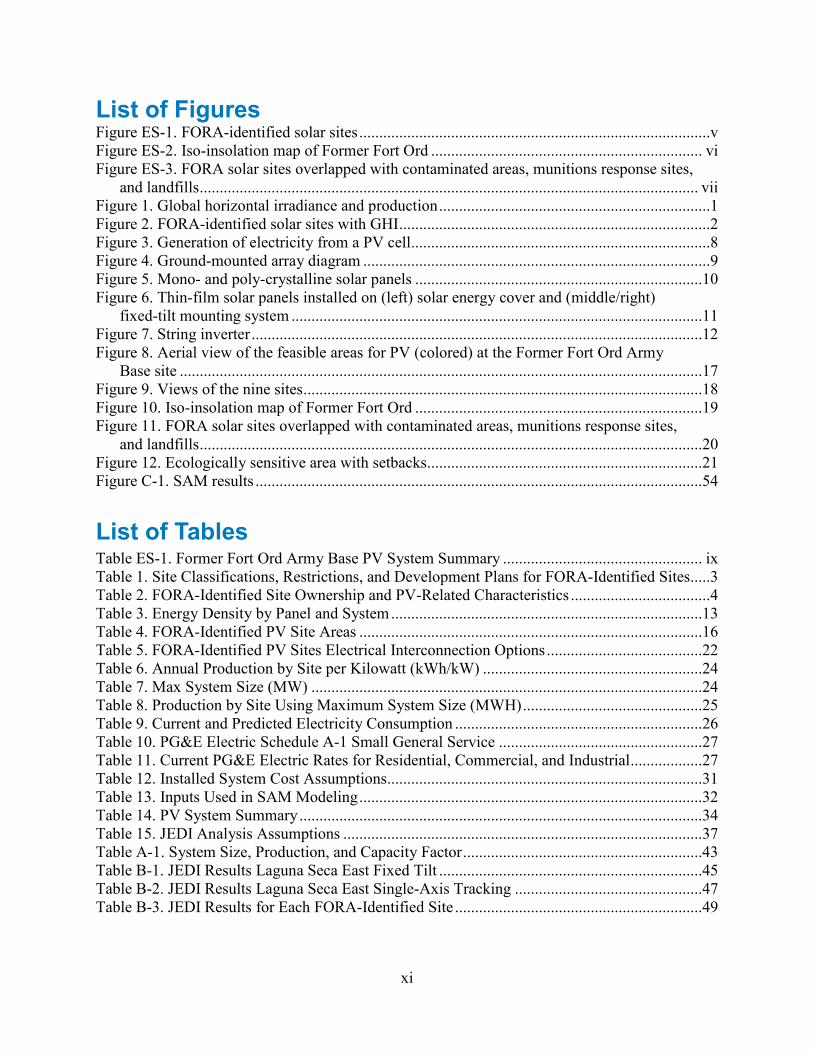
The Former FOAB is located in Marina, California. It is just east of Monterey Bay and west of Salinas on the Central Coast. Pacific Gas and Electric is the utility provider, and is one of the three major investor-owned utilities in the state. Due to the proximity to the Pacific Ocean, each of the nine selected sites have their own microclimate and are affected differently by fog. Figure 1 shows the amount of ground level horizontal irradiance and production, in kilowatt-hours per year, for each site.
Figure 1. Global horizontal irradiance and production
The Former FOAB site is approximately 27,800 acres and is located in Monterey County, which had a population of 415,000 in 2010. The site operated as an army base and was in operation from 1917–1991. Fort Ord was used for artillery and basic training. Much of the site has potential unexploded ordinance as well as toxic and hazardous waste. Contamination has been identified from leaking petroleum underground storage tanks, automotive chemicals, oil-waste separators, target ranges, and landfills. Since its closure
2
in 1991, the land is in the process of being transferred to multiple stakeholders, who are planning new commercial development and residential housing, as well as recreational and wildlife conservation. The Former FOAB has many hiking trails and recreational uses, and recently 14,651 acres was designated as a national monument.
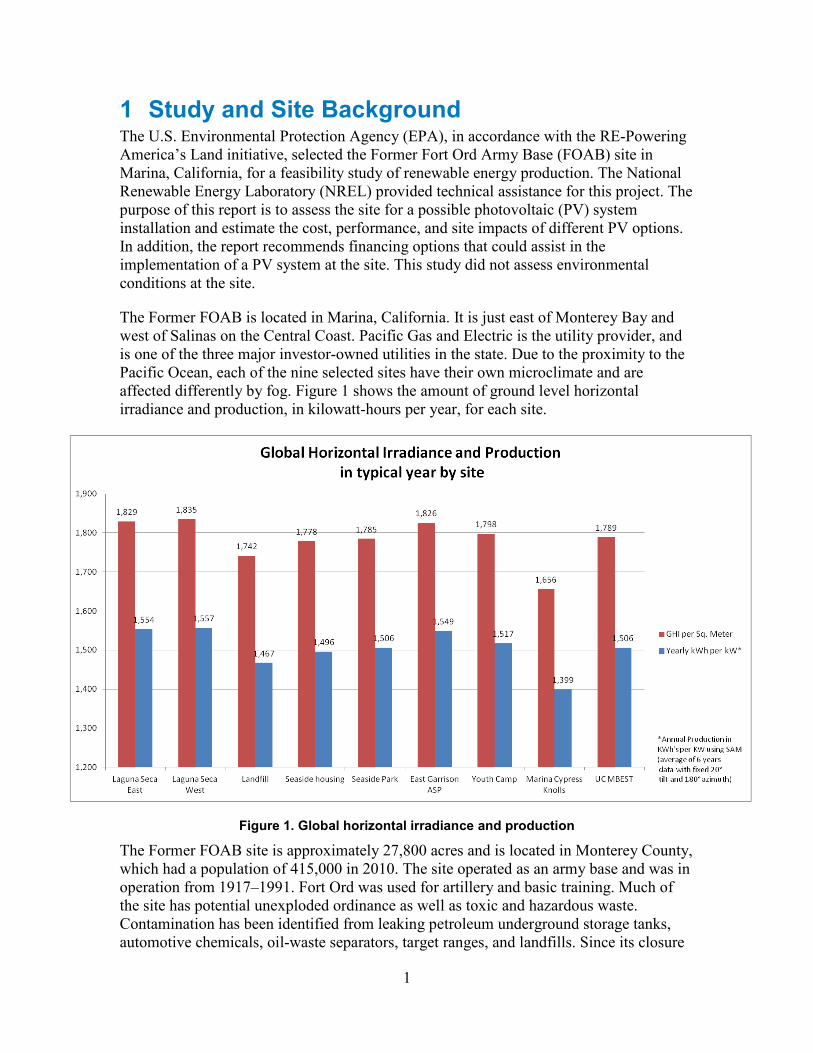
The map in Figure 2 shows the site layout with global horizontal insolation measurements for each potential site.
Figure 2. FORA-identified solar sites with GHI
Image created using Google Earth. GHI has units of kWh/m2-year.
Table 1 lists site classifications, contaminants, restrictions, and information about future development pertaining to Former FOAB.
3
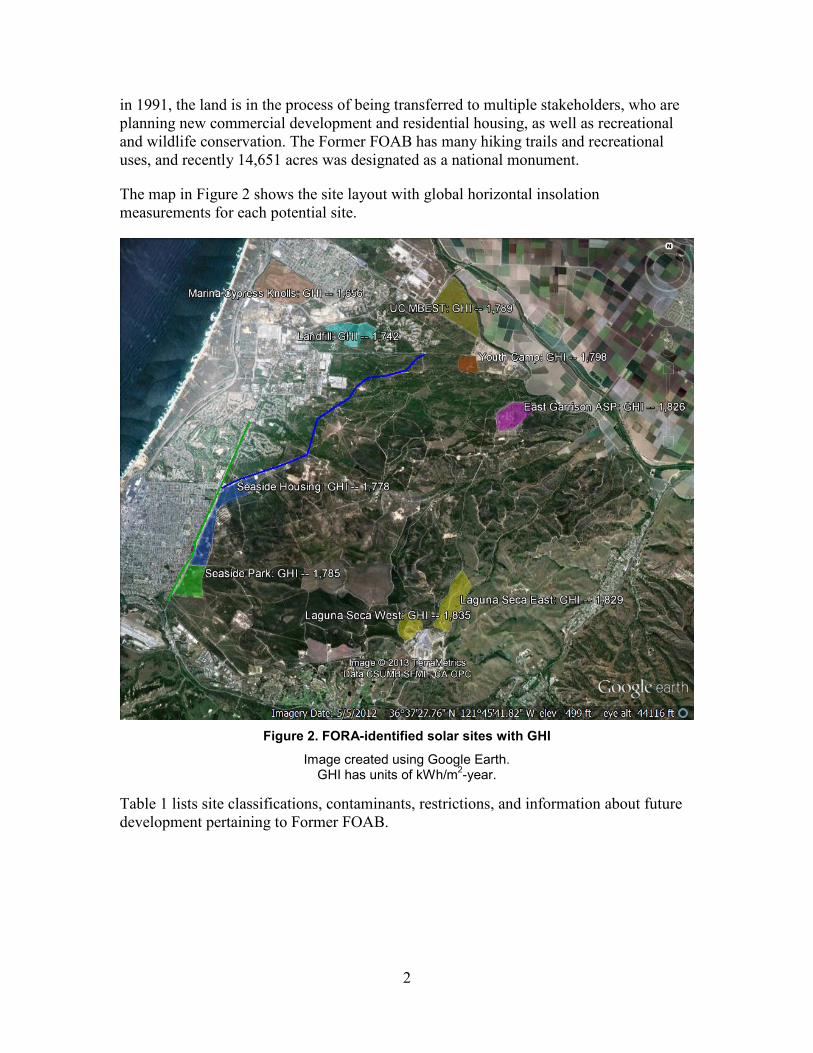
Table 1. Site Classifications, Restrictions, and Development Plans for FORA-Identified Sites
Site Classification Restrictions Future Development
Laguna Seca East
Munitions Response Area, 14A, IRP Site 39
High degree of slope; soil covenants apply
when soils are moved. Not the best for ground mount; if
development occurs, rooftop mount is recommended
“Open space/recreation” (includes commercial
recreation, educational facilities, and certain
other uses)
Laguna Seca West
Munitions Response Area, 47, IRP Site 39
Soil covenants apply when soils are moved
“Open space/recreation” (includes commercial
recreation, educational facilities, and certain
other uses)
Landfill Hazardous and Toxic Waste, IRP Site OU2
Landfill cap restricts depth of ground
penetration-ballasted system only
Habitat management (allows infrastructure
services and facilities; 81 acres allowed
development and 227 acres habitat)
Seaside Housing
Munitions Response Area, 15 SEA 02, IRP
Site 39
ESCA program sites have covenants
requiring a management program
and state (DTSC) regulatory signoff whenever certain
quantities of soil are to be moved. Good for rooftop mounting.
Conference center/residential
development in future
Seaside Park
Munitions Response Area, 15 SEA 01, IRP
Site 39 ESCA program site Future use is a park
East Garrison
ASP
Future East Garrison Munitions Response
Area (42 &11)
ESCA program site; about 40% useable
Mixed use land use designation in Base
Reuse Plan
Youth Camp Other
Potential shading from tall trees in some
areas. Small area for placement of ground-
mounted system
Public facility/institutional
4
Marina Cypress Knolls
Other
Slopes may limit areas for ground-mounted
PV. Solar could go on rooftops
712 unit entitled senior housing project, being repackaged for new
development proposals
UC MBEST Other
None identified. However,
development on the majority of the overall site has not yet been
built or designed
Mixed use land use designation in Base
Reuse Plan
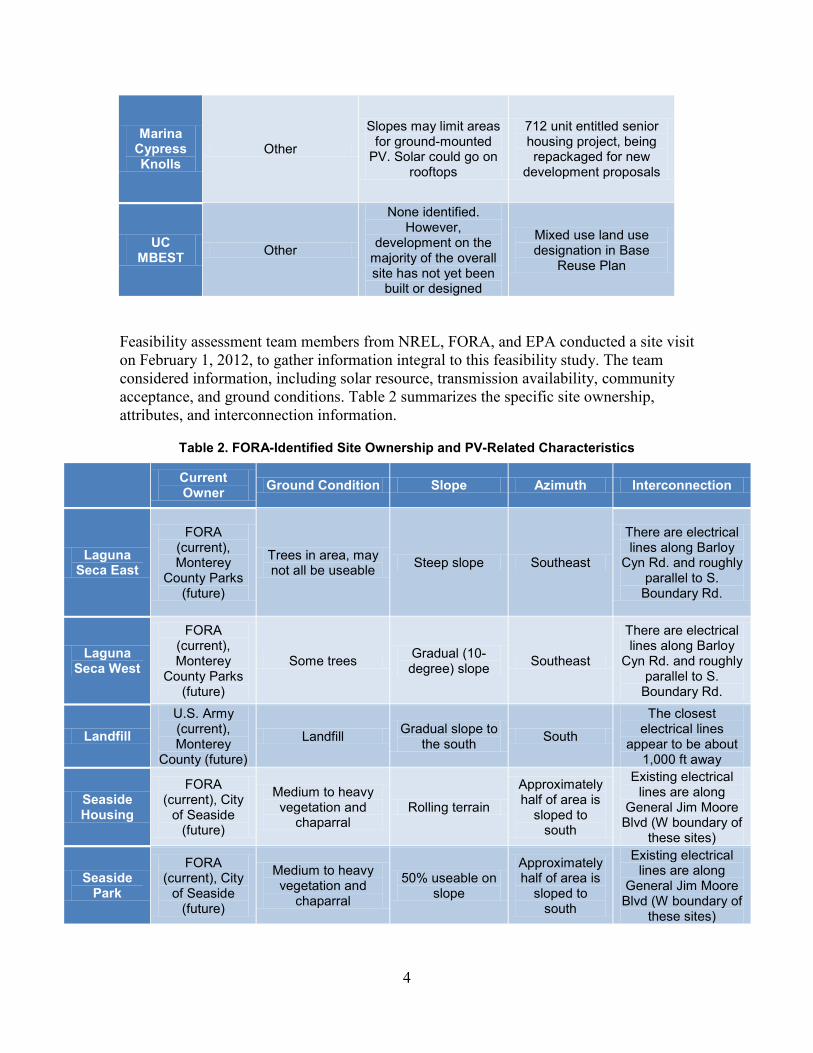
Feasibility assessment team members from NREL, FORA, and EPA conducted a site visit on February 1, 2012, to gather information integral to this feasibility study. The team considered information, including solar resource, transmission availability, community acceptance, and ground conditions. Table 2 summarizes the specific site ownership, attributes, and interconnection information.
Table 2. FORA-Identified Site Ownership and PV-Related Characteristics
Current Owner Ground Condition Slope Azimuth Interconnection
Laguna Seca East
FORA (current), Monterey
County Parks (future)
Trees in area, may not all be useable Steep slope Southeast
There are electrical lines along Barloy
Cyn Rd. and roughly parallel to S.
Boundary Rd.
Laguna Seca West
FORA (current), Monterey
County Parks (future)
Some trees Gradual (10-degree) slope Southeast
There are electrical lines along Barloy
Cyn Rd. and roughly parallel to S.
Boundary Rd.
Landfill U.S. Army (current), Monterey
County (future)
Landfill Gradual slope to the south South
The closest electrical lines
appear to be about 1,000 ft away
Seaside Housing
FORA (current), City
of Seaside (future)
Medium to heavy vegetation and
chaparral Rolling terrain
Approximately half of area is
sloped to south
Existing electrical lines are along
General Jim Moore Blvd (W boundary of
these sites)
Seaside Park
FORA (current), City
of Seaside (future)
Medium to heavy vegetation and
chaparral
50% useable on slope
Approximately half of area is
sloped to south
Existing electrical lines are along
General Jim Moore Blvd (W boundary of
these sites)
5
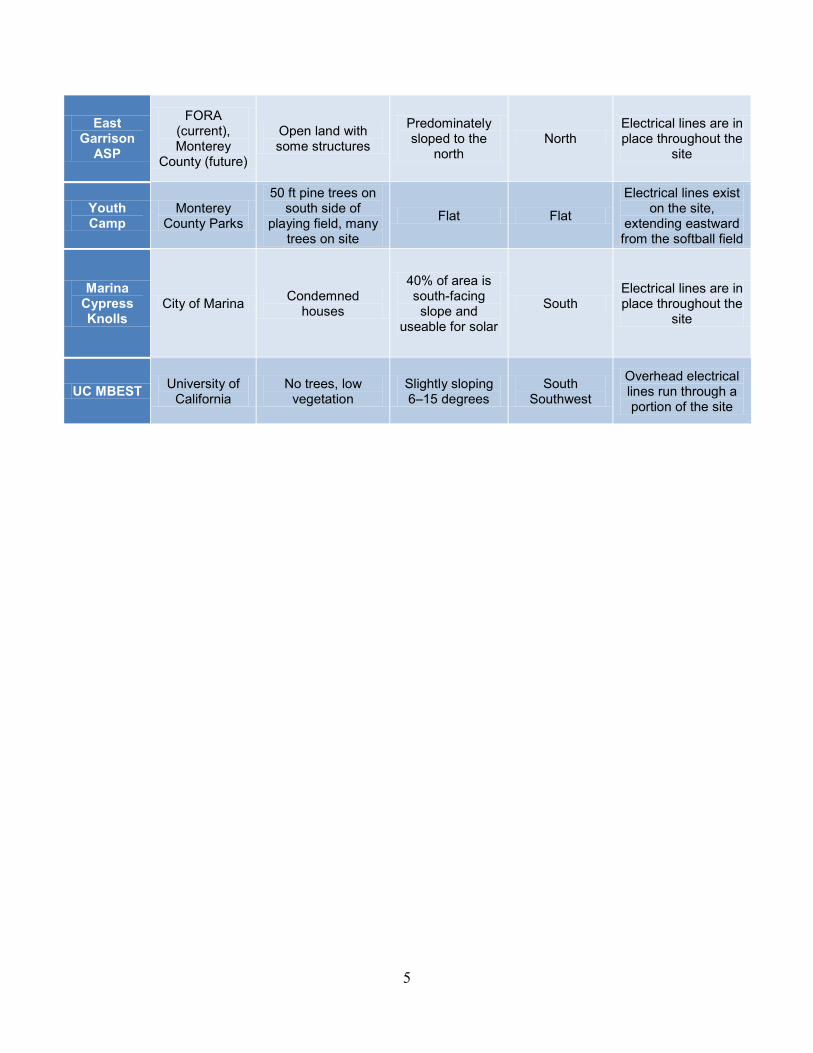
East Garrison
ASP
FORA (current), Monterey
County (future)
Open land with some structures
Predominately sloped to the
north North
Electrical lines are in place throughout the
site
Youth Camp
Monterey County Parks
50 ft pine trees on south side of
playing field, many trees on site
Flat Flat
Electrical lines exist on the site,
extending eastward from the softball field
Marina Cypress Knolls
City of Marina Condemned houses
40% of area is south-facing slope and
useable for solar
South Electrical lines are in place throughout the
site
UC MBEST University of California
No trees, low vegetation
Slightly sloping 6–15 degrees
South Southwest
Overhead electrical lines run through a portion of the site
6
2 Development of a PV System on Superfund Sites
Through the RE-Powering America’s Lands initiative, EPA has identified several benefits for siting solar PV facilities on potentially contaminated lands, landfills, and munitions sites, noting that they:
• Can be developed in place of limited greenfields, preserving the land carbon sink • Could have environmental conditions that are not well suited for commercial or
residential redevelopment, but might be adequately zoned for renewable energy • Generally are located near existing roads and energy transmission or distribution
infrastructure • Could provide an economically viable reuse for sites that have potential
significant cleanup costs or low real estate development demand • Can provide job opportunities in urban and rural communities • Can advance cleaner and more cost-effective energy technologies and reduce the
environmental impacts of energy systems (e.g., reduce greenhouse gas emissions).
By taking advantage of these potential benefits, PV can provide a viable, beneficial reuse—in many cases, generating significant revenue on a site that would otherwise go unused.
The Former FOAB is owned by multiple groups who are interested in potential revenue flows on the site. For many Superfund sites, the local community has significant interest in the redevelopment of the area and community engagement is critical to match future reuse options to the community’s vision for the area.
Understanding opportunities studied by similar sites demonstrates the potential for PV system development. PV has been successful at other EPA cleanup sites, such as the 2-MW plant at Fort Carson, Colorado, which uses thin-film PV modules on 15 acres of decommissioned landfill. Also, Nellis Air Force Base in Nevada has installed 14 MW of crystalline solar on a landfill to power 25% of the base’s energy needs.
The subject site has potential to be used for other functions beyond the solar PV systems proposed in this report. Any potential use should align with the community vision for the site and should work to enhance the overall utility of the property.
There are many compelling reasons to consider moving toward renewable energy sources for power generation instead of fossil fuels, including:
• Renewable energy sources offer a sustainable energy option in the broader energy portfolio
• Renewable energy can have a net-positive effect on human health and the environment
• Deployment of renewable energy bolsters national energy independence and increases domestic energy security
7
• Fluctuating electric costs can be mitigated by locking in electricity rates through long-term power purchase agreements (PPAs) linked to renewable energy systems
• Generating energy without harmful emissions or waste products can be accomplished through renewable energy sources
• PV significantly reduces water consumption
• Installing renewable energy can help demonstrate community leadership and have a positive impact on marketing the area.
8
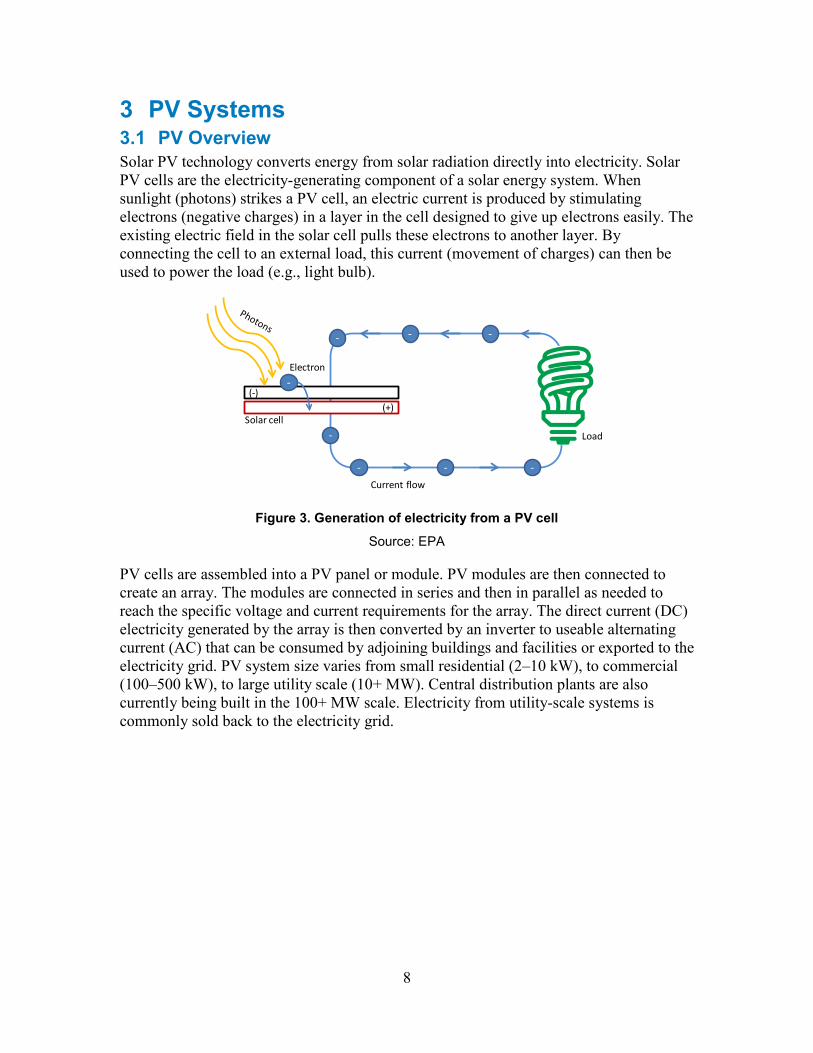
3 PV Systems 3.1 PV Overview Solar PV technology converts energy from solar radiation directly into electricity. Solar PV cells are the electricity-generating component of a solar energy system. When sunlight (photons) strikes a PV cell, an electric current is produced by stimulating electrons (negative charges) in a layer in the cell designed to give up electrons easily. The existing electric field in the solar cell pulls these electrons to another layer. By connecting the cell to an external load, this current (movement of charges) can then be used to power the load (e.g., light bulb).
Figure 3. Generation of electricity from a PV cell
Source: EPA
PV cells are assembled into a PV panel or module. PV modules are then connected to create an array. The modules are connected in series and then in parallel as needed to reach the specific voltage and current requirements for the array. The direct current (DC) electricity generated by the array is then converted by an inverter to useable alternating current (AC) that can be consumed by adjoining buildings and facilities or exported to the electricity grid. PV system size varies from small residential (2–10 kW), to commercial (100–500 kW), to large utility scale (10+ MW). Central distribution plants are also currently being built in the 100+ MW scale. Electricity from utility-scale systems is commonly sold back to the electricity grid.
(-)(+)
-
- -
-Electron
Current flow
-
Solar cell
- - -
Load
9
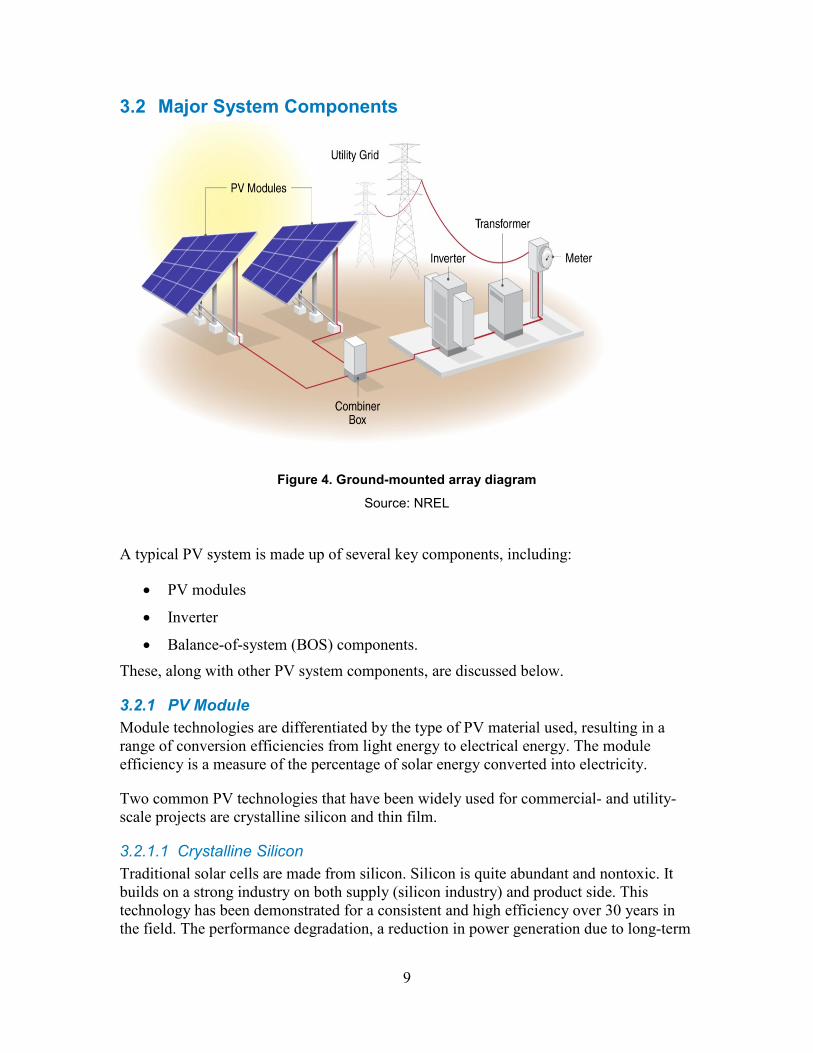
3.2 Major System Components
Figure 4. Ground-mounted array diagram
Source: NREL
A typical PV system is made up of several key components, including:
• PV modules
• Inverter
• Balance-of-system (BOS) components. These, along with other PV system components, are discussed below.
3.2.1 PV Module Module technologies are differentiated by the type of PV material used, resulting in a range of conversion efficiencies from light energy to electrical energy. The module efficiency is a measure of the percentage of solar energy converted into electricity.
Two common PV technologies that have been widely used for commercial- and utility-scale projects are crystalline silicon and thin film.
3.2.1.1 Crystalline Silicon Traditional solar cells are made from silicon. Silicon is quite abundant and nontoxic. It builds on a strong industry on both supply (silicon industry) and product side. This technology has been demonstrated for a consistent and high efficiency over 30 years in the field. The performance degradation, a reduction in power generation due to long-term
10
exposure, is under 1% per year. Silicon modules have a lifespan range of 25–30 years but can keep producing energy beyond this range.
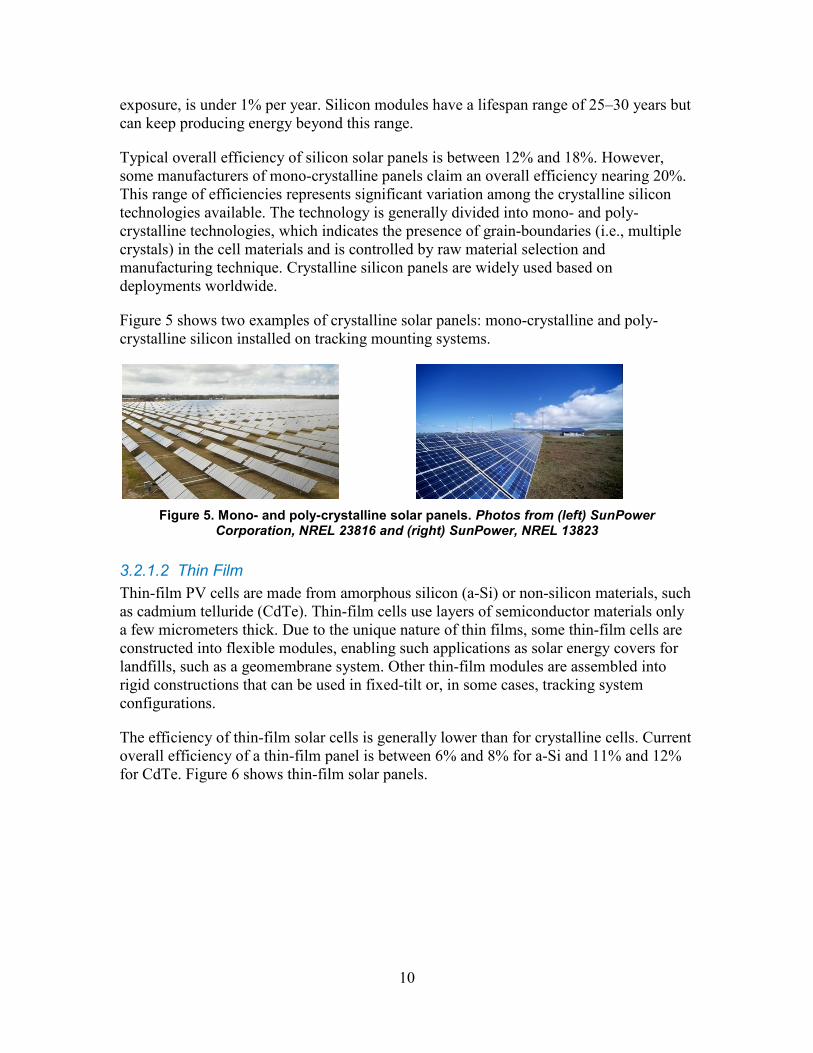
Typical overall efficiency of silicon solar panels is between 12% and 18%. However, some manufacturers of mono-crystalline panels claim an overall efficiency nearing 20%. This range of efficiencies represents significant variation among the crystalline silicon technologies available. The technology is generally divided into mono- and poly-crystalline technologies, which indicates the presence of grain-boundaries (i.e., multiple crystals) in the cell materials and is controlled by raw material selection and manufacturing technique. Crystalline silicon panels are widely used based on deployments worldwide.
Figure 5 shows two examples of crystalline solar panels: mono-crystalline and poly-crystalline silicon installed on tracking mounting systems.
Figure 5. Mono- and poly-crystalline solar panels. Photos from (left) SunPower Corporation, NREL 23816 and (right) SunPower, NREL 13823
3.2.1.2 Thin Film Thin-film PV cells are made from amorphous silicon (a-Si) or non-silicon materials, such as cadmium telluride (CdTe). Thin-film cells use layers of semiconductor materials only a few micrometers thick. Due to the unique nature of thin films, some thin-film cells are constructed into flexible modules, enabling such applications as solar energy covers for landfills, such as a geomembrane system. Other thin-film modules are assembled into rigid constructions that can be used in fixed-tilt or, in some cases, tracking system configurations.
The efficiency of thin-film solar cells is generally lower than for crystalline cells. Current overall efficiency of a thin-film panel is between 6% and 8% for a-Si and 11% and 12% for CdTe. Figure 6 shows thin-film solar panels.
11
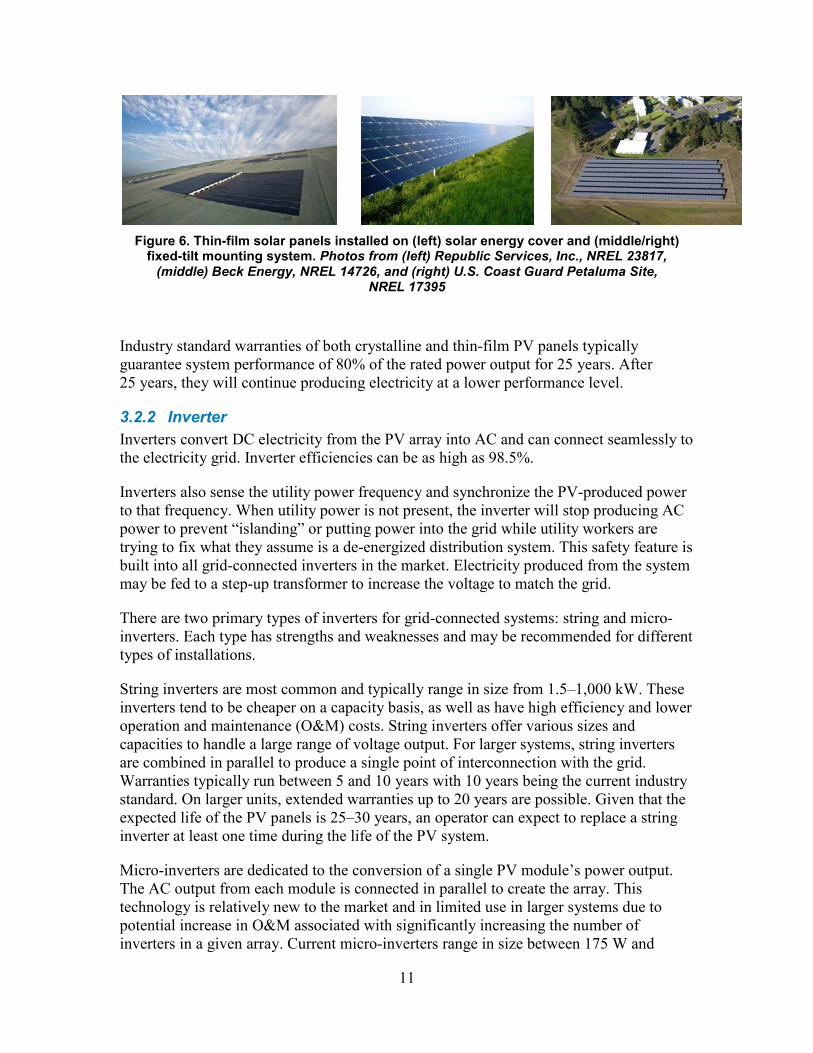
Figure 6. Thin-film solar panels installed on (left) solar energy cover and (middle/right)
fixed-tilt mounting system. Photos from (left) Republic Services, Inc., NREL 23817, (middle) Beck Energy, NREL 14726, and (right) U.S. Coast Guard Petaluma Site,
NREL 17395
Industry standard warranties of both crystalline and thin-film PV panels typically guarantee system performance of 80% of the rated power output for 25 years. After 25 years, they will continue producing electricity at a lower performance level.
3.2.2 Inverter Inverters convert DC electricity from the PV array into AC and can connect seamlessly to the electricity grid. Inverter efficiencies can be as high as 98.5%.
Inverters also sense the utility power frequency and synchronize the PV-produced power to that frequency. When utility power is not present, the inverter will stop producing AC power to prevent “islanding” or putting power into the grid while utility workers are trying to fix what they assume is a de-energized distribution system. This safety feature is built into all grid-connected inverters in the market. Electricity produced from the system may be fed to a step-up transformer to increase the voltage to match the grid.
There are two primary types of inverters for grid-connected systems: string and micro-inverters. Each type has strengths and weaknesses and may be recommended for different types of installations.
String inverters are most common and typically range in size from 1.5–1,000 kW. These inverters tend to be cheaper on a capacity basis, as well as have high efficiency and lower operation and maintenance (O&M) costs. String inverters offer various sizes and capacities to handle a large range of voltage output. For larger systems, string inverters are combined in parallel to produce a single point of interconnection with the grid. Warranties typically run between 5 and 10 years with 10 years being the current industry standard. On larger units, extended warranties up to 20 years are possible. Given that the expected life of the PV panels is 25–30 years, an operator can expect to replace a string inverter at least one time during the life of the PV system.
Micro-inverters are dedicated to the conversion of a single PV module’s power output. The AC output from each module is connected in parallel to create the array. This technology is relatively new to the market and in limited use in larger systems due to potential increase in O&M associated with significantly increasing the number of inverters in a given array. Current micro-inverters range in size between 175 W and
12
380 W. These inverters can be the most expensive option per watt of capacity. Warranties range from 10–20 years. Small projects with irregular modules and shading issues typically benefit from micro-inverters.
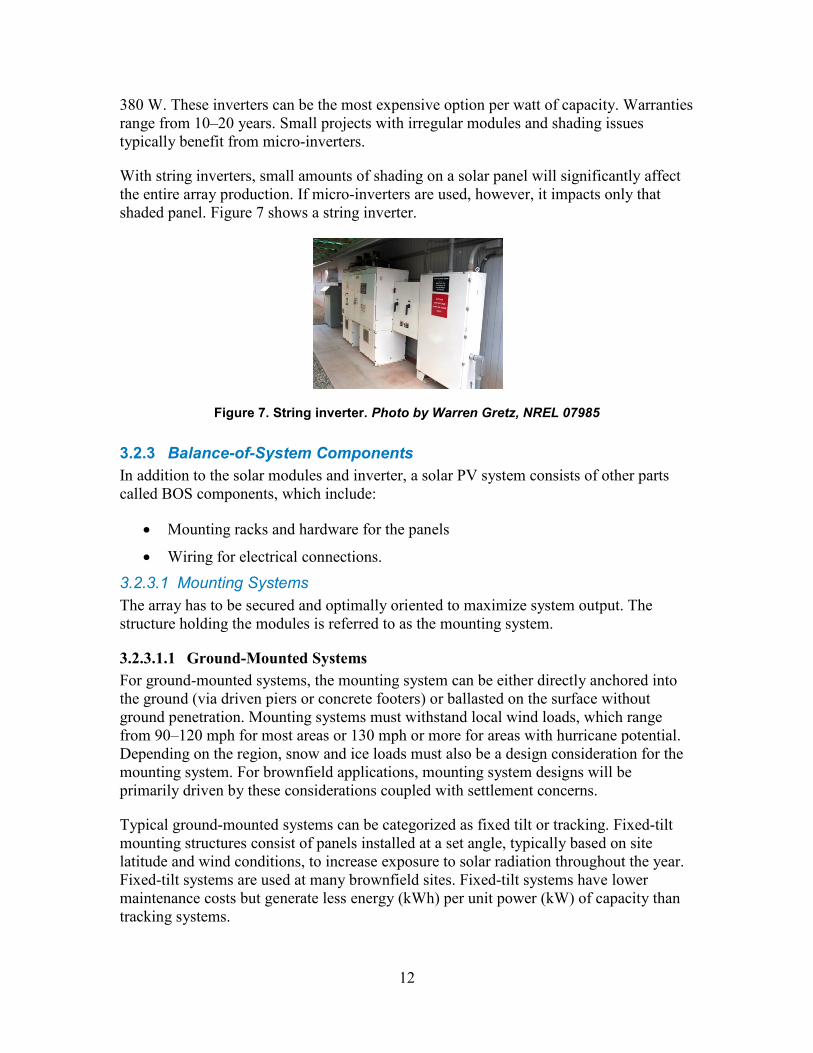
With string inverters, small amounts of shading on a solar panel will significantly affect the entire array production. If micro-inverters are used, however, it impacts only that shaded panel. Figure 7 shows a string inverter.
Figure 7. String inverter. Photo by Warren Gretz, NREL 07985
3.2.3 Balance-of-System Components In addition to the solar modules and inverter, a solar PV system consists of other parts called BOS components, which include:
• Mounting racks and hardware for the panels
• Wiring for electrical connections.
3.2.3.1 Mounting Systems The array has to be secured and optimally oriented to maximize system output. The structure holding the modules is referred to as the mounting system.
3.2.3.1.1 Ground-Mounted Systems For ground-mounted systems, the mounting system can be either directly anchored into the ground (via driven piers or concrete footers) or ballasted on the surface without ground penetration. Mounting systems must withstand local wind loads, which range from 90–120 mph for most areas or 130 mph or more for areas with hurricane potential. Depending on the region, snow and ice loads must also be a design consideration for the mounting system. For brownfield applications, mounting system designs will be primarily driven by these considerations coupled with settlement concerns.
Typical ground-mounted systems can be categorized as fixed tilt or tracking. Fixed-tilt mounting structures consist of panels installed at a set angle, typically based on site latitude and wind conditions, to increase exposure to solar radiation throughout the year. Fixed-tilt systems are used at many brownfield sites. Fixed-tilt systems have lower maintenance costs but generate less energy (kWh) per unit power (kW) of capacity than tracking systems.
13
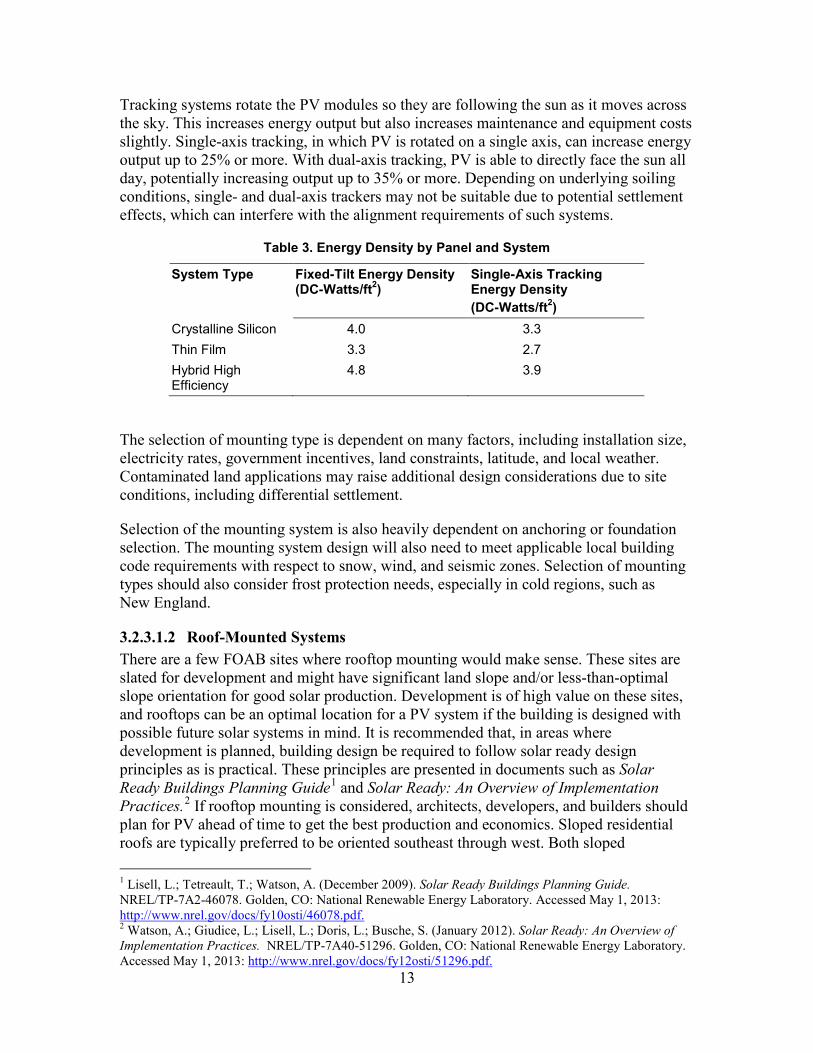
Tracking systems rotate the PV modules so they are following the sun as it moves across the sky. This increases energy output but also increases maintenance and equipment costs slightly. Single-axis tracking, in which PV is rotated on a single axis, can increase energy output up to 25% or more. With dual-axis tracking, PV is able to directly face the sun all day, potentially increasing output up to 35% or more. Depending on underlying soiling conditions, single- and dual-axis trackers may not be suitable due to potential settlement effects, which can interfere with the alignment requirements of such systems.
Table 3. Energy Density by Panel and System
System Type Fixed-Tilt Energy Density (DC-Watts/ft2)
Single-Axis Tracking Energy Density (DC-Watts/ft2)
Crystalline Silicon 4.0 3.3 Thin Film 3.3 2.7 Hybrid High Efficiency
4.8 3.9
The selection of mounting type is dependent on many factors, including installation size, electricity rates, government incentives, land constraints, latitude, and local weather. Contaminated land applications may raise additional design considerations due to site conditions, including differential settlement.
Selection of the mounting system is also heavily dependent on anchoring or foundation selection. The mounting system design will also need to meet applicable local building code requirements with respect to snow, wind, and seismic zones. Selection of mounting types should also consider frost protection needs, especially in cold regions, such as New England.
3.2.3.1.2 Roof-Mounted Systems There are a few FOAB sites where rooftop mounting would make sense. These sites are slated for development and might have significant land slope and/or less-than-optimal slope orientation for good solar production. Development is of high value on these sites, and rooftops can be an optimal location for a PV system if the building is designed with possible future solar systems in mind. It is recommended that, in areas where development is planned, building design be required to follow solar ready design principles as is practical. These principles are presented in documents such as Solar Ready Buildings Planning Guide1 and Solar Ready: An Overview of Implementation Practices.2 If rooftop mounting is considered, architects, developers, and builders should plan for PV ahead of time to get the best production and economics. Sloped residential roofs are typically preferred to be oriented southeast through west. Both sloped 1 Lisell, L.; Tetreault, T.; Watson, A. (December 2009). Solar Ready Buildings Planning Guide. NREL/TP-7A2-46078. Golden, CO: National Renewable Energy Laboratory. Accessed May 1, 2013: http://www.nrel.gov/docs/fy10osti/46078.pdf. 2 Watson, A.; Giudice, L.; Lisell, L.; Doris, L.; Busche, S. (January 2012). Solar Ready: An Overview of Implementation Practices. NREL/TP-7A40-51296. Golden, CO: National Renewable Energy Laboratory. Accessed May 1, 2013: http://www.nrel.gov/docs/fy12osti/51296.pdf.
14
residential roofs and flat commercial roofs should be free of obstructions, such as chimneys and vents, and also be free from shading by neighboring trees and buildings. Planning ahead of time can significantly reduce solar installation costs and improve lifetime output.
3.2.3.2 Wiring for Electrical Connections Electrical connections, including wiring, disconnect switches, fuses, and breakers, are required to meet electrical code (e.g., NEC Article 690) for both safety and equipment protection.
In most traditional applications, wiring from (1) the arrays to inverters and (2) inverters to point of interconnection is generally run as direct burial through trenches. In landfill applications, this wiring may be required to run through above-ground conduit due to restrictions with cap penetration or other concerns. Therefore, developers should consider noting any such restrictions, if applicable, in requests for proposals (RFPs) in order to improve overall bid accuracy. Similarly, it is recommended that PV system vendors reflect these costs in the quote when costing out the overall system.
3.2.3.3 PV System Monitoring For reliable functioning and maximum yield of a PV system, monitoring is essential. It can be as simple as reading values, such as produced AC power, daily kilowatt-hours, and cumulative kilowatt-hours, locally on an LCD display on the inverter. For more sophisticated monitoring and control purposes, environmental data, such as module temperature, ambient temperature, solar radiation, and wind speed, can be collected. Remote control and monitoring can be performed via various remote connections. Systems can send alerts and status messages to the control center or user. Data can be stored in the inverter’s memory or in external data loggers for further system analysis. Collection of this basic information is standard for solar systems and not unique to landfill applications.
Weather stations are typically installed in large-scale systems. Weather data, such as solar radiation and temperature, can be used to predict energy production, enabling comparison of the target and actual system output and performance and identification of under-performing arrays. Operators may also use this data to identify, for example, required maintenance, shade on panels, and accumulating dirt on panels. Monitoring system data can also be used for outreach and education. This can be achieved with publicly available, online displays; wall-mounted systems; or even smartphone applications.
3.2.4 Operation and Maintenance PV panels typically have a 25-year performance warranty. Inverters, which come standard with a 5- or 10-year warranty (extended warranties available), would be expected to last 10–15 years. System performance should be verified on a vendor-provided website. Wire and rack connections should be checked annually. This economic analysis uses an annual O&M cost computed as $20/kW/yr, which is based on the historical O&M costs of installed fixed-axis, grid-tied PV systems. In addition, the system should expect a replacement of system inverters in year 15 at a cost of $0.25/W.
15
3.3 Siting Considerations PV modules are very sensitive to shading. When shaded (either partially or fully), the panel is unable to optimally collect the high-energy beam radiation from the sun. As explained above, PV modules are made up of many individual cells that all produce a small amount of current and voltage. These individual cells are connected in series to produce a larger voltage. If an individual cell is shaded, it acts as resistance to the whole series circuit, impeding current flow and dissipating power rather than producing it.
Sites that are level, open, and clear of obstructions are the best for solar PV systems. Several FOAB sites have significant vegetation on them and oak trees are a particular concern with some stakeholder groups. The following section will address system siting at each site.
16
4 Proposed Installation Location Information This section summarizes the findings of the NREL solar assessment site visit on February 1, 2012.
4.1 Former Fort Ord Army Base PV Systems As discussed in Section 1, the Former FOAB site is managed by FORA and other local stakeholders.
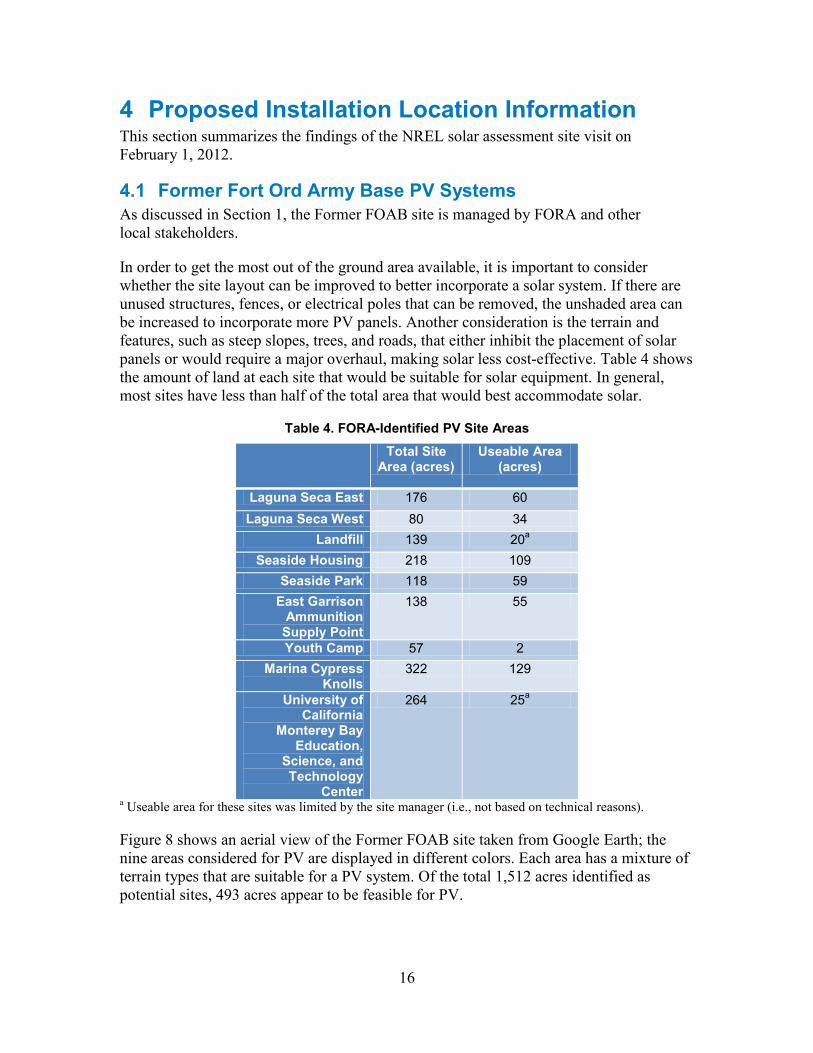
In order to get the most out of the ground area available, it is important to consider whether the site layout can be improved to better incorporate a solar system. If there are unused structures, fences, or electrical poles that can be removed, the unshaded area can be increased to incorporate more PV panels. Another consideration is the terrain and features, such as steep slopes, trees, and roads, that either inhibit the placement of solar panels or would require a major overhaul, making solar less cost-effective. Table 4 shows the amount of land at each site that would be suitable for solar equipment. In general, most sites have less than half of the total area that would best accommodate solar.
Table 4. FORA-Identified PV Site Areas
Total Site Area (acres)
Useable Area (acres)
Laguna Seca East 176 60 Laguna Seca West 80 34
Landfill 139 20a Seaside Housing 218 109
Seaside Park 118 59 East Garrison
Ammunition Supply Point
138 55
Youth Camp 57 2 Marina Cypress
Knolls 322 129
University of California
Monterey Bay Education,
Science, and Technology
Center
264 25a
a Useable area for these sites was limited by the site manager (i.e., not based on technical reasons).
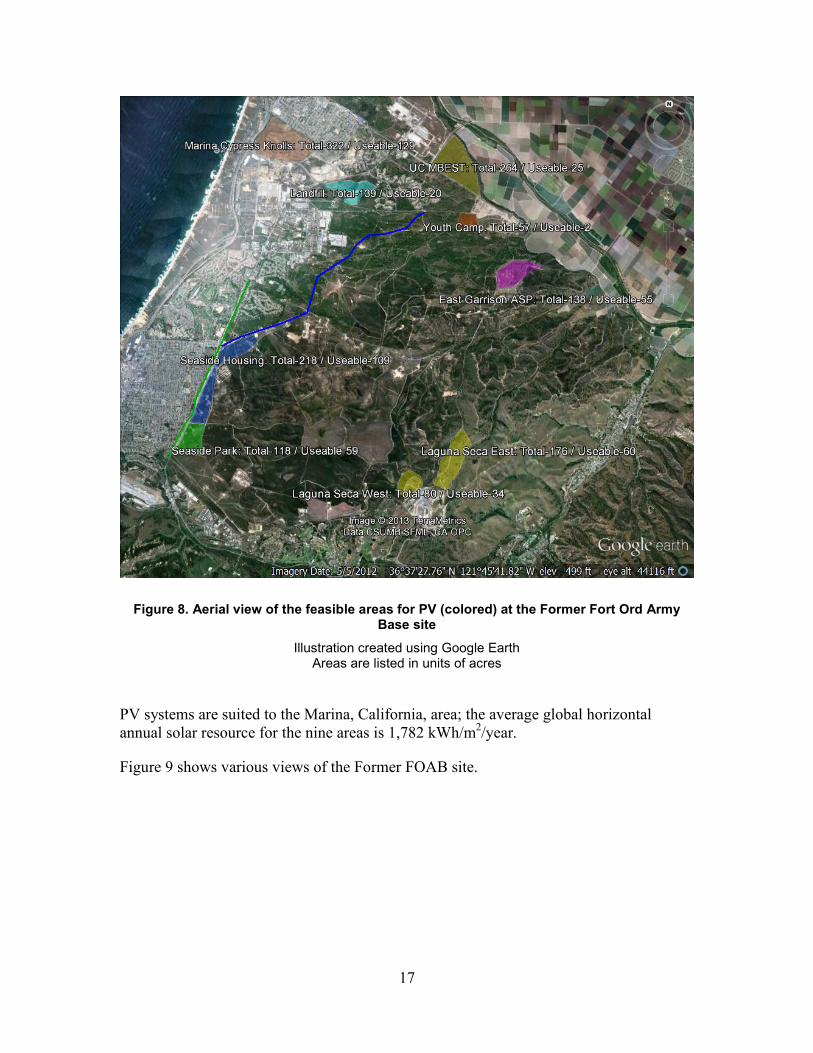
Figure 8 shows an aerial view of the Former FOAB site taken from Google Earth; the nine areas considered for PV are displayed in different colors. Each area has a mixture of terrain types that are suitable for a PV system. Of the total 1,512 acres identified as potential sites, 493 acres appear to be feasible for PV.
17
Figure 8. Aerial view of the feasible areas for PV (colored) at the Former Fort Ord Army Base site
Illustration created using Google Earth Areas are listed in units of acres
PV systems are suited to the Marina, California, area; the average global horizontal annual solar resource for the nine areas is 1,782 kWh/m2/year.
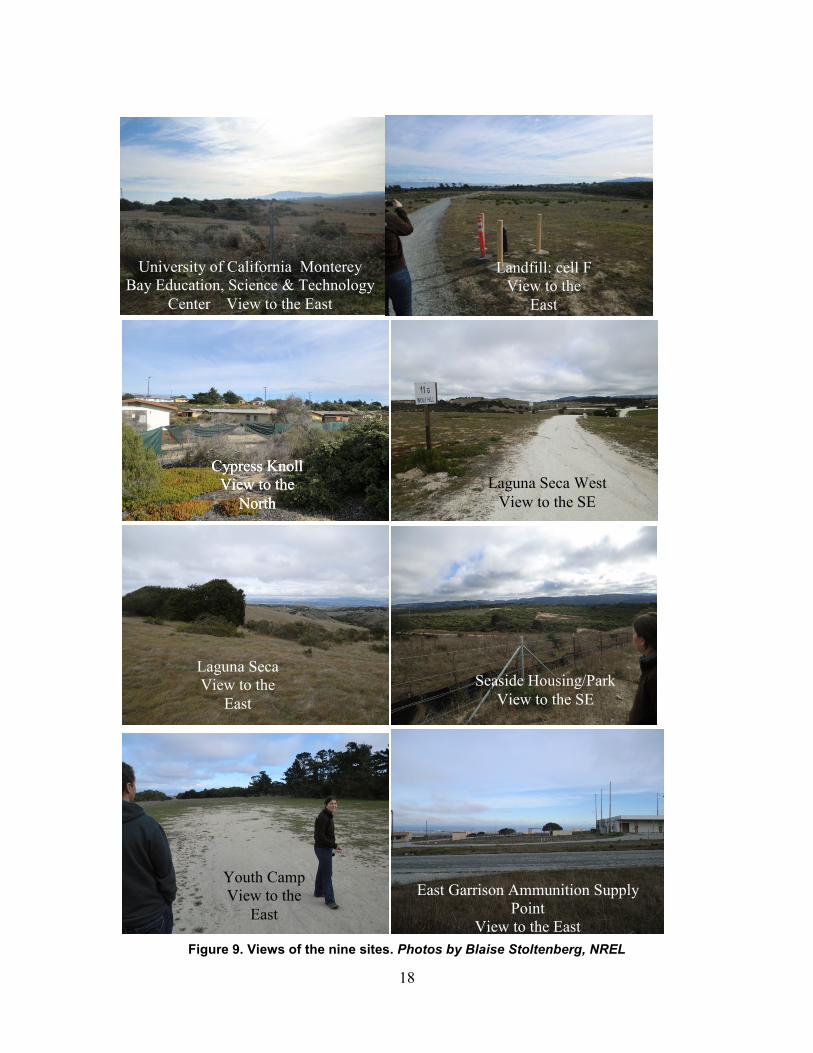
Figure 9 shows various views of the Former FOAB site.
18
Figure 9. Views of the nine sites. Photos by Blaise Stoltenberg, NREL
University of California Monterey Bay Education, Science & Technology
Center View to the East
Landfill: cell F View to the
East
Cypress Knoll View to the
North Laguna Seca West
View to the SE
Cypress Knoll View to the
North
East Garrison Ammunition Supply Point
View to the East
Youth Camp View to the
East
Seaside Housing/Park View to the SE
Laguna Seca View to the
East
19
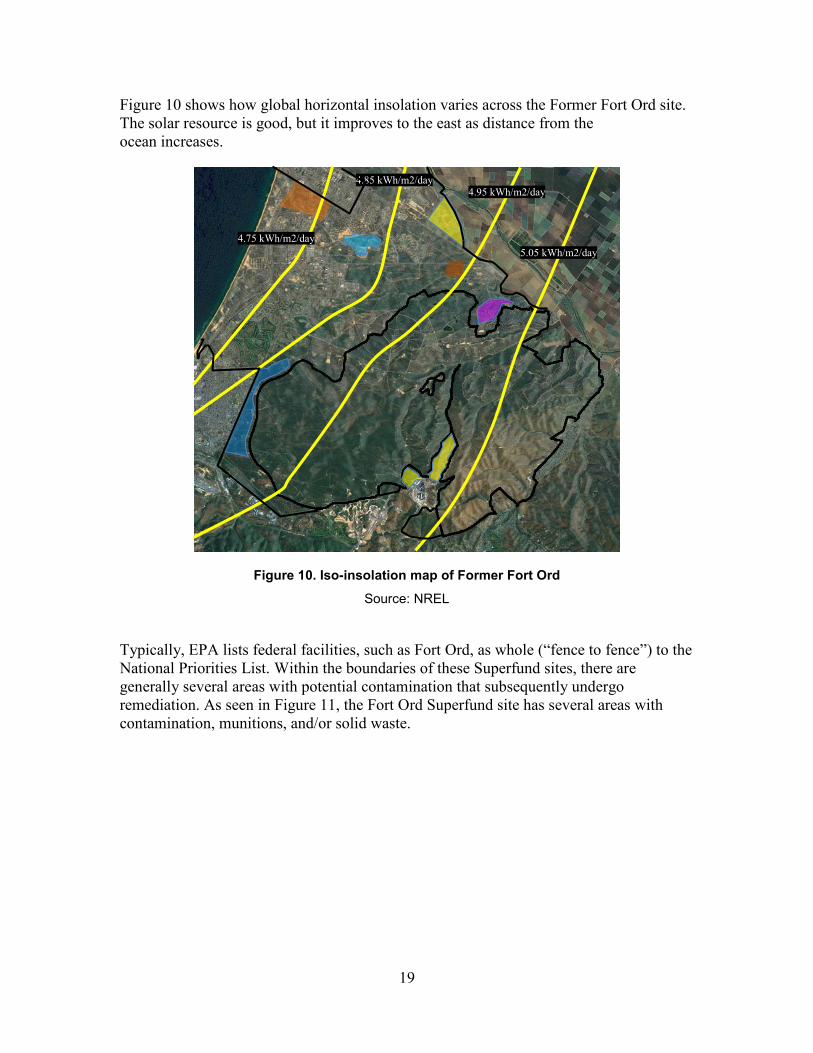
Figure 10 shows how global horizontal insolation varies across the Former Fort Ord site. The solar resource is good, but it improves to the east as distance from the ocean increases.
Figure 10. Iso-insolation map of Former Fort Ord
Source: NREL
Typically, EPA lists federal facilities, such as Fort Ord, as whole (“fence to fence”) to the National Priorities List. Within the boundaries of these Superfund sites, there are generally several areas with potential contamination that subsequently undergo remediation. As seen in Figure 11, the Fort Ord Superfund site has several areas with contamination, munitions, and/or solid waste.
4.75 kWh/m2/day
4.85 kWh/m2/day 4.95 kWh/m2/day
5.05 kWh/m2/day
20
Figure 11. FORA solar sites overlapped with contaminated areas, munitions response sites, and landfills
Source: NREL
The sites identified by FORA for evaluation under this feasibility study are within the overall site boundaries and, in some instances, overlap with the potentially or formerly contaminated areas, munitions response sites, and/or landfills.
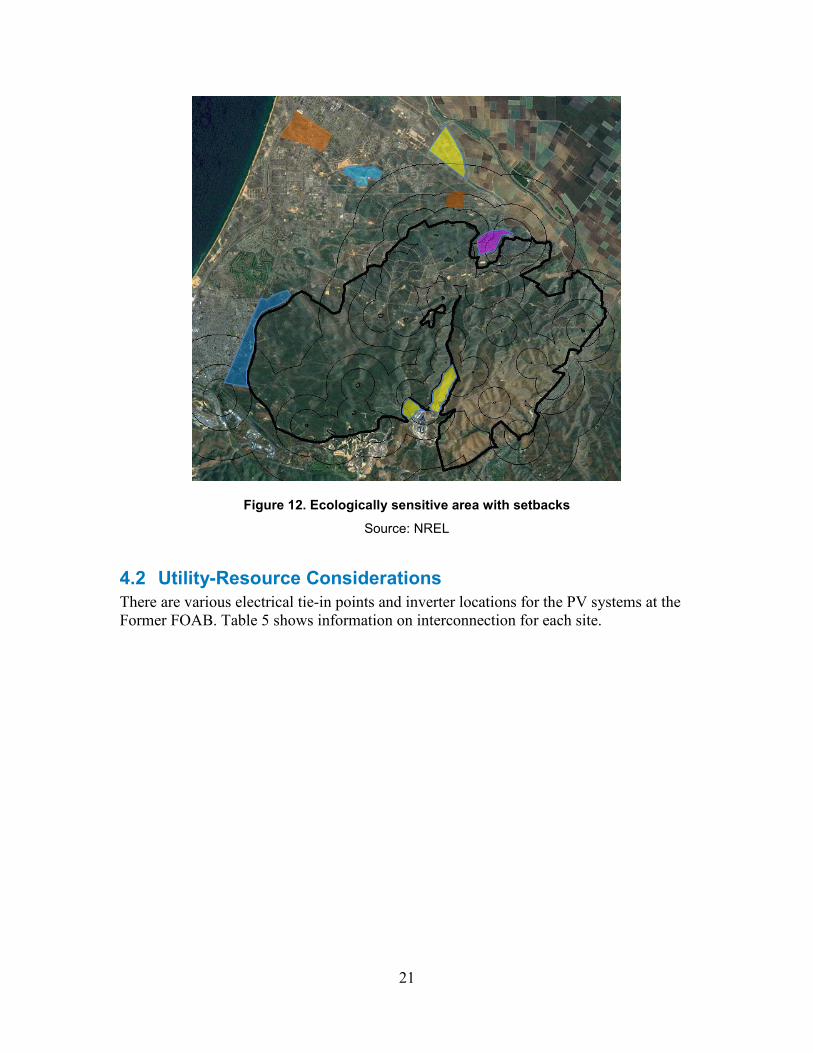
The Former Fort Ord also includes some ecologically sensitive sites. Figure 12 shows these sites with setbacks at 500 m, 1 km, and 2 km. The Army’s Biological Opinion3 outlines the different requirements related to each setback. In general, siting solar within the indicated setbacks will require additional due diligence.
3 http://www.fortordcleanup.com/adminrec/ar_pdfs/AR-BW-2334/.
Areas of contamination, munitions, and/or solid waste Fort Ord National Monument • Other shaded areas are FORA identified solar sites
21
Figure 12. Ecologically sensitive area with setbacks
Source: NREL
4.2 Utility-Resource Considerations There are various electrical tie-in points and inverter locations for the PV systems at the Former FOAB. Table 5 shows information on interconnection for each site.
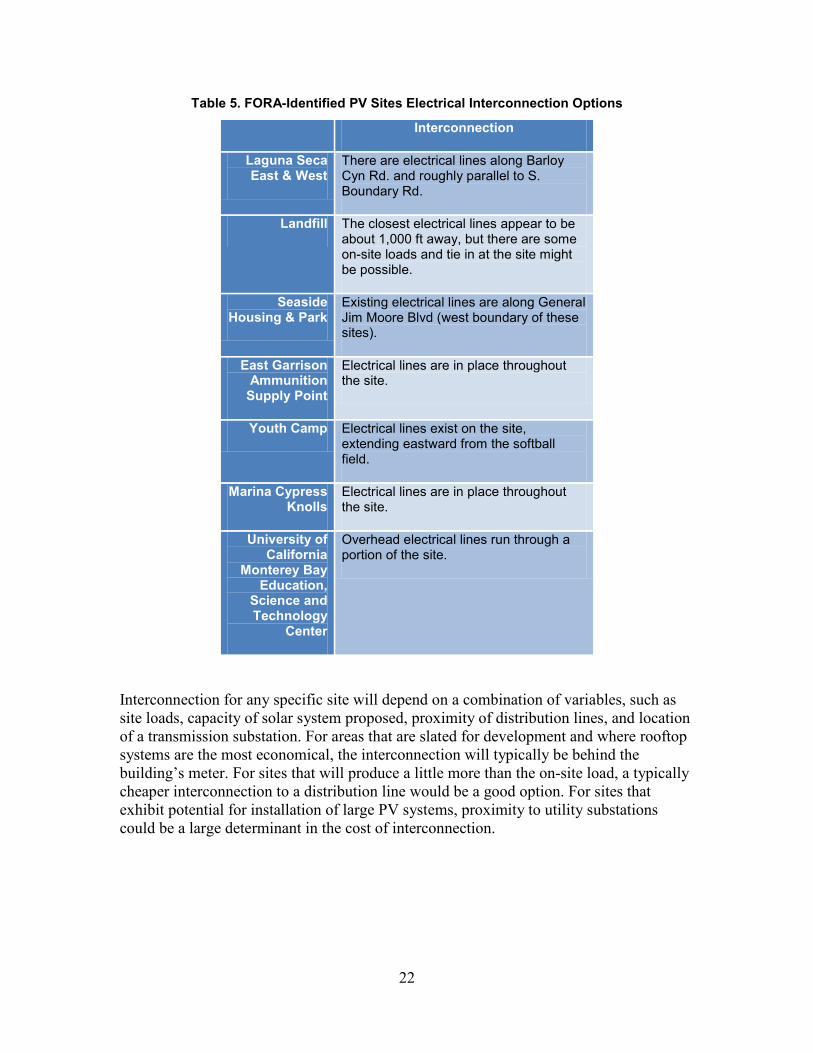
22
Table 5. FORA-Identified PV Sites Electrical Interconnection Options
Interconnection
Laguna Seca East & West
There are electrical lines along Barloy Cyn Rd. and roughly parallel to S. Boundary Rd.
Landfill The closest electrical lines appear to be about 1,000 ft away, but there are some on-site loads and tie in at the site might be possible.
Seaside Housing & Park
Existing electrical lines are along General Jim Moore Blvd (west boundary of these sites).
East Garrison Ammunition
Supply Point
Electrical lines are in place throughout the site.
Youth Camp Electrical lines exist on the site, extending eastward from the softball field.
Marina Cypress Knolls
Electrical lines are in place throughout the site.
University of California
Monterey Bay Education,
Science and Technology
Center
Overhead electrical lines run through a portion of the site.
Interconnection for any specific site will depend on a combination of variables, such as site loads, capacity of solar system proposed, proximity of distribution lines, and location of a transmission substation. For areas that are slated for development and where rooftop systems are the most economical, the interconnection will typically be behind the building’s meter. For sites that will produce a little more than the on-site load, a typically cheaper interconnection to a distribution line would be a good option. For sites that exhibit potential for installation of large PV systems, proximity to utility substations could be a large determinant in the cost of interconnection.
23
4.3 Useable Acreage for PV System Installation Typically, a minimum of 2 useable acres is recommended to site utility-scale PV systems. Useable acreage is usually characterized as "flat to gently sloping" and having southern exposures that are free from obstructions and get full sun for at least a 6-hour period each day. For example, eligible space for PV includes under-utilized or unoccupied land, vacant lots, and/or unused paved area (e.g., a parking lot or industrial site space), as well as existing building rooftops.
4.4 PV Site Solar Resource The Former FOAB site has been evaluated to determine the adequacy of the solar resource available using both on-site data and industry tools for each site.
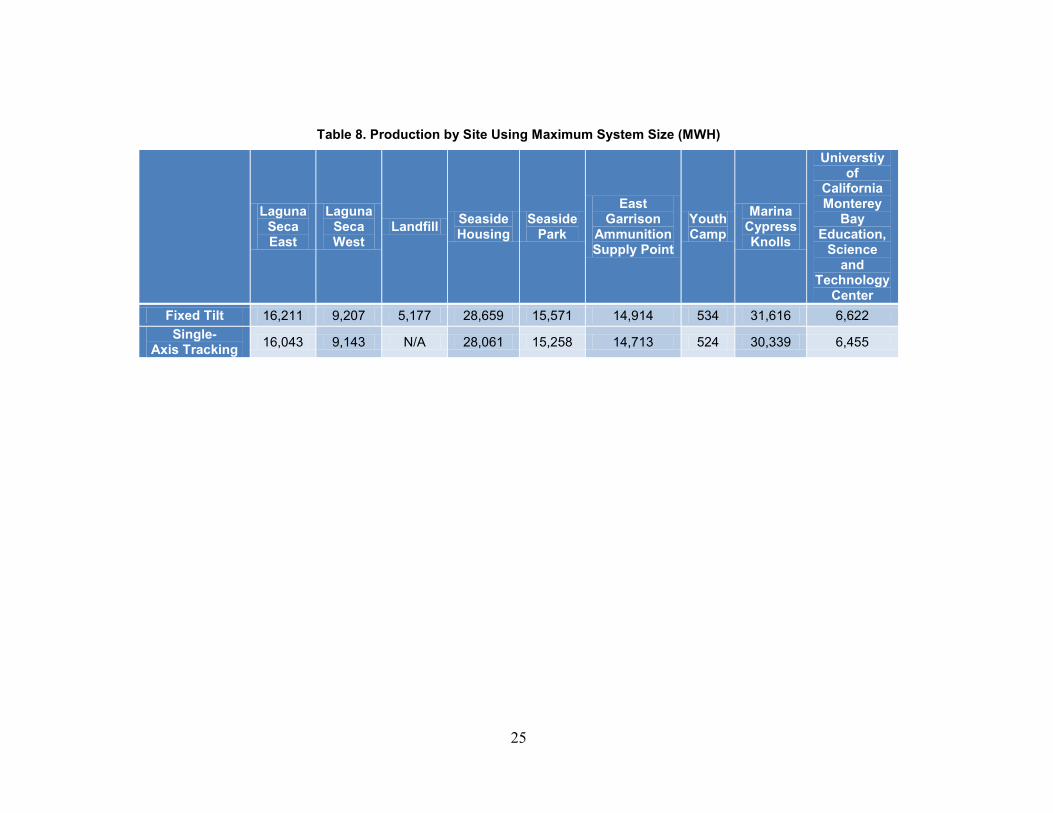
Tables 6–8 show the production per kilowatt of solar installed for each site, the maximum system size for each site, and the production for each site if the maximum system size is installed. The predicted array performance was found using NREL’s System Advisor Model (SAM), with custom weather data for each site. Table 6 uses a hypothetical system size of 1 kW to show the estimated production for each kilowatt so that analysis results can be scaled if the system size changes.
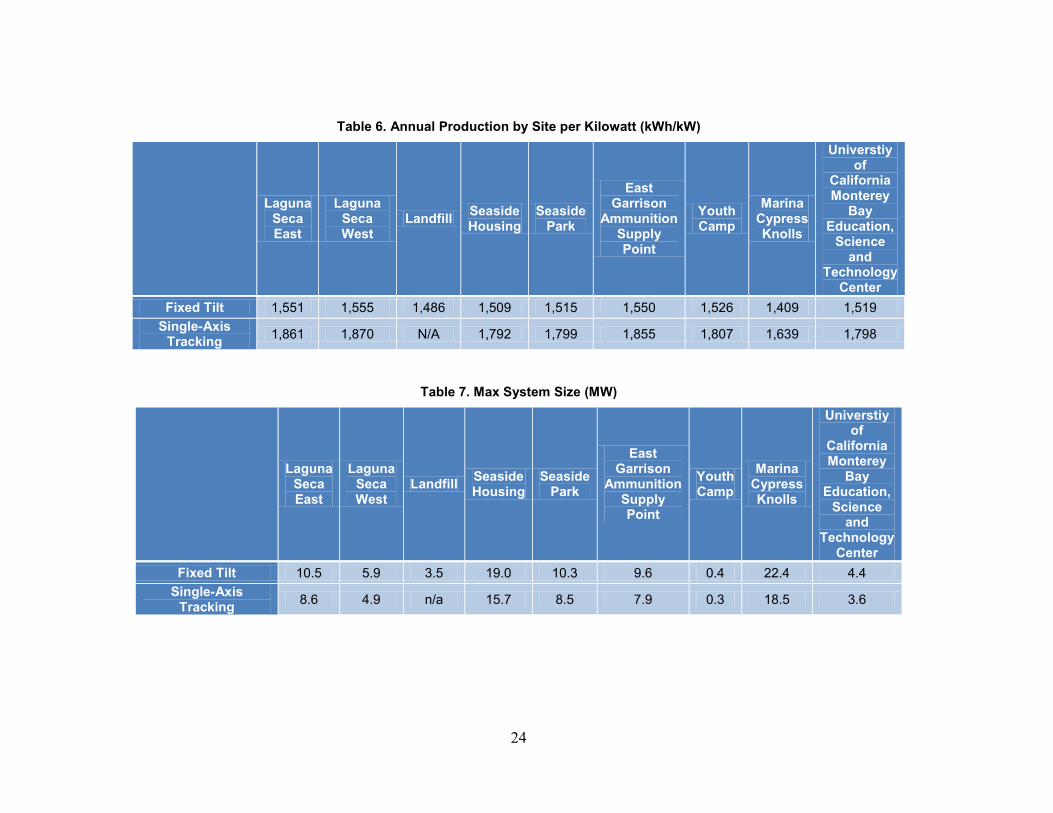
24
Table 6. Annual Production by Site per Kilowatt (kWh/kW)
Laguna
Seca East
Laguna Seca West
Landfill Seaside Housing
Seaside Park
East Garrison
Ammunition Supply Point
Youth Camp
Marina Cypress Knolls
Universtiy of
California Monterey
Bay Education,
Science and
Technology Center
Fixed Tilt 1,551 1,555 1,486 1,509 1,515 1,550 1,526 1,409 1,519 Single-Axis
Tracking 1,861 1,870 N/A 1,792 1,799 1,855 1,807 1,639 1,798
Table 7. Max System Size (MW)
Laguna
Seca East
Laguna Seca West
Landfill Seaside Housing
Seaside Park
East Garrison
Ammunition Supply Point
Youth Camp
Marina Cypress Knolls
Universtiy of
California Monterey
Bay Education,
Science and
Technology Center
Fixed Tilt 10.5 5.9 3.5 19.0 10.3 9.6 0.4 22.4 4.4 Single-Axis
Tracking 8.6 4.9 n/a 15.7 8.5 7.9 0.3 18.5 3.6
25
Table 8. Production by Site Using Maximum System Size (MWH)
Laguna
Seca East
Laguna Seca West
Landfill Seaside Housing
Seaside Park
East Garrison
Ammunition Supply Point
Youth Camp
Marina Cypress Knolls
Universtiy of
California Monterey
Bay Education,
Science and
Technology Center
Fixed Tilt 16,211 9,207 5,177 28,659 15,571 14,914 534 31,616 6,622 Single-
Axis Tracking 16,043 9,143 N/A 28,061 15,258 14,713 524 30,339 6,455
26
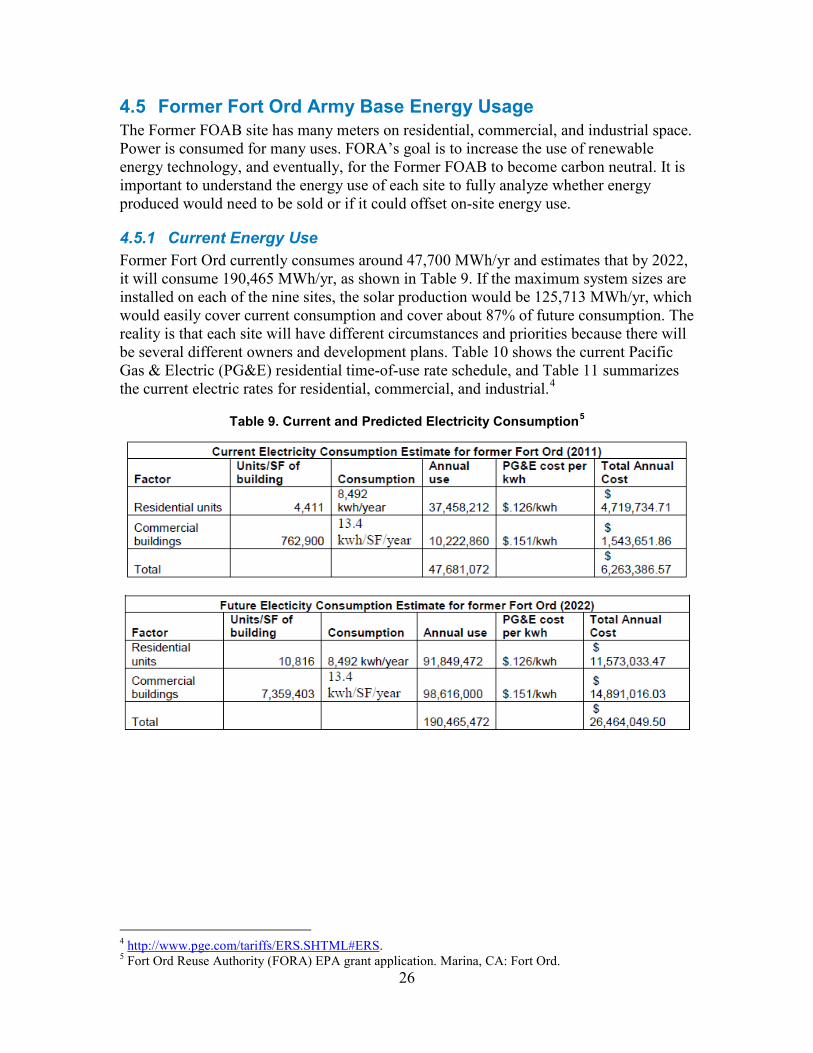
4.5 Former Fort Ord Army Base Energy Usage The Former FOAB site has many meters on residential, commercial, and industrial space. Power is consumed for many uses. FORA’s goal is to increase the use of renewable energy technology, and eventually, for the Former FOAB to become carbon neutral. It is important to understand the energy use of each site to fully analyze whether energy produced would need to be sold or if it could offset on-site energy use.
4.5.1 Current Energy Use Former Fort Ord currently consumes around 47,700 MWh/yr and estimates that by 2022, it will consume 190,465 MWh/yr, as shown in Table 9. If the maximum system sizes are installed on each of the nine sites, the solar production would be 125,713 MWh/yr, which would easily cover current consumption and cover about 87% of future consumption. The reality is that each site will have different circumstances and priorities because there will be several different owners and development plans. Table 10 shows the current Pacific Gas & Electric (PG&E) residential time-of-use rate schedule, and Table 11 summarizes the current electric rates for residential, commercial, and industrial.4
Table 9. Current and Predicted Electricity Consumption5
4 http://www.pge.com/tariffs/ERS.SHTML#ERS. 5 Fort Ord Reuse Authority (FORA) EPA grant application. Marina, CA: Fort Ord.
27
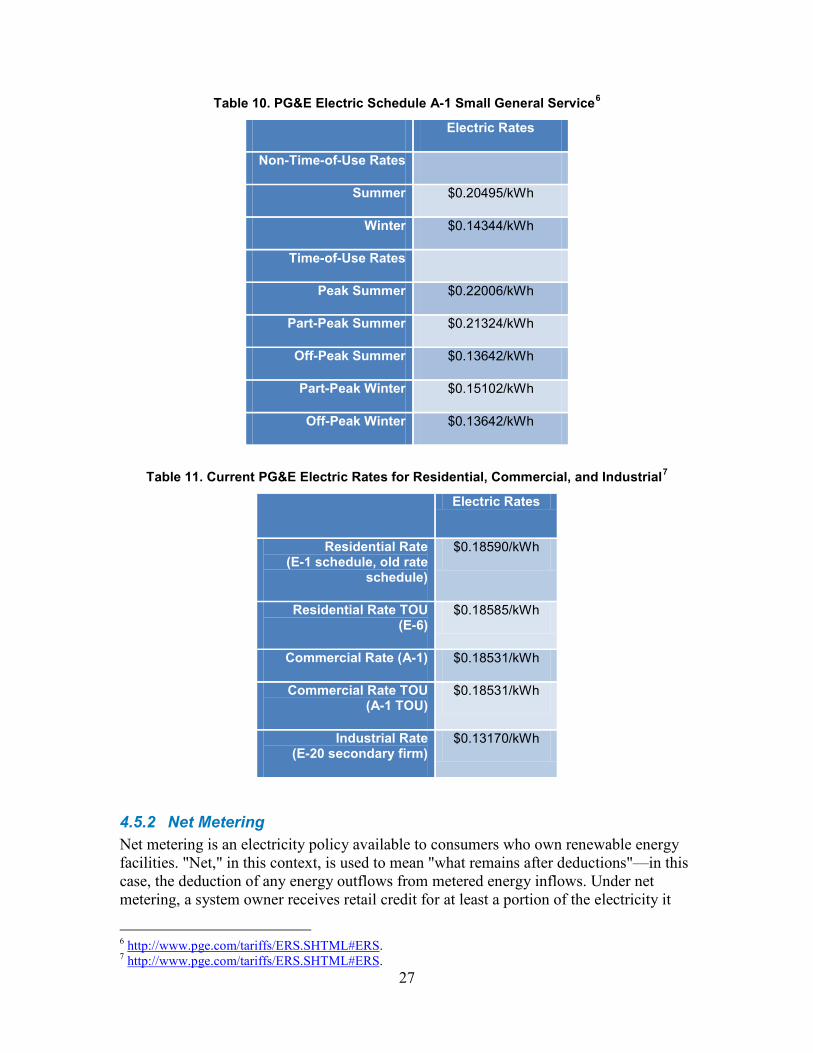
Table 10. PG&E Electric Schedule A-1 Small General Service6
Electric Rates
Non-Time-of-Use Rates
Summer $0.20495/kWh
Winter $0.14344/kWh
Time-of-Use Rates
Peak Summer $0.22006/kWh
Part-Peak Summer $0.21324/kWh
Off-Peak Summer $0.13642/kWh
Part-Peak Winter $0.15102/kWh
Off-Peak Winter $0.13642/kWh
Table 11. Current PG&E Electric Rates for Residential, Commercial, and Industrial7
Electric Rates
Residential Rate (E-1 schedule, old rate
schedule)
$0.18590/kWh
Residential Rate TOU (E-6)
$0.18585/kWh
Commercial Rate (A-1) $0.18531/kWh
Commercial Rate TOU (A-1 TOU)
$0.18531/kWh
Industrial Rate (E-20 secondary firm)
$0.13170/kWh
4.5.2 Net Metering Net metering is an electricity policy available to consumers who own renewable energy facilities. "Net," in this context, is used to mean "what remains after deductions"—in this case, the deduction of any energy outflows from metered energy inflows. Under net metering, a system owner receives retail credit for at least a portion of the electricity it
6 http://www.pge.com/tariffs/ERS.SHTML#ERS. 7 http://www.pge.com/tariffs/ERS.SHTML#ERS.
28
generates. As part of the Energy Policy Act of 2005, under Sec. 1251, all public electric utilities are required upon request to make net metering available to their customers.
(11) NET METERING.—Each electric utility shall make available upon request net metering service to any electric consumer that the electric utility serves. For purposes of this paragraph, the term ‘net metering service’ means service to an electric consumer under which electric energy generated by that electric consumer from an eligible onsite generating facility and delivered to the local distribution facilities may be used to offset electric energy provided by the electric utility to the electric consumer during the applicable billing period.
California's net-metering law,8 which took effect in 1996, requires utilities to offer net metering to all customers with solar and wind-energy systems up to 1 MW.
Renewable energy certificates (RECs),9 also known as green certificates, green tags, or tradable renewable certificates, are tradable commodities in the United States that represent proof of electric energy generation from eligible renewable energy resources (renewable electricity). The RECs that are associated with the electricity produced and are used on-site remain with the customer-generator. If, however, the customer chooses to receive financial compensation for the net energy generated remaining after a 12-month period, the utility will be granted the RECs associated with only that surplus that they purchase.
California does not allow any new or additional demand charges, standby charges, customer charges, minimum monthly charges, interconnection charges, or other charges that would increase an eligible customer-generator's costs beyond those of other customers in the rate class to which the eligible customer-generator would otherwise be assigned. The California Public Utilities Commission has explicitly ruled that technologies eligible for net metering (up to 1 MW) are exempt from interconnection application fees, as well as from initial and supplemental interconnection review fees.
Publicly owned utilities may elect to provide co-energy metering, which is the same as net metering except that it incorporates a time-of-use (TOU) rate schedule. Customer-generators who are subject to TOU rates and have systems sized between 10 kW and 1 MW are entitled to return electricity to the system for the same TOU (including real-time) price that they pay for power purchases. However, TOU customers who choose to co-energy meter must pay for the metering equipment capable of making such measurements. Customer-generators retain ownership of all RECs associated with the generation of electricity they use on site.
4.5.3 Virtual Net Metering California allows virtual net metering (VNM). This arrangement can allow certain entities, such as a local government, to install renewable generation of up to 1 MW at one 8 For the full text of this bill, see http://www.dsireusa.org/incentives/ incentive.cfm?Incentive_Code=CA02R&re=1&ee=1. 9 For a description of RECs, see http://apps3.eere.energy.gov/greenpower/markets/ certificates.

29
location within its geographic boundary and to generate credits that can be used to offset charges at one or more other locations within the same geographic boundary. California Assembly Bill 2466 (AB 2466), codified as Section 283010 of the Public Utilities Code, was signed into law by Governor Schwarzenegger in September 2008 and became effective on January 1, 2009.11
In Public Utilities Code Section 2830, the California State Legislature defined local government to include cities, counties, school districts, special districts, political subdivisions, or other local public agencies that are authorized to generate electricity. The legislature decided that the tariff would not be available for the state, any agency or department of the state, or any joint powers authority. Depending upon the classification of the site, Former Fort Ord may qualify under AB2466 for VNM. Also, PG&E could allow VNM if they choose. The PG&E customer representative for the site customer should be asked if VNM is an option.
10 Public Utilities Code. Section 2830. Accessed April 3, 2013: http://www.leginfo.ca.gov/cgi-bin/displaycode?section=puc&group=02001-03000&file=2830. 11 For more information about VNM, see http://www.pge.com/b2b/newgenerator/ab2466/.
30
5 Economics and Performance The economic performance of a PV system installed on a site is evaluated using a combination of the assumptions and background information discussed previously, as well as a number of industry-specific inputs determined by other studies. In particular, this study uses SAM.12
SAM is a performance and economic model designed to facilitate decision making for people involved in the renewable energy industry, ranging from project managers and engineers to incentive program designers, technology developers, and researchers. It makes performance predictions for grid-connected solar, solar water heating, wind, and geothermal power systems and makes economic calculations for projects that buy and sell power at retail rates, as well as power projects that sell power through a PPA.
SAM consists of a performance model and financial model. The performance model calculates a system's energy output on an hourly basis (sub-hourly simulations are available for some technologies). The financial model calculates annual project cash flows over a period of years for a range of financing structures for residential, commercial, and utility projects.
SAM makes performance predictions for grid-connected solar, small wind, and geothermal power systems and economic estimates for distributed energy and central generation projects. The model calculates the cost of generating electricity based on information a user provides about a project's location, installation and operating costs, type of financing, applicable tax credits and incentives, and system specifications.
5.1 Assumptions and Input Data for Analysis Cost of a PV system depends on the system size and other factors, such as geographic location, mounting structure, and type of PV module. Based on significant cost reductions seen in 2011, the average cost for utility-scale ground-mounted systems has declined from $4.80/W in the first quarter of 2010 to $2.90/W in the first quarter of 2012. With an increasing demand and supply, potential of further cost reduction is expected as market conditions evolve. For this analysis, the following input data were used. The installed cost of fixed-tilt ground-mounted systems was assumed to be $2.79–$3.20/W, the installed cost of single-axis tracking systems was assumed to be $3.35–$3.84/W, and the installed cost of a fixed ballasted system on a landfill was assumed to be $3.49–$4.00/W.13
The estimated increase in cost from this baseline for a ballasted system on a landfill is 25%. This increased cost is due to limitations placed on design and construction methods because of the ground conditions at the site. Such limitations include restrictions on storm water runoff, weight loading of construction equipment, inability to trench for utility
12 For additional information on SAM, see https://sam.nrel.gov/cost. 13 Goodrich, A.; James, T.; Woodhouse, M. (2012). Residential, Commercial, and Utility-Scale Photovoltaic (PV) System Prices in the United States: Current Drivers and Cost-Reduction Opportunities. 64 pp.; NREL Report No. TP-6A20-53347.
31
lines, additional engineering costs, permitting issues, and non-standard ballasted racking systems. The installed system cost assumptions are summarized in Table 12.
Table 12. Installed System Cost Assumptions
System Type Fixed Tilt ($/W)
Single-Axis Tracking ($/W)
Baseline system 2.79 – 3.20 3.35 – 3.84 Ballasted (non-penetrating)
3.49 – 4.00 N/A
These prices include the PV array and the BOS components for each system (i.e. the inverter, electrical equipment, and installation cost). This includes estimated taxes and a national-average labor rate but does not include land cost. The economics of grid-tied PV depend on incentives, the cost of electricity, the solar resource, and panel tilt and orientation. For this analysis, the cost of electricity was assumed to be $0.17/kWh.
It was also assumed that relevant federal incentives are received. It is important to consider all applicable incentives or grants to make PV as cost-effective as possible. If the PV system is owned by a private tax-paying entity, this entity may qualify for federal tax credits and accelerated depreciation on the PV system, which can be worth about 15% of the initial capital investment. The total potential tax benefits to the tax-paying entity can be as high as 45% of the initial system cost. Because state and federal governments do not pay taxes, private ownership of the PV system would be required to capture tax incentives.
For the purposes of this analysis, the project is expected to have a 25-year life, although the system can be reasonably expected to continue operation past this point. For the PPA option, inflation is assumed to be 2.5%, the real discount rate to be 5.85%, financing secured via a 15-year loan at a 6% interest rate, and 45% debt fraction to keep the debt service coverage ratio at 1.2. For the municipal ownership option, inflation is assumed to be 2.5%, the real discount rate to be 3%, financing secured via a 25-year loan at a 6% interest rate, and 100% debt fraction. The panels are assumed to have a 0.5% per year degradation in performance. The annual O&M cost is assumed to be $30/kW/yr for the first 15 years, which includes a reserve account for inverter replacement. The O&M cost for years 16–25 is $20/kW/yr.
A system DC-to-AC conversion of 80% was assumed. This includes losses in the inverter, wire losses, PV module losses, and losses due to temperature effects. Custom weather data from 2003 to 2010 were used to calculate expected energy performance using SAM. The weather data included hourly measurements of global horizontal irradiance, direct normal irradiance, diffuse horizontal irradiance, dry bulb temperature, dew point, relative humidity, pressure, wind speed, and albedo. The solar data used had a resolution of 1 km and was based on satellite images. The other meteorological (met) data used was for coincident hours as the solar data, but it was measured at the Monterey, California, airport, a few miles from the sites. Solar data have the biggest and most direct
32
effect on simulated PV production while the met data have only minor effects on estimated production; therefore, this methodology was deemed to be satisfactory for the purposes of this report.
Table 13 lists the major inputs for the two ownership scenarios.
Table 13. Inputs Used in SAM Modeling
Inputs PPA/Investor Municipal Ownership Weather data 2003 - 2010 2003 - 2010
Utility rate N/A
0.17 flat buy and sell rate w/ 2% utility rate
escalation, net metering enabled
Analysis period (years) 25 25 Inflation 2.50% 2.50% Real discount rate 5.85% 3.00% Federal tax rate 35% 0% State tax rate 8% 0% Insurance (% of installed cost) 0.50% 0.50% Property tax 0 0 Construction loan 0 0 Loan term 15 25 Loan rate 6% 6% Debt fraction 48% 100% Minimum IRR 15.00% N/A PPA escalation rate 1.50% N/A
Federal depreciation
5 year MACRS w/ 50% 1st year bonus depreciation
(50%,16%,19.6%,5.76%,5.76%,2.88%) None
State depreciation 5-year MACRS None Federal ITC 30% None Payment incentives none None Degradation 0.50% 0.50% Availability 100% 100% Cost range low - fixed-tilt (per kW) $2,790.00 $2,790.00 Cost range high - fixed-tilt (per kW) $3,200.00 $3,200.00 Cost range low- single-axis tracking (per kW) $3,350.00 $3,350.00 Cost range high - single-axis tracking (per kW) $3,840.00 $3,840.00 Cost range low - landfill ballasted per kW $3,490.00 $3,490.00 Cost range high- landfill ballasted per kW $4,000.00 $4,000.00
33
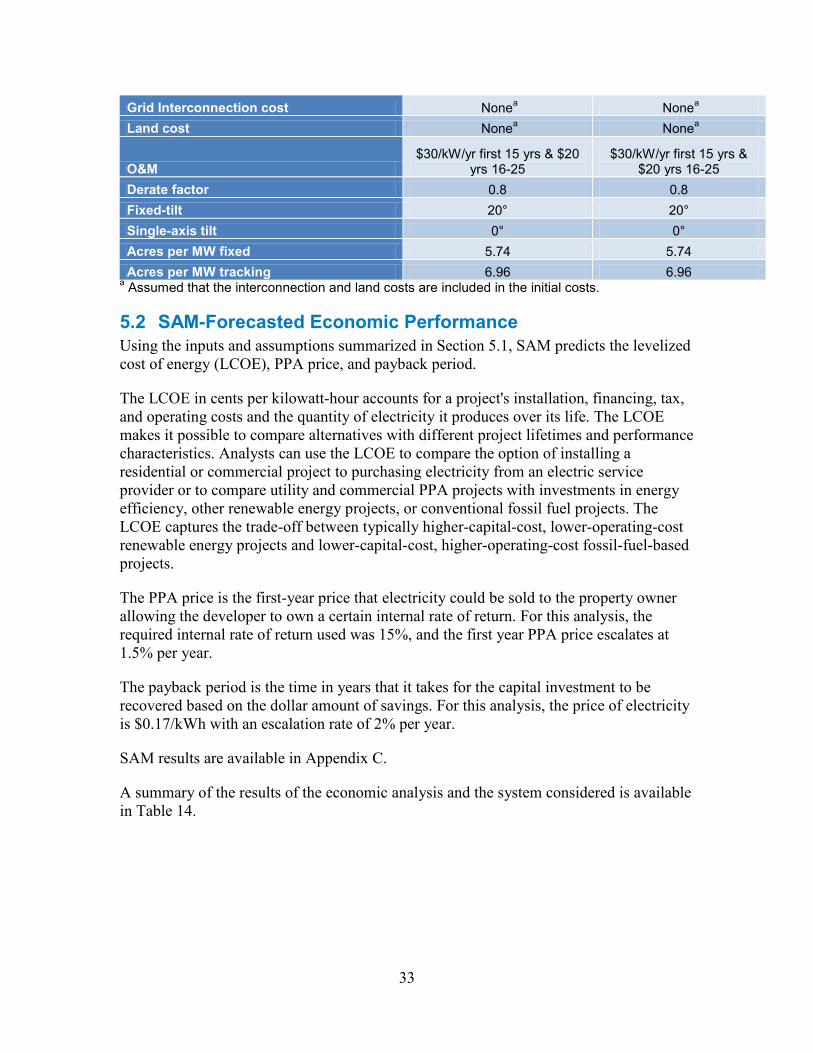
Grid Interconnection cost Nonea Nonea Land cost Nonea Nonea
O&M $30/kW/yr first 15 yrs & $20
yrs 16-25 $30/kW/yr first 15 yrs &
$20 yrs 16-25 Derate factor 0.8 0.8 Fixed-tilt 20° 20° Single-axis tilt 0° 0° Acres per MW fixed 5.74 5.74 Acres per MW tracking 6.96 6.96
a Assumed that the interconnection and land costs are included in the initial costs.
5.2 SAM-Forecasted Economic Performance Using the inputs and assumptions summarized in Section 5.1, SAM predicts the levelized cost of energy (LCOE), PPA price, and payback period.
The LCOE in cents per kilowatt-hour accounts for a project's installation, financing, tax, and operating costs and the quantity of electricity it produces over its life. The LCOE makes it possible to compare alternatives with different project lifetimes and performance characteristics. Analysts can use the LCOE to compare the option of installing a residential or commercial project to purchasing electricity from an electric service provider or to compare utility and commercial PPA projects with investments in energy efficiency, other renewable energy projects, or conventional fossil fuel projects. The LCOE captures the trade-off between typically higher-capital-cost, lower-operating-cost renewable energy projects and lower-capital-cost, higher-operating-cost fossil-fuel-based projects.
The PPA price is the first-year price that electricity could be sold to the property owner allowing the developer to own a certain internal rate of return. For this analysis, the required internal rate of return used was 15%, and the first year PPA price escalates at 1.5% per year.
The payback period is the time in years that it takes for the capital investment to be recovered based on the dollar amount of savings. For this analysis, the price of electricity is $0.17/kWh with an escalation rate of 2% per year.
SAM results are available in Appendix C.
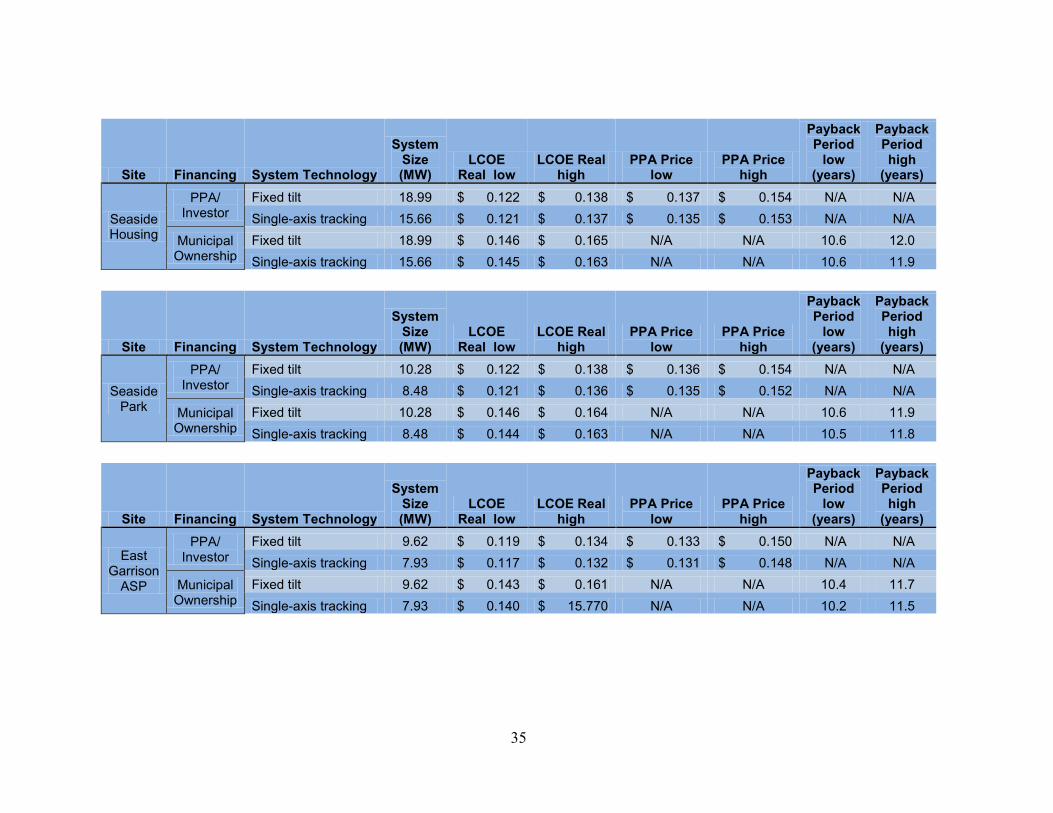
A summary of the results of the economic analysis and the system considered is available in Table 14.
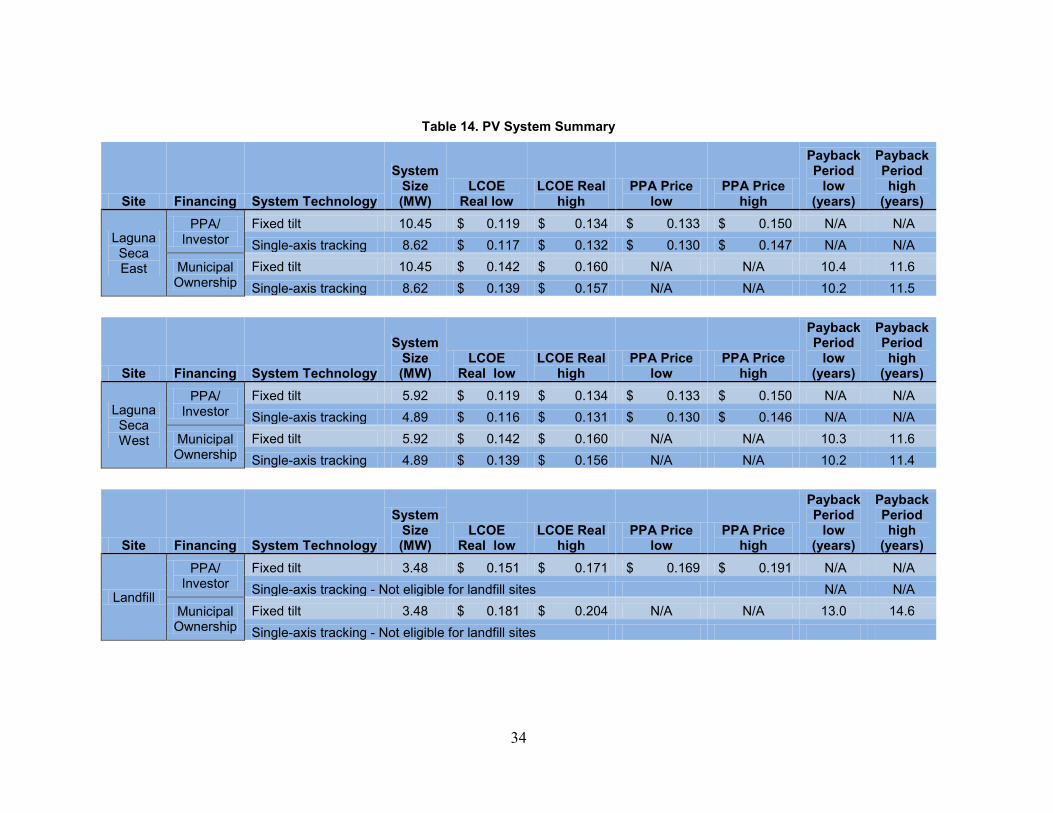
34
Table 14. PV System Summary
Site Financing System Technology
System Size (MW)
LCOE Real low
LCOE Real high
PPA Price low
PPA Price high
Payback Period
low (years)
Payback Period high
(years)
Laguna Seca East
PPA/ Investor
Fixed tilt 10.45 $ 0.119 $ 0.134 $ 0.133 $ 0.150 N/A N/A Single-axis tracking 8.62 $ 0.117 $ 0.132 $ 0.130 $ 0.147 N/A N/A
Municipal Ownership
Fixed tilt 10.45 $ 0.142 $ 0.160 N/A N/A 10.4 11.6 Single-axis tracking 8.62 $ 0.139 $ 0.157 N/A N/A 10.2 11.5
Site Financing System Technology
System Size (MW)
LCOE Real low
LCOE Real high
PPA Price low
PPA Price high
Payback Period
low (years)
Payback Period high
(years)
Laguna Seca West
PPA/ Investor
Fixed tilt 5.92 $ 0.119 $ 0.134 $ 0.133 $ 0.150 N/A N/A Single-axis tracking 4.89 $ 0.116 $ 0.131 $ 0.130 $ 0.146 N/A N/A
Municipal Ownership
Fixed tilt 5.92 $ 0.142 $ 0.160 N/A N/A 10.3 11.6 Single-axis tracking 4.89 $ 0.139 $ 0.156 N/A N/A 10.2 11.4
Site Financing System Technology
System Size (MW)
LCOE Real low
LCOE Real high
PPA Price low
PPA Price high
Payback Period
low (years)
Payback Period high
(years)
Landfill
PPA/ Investor
Fixed tilt 3.48 $ 0.151 $ 0.171 $ 0.169 $ 0.191 N/A N/A Single-axis tracking - Not eligible for landfill sites N/A N/A
Municipal Ownership
Fixed tilt 3.48 $ 0.181 $ 0.204 N/A N/A 13.0 14.6 Single-axis tracking - Not eligible for landfill sites
35
Site Financing System Technology
System Size (MW)
LCOE Real low
LCOE Real high
PPA Price low
PPA Price high
Payback Period
low (years)
Payback Period high
(years)
Seaside Housing
PPA/ Investor
Fixed tilt 18.99 $ 0.122 $ 0.138 $ 0.137 $ 0.154 N/A N/A Single-axis tracking 15.66 $ 0.121 $ 0.137 $ 0.135 $ 0.153 N/A N/A
Municipal Ownership
Fixed tilt 18.99 $ 0.146 $ 0.165 N/A N/A 10.6 12.0 Single-axis tracking 15.66 $ 0.145 $ 0.163 N/A N/A 10.6 11.9
Site Financing System Technology
System Size (MW)
LCOE Real low
LCOE Real high
PPA Price low
PPA Price high
Payback Period
low (years)
Payback Period high
(years)
Seaside Park
PPA/ Investor
Fixed tilt 10.28 $ 0.122 $ 0.138 $ 0.136 $ 0.154 N/A N/A Single-axis tracking 8.48 $ 0.121 $ 0.136 $ 0.135 $ 0.152 N/A N/A
Municipal Ownership
Fixed tilt 10.28 $ 0.146 $ 0.164 N/A N/A 10.6 11.9 Single-axis tracking 8.48 $ 0.144 $ 0.163 N/A N/A 10.5 11.8
Site Financing System Technology
System Size (MW)
LCOE Real low
LCOE Real high
PPA Price low
PPA Price high
Payback Period
low (years)
Payback Period high
(years)
East Garrison
ASP
PPA/ Investor
Fixed tilt 9.62 $ 0.119 $ 0.134 $ 0.133 $ 0.150 N/A N/A Single-axis tracking 7.93 $ 0.117 $ 0.132 $ 0.131 $ 0.148 N/A N/A
Municipal Ownership
Fixed tilt 9.62 $ 0.143 $ 0.161 N/A N/A 10.4 11.7 Single-axis tracking 7.93 $ 0.140 $ 15.770 N/A N/A 10.2 11.5
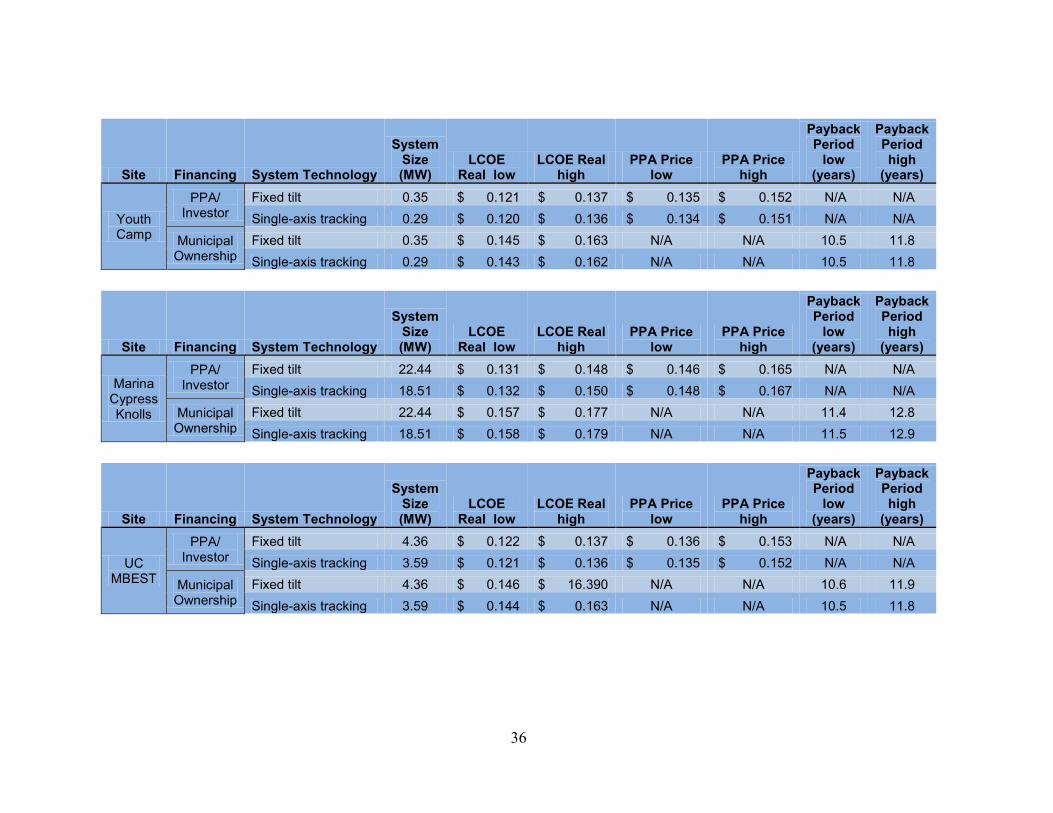
36
Site Financing System Technology
System Size (MW)
LCOE Real low
LCOE Real high
PPA Price low
PPA Price high
Payback Period
low (years)
Payback Period high
(years)
Youth Camp
PPA/ Investor
Fixed tilt 0.35 $ 0.121 $ 0.137 $ 0.135 $ 0.152 N/A N/A Single-axis tracking 0.29 $ 0.120 $ 0.136 $ 0.134 $ 0.151 N/A N/A
Municipal Ownership
Fixed tilt 0.35 $ 0.145 $ 0.163 N/A N/A 10.5 11.8 Single-axis tracking 0.29 $ 0.143 $ 0.162 N/A N/A 10.5 11.8
Site Financing System Technology
System Size (MW)
LCOE Real low
LCOE Real high
PPA Price low
PPA Price high
Payback Period
low (years)
Payback Period high
(years)
Marina Cypress Knolls
PPA/ Investor
Fixed tilt 22.44 $ 0.131 $ 0.148 $ 0.146 $ 0.165 N/A N/A Single-axis tracking 18.51 $ 0.132 $ 0.150 $ 0.148 $ 0.167 N/A N/A
Municipal Ownership
Fixed tilt 22.44 $ 0.157 $ 0.177 N/A N/A 11.4 12.8 Single-axis tracking 18.51 $ 0.158 $ 0.179 N/A N/A 11.5 12.9
Site Financing System Technology
System Size (MW)
LCOE Real low
LCOE Real high
PPA Price low
PPA Price high
Payback Period
low (years)
Payback Period high
(years)
UC MBEST
PPA/ Investor
Fixed tilt 4.36 $ 0.122 $ 0.137 $ 0.136 $ 0.153 N/A N/A Single-axis tracking 3.59 $ 0.121 $ 0.136 $ 0.135 $ 0.152 N/A N/A
Municipal Ownership
Fixed tilt 4.36 $ 0.146 $ 16.390 N/A N/A 10.6 11.9 Single-axis tracking 3.59 $ 0.144 $ 0.163 N/A N/A 10.5 11.8
37
The system economics presented in this analysis represent the best referenceable information available at the time of the analysis and therefore should be considered best estimates. Only a firm proposal developed by a solar installer or developer will provide a complete picture of the true economics of a system. Accordingly, there are two assumptions that should be addressed specifically. First, no California state or local incentives were modeled in this economic analysis. At present, even though there does not appear to be incentives available in California, it is likely there will be more in the future that will improve system economics. Second, system cost is based on published data with adjustments for tracking and landfill applications based on industry research. Costs in the solar industry are changing more rapidly than the availability of published data; therefore, the proposed system cost from a solar developer might be considerably less than calculated in this report and could greatly improve system economics.
5.3 Job Analysis and Impact To evaluate the impact on employment and economy of the PV project associated with this analysis, the Jobs and Economic Development Impact (JEDI) model was used.14 JEDI estimates the economic impacts associated with the construction and operation of distributed generation power plants. It is a flexible input-output tool that estimates, but does not precisely predict, the number of jobs and economic impacts that can be reasonably supported by a proposed facility.
The JEDI models represent the entire economy, including cross-industry or cross-company impacts. For example, JEDI estimates the impact that the installation of a distributed generation facility would have on not only the manufacturers of PV modules and inverters but also the associated construction materials, metal fabrication industry, project management support, transportation, and other industries that are required to enable the procurement and installation of the complete system.
For this analysis, inputs, including the estimated installed project cost ($/kW), targeted year of construction, system capacity (kW), O&M costs ($/kW), and location, were entered into the model to predict the jobs and economic impact. It is important to note that JEDI does not predict or incorporate any displacement of related economic activity or alternative jobs due to the implementation of the proposed project. As such, JEDI results are considered gross estimates as opposed to net estimates.
For the Former FOAB site, the values in Table 15 were assumed.
Table 15. JEDI Analysis Assumptions
Input Assumed Value
Placed In Service Year 2013 Installed System Cost Low price range Location California
14 The JEDI models have been used by the U.S. Department of Energy, the U.S. Department of Agriculture, NREL, and the Lawrence Berkeley National Laboratory, as well as a number of universities. For information on JEDI, see http://www.nrel.gov/analysis/jedi/about_jedi.html.
38
Using these inputs, JEDI estimates the gross direct and indirect jobs, associated earnings, and total economic impact supported by the construction and continued operation of the proposed PV system.
The estimates of jobs associated with this project are presented as either construction period jobs or sustained operations jobs. Each job is expressed as a whole, or fraction, full-time equivalent (FTE) position. An FTE is defined as 40 hours per week for one person for the duration of a year. Construction period jobs are considered short-term positions that exist only during the procurement and construction periods.
As indicated in the results of the JEDI model analysis provided in Appendix B, if all the maximum system sizes were built for all nine sites, the total proposed system is estimated to support 1,899 direct, indirect, and induced jobs per year for the duration of the procurement and construction period (typically 12–18 months). The annual O&M of the new PV systems would be estimated to support 32 FTEs per year for the life of the systems.
5.4 Financing Opportunities The procurement, development, construction, and management of a successful utility-scale distributed generation facility can be owned and financed a number of different ways. The most common ownership and financing structures are described below.
5.4.1 Owner and Operator Financing The owner/operator financing structure is characterized by a single entity with the financial strength to fund all of the solar project costs and, if a private entity, sufficient tax appetite to utilize all of the project’s tax benefits. Private owners/operators typically establish a special purpose entity (SPE) that solely owns the assets of the project. An initial equity investment into the SPE is funded by the private entity using existing funds, and all of the project’s cash flows and tax benefits are utilized by the entity. This equity investment is typically matched with debt financing for the majority of the project costs. Project debt is typically issued as a loan based on each owner’s/operator’s assets and equity in the project. In addition, private entities can utilize any of federal tax credits offered.
For public entities that choose to finance, own, and operate a solar project, funding can be raised as part of a larger, general obligation bond; as a standalone tax credit bond; through a tax-exempt lease structure, bank financing, grant and incentive programs, or internal cash; or some combination of the above. Certain structures are more common than others and grant programs for solar programs are on the decline. Regardless, as tax-exempt entities, public entities are unable to benefit directly from the various tax-credit-based incentives available to private companies. This has given way to the now common use of third-party financing structures, such as the PPA.
5.4.2 Third-Party Developers with Power Purchase Agreements Because many project site hosts do not have the financial or technical capabilities to develop a capital-intensive project, many times they turn to third-party developers (and/or their investors). In exchange for access to a site through a lease or easement arrangement,
39
third-party developers will finance, develop, own, and operate solar projects, utilizing their own expertise and sources of tax equity financing and debt capital. Once the system is installed, the third-party developer will sell the electricity to the site host or local utility via a PPA—a contract to sell electricity at a negotiated rate over a fixed period of time. The PPA typically will be between the third-party developer and the site host if it is a retail (behind-the-meter) transaction or directly with an electric utility if it is a wholesale transaction.
Site hosts benefit by either receiving competitively priced electricity from the project via the PPA or land lease revenues for making the site available to the solar developer via a lease payment. This lease payment can take on the form of either a revenue-sharing agreement or an annual lease payment. In addition, third-party developers are able to utilize federal tax credits. For public entities, this arrangement allows them to utilize the benefits of the tax credits (low PPA price, higher lease payment) while not directly receiving them. The term of a PPA typically varies from 20–25 years.
5.4.3 Third-Party “Flip” Agreements The most common use of third-party “flip” agreements is a site host working with a third-party developer who then partners with a tax-motivated investor in an SPE that would own and operate the project. Initially, most of the equity provided to the SPE would come from the tax investor and most of the benefit would flow to the tax investor (as much as 99%). When the tax investor has fully monetized the tax benefits and achieved an agreed-upon rate of return, the allocation of benefits and majority ownership (95%) would flip to the site host (but not within the first 5 years). After the flip, the site host would have the option to buy out all or most of the tax investor’s interest in the project at the fair market value of the tax investor’s remaining interest.
A flip agreement can also be signed between a developer and investors within an SPE, where the investors would begin with the majority ownership. Eventually, the ownership would flip to the developer once each investor’s return is met.
5.4.4 Hybrid Financial Structures As the solar market evolves, hybrid financial solutions have been developed in certain instances to finance solar projects. A particular structure, nicknamed “The Morris Model” after Morris County, New Jersey, combines highly rated public debt, a capital lease, and a PPA. Low-interest public debt replaces more costly financing available to the solar developer and contributes to a very attractive PPA price for the site hosts. New Markets Tax Credits have been combined with PPAs and public debt in other locations, such as Denver and Salt Lake City.
5.4.5 Solar Services Agreement and Operating Lease The solar services agreement (SSA) and operating lease business models have been predominately used in the municipal and cooperative utility markets due to their treatment of tax benefits and the rules limiting federal tax benefit transfers from non-profit to for-profit companies. Under IRS guidelines, municipalities cannot enter capital leases with for-profit entities when the for-profit entities capture tax incentives. As a result, a number of business models have emerged as a work-around to this issue. One
40
model is the SSA, wherein a private party sells “solar services” (i.e., energy and RECs) to a municipality over a specified contract period (typically long enough for the private party to accrue the tax credits). The non-profit utility typically purchases the solar services with either a one-time, up-front payment equal to the turnkey system cost minus the 30% federal tax credit or may purchase the services in annual installments. The municipality may buy out the system once the third party has accrued the tax credits, but due to IRS regulations, the buyout of the plant cannot be included as part of the SSA (i.e., the SSA cannot be used as a vehicle for a sale and must be a separate transaction).
Similar to the SSA, there are a variety of lease options that are available to municipalities that allow the capture of tax benefits by third-party owners, which result in a lower cost to the municipality; these include an operating lease for solar services (as opposed to an equipment capital lease).
5.4.6 Sales/Leaseback In the widely accepted sales/leaseback model, the public or private entity would install the PV system, sell it to a tax investor, and then lease it back. As the lessee, they would be responsible for operating and maintaining the solar system as well as have the right to sell or use the power. In exchange for use of the solar system, the public or private entity would make lease payments to the tax investor (the lessor). The tax investor would have rights to federal tax benefits generated by the project and the lease payments. Sometimes, the entity is allowed to buy back the project at 100% fair market value after the tax benefits are exhausted.
5.4.7 Community Solar/Solar Gardens In the concept of “community solar,” the costs and benefits of one large solar project are shared by a number of participants. A site owner may be able to make the land available for a large solar project, which can be the basis for a community solar project. Ownership structures for these projects vary, but the large projects are typically owned or sponsored by a local utility. Community solar gardens are distributed solar projects wherein utility customers have a stake via a pro-rated share of the project’s energy output. This business model is targeted to meet demand for solar projects by customers who rent/lease homes or businesses, do not have good solar access at their sites, or do not want to install solar system on their facilities. Customer pro-rated shares of solar projects are acquired through a long-term transferrable lease of one or more panels, or they subscribe to a share of the project in terms of a specific level of energy output or the energy output of a set amount of capacity. Under the customer lease option, the customer receives a billing credit for the number of kilowatt-hours their pro-rated share of the solar project produces each month; it is also known as VNM. Under the customer subscription option, the customers typically pay a set price for a block of solar energy (i.e., 100 kWh per-month blocks) from the community solar project. Other models include monthly energy outputs from a specific investment dollar amount or a specific number of panels.
Community solar gardens and customer subscription-based projects can be owned solely by the utility, owned solely by third-party developers with facilitation of billing provided by the utility, or a joint venture between the utility and a third-party developer—leading

41
to eventual ownership by the utility after the tax benefits have been absorbed by the third-party developer.
There are some states that offer solar incentives for community solar projects, including Washington State (production incentive) and Utah (state income tax credit). Community solar is known as solar gardens depending on the location (e.g., Colorado).
42
6 Conclusions and Recommendations The site locations considered in this report have great potential and should be duly considered for implementation of solar PV systems. Installing PV systems on the Former Fort Ord site could generate approximately 125,713 MWh annually and represent the full amount of current power consumption for the area. Additionally, reusing land that cannot be used for other purposes would minimize the environmental impact of power production.
As summarized in Section 5, the economic analysis completed using SAM has an internal rate of return of 15% and predicts the LCOE to be $0.13–$0.15/kWh.
It is recommended that specific site owners or managers further pursue opportunities for solar system installations at the different sites on the Former FOAB.When reviewing proposals for a PV system to be installed at this site, evaluation criteria should include the annual output (kWh/yr) as well as price per kilowatt-hour. A design-build contract can enable vendors to optimize system configuration, including slope and tracking requirements or a specific system design can be required of the vendor. The next steps for solar development are:
1. Prioritize sites
2. Determine financing structure and create an RFP
3. Issue RFP
4. Review proposals
5. Award contracts.
For multiple reasons—the high cost of energy, the dropping cost of PV, and the existence of a good solar resource and probable incentives—this report finds that PV systems are a reasonable use for the proposed sites.
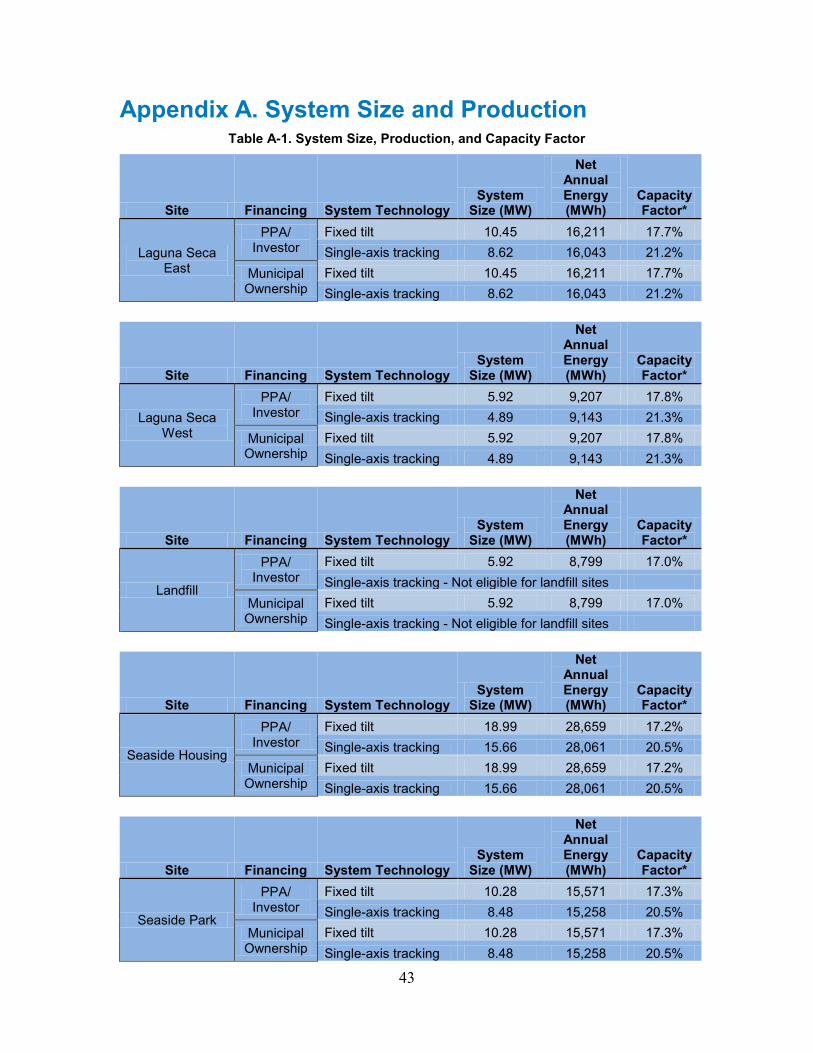
43
Appendix A. System Size and Production Table A-1. System Size, Production, and Capacity Factor
Site Financing System Technology System
Size (MW)
Net Annual Energy (MWh)
Capacity Factor*
Laguna Seca East
PPA/ Investor
Fixed tilt 10.45 16,211 17.7% Single-axis tracking 8.62 16,043 21.2%
Municipal Ownership
Fixed tilt 10.45 16,211 17.7% Single-axis tracking 8.62 16,043 21.2%
Site Financing System Technology System
Size (MW)
Net Annual Energy (MWh)
Capacity Factor*
Laguna Seca West
PPA/ Investor
Fixed tilt 5.92 9,207 17.8% Single-axis tracking 4.89 9,143 21.3%
Municipal Ownership
Fixed tilt 5.92 9,207 17.8% Single-axis tracking 4.89 9,143 21.3%
Site Financing System Technology System
Size (MW)
Net Annual Energy (MWh)
Capacity Factor*
Landfill
PPA/ Investor
Fixed tilt 5.92 8,799 17.0% Single-axis tracking - Not eligible for landfill sites
Municipal Ownership
Fixed tilt 5.92 8,799 17.0% Single-axis tracking - Not eligible for landfill sites
Site Financing System Technology System
Size (MW)
Net Annual Energy (MWh)
Capacity Factor*
Seaside Housing
PPA/ Investor
Fixed tilt 18.99 28,659 17.2% Single-axis tracking 15.66 28,061 20.5%
Municipal Ownership
Fixed tilt 18.99 28,659 17.2% Single-axis tracking 15.66 28,061 20.5%
Site Financing System Technology System
Size (MW)
Net Annual Energy (MWh)
Capacity Factor*
Seaside Park
PPA/ Investor
Fixed tilt 10.28 15,571 17.3% Single-axis tracking 8.48 15,258 20.5%
Municipal Ownership
Fixed tilt 10.28 15,571 17.3% Single-axis tracking 8.48 15,258 20.5%
44
Site Financing System Technology System
Size (MW)
Net Annual Energy (MWh)
Capacity Factor*
East Garrison ASP
PPA/ Investor
Fixed tilt 9.62 14,914 17.7% Single-axis tracking 7.93 14,713 21.2%
Municipal Ownership
Fixed tilt 9.62 14,914 17.7% Single-axis tracking 7.93 14,713 21.2%
Site Financing System Technology System
Size (MW)
Net Annual Energy (MWh)
Capacity Factor*
Youth Camp
PPA/ Investor
Fixed tilt 0.35 534 17.4% Single-axis tracking 0.29 524 20.6%
Municipal Ownership
Fixed tilt 0.35 534 17.4% Single-axis tracking 0.29 524 20.6%
Site Financing System Technology System
Size (MW)
Net Annual Energy (MWh)
Capacity Factor*
Marina Cypress Knolls
PPA/ Investor
Fixed tilt 22.44 31,616 16.1% Single-axis tracking 18.51 30,339 18.7%
Municipal Ownership
Fixed tilt 22.44 31,616 16.1%
Single-axis tracking 18.51 30,339 18.7%
Site Financing System Technology System
Size (MW)
Net Annual Energy (MWh)
Capacity Factor*
University of Califorina
Monterey Bay Education,
Science and Technology
Center
PPA/ Investor
Fixed tilt 4.36 6,622 17.3% Single-axis tracking 3.59 6,455 20.5%
Municipal Ownership
Fixed tilt 4.36 6,622 17.3%
Single-axis tracking 3.59 6,455 20.5% * Capacity factor is the ratio of delivered energy output to potential output at full capacity (i.e., if the panels were exposed to standard test conditions every hour of the year or 8,760 hours/year multiplied by the system nameplate capacity).
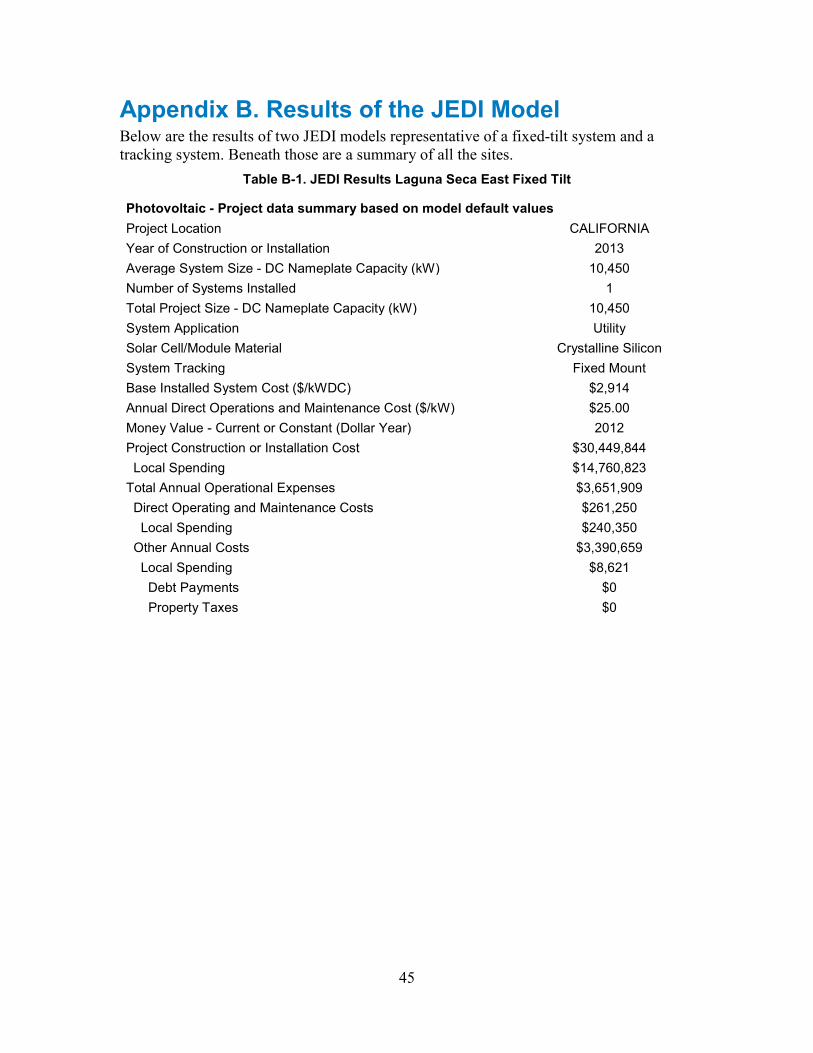
45
Appendix B. Results of the JEDI Model Below are the results of two JEDI models representative of a fixed-tilt system and a tracking system. Beneath those are a summary of all the sites.
Table B-1. JEDI Results Laguna Seca East Fixed Tilt
Photovoltaic - Project data summary based on model default values Project Location
CALIFORNIA
Year of Construction or Installation
2013 Average System Size - DC Nameplate Capacity (kW) 10,450 Number of Systems Installed
1
Total Project Size - DC Nameplate Capacity (kW)
10,450 System Application
Utility
Solar Cell/Module Material
Crystalline Silicon System Tracking
Fixed Mount
Base Installed System Cost ($/kWDC)
$2,914 Annual Direct Operations and Maintenance Cost ($/kW) $25.00 Money Value - Current or Constant (Dollar Year)
2012
Project Construction or Installation Cost
$30,449,844 Local Spending
$14,760,823
Total Annual Operational Expenses
$3,651,909 Direct Operating and Maintenance Costs
$261,250
Local Spending
$240,350 Other Annual Costs
$3,390,659
Local Spending
$8,621 Debt Payments
$0
Property Taxes
$0

46
Local Economic Impacts - Summary Results
Jobs Earnings Output
During construction and installation period
$000 (2012) $000 (2012) Project Development and On-Site Labor Impacts
Construction and Installation Labor 41.0 $2,656.60
Construction and Installation Related Services 47.0 $2,203.70 Subtotal 88.0 $4,860.30 $8,098.40
Module and Supply Chain Impacts Manufacturing 0.0 $0.00 $0.00
Trade (Wholesale and Retail) 10.0 $586.20 $1,763.80 Finance, Insurance, and Real Estate 0.0 $0.00 $0.00 Professional Services 13.8 $696.80 $2,362.70 Other Services 23.4 $1,713.90 $5,937.60 Other Sectors 34.7 $1,340.30 $2,569.10 Subtotal 82.0 $4,337.30 $12,633.20 Induced Impacts 60.0 $2,736.50 $9,723.40 Total Impacts 229.9 $11,934.10 $30,454.90
Annual Annual
Annual Earnings Output
During operating years Jobs $000 (2012) $000 (2012) On-Site Labor Impacts
PV Project Labor Only 2.4 $145.60 $145.60 Local Revenue and Supply Chain Impacts 0.8 $48.10 $158.80 Induced Impacts 0.7 $31.60 $112.30 Total Impacts 3.9 $225.30 $416.70 Notes: Earnings and output values are thousands of dollars in year 2012 dollars. Construction and
operating period jobs are full-time equivalent for one year (1 FTE = 2,080 hours). Economic impacts "during operating years" represent impacts that occur from system/plant operations/expenditures. Totals may not add up due to independent rounding.
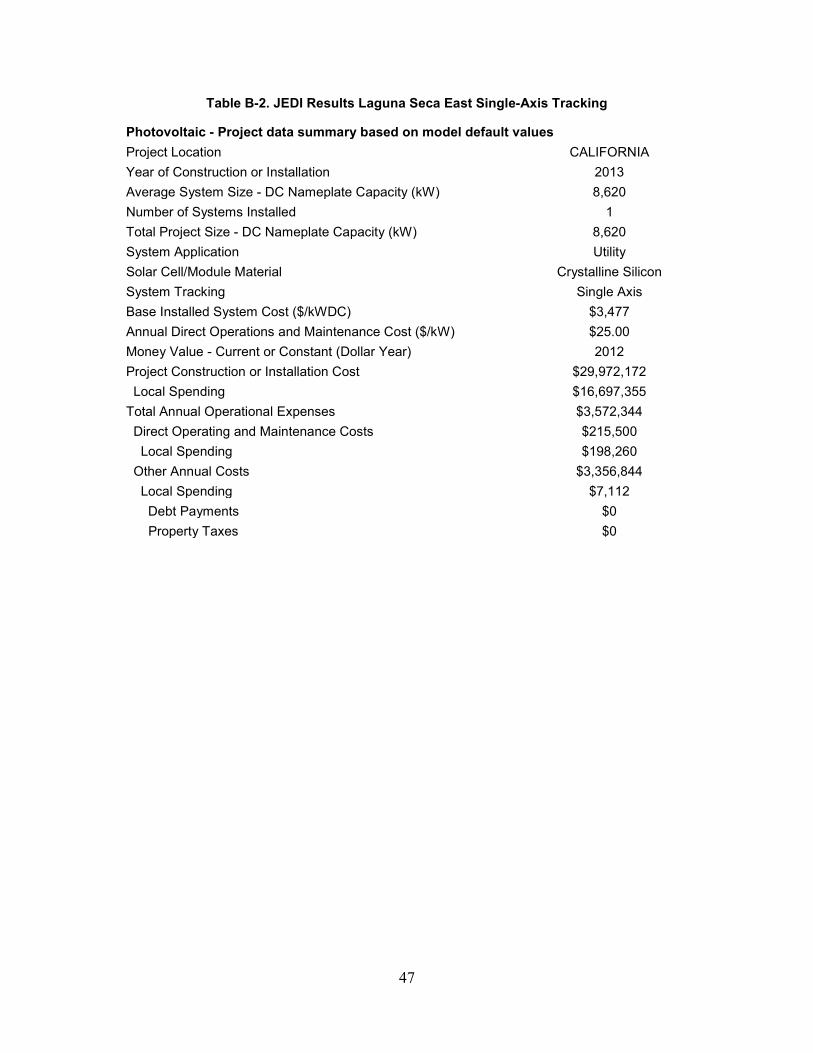
47
Table B-2. JEDI Results Laguna Seca East Single-Axis Tracking
Photovoltaic - Project data summary based on model default values Project Location
CALIFORNIA
Year of Construction or Installation
2013 Average System Size - DC Nameplate Capacity (kW) 8,620 Number of Systems Installed
1
Total Project Size - DC Nameplate Capacity (kW)
8,620 System Application
Utility
Solar Cell/Module Material
Crystalline Silicon System Tracking
Single Axis
Base Installed System Cost ($/kWDC)
$3,477 Annual Direct Operations and Maintenance Cost ($/kW) $25.00 Money Value - Current or Constant (Dollar Year)
2012
Project Construction or Installation Cost
$29,972,172 Local Spending
$16,697,355
Total Annual Operational Expenses
$3,572,344 Direct Operating and Maintenance Costs
$215,500
Local Spending
$198,260 Other Annual Costs
$3,356,844
Local Spending
$7,112 Debt Payments
$0
Property Taxes
$0
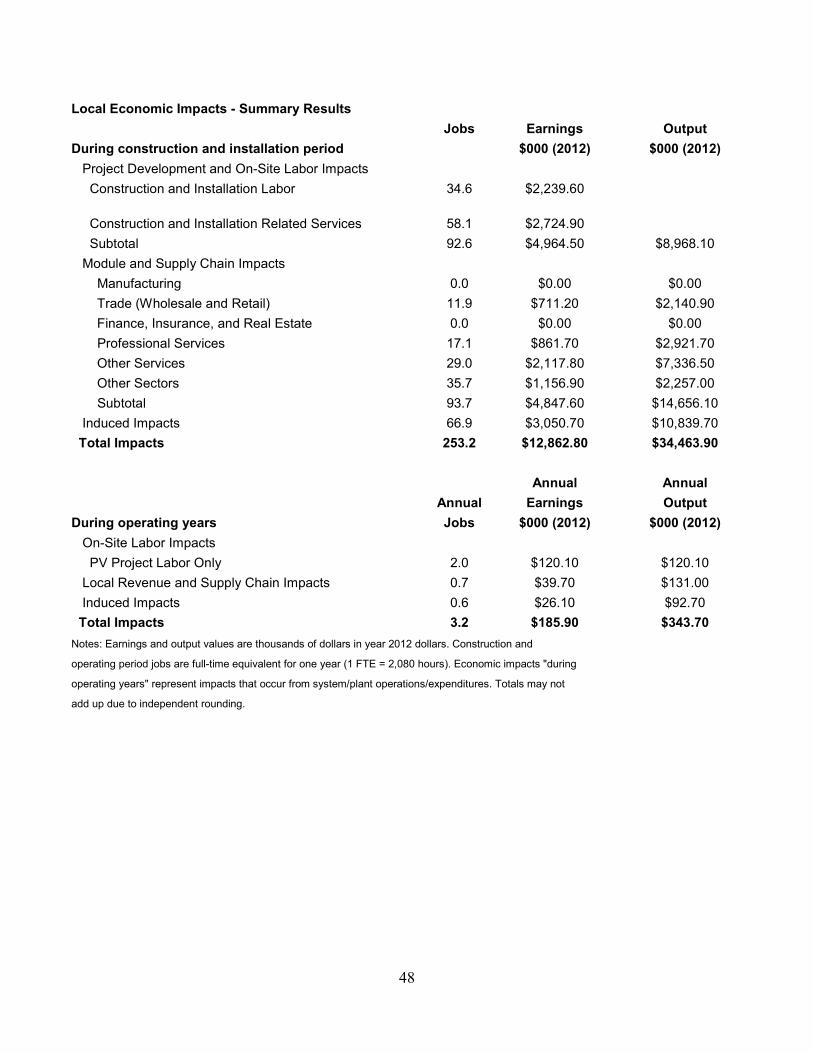
48
Local Economic Impacts - Summary Results
Jobs Earnings Output
During construction and installation period
$000 (2012) $000 (2012) Project Development and On-Site Labor Impacts
Construction and Installation Labor 34.6 $2,239.60
Construction and Installation Related Services 58.1 $2,724.90 Subtotal 92.6 $4,964.50 $8,968.10
Module and Supply Chain Impacts Manufacturing 0.0 $0.00 $0.00
Trade (Wholesale and Retail) 11.9 $711.20 $2,140.90 Finance, Insurance, and Real Estate 0.0 $0.00 $0.00 Professional Services 17.1 $861.70 $2,921.70 Other Services 29.0 $2,117.80 $7,336.50 Other Sectors 35.7 $1,156.90 $2,257.00 Subtotal 93.7 $4,847.60 $14,656.10 Induced Impacts 66.9 $3,050.70 $10,839.70 Total Impacts 253.2 $12,862.80 $34,463.90
Annual Annual
Annual Earnings Output
During operating years Jobs $000 (2012) $000 (2012) On-Site Labor Impacts
PV Project Labor Only 2.0 $120.10 $120.10 Local Revenue and Supply Chain Impacts 0.7 $39.70 $131.00 Induced Impacts 0.6 $26.10 $92.70 Total Impacts 3.2 $185.90 $343.70 Notes: Earnings and output values are thousands of dollars in year 2012 dollars. Construction and
operating period jobs are full-time equivalent for one year (1 FTE = 2,080 hours). Economic impacts "during operating years" represent impacts that occur from system/plant operations/expenditures. Totals may not add up due to independent rounding.
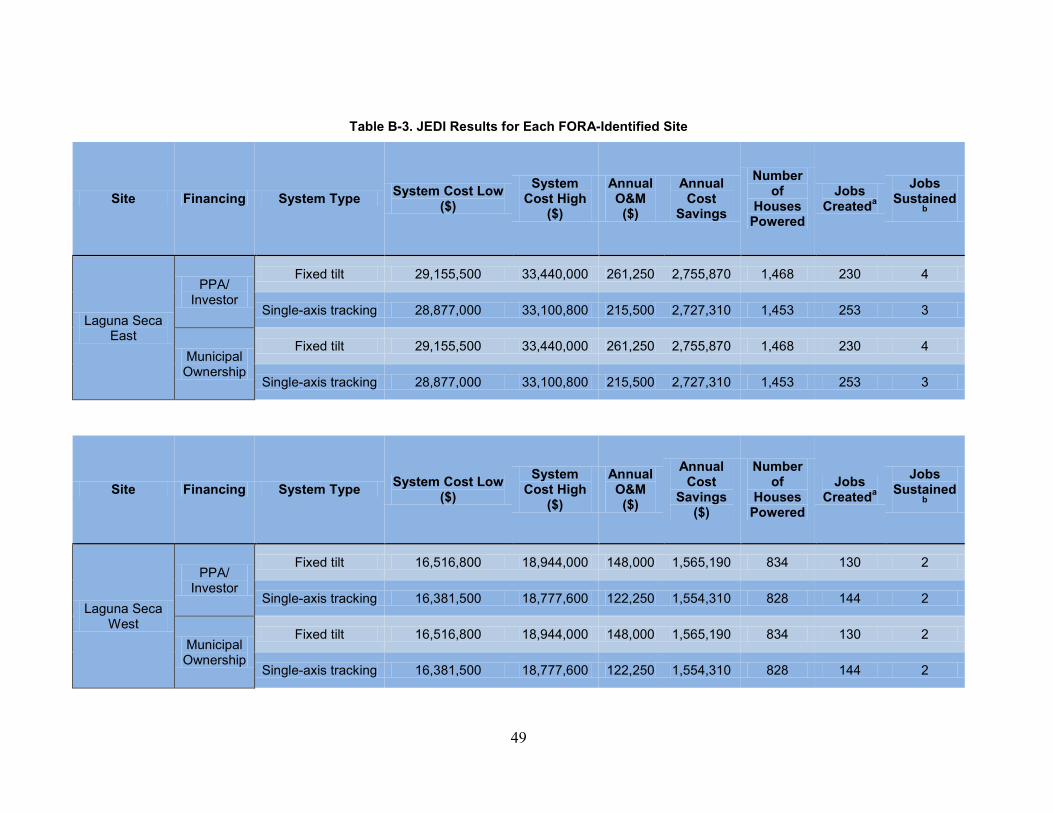
49
Table B-3. JEDI Results for Each FORA-Identified Site
Site Financing System Type System Cost Low ($)
System Cost High
($)
Annual O&M ($)
Annual Cost
Savings
Number of
Houses Powered
Jobs Createda
Jobs Sustained
b
Laguna Seca East
PPA/ Investor
Fixed tilt 29,155,500 33,440,000 261,250 2,755,870 1,468 230 4
Single-axis tracking 28,877,000 33,100,800 215,500 2,727,310 1,453 253 3
Municipal Ownership
Fixed tilt 29,155,500 33,440,000 261,250 2,755,870 1,468 230 4
Single-axis tracking 28,877,000 33,100,800 215,500 2,727,310 1,453 253 3
Site Financing System Type System Cost Low ($)
System Cost High
($)
Annual O&M ($)
Annual Cost
Savings ($)
Number of
Houses Powered
Jobs Createda
Jobs Sustained
b
Laguna Seca West
PPA/ Investor
Fixed tilt 16,516,800 18,944,000 148,000 1,565,190 834 130 2
Single-axis tracking 16,381,500 18,777,600 122,250 1,554,310 828 144 2
Municipal Ownership
Fixed tilt 16,516,800 18,944,000 148,000 1,565,190 834 130 2
Single-axis tracking 16,381,500 18,777,600 122,250 1,554,310 828 144 2
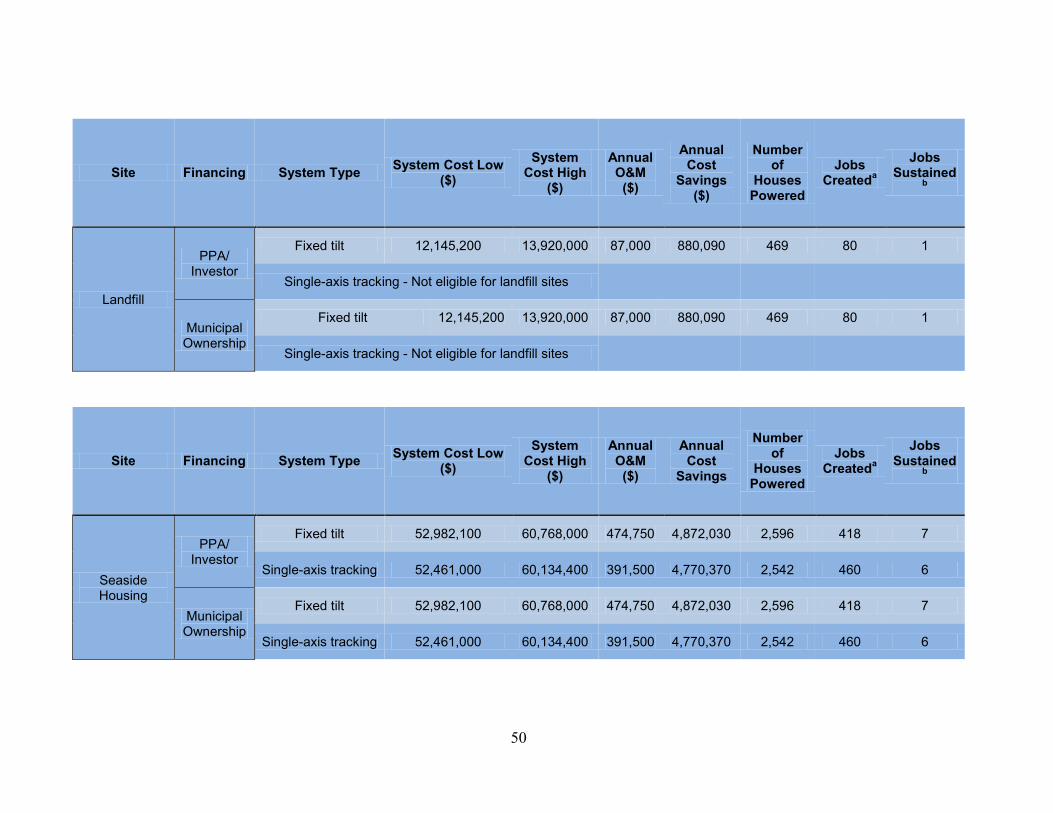
50
Site Financing System Type System Cost Low ($)
System Cost High
($)
Annual O&M ($)
Annual Cost
Savings ($)
Number of
Houses Powered
Jobs Createda
Jobs Sustained
b
Landfill
PPA/ Investor
Fixed tilt 12,145,200 13,920,000 87,000 880,090 469 80 1
Single-axis tracking - Not eligible for landfill sites
Municipal Ownership
Fixed tilt 12,145,200 13,920,000 87,000 880,090 469 80 1
Single-axis tracking - Not eligible for landfill sites
Site Financing System Type System Cost Low ($)
System Cost High
($)
Annual O&M ($)
Annual Cost
Savings
Number of
Houses Powered
Jobs Createda
Jobs Sustained
b
Seaside Housing
PPA/ Investor
Fixed tilt 52,982,100 60,768,000 474,750 4,872,030 2,596 418 7
Single-axis tracking 52,461,000 60,134,400 391,500 4,770,370 2,542 460 6
Municipal Ownership
Fixed tilt 52,982,100 60,768,000 474,750 4,872,030 2,596 418 7
Single-axis tracking 52,461,000 60,134,400 391,500 4,770,370 2,542 460 6
51
Site Financing System Type System Cost Low ($)
System Cost High
($)
Annual O&M ($)
Annual Cost
Savings
Number of
Houses Powered
Jobs Createda
Jobs Sustained
b
Seaside Park
PPA/ Investor
Fixed tilt 28,681,200 32,896,000 257,000 2,647,070 1,410 226 4
Single-axis tracking 28,408,000 32,563,200 212,000 2,593,860 1,382 249 3
Municipal Ownership
Fixed tilt 28,681,200 32,896,000 257,000 2,647,070 1,410 226 4
Single-axis tracking 28,408,000 32,563,200 212,000 2,593,860 1,382 249 3
Site Financing System Type System Cost Low ($)
System Cost High
($)
Annual O&M ($)
Annual Cost
Savings ($)
Number of
Houses Powered
Jobs Createda
Jobs Sustained
b
East Garrison Ammunition Supply Point
PPA/ Investor
Fixed tilt 26,839,800 30,784,000 240,500 2,535,380 1,351 212 4
Single-axis tracking 26,565,500 30,451,200 198,250 2,501,210 1,333 233 3
Municipal Ownership
Fixed tilt 26,839,800 30,784,000 240,500 2,535,380 1,351 212 4
Single-axis tracking 26,565,500 30,451,200 198,250 2,501,210 1,333 233 3
52
Site Financing System Type System Cost Low ($)
System Cost High
($)
Annual O&M ($)
Annual Cost
Savings ($)
Number of
Houses Powered
Jobs Createda
Jobs Sustained
b
Youth Camp
PPA/ Investor
Fixed tilt 976,500 1,120,000 8,750 90,780 48 8 0
Single-axis tracking 971,500 1,113,600 7,250 89,080 47 8 0
Municipal Ownership
Fixed tilt 976,500 1,120,000 8,750 90,780 48 8 0
Single-axis tracking 971,500 1,113,600 7,250 89,080 47 8 0
Site Financing System Type System Cost Low ($)
System Cost High
($)
Annual O&M ($)
Annual Cost
Savings ($)
Number of
Houses Powered
Jobs Createda
Jobs Sustained
b
Marina Cypress Knolls
PPA/ Investor
Fixed tilt 62,607,600 71,808,000 561,000 5,374,720 2,864 494 8
Single-axis tracking 62,008,500 71,078,400 462,750 5,157,630 2,748 544 7
Municipal Ownership
Fixed tilt 62,607,600 71,808,000 561,000 5,374,720 2,864 494 8
Single-axis tracking 62,008,500 71,078,400 462,750 5,157,630 2,748 544 7
53
Site Financing System Type System Cost Low ($)
System Cost High
($)
Annual O&M ($)
Annual Cost
Savings ($)
Number of
Houses Powered
Jobs Createda
Jobs Sustained
b
University of Califorina
Monterey Bay Education,
Science and Technology
Center T
PPA/ Investor
Fixed tilt 12,164,400 13,952,000 109,00 1,125,740 600 101 2
Single-axis tracking 12,026,500 13,785,600 89,750 1,097,350 585 121 2
Municipal Ownership
Fixed tilt 12,164,400 13,952,000 109,00 1,125,740 600 101 2
Single-axis tracking 12,026,500 13,785,600 89,750 1,097,350 585 121 2
a Jobs created as a result of project capital investment, including direct, indirect, and induced jobs. b Jobs (direct, indirect, and induced) sustained as a result of operations and maintenance (O&M) of the system.
54
Appendix C. Results of the System Advisor Model
Figure C-1. SAM results