Embed Size (px)
Citation preview

1
METI Feasibility Study
2015 global warming countermeasure technology dissemination for the
promotion of business
Feasibility study for JCM
projects through the
promotion of mass
dissemination of
high-efficiency solar pump
systems for irrigation in the
field of agriculture
Nidec Corp.
March 16th, 2016

2
CONTENT
TABLE OF FIGURES ........................................................................................................... 4
LIST OF UNITS AND ABBREVIATIONS .......................................................................... 6
1. BACKGROUND AND PURPOSE OF THIS STUDY ..................................................... 7
1.1 Background of this survey .......................................................................................... 7
1.1.1 Basic information of India ................................................................................... 8
1.1.2 Current status of India’s agriculture and irrigation .......................................... 9
1.1.3 Outlook to the greenhouse gas emissions situation in India .......................... 10
1.1.4 Situation of India-Japan bilateral credit system (JCM)................................... 11
1.2 The purpose of this survey ........................................................................................ 11
2. CURRENT STATUS OF SOLAR PUMP FOR IRRIGATION IN INDIA .................... 13
2.1 Subsidy and real number of sanctioned pumps ...................................................... 13
2.2 MNRE subsidy problems .......................................................................................... 15
2.3 Hearing to local farmers ........................................................................................... 15
2.3.1 Farm visit to Wagholi, Pune, Maharashtra ...................................................... 16
2.3.2 Farm visit to Bishangard Village, Jaipur, Rajasthan ...................................... 16
2.3.3 Farm visit to Ariyallur, Tamil Nadu ................................................................. 17
2.3.4 Farm visit to Thanjavur, Tamil Nadu ............................................................... 18
2.3.5 Summary of farm visits ...................................................................................... 18
2.4 Survey of indigenous solar pumps ........................................................................... 19
2.4.1 Results of the simulation of non-indigenous solar pumps ............................... 19
2.4.2 Survey of indigenous solar pumps..................................................................... 28
3. INSTALLATION AND OPERATION OF SOLAR PUMP PROTOTYPE .................... 30
3.1 Survey of the land used for installation .................................................................. 30
3.2 Survey of the installation procedure ........................................................................ 34
3.3 Testing in NISE ......................................................................................................... 39
3.4 Survey after the installation .................................................................................... 40
3.4.1 Set up ................................................................................................................... 40
3.4.2 Operation............................................................................................................. 40
3.4.3 Data acquisition .................................................................................................. 40
4. PLAN FOR THE MASS DISSEMINATION OF SOLAR PUMPS IN INDIA ............ 44
4.1 Future market forecast ............................................................................................. 44
5. STUDY OF EMISSION REDUCTION METHODOLOGY .......................................... 49

3
5.1 Study of JCM methodologies .................................................................................... 49
5.1.1 JCM methodologies under study ....................................................................... 49
5.1.2 Analysis with the JCM methodologies .............................................................. 50
5.2 Study of emissions reduction methodology ............................................................. 51
5.2.1 JCM methodology proposal ................................................................................ 51
5.3 Emission reduction estimates .................................................................................. 53
5.3.1 Parameter settings ............................................................................................. 53
5.3.2 Calculation of the reference emissions ............................................................. 54
5.3.3 Calculation of project emissions ........................................................................ 56
5.3.4 Calculation of emissions reduction with the estimated amount of project
dissemination ............................................................................................................... 57
6. EFFORTS TO STRENGTHEN RELATIONS FOR THE JCM WITH PARTNER
COUNTRY GOVERNMENT OFFICIALS ........................................................................ 59
6.1 Indian Ministry of Power, Coal, and New Renewable Energy ............................... 59
6.2 Indian Ministry of Agriculture ................................................................................. 60
6.3 Indian Ministry of New Renewable Energy (MNRE) ............................................. 61
7. POLICY RECOMMENDATION TO THE JCM PARTNER COUNTRY ..................... 62
7.1 First recommendation to the MNRE ....................................................................... 62
7.2 Second recommendation to the MNRE .................................................................... 64
8. CONCLUSION ................................................................................................................ 67

4
TABLE OF FIGURES
FIG. 1. GRAPH OF GROSS DOMESTIC PRODUCT (GDP) ..................................... 9
FIG. 2. GRAPH OF IRRIGATION CAPACITY .......................................................... 10
FIG. 3. GRAPHS OF CO2 EMISSION ........................................................................ 11
FIG. 4. DISTRIBUTION OF SANCTIONED SOLAR PUMPS ................................ 15
FIG. 5. SCHEMATIC OF A PUMP MEASURING DEVICE .................................... 20
FIG. 6. DIAGRAM OF THE VOLTAGE-CURRENT MEASUREMENT ................. 20
FIG. 7. SETUP OF THE PUMP ................................................................................. 21
FIG. 8. SETUP OF THE MEASURING DEVICE ..................................................... 21
FIG. 9. AMOUNT OF WATER WITH RESPECT TO THE INPUT POWER .......... 22
FIG. 10. EFFICIENCY CURVE OF EACH PUMP ................................................... 22
FIG. 11. ENVIRONMENTAL CONDITIONS AT THE SURVEY OF COMPANY L
(Germany) ............................................................................................................. 23
FIG. 12. SOLAR RADIATION IN A CONDITION OF FIXED HORIZONT ........... 24
FIG. 13. EARLY MAY TEMPERATURES OF NORTHWESTERN INDIA ............ 25
FIG. 14. DIURNAL VARIATION OF THE PANEL TEMPERATURE .................... 25
FIG. 15. TEMPERATURE SETTING AND THE SIMULATED OUTPUT VOLTAGE
OF THE POWER SUPPLY IN PUMP L (Germany) .......................................... 26
FIG. 16. NUMBER OF REVOLUTIONS AND INPUT POWER ............................. 26
FIG. 17. TEMPERATURE SETTING AND THE SIMULATED OUTPUT VOLTAGE
OF THE POWER SUPPLY IN PUMP G (Denmark) ......................................... 27
FIG. 18. INPUT POWER AND WATER OUTPUT IN PUMP G (Denmark) ........... 27
FIG. 19. EFFICIENCY OF COMPANY D (India) PUMP ......................................... 29
FIG. 20. MAP OF THE REGION OF IARI PUSA CAMPUS ................................... 31
FIG. 21. THE DIVISION OF AGRICULTURAL ENGINEERING .......................... 31
FIG. 22. DR. INDRA MANI (AT LEFT SIDE) ........................................................... 31
FIG. 23. NO SUNSHINE INTERFERENCE FROM SURROUNDING BUSHES . 31
FIG. 24. LOCATION OF THE CFMT&TI.................................................................. 32
FIG. 25. THE FIVE WELL LOCATIONS IN THE FARM AREA ............................ 33
FIG. 26. WELL #5 SUITABLE FOR A DEEP WELL PUMP ................................... 33
FIG. 27. SOLAR PUMP SYSYEM OF NIDEC .......................................................... 34
FIG. 28. CARGO ARRIVING TO IARI ....................................................................... 35
FIG. 29. 6" DIAMETER WELL ................................................................................... 35
FIG. 30. SETUP OF WELL’S LINE ........................................................................... 36
FIG. 31. PIPE AND PUMP CONNECTION .............................................................. 36

5
FIG. 32. WELL DEPTH MEASUREMENT ............................................................... 36
FIG. 33. WATER LEVEL SENSOR SETTING .......................................................... 36
FIG. 34. PUMP IMMERSION IN THE WELL .......................................................... 36
FIG. 35. PUMP WITH FLOW METER ...................................................................... 36
FIG. 36. MOUNTING BASE AND ANCHOR ............................................................ 36
FIG. 37. ASSEMBLY (FRAME TO BASE) ................................................................. 36
FIG. 38. FRAME MOUNTING ................................................................................... 37
FIG. 39. PV MODULE MOUNTING .......................................................................... 37
FIG. 40. PUMP OPERATION TEST .......................................................................... 37
FIG. 41. PANEL / CONTROLLER INSTALLATION COMPLETED ....................... 37
FIG. 42. CARGO ARRIVAL (STAND/PUMP) ............................................................ 38
FIG. 43. SOLAR PANEL ARRIVAL ............................................................................ 38
FIG. 44. WELL’S TURRET ......................................................................................... 38
FIG. 45. TURRET ........................................................................................................ 38
FIG. 46. CONCLUSION .............................................................................................. 38
FIG. 47. CONCLUSION .............................................................................................. 38
FIG. 48. CONTROLLER MOUNTING ...................................................................... 38
FIG. 49. SCREENSHOT OF KIBANA ....................................................................... 41
FIG. 50. BLOCK DIAGRAM OF THE IOT DATA COLLECTION .......................... 42
FIG. 51. VISUALIZATION OF SENSOR DATA USING KIBANA – SOLAR
IRRADIATION AND DCDC VOLTAGE ............................................................. 42
FIG. 52. DATA OF WATER OUTPUT ........................................................................ 43
FIG. 53. REAL WATER OUTPUT .............................................................................. 43
FIG. 54. STARTUP SCREEN ..................................................................................... 43
FIG. 55. LOGIN SCREEN .......................................................................................... 43
FIG. 56. MENU SCREEN ........................................................................................... 43
FIG. 57. MR. ASHWANI KUMAR .............................................................................. 61
FIG. 58. MR. ASHWANI KUMAR AND THE DIRECTOR OF IARI ....................... 61
FIG. 59. POINT FULFILLING MNRE REQUIREMENTS FOR NUMBER OF
SOLAR PANELS, POWER OUTPUT AND PUMP EFFICIENCY ................... 63
FIG. 60. TRANSITION OF THE ELECTRIC POWER GENERATED BY THE
FIRST DAY OF EACH TRACKING SYSTEM ................................................... 64
FIG. 61. WATER OUTPUT VS INPUT POWER OF THE STANDARD PUMP ..... 65
FIG. 62. PERFORMANCE CURVE DERIVATION OF THE PUMP OF
EFFICIENCY α .................................................................................................... 65
6
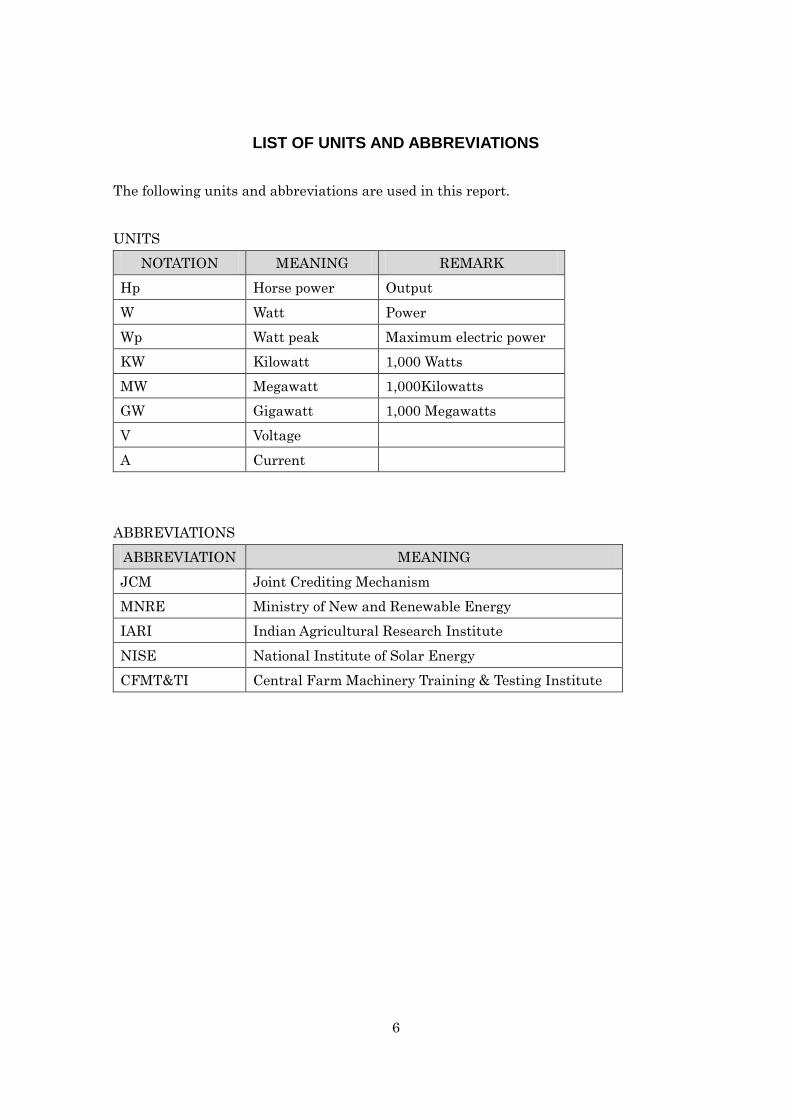
LIST OF UNITS AND ABBREVIATIONS
The following units and abbreviations are used in this report.
UNITS
NOTATION MEANING REMARK
Hp Horse power Output
W Watt Power
Wp Watt peak Maximum electric power
KW Kilowatt 1,000 Watts
MW Megawatt 1,000Kilowatts
GW Gigawatt 1,000 Megawatts
V Voltage
A Current
ABBREVIATIONS
ABBREVIATION MEANING
JCM Joint Crediting Mechanism
MNRE Ministry of New and Renewable Energy
IARI Indian Agricultural Research Institute
NISE National Institute of Solar Energy
CFMT&TI Central Farm Machinery Training & Testing Institute

7
1. BACKGROUND AND PURPOSE OF THIS STUDY
1.1 Background of this survey
Japan established and implemented the JCM to spread and implement greenhouse
gases (GHG) reduction technologies, products, systems, services, infrastructure, in
developing countries leading to achieve the reduction and absorption of GHG emissions,
along with the quantitative evaluation of the contribution of our country, and the
achievement of Japan's reduction target.
By October 1 of 2015, 15 countries (Mongolia, Bangladesh, Ethiopia, Kenya, Maldives,
Vietnam, Laos, Indonesia, Costa Rica, Palau, Cambodia, Mexico, Saudi Arabia, Chile
and Myanmar) already agreed to build the JCM system, and successively held bipartite
joint committees composed by the governments of the countries in order to begin with
the adoption of the necessary rules of operation and guidelines.
During the 20th United Nations Framework Convention on Climate Change Conference
of the United Nations held in December last year (COP20), representatives of 12
signatory countries (at that time) gathered together and held the first JCM high-level
round table. In this high-level round table, the promotion of the formation of projects
was confirmed and the progress of the JCM welcomed. The continuation of the
promotion of excellent low carbon technologies from Japan through the JCM, expected
to greatly contribute towards the reduction and absorption of GHG emissions on a
global scale was issued as a joint shared statement. In addition, in November 15 of 2013
by instructions of Prime Minister was established the "global warming diplomatic
strategy attack" for the JCM, where the Government of Japan aims at a double number
of signing countries in the following three years and accelerate the consultations with
related countries, support the formation of projects that would involve the transfer of
low-carbon technologies, and continue the implementation of such system with
developing countries.
The purpose of this study is to recommend a new policy to India associated with the
proposal of a business scheme aiming at the dissemination of low-carbon technologies
and products, show the usefulness of the JCM and the excellent low-carbon technologies
and products, along with a plan for their promotion in India, which could contribute to
the increase of countries signing the bilateral agreement.

8
1.1.1 Basic information of India
The Republic of India is the seventh largest country by area and the second most
populous country with over 1.276 billion people distributed in 29 states and 7 union
territories. India has no national language, but the official language of the government
is Hindi, having the largest number of speakers; English is regarded as a
supplementary language for business and administration only.
India shares land borders with Pakistan, China, Nepal, Bhutan, Myanmar (Burma) and
Bangladesh. It is one of the fastest-growing major economies in the world and
considered a newly industrialized country. Its economy is the world's seventh-largest by
nominal GDP, estimated to be 2.182 trillion USD in 2015. Its currency is the Indian
rupee (INR). The exchange rate with other foreign currency is: 68.53 INR = 1 USD; 0.61
INR = 1 JPY; 10.5 INR = 1 CNY (data of February 20, 2016). Figure 1 shows the
national GDP of India1.
The economy of India is strongly driven by its climate, influenced by the Himalayas and
the Thar Desert. The Himalayas prevent cold winds from blowing in, keeping the Indian
subcontinent warmer than most locations at similar latitudes. The Thar Desert attracts
the summer monsoon between June and October, providing the majority of India's
rainfall. The two major Himalayan-origin rivers that substantially flow through India
are the Ganges and the Brahmaputra. Other important rivers include the Yamuna, Kosi,
Godavari, Mahanadi, Kaveri, and Krishna.
Recently in 1991 India's economic policies changed towards liberalization with the goal
of making the economy more market oriented and expanding the role of private and
foreign investment. Specific changes include a reduction in import tariffs, deregulation
of markets, reduction of taxes, and greater foreign investment. The direction of
liberalization has remained the same irrespective of the ruling party, but it has not yet
solved difficult issues such as reducing agricultural subsidies and reforming labor laws.
By year 2011 the 486.6 million India’s labor force was the second largest in the world,
but yet 94% was part of the informal sector.
1 Source: https://en.wikipedia.org/wiki/Economic_development_in_India

9
FIG. 1. GRAPH OF GROSS DOMESTIC PRODUCT (GDP)
1.1.2 Current status of India’s agriculture and irrigation
Significant growth has been registered in the agricultural sector from the beginning of
the Green Revolution in the 1960’s in India, the period when agriculture increased its
yields due to improved agronomic technology, to the 1991 economic liberalization
reforms. Exports growth of over 10.1 % annually through the 1990s was a result of
contract farming and high value agricultural products, with 18.1% of India’s labor force
working in the agricultural sector. Major agricultural products included rice, wheat,
oilseed, cotton, jute, tea, sugarcane, and potatoes. By year 2003 agriculture accounted
for 22 % of India's GDP and employed 58% of the country's workforce. By now, India is
the world's largest producer of fruits, cashew nuts, coconuts, ginger, turmeric and
banana, the second largest producer of groundnut, wheat and vegetables, the third
largest producer of tobacco and rice, and the fourth largest producer of coarse grains.
For a country with two harvests being reaped per year, Indian products reach the world
via existing trading networks. However, currently even the rainfall water from the
double monsoons seasons (in summer and winter) cannot solve the problem of water
insufficiency.
After Indian farmers adopted modern agricultural practices, grid electricity and diesel
fuel pumps spread across the country, resulting in secondary negative effects: depletion
of ground water resources and increase of GHG. In the Punjab region of India, for
example, groundwater levels have dropped 10 meters since 1979.
The government of India introduced drip and micro irrigation systems earlier in the
year 1992 under centrally sponsored subsidies to attack the problem of depletion of
ground aquifers. The subsidy first offered up to 100% subsidy to small and marginal
farmers for setting up these irrigation facilities. In nowadays the subsidy has been
reduced to 25% to all farmers. Later in 2010 the Ministry of New and Renewable Energy
(MNRE) launched the Jawaharlal Nehru National Solar Mission (JNNSM) with the

10
target of deploying 100 GW of electricity from solar power by 2022, and replacing 19
million grid electricity pumps and 7 million diesel pumps with solar pumps. The two
subsidy plans appear to be unofficially linked with each other in practice. Figure 2
shows the irrigation capacity in India2.
FIG. 2. GRAPH OF IRRIGATION CAPACITY
1.1.3 Outlook to the greenhouse gas emissions situation in India
The Bharat stage emission standards are emission standards instituted by the
Government of India first introduced in the year 2000 to regulate the output of air
pollutants from internal combustion engine equipment, including motor vehicles. The
standards and the timeline for implementation are set by the Central Pollution Control
Board under the Ministry of Environment & Forests and Climate Change. Since April
2012, current Bharat stage IV norms have been enforced across 13 major cities of the
country.
From the time the MNRE implemented the JNNSM, India's air quality has improved
and some regions witnessing 30 to 65% reduction of GHG. But even at these lower levels,
the emissions are higher than those recommended by the World Health Organization.
In 2007 there were nearly 75 GW of aggregate capacity from diesel generator sets with
unit sizes between 100 KW to 1 MW, making India’ CO2 emission among the world’s top
with 1,221.76 million tons. In the year 2012-13, India consumed 15.744 million tons of
petrol and 69.179 million tons of diesel, increasing to 2,070 million tons the CO2
emissions with a large part coming from 4 to 5 million diesel powered pumps, each
consuming about 3.5 kilowatts. India’ CO2 emission is among the world’s top with 2,070
million tons in the year 2013. Figure 3 shows the emissions of CO2 in India and in the
world3.
2 Source: Agriculture Census: 2011 Government of India, Table 2, page 16. Global map of irrigated areas: India FAO-United Nations
and Bonn University, Germany (2013) 3 Sources: EDGARv4.3, European Commission, Joint Research Centre (JRC)/PBL Netherlands Environmental Assessment Agency.

11
FIG. 3. GRAPHS OF CO2 EMISSION
1.1.4 Situation of India-Japan bilateral credit system (JCM)
The government of Japan through METI has signed agreement for the implementation
of the JCM scheme with the following countries: Mongolia, Bangladesh, Ethiopia,
Kenya, Maldives, Viet Nam, Laos, Indonesia, Costa Rica, Palau, Cambodia, Mexico,
Saudi Arabia, Chile, Myanmar and Thailand.
1.2 The purpose of this survey
Irrigation water for agriculture in India is largely dependent on the pumping of
groundwater due to the insufficiency from the rivers. The existing inefficient irrigation
pumps push up the ratio of power used by the agriculture sector, resulting in policies for
energy subsidy for the large number of low-income farmers that have become a major
factor of pressure to the country's energy supply and finance.
If it could be possible the mass dissemination of solar power generation and power
supply independent irrigation pumps (called solar pumps), and promote the
replacement of grid connected and diesel fuel pumps, then a big reduction of the load on
the power supply system as well as GHG emissions could happen.
For this purpose, the MNRE started 10 years ago a policy of subsidy for the
dissemination of solar pumps, but although a budget for about ten million units is
prepared every year, from a number around 35 million of irrigation pumps that exist
throughout India, the very limited penetration of solar pumps is of less than two million
units. The mentioned budget for the introduction of solar pump has not been totally
digested, and replacement has not progressed.
Emission Database for Global Atmospheric Research (EDGAR), release version 4.3. http://edgar.jrc.ec.europe.eu

12
The causes why the dissemination of the solar pump does not proceed in spite of the
subsidy policy are: due to the amount of water output from inefficient pumps is
insufficient, multiple failures due to unstable operation of the solar system and the
pump, and the mentality that the existing products cannot meet the local expectations.
Also, subsidy rules set by the MNRE (for example, the case where the capacity of the
pump motor is 3 HP but the uniform capacity of solar panels of 3KW exceeds the
specification, or the obligation of a type of solar panel mounting frame which is not
efficient at solar tracking, etc.) are some of the problems that officials from the Ministry
of Agriculture are questioned by users.
Therefore, for the large amount of power consumption due to the spread of inefficient
pumps and the problem that it has produced to India, in the use of the JCM in this
study covering the dissemination of high-efficiency solar pumps and promoting the
migration from grid connected pumps to solar pumps, for the purpose of reduction of
GHG emissions in India, the following investigation and examination is conducted.

13
2. CURRENT STATUS OF SOLAR PUMP FOR IRRIGATION IN INDIA
When the MNRE implemented the Jawaharlal Nehru National Solar Mission (JNNSM)
and provided subsidies for the procurement of solar pumps, the growth of businesses
related to manufacturing and sales of solar systems came along with the one for solar
pumps. This chapter describes and explains the program of subsidies under the
JNNSM.
2.1 Subsidy and real number of sanctioned pumps
The JNNSM was launched on the 11th of January, 2010 by the Prime Minister of India.
The mission has set the ambitious target of deploying 100 GW of electricity from solar
power by 2022. It is planned following three phases:
First phase, 2012 and up to March 2013
Second phase from 2013 to 2017
Third phase from 2017 to 2022
The target is split between 60 GW of utility scale projects, like solar parks in different
states, and 40 GW of rooftop, other smaller grid electricity projects and off-grid projects
like solar pump systems.
There are 2 types of solar systems under consideration for the plan:
Grid electricity systems
Off-grid systems
The enabling policy framework is different for grid electricity projects and off-grid solar
projects. solar pump systems fall in the category of solar off-grid projects.
Based on the current energy capacity in India (40GW of grid electricity and 38GW of
off-grid including hydraulic, wind, and other renewable energy), the distribution of the
additional capacity is:
Segment Target Phase 1 Accum Phase 2 Accum Phase 3
Grid connected 1,100 MW 10,000 MW 20,000 MW
Off-grid systems 200 MW 1,000 MW 2,000 MW
Available information about subsidy distribution for the 1st phase
The Indian Government decided the implementation of this phase by approving a
combination of low interest bearing loans and/or central financial assistance, thru the

14
biddings of two batches. In batch 1 the capacity addition was 650 MW of grid connected
solar energy plants, and in batch 2 the remaining capacity was awarded. The capacity
addition for off-grid system came from small solar generation plants, like rooftop plants
with capacity less than 2 MW.
1100 MW capacity grid electricity solar projects
200 MW capacity off-grid solar applications
Number of solar pumps: 17,500 sets
Total fund: 2.995 billion Rupees (5.5 billion yen)
Available information about subsidy distribution for the 2nd phase
The Indian Government extended the implementation of the plan, not just focusing in
grid connected solar energy plants, but also focusing in off-grid small-scale systems,
allocating a larger number of solar pumps in selected states upon approval.
8900 MW capacity grid connected solar projects, with 6,000 MW from state
schemes
800 MW capacity off-grid solar applications
Number of solar pumps: 100,000 sets (20,00 between year 2014 and 2015,
30,000 between 2015 and 2016, and the rest between 2016 and 2017)
Fund for 2014 and 2015: 4 billion Rupees (7.3 billion yen)
Available information about fund distribution for the 3rd phase
10,000 MW capacity grid connected solar projects
1,000 MW capacity off-grid solar applications
Other relevant information about the fund is not available at the moment.
The official number of sanctioned solar pumps under the subsidy of the JNNSM during
the course of the 2nd phase, for the period between the year 2014 and 2015, according to
the state where these were installed is presented in the fig. 4. It accounts for only 38%
(7,518 solar pumps) from the target of 20,000 set by the MNRE.

15
FIG. 4. DISTRIBUTION OF SANCTIONED SOLAR PUMPS4
2.2 MNRE subsidy problems
Regarding the scarce segregation of the subsidy, there are a few problems to highlight:
Obtaining approvals from MNRE takes anywhere between 6 months to 1 year.
Application is a painfully slow process to farmers due to the lack of information.
Subsidy is limited to the purchase of solar pumps made by members of an
association endorsed by MNRE.
Farmers might need to adopt drip or micro irrigation system in exchange for
accepting MNRE subsidies to buy solar pumps. This irrigation system belongs to a
different central subsidy scheme.
Farmers who qualify to the subsidy must hurdle bank’s high interest rates of
around 13.75% to finance in a regular period of 5 year the rest of the solar pump.
In this study, the basis for reduction of the initial cost of our prospective considers:
a) introducing high-efficiency pumps expected to be developed in the future that
could allow reducing the number of solar panels, and b) omitting the tracking
mechanism and the related maintenance labor. But the benefit cannot be obtained
due to the requirements of the MNRE about a fixed output from the solar panels
and indispensable tracking mechanism.
2.3 Hearing to local farmers
In order for farmers to increase their income and earn a reasonable livelihood, by
improving the efficiency of conveying and applying water from the source to high-value
crops, they have learnt how to optimize water usage and lower the cost of pumping.
4 Sources: Ministry of New & Renewable energy, SPV Off-Grid Division. http://mnre.gov.in/

16
We visited four farms in India in order to conduct a direct hearing with the farmers,
understand the local conditions, confirm current farming practices and verify the
digestion of the MNRE subsidy.
2.3.1 Farm visit to Wagholi, Pune, Maharashtra
The first hearing was conducted on December 23th, 2015. The solar pump system was
manufactured by Span Motors, and installed 9 months ago, at 195 feet in a bore well of
7.5 inches diameter and water level at 100 feet. The farm size is 3 acres. It has a tank
for water storage with floating sensor measuring the water level and automatically
turning the pump ON and OFF. Each solar panel has the following specifications:
SPEC VALUE
Maximum power (MP) 225 Wp
Open circuit voltage 36.2 V
Short circuit current 8.11 A
Voltage at MP 29.6 V
Current at MP 7.61 A
The total power of the system of 8 solar panels is 1.8KW, and the system is installed in
such a way that it will get both AC power from the grid and DC power from the solar
panel. The system has a DC motor of 2 HP.
Some relevant comments provided by the farmer are: 1) the solar pump system was
installed without MNRE subsidy, 2) this system requires less maintenance compared
with a diesel fuel pump, and 3) dust sediments on top of the solar panels need to be
manually cleaned up frequently, at least once every three days, requiring additional
manpower for this task.
2.3.2 Farm visit to Bishangard Village, Jaipur, Rajasthan
The second hearing was conducted on December 30th, 2015. The solar pump was
manufactured by Shakti and installed 3 years ago, at 70 meters in the well of 80 meters
depth. It pumps water to a drip filter system which in turn irrigates the 2 acres farm
land. Each solar panel has the following specifications:
17
SPEC VALUE
Maximum power (MP) 230 Wp
Open circuit voltage 36.0 V
Short circuit current 8.40 A
Voltage at MP 30.0 V
Current at MP 7.70 A
The total power of the system of 14 solar panels is 3.22KW, and it features an automatic
maximum power point tracking (MPPT) system. This tracking system gets its power
supply from two 10W solar panels and a 12V battery backup system. The tracking
system will change the position angle of the solar panels of the solar pump every 15
minutes. The system has an AC motor of 3 HP.
Some relevant comments provided by the farmer are: 1) the solar pump system was
installed with an MNRE subsidy of 86%, 2) dust sediments on top of the solar panels
need to be manually cleaned up, 3) currently the automatic MPPT system is not
working, but yet the farmer is not much concern about it; in fact he prefers not having it
due to problems with the battery maintenance and security, and 4) technical support is
not immediately available due to the remote location of the farm, 5) crops are lemon and
vegetables.
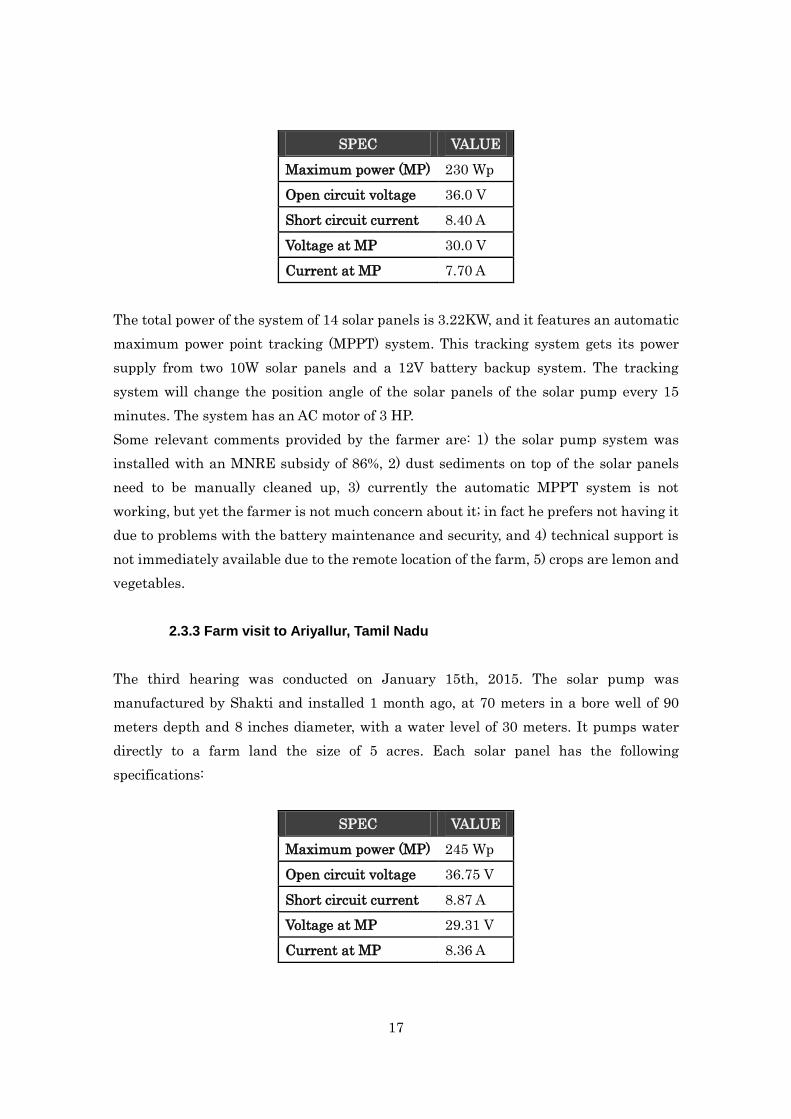
2.3.3 Farm visit to Ariyallur, Tamil Nadu
The third hearing was conducted on January 15th, 2015. The solar pump was
manufactured by Shakti and installed 1 month ago, at 70 meters in a bore well of 90
meters depth and 8 inches diameter, with a water level of 30 meters. It pumps water
directly to a farm land the size of 5 acres. Each solar panel has the following
specifications:
SPEC VALUE
Maximum power (MP) 245 Wp
Open circuit voltage 36.75 V
Short circuit current 8.87 A
Voltage at MP 29.31 V
Current at MP 8.36 A
18
The total power of the system of 20 solar panels connected in series is 4.9KW. The
system has AC motor of 5 HP. It features an auto tracking system changing the angle of
the solar panels every 15 minutes.
Some relevant comments provided by the farmer are: 1) the solar pump system was
installed with an MNRE subsidy of 80%, 2) it comes with a lightning arrester and
grounding, 3) crops are eucalyptus and vegetables.
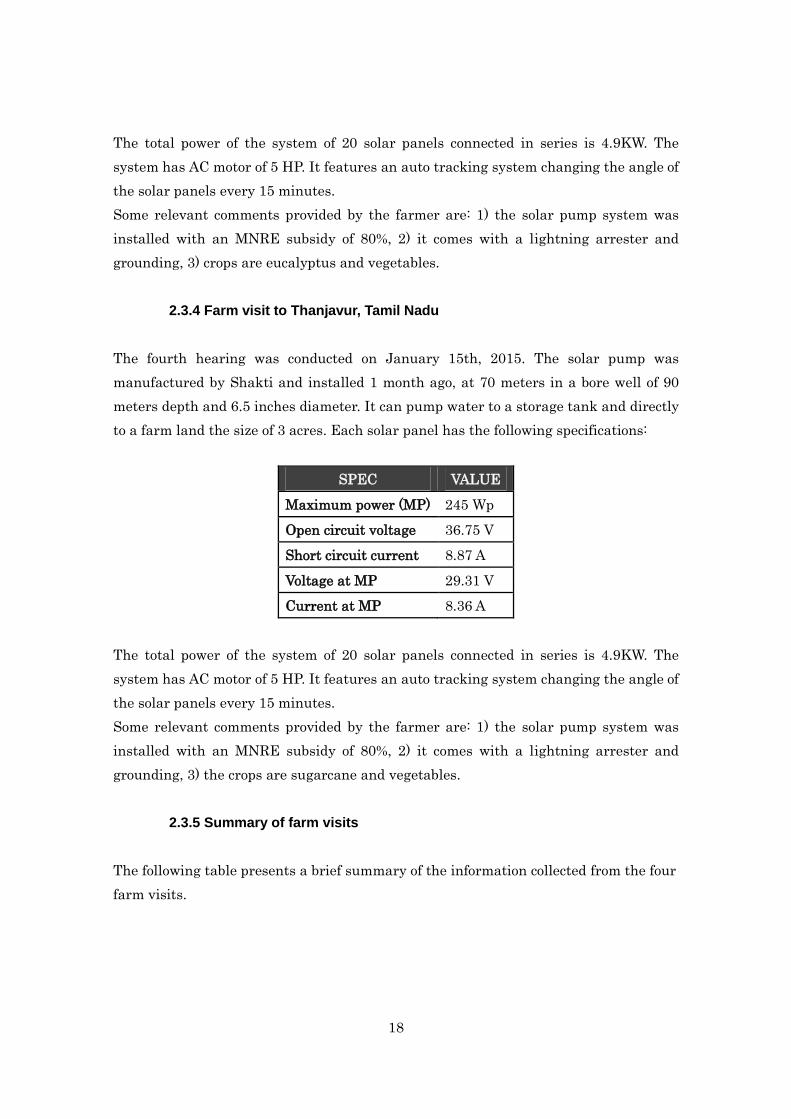
2.3.4 Farm visit to Thanjavur, Tamil Nadu
The fourth hearing was conducted on January 15th, 2015. The solar pump was
manufactured by Shakti and installed 1 month ago, at 70 meters in a bore well of 90
meters depth and 6.5 inches diameter. It can pump water to a storage tank and directly
to a farm land the size of 3 acres. Each solar panel has the following specifications:
SPEC VALUE
Maximum power (MP) 245 Wp
Open circuit voltage 36.75 V
Short circuit current 8.87 A
Voltage at MP 29.31 V
Current at MP 8.36 A
The total power of the system of 20 solar panels connected in series is 4.9KW. The
system has AC motor of 5 HP. It features an auto tracking system changing the angle of
the solar panels every 15 minutes.
Some relevant comments provided by the farmer are: 1) the solar pump system was
installed with an MNRE subsidy of 80%, 2) it comes with a lightning arrester and
grounding, 3) the crops are sugarcane and vegetables.
2.3.5 Summary of farm visits
The following table presents a brief summary of the information collected from the four
farm visits.

19
Visit 1 Visit 2 Visit 3 Visit 4
Location Wagholi, Pune Bishangard,
Rajasthan
Ariyallur,
Tamil Nadu
Thanjavur,
Tamil Nadu
Depth of Bore
well
100 m 80 m 90 m 90 m
Diameter of
Bore well
7.5 inches 6 inches 8 inches 6.5 inches
Manufacturer
of pump
Span motors Shakti Ltd Shakti Ltd Shakti Ltd
Capacity 2 HP 3 HP 5 HP 5 HP
Diameter of
pump
6 inches 5 inches 6 inches 6 inches
Solar panel 225 W, total 8,
4 in series & 2
parallel string
230 W, 14
panels all in
series
245 W, 20
panels all in
series
245 W, 20
panels all in
series
Tracking
system
Fixed (no
tracking)
Automatic
tracking
Automatic
tracking
Automatic
tracking
Subsidy No 86% 80% 80%
2.4 Survey of indigenous solar pumps
As part of examining the possibility of contributing to the prevention of global warming
by deploying high-efficient advanced pumps having Japanese technology in developing
countries, we conducted a survey of performance of pumps having advanced technology
from manufacturers of other countries that our prospective pump will have to compete
against (company names are omitted, and instead a code letters are used): G (Denmark),
F (USA), L (Germany) and R (India).
2.4.1 Results of the simulation of non-indigenous solar pumps
The evaluation results of the pumps manufactured with technology from other countries
in this section follow to the description of the conditions of the experiments.
Experimental apparatus and method for creating pump efficiency curve
Figures 5 and 6 show the diagram of the configuration of the measurement apparatus.
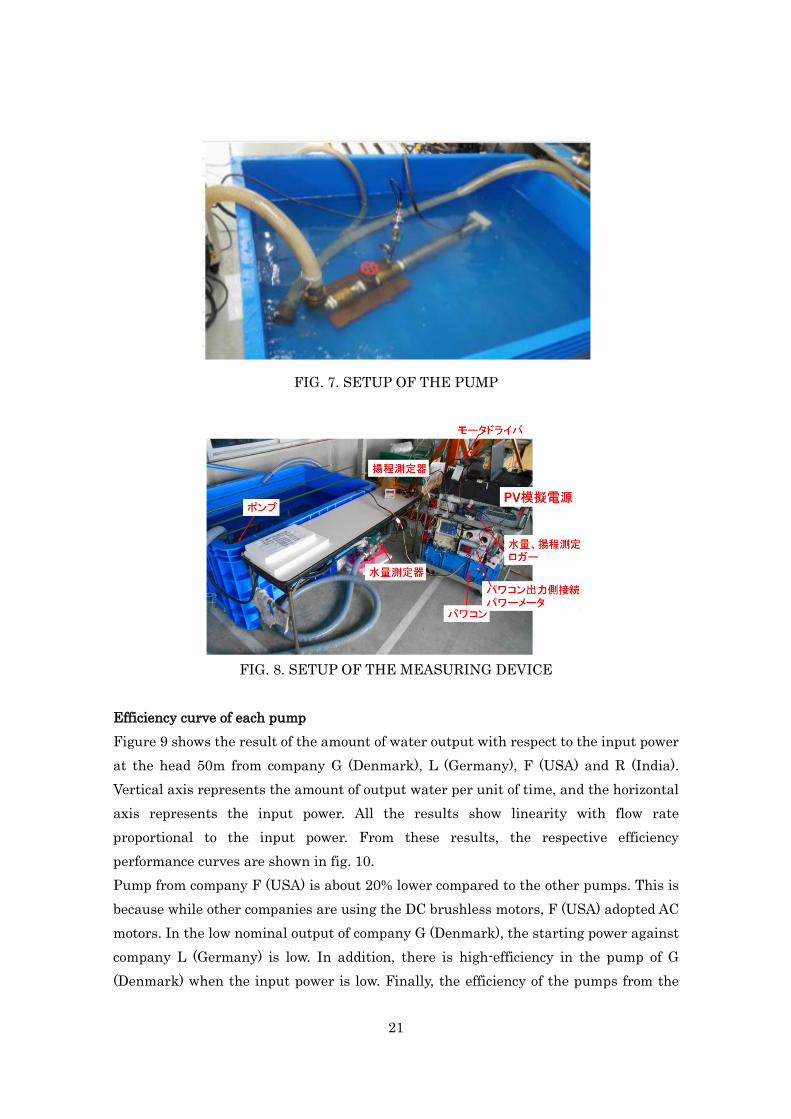
Figures 7 and 8 are pictures of the apparatus and the configuration at the evaluation

20
test. We connected the voltage from a stable power supply to the power conditioner
(driver). From the connected voltage, the power was 2.5 KW, 2 KW, 1.5 KW, 1 KW and
0.5 KW. We connected a pipe to the pump of the same diameter, mounted a valve to
control the pressure, and by adjusting the pressure we simulated the head of the well.
The pressure gauge and flow meter were connected to the conditioner (display unit), the
pump submerged in a water bath, and signals from the pressure gauge and flow meter
were monitored. The water output from the pump was returned over and over again to
the water bath. Voltage and current measurement were taken using an oscilloscope.
Pressure gauge, flow meter and the oscilloscope were connected to a data logger.
Recording of the data was synchronized with respect to the start-up. We registered the
amount of output water for an adjustment of pump head equal to 50m.
FIG. 5. SCHEMATIC OF A PUMP MEASURING DEVICE
FIG. 6. DIAGRAM OF THE VOLTAGE-CURRENT MEASUREMENT
21
FIG. 7. SETUP OF THE PUMP
FIG. 8. SETUP OF THE MEASURING DEVICE
Efficiency curve of each pump
Figure 9 shows the result of the amount of water output with respect to the input power
at the head 50m from company G (Denmark), L (Germany), F (USA) and R (India).
Vertical axis represents the amount of output water per unit of time, and the horizontal
axis represents the input power. All the results show linearity with flow rate
proportional to the input power. From these results, the respective efficiency
performance curves are shown in fig. 10.
Pump from company F (USA) is about 20% lower compared to the other pumps. This is
because while other companies are using the DC brushless motors, F (USA) adopted AC
motors. In the low nominal output of company G (Denmark), the starting power against
company L (Germany) is low. In addition, there is high-efficiency in the pump of G
(Denmark) when the input power is low. Finally, the efficiency of the pumps from the
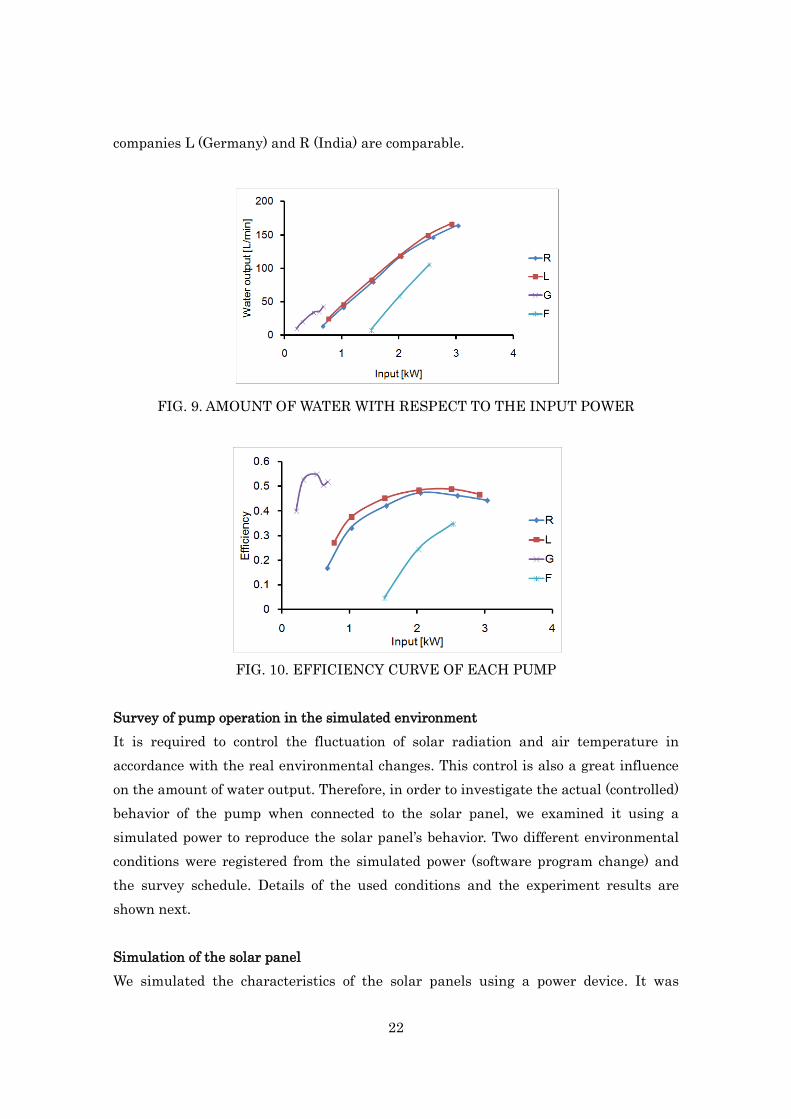
22
companies L (Germany) and R (India) are comparable.
FIG. 9. AMOUNT OF WATER WITH RESPECT TO THE INPUT POWER
FIG. 10. EFFICIENCY CURVE OF EACH PUMP
Survey of pump operation in the simulated environment
It is required to control the fluctuation of solar radiation and air temperature in
accordance with the real environmental changes. This control is also a great influence
on the amount of water output. Therefore, in order to investigate the actual (controlled)
behavior of the pump when connected to the solar panel, we examined it using a
simulated power to reproduce the solar panel’s behavior. Two different environmental
conditions were registered from the simulated power (software program change) and
the survey schedule. Details of the used conditions and the experiment results are
shown next.
Simulation of the solar panel
We simulated the characteristics of the solar panels using a power device. It was

23
studied under the conditions of an array connected all in series providing 2,400 Wp.
Environmental conditions in the investigation of the pump from company L (Germany)
The environmental conditions used in the investigation of the pump from L (Germany)
are shown in fig. 11. Panel temperature and solar radiation were set as the
environmental conditions. Purple line represents temperature, and the yellow one is the
solar radiation. The horizontal axis is the time.
FIG. 11. ENVIRONMENTAL CONDITIONS AT THE SURVEY OF COMPANY L
(Germany)
Environmental conditions in the investigation of the pump from company G (Denmark)
Sunlight conditions used in the investigation of company G (Denmark) were
transformations in order to meet the requirements defined by the MNRE of 7.15
KWh/day. The result of the transformation is shown in fig. 12. In brief, the
transformation used data taken on May 1st over with the solar panel of the institute
within the joint research in a fixed horizontal plane over the place of Jalgaon,
Maharashtra, India as a base, assumes the direct solar radiation on the solar panel,
calculates the cosine of the angle between the fixed horizontal plane and the straight
normal line joining the midpoints of the sun and the panel, and to obtain the solar
radiation from the azimuth and elevation, the maximum value of the solar radiation
was fixed in such a way that it turns 7.15 KWh/day along the axis of time by
extrapolation.

24
FIG. 12. SOLAR RADIATION IN A CONDITION OF FIXED HORIZONT
Temperature conditions in the investigation of the pump from company G (Denmark)
Temperature conditions used in the investigation of the pump from company G
(Denmark) were based on the temperature data on May 1st over a northwestern city
similar to New Delhi, India. The formula5 for the calculation of temperature of the solar
panels assumed the wind was blowing at average speed of 1m/sec. The reference value
(NOCT) was a measure from July 27 of 2015 over Koriyama: under a condition of 1000
W/m2 of solar radiation and 34℃ of temperature, the result of the panel temperature
was 68℃. Temperatures shown in fig. 15 were calculated on the basis of the diurnal
variation of temperature of one day in early May. Figure 13 shows the results of diurnal
variations in panel temperature calculated for the previous conditions.
T_cell: Panel temperature [℃]
T_air: Environment temperature [℃]
NOCT: Panel temperature at 800w/m2 irradiation and 25℃ [℃]
S: Solar irradiation [W/m2]
5 Source: http://www.solareducation.org/solarcdrom/modules/nominal-operating-cell-temperature

25
FIG. 13. EARLY MAY TEMPERATURES OF NORTHWESTERN INDIA6
FIG. 14. DIURNAL VARIATION OF THE PANEL TEMPERATURE
SURVEY RESULTS FOR EACH PUMP
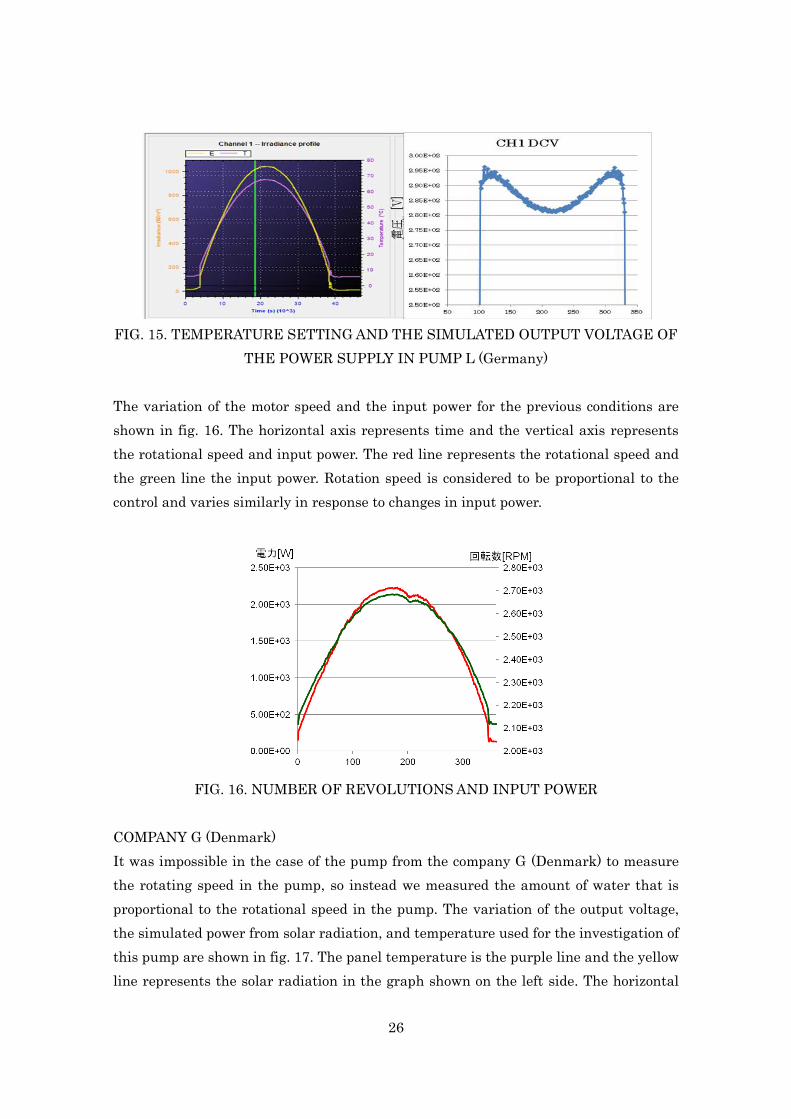
COMPANY L (Germany)
The variation of the output voltage from the simulated power and the conditions of solar
radiation and temperature used this pump investigation are shown in fig. 15. In the left
graph the panel temperature is shown with the purple line on the left, and the yellow
line represents the solar radiation. The horizontal axis is the time. Graph in the right
figure represents the output voltage from the simulated power. The horizontal axis
represents time and the vertical axis represents the voltage. The voltage decreases
when the temperature rises, and increases when the temperature decreases. Maximum
power point tracking (MPPT) is the voltage value when power has the maximum value.
The solar power generated from MPPT is a control device for the solar panel to
automatically determine the value of a voltage that when multiplied by the current
maximizes the power output (optimum operating point).
6Source:http://metnet.imd.gov.in/mausamdocs/16618_F.pdf
26
FIG. 15. TEMPERATURE SETTING AND THE SIMULATED OUTPUT VOLTAGE OF
THE POWER SUPPLY IN PUMP L (Germany)
The variation of the motor speed and the input power for the previous conditions are
shown in fig. 16. The horizontal axis represents time and the vertical axis represents
the rotational speed and input power. The red line represents the rotational speed and
the green line the input power. Rotation speed is considered to be proportional to the
control and varies similarly in response to changes in input power.
FIG. 16. NUMBER OF REVOLUTIONS AND INPUT POWER
COMPANY G (Denmark)
It was impossible in the case of the pump from the company G (Denmark) to measure
the rotating speed in the pump, so instead we measured the amount of water that is
proportional to the rotational speed in the pump. The variation of the output voltage,
the simulated power from solar radiation, and temperature used for the investigation of
this pump are shown in fig. 17. The panel temperature is the purple line and the yellow
line represents the solar radiation in the graph shown on the left side. The horizontal

27
axis is the time. Graph in the right figure represents the output voltage from the
simulated power. The horizontal axis represents time and the vertical axis represents
the voltage. The voltage decreases when the temperature rises, and increases when the
temperature decreases. Voltage from MPPT control was implemented.
FIG. 17. TEMPERATURE SETTING AND THE SIMULATED OUTPUT VOLTAGE OF
THE POWER SUPPLY IN PUMP G (Denmark)
The amount of output water required by the MNRE from the power input of the
previous conditions during the authentication is shown in fig. 18. The horizontal axis
represents time; one vertical axis represents the rotational speed and the other input
power. The blue line represents water, and the red line the input power. Rotation speed
is considered to be proportional to the control and varies similarly in response to
changes in input power. However, due to the solar power generated could exceed 1 KW,
the control was limited to 1 KW.
FIG. 18. INPUT POWER AND WATER OUTPUT IN PUMP G (Denmark)
28
SUMMARY
We investigated the pumps from companies of other countries: G (Denmark), L
(Germany), F (USA), and R (India), for the purpose of creating their performance curve
and operation in a pseudo-environment. The results showed the efficiency of L
(Germany) and R (India) were comparable. The efficiency of F (USA) using an AC motor
was 20 percent lower, and output of the low rated G (Denmark) was 5% higher. It was
confirmed that G (Denmark) and L (Germany) implement MPPT control. In addition, G
(Denmark) showed an input of more than 1KW, even when there is a limit to the input.
2.4.2 Survey of indigenous solar pumps
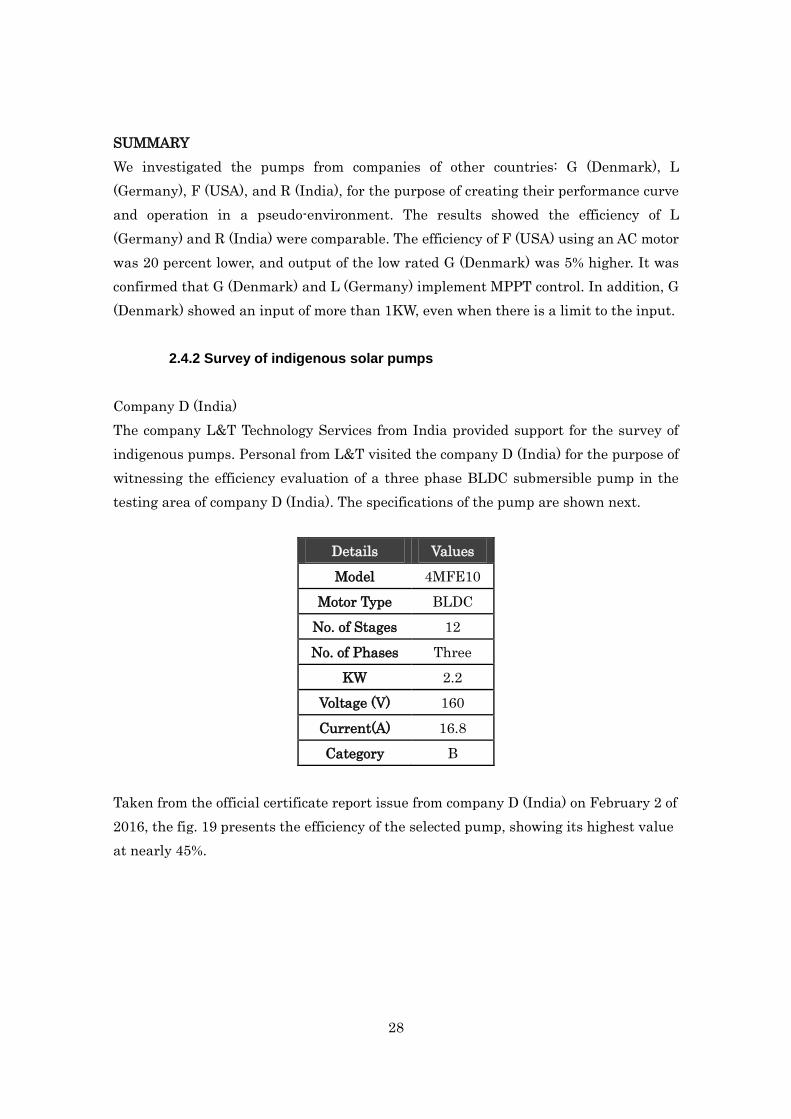
Company D (India)
The company L&T Technology Services from India provided support for the survey of
indigenous pumps. Personal from L&T visited the company D (India) for the purpose of
witnessing the efficiency evaluation of a three phase BLDC submersible pump in the
testing area of company D (India). The specifications of the pump are shown next.
Details Values
Model 4MFE10
Motor Type BLDC
No. of Stages 12
No. of Phases Three
KW 2.2
Voltage (V) 160
Current(A) 16.8
Category B
Taken from the official certificate report issue from company D (India) on February 2 of
2016, the fig. 19 presents the efficiency of the selected pump, showing its highest value
at nearly 45%.

29
FIG. 19. EFFICIENCY OF COMPANY D (India) PUMP

30
3. INSTALLATION AND OPERATION OF SOLAR PUMP PROTOTYPE
On November 5, 2015 we accepted the recommendation from the Ministry of Agriculture
of India for installing this project in the following two sites:
① Indian Agricultural Research Institute (IARI), in Pusa, New Delhi.
② Central Farm Machinery Training & Testing Institute (CFMT&TI), in Budni,
Madhya Pradesh.
The field survey started immediately on the next day.
3.1 Survey of the land used for installation
① November 2015 at the Indian Agricultural Research Institute (IARI).
The IARI or more popularly known as Pusa Institute, opened in 1905 at Pusa (Bihar)
with the generous grant from American Mr. Henry Phipps. The institute was then
known as Agricultural Research Institute (ARI). The institute was moved to Delhi on
July 29th 1936. After the country’s independence, the name of the institute was
changed to Indian Agricultural Research Institute (IARI).
Located in the limits of the city of New Delhi, India, 30 minutes northeast from Indira
Gandhi International Airport and about 1 hour from NIDEC’s office in Gurgaon, the
Division of Agricultural Engineering (fig. 20, 21 and 23) of IARI, the place selected for
the demonstration of the project. It extends for about 3km × 3km in a quiet place that
does not appear yet in the city, but yet mobile communication devices like smart phone
used in the vicinity are within the range of the existing 3G / 2G connection. Dr. Indra
Mani, shown in the pictures (fig. 22), is the current Director of IARI.
Site 1: IARI. With solar module and pump.
Already with fixed solar panels and installed Lorentz 2HP BLDC pump, but later
replaced with NIDEC system by request of the IRIA.
The depth of the well is about 80 meters (262 feet).
Mainly growing fruit trees and vegetables.

31
FIG. 20. MAP OF THE REGION OF IARI PUSA
CAMPUS
FIG. 21. THE DIVISION OF
AGRICULTURAL ENGINEERING
FIG. 22. DR. INDRA MANI (AT LEFT SIDE)
FIG. 23. NO SUNSHINE INTERFERENCE FROM SURROUNDING BUSHES
※Scene prior to the third-party system exchange (fixed type of solar panels and 2HP BLDC pump)
32
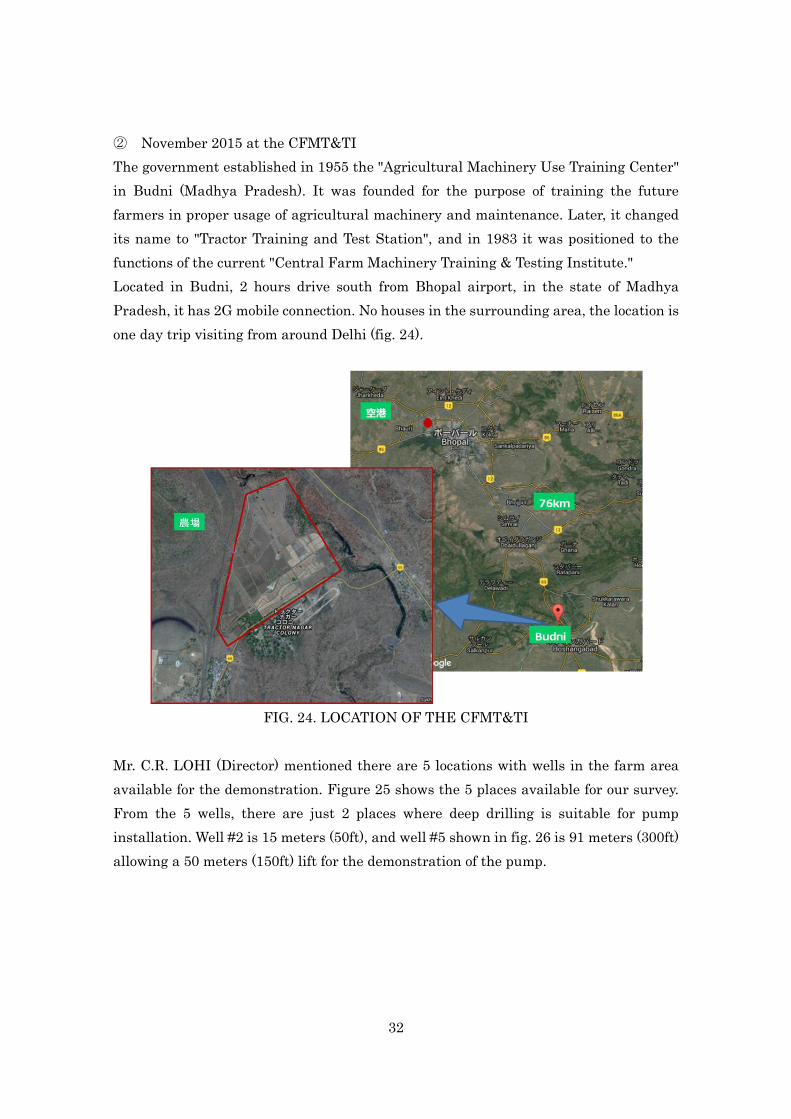
② November 2015 at the CFMT&TI
The government established in 1955 the "Agricultural Machinery Use Training Center"
in Budni (Madhya Pradesh). It was founded for the purpose of training the future
farmers in proper usage of agricultural machinery and maintenance. Later, it changed
its name to "Tractor Training and Test Station", and in 1983 it was positioned to the
functions of the current "Central Farm Machinery Training & Testing Institute."
Located in Budni, 2 hours drive south from Bhopal airport, in the state of Madhya
Pradesh, it has 2G mobile connection. No houses in the surrounding area, the location is
one day trip visiting from around Delhi (fig. 24).
FIG. 24. LOCATION OF THE CFMT&TI
Mr. C.R. LOHI (Director) mentioned there are 5 locations with wells in the farm area
available for the demonstration. Figure 25 shows the 5 places available for our survey.
From the 5 wells, there are just 2 places where deep drilling is suitable for pump
installation. Well #2 is 15 meters (50ft), and well #5 shown in fig. 26 is 91 meters (300ft)
allowing a 50 meters (150ft) lift for the demonstration of the pump.

33
FIG. 25. THE FIVE WELL LOCATIONS IN THE FARM AREA
FIG. 26. WELL #5 SUITABLE FOR A DEEP WELL PUMP

34
SUMMARY
Two places in IARI and CFMT&TI were selected for the installation of solar pump
systems for the period of the feasibility study.
IARI has good location and is the main demonstration site because it is easy to go to
the site from Delhi.
One more pump system will be installed in IARI. It is still an ongoing operation of
well drilling and installation of the pump.
Budni was recommended by the Ministry of Agriculture. Despite its bad access,
different weather conditions, and different mobile communication, it is useful for
the investigation.
3.2 Survey of the installation procedure
The pump system installed this time was the type without a charging function, only
with the ability to pump water with the energy of sunlight, and equipped with various
sensors and 2G/3G mobile communication function for monitoring the operation status.
The solar panel frame allowed a 2-axis manual tracking three times per day (morning,
noon and afternoon), and to operate setting the surface of the solar panel in the
direction of the sun. System in the fig. 27 follows the electrical product safety
regulations in India, EMC (electromagnetic compatibility) regulations, designed and
manufactured to pass the radio wave regulations. Compatibility survey of regulation
was carried out separately and in parallel to this study. Since it was confirmed to pass
the regulations, it is possible to continue the operation after the end of period of study.
FIG. 27. SOLAR PUMP SYSYEM OF NIDEC
35
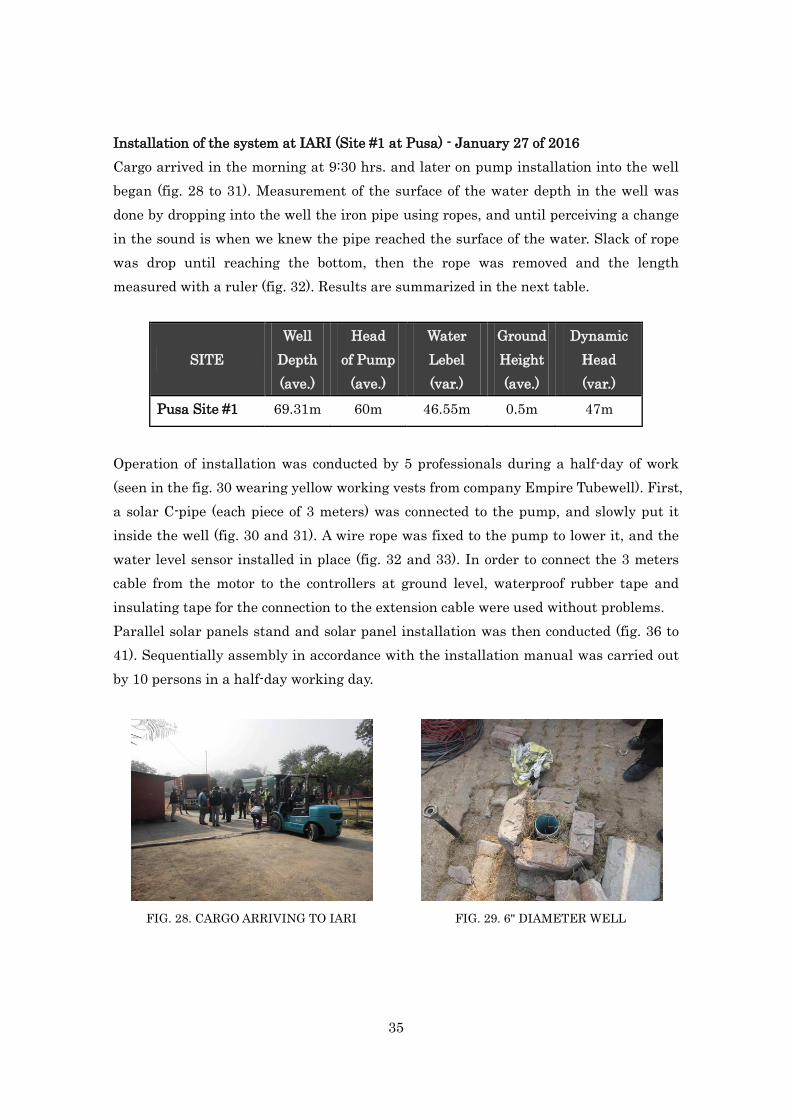
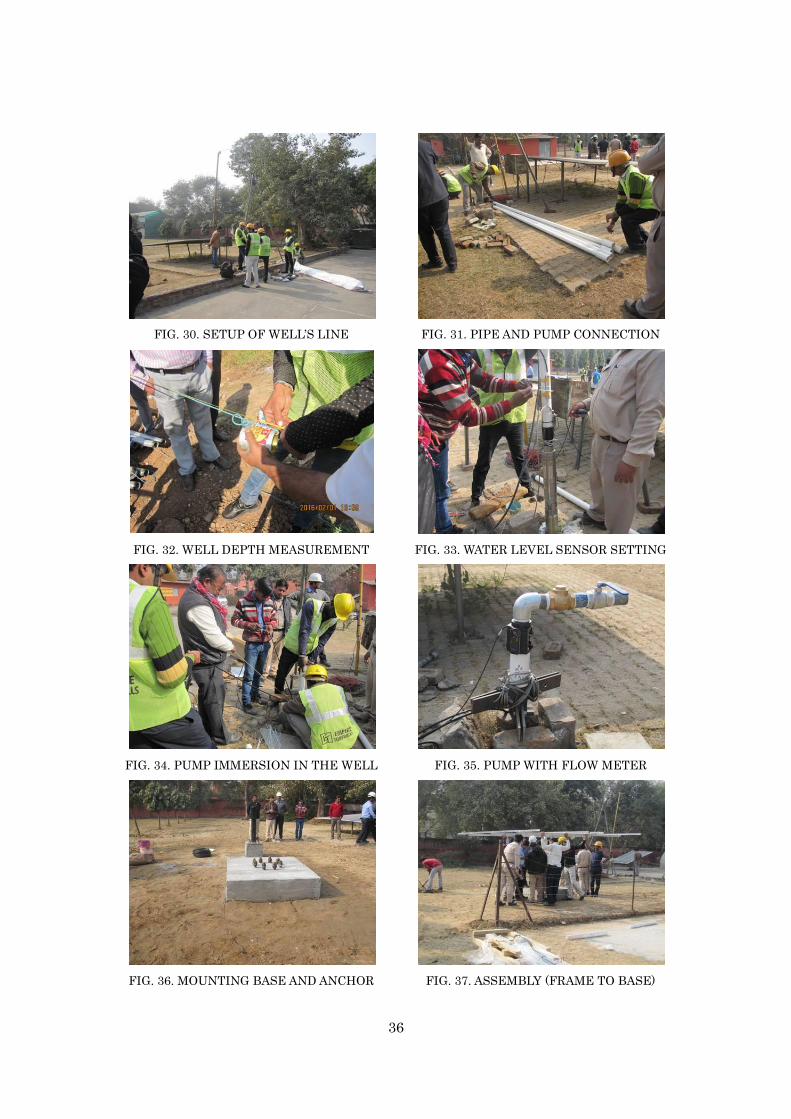
Installation of the system at IARI (Site #1 at Pusa) - January 27 of 2016
Cargo arrived in the morning at 9:30 hrs. and later on pump installation into the well
began (fig. 28 to 31). Measurement of the surface of the water depth in the well was
done by dropping into the well the iron pipe using ropes, and until perceiving a change
in the sound is when we knew the pipe reached the surface of the water. Slack of rope
was drop until reaching the bottom, then the rope was removed and the length
measured with a ruler (fig. 32). Results are summarized in the next table.
SITE
Well
Depth
(ave.)
Head
of Pump
(ave.)
Water
Lebel
(var.)
Ground
Height
(ave.)
Dynamic
Head
(var.)
Pusa Site #1 69.31m 60m 46.55m 0.5m 47m
Operation of installation was conducted by 5 professionals during a half-day of work
(seen in the fig. 30 wearing yellow working vests from company Empire Tubewell). First,
a solar C-pipe (each piece of 3 meters) was connected to the pump, and slowly put it
inside the well (fig. 30 and 31). A wire rope was fixed to the pump to lower it, and the
water level sensor installed in place (fig. 32 and 33). In order to connect the 3 meters
cable from the motor to the controllers at ground level, waterproof rubber tape and
insulating tape for the connection to the extension cable were used without problems.
Parallel solar panels stand and solar panel installation was then conducted (fig. 36 to
41). Sequentially assembly in accordance with the installation manual was carried out
by 10 persons in a half-day working day.
FIG. 28. CARGO ARRIVING TO IARI
FIG. 29. 6" DIAMETER WELL
36
FIG. 30. SETUP OF WELL’S LINE
FIG. 31. PIPE AND PUMP CONNECTION
FIG. 32. WELL DEPTH MEASUREMENT
FIG. 33. WATER LEVEL SENSOR SETTING
FIG. 34. PUMP IMMERSION IN THE WELL
FIG. 35. PUMP WITH FLOW METER
FIG. 36. MOUNTING BASE AND ANCHOR
FIG. 37. ASSEMBLY (FRAME TO BASE)

37
FIG. 38. FRAME MOUNTING
FIG. 39. PV MODULE MOUNTING
FIG. 40. PUMP OPERATION TEST
FIG. 41. PANEL / CONTROLLER
INSTALLATION COMPLETED
Installation of the system at CFMT&TI (Well #5 at Budni) - February 1 of 2016
The cargo arrival was the previous week; using the farm tractor and a forklift it was
carried to the site in turn and installation of the pump in the well began. Well depth and
water depth measurement was carried out in the same manner as in the case of IARI.
This time the pump was connected to a steel pipe (each piece of 3 meters), and slowly
put inside the well. Wire rope and water level sensor were set in place. Results are
summarized in the next table.
Installation of the pump was carried out by 5 persons working half-day. Stand and solar
panel installation was completed in about 2 hours. Controller installation and electrical
work, with three added assistants under business travel, working half-day for a total of
about 10 people (fig.42 to 48).
SITE
Well
Depth
(ave.)
Head
of Pump
(ave.)
Water
Lebel
(var.)
Ground
Height
(ave.)
Dynamic
Head
(var.)
CMFT&TI 55m 51m 6.5m 0.5m 7m

38
FIG. 42. CARGO ARRIVAL (STAND/PUMP)
FIG. 43. SOLAR PANEL ARRIVAL
FIG. 44. WELL’S TURRET
FIG. 45. TURRET
FIG. 46. CONCLUSION
FIG. 47. CONCLUSION
FIG. 48. CONTROLLER MOUNTING

39
Survey results after the installation task show the stand, the solar panel and the
controller represent a major issue in the installation of the pump. Improvement in the
base specification is a required challenge.
Need a hook for the wire rope attached to the pump
In the know-how of local professional there is no problem related to the extension of
the pump harness
Thin flow-meter cable, improve reliability requirements
Initial configuration is necessary in the flow-meter, require to select unnecessary
goods
Low-cost study is needed for the structure of the base of the mounting stand
Installation of 360-degree rotation stand is impossible
The pump cable, flow-meter cable and cable of the solar panel are connected to
the controller which is attached to the frame pillar, preventing the winding
around the pillar.
Crash prevention between the controller and mounting base
A guide for controller mounting position in the stand pillar is required
Simplification of the work for the wiring to the controller
Mechanism to prevent morning dew falling from solar panels to the controller
Winding the excess of cable from the installation to the structure
Study of data transmitting is needed to match with poor India mobile radio wave
environment
3.3 Testing in NISE
NISE (National Institute of Solar Energy) is part of the MNRE and engages into the
demonstration and standardization of solar energy, research and study, education,
training and technical tests. As an intermediate presence that connects the employers'
organizations to government agencies, public authorities and industry, it is also an
organization that has been promoting the commercialization, development and
dissemination of solar energy in India. It is located in the suburbs of Gurgaon city, about
25km southwest from the capital New Delhi.
In NISE it is determined the subsidy criteria for the solar pump; each unit by the
system manufacturer scheduled for commercialization is tested to determine if it has
reached the subsidy beneficiaries criteria.
With respect to our prospective solar pump system, testing at our facility was confirmed
after bringing the installed unit for the study described previously and finishing the
40
arrangements to perform the test; it was revealed the test cannot start during the
period of the present study project. In the application for taking the test, all tests are
conducted from April at the earliest. The test will be completed with company’s funds,
and we expect the coming result harness a policy to help the future of our business.
3.4 Survey after the installation
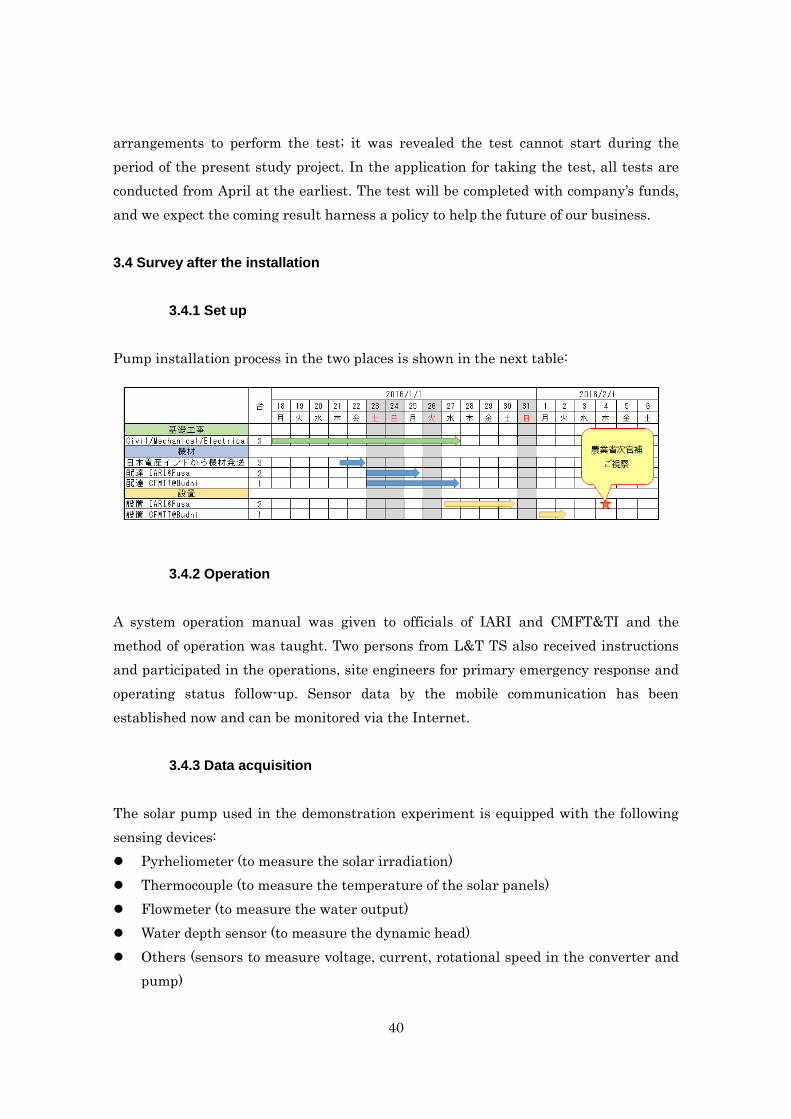
3.4.1 Set up
Pump installation process in the two places is shown in the next table:
3.4.2 Operation
A system operation manual was given to officials of IARI and CMFT&TI and the
method of operation was taught. Two persons from L&T TS also received instructions
and participated in the operations, site engineers for primary emergency response and
operating status follow-up. Sensor data by the mobile communication has been
established now and can be monitored via the Internet.
3.4.3 Data acquisition
The solar pump used in the demonstration experiment is equipped with the following
sensing devices:
Pyrheliometer (to measure the solar irradiation)
Thermocouple (to measure the temperature of the solar panels)
Flowmeter (to measure the water output)
Water depth sensor (to measure the dynamic head)
Others (sensors to measure voltage, current, rotational speed in the converter and
pump)

41
The sensors provide different environment data. The data is collected in real-time in
India with the sensor hub of the solar pump, stored via 2G/3G high-speed internet in a
cloud server located in Singapore, and monitored on-line in Japan using Windows®
Explorer® browser running a plug-in application called KIBANA®.
Data available for monitoring is described in the next table:
SENSOR ID DATA
THERMOCOUPLE Solar irradiation. Solar panel temperature.
DCDC Voltage and current from the converter.
LEVEL Dynamic head.
PUMP Rotational speed. Current. Power.
FLOW Water output from the pump.
Figure 49 shows a screenshot from a computer’s monitor at the headquarters of NIDEC
in Kyoto Japan at the time of monitoring the operational status of the pumps installed
in India for the demonstration for the dates between February 7 to 13 of 2016.
Different data around the solar pump system, temperature, pump operating status, the
amount of output water and accumulated power generation can be collected via IoT, and
obtain statistical information from it.
FIG. 49. SCREENSHOT OF KIBANA

42
The fig. 50 shows a block diagram of the IoT data collection.
FIG. 50. BLOCK DIAGRAM OF THE IOT DATA COLLECTION
The fig. 51 shows irradiation level and voltage output from the DCDC converter, for the
period between February 7 to 13 of 2016.
FIG. 51. VISUALIZATION OF SENSOR DATA USING KIBANA – SOLAR
IRRADIATION AND DCDC VOLTAGE

43
The fig. 52 shows a diagram of water output from the solar pump in Pusa site #1, for
data from February 7 to 12 of 2016. The fig. 53 shows the actual measurement value of
water output for the solar pump.
FIG. 52. DATA OF WATER OUTPUT
FIG. 53. REAL WATER OUTPUT
KONOHA application for Smartphone with ANDROID® system
The solar pumps features a control box allowing a connection with the solar pump via
WIFI using a Smartphone with ANDROID® operating system and launching an
application called KONOHA, created in NIDEC specifically for the project. In addition
to KIBANA system, KONOHA application allows monitoring of solar irradiance data
solar power data, pump data, water level data and water output data. It allows driving
and stopping the solar pump. Furthermore, it features several system alarms for the
safety of the solar pump. The next 3 figures show some screenshots of the application.
FIG. 54. STARTUP SCREEN
FIG. 55. LOGIN SCREEN
FIG. 56. MENU SCREEN

44
4. PLAN FOR THE MASS DISSEMINATION OF SOLAR PUMPS IN INDIA
4.1 Future market forecast
1) The current and the potential situation
Currently, the government of India wants to replace 26 million sets of installed
irrigation pumps for agriculture which are connected to the grid (according to numbers
from the MNRE, 2015), and 7 million sets of diesel fuel pumps. The Indian government
has paid a lot of subsidies to farmers as expense assistance for running their pumps,
and although there is a time limit of a few hours of electricity per day, farmers are using
their pumps virtually free of charge. A reform to the government finances is under
pressure by the central government and power companies for reducing this subsidy. By
doing so, this activity could be an energy reform to reduce the use of fossil fuel, and
enforce the reduction of CO2 emissions.
Even when electrification of rural areas is progressing, technical delay of infrastructure
development, aging of existing one, poor efficiency of the power supply due to theft, and
unstable power supply need to be normalized, so significant investment is still required.
Furthermore, regardless the number of irrigation pumps that exist, the percentage of
agricultural land for irrigation has remained in 36.4% since year 2011.
Situation of Irrigation by Province7
State
Total crop area
(2011) (million
hectares)
Groundwater
irrigation equipped
crop area (2011)
(million hectares)
Canal irrigation
equipped crop area
(2011) (million
hectares)
Total crop area
actually irrigated
(2011) (million
hectares)
Andhra Pradesh 14.3 2.5 2.7 4.9
Arunachal Pradesh 0.4 0.07 0.05
Assam 3.0 0.13 0.1 0.22
Bihar 6.4 2.2 1.3 3.5
Chhattisgarh 5.1 0.17 0.74 0.85
Goa 0.1 0.1 0.1
Gujarat 9.9 3.1 0.5 3.2
Haryana 3.6 1.99 1.32 3.26
Himachal Pradesh 1.0 0.02 0.09 0.11
7 Global map of irrigated areas: India FAO-United Nations and Bonn University, Germany (2013)

45
Jammu & Kashmir 0.9 0.02 0.38 0.37
Jharkhand 3.2 0.11 0.13 0.24
Karnataka 12.2 1.43 1.33 2.38
Kerala 1.5 0.18 0.21 0.39
Madhya Pradesh 15.8 2.74 1.70 4.19
Maharashtra 19.8 3.12 1.03 3.36
Manipur 0.2 0.05 0.05
Meghalaya 0.3 0.06 0.06
Mizoram 0.1 0.01 0.01
Nagaland 1.1 0.1 0.07
Odisha 4.9 0.17 1.07 1.24
Punjab 4.0 3.06 0.94 3.96
Rajasthan 21.1 3.98 1.52 5.12
Sikkim 0.1 0.01 0.01
Tamil Nadu 6.5 1.61 1.43 2.66
Tripura 0.3 0.02 0.05 0.07
Uttar Pradesh 17.6 10.64 4.21 14.49
Uttarakhand 0.8 0.22 0.14 0.35
West Bengal 5.5 2.02 1.19 2.92
ALL INDIA 159.6 39.43 22.48 58.13
Although irrigation is supposed to be carried out from groundwater excavation and
canal development, upon hearings with the Government of India we understood there
are not many rivers in India so they must rely on groundwater. The information
showing the gravity of the well drilling problems seems to be fairly accurate.
Potential of New Irrigation in India
Unit: million of hectares (MH)
Agricultural land of India 159.6
Agricultural land already
with well water irrigation 39.43 Irrigation rate: 24.7%
Agricultural land already
with irrigation by canal 22.48 Irrigation rate: 14.1%
Total of farmland already
with irrigation 58.13
Basic calculation: 61.91)
Irrigation rate: 36.4%

46
Agricultural land without
irrigation 101.47 Not irrigation rate: 63.5%
From the above information, the market of solar pump system is already installed, but
assuming a novel parallel posture, it can also be considered to have an inexhaustible
potential. As one example, from material about state-by-state irrigation rates, let us
explain the information from Punjab province, scene of the beginning of the mentioned
"Green Revolution", where in 2011 achieved 99% irrigation rate. In this state, the
results of double cropping are lower groundwater levels, land subsidence problems, and
usage of large doses of chemical fertilizer, leading to productivity stagnation and other
different issues and problems. But still, exports continue to be carried out as production
of rice and wheat is one of the granaries of India.
India's agricultural land area is about 160 million hectares, from where Punjab
province has an area of 4 million hectares. According to the MNRE8, the rice production
of all India in fiscal 2008 was about 89 million tons, and in that small area of Punjab it
was 11 million tons which accounted for 12% of the entire India, having the top yield per
unit area in all India with 4,010 kilograms (national average is 2,125 kilograms). All
India wheat production accounts for about 80 million tons, and Punjab produced about
15 million tons, a share of about 19%. India tops the production of rise with respect to
the yield per unit of land for about 4,462 kilograms (national average is 2,907
kilograms), and although there seem to be different factors that contribute greatly to
the improvement of agricultural productivity, irrigation is considered to be a great part
of it.
2) Market Forecast
India's agricultural land area is about 180 million hectares, a proud second largest
production place for rice and wheat in the world, with 50% of the total population
engaged to it, although the percentage of the GDP of the Indian economy was about
16%.
The average size of farms in India is very small, accounting for 80% of artisanal farms
(with less than one hectare) and small farms (with 1 to 2 hectares) in India; medium
and large size farms of 4 hectares or more of agricultural land account for only 9%. In
the previously mentioned state of Punjab, the data shows medium and large size farms
accounts for 63%.
8 http://www.maff.go.jp/j/kokusai/kokusei/kaigai_nogyo/k_syokuryo/h21/pdf/h21_asia3.pdf

47
The case of the state of Haryana where irrigation rate has reached 95% is special
because it is known many wealthy farmers live there, and the majority of small size
farmers in general have no investment capacity of their own. Medium and large size
farms, having already higher year revenues, own their agricultural machinery,
including the irrigation pump, so we believe the demand for replacement can be
stimulated by promoting the benefits to these farmers.
Progressive aging of equipment and decline of productivity are appealing points needed
to be revealed to farmers; stable electricity supply and reduction of energy costs could
ensure the stability of future revenue; it is possible to achieve the change by
encouraging an aggressive investment and considering it the first step in a market
launch.
Based on the above graph9, 58 million households live with the average annual income
and each one represents a farmer with a cultivated land; assuming 9% are farmers with
medium or large size farm, about 5 million households are expected to become our
target. Reliable information shows the installation of one well for every 5.5 hectares. In
that perspective, from the fact that 5 million households are medium and large size
farms, purchase of multiple units is envisioned. The number of artisanal and small size
farms having their own well and pump is small, thus their income from the cultivated
land is used to rent from medium and large size farms a well and/or pump to obtain the
necessary water, o sometimes simply buy the water.
9 Issue from April 5, 2010 Mizuho report: Purchasing power and consumption realities in rural India (Japanese edition only)

48
It is considered there is the case where small farmers jointly buy one standalone AC
pump and manage the well, but the price of a solar pump is still high to artisanal
farmers and is not in the price range that can be purchased jointly.
Wells with hand digging and low wells exist from ancient times, but in nowadays it is
reported several cases of states under drought conditions and an increased demand for
deep well due to the excessive pumping of too much water; however, the ownership of
the place where the well exists it is certainly considered to be in a decreasing direction.
In addition, lower groundwater level has become a serious problem in India in recent
years, thus the Indian government has begun to limit the terms of well drilling. While it
is essential the promotion for irrigation in non-irrigated areas, in places where water is
absolutely insufficient, it is unknown how much drilling is taking place when making a
new well.
Solar pumps and others alike new energy technologies could be assumed to be the
default; in addition, IoT enabling the control and detection of the amount of water usage
and pumping would be considered to become mandatory.

49
5. STUDY OF EMISSION REDUCTION METHODOLOGY
The scheme called MRV (Measurement, Reporting and Verification) involves measuring
of the state initiatives to reduce emissions of greenhouse gases (GHG), reporting on an
international scale, and verifying the degree of reductions. This scheme checks the
accuracy of activities aimed at reducing GHG emissions. The process of “measurement”
uses Clean Development Mechanism (CDM) methodologies recommended by the United
Nations Framework Convention on Climate Change (UNFCCC) to estimate GHG
emissions.
5.1 Study of JCM methodologies
Business feasibility studies for Joint Crediting Mechanism (JCM) projects many times
refer to CDM methodologies when proposing a new JCM methodology. Just a few CDM
methodologies cover pump systems although these do not fully apply to our project due
to different specifications. Nevertheless it was decided to refer some of these in our
study.
5.1.1 JCM methodologies under study
CDM methodologies are categorized according to the size of the project under study. The
methodologies referenced in our project are the following ones.
For small-scale projects:
METH No. TITLE
AMS-I.A. Electricity generation by the user
AMS-I.D. Grid connected renewable electricity generation
AMS-I.F. Renewable electricity generation for captive use and mini-grid
AMS-I.J Solar water heating systems (SWH)
AMS-I.K Solar cookers for households
AMS-I.L. Electrification of rural communities using renewable energy
AMS-II.C. Demand-side energy efficiency activities for specific technologies
AMS-II.P. Energy efficient pump-set for agriculture use

50
For large-scale projects:
METH No. TITLE
AM0019 Renewable energy projects replacing part of the electricity
production of one single fossil fuel fired power plant that stands
alone or supplies to a grid
AM0020 Baseline methodology for water pumping efficiency improvements
The CDM methodologies more suitable to our solar pump system project are the ones for
small scale projects. In few words, a methodology calculates the GHG emissions from
the consumptions of the associated non-renewable energy technology (like fossil
fuel-based) with an “emission factor” suitable in the approach for the development of the
JCM methodology.
There is the Emission Factor Database (EFDB)10, a continuously revised web-based
information exchange forum for retrieving emission factors and other parameters
relevant for the estimation of emissions and reductions of GHG at national level. It is
divided in the Intergovernmental Panel on Climate Change (IPCC) default factors and
country specific emission factors, for example from the Indian Network for Climate
Change Assessment (INCCA). The database can be queried over the internet via the
home pages of the IPCC. Some default and country specific CO2 emission factors are:
Northern grid of India = 0.94 t/MWh
Southern grid of India = 0.91 t/MWh
Default value for a grid = 0.8 t/MWh
For the majority of countries, many more available factors for calculating GHG
emissions from electricity consumption are the composite electricity/heat emission
factors published by the International Energy Agency (IEA), which are also the basis for
most of the grid electricity factors. Some specific CO2 emission factors for India are:
For electricity generated in India = 1.33 t/MWh
For electricity consumed in India = 1.8 t/MWh
5.1.2 Analysis with the JCM methodologies
Business feasibility studies of JCM projects of energy efficiency between Japan and
another country look into existing CDM methodologies to estimate the GHG emission
and expected reduction. Currently, Japan and the host countries in the Join Committees
10 http://www.ipcc-nggip.iges.or.jp/EFDB/main.php

51
approved several methodologies to accommodate a wide range of JCM projects, and our
study could accommodate some of these for our project.
There is one JCM feasibility study similar to this pump system project:
IMPLEMENTING DESCRIPTION
Nippon Koei Co., Ltd. and
EBARA Corp.
Energy Saving for Irrigation Facility by Introducing
High-efficiency Pumps
This study, called ESIF in the rest of our document, covers the introduction of
high-efficiency fossil-fueled pumps in Vietnam. Although our project targets solar
pumps in India, the methodology for the estimation of CO2 emissions fits well in our
project.
5.2 Study of emissions reduction methodology
Because our project intends introducing high-efficiency solar pumps to reduce GHG
emissions in India, pumps running with fossil fuel or grid electricity in farms of India
are the subject of the study. Based on the JCM methodology used in the ESIF study and
the CDM methodologies AMS-I.A., AMS-I.D., AMS-I.F., AMS-I.J., AMS-I.K., AMS-I.L.,
AMS-II.C., AMS-II.P., AM0019 and AM0020, we examined the key points considered
necessary in order to later propose a methodology to use in our study.
5.2.1 JCM methodology proposal
Reference Scenario
The reference scenario is defined as: “If the project is not implemented, the newest
pump running with diesel fuel or grid electricity produced locally will be applied.” The
market data shows the share for diesel fuel or grid electricity pumps presents many
players, like Grundfos, Lorentz, Franklin, Shakti, CRI, Aquasub, KBL (Kirloskar
Brothers Limited), Varuna, Texmo, among others.
Our project activity of introducing solar pump systems follows an on-site survey of
operational conditions of pumps in India to confirm and adjust our study.
The following table of terms and definitions aiming to ease understanding is necessary
previous the description of our proposal.

52
TERMS DEFINITIONS
Solar pump Pump powered with photovoltaic cells
Solar capacity The measure of power from a photovoltaic cell
in units of Watt-peak (Wp)
Brushless direct current
(BLDC) motor
An electric motor with an electronic controller
replacing the brush/commutator
Dynamic head The height a fluid is to be pumped
Horsepower (HP) Another unit to measure power, like Watt
Pump efficiency A decimal number describing the relation
between pump capacity (water output),
dynamic head and input power
The proposed JCM methodology is summarized next.
Eligibility Criteria
Eligibility criteria related to the project of solar pump system
No. CRITERIA
1 The project is a lineup of solar pumps for different dynamic heads and different
pump capacities, each one equipped with an array of solar panels of power
capacity no larger than 3,000Wp, a starter and other electrical accessories, and
optional sensing devices allowing remote monitoring via internet
2 One solar pump comprises the assembly of one pump and one BLDC motor of
specific HP capacity. The pump of the project has efficiency in the range of 60%
(10%).
3 The solar pump does not consume diesel fuel nor is connected to the grid at any
moment during the JCM project period. This will be confirmed at the time of the
validation and verification
Monitoring
One solar pump of the project could be equipped with the optional devices described in
section 3. Data from the devices in the solar pumps of the project should be
monitored/recorded from Japan during the JCM project period via internet. The
following is the minimum information necessary to report:

53
SENSOR ID DATA
THERMOCOUPLE Solar irradiation. Solar panel temperature.
DCDC Voltage and current from the converter.
LEVEL Dynamic head.
PUMP Rotational speed. Current. Power.
FLOW Water output from the pump.
In addition, the following information is also required:
Number of pump sets replaced and newly installed under the project activity,
identified by the type of pump set and the date of installation.
Data to unambiguously identify the recipient of the pump sets installed under
the project activity.
If available, performance curves or efficiency rate of the old pump in the case of
replacement.
We assume the operating hours of a solar pump of the project shall be according with
the available time of daily solar irradiation, which is around 8 hours every day. We also
assume 365 possible operating days per year.
GHG emission source and GHG type
Source of GHG emissions of the project is CO2 generated from the consumption of fossil
fuel based electricity in the reference scenario and the project.
5.3 Emission reduction estimates
GHG emissions are calculated as the difference between the ones generated from the
reference scenario and the ones from the project, in terms of tonnes of CO2 (tCO2) or
millions of tonnes (MtCO2) per year.
5.3.1 Parameter settings
Emission factor and efficiency of the pump are the most important parameters in the
calculation. Listed below are the value used in this study.
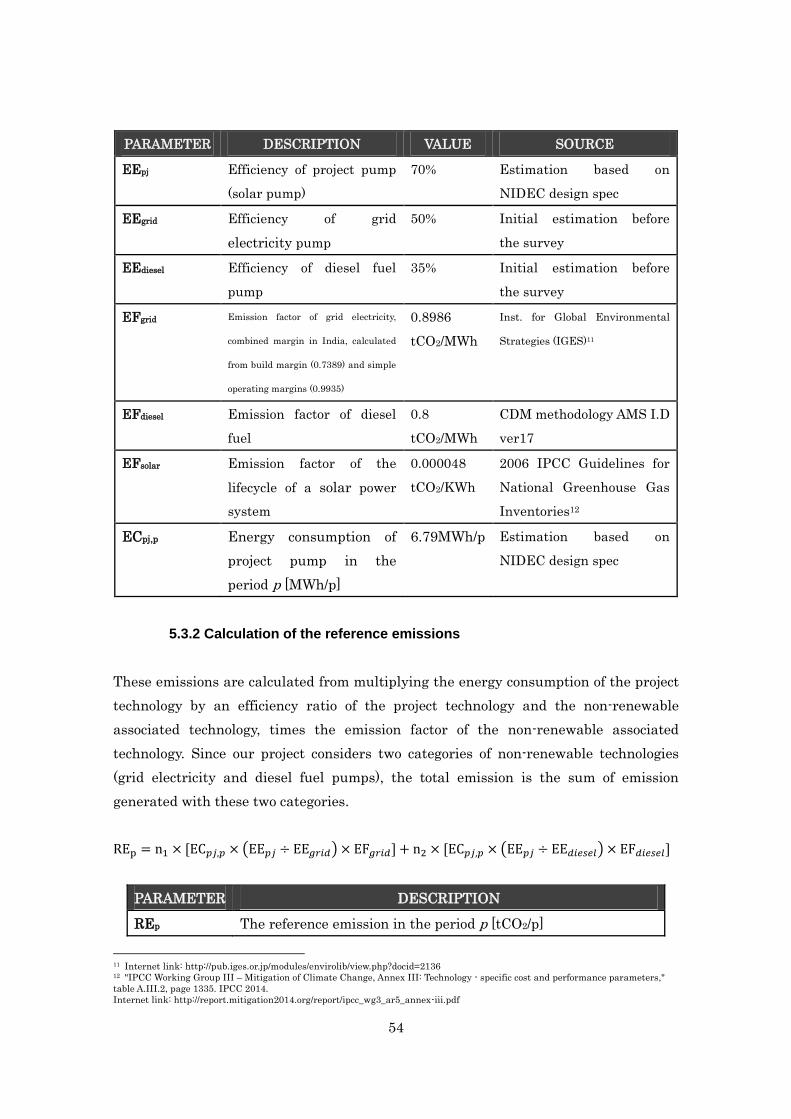
54
PARAMETER DESCRIPTION VALUE SOURCE
EEpj Efficiency of project pump
(solar pump)
70% Estimation based on
NIDEC design spec
EEgrid Efficiency of grid
electricity pump
50% Initial estimation before
the survey
EEdiesel Efficiency of diesel fuel
pump
35% Initial estimation before
the survey
EFgrid Emission factor of grid electricity,
combined margin in India, calculated
from build margin (0.7389) and simple
operating margins (0.9935)
0.8986
tCO2/MWh
Inst. for Global Environmental
Strategies (IGES)11
EFdiesel Emission factor of diesel
fuel
0.8
tCO2/MWh
CDM methodology AMS I.D
ver17
EFsolar Emission factor of the
lifecycle of a solar power
system
0.000048
tCO2/KWh
2006 IPCC Guidelines for
National Greenhouse Gas
Inventories12
ECpj,p Energy consumption of
project pump in the
period p [MWh/p]
6.79MWh/p Estimation based on
NIDEC design spec
5.3.2 Calculation of the reference emissions
These emissions are calculated from multiplying the energy consumption of the project
technology by an efficiency ratio of the project technology and the non-renewable
associated technology, times the emission factor of the non-renewable associated
technology. Since our project considers two categories of non-renewable technologies
(grid electricity and diesel fuel pumps), the total emission is the sum of emission
generated with these two categories.
PARAMETER DESCRIPTION
REp The reference emission in the period p [tCO2/p]
11 Internet link: http://pub.iges.or.jp/modules/envirolib/view.php?docid=2136 12 "IPCC Working Group III – Mitigation of Climate Change, Annex III: Technology - specific cost and performance parameters,"
table A.III.2, page 1335. IPCC 2014.
Internet link: http://report.mitigation2014.org/report/ipcc_wg3_ar5_annex-iii.pdf

55
n1 Number of grid electricity pumps replaced by the project [-]
n2 Number of diesel fuel pumps replaced by the project [-]
ECpj,p Energy consumption of project solar pump in the period p
[MWh/p]
EEpj Efficiency of the project solar pump [-]
EEgrid Efficiency of reference grid electricity pump [-]
EEdiesel Efficiency of reference diesel fuel pump [-]
EFgrid Emission factor of reference grid electricity pump [tCO2/MWh]
EFdiesel Emission factor of reference diesel fuel pump [tCO2/MWh]
This reference scenario covers the emissions from an energy mixture in the grid (coal,
natural gas, diesel, nuclear, hydropower, wind, solar, biomass), and energy supplied by
diesel fuel.
The initial estimation in this study regarding market penetration, for the number of
expected solar pumps to be sold in India, the numbers for the following five periods are
shown in the following table.
PERIOD AGRICULTURE PUMP13
MARKET SIZE ESTIMATION
NUMBER OF
SOLAR PUMP
1 1,438,000 14,000
2 1,461,000 29,000
3 1,484,000 45,000
4 1,507,000 75,000
5 1,531,000 122,000
SUM - 286,000
From the approximately 19 million of grid electricity pumps (73%) and 7 million diesel
fuel pumps (27%) out of the 26 million pumps that officially existed in India in 201414,
we assume the project will replace in the same proportion grid electricity and diesel fuel
pumps, by the total number of solar pumps to be sold by the project shown in the
previous table. For the ease of explanation, the formula to estimate the CO2 emissions
of the reference scenario just for the first period is shown next.
13 Market research of agriculture pump-set industry of India. Figure 12, agriculture pump market –size and growth, by volume
(2009-2013), page 24. By Shakti Sustainable Energy Fundation. June 12, 2012. 14 Feasibility analysis for solar agricultural water pumps in India. KPMG Advisory Services Private Limited report. January 2014.

56
The estimation of CO2 emissions of the reference scenario for the next five periods are
the next.
PERIOD EMISSIONS OF THE REFERENCE
SCENARIO (tCO2/p)
1 143,000
2 297,000
3 461,000
4 768,000
5 1,249,000
5.3.3 Calculation of project emissions
These emissions are calculated from multiplying the emission factor of the lifecycle of a
solar power system and the power produced by the system for the project in the period
p.
PARAMETER DESCRIPTION
PEp Project emission during the period p [tCO2/p]
EFsolar Emission factor of the lifecycle of a solar power system [tCO2/KWh]
n1 Number of grid electricity pumps replaced by the project [-]
n2 Number of diesel fuel pumps replaced by the project [-]
ECpj,p Power produced and consumed by the system for the project in
the period p [KWh/p]
Due to the emission factor is very low for most renewable energy project activities, like
solar projects, sometimes for practical reasons these emissions are considered zero.
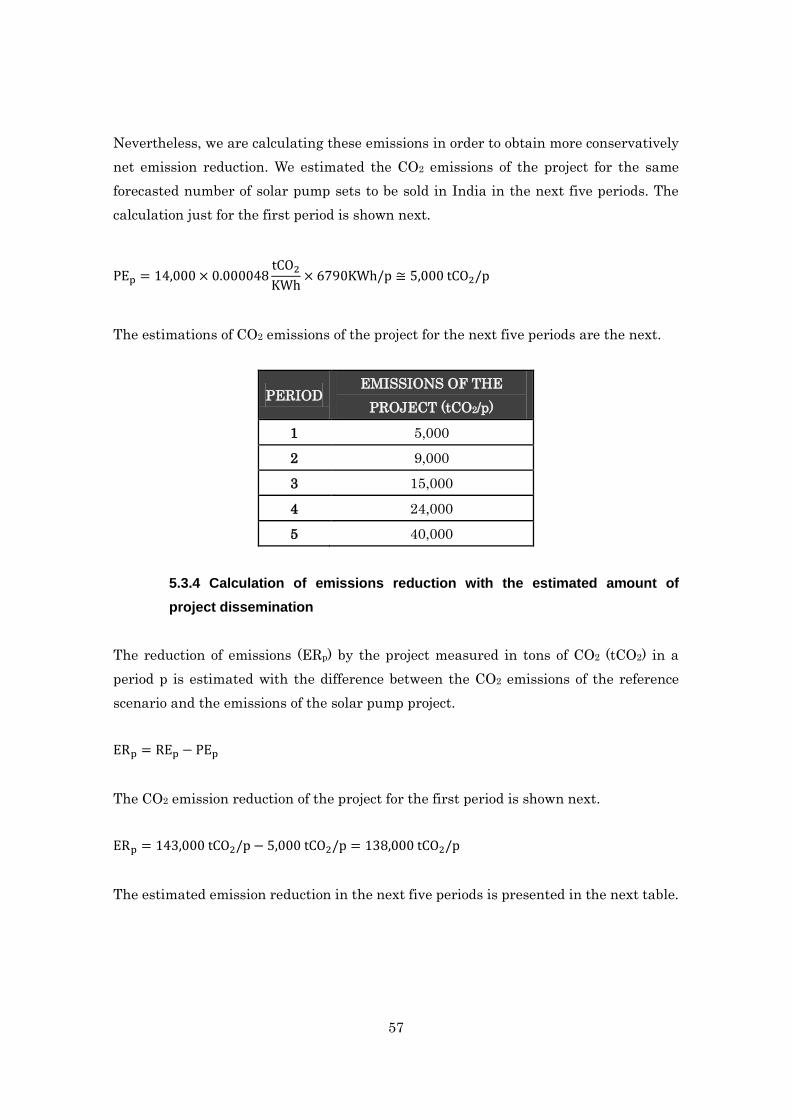
57
Nevertheless, we are calculating these emissions in order to obtain more conservatively
net emission reduction. We estimated the CO2 emissions of the project for the same
forecasted number of solar pump sets to be sold in India in the next five periods. The
calculation just for the first period is shown next.
The estimations of CO2 emissions of the project for the next five periods are the next.
PERIOD EMISSIONS OF THE
PROJECT (tCO2/p)
1 5,000
2 9,000
3 15,000
4 24,000
5 40,000
5.3.4 Calculation of emissions reduction with the estimated amount of
project dissemination
The reduction of emissions (ERp) by the project measured in tons of CO2 (tCO2) in a
period p is estimated with the difference between the CO2 emissions of the reference
scenario and the emissions of the solar pump project.
The CO2 emission reduction of the project for the first period is shown next.
The estimated emission reduction in the next five periods is presented in the next table.

58
PERIOD EMISSIONS REDUCTION OF
THE PROJECT (tCO2/p)
1 138,000
2 288,000
3 446,000
4 744,000
5 1,209,000
SUM 2,825,000
The total CO2 emission reduction for the 5 periods of this project is estimated to be
2,825,000 tCO2.

59
6. EFFORTS TO STRENGTHEN RELATIONS FOR THE JCM WITH PARTNER
COUNTRY GOVERNMENT OFFICIALS
6.1 Indian Ministry of Power, Coal, and New Renewable Energy
Date and time: January 13 of 2016, 11:15 – 13:00hrs
Place: Imperial Hotel (Tokyo)
Attendee (Indian side): Ministry of power, coal and new renewable energy
Ambassador of India to Japan
Ministry of Foreign Affairs
General Director for East Asia
General Director of MNRE
Ministry of Petroleum and Natural Gas
Director of International Cooperation
Tokyo Embassy of India Chief Minister
Ministry of Coal and Adviser
Counselor of Tokyo Indian Embassy
Director of Ministry of Power
Director of National Thermal Power Corporation (NTPC)
Chairman and President of India Renewable Energy
Development Authority (IREDA)
Secretary of Minister Mr. Goyal
Attendee (NIDEC side): Mr. Tanabe
Mr. Nakao (NIND)
Mr. Uetake (NBA)
Mr. Hiramoto (NBD)
Note: About 30 additional people attended, representing the Embassy of India and Indian businesses.
A round table was held during the visit to Japan of Mr. Piyushi Goyal, from the Indian
Ministry of power, coal, new and renewable energy. We had the opportunity to explain
the JCM project feasibility study conducted at the Indian Agricultural Research
Institute (IARI), for the plan of mass dissemination of solar pump systems. The
Minister in this occasion asked directly about the greatly expected high-efficiency pump
for irrigation and the solar pump system, and the achieved success of the project; he
promised the partnering not only to reduce GHG emissions but to promote
environmental improvement and energy conservation.
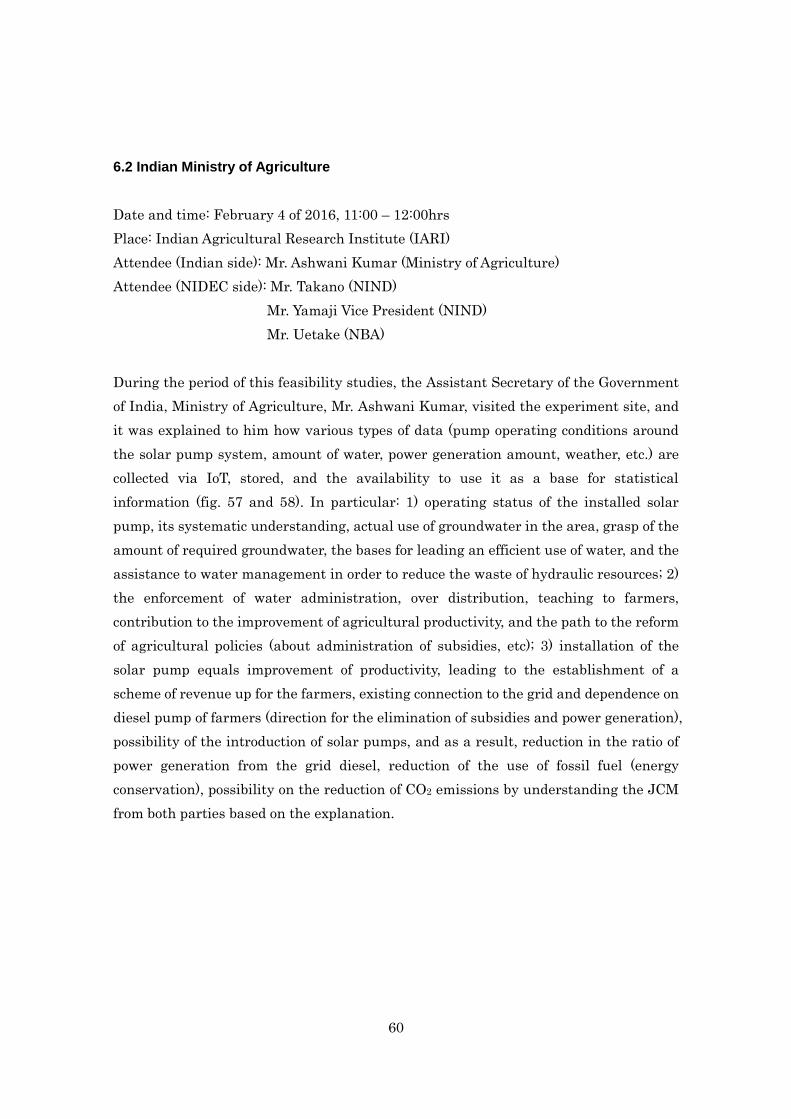
60
6.2 Indian Ministry of Agriculture
Date and time: February 4 of 2016, 11:00 – 12:00hrs
Place: Indian Agricultural Research Institute (IARI)
Attendee (Indian side): Mr. Ashwani Kumar (Ministry of Agriculture)
Attendee (NIDEC side): Mr. Takano (NIND)
Mr. Yamaji Vice President (NIND)
Mr. Uetake (NBA)
During the period of this feasibility studies, the Assistant Secretary of the Government
of India, Ministry of Agriculture, Mr. Ashwani Kumar, visited the experiment site, and
it was explained to him how various types of data (pump operating conditions around
the solar pump system, amount of water, power generation amount, weather, etc.) are
collected via IoT, stored, and the availability to use it as a base for statistical
information (fig. 57 and 58). In particular: 1) operating status of the installed solar
pump, its systematic understanding, actual use of groundwater in the area, grasp of the
amount of required groundwater, the bases for leading an efficient use of water, and the
assistance to water management in order to reduce the waste of hydraulic resources; 2)
the enforcement of water administration, over distribution, teaching to farmers,
contribution to the improvement of agricultural productivity, and the path to the reform
of agricultural policies (about administration of subsidies, etc); 3) installation of the
solar pump equals improvement of productivity, leading to the establishment of a
scheme of revenue up for the farmers, existing connection to the grid and dependence on
diesel pump of farmers (direction for the elimination of subsidies and power generation),
possibility of the introduction of solar pumps, and as a result, reduction in the ratio of
power generation from the grid diesel, reduction of the use of fossil fuel (energy
conservation), possibility on the reduction of CO2 emissions by understanding the JCM
from both parties based on the explanation.
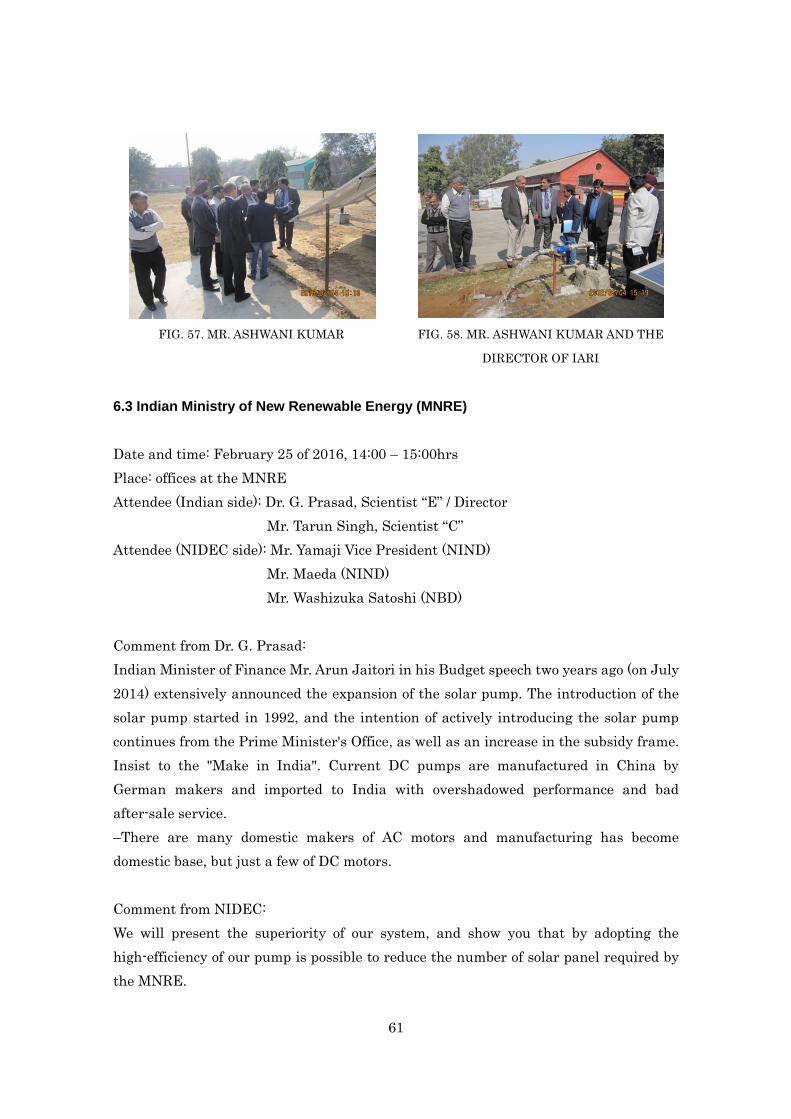
61
FIG. 57. MR. ASHWANI KUMAR
FIG. 58. MR. ASHWANI KUMAR AND THE
DIRECTOR OF IARI
6.3 Indian Ministry of New Renewable Energy (MNRE)
Date and time: February 25 of 2016, 14:00 – 15:00hrs
Place: offices at the MNRE
Attendee (Indian side): Dr. G. Prasad, Scientist “E” / Director
Mr. Tarun Singh, Scientist “C”
Attendee (NIDEC side): Mr. Yamaji Vice President (NIND)
Mr. Maeda (NIND)
Mr. Washizuka Satoshi (NBD)
Comment from Dr. G. Prasad:
Indian Minister of Finance Mr. Arun Jaitori in his Budget speech two years ago (on July
2014) extensively announced the expansion of the solar pump. The introduction of the
solar pump started in 1992, and the intention of actively introducing the solar pump
continues from the Prime Minister's Office, as well as an increase in the subsidy frame.
Insist to the "Make in India". Current DC pumps are manufactured in China by
German makers and imported to India with overshadowed performance and bad
after-sale service.
–There are many domestic makers of AC motors and manufacturing has become
domestic base, but just a few of DC motors.
Comment from NIDEC:
We will present the superiority of our system, and show you that by adopting the
high-efficiency of our pump is possible to reduce the number of solar panel required by
the MNRE.
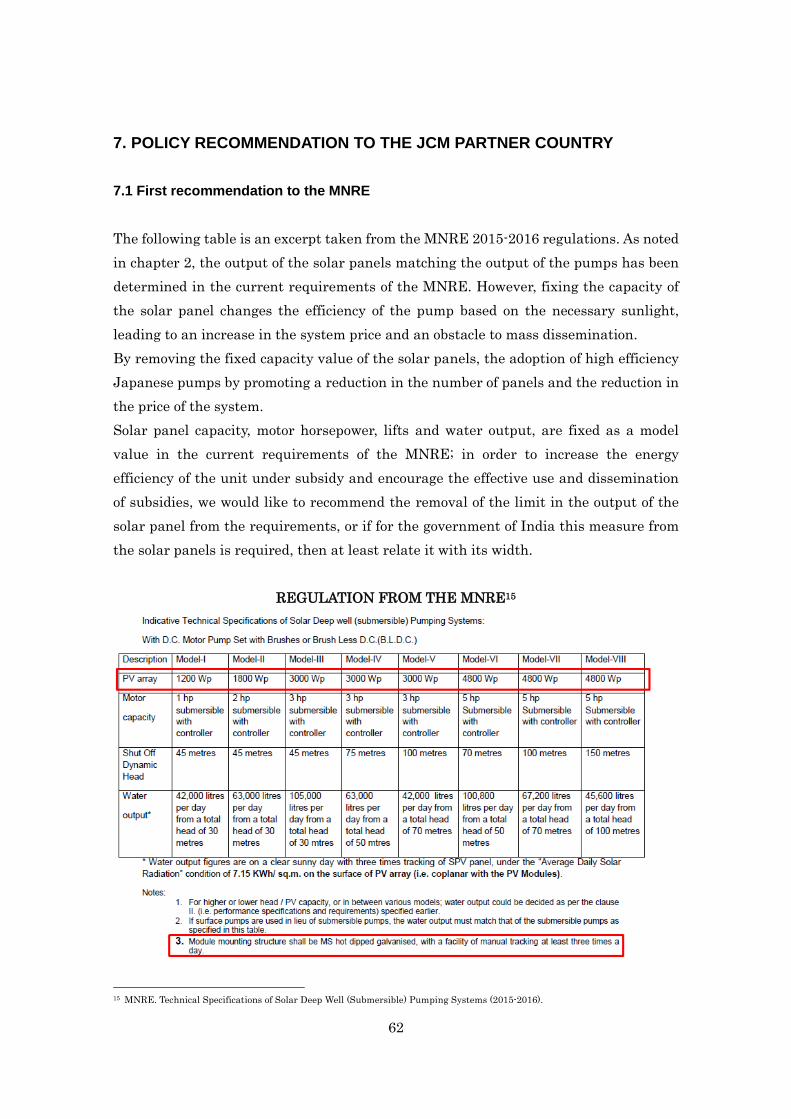
62
7. POLICY RECOMMENDATION TO THE JCM PARTNER COUNTRY
7.1 First recommendation to the MNRE
The following table is an excerpt taken from the MNRE 2015-2016 regulations. As noted
in chapter 2, the output of the solar panels matching the output of the pumps has been
determined in the current requirements of the MNRE. However, fixing the capacity of
the solar panel changes the efficiency of the pump based on the necessary sunlight,
leading to an increase in the system price and an obstacle to mass dissemination.
By removing the fixed capacity value of the solar panels, the adoption of high efficiency
Japanese pumps by promoting a reduction in the number of panels and the reduction in
the price of the system.
Solar panel capacity, motor horsepower, lifts and water output, are fixed as a model
value in the current requirements of the MNRE; in order to increase the energy
efficiency of the unit under subsidy and encourage the effective use and dissemination
of subsidies, we would like to recommend the removal of the limit in the output of the
solar panel from the requirements, or if for the government of India this measure from
the solar panels is required, then at least relate it with its width.
REGULATION FROM THE MNRE15
15 MNRE. Technical Specifications of Solar Deep Well (Submersible) Pumping Systems (2015-2016).

63
POLICY CHANGE PROPOSAL TO THE MNRE
Model I Model II Model III Model IV Model V Model VI Model VII Model VIII
PV array
930 ~
1200 Wp
1550 ~
1800 Wp
2400 ~
3000 Wp
2400 ~
3000 Wp
2170 ~
3000 Wp
3720 ~
4800 Wp
3720 ~
4800 Wp
3410 ~
4800 Wp
Motor Cap. 1 HP 2 HP 3 HP 3 HP 3 HP 5 HP 5 HP 5 HP
Shut off
dynamic head
45 M 45 M 45 M 75 M 100 M 70 M 100M 150M
Water output
42,000L /
30m
63,000L /
30m
105,000L /
30m
63,000 L
/ 50m
42,000L /
70m
100,800L
/ 50m
67,200L /
70m
45,600L /
100m
Introducing Cost Reduction by Reduction on the Number of Solar Panels
We have engaged in the study and development of high-efficiency pumps targeting the
efficiency of 68%, and this study was conducted for the introduction of such
high-efficiency pump. Currently our company is promoting the commercialization of 3
HP pump for total head of 50 meters. In the requirement of the MNRE for 3 HP pumps
and total head of 50 meters, the output of the solar panel is determined to be 3000 Wp.
The fig. 59 shows the relationship between the pump efficiency and solar panel capacity
to achieve the amount of 63 KLitres of water output per day. The horizontal axis shows
pump efficiency, the left vertical axis represents the solar panel capacity and the right
one the number of PV panels. From the relationship, in the case of introducing our
pump, since the efficiency is 68%, solar panel capacity can be reduced from the
conventional 3000 Wp with 10 panels to 2400 Wp with only 8 panels.
FIG. 59. POINT FULFILLING MNRE REQUIREMENTS FOR NUMBER OF SOLAR
PANELS, POWER OUTPUT AND PUMP EFFICIENCY

64
7.2 Second recommendation to the MNRE
As noted in chapter 2 about our system prospect, labor maintenance of the frame for the
tracking mechanism has become a problem. In addition, tracking frame costs nearly 10
times more than a fixed frame. Therefore, we investigated the possibility of further
efficiency of the pump thought the omission of the tracking mechanism.
Under the solar radiation conditions defined in chapter 2 and an array of solar panels
for a capacity of 3000 Wp, for each tracking conditions, it was calculated the required
pump efficiency α to achieve the amount of water output of 63KL determined by the
MNRE. Figure 60 presents the calculation results of the total amount of power
generated in one day by each tracking conditions. The horizontal axis represents time
and the vertical axis is the generated power, indicating the total amount of power
generation per day.
FIG. 60. TRANSITION OF THE ELECTRIC POWER GENERATED BY THE FIRST
DAY OF EACH TRACKING SYSTEM
The previous results were obtained by simulating the pump efficiency meeting the
amount of water output. The relationship in the fig. 61 between the input power to the
pump and the water output was approximated with the later equation.
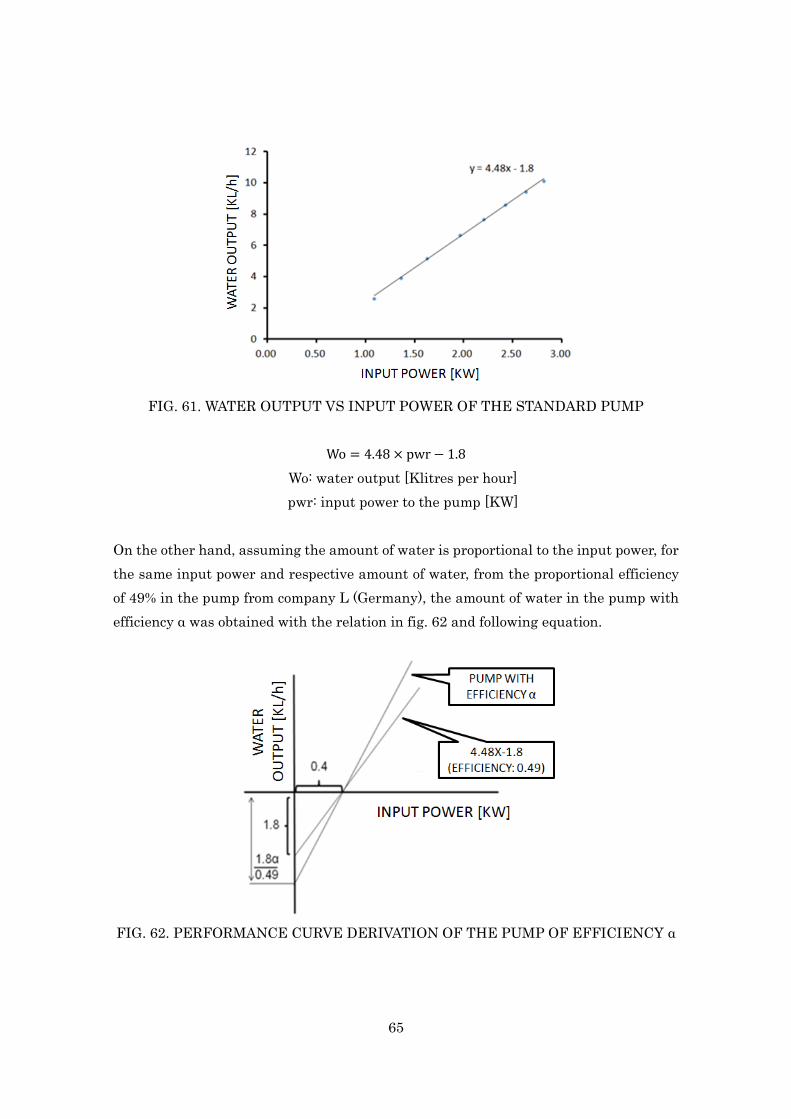
65
FIG. 61. WATER OUTPUT VS INPUT POWER OF THE STANDARD PUMP
Wo: water output [Klitres per hour]
pwr: input power to the pump [KW]
On the other hand, assuming the amount of water is proportional to the input power, for
the same input power and respective amount of water, from the proportional efficiency
of 49% in the pump from company L (Germany), the amount of water in the pump with
efficiency α was obtained with the relation in fig. 62 and following equation.
FIG. 62. PERFORMANCE CURVE DERIVATION OF THE PUMP OF EFFICIENCY α

66
We determined the efficiency with using the amount of power generation in fig. 60 for
getting an amount of 63,000 litres of water output in one day. The results are shown in
the next table.
Pump efficiency achieving the requirement of each tracking system
Automatic
tracking
Fixed Manual (3-stage
tracking)
Pumping efficiency to meet
the MNRE requirements 49% 71% 53%
In order to meet the required amount of water output with the pump, 49% efficiency is
necessary in the case of automatic tracking to the sun, 53% in the case of manual
tracking, and 71% in the case of no tracking mechanism (fixed). In other words, by the
condition of efficiency at 71% or more in the fixed frame with no tracking mechanism, it
would lead to a low-cost dissemination when thinking about the life cycle of the solar
pump. Thus, we want to express to the MNRE that it is possible to omit the tracking
mechanism when the pump’s efficiency is 71% and above. This would lead to the
dissemination of high-efficiency pumps.

67
8. CONCLUSION
Based on the results of this survey, we confirmed that one effective solution to the
challenges in the agricultural sector faced by India is the introduction of high-efficiency
pumps. From the previously mentioned recommendations, the promotion of solar pumps
in India can be expected with an effective use of subsidies.
India’s target of CO2 emissions by year 2030 is set with a reduction rate of 33 to 35%
per registered GDP in 2005, and one of the major triggers to achieve it is with the use of
energy efficient CO2 emission reduction products.
With the progress of the dialogue between Japan and India for the construction of the
JCM offering financial support and Japanese technology, the full-scale implementation
of this project through the assistance of supporting programs could possibly represent a
great appeal even for the UN Framework Convention on Climate Change Parties
(UNFCCC), in the efforts towards achieving the NDC (Nationally Determined
Contribution).