Embed Size (px)
Citation preview
Demerara Harbour Bridge Corporations
Feasibility Study and Design for the New
Demerara River Crossing
FINAL REPORT
LievenseCSO Engineering Contracting B.V. CORRESPONDENCE ADDRESS
P.O. Box 3199 NL-4800 DD Breda The Netherlands VISITING ADDRESS
Tramsingel 2 NL-4814 AB Breda TELEPHONE
+31 (0) 88 910 2303 E-MAIL
[email protected] WEBSITE
LievenseCSO.com CHAMBER OF COMMERCE
24158870
Doc number: GGFD-R-014
Revision: 0
Date: August 17th, 2017
FEASIBILITY STUDY AND DESIGN NEW DEMERARA RIVER CROSSING
FINAL REPORT
DOC NO.: GGFD-R-014 REV 0 | AUGUST 17TH, 2017
Authorization
Author Erik Schurink
Review Joel van der Beek
Jaap Wientjes
Authorization Arie Mol
Doc number: GGFD-R-014
Revision: 0
Date: August 17th, 2017

FEASIBILITY STUDY AND DESIGN NEW DEMERARA RIVER CROSSING
FINAL REPORT
DOC NO.: GGFD-R-014 REV 0 | AUGUST 17TH, 2017
Table of contents 1 Executive summary ..............................................................................................................1
1.1 Introduction ...................................................................................................................... 1
1.2 Main conclusions ............................................................................................................... 2
1.3 Recommended bridge location ......................................................................................... 3
1.4 Recommended bridge configuration ................................................................................ 4
1.5 Additional road capacity by the Links ............................................................................... 2
1.6 Alternative transport modalities ....................................................................................... 2
1.7 Financial feasibility and financing of the Project .............................................................. 3
1.8 Investment costs, Toll rates and Business Case ................................................................ 3
1.9 Risk Management .............................................................................................................. 4
1.10 Communication ................................................................................................................. 4
2 Why a new bridge? ..............................................................................................................5
2.1 The condition of the current floating bridge .................................................................... 5
2.2 Historic growth of traffic ................................................................................................... 5
2.3 Traffic congestion in general ............................................................................................. 6
3 Road traffic: forecast ......................................................................................................... 10
3.1 Drivers for growth ...........................................................................................................10
3.2 Models predicting impacts of growth on traffic .............................................................11
3.3 Prognosis on traffic volumes ...........................................................................................11
3.4 Impact of bridge location and bridge capacity on traffic forecast ..................................12
3.5 Impact of speedboat ferry system on traffic forecast bridge .........................................13
4 River transport: present situation and forecast ................................................................... 14
4.1 Nature and number of ships ...........................................................................................14
4.2 Trends ..............................................................................................................................14
4.3 Bridge impact on navigation in the present situation .....................................................15
4.4 Air draft of ships influences bridge height ......................................................................16
4.5 Impact of bridge location on river navigation .................................................................16
4.6 How to reduce the navigation time of vessel passage ...................................................17
4.7 Feasibility from a navigation point of view .....................................................................18
5 Road traffic: present situation ............................................................................................ 19
5.1 Current bridge .................................................................................................................19
5.2 Origin and destination of bridge users ............................................................................19
5.3 Present situation road system ........................................................................................20
5.4 Accidents .........................................................................................................................22
5.5 Conclusions existing situation .........................................................................................22
6 Road traffic: expected impacts of a new bridge ................................................................... 23
6.1 Effect of height of (new) bridge on traffic.......................................................................23
6.2 Effect of number of lanes ................................................................................................24
FEASIBILITY STUDY AND DESIGN NEW DEMERARA RIVER CROSSING
FINAL REPORT
DOC NO.: GGFD-R-014 REV 0 | AUGUST 17TH, 2017
6.3 Effect Impacts bypass roads and links .............................................................................26
7 Alternatives considered ..................................................................................................... 27
7.1 Location ...........................................................................................................................27
8 Design Considerations ........................................................................................................ 29
8.1 Bridge type ......................................................................................................................29
8.2 Number of lanes ..............................................................................................................29
8.3 Intersections ....................................................................................................................29
8.4 Ancillary facilities.............................................................................................................29
9 Reference Design and Cost Estimate ................................................................................... 31
9.1 Rules for horizontal alignments ......................................................................................31
9.2 Rules for vertical alignments ...........................................................................................31
9.3 Impacts on land ...............................................................................................................31
9.4 Construction methods .....................................................................................................32
9.5 Low bridge design ...........................................................................................................32
9.6 High bridge design ...........................................................................................................32
10 Environmental and social impacts ...................................................................................... 35
10.1 Scope ...............................................................................................................................35
10.2 Traffic-related impacts ....................................................................................................35
10.3 Biodiversity ......................................................................................................................35
10.4 Overall impacts ................................................................................................................36
10.5 Recommendations from environmental and social point of view ..................................36
11 Economic feasibility ........................................................................................................... 37
11.1 Scope ...............................................................................................................................37
11.2 Assumptions on economic feasibility ..............................................................................37
11.3 Revenues from toll ..........................................................................................................37
11.4 Investment costs .............................................................................................................38
11.5 Operational costs ............................................................................................................38
11.6 Travel time demurrage river traffic .................................................................................39
11.7 Results and conclusions ..................................................................................................39
12 Basic Design: Low 3 lane bridge Houston - Versailles ........................................................... 42
13 Financial feasibility, Financing and Funding ........................................................................ 52
13.1 PPP Strategy ....................................................................................................................52
13.2 Organisational structure; SPC .........................................................................................52
13.3 Possible Partners .............................................................................................................52
13.4 The Financial Model ........................................................................................................52
13.5 Revenues .........................................................................................................................53
13.6 Tax and Dividends ...........................................................................................................54
14 Financial feasibility; toll rate impact ................................................................................... 55
14.1 Cash available for debt service........................................................................................55
14.2 Increase of toll; effect business case and government contribution ..............................55
14.3 Project structure .............................................................................................................56
FEASIBILITY STUDY AND DESIGN NEW DEMERARA RIVER CROSSING
FINAL REPORT
DOC NO.: GGFD-R-014 REV 0 | AUGUST 17TH, 2017
14.4 Impact of bridge locations and configurations on the financial modelling ....................55
15 Risk management .............................................................................................................. 56
Disclaimer
Annexes
Annex 1. Traffic Projections Demand
Annex 2. Site Investigation
Annex 3. Analysis Road System
Annex 4. Shipping Analysis
Annex 5. Conceptual Design River crossing
Annex 6. Initial Environmental and Social Impact Assessment Report
Annex 7. Economic Feasibility
Annex 8. Financial Feasibility
Annex 9. Basic Design
Annex 10. Financing and Funding Plan
Annex 11. Basic Design Drawings
Annex 12. Basic Design Cost Estimation
FEASIBILITY STUDY AND DESIGN NEW DEMERARA RIVER CROSSING
FINAL REPORT
DOC NO.: GGFD-R-014 REV 0 | AUGUST 17TH, 2017
1 / 57
1 Executive summary
1.1 Introduction
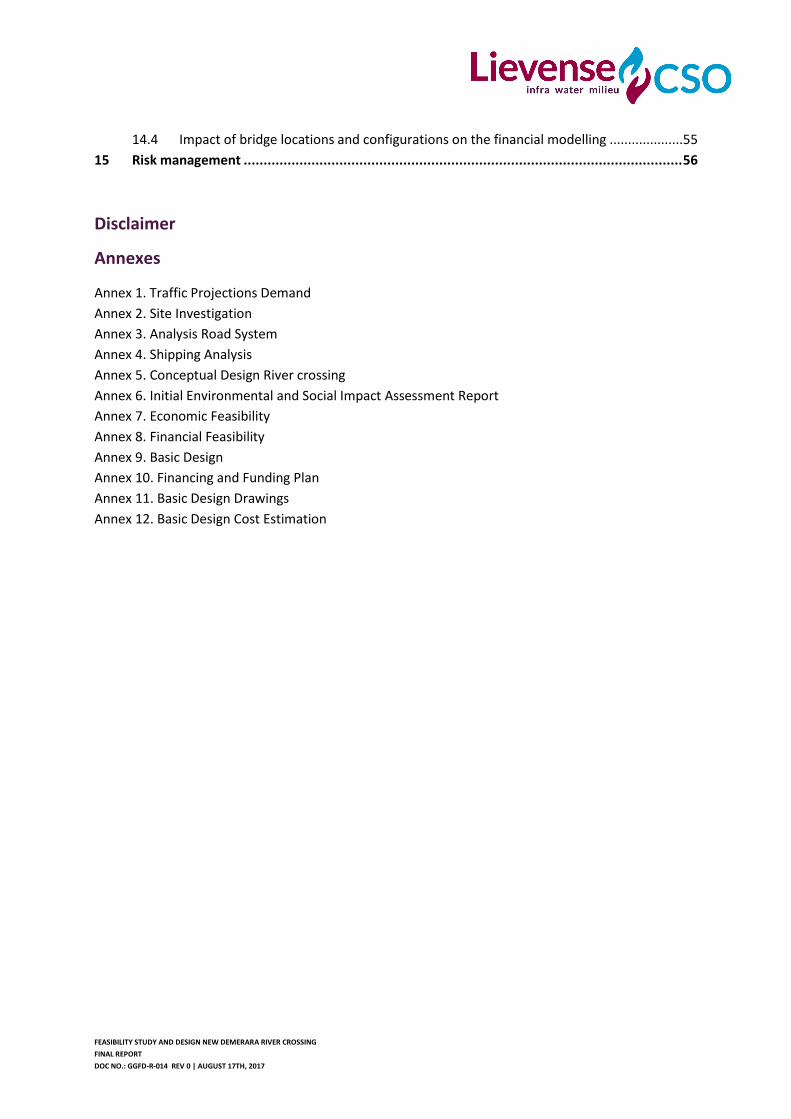
The Demerara Harbour Bridge has been in operation for 40 years and has long passed its
technical lifetime. The bridge is no longer able to service the present and future traffic
demand. The long retraction time causes major traffic congestion. A total overhaul would be
costly and the limited capacity does not provide a solution for the growing traffic .
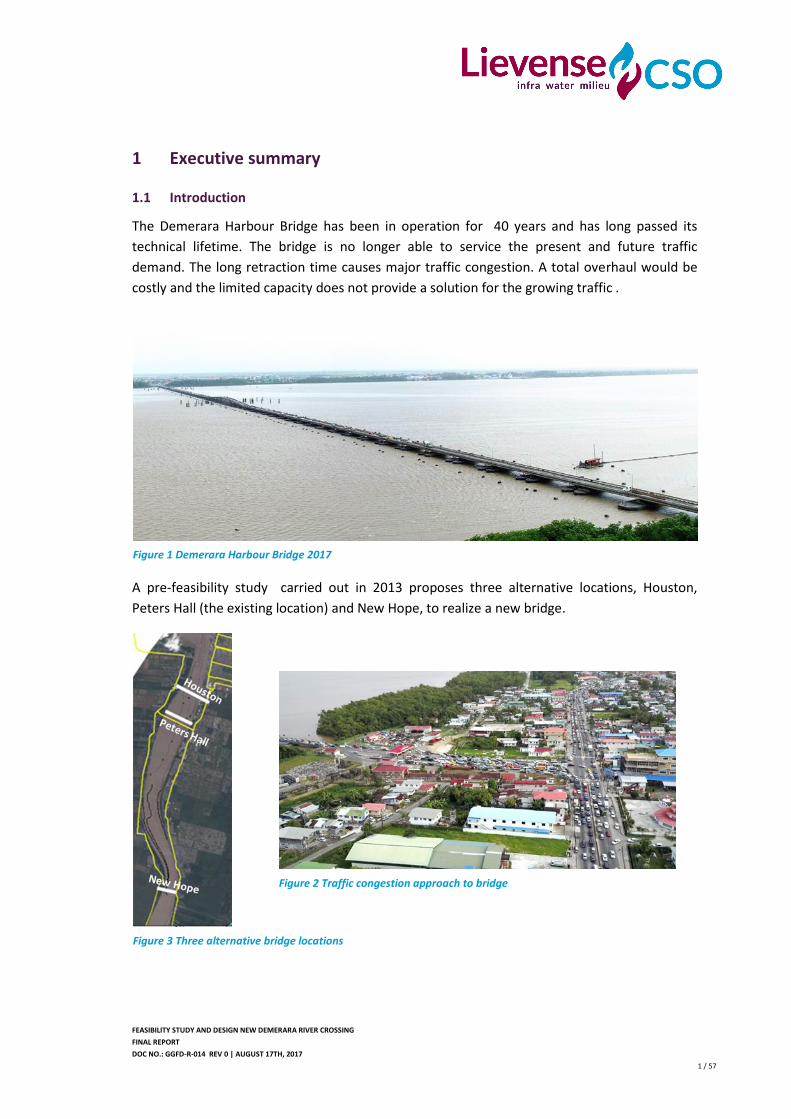
A pre-feasibility study carried out in 2013 proposes three alternative locations, Houston,
Peters Hall (the existing location) and New Hope, to realize a new bridge.
Figure 1 Demerara Harbour Bridge 2017
Figure 3 Three alternative bridge locations
Figure 2 Traffic congestion approach to bridge
FEASIBILITY STUDY AND DESIGN NEW DEMERARA RIVER CROSSING
FINAL REPORT
DOC NO.: GGFD-R-014 REV 0 | AUGUST 17TH, 2017
2 / 57
Currently there is an urgent need for a final
conclusion on the configuration and
location of the new river crossing. A
detailed feasibility and design study is
needed to address all aspects of the
Project and present a basis for decision-
making and the further steps into
realisation.
The Government of Guyana has
commissioned LievenseCSO to execute a
the feasibility and design study. This study
includes site investigations, traffic and river
studies, designs, environmental impact
study, socio economic cost benefit analysis,
financial analysis and financing and funding
plan. The aim of the study is to support the
decision making by the government on the
location and configuration of the river
crossing.
The Demerara Harbour Bridge Corporation
has acted as the Employer and has
supervised the Consultants together with
the Department of Transportation Planning
of the Ministry of Public Infrastructure.
Consultants very much appreciate the
efforts of the Demerara Harbour Bridge
Corporation and the Ministry of Public
Infrastructure for all timely data collection
as well as the excellent organisation of the
stakeholder meetings and feed backs
given. The study has been carried out
between January 1, 2017 and August 17,
2017.
This Final Report summarizes the findings
and conclusions of the study. For more
detailed information on the subjects
studied reference is made to the Annexes
of this Report comprising the detailed
study reports on the various subjects.
1.2 Main conclusions
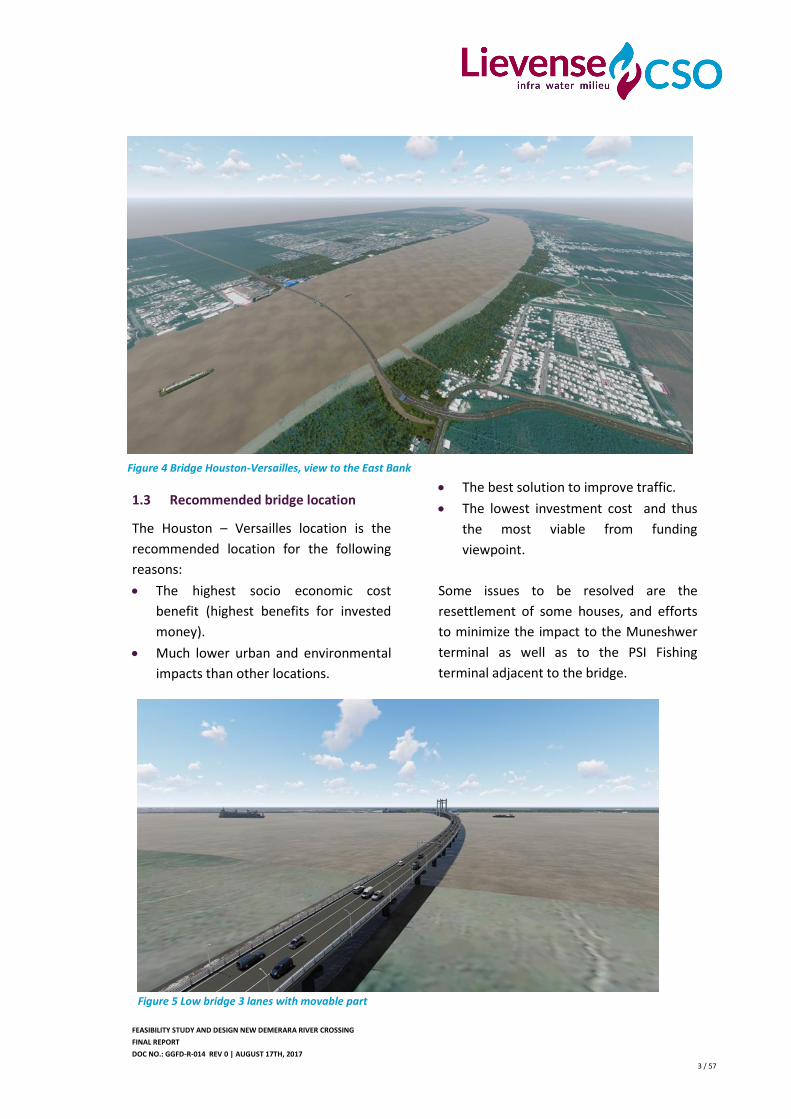
A low bridge at Houston with three lanes
and a movable section to transit seagoing
vessels is found to be the best solution.
Present bridge is unreliable and lacks
the capacity to serve the traffic
demand hence a new bridge is
required.
Traffic is estimated to continue to grow
at 5% per annum.
The road network in greater
Georgetown area is saturated. The
road network adjacent to the present
bridge is not able to serve the present
and future traffic demand. New linking
roads are required to fully use the new
bridge capacity.
The best location is at Houston –
Versailles.
A three lane bridge with an opening
section to allow river traffic to pass is
the best configuration.
Investment costs, traffic demand,
economic impact, urban development
aspects, environmental impacts and
financial feasibility have all been
considered in the equation to arrive at
the above choice of location and
configuration.
FEASIBILITY STUDY AND DESIGN NEW DEMERARA RIVER CROSSING
FINAL REPORT
DOC NO.: GGFD-R-014 REV 0 | AUGUST 17TH, 2017
3 / 57
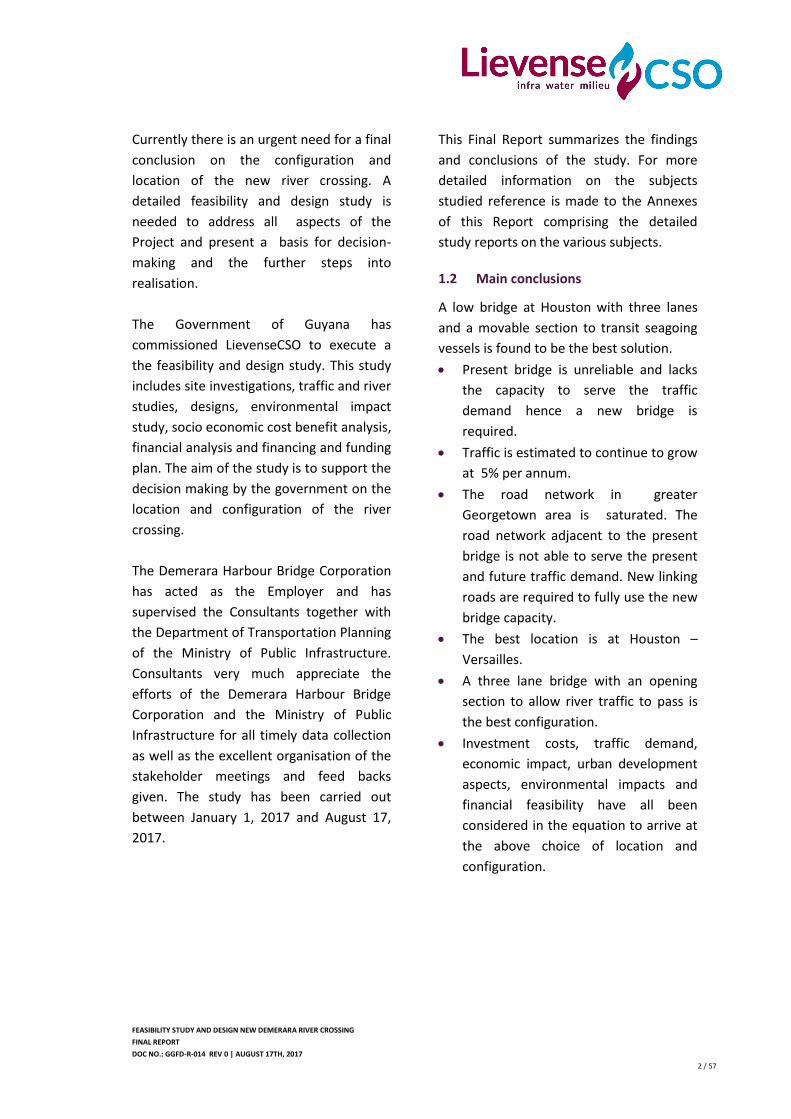
1.3 Recommended bridge location
The Houston – Versailles location is the
recommended location for the following
reasons:
The highest socio economic cost
benefit (highest benefits for invested
money).
Much lower urban and environmental
impacts than other locations.
The best solution to improve traffic.
The lowest investment cost and thus
the most viable from funding
viewpoint.
Some issues to be resolved are the
resettlement of some houses, and efforts
to minimize the impact to the Muneshwer
terminal as well as to the PSI Fishing
terminal adjacent to the bridge.
Figure 5 Low bridge 3 lanes with movable part
Figure 4 Bridge Houston-Versailles, view to the East Bank
FEASIBILITY STUDY AND DESIGN NEW DEMERARA RIVER CROSSING
FINAL REPORT
DOC NO.: GGFD-R-014 REV 0 | AUGUST 17TH, 2017
4 / 57
On the West Bank attention should be paid
to mangrove fringe crossing, the current
drainage channel and a timber company.
There is impact to the harbour as well as
the navigation in the river. Procedures for
navigation have to be reconsidered and
new lead lines to be developed.
All these challenges are manageable.
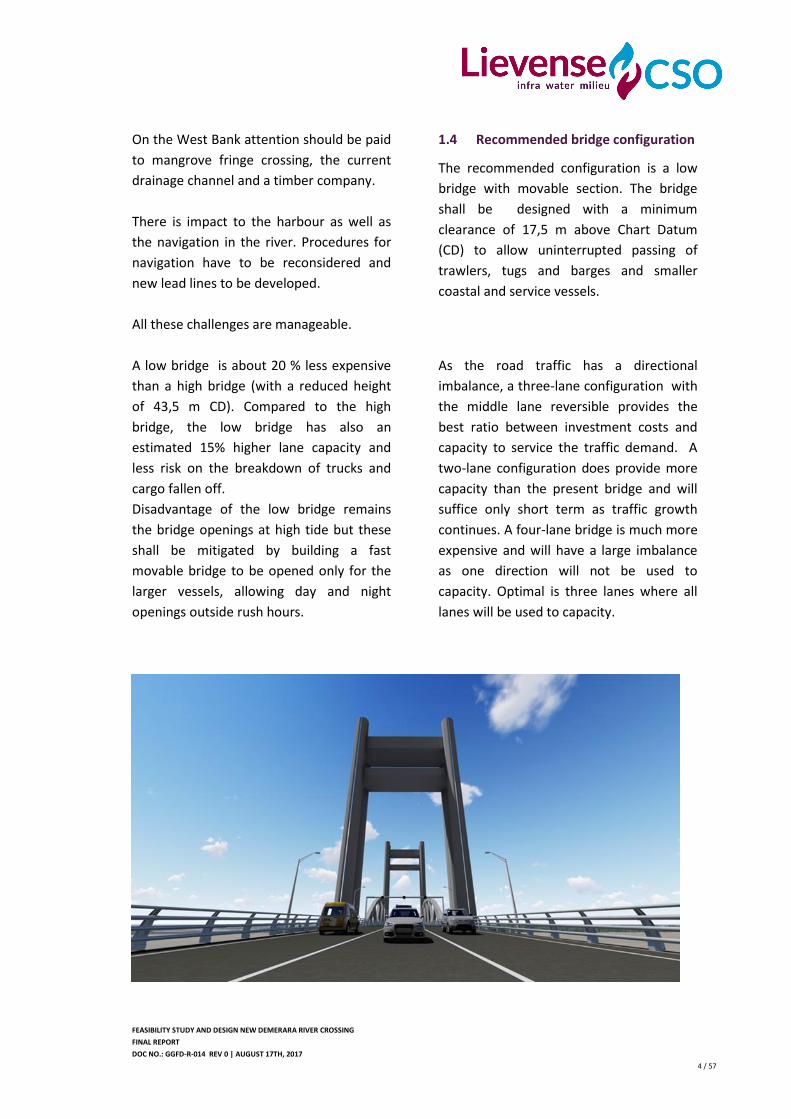
1.4 Recommended bridge configuration
The recommended configuration is a low
bridge with movable section. The bridge
shall be designed with a minimum
clearance of 17,5 m above Chart Datum
(CD) to allow uninterrupted passing of
trawlers, tugs and barges and smaller
coastal and service vessels.
A low bridge is about 20 % less expensive
than a high bridge (with a reduced height
of 43,5 m CD). Compared to the high
bridge, the low bridge has also an
estimated 15% higher lane capacity and
less risk on the breakdown of trucks and
cargo fallen off.
Disadvantage of the low bridge remains
the bridge openings at high tide but these
shall be mitigated by building a fast
movable bridge to be opened only for the
larger vessels, allowing day and night
openings outside rush hours.
As the road traffic has a directional
imbalance, a three-lane configuration with
the middle lane reversible provides the
best ratio between investment costs and
capacity to service the traffic demand. A
two-lane configuration does provide more
capacity than the present bridge and will
suffice only short term as traffic growth
continues. A four-lane bridge is much more
expensive and will have a large imbalance
as one direction will not be used to
capacity. Optimal is three lanes where all
lanes will be used to capacity.
FEASIBILITY STUDY AND DESIGN NEW DEMERARA RIVER CROSSING
FINAL REPORT
DOC NO.: GGFD-R-014 REV 0 | AUGUST 17TH, 2017
2 / 57
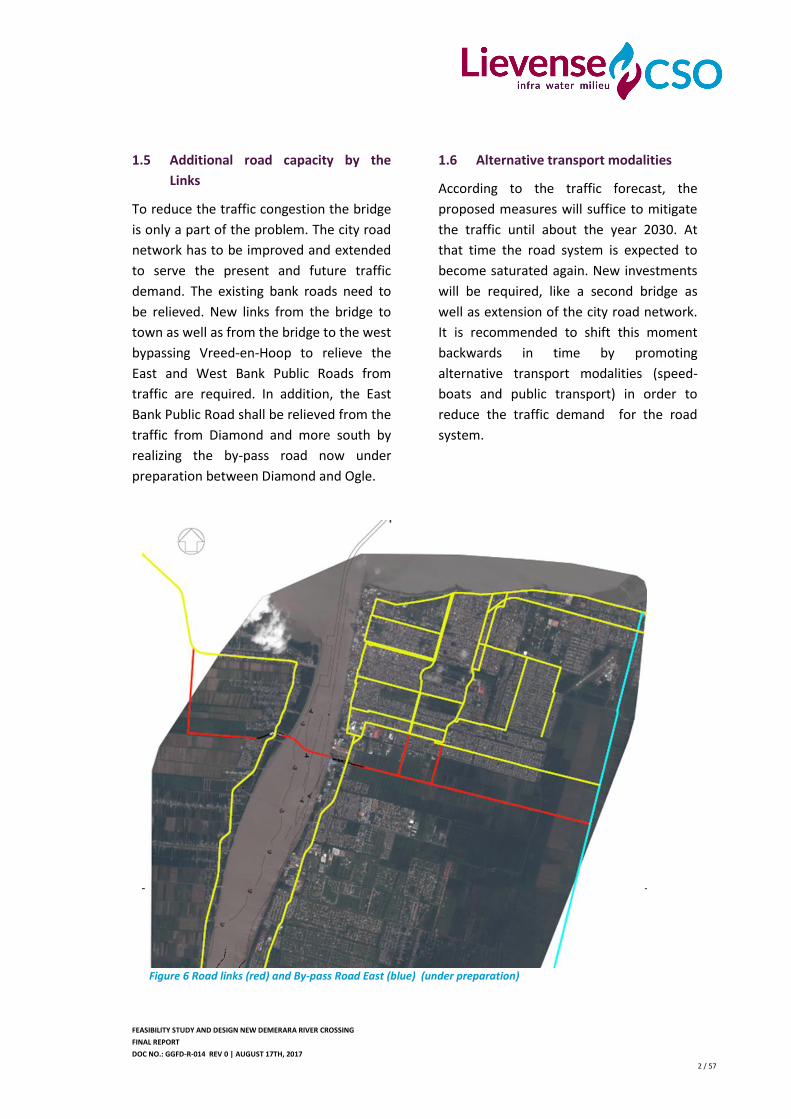
1.5 Additional road capacity by the
Links
To reduce the traffic congestion the bridge
is only a part of the problem. The city road
network has to be improved and extended
to serve the present and future traffic
demand. The existing bank roads need to
be relieved. New links from the bridge to
town as well as from the bridge to the west
bypassing Vreed-en-Hoop to relieve the
East and West Bank Public Roads from
traffic are required. In addition, the East
Bank Public Road shall be relieved from the
traffic from Diamond and more south by
realizing the by-pass road now under
preparation between Diamond and Ogle.
1.6 Alternative transport modalities
According to the traffic forecast, the
proposed measures will suffice to mitigate
the traffic until about the year 2030. At
that time the road system is expected to
become saturated again. New investments
will be required, like a second bridge as
well as extension of the city road network.
It is recommended to shift this moment
backwards in time by promoting
alternative transport modalities (speed-
boats and public transport) in order to
reduce the traffic demand for the road
system.
Figure 6 Road links (red) and By-pass Road East (blue) (under preparation)
FEASIBILITY STUDY AND DESIGN NEW DEMERARA RIVER CROSSING
FINAL REPORT
DOC NO.: GGFD-R-014 REV 0 | AUGUST 17TH, 2017
3 / 57
1.7 Financial feasibility and financing of
the Project
A business case of the Project has been
developed for the Project. In principle the
conclusions hold for each type of financing.
The Revenues from toll and the expenses
have been projected. The debt service
(repayment of principal and interest) to
pay back bonds/loans and interest) is the
most important cost factor and is very
dominant in the financial projections.
Government wishes as much as possible
private involvement (PPP) to reduce the
claim on Government funding and
liabilities. A funding plan has been
developed taking into account lowest
government contribution i.e. maximise
non-governmental financial institutions
and funding, swift arranging and a
sustainable structure which fits the Project.
A keen appetite has been found in the
national and regional financial markets to
fund the Project.
From the financial projections it was
concluded that the business case of the
Project is financially not viable assuming
similar toll rates and no contribution from
Government. The main reason is the high
debt service caused by the short loan
periods and high interests in the market.
1.8 Investment costs, Toll rates and
Business Case
Project costs of the low three lane bridge
at Houston - Versailles are estimated at
USD 150 million, including contractors cost
and additional costs for services, land
acquisition for the approach roads, and
limited budget for a first phase of link
roads.
Total required funding is USD 170 million
including interest for pre-financing cost
during construction.
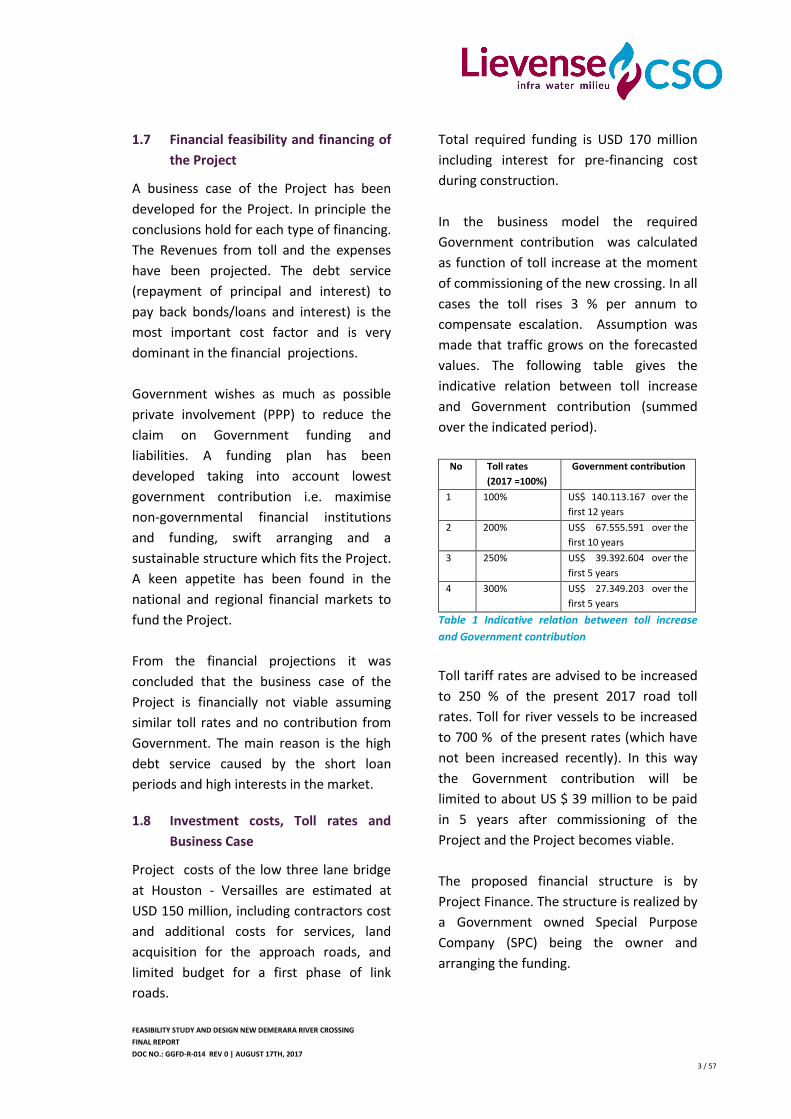
In the business model the required
Government contribution was calculated
as function of toll increase at the moment
of commissioning of the new crossing. In all
cases the toll rises 3 % per annum to
compensate escalation. Assumption was
made that traffic grows on the forecasted
values. The following table gives the
indicative relation between toll increase
and Government contribution (summed
over the indicated period).
No Toll rates
(2017 =100%)
Government contribution
1 100% US$ 140.113.167 over the
first 12 years
2 200% US$ 67.555.591 over the
first 10 years
3 250% US$ 39.392.604 over the
first 5 years
4 300% US$ 27.349.203 over the
first 5 years
Table 1 Indicative relation between toll increase
and Government contribution
Toll tariff rates are advised to be increased
to 250 % of the present 2017 road toll
rates. Toll for river vessels to be increased
to 700 % of the present rates (which have
not been increased recently). In this way
the Government contribution will be
limited to about US $ 39 million to be paid
in 5 years after commissioning of the
Project and the Project becomes viable.
The proposed financial structure is by
Project Finance. The structure is realized by
a Government owned Special Purpose
Company (SPC) being the owner and
arranging the funding.
FEASIBILITY STUDY AND DESIGN NEW DEMERARA RIVER CROSSING
FINAL REPORT
DOC NO.: GGFD-R-014 REV 0 | AUGUST 17TH, 2017
4 / 57
The SPC is supported and guaranteed by
Government through:
A guarantee on the pay back on bonds,
loans and interest.
Some SPC equity or similar long term
financing not requiring interest.
Annual yearly government contribu-
tion for the first 5-10 years to cover the
negative cash flow as indicated above.
An alternative structure is to seek private
parties willing to engage themselves in a
BOOT Project (built, operate, own and
transfer). These parties will take care of the
financing which may be better than can be
funded by Government. However Project
costs are higher and the BOOT business
case must result in sufficient risk coverage
and profit for the private partner and as a
result may require higher toll rates or more
Government contribution. It is expected
that similar guarantees from Government
will be required as in the case of Project
Finance.
DBFM (Design, Built, Finance and Maintain)
or similar is a mixed option combining the
SPC structure with possibly better financing
by the private party.
1.9 Risk Management
The recommended project has from an
financial point of view limited safety
margin and many factors are still uncertain.
This include among others, the contract
costs of the D&C contractor, the final
funding costs and interest, the uncertainty
in the traffic forecast and thus the
revenues, claims and force majeure.
Therefore, it is recommended to adopt a
flexible development strategy to control
risks in cost and revenues by scope
management, as this is the only way to
influence the costs of the project. This
includes minor items like the link roads and
viaducts over the bank roads, but even the
consideration to accept two lanes if such is
the only way to realize the project.
Another recommendation is early con-
tractor involvement.
1.10 Communication
Make investments in careful
communication to the public to generate
the willingness to pay the considerable
higher toll rates; use for this also the Final
Environmental and Social Impact
Assessment (ESIA) process as required by
the Environment Protection Agency (EPA)
as a tool to create public support for the
project.
FEASIBILITY STUDY AND DESIGN NEW DEMERARA RIVER CROSSING
FINAL REPORT
DOC NO.: GGFD-R-014 REV 0 | AUGUST 17TH, 2017
5 / 57
2 Why a new bridge?
2.1 The condition of the current floating
bridge
The current two-lane steel floating bridge
connects the East Bank at Peters Hall with
the West Bank at Meer Zorgen. Some
40.000-45.000 people (10.000 vehicles per
direction) use the bridge each day. The
market share of the bridge for the
passenger segment is about 85% (the other
15% use speedboats).
The current bridge has already passed its
technical life and requires fundamental
overhaul, replacement, maintenance and
repair. Road capacity is limited due to the
retraction system. Opening times are long
due to the slow retraction process. The
structure is vulnerable for incidents from
vehicles and vessels as well as river forces.
As the bridge is the only connection, the
West Bank economy and population will
suffer significantly in case the bridge
cannot be used over longer time; there is
no good alternative.
Reference is made to the situation in 1988
when the bridge was out of operation for a
few weeks.
In addition, the long and frequent bridge
openings impact traffic. Bridge opening
time depends on water levels and flow
velocities (tide). When appropriate tidal
conditions for opening coincide with (road)
rush hours, large traffic jams occur. The
retraction time to open the bridge allowing
river traffic pass is long and the mechanism
sometimes fails resulting in either river or
road traffic cannot pass. This causes
unnecessary delays and demurrage for the
ships and congestion for road traffic.
The new bridge will replace the existing
bridge. As soon as the new bridge is in
operation the old bridge will be closed and
demolished.
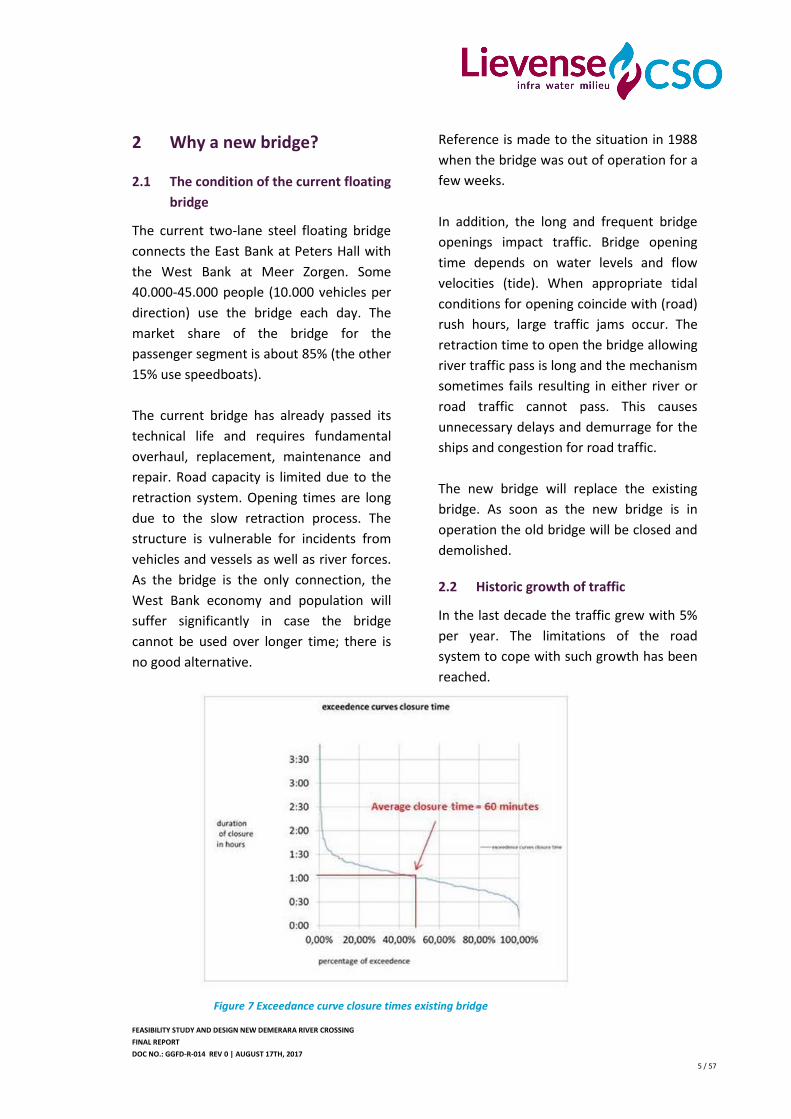
2.2 Historic growth of traffic
In the last decade the traffic grew with 5%
per year. The limitations of the road
system to cope with such growth has been
reached.
Figure 7 Exceedance curve closure times existing bridge
FEASIBILITY STUDY AND DESIGN NEW DEMERARA RIVER CROSSING
FINAL REPORT
DOC NO.: GGFD-R-014 REV 0 | AUGUST 17TH, 2017
6 / 57
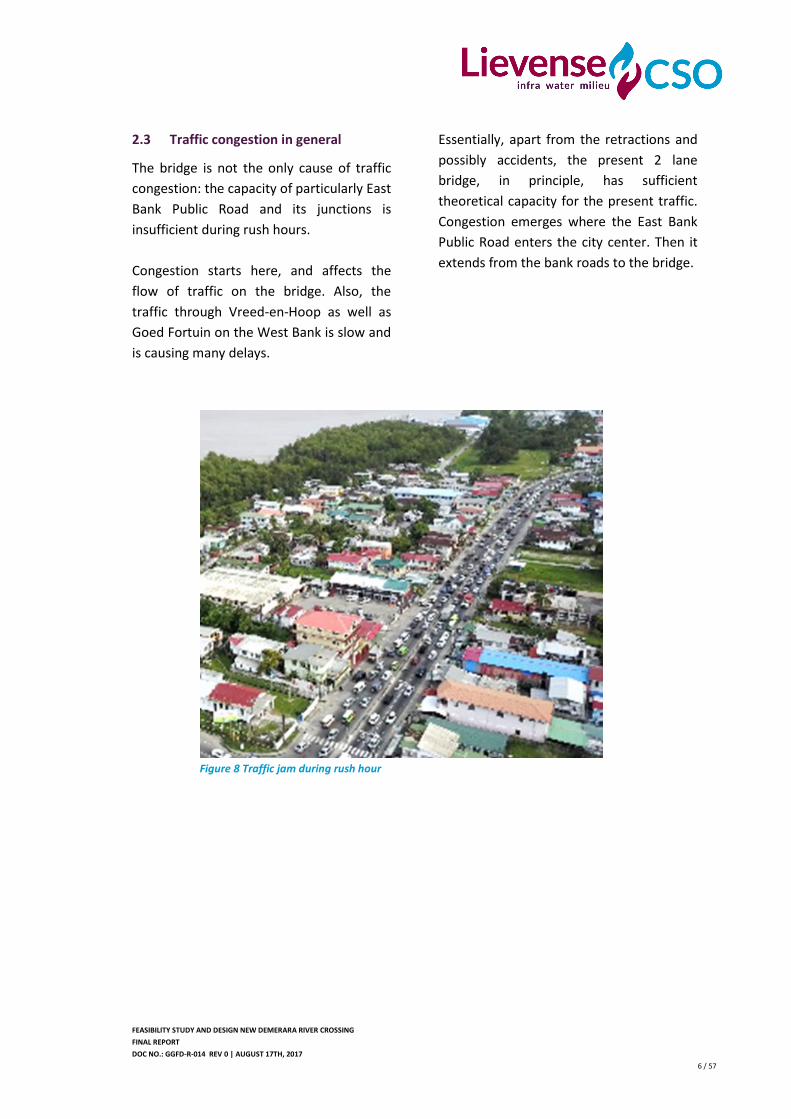
2.3 Traffic congestion in general
The bridge is not the only cause of traffic
congestion: the capacity of particularly East
Bank Public Road and its junctions is
insufficient during rush hours.
Congestion starts here, and affects the
flow of traffic on the bridge. Also, the
traffic through Vreed-en-Hoop as well as
Goed Fortuin on the West Bank is slow and
is causing many delays.
Essentially, apart from the retractions and
possibly accidents, the present 2 lane
bridge, in principle, has sufficient
theoretical capacity for the present traffic.
Congestion emerges where the East Bank
Public Road enters the city center. Then it
extends from the bank roads to the bridge.
Figure 8 Traffic jam during rush hour
FEASIBILITY STUDY AND DESIGN NEW DEMERARA RIVER CROSSING
FINAL REPORT
DOC NO.: GGFD-R-014 REV 0 | AUGUST 17TH, 2017
10 / 57
3 Road traffic: forecast
3.1 Drivers for growth
The growth of traffic on the bridge is
strongly related to the macro economic
growth. According to the IMF, ‘Guyana’s
macroeconomic outlook is generally
positive for 2016 and the medium-term’.
International studies indicate that there
are several factors that explain the volume
of motorized vehicles. Rand/Institute for
Mobility Research identifies nine factors
that explain motorized transportation in
developing countries: 1) good car
infrastructure; 2) inexpensive fuel; 3) pro-
car policies; 4) lack of alternative to driving;
5) active population; 6) existence of
domestic oil; 7) strength of the domestic
car industry; 8) spatial dispersion; 9)
favourability of car culture.
For Guyana three out of these nine factors
are expected to drive the increase of traffic
demand in the future: good car culture,
inexpensive fuel and existence of domestic
oil. The conclusion is that a further
increase in motorized transportation is to
be excepted. This is in line with historical
data. Car registration in Guyana shows a
steep increase of over 7% per annum
(2010-2015). Worldwide, people are using
cars more and more. The percentage of
commuters that are able to use individual
transportation modes will increase over
time.
Momentarily, car-pooling is widely used for
the bridge crossing. The public transport by
speedboats and minibuses seems flexible
and rather efficient. Improvements can still
be made and may reduce the additional
traffic pressure on the bridge in the future.
A large share of demand for transportation
services consists of commuting distances to
schools, administration and utilities.
Regarding trade corridors the bridge plays
an important role. Georgetown is
considered the marketplace of Guyana.
The bridge provides Regions 1, 2, 4 and 7
with market access. The Port of
Georgetown plays a key role in Guyana’s
international trade.
Urbanisation has resulted in a long series
of housing schemes, following the lines of
the shore of the ocean, the riverbanks and
the larger roads. When there is a road,
housing schemes and commercial
developments follow. Demerara West Bank
and West Coast also show a strong
increase in housing. However, Region 3 has
a relatively low level (even slight reduction)
of employment opportunities. People have
to cross the Demerara River to go to work,
for administrative issues, access to
markets, schools and hospitals. The
crossings are strongly related to a
structural imbalance. At present there is a
ratio of 1:2 between the West Bank and
the East Bank population. We assume a
continuation of the ratio of 1:2 for the
number of inhabitants on the West and
East Bank respectively which means that
population growth is assumed to be equal
on both sides.
There is no recent integral transportation
plan, neither at a regional level nor at
national level. The general traffic
projection will be influenced by the plans
for urban development in the regions. Due
to a strong decrease of average household
size, the number of houses shows a
structural increase. Although Government
follows a decentralisation policy, it is not
FEASIBILITY STUDY AND DESIGN NEW DEMERARA RIVER CROSSING
FINAL REPORT
DOC NO.: GGFD-R-014 REV 0 | AUGUST 17TH, 2017
11 / 57
believed that this policy will significantly
influence (or even turn) the degree of
urbanisation, which is observed all over
the world. These factors, together with an
increase of the commercial activities, lead
to the structural growth of the larger
Georgetown area.
3.2 Models predicting impacts of
growth on traffic
In our traffic models we have taken a time
horizon of 30 years for traffic forecast
projections. The technical lifetime of a
fixed bridge exceeds 50 years. Effects of
bridge type and location on traffic growth
have been estimated.
The effect of a price increase on the
volume of demand (price elasticity of
demand) has been analysed and identified.
Effects of pricing policies on volumes were
found to be low. It has also been evidenced
by a recent doubling of the toll rates. After
5 months the 100% price increase led run
to a slight volume decrease (-6%)
compared to the situation that was
expected when the fee would not have
been changed. Ferry traffic however
increased significantly and some overflow
to the alternative mode occurred.
It is expected that the traffic volumes soon
will return to 5% per annum growth
pattern, that was followed before the price
increase. The demand for bridge crossings
seems to be ‘relatively inelastic’ also
because the alternative is not attractive for
various reasons.
The interviews showed that a comparable
effect could be expected when prices
would be increased to 200% of the present
toll rate. Based on estimates of
affordability traffic volumes might drop
severely when the price increase would be
higher than 250% of the present toll. At
these higher tolls, commuters are expected
to look very seriously for alternatives like
driving carpooling, speedboats and choose
for bus transport instead of individual cars.
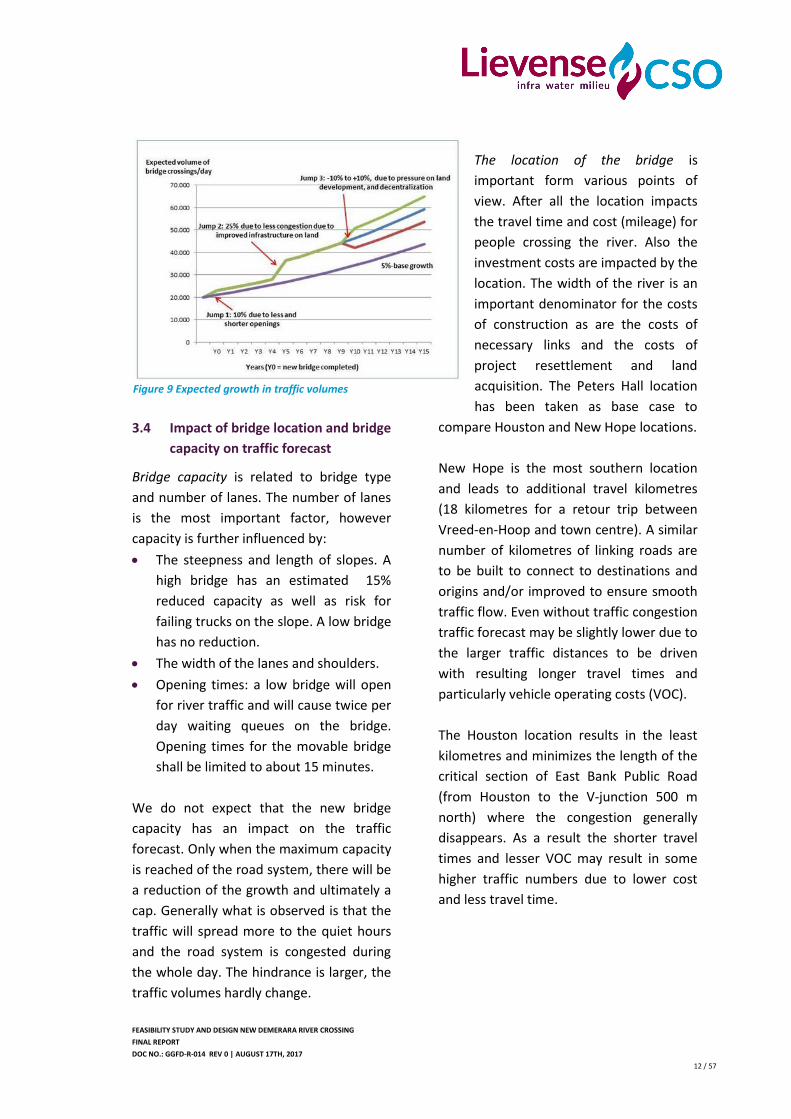
3.3 Prognosis on traffic volumes
The prognosis of the traffic volumes
crossing the bridge is based on historical
volumes, a base growth rate and several
incremental changes (jumps). Impact of toll
increase is assumed to be zero. With 5%
per annum, the base growth rate is
positioned in between GDP growth (4%)
and growth in registration of vehicles (7%).
The availability of the new bridge in 2020 is
expected to result in an instantaneous 10%
jump in traffic due to reduced
interruptions.
A second jump, of 25% is expected in 2025
when the additional road infrastructure
will be fully effective. A third jump might
occur in 2030, supposing that the
Demerara West Bank becomes urban,
offering more employment, commerce and
utilities, and thus the need for people to
use the bridge might change and even
decrease. The number of river crossings
might stabilize or even slow down.
FEASIBILITY STUDY AND DESIGN NEW DEMERARA RIVER CROSSING
FINAL REPORT
DOC NO.: GGFD-R-014 REV 0 | AUGUST 17TH, 2017
12 / 57
3.4 Impact of bridge location and bridge
capacity on traffic forecast
Bridge capacity is related to bridge type
and number of lanes. The number of lanes
is the most important factor, however
capacity is further influenced by:
The steepness and length of slopes. A
high bridge has an estimated 15%
reduced capacity as well as risk for
failing trucks on the slope. A low bridge
has no reduction.
The width of the lanes and shoulders.
Opening times: a low bridge will open
for river traffic and will cause twice per
day waiting queues on the bridge.
Opening times for the movable bridge
shall be limited to about 15 minutes.
We do not expect that the new bridge
capacity has an impact on the traffic
forecast. Only when the maximum capacity
is reached of the road system, there will be
a reduction of the growth and ultimately a
cap. Generally what is observed is that the
traffic will spread more to the quiet hours
and the road system is congested during
the whole day. The hindrance is larger, the
traffic volumes hardly change.
The location of the bridge is
important form various points of
view. After all the location impacts
the travel time and cost (mileage) for
people crossing the river. Also the
investment costs are impacted by the
location. The width of the river is an
important denominator for the costs
of construction as are the costs of
necessary links and the costs of
project resettlement and land
acquisition. The Peters Hall location
has been taken as base case to
compare Houston and New Hope locations.
New Hope is the most southern location
and leads to additional travel kilometres
(18 kilometres for a retour trip between
Vreed-en-Hoop and town centre). A similar
number of kilometres of linking roads are
to be built to connect to destinations and
origins and/or improved to ensure smooth
traffic flow. Even without traffic congestion
traffic forecast may be slightly lower due to
the larger traffic distances to be driven
with resulting longer travel times and
particularly vehicle operating costs (VOC).
The Houston location results in the least
kilometres and minimizes the length of the
critical section of East Bank Public Road
(from Houston to the V-junction 500 m
north) where the congestion generally
disappears. As a result the shorter travel
times and lesser VOC may result in some
higher traffic numbers due to lower cost
and less travel time.
Figure 9 Expected growth in traffic volumes
FEASIBILITY STUDY AND DESIGN NEW DEMERARA RIVER CROSSING
FINAL REPORT
DOC NO.: GGFD-R-014 REV 0 | AUGUST 17TH, 2017
13 / 57
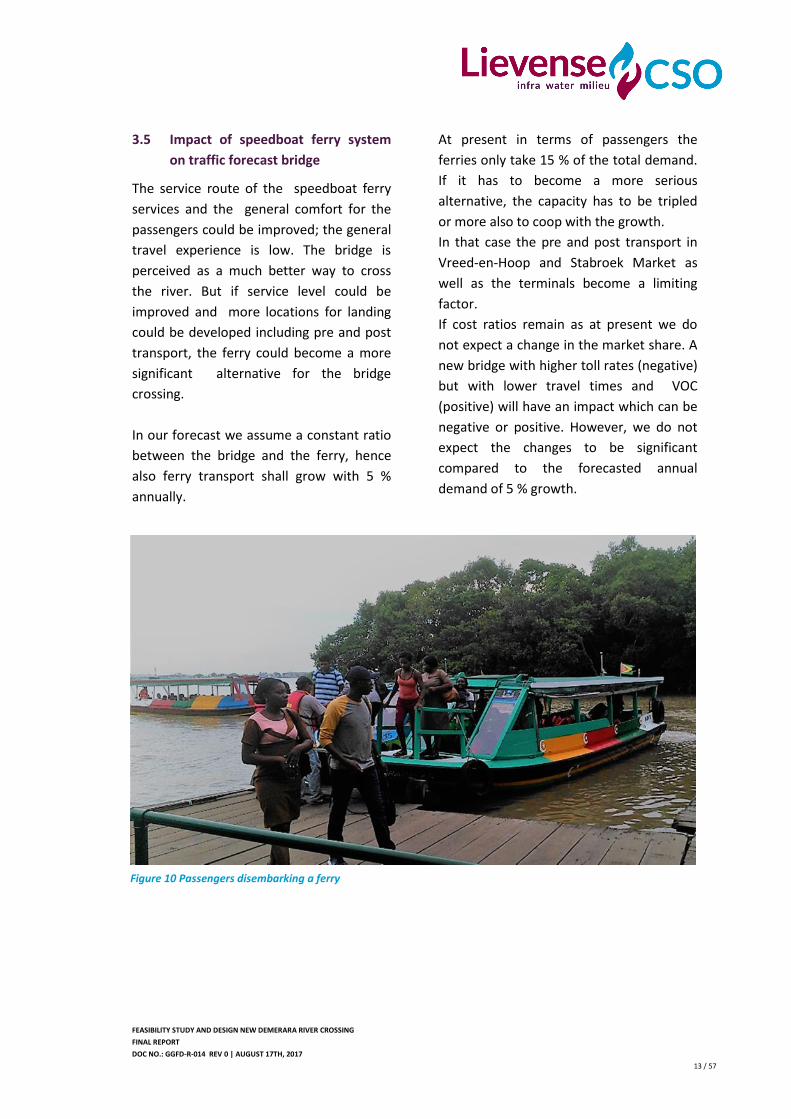
3.5 Impact of speedboat ferry system
on traffic forecast bridge
The service route of the speedboat ferry
services and the general comfort for the
passengers could be improved; the general
travel experience is low. The bridge is
perceived as a much better way to cross
the river. But if service level could be
improved and more locations for landing
could be developed including pre and post
transport, the ferry could become a more
significant alternative for the bridge
crossing.
In our forecast we assume a constant ratio
between the bridge and the ferry, hence
also ferry transport shall grow with 5 %
annually.
At present in terms of passengers the
ferries only take 15 % of the total demand.
If it has to become a more serious
alternative, the capacity has to be tripled
or more also to coop with the growth.
In that case the pre and post transport in
Vreed-en-Hoop and Stabroek Market as
well as the terminals become a limiting
factor.
If cost ratios remain as at present we do
not expect a change in the market share. A
new bridge with higher toll rates (negative)
but with lower travel times and VOC
(positive) will have an impact which can be
negative or positive. However, we do not
expect the changes to be significant
compared to the forecasted annual
demand of 5 % growth.
Figure 10 Passengers disembarking a ferry
FEASIBILITY STUDY AND DESIGN NEW DEMERARA RIVER CROSSING
FINAL REPORT
DOC NO.: GGFD-R-014 REV 0 | AUGUST 17TH, 2017
14 / 57
4 River transport: present
situation and forecast
4.1 Nature and number of ships
The number of ships crossing the present
bridge at Peters Hall is summarized in the
table below.
Category ships 2009 2012 2016
Trawlers 530 205 431
Coastal vessels 16 7 48
Tug/barge 216 226 136
1.1.1 Ocean Going
Vessels (OGV)
449 691 524
Total 1.211 1.219 1.139
Table 2 Transits through Demerara Harbour Bridge
The origins/destinations for river transport
south of the existing bridge are as follows:
Oil products terminals just south of the
existing bridge and at Linden. Generally
the load per vessel is around 5.000 t as
more cargo is not possible due to
limited depth of the river. Tugs are not
used. The pilots navigate the vessel
using the tidal currents and water
levels.
Bauxite export from Linden to sea.
Coastal vessels and special purpose
vessels serving terminals between the
bridge and Linden. This is a small
category serving smaller industries
along the river as well as Linden. It
includes dredgers, marine construction
equipment, smaller general cargo
vessels, etc.
Trawlers going to their terminals just
south of the bridge as well as between
New Hope and Grove. The trawlers
based in Georgetown are fishing in
coastal waters for shrimps as well as
deep-sea fishing.
Tug-barge operations contain generally
bulk goods. Air draft is small (4 m). For
nautical reasons they pass the bridge
through the wide retractable opening
to avoid incidents.
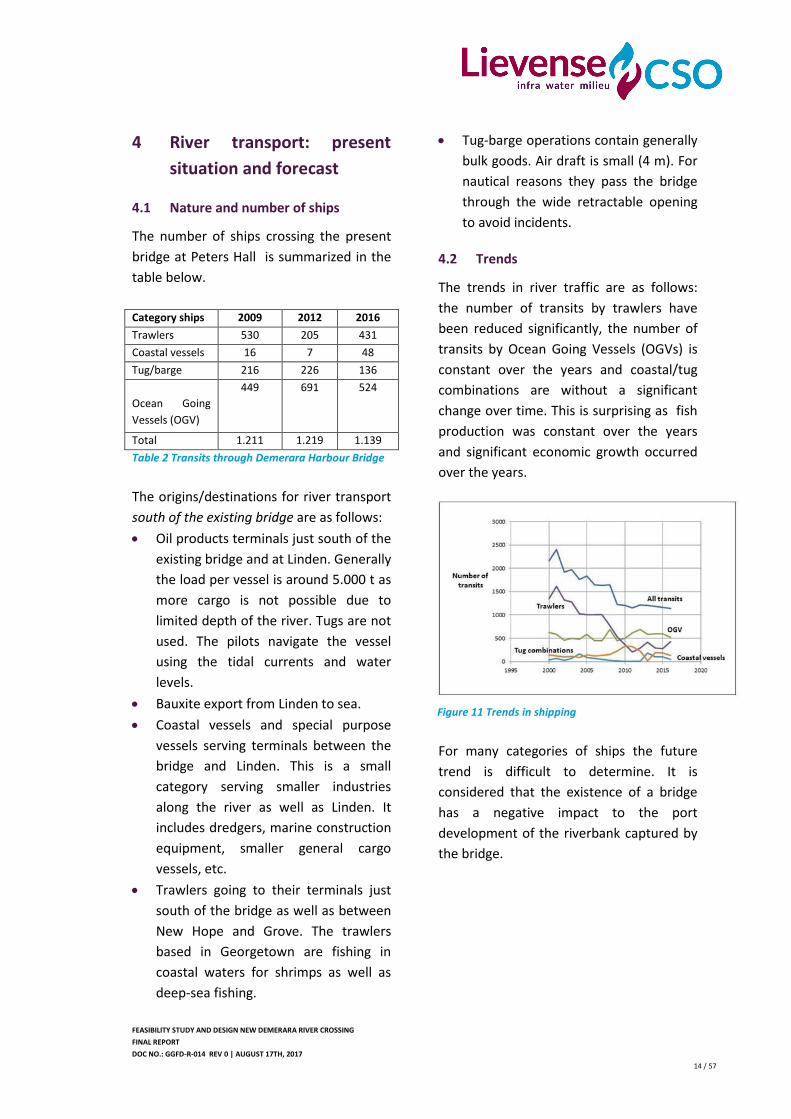
4.2 Trends
The trends in river traffic are as follows:
the number of transits by trawlers have
been reduced significantly, the number of
transits by Ocean Going Vessels (OGVs) is
constant over the years and coastal/tug
combinations are without a significant
change over time. This is surprising as fish
production was constant over the years
and significant economic growth occurred
over the years.
For many categories of ships the future
trend is difficult to determine. It is
considered that the existence of a bridge
has a negative impact to the port
development of the riverbank captured by
the bridge.
Figure 11 Trends in shipping
FEASIBILITY STUDY AND DESIGN NEW DEMERARA RIVER CROSSING
FINAL REPORT
DOC NO.: GGFD-R-014 REV 0 | AUGUST 17TH, 2017
15 / 57
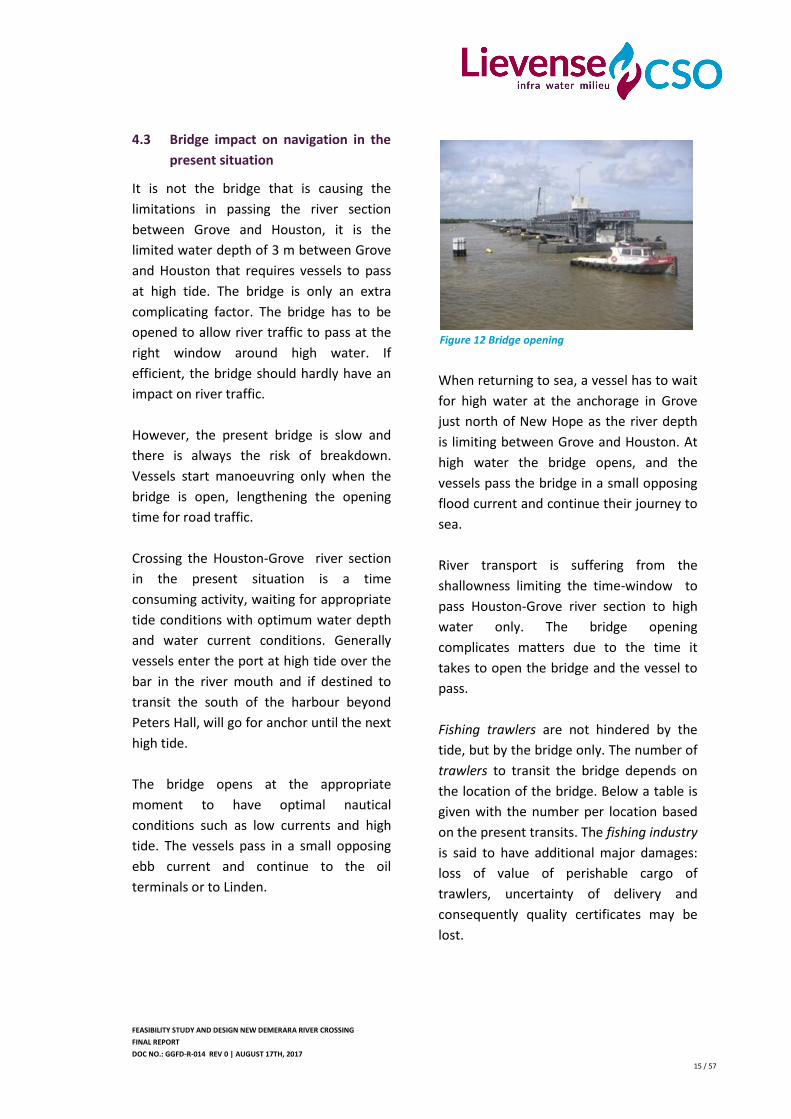
4.3 Bridge impact on navigation in the
present situation
It is not the bridge that is causing the
limitations in passing the river section
between Grove and Houston, it is the
limited water depth of 3 m between Grove
and Houston that requires vessels to pass
at high tide. The bridge is only an extra
complicating factor. The bridge has to be
opened to allow river traffic to pass at the
right window around high water. If
efficient, the bridge should hardly have an
impact on river traffic.
However, the present bridge is slow and
there is always the risk of breakdown.
Vessels start manoeuvring only when the
bridge is open, lengthening the opening
time for road traffic.
Crossing the Houston-Grove river section
in the present situation is a time
consuming activity, waiting for appropriate
tide conditions with optimum water depth
and water current conditions. Generally
vessels enter the port at high tide over the
bar in the river mouth and if destined to
transit the south of the harbour beyond
Peters Hall, will go for anchor until the next
high tide.
The bridge opens at the appropriate
moment to have optimal nautical
conditions such as low currents and high
tide. The vessels pass in a small opposing
ebb current and continue to the oil
terminals or to Linden.
When returning to sea, a vessel has to wait
for high water at the anchorage in Grove
just north of New Hope as the river depth
is limiting between Grove and Houston. At
high water the bridge opens, and the
vessels pass the bridge in a small opposing
flood current and continue their journey to
sea.
River transport is suffering from the
shallowness limiting the time-window to
pass Houston-Grove river section to high
water only. The bridge opening
complicates matters due to the time it
takes to open the bridge and the vessel to
pass.
Fishing trawlers are not hindered by the
tide, but by the bridge only. The number of
trawlers to transit the bridge depends on
the location of the bridge. Below a table is
given with the number per location based
on the present transits. The fishing industry
is said to have additional major damages:
loss of value of perishable cargo of
trawlers, uncertainty of delivery and
consequently quality certificates may be
lost.
Figure 12 Bridge opening
FEASIBILITY STUDY AND DESIGN NEW DEMERARA RIVER CROSSING
FINAL REPORT
DOC NO.: GGFD-R-014 REV 0 | AUGUST 17TH, 2017
16 / 57
Location Number of
trawlers affected
Transits per
year
Houston 88 4895
Peters Hall 32 415
New Hope 0 0
Table 3 Number of trawlers to transit the bridge
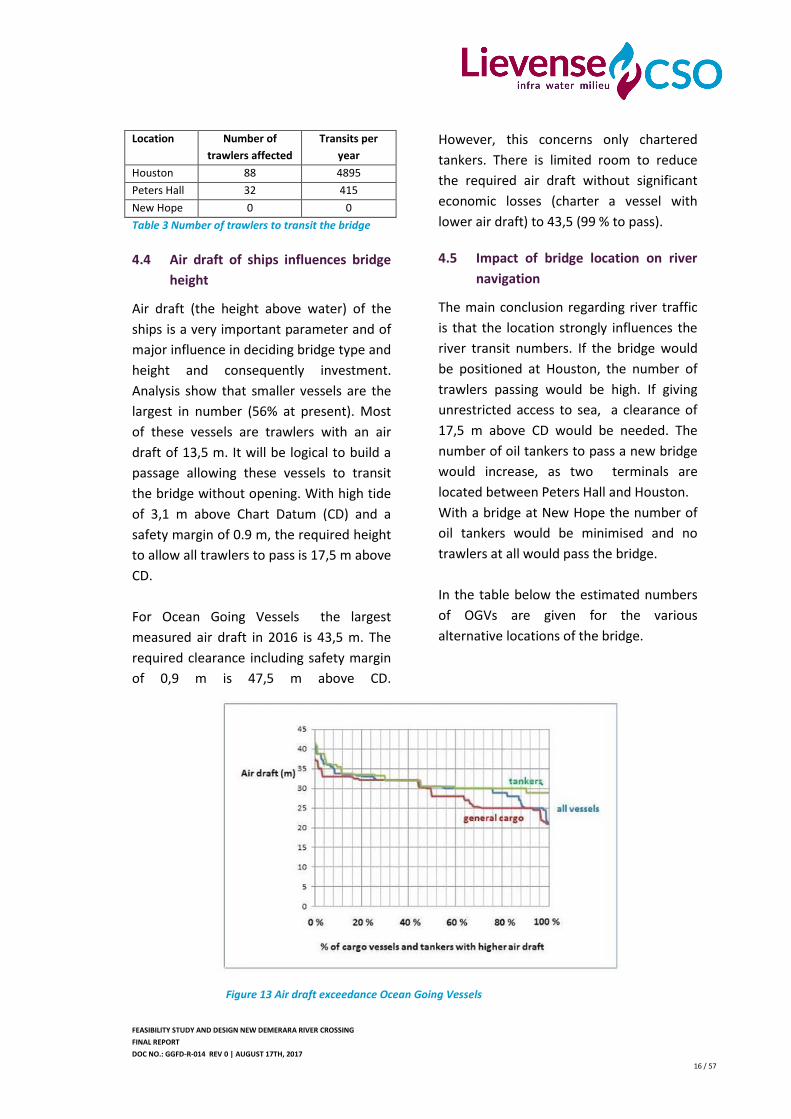
4.4 Air draft of ships influences bridge
height
Air draft (the height above water) of the
ships is a very important parameter and of
major influence in deciding bridge type and
height and consequently investment.
Analysis show that smaller vessels are the
largest in number (56% at present). Most
of these vessels are trawlers with an air
draft of 13,5 m. It will be logical to build a
passage allowing these vessels to transit
the bridge without opening. With high tide
of 3,1 m above Chart Datum (CD) and a
safety margin of 0.9 m, the required height
to allow all trawlers to pass is 17,5 m above
CD.
For Ocean Going Vessels the largest
measured air draft in 2016 is 43,5 m. The
required clearance including safety margin
of 0,9 m is 47,5 m above CD.
However, this concerns only chartered
tankers. There is limited room to reduce
the required air draft without significant
economic losses (charter a vessel with
lower air draft) to 43,5 (99 % to pass).
4.5 Impact of bridge location on river
navigation
The main conclusion regarding river traffic
is that the location strongly influences the
river transit numbers. If the bridge would
be positioned at Houston, the number of
trawlers passing would be high. If giving
unrestricted access to sea, a clearance of
17,5 m above CD would be needed. The
number of oil tankers to pass a new bridge
would increase, as two terminals are
located between Peters Hall and Houston.
With a bridge at New Hope the number of
oil tankers would be minimised and no
trawlers at all would pass the bridge.
In the table below the estimated numbers
of OGVs are given for the various
alternative locations of the bridge.
Figure 13 Air draft exceedance Ocean Going Vessels
FEASIBILITY STUDY AND DESIGN NEW DEMERARA RIVER CROSSING
FINAL REPORT
DOC NO.: GGFD-R-014 REV 0 | AUGUST 17TH, 2017
17 / 57
Type of cargo Number of OGVs
Peters Hall Houston New Hope
Oil Products 99 174 12
Bauxite 62 62 62
General cargo 101 101 101
Total 262 337 175
Table 4 Number of Ocean Going Vessels per category on different bridge locations (year 2017)
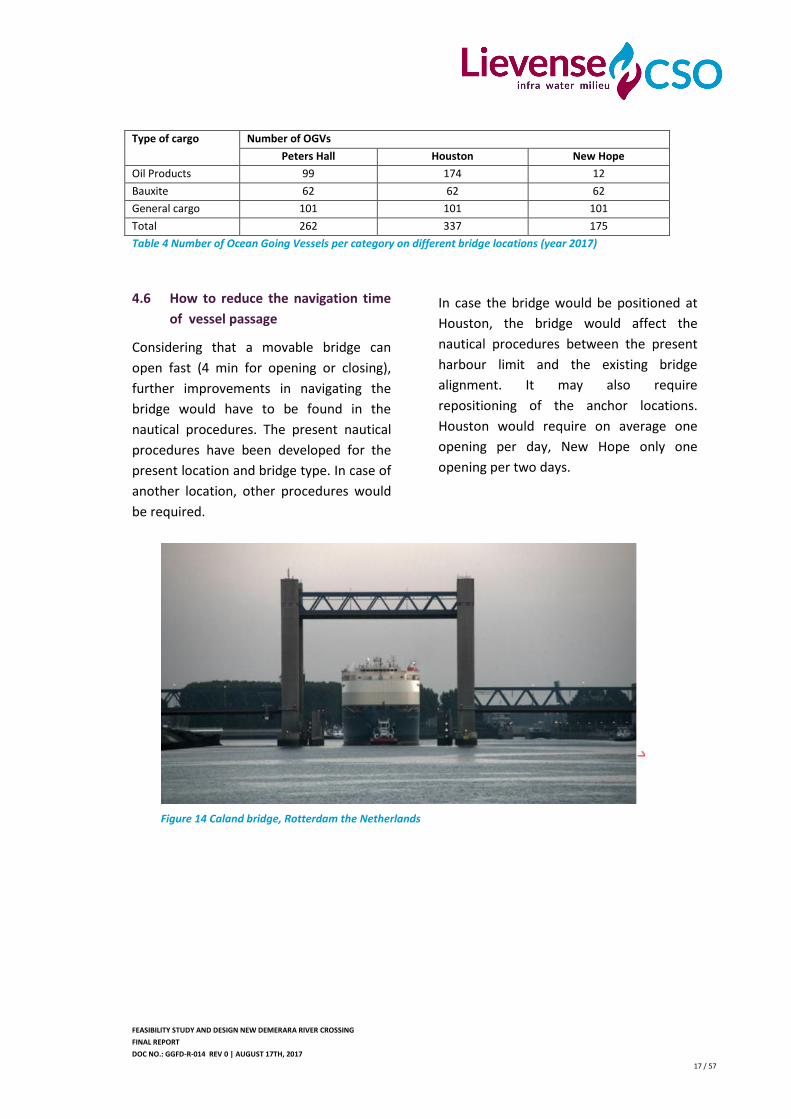
4.6 How to reduce the navigation time
of vessel passage
Considering that a movable bridge can
open fast (4 min for opening or closing),
further improvements in navigating the
bridge would have to be found in the
nautical procedures. The present nautical
procedures have been developed for the
present location and bridge type. In case of
another location, other procedures would
be required.
In case the bridge would be positioned at
Houston, the bridge would affect the
nautical procedures between the present
harbour limit and the existing bridge
alignment. It may also require
repositioning of the anchor locations.
Houston would require on average one
opening per day, New Hope only one
opening per two days.
Figure 14 Caland bridge, Rotterdam the Netherlands
FEASIBILITY STUDY AND DESIGN NEW DEMERARA RIVER CROSSING
FINAL REPORT
DOC NO.: GGFD-R-014 REV 0 | AUGUST 17TH, 2017
18 / 57
For the new bridge location it is advised to
train pilots in a simulator in a reputed
marine research institute who will also
design this procedure. In case of a bridge at
Houston, the nautical procedures and lead
lines in the harbour area shall also have to
be redesigned to ensure safe shipping.
Another measure is the compelling use of
tugs increasing safety of manoeuvring. The
use of tugs is already a measure considered
by MARAD to cope with the port
congestion and safety of manoeuvring.
As a result it is expected that with
sufficient measures opening times of about
average 15 minutes can be reached in case
only one vessel is passing. Most likely
passing of more vessels is less efficient due
to the fast opening/closure procedures of
the bridge. Day and night retractions are
required with preference at outside rush
hours to avoid the impact to the road
traffic during rush hours. Note that the
procedure of opening a modern bridge
with good navigational means is much less
complicated than the retraction of the
present floating bridge with all its
limitations.
4.7 Feasibility from a navigation point
of view
Houston location will affect most vessels,
but is the best option taking into account
the water depth. New Hope location has to
serve the lowest number of vessels and has
deep water but its location in a bend in the
river makes manoeuvring more difficult.
Peters Hall location is a median in terms of
number of vessels to serve and but has
limitations in water depth.
From a shipping and port point of view
New Hope is the favourite location, but the
differences between the three locations
are not significant. Shippers however
prefer a high bridge ensuring unlimited
access.
For the bridge at Houston a fixed
minimum elevation of 17,5 m CD is
recommended to allow trawlers and
smaller vessels to transit without opening
the movable part. In New Hope this
minimum air draft is less relevant. The
elevation of a high or movable bridge shall
be at least 47,5 m to allow all recorded
traffic of OGVs to pass the bridge or a
minimum of 43,5 m CD to let 99 % pass.
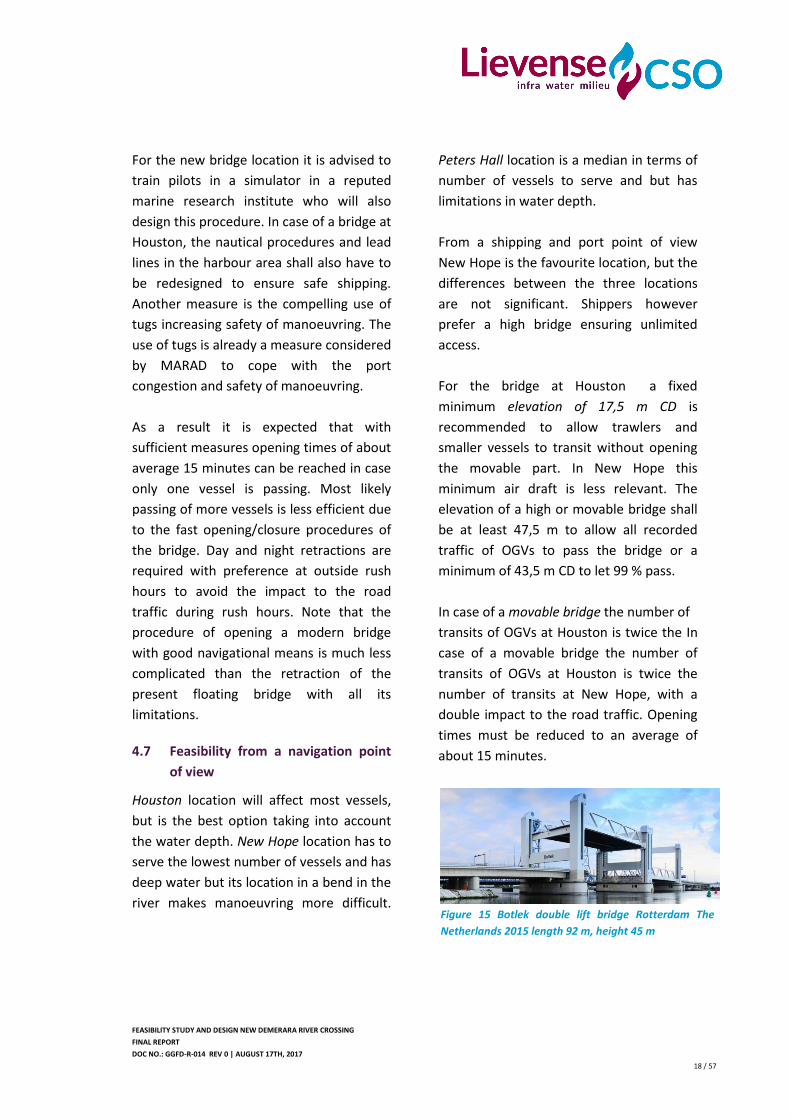
In case of a movable bridge the number of
transits of OGVs at Houston is twice the In
case of a movable bridge the number of
transits of OGVs at Houston is twice the
number of transits at New Hope, with a
double impact to the road traffic. Opening
times must be reduced to an average of
about 15 minutes.
Figure 15 Botlek double lift bridge Rotterdam The
Netherlands 2015 length 92 m, height 45 m
FEASIBILITY STUDY AND DESIGN NEW DEMERARA RIVER CROSSING
FINAL REPORT
DOC NO.: GGFD-R-014 REV 0 | AUGUST 17TH, 2017
19 / 57
5 Road traffic: present
situation
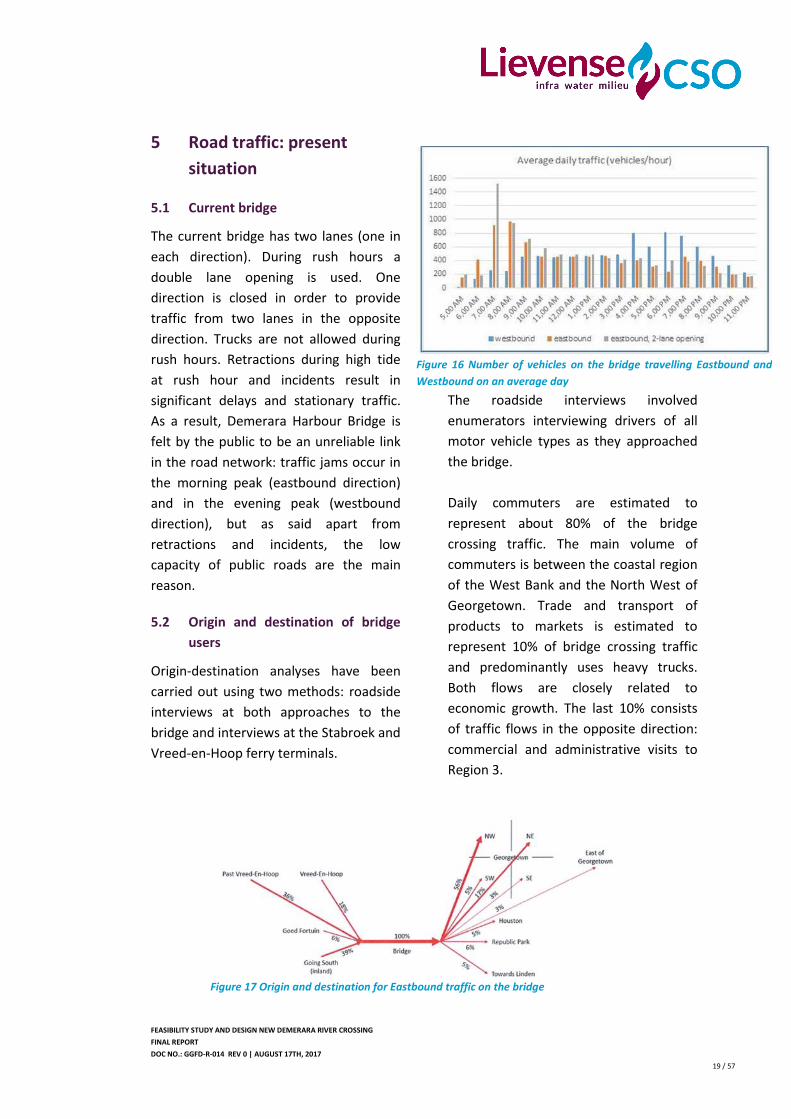
5.1 Current bridge
The current bridge has two lanes (one in
each direction). During rush hours a
double lane opening is used. One
direction is closed in order to provide
traffic from two lanes in the opposite
direction. Trucks are not allowed during
rush hours. Retractions during high tide
at rush hour and incidents result in
significant delays and stationary traffic.
As a result, Demerara Harbour Bridge is
felt by the public to be an unreliable link
in the road network: traffic jams occur in
the morning peak (eastbound direction)
and in the evening peak (westbound
direction), but as said apart from
retractions and incidents, the low
capacity of public roads are the main
reason.
5.2 Origin and destination of bridge
users
Origin-destination analyses have been
carried out using two methods: roadside
interviews at both approaches to the
bridge and interviews at the Stabroek and
Vreed-en-Hoop ferry terminals.
The roadside interviews involved
enumerators interviewing drivers of all
motor vehicle types as they approached
the bridge.
Daily commuters are estimated to
represent about 80% of the bridge
crossing traffic. The main volume of
commuters is between the coastal region
of the West Bank and the North West of
Georgetown. Trade and transport of
products to markets is estimated to
represent 10% of bridge crossing traffic
and predominantly uses heavy trucks.
Both flows are closely related to
economic growth. The last 10% consists
of traffic flows in the opposite direction:
commercial and administrative visits to
Region 3.
Figure 16 Number of vehicles on the bridge travelling Eastbound and
Westbound on an average day
Figure 17 Origin and destination for Eastbound traffic on the bridge
FEASIBILITY STUDY AND DESIGN NEW DEMERARA RIVER CROSSING
FINAL REPORT
DOC NO.: GGFD-R-014 REV 0 | AUGUST 17TH, 2017
20 / 57
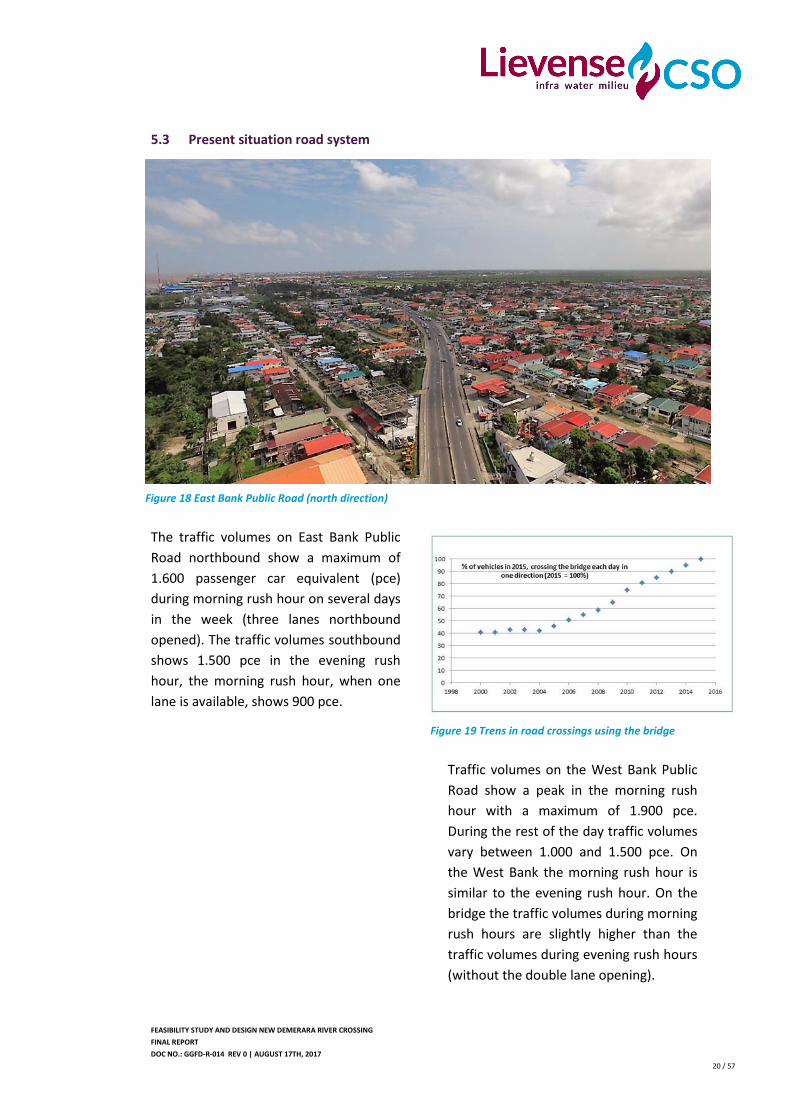
5.3 Present situation road system
The traffic volumes on East Bank Public
Road northbound show a maximum of
1.600 passenger car equivalent (pce)
during morning rush hour on several days
in the week (three lanes northbound
opened). The traffic volumes southbound
shows 1.500 pce in the evening rush
hour, the morning rush hour, when one
lane is available, shows 900 pce.
Traffic volumes on the West Bank Public
Road show a peak in the morning rush
hour with a maximum of 1.900 pce.
During the rest of the day traffic volumes
vary between 1.000 and 1.500 pce. On
the West Bank the morning rush hour is
similar to the evening rush hour. On the
bridge the traffic volumes during morning
rush hours are slightly higher than the
traffic volumes during evening rush hours
(without the double lane opening).
Figure 18 East Bank Public Road (north direction)
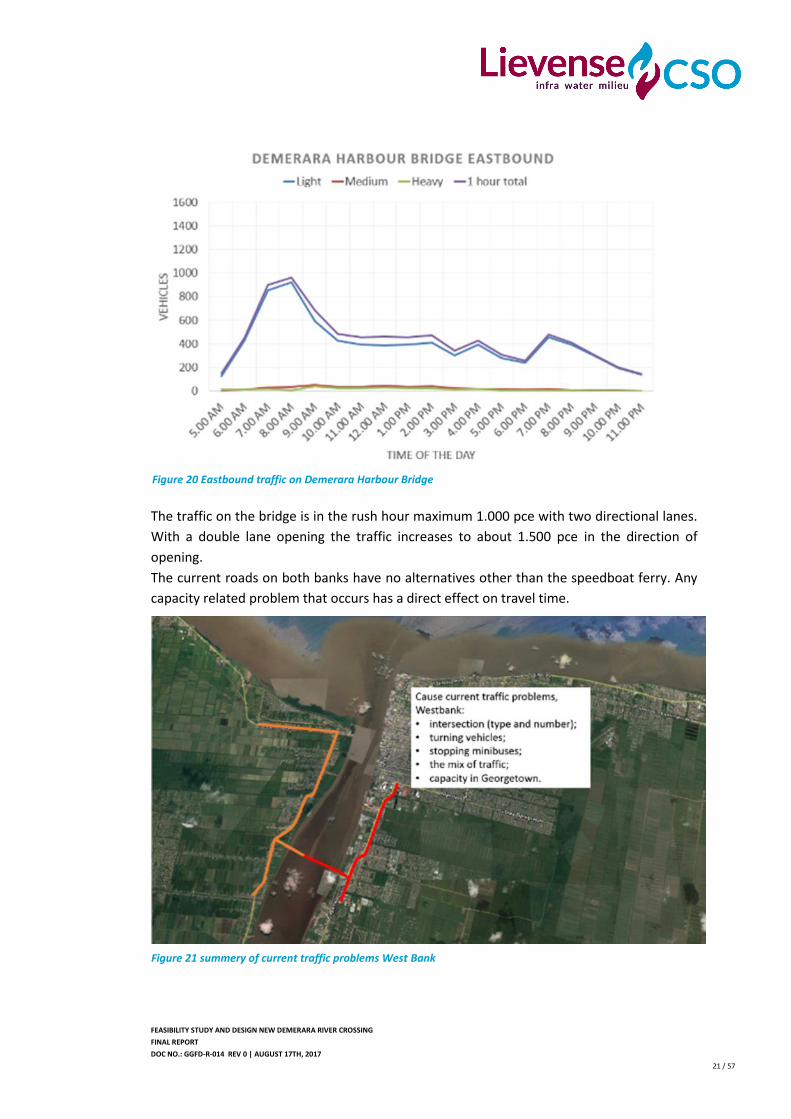
Figure 19 Trens in road crossings using the bridge
FEASIBILITY STUDY AND DESIGN NEW DEMERARA RIVER CROSSING
FINAL REPORT
DOC NO.: GGFD-R-014 REV 0 | AUGUST 17TH, 2017
21 / 57
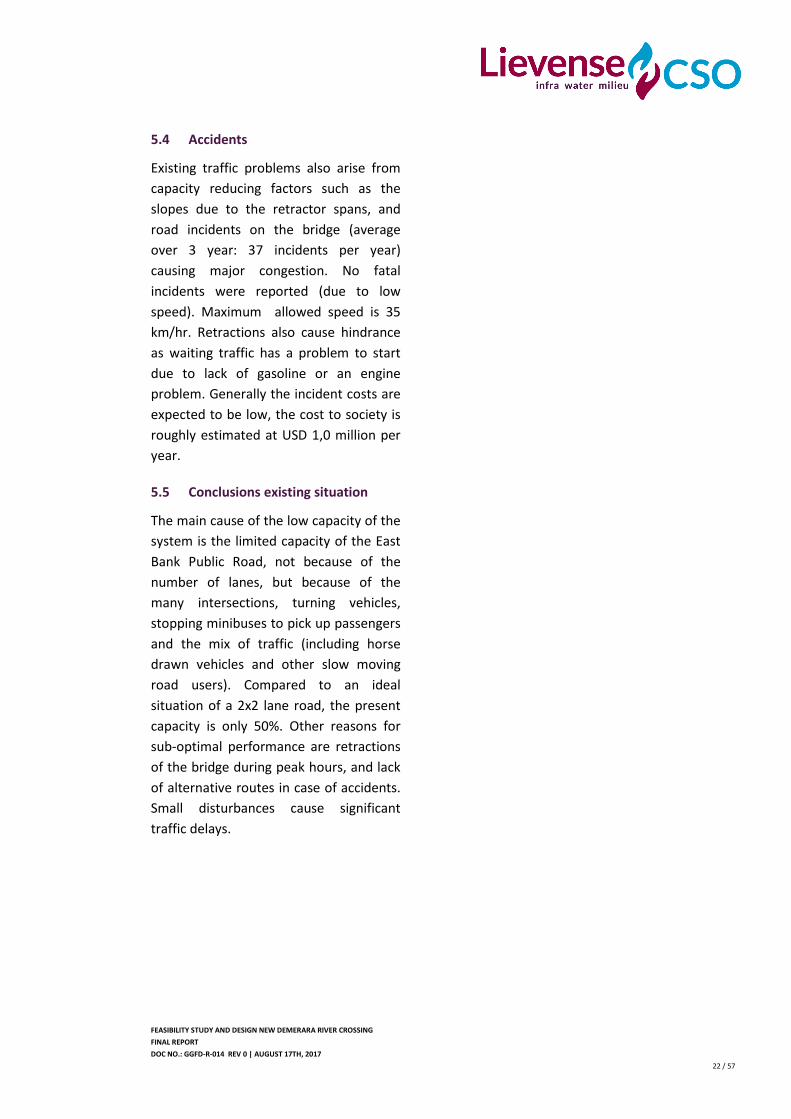
The traffic on the bridge is in the rush hour maximum 1.000 pce with two directional lanes.
With a double lane opening the traffic increases to about 1.500 pce in the direction of
opening.
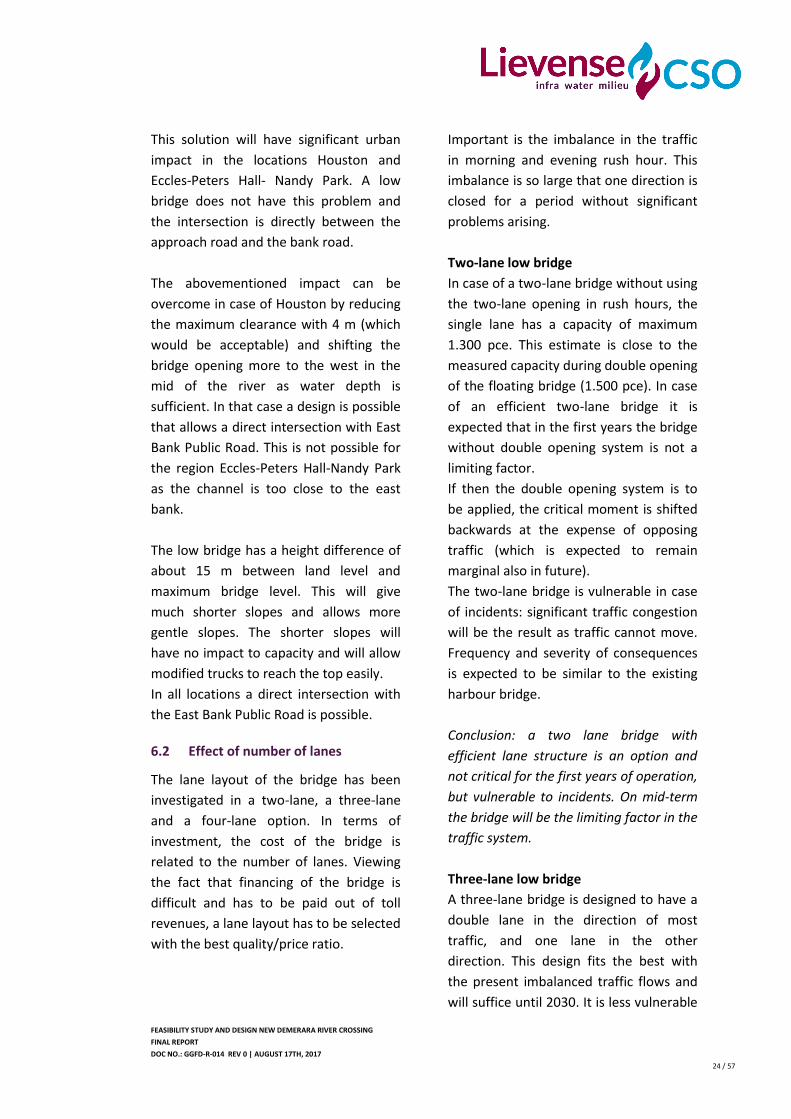
The current roads on both banks have no alternatives other than the speedboat ferry. Any
capacity related problem that occurs has a direct effect on travel time.
Figure 21 summery of current traffic problems West Bank
Figure 20 Eastbound traffic on Demerara Harbour Bridge
FEASIBILITY STUDY AND DESIGN NEW DEMERARA RIVER CROSSING
FINAL REPORT
DOC NO.: GGFD-R-014 REV 0 | AUGUST 17TH, 2017
22 / 57
5.4 Accidents
Existing traffic problems also arise from
capacity reducing factors such as the
slopes due to the retractor spans, and
road incidents on the bridge (average
over 3 year: 37 incidents per year)
causing major congestion. No fatal
incidents were reported (due to low
speed). Maximum allowed speed is 35
km/hr. Retractions also cause hindrance
as waiting traffic has a problem to start
due to lack of gasoline or an engine
problem. Generally the incident costs are
expected to be low, the cost to society is
roughly estimated at USD 1,0 million per
year.
5.5 Conclusions existing situation
The main cause of the low capacity of the
system is the limited capacity of the East
Bank Public Road, not because of the
number of lanes, but because of the
many intersections, turning vehicles,
stopping minibuses to pick up passengers
and the mix of traffic (including horse
drawn vehicles and other slow moving
road users). Compared to an ideal
situation of a 2x2 lane road, the present
capacity is only 50%. Other reasons for
sub-optimal performance are retractions
of the bridge during peak hours, and lack
of alternative routes in case of accidents.
Small disturbances cause significant
traffic delays.

FEASIBILITY STUDY AND DESIGN NEW DEMERARA RIVER CROSSING
FINAL REPORT
DOC NO.: GGFD-R-014 REV 0 | AUGUST 17TH, 2017
23 / 57
6 Road traffic: expected
impacts of a new bridge
A new bridge should not only connect
both riverbanks but also result in
undisturbed traffic. In the traffic study
impacts of height and number of lanes of
a new bridge on general traffic flow have
been assessed.
6.1 Effect of height of (new) bridge on
traffic
A high bridge has the advance that it does
not close for road traffic. However in the
case of an elevation difference of about
46 m the ramps are very long to reach the
required clearance height. With a
maximum possible slope of 6% there is
more than 750 m of slope required to
overcome 46 m. This results on the East
Bank in not being at the road level west
of the East Bank Public Road and
significant ramps and road works are
required at the east of East Bank Public
Road.
Another impact of a high bridge is the
impact to truck traffic:
Trucks have generally modified
differentials to cope with long haul
distances. They are vulnerable on long
steep slopes not reaching the top. Major
hindrance will occur due to trucks
blocking the road.
Cargo may fall off from not properly
loaded trucks, resulting in accidents and
major traffic delays.
The road system is reduced in capacity by
slow trucks climbing the hill. Assuming
10% trucks, the road capacity is reduced
by 15% on 750 m long slopes of 6%. This
value is based on non-modified trucks
and will be more in case of modified
trucks.
The navigation channel is not in the
centre of the river but close to the east
bank in case of Peters Hall. As a result the
long slopes of the high bridge will first
cross the East Bank Public Road and then
return to the bank road making the
intersection.
Figure 22 Urban area Eccles – Nandy Park
FEASIBILITY STUDY AND DESIGN NEW DEMERARA RIVER CROSSING
FINAL REPORT
DOC NO.: GGFD-R-014 REV 0 | AUGUST 17TH, 2017
24 / 57
This solution will have significant urban
impact in the locations Houston and
Eccles-Peters Hall- Nandy Park. A low
bridge does not have this problem and
the intersection is directly between the
approach road and the bank road.
The abovementioned impact can be
overcome in case of Houston by reducing
the maximum clearance with 4 m (which
would be acceptable) and shifting the
bridge opening more to the west in the
mid of the river as water depth is
sufficient. In that case a design is possible
that allows a direct intersection with East
Bank Public Road. This is not possible for
the region Eccles-Peters Hall-Nandy Park
as the channel is too close to the east
bank.
The low bridge has a height difference of
about 15 m between land level and
maximum bridge level. This will give
much shorter slopes and allows more
gentle slopes. The shorter slopes will
have no impact to capacity and will allow
modified trucks to reach the top easily.
In all locations a direct intersection with
the East Bank Public Road is possible.
6.2 Effect of number of lanes
The lane layout of the bridge has been
investigated in a two-lane, a three-lane
and a four-lane option. In terms of
investment, the cost of the bridge is
related to the number of lanes. Viewing
the fact that financing of the bridge is
difficult and has to be paid out of toll
revenues, a lane layout has to be selected
with the best quality/price ratio.
Important is the imbalance in the traffic
in morning and evening rush hour. This
imbalance is so large that one direction is
closed for a period without significant
problems arising.
Two-lane low bridge
In case of a two-lane bridge without using
the two-lane opening in rush hours, the
single lane has a capacity of maximum
1.300 pce. This estimate is close to the
measured capacity during double opening
of the floating bridge (1.500 pce). In case
of an efficient two-lane bridge it is
expected that in the first years the bridge
without double opening system is not a
limiting factor.
If then the double opening system is to
be applied, the critical moment is shifted
backwards at the expense of opposing
traffic (which is expected to remain
marginal also in future).
The two-lane bridge is vulnerable in case
of incidents: significant traffic congestion
will be the result as traffic cannot move.
Frequency and severity of consequences
is expected to be similar to the existing
harbour bridge.
Conclusion: a two lane bridge with
efficient lane structure is an option and
not critical for the first years of operation,
but vulnerable to incidents. On mid-term
the bridge will be the limiting factor in the
traffic system.
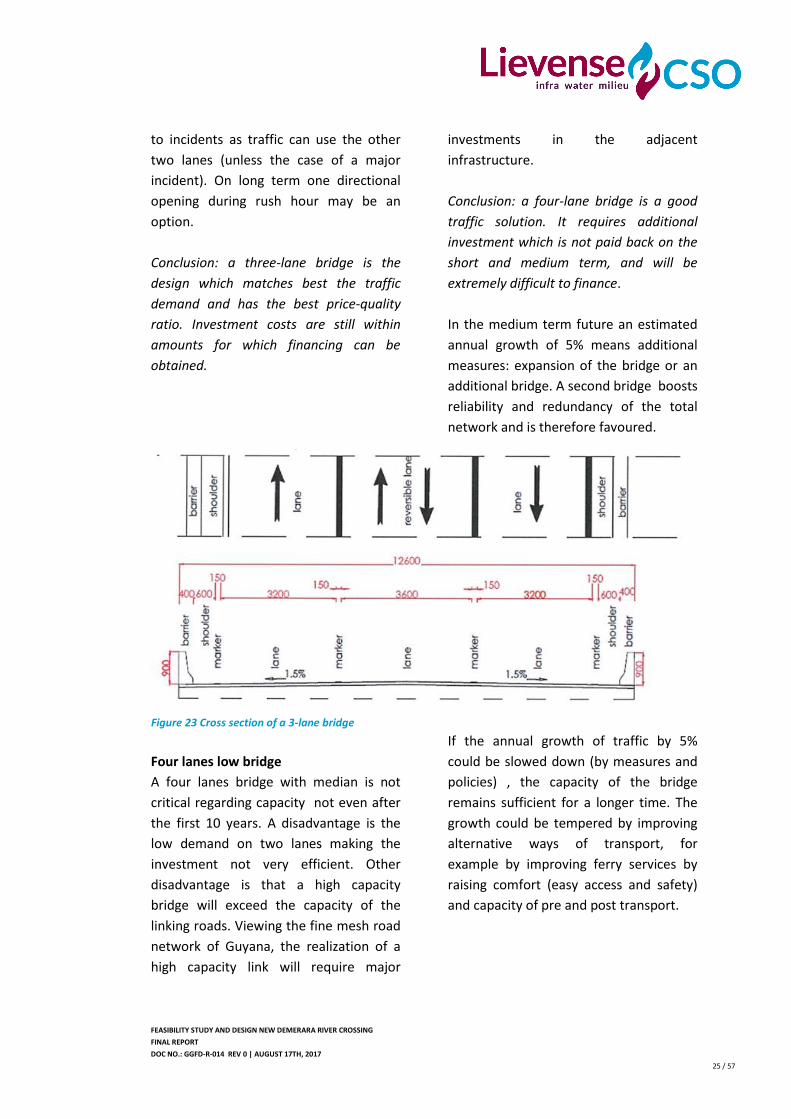
Three-lane low bridge
A three-lane bridge is designed to have a
double lane in the direction of most
traffic, and one lane in the other
direction. This design fits the best with
the present imbalanced traffic flows and
will suffice until 2030. It is less vulnerable
FEASIBILITY STUDY AND DESIGN NEW DEMERARA RIVER CROSSING
FINAL REPORT
DOC NO.: GGFD-R-014 REV 0 | AUGUST 17TH, 2017
25 / 57
to incidents as traffic can use the other
two lanes (unless the case of a major
incident). On long term one directional
opening during rush hour may be an
option.
Conclusion: a three-lane bridge is the
design which matches best the traffic
demand and has the best price-quality
ratio. Investment costs are still within
amounts for which financing can be
obtained.
Four lanes low bridge
A four lanes bridge with median is not
critical regarding capacity not even after
the first 10 years. A disadvantage is the
low demand on two lanes making the
investment not very efficient. Other
disadvantage is that a high capacity
bridge will exceed the capacity of the
linking roads. Viewing the fine mesh road
network of Guyana, the realization of a
high capacity link will require major
investments in the adjacent
infrastructure.
Conclusion: a four-lane bridge is a good
traffic solution. It requires additional
investment which is not paid back on the
short and medium term, and will be
extremely difficult to finance.
In the medium term future an estimated
annual growth of 5% means additional
measures: expansion of the bridge or an
additional bridge. A second bridge boosts
reliability and redundancy of the total
network and is therefore favoured.
If the annual growth of traffic by 5%
could be slowed down (by measures and
policies) , the capacity of the bridge
remains sufficient for a longer time. The
growth could be tempered by improving
alternative ways of transport, for
example by improving ferry services by
raising comfort (easy access and safety)
and capacity of pre and post transport.
Figure 23 Cross section of a 3-lane bridge
FEASIBILITY STUDY AND DESIGN NEW DEMERARA RIVER CROSSING
FINAL REPORT
DOC NO.: GGFD-R-014 REV 0 | AUGUST 17TH, 2017
26 / 57
Recommended lane design
If funding can be found a three-lane
bridge is recommended as most suitable
to serve the traffic demand in the coming
decade.
If funding can only be found for a two-
lane bridge, selecting a two-lane
configuration implies higher vulnerability
for accidents and traffic congestion.
Intersections and linking road should
higher capacity to serve traffic demand
than the bridge; the bridge is the highest
investment and should therefore be used
most efficiently.
In the far future a second bridge is
advised above over-dimensioning the first
bridge, giving more redundancy, allowing
better distribution of the traffic over the
region and spread economic
developments.
We also recommend to implement
measures to reduce traffic growth by
public transport as speedboat ferries and
minibuses.
6.3 Effect Impacts bypass roads and
links
The traffic forecast assumes that the
existing road network is kept on the
present level. If not extended or
improved, the new bridge may give a
slight improvement but traffic congestion
will not be resolved on mid and long
term.
Government is preparing the Project of
the eastern bypass road on the East Bank,
connecting Diamond with Ogle. This
bypass will reduce traffic from the East
Bank Public Road. It is considered that
the existing east and west bank roads
including Vreed-en-Hoop cannot be
significantly improved further.
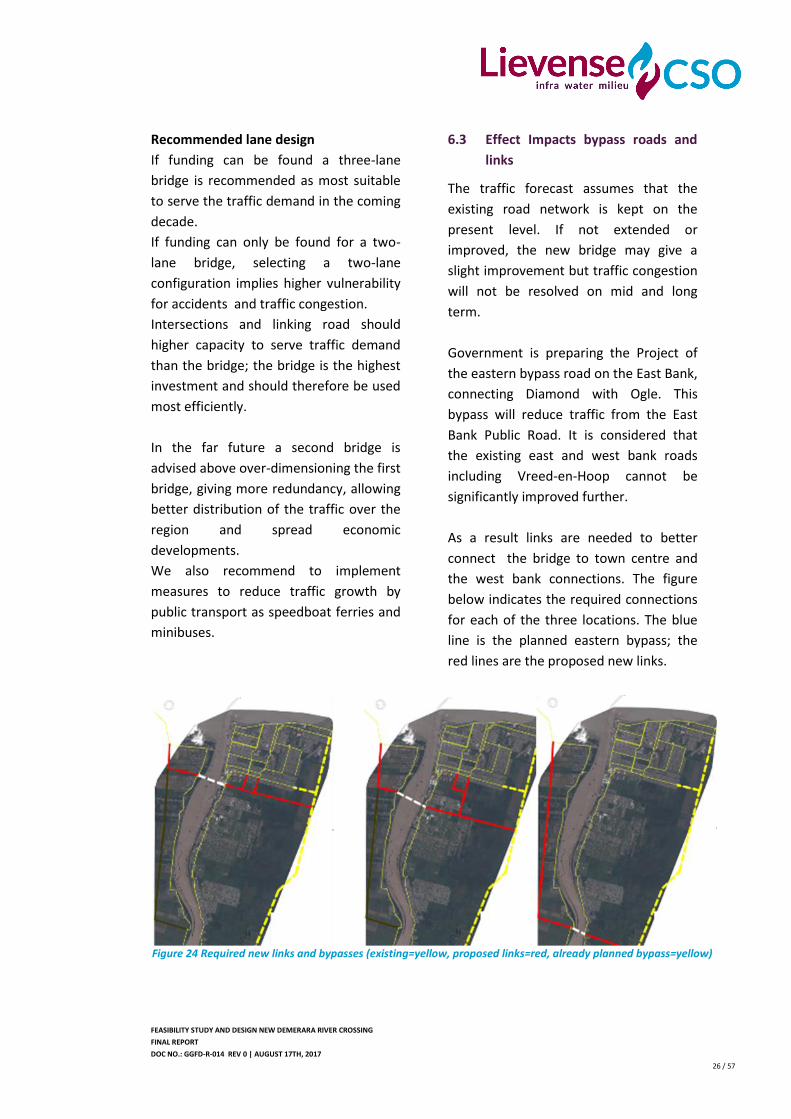
As a result links are needed to better
connect the bridge to town centre and
the west bank connections. The figure
below indicates the required connections
for each of the three locations. The blue
line is the planned eastern bypass; the
red lines are the proposed new links.
Figure 24 Required new links and bypasses (existing=yellow, proposed links=red, already planned bypass=yellow)
FEASIBILITY STUDY AND DESIGN NEW DEMERARA RIVER CROSSING
FINAL REPORT
DOC NO.: GGFD-R-014 REV 0 | AUGUST 17TH, 2017
27 / 57
7 Alternatives considered
The purpose of the study is to
advise on alternative
investment options within
reasonable (affordable)
budget. Preferable options
are characterized by a high
benefit/cost ratio, positive
impacts on social and
environmental elements, and
most appropriate to river
navigation and support (road)
mobility between East Bank
and West Bank. Variables are
bridge location and bridge
type (floating, low and high
bridge).
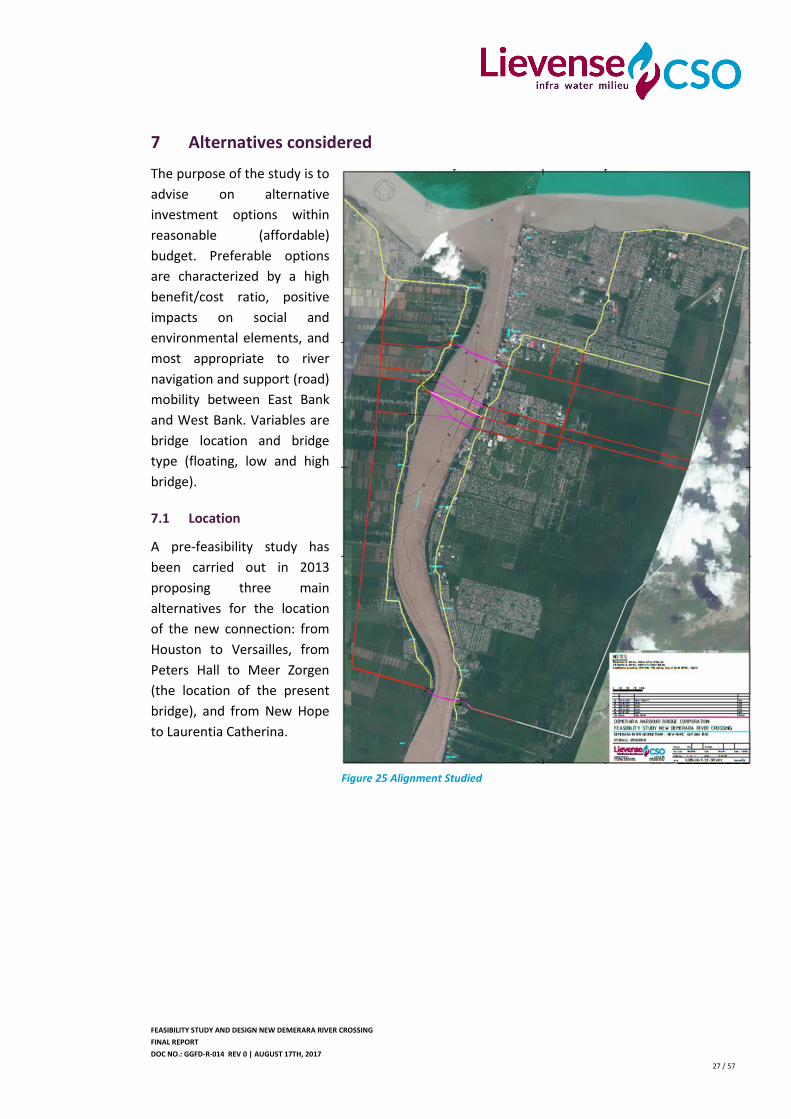
7.1 Location
A pre-feasibility study has
been carried out in 2013
proposing three main
alternatives for the location
of the new connection: from
Houston to Versailles, from
Peters Hall to Meer Zorgen
(the location of the present
bridge), and from New Hope
to Laurentia Catherina.
Figure 25 Alignment Studied
FEASIBILITY STUDY AND DESIGN NEW DEMERARA RIVER CROSSING
FINAL REPORT
DOC NO.: GGFD-R-014 REV 0 | AUGUST 17TH, 2017
28 / 57
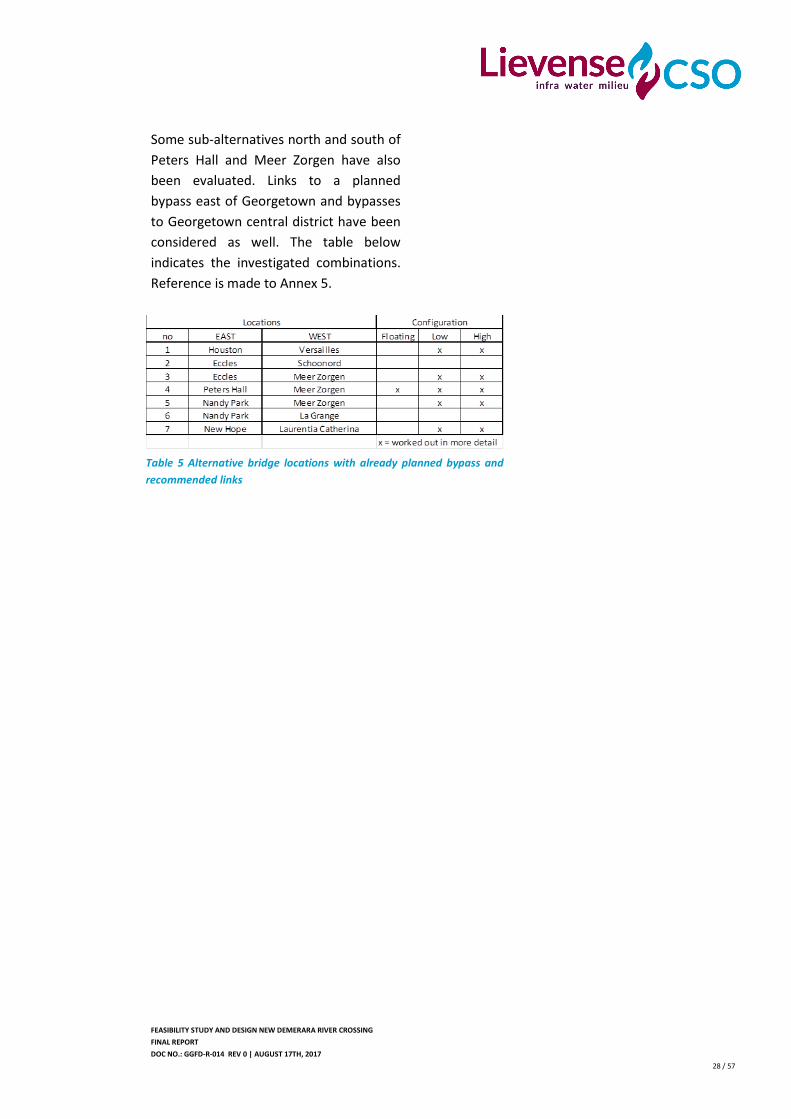
Some sub-alternatives north and south of
Peters Hall and Meer Zorgen have also
been evaluated. Links to a planned
bypass east of Georgetown and bypasses
to Georgetown central district have been
considered as well. The table below
indicates the investigated combinations.
Reference is made to Annex 5.
Table 5 Alternative bridge locations with already planned bypass and
recommended links
FEASIBILITY STUDY AND DESIGN NEW DEMERARA RIVER CROSSING
FINAL REPORT
DOC NO.: GGFD-R-014 REV 0 | AUGUST 17TH, 2017
29 / 57
8 Design Considerations
8.1 Bridge type
The alternatives considered are: a bridge
similar to the current floating bridge, a
low bridge with a movable part and a
high bridge. A tunnel has not been
considered because of the high
investment and maintenance costs and
the importance of non-interrupted
connectivity between the East and the
West Bank.
8.2 Number of lanes
A main consideration of the bridge
Project is the cost level. Taking into
account the length of the river crossing
(the bridge is approximately 1,5 km in
length) it is estimated that additional
width of the bridge cost about 4 million
USD each meter, independent of its
purpose. This means that the cross
sections have to be optimal arranged and
as much as possible designed as fit for
purpose of servicing the traffic coming of
and going on to the bridge. Parameters
are number of lanes, width of lanes,
width of shoulders, barriers, pedestrian
and/or cycle path.
8.3 Intersections
Traffic analysis recommends east-west
links to deviate traffic to other parts of
the road network. The intersections at
both the roads will be controlled by
traffic lights. It is proposed to plan
flyovers to connect the bridge to the links
located further down south. The flyovers
may be built in a phased way, as the
traffic light will manage the traffic during
the first phase of operation.
Intersections and linking roads shall have
a larger capacity than the bridge from an
economical reason: the bridge is by far
the most expensive component of the
system and shall be used to a maximum.
8.4 Ancillary facilities
The following ancillary facilities are
required:
a toll plaza with four covered gates
for manual collection and preparation
for automatic toll collection;
an office building 1.000 m2 with
premises for staff, administration and
management. It also comprises a
control room for handling the traffic
around the bridge (the bridge traffic
lights, the intersection traffic lights),
and space for security staff and
police;
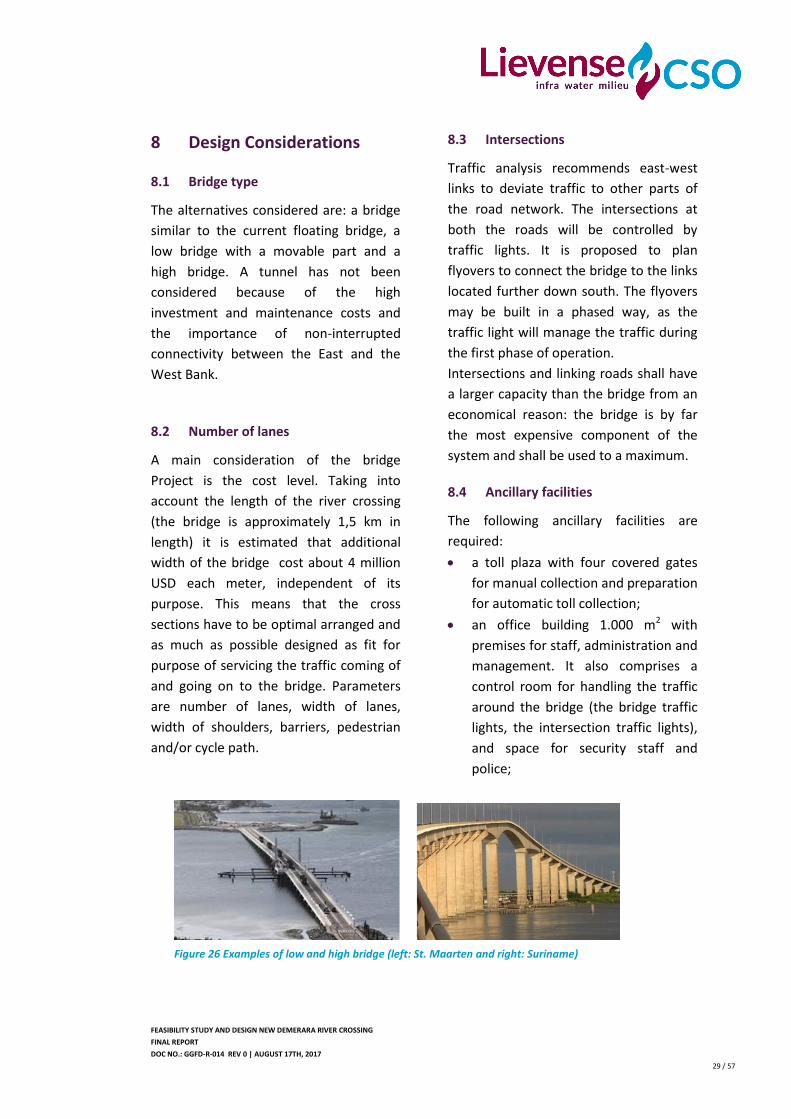
Figure 26 Examples of low and high bridge (left: St. Maarten and right: Suriname)
FEASIBILITY STUDY AND DESIGN NEW DEMERARA RIVER CROSSING
FINAL REPORT
DOC NO.: GGFD-R-014 REV 0 | AUGUST 17TH, 2017
30 / 57
a garage of 200 m2 for company cars,
rescue trucks and a small workshop
and spare parts;
the movable bridge has spares and
workshop in the bridge foundation. It
has two parking places and a bridge
operating room on road level, with a
staircase to the machine room and
workshop;
portals above the three lanes of the
bridge every 250 m indicating the
direction of the reversible lane.
FEASIBILITY STUDY AND DESIGN NEW DEMERARA RIVER CROSSING
FINAL REPORT
DOC NO.: GGFD-R-014 REV 0 | AUGUST 17TH, 2017
31 / 57
9 Reference Design and Cost
Estimate
9.1 Rules for horizontal alignments
In working out the horizontal alignments
the following rules were applied:
For the alignments Peters Hall to
Meer Zorgen, the existing retractable
part of the current bridge is in the
deepest water (3.2 m CD) and the
most suitable as streamlines are
straight.
At the Houston Versailles location the
opening can be located over a large
stretch of the river. However, much
deviating from the present fairway
would require a redesign of the
fairways in the port.
In New Hope the depth is much larger
than at other locations. Main
concerns are the curved river flows,
particularly the flood current, which
could lead to nautical hazards.
In order to reduce costs, it is
preferred to have the opening of the
high bridge as much as possible in the
middle of the river to avoid that the
bridge proceeds over land.
The intersections shall be
perpendicular crossings. Gradual
bends have been applied on the
horizontal alignment to fit the
alignment at the bank roads as well
as the preferred nautical transit
opening of the bridge. This results in
a curved bridge at most locations.
The length of the bridge is to be
minimized for cost reasons.
9.2 Rules for vertical alignments
For a high bridge: The highest road
level of the bridge is + 50 m CD, and a
clearance of 47,5 m CD to allow the
highest vessel recorded in 2016 (43,5
m air draft).
For a low bridge: a minimum
clearance of + 17,5 m CD to allow
trawlers to transit the bridge without
opening. The movable part shall have
a clearance of + 47,5 m CD, high
enough for all OGVs.
Abutments of high and low bridge are
set on + 6,2 m CD. The slopes shall
not be steeper than 6% and
preferably be 4% or lower.
9.3 Impacts on land
With a high bridge the elevation
difference is about 43,8 m. Utilising a
maximum slope of 6 % the length of the
bridge slopes is about 750 m at both sides
of the navigable opening. The nautical
passage at Peters Hall and New Hope is
more or less on 1/3 of the width of the
river at the east side. As a result the high
bridge shall slope hundreds of meters
over land and will also cross the East
Bank Public Road. At Houston the
navigable opening can be in the middle
but even here the length is not sufficient
for reaching the land surface levels
before the intersection. The low bridge
generally needs 375 m to reach land level
and has ample space to do so. On the
west side there is enough length to reach
the elevations required for the
intersection levels.
FEASIBILITY STUDY AND DESIGN NEW DEMERARA RIVER CROSSING
FINAL REPORT
DOC NO.: GGFD-R-014 REV 0 | AUGUST 17TH, 2017
32 / 57
9.4 Construction methods
A considerable part of the required
construction material should be imported
from outside Guyana since there is no
steel industry and no possibility of the
production of large concrete pre stressed
structures. Most of the construction will
be done on the river, therefore in the
reference design, it is tried to use mostly
pre-fab elements and only chosen for in-
situ production if necessary.
9.5 Low bridge design
In the design the structure has been kept
as light and simple as possible. The low
bridge is a fixed bridge with spans of 20
m and a movable section with a span of
95 m and a nautical width of 70 m. Main
longitudinal girders are pre-fab made of
pre-stressed concrete in the shape of a
reverse T, with an in-situ reinforced
concrete layer on top. These beams are
then placed on a crossbeam. The cross
beam is a reinforced prefab concrete
beam.
The cross beam is founded on two steel
piles for normal sections and 4 steel piles
at strong points which are located every
123 m. The cross beam and the piles are
connected by a reinforced concrete pile
plug. The weight of the structure is
calculated and the piles are designed
based on the calculated dead weight and
the live loads.
The movable section is a lift bridge with
the deck and the towers designed in steel
in order to keep the weight of the bridge
low in view of the poor soil conditions.
Bascule and swing bridges have been
considered but are more costly for this
Project.
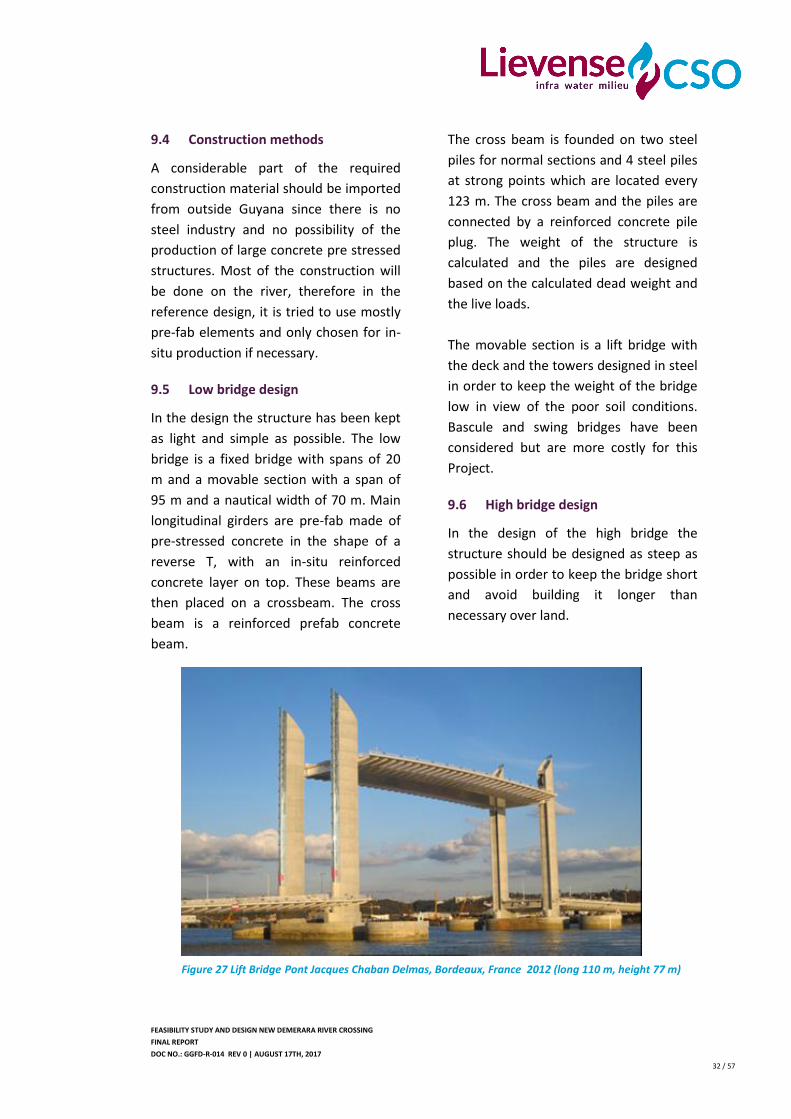
9.6 High bridge design
In the design of the high bridge the
structure should be designed as steep as
possible in order to keep the bridge short
and avoid building it longer than
necessary over land.
Figure 27 Lift Bridge Pont Jacques Chaban Delmas, Bordeaux, France 2012 (long 110 m, height 77 m)
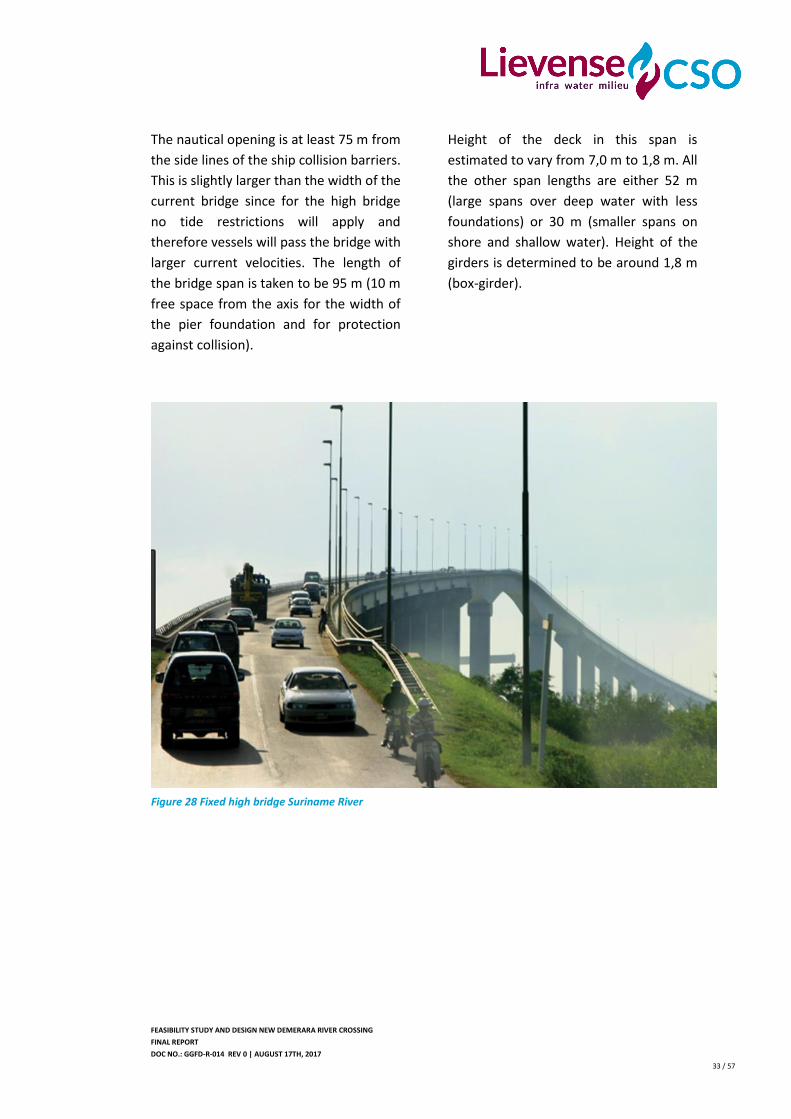
FEASIBILITY STUDY AND DESIGN NEW DEMERARA RIVER CROSSING
FINAL REPORT
DOC NO.: GGFD-R-014 REV 0 | AUGUST 17TH, 2017
33 / 57
The nautical opening is at least 75 m from
the side lines of the ship collision barriers.
This is slightly larger than the width of the
current bridge since for the high bridge
no tide restrictions will apply and
therefore vessels will pass the bridge with
larger current velocities. The length of
the bridge span is taken to be 95 m (10 m
free space from the axis for the width of
the pier foundation and for protection
against collision).
Height of the deck in this span is
estimated to vary from 7,0 m to 1,8 m. All
the other span lengths are either 52 m
(large spans over deep water with less
foundations) or 30 m (smaller spans on
shore and shallow water). Height of the
girders is determined to be around 1,8 m
(box-girder).
Figure 28 Fixed high bridge Suriname River
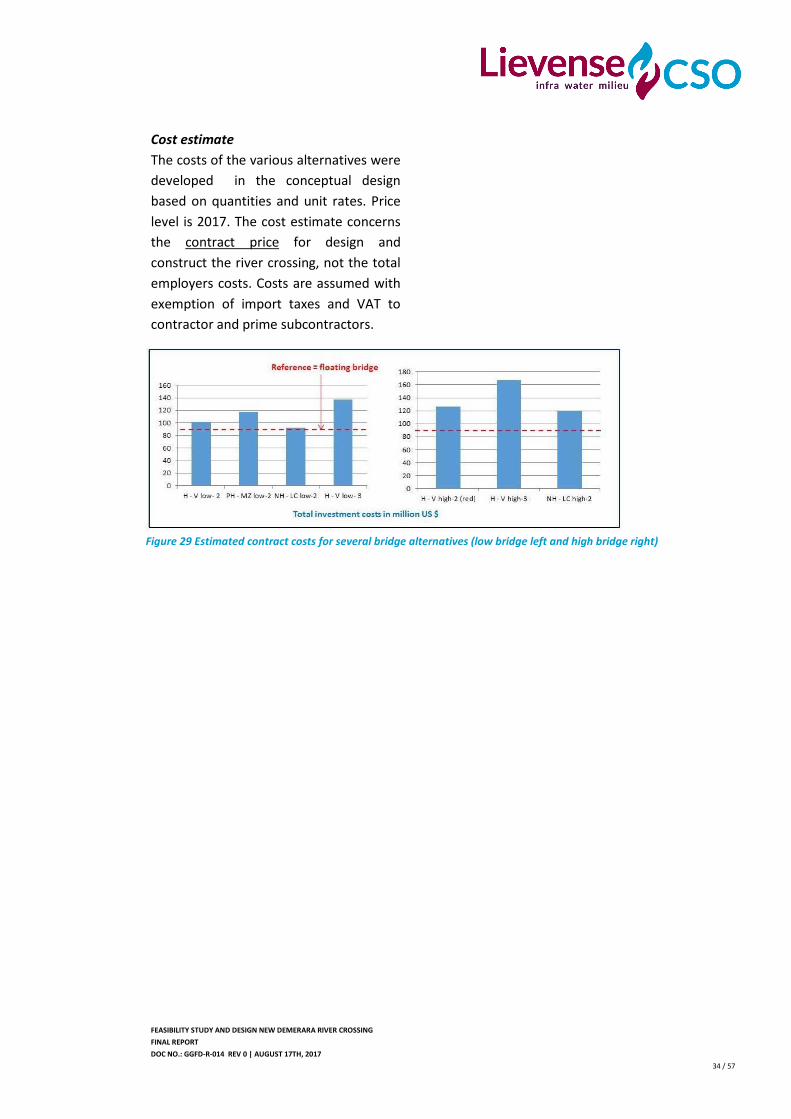
FEASIBILITY STUDY AND DESIGN NEW DEMERARA RIVER CROSSING
FINAL REPORT
DOC NO.: GGFD-R-014 REV 0 | AUGUST 17TH, 2017
34 / 57
Cost estimate
The costs of the various alternatives were
developed in the conceptual design
based on quantities and unit rates. Price
level is 2017. The cost estimate concerns
the contract price for design and
construct the river crossing, not the total
employers costs. Costs are assumed with
exemption of import taxes and VAT to
contractor and prime subcontractors.
Figure 29 Estimated contract costs for several bridge alternatives (low bridge left and high bridge right)
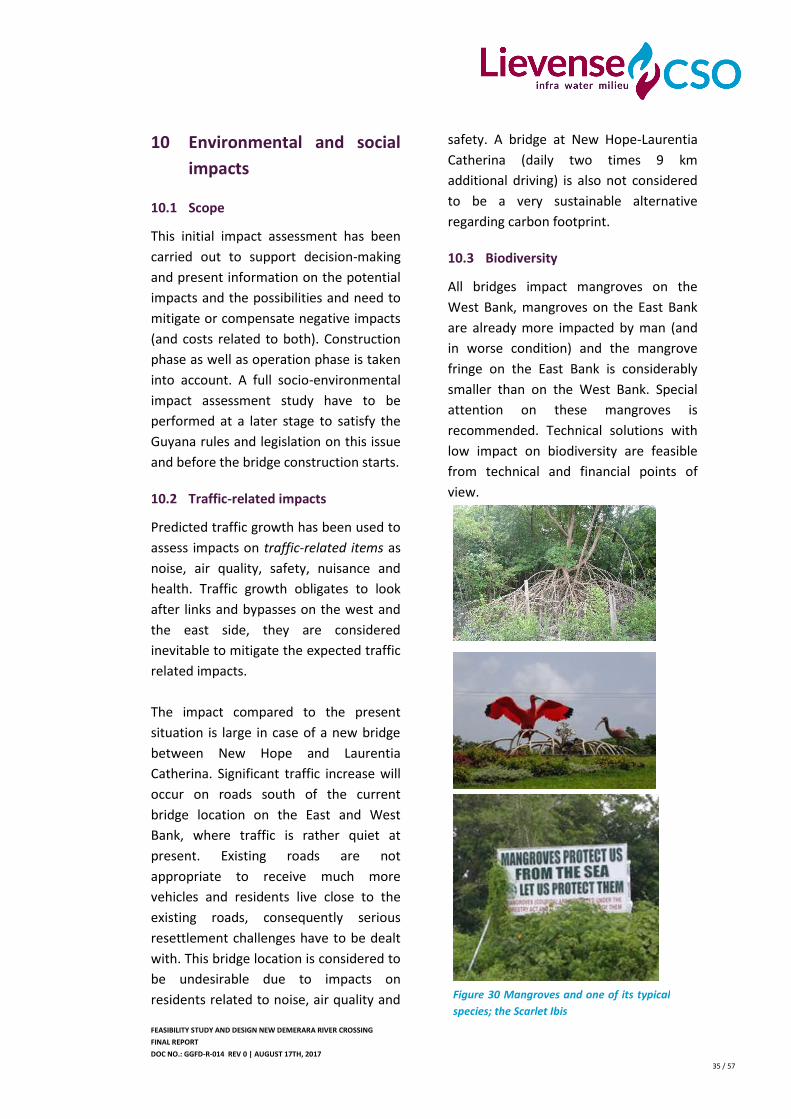
FEASIBILITY STUDY AND DESIGN NEW DEMERARA RIVER CROSSING
FINAL REPORT
DOC NO.: GGFD-R-014 REV 0 | AUGUST 17TH, 2017
35 / 57
10 Environmental and social
impacts
10.1 Scope
This initial impact assessment has been
carried out to support decision-making
and present information on the potential
impacts and the possibilities and need to
mitigate or compensate negative impacts
(and costs related to both). Construction
phase as well as operation phase is taken
into account. A full socio-environmental
impact assessment study have to be
performed at a later stage to satisfy the
Guyana rules and legislation on this issue
and before the bridge construction starts.
10.2 Traffic-related impacts
Predicted traffic growth has been used to
assess impacts on traffic-related items as
noise, air quality, safety, nuisance and
health. Traffic growth obligates to look
after links and bypasses on the west and
the east side, they are considered
inevitable to mitigate the expected traffic
related impacts.
The impact compared to the present
situation is large in case of a new bridge
between New Hope and Laurentia
Catherina. Significant traffic increase will
occur on roads south of the current
bridge location on the East and West
Bank, where traffic is rather quiet at
present. Existing roads are not
appropriate to receive much more
vehicles and residents live close to the
existing roads, consequently serious
resettlement challenges have to be dealt
with. This bridge location is considered to
be undesirable due to impacts on
residents related to noise, air quality and
safety. A bridge at New Hope-Laurentia
Catherina (daily two times 9 km
additional driving) is also not considered
to be a very sustainable alternative
regarding carbon footprint.
10.3 Biodiversity
All bridges impact mangroves on the
West Bank, mangroves on the East Bank
are already more impacted by man (and
in worse condition) and the mangrove
fringe on the East Bank is considerably
smaller than on the West Bank. Special
attention on these mangroves is
recommended. Technical solutions with
low impact on biodiversity are feasible
from technical and financial points of
view.
Figure 30 Mangroves and one of its typical
species; the Scarlet Ibis
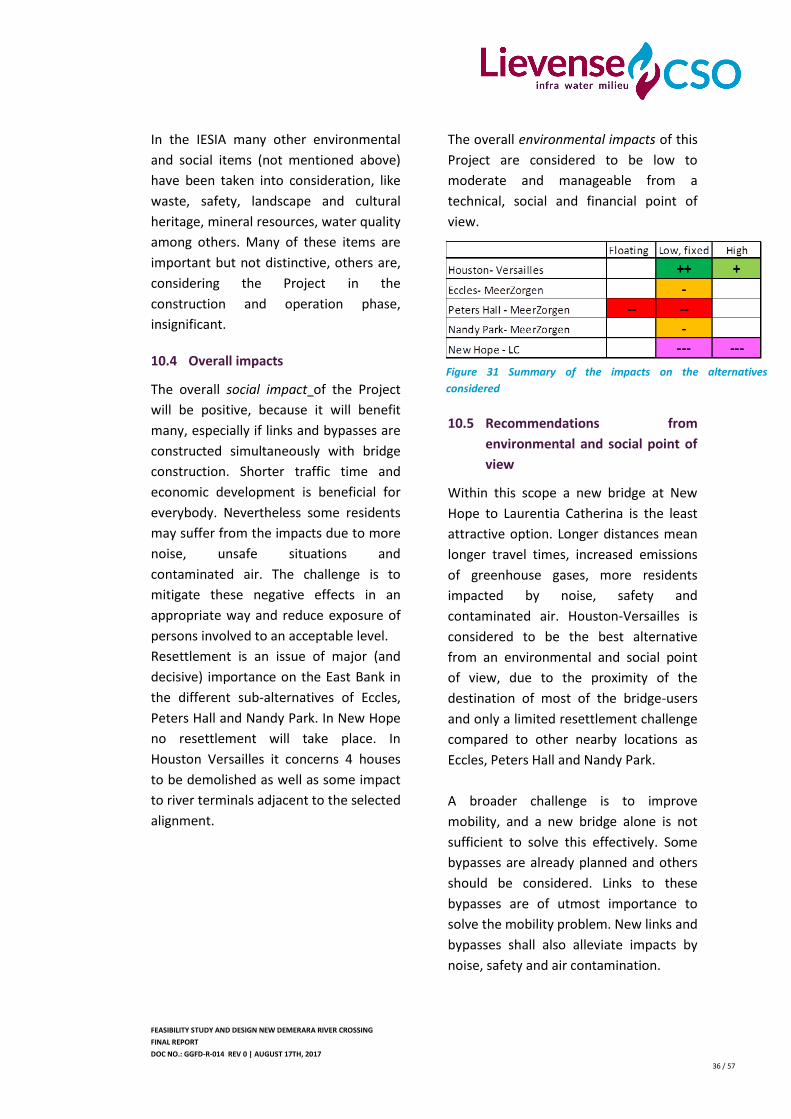
FEASIBILITY STUDY AND DESIGN NEW DEMERARA RIVER CROSSING
FINAL REPORT
DOC NO.: GGFD-R-014 REV 0 | AUGUST 17TH, 2017
36 / 57
In the IESIA many other environmental
and social items (not mentioned above)
have been taken into consideration, like
waste, safety, landscape and cultural
heritage, mineral resources, water quality
among others. Many of these items are
important but not distinctive, others are,
considering the Project in the
construction and operation phase,
insignificant.
10.4 Overall impacts
The overall social impact of the Project
will be positive, because it will benefit
many, especially if links and bypasses are
constructed simultaneously with bridge
construction. Shorter traffic time and
economic development is beneficial for
everybody. Nevertheless some residents
may suffer from the impacts due to more
noise, unsafe situations and
contaminated air. The challenge is to
mitigate these negative effects in an
appropriate way and reduce exposure of
persons involved to an acceptable level.
Resettlement is an issue of major (and
decisive) importance on the East Bank in
the different sub-alternatives of Eccles,
Peters Hall and Nandy Park. In New Hope
no resettlement will take place. In
Houston Versailles it concerns 4 houses
to be demolished as well as some impact
to river terminals adjacent to the selected
alignment.
The overall environmental impacts of this
Project are considered to be low to
moderate and manageable from a
technical, social and financial point of
view.
10.5 Recommendations from
environmental and social point of
view
Within this scope a new bridge at New
Hope to Laurentia Catherina is the least
attractive option. Longer distances mean
longer travel times, increased emissions
of greenhouse gases, more residents
impacted by noise, safety and
contaminated air. Houston-Versailles is
considered to be the best alternative
from an environmental and social point
of view, due to the proximity of the
destination of most of the bridge-users
and only a limited resettlement challenge
compared to other nearby locations as
Eccles, Peters Hall and Nandy Park.
A broader challenge is to improve
mobility, and a new bridge alone is not
sufficient to solve this effectively. Some
bypasses are already planned and others
should be considered. Links to these
bypasses are of utmost importance to
solve the mobility problem. New links and
bypasses shall also alleviate impacts by
noise, safety and air contamination.
Figure 31 Summary of the impacts on the alternatives
considered
FEASIBILITY STUDY AND DESIGN NEW DEMERARA RIVER CROSSING
FINAL REPORT
DOC NO.: GGFD-R-014 REV 0 | AUGUST 17TH, 2017
37 / 57
11 Economic feasibility
11.1 Scope
A socio-economic cost benefit analysis
provides input for investment and
financing decisions that have to be made.
The analysis is a supportive tool for
alternative selection and for Project
justification.
A Project is feasible in an economic sense
when the benefits outweigh the costs.
Benefits and costs are measured from a
national (or public) point of view. The
cost-benefit analysis (CBA) shows which
of the alternatives create the highest
value, but it is more about identifying
differences between Project alternatives,
than about predicting absolute monetary
values.
This analysis includes construction costs,
operation costs and maintenance costs,
rehabilitation costs and revenues. It also
includes the socio-economic effects:
travel time for both passengers and cargo
and for river and road traffic,
environmental and social and economic
effects. Improved travel time will lead to
an improved business climate, improved
competitive positioning, and new
opportunities in the field of land
development and real estate
development. Direct as well as indirect
effects have been considered.
11.2 Assumptions on economic
feasibility
A time horizon of 30 years is taken for our
Projections, the technical lifetime of the
bridge exceeds 50 years. Projections
longer than 30 years involve high
uncertainty and their predictive value
becomes low. At the same time it is
probable that this bridge will be followed
by other river-crossing infrastructure. A
newly built copy of the present floating
bridge, on the same location, with an
identical layout, and without any change
to the surrounding road infrastructure, is
taken as reference case.
The Inter-American Development Bank
recommends that a 12% real discount
rate to be used in Projects. In addition we
have performed the calculation with a 9%
and with a 6% rate in the sensitivity
analysis. This rate is a good reflection of
the social cost of capital (representing the
investors’ positions) as inflation at the
moment is 0%, and domestic interest
rates are 10-12% per annum.
11.3 Revenues from toll
The bridge generates revenues from two
sources: road traffic and river traffic. For
road traffic the toll rates are assumed to
be constant. For river traffic the toll rates
are assumed to increase over time. The
traffic volumes are based on the traffic
forecast.
Annual revenues from toll are estimated
to be at 5,4 million USD in year 1, and
growing over the years to 8,4 million USD
in year 10. The growth of revenues is the
consequence of a growth in traffic
volumes. Location and configuration of
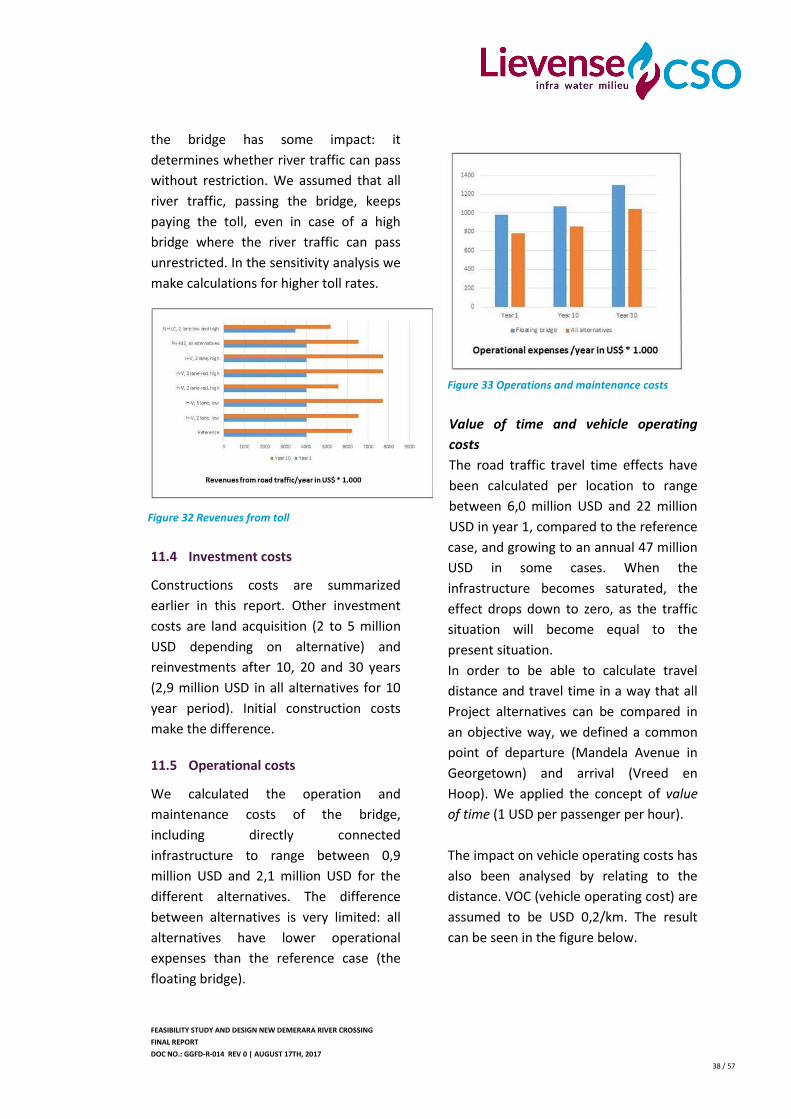
FEASIBILITY STUDY AND DESIGN NEW DEMERARA RIVER CROSSING
FINAL REPORT
DOC NO.: GGFD-R-014 REV 0 | AUGUST 17TH, 2017
38 / 57
the bridge has some impact: it
determines whether river traffic can pass
without restriction. We assumed that all
river traffic, passing the bridge, keeps
paying the toll, even in case of a high
bridge where the river traffic can pass
unrestricted. In the sensitivity analysis we
make calculations for higher toll rates.
11.4 Investment costs
Constructions costs are summarized
earlier in this report. Other investment
costs are land acquisition (2 to 5 million
USD depending on alternative) and
reinvestments after 10, 20 and 30 years
(2,9 million USD in all alternatives for 10
year period). Initial construction costs
make the difference.
11.5 Operational costs
We calculated the operation and
maintenance costs of the bridge,
including directly connected
infrastructure to range between 0,9
million USD and 2,1 million USD for the
different alternatives. The difference
between alternatives is very limited: all
alternatives have lower operational
expenses than the reference case (the
floating bridge).
Value of time and vehicle operating
costs
The road traffic travel time effects have
been calculated per location to range
between 6,0 million USD and 22 million
USD in year 1, compared to the reference
case, and growing to an annual 47 million
USD in some cases. When the
infrastructure becomes saturated, the
effect drops down to zero, as the traffic
situation will become equal to the
present situation.
In order to be able to calculate travel
distance and travel time in a way that all
Project alternatives can be compared in
an objective way, we defined a common
point of departure (Mandela Avenue in
Georgetown) and arrival (Vreed en
Hoop). We applied the concept of value
of time (1 USD per passenger per hour).
The impact on vehicle operating costs has
also been analysed by relating to the
distance. VOC (vehicle operating cost) are
assumed to be USD 0,2/km. The result
can be seen in the figure below.
Figure 32 Revenues from toll
Figure 33 Operations and maintenance costs
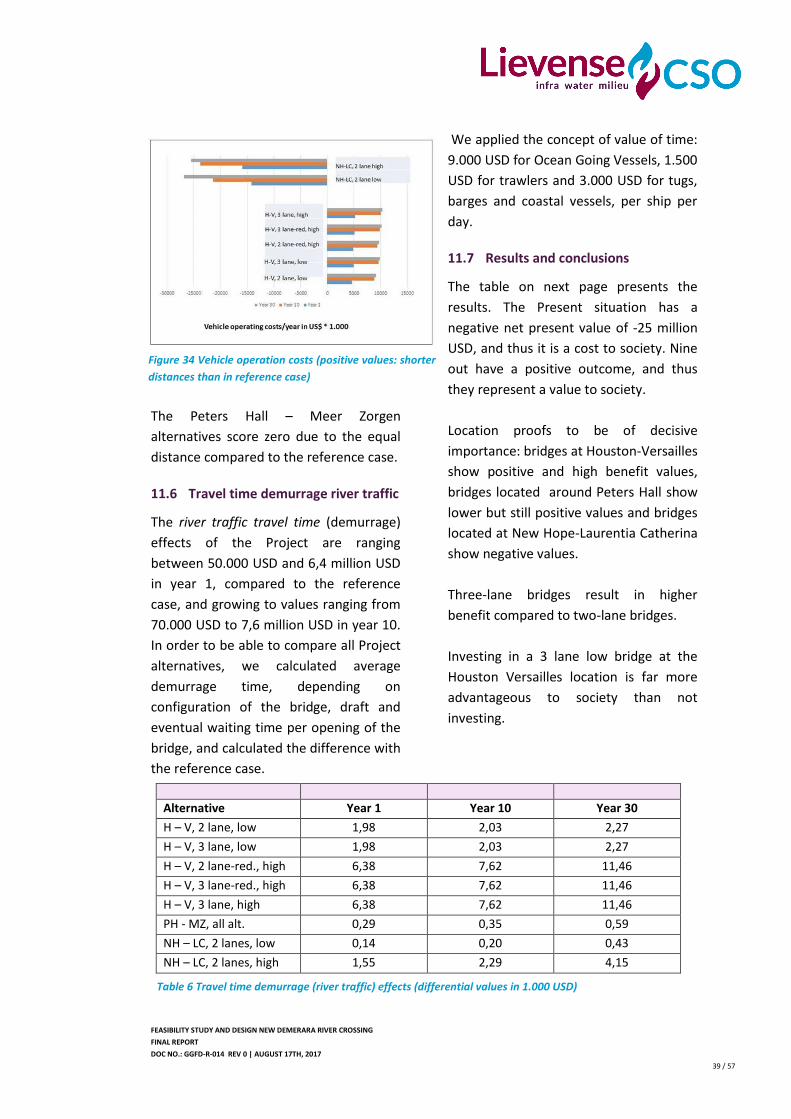
FEASIBILITY STUDY AND DESIGN NEW DEMERARA RIVER CROSSING
FINAL REPORT
DOC NO.: GGFD-R-014 REV 0 | AUGUST 17TH, 2017
39 / 57
The Peters Hall – Meer Zorgen
alternatives score zero due to the equal
distance compared to the reference case.
11.6 Travel time demurrage river traffic
The river traffic travel time (demurrage)
effects of the Project are ranging
between 50.000 USD and 6,4 million USD
in year 1, compared to the reference
case, and growing to values ranging from
70.000 USD to 7,6 million USD in year 10.
In order to be able to compare all Project
alternatives, we calculated average
demurrage time, depending on
configuration of the bridge, draft and
eventual waiting time per opening of the
bridge, and calculated the difference with
the reference case.
We applied the concept of value of time:
9.000 USD for Ocean Going Vessels, 1.500
USD for trawlers and 3.000 USD for tugs,
barges and coastal vessels, per ship per
day.
11.7 Results and conclusions
The table on next page presents the
results. The Present situation has a
negative net present value of -25 million
USD, and thus it is a cost to society. Nine
out have a positive outcome, and thus
they represent a value to society.
Location proofs to be of decisive
importance: bridges at Houston-Versailles
show positive and high benefit values,
bridges located around Peters Hall show
lower but still positive values and bridges
located at New Hope-Laurentia Catherina
show negative values.
Three-lane bridges result in higher
benefit compared to two-lane bridges.
Investing in a 3 lane low bridge at the
Houston Versailles location is far more
advantageous to society than not
investing.
Figure 34 Vehicle operation costs (positive values: shorter
distances than in reference case)
Alternative Year 1 Year 10 Year 30
H – V, 2 lane, low 1,98 2,03 2,27
H – V, 3 lane, low 1,98 2,03 2,27
H – V, 2 lane-red., high 6,38 7,62 11,46
H – V, 3 lane-red., high 6,38 7,62 11,46
H – V, 3 lane, high 6,38 7,62 11,46
PH - MZ, all alt. 0,29 0,35 0,59
NH – LC, 2 lanes, low 0,14 0,20 0,43
NH – LC, 2 lanes, high 1,55 2,29 4,15
Table 6 Travel time demurrage (river traffic) effects (differential values in 1.000 USD)
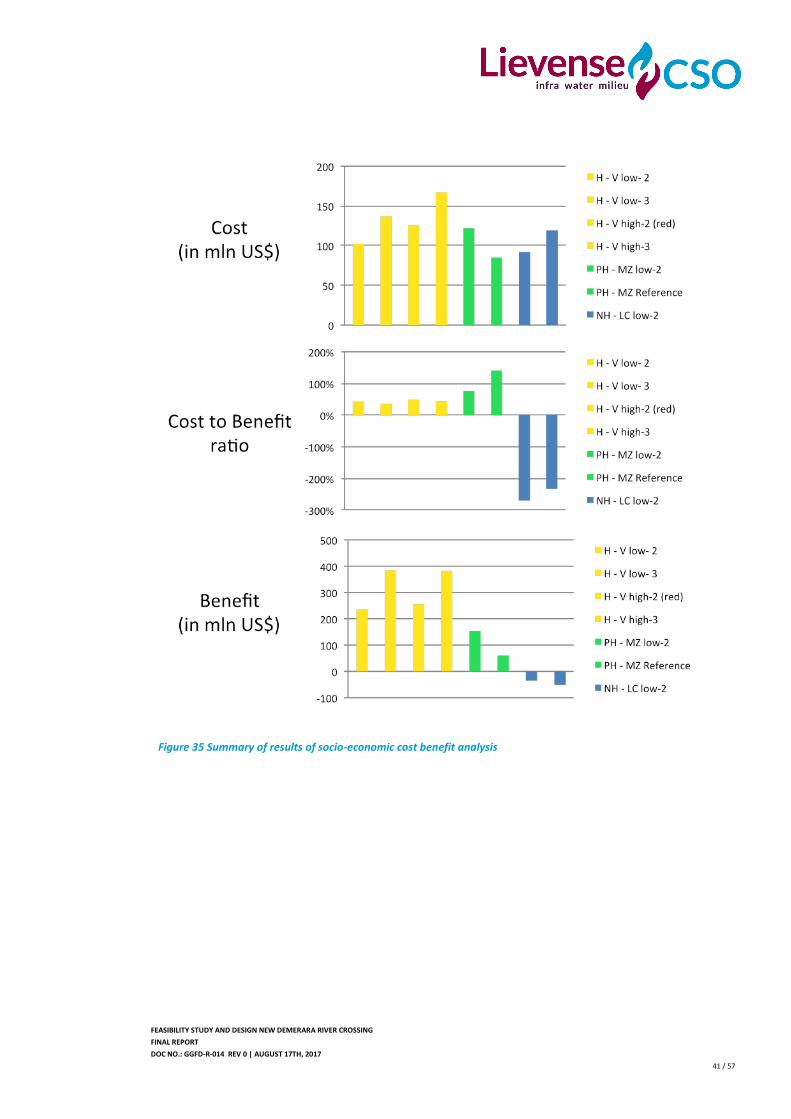
FEASIBILITY STUDY AND DESIGN NEW DEMERARA RIVER CROSSING
FINAL REPORT
DOC NO.: GGFD-R-014 REV 0 | AUGUST 17TH, 2017
41 / 57
Figure 35 Summary of results of socio-economic cost benefit analysis
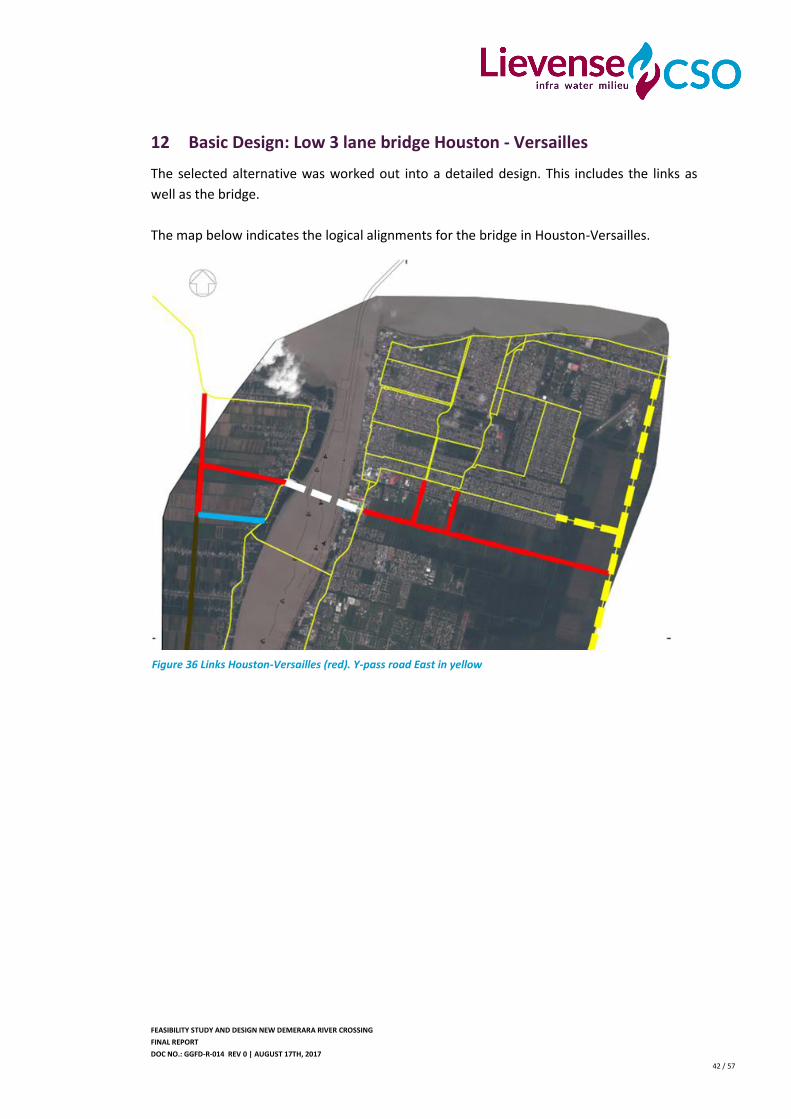
FEASIBILITY STUDY AND DESIGN NEW DEMERARA RIVER CROSSING
FINAL REPORT
DOC NO.: GGFD-R-014 REV 0 | AUGUST 17TH, 2017
42 / 57
12 Basic Design: Low 3 lane bridge Houston - Versailles
The selected alternative was worked out into a detailed design. This includes the links as
well as the bridge.
The map below indicates the logical alignments for the bridge in Houston-Versailles.
Figure 36 Links Houston-Versailles (red). Y-pass road East in yellow
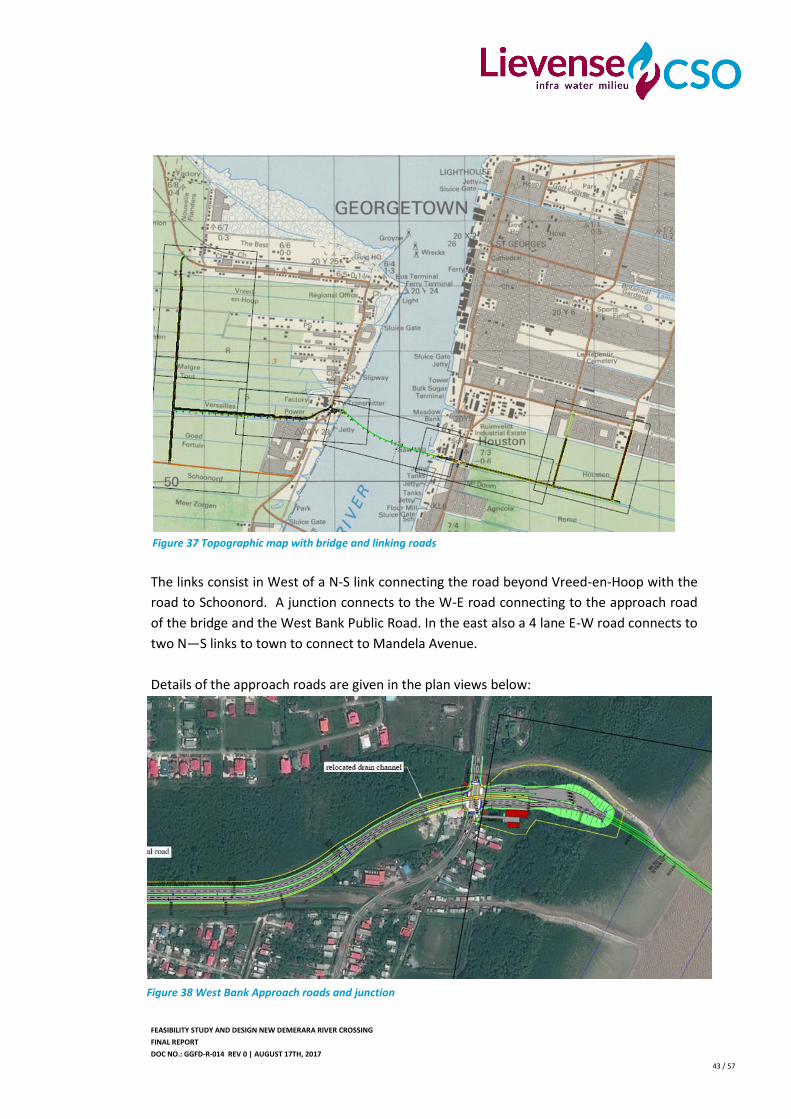
FEASIBILITY STUDY AND DESIGN NEW DEMERARA RIVER CROSSING
FINAL REPORT
DOC NO.: GGFD-R-014 REV 0 | AUGUST 17TH, 2017
43 / 57
The links consist in West of a N-S link connecting the road beyond Vreed-en-Hoop with the
road to Schoonord. A junction connects to the W-E road connecting to the approach road
of the bridge and the West Bank Public Road. In the east also a 4 lane E-W road connects to
two N—S links to town to connect to Mandela Avenue.
Details of the approach roads are given in the plan views below:
Figure 37 Topographic map with bridge and linking roads
Figure 38 West Bank Approach roads and junction
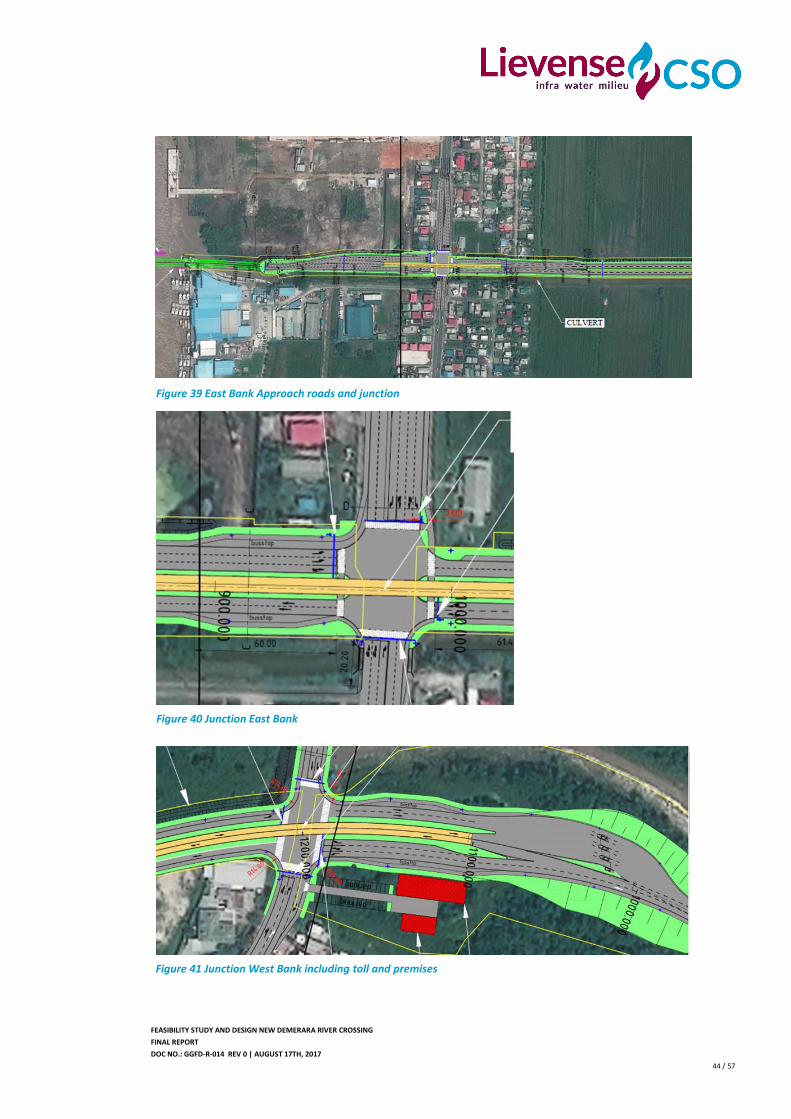
FEASIBILITY STUDY AND DESIGN NEW DEMERARA RIVER CROSSING
FINAL REPORT
DOC NO.: GGFD-R-014 REV 0 | AUGUST 17TH, 2017
44 / 57
Figure 39 East Bank Approach roads and junction
Figure 40 Junction East Bank
Figure 41 Junction West Bank including toll and premises
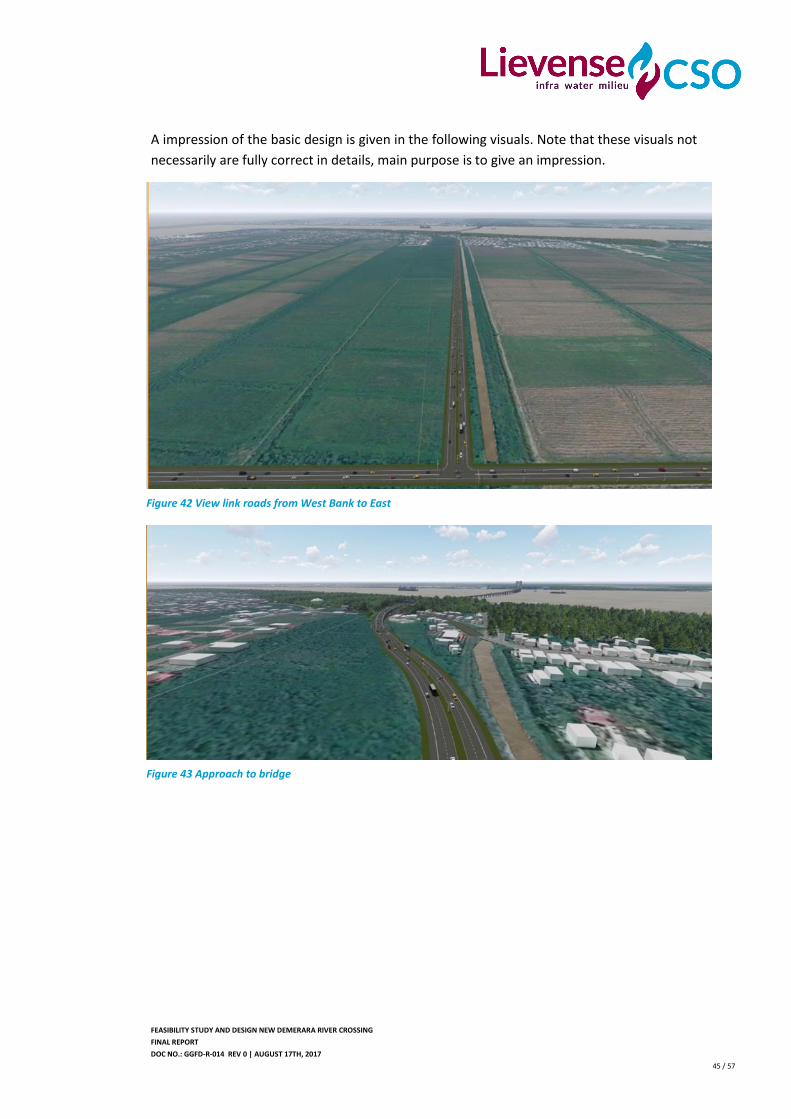
FEASIBILITY STUDY AND DESIGN NEW DEMERARA RIVER CROSSING
FINAL REPORT
DOC NO.: GGFD-R-014 REV 0 | AUGUST 17TH, 2017
45 / 57
A impression of the basic design is given in the following visuals. Note that these visuals not
necessarily are fully correct in details, main purpose is to give an impression.
Figure 42 View link roads from West Bank to East
Figure 43 Approach to bridge
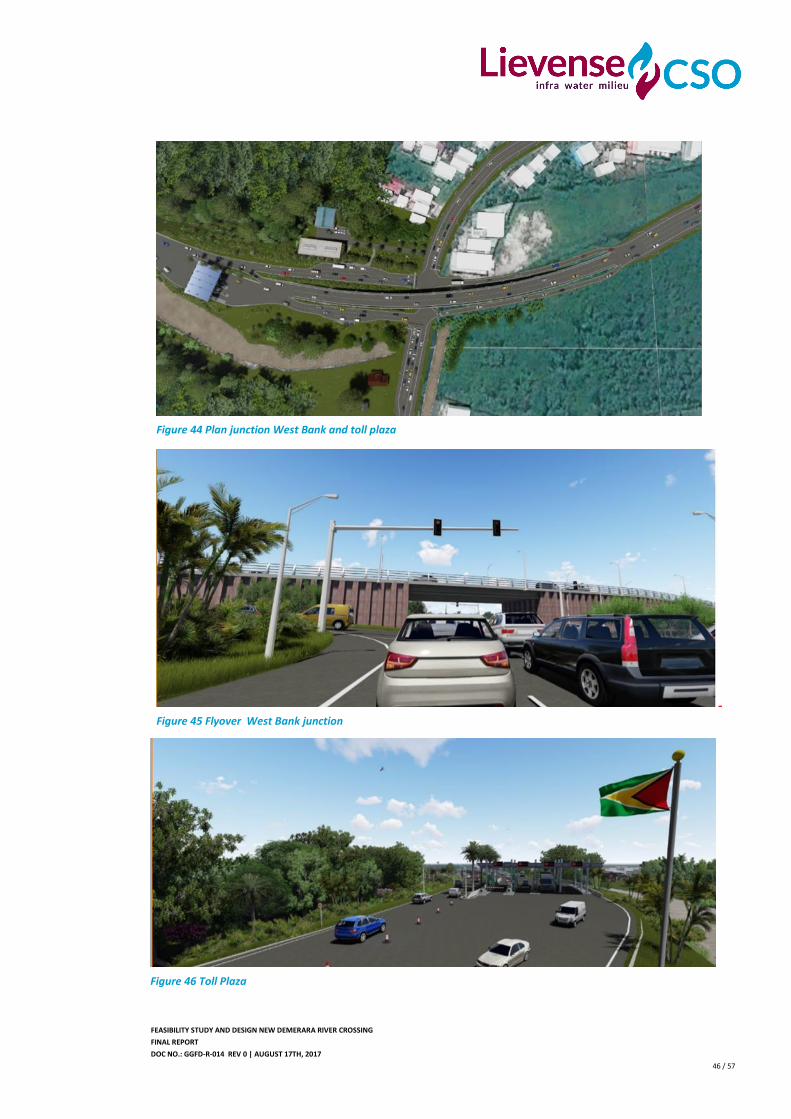
FEASIBILITY STUDY AND DESIGN NEW DEMERARA RIVER CROSSING
FINAL REPORT
DOC NO.: GGFD-R-014 REV 0 | AUGUST 17TH, 2017
46 / 57
Figure 44 Plan junction West Bank and toll plaza
Figure 45 Flyover West Bank junction
Figure 46 Toll Plaza
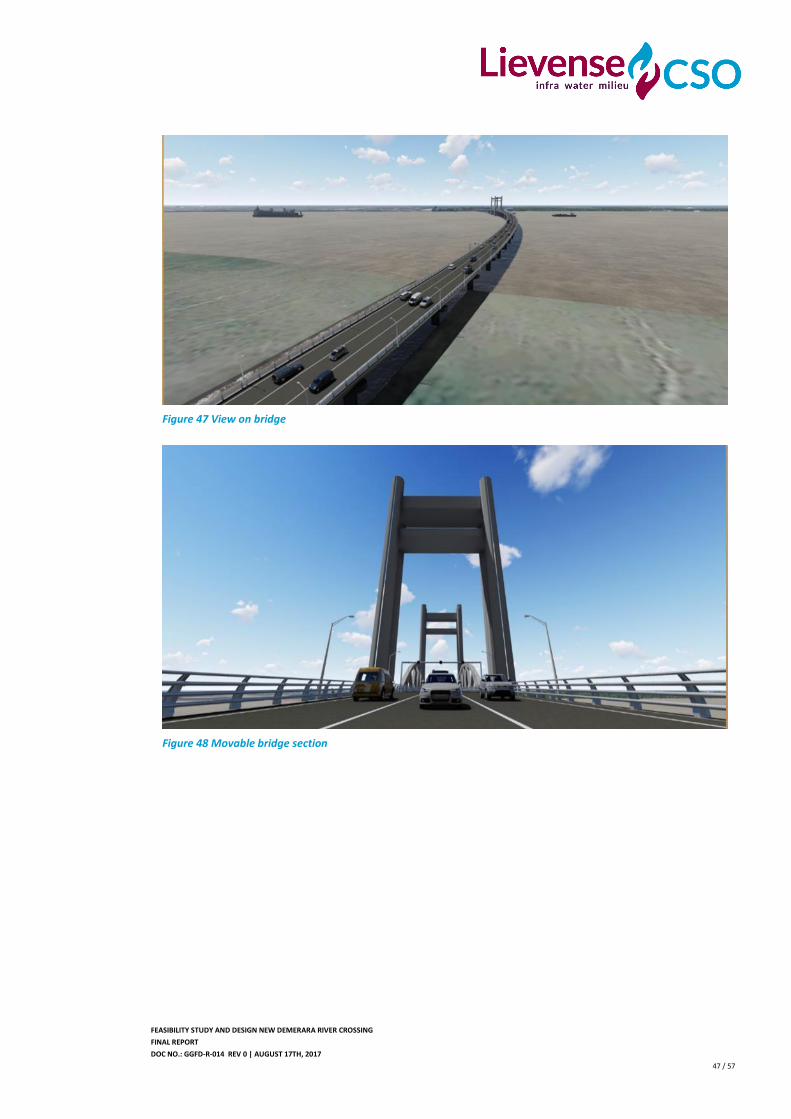
FEASIBILITY STUDY AND DESIGN NEW DEMERARA RIVER CROSSING
FINAL REPORT
DOC NO.: GGFD-R-014 REV 0 | AUGUST 17TH, 2017
47 / 57
Figure 47 View on bridge
Figure 48 Movable bridge section
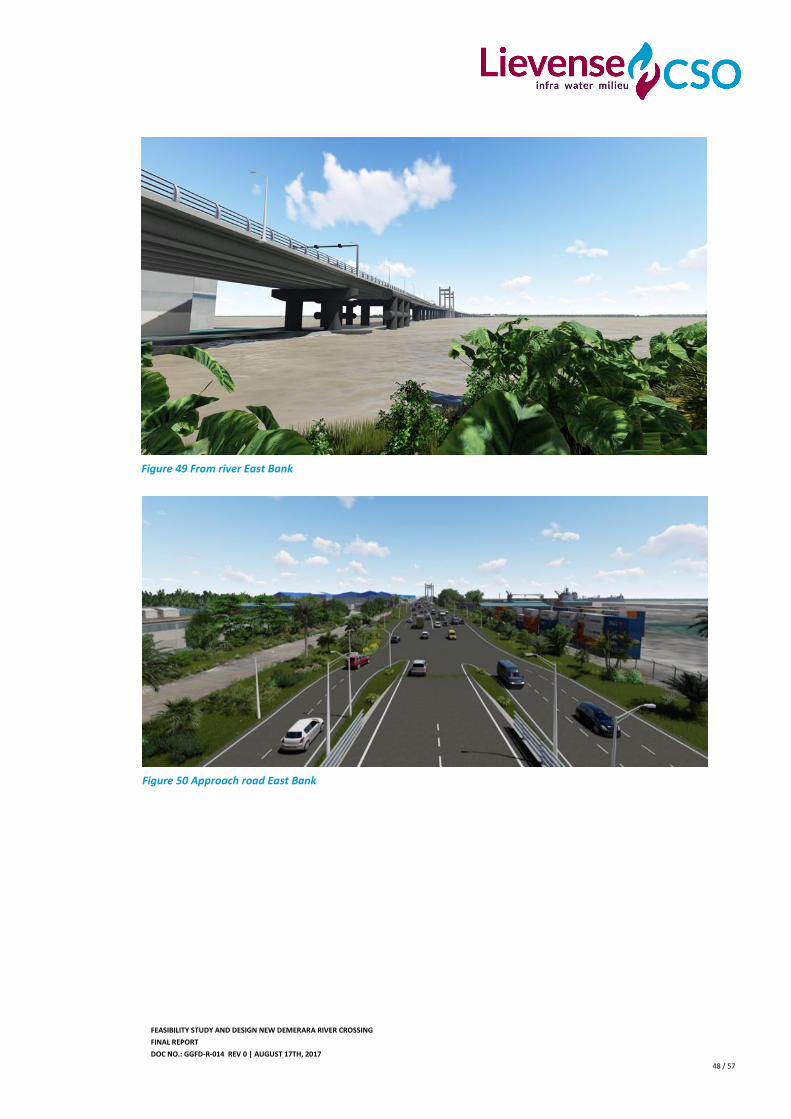
FEASIBILITY STUDY AND DESIGN NEW DEMERARA RIVER CROSSING
FINAL REPORT
DOC NO.: GGFD-R-014 REV 0 | AUGUST 17TH, 2017
48 / 57
Figure 49 From river East Bank
Figure 50 Approach road East Bank
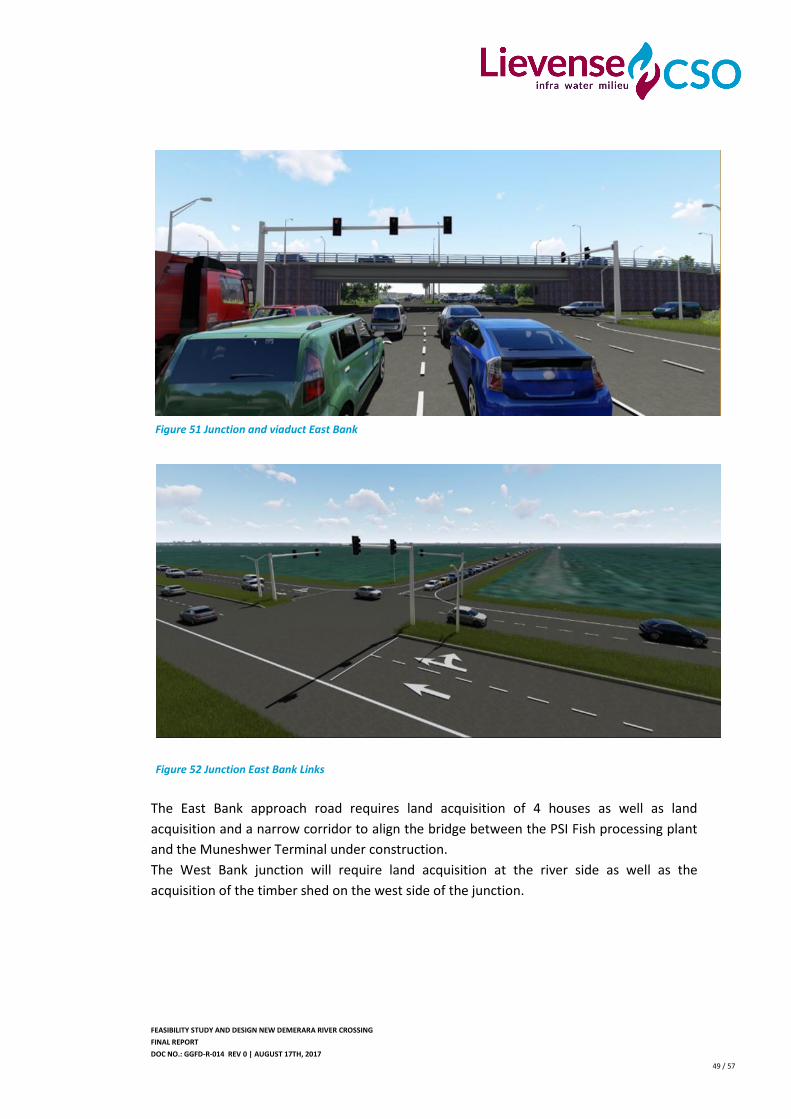
FEASIBILITY STUDY AND DESIGN NEW DEMERARA RIVER CROSSING
FINAL REPORT
DOC NO.: GGFD-R-014 REV 0 | AUGUST 17TH, 2017
49 / 57
The East Bank approach road requires land acquisition of 4 houses as well as land
acquisition and a narrow corridor to align the bridge between the PSI Fish processing plant
and the Muneshwer Terminal under construction.
The West Bank junction will require land acquisition at the river side as well as the
acquisition of the timber shed on the west side of the junction.
Figure 51 Junction and viaduct East Bank
Figure 52 Junction East Bank Links
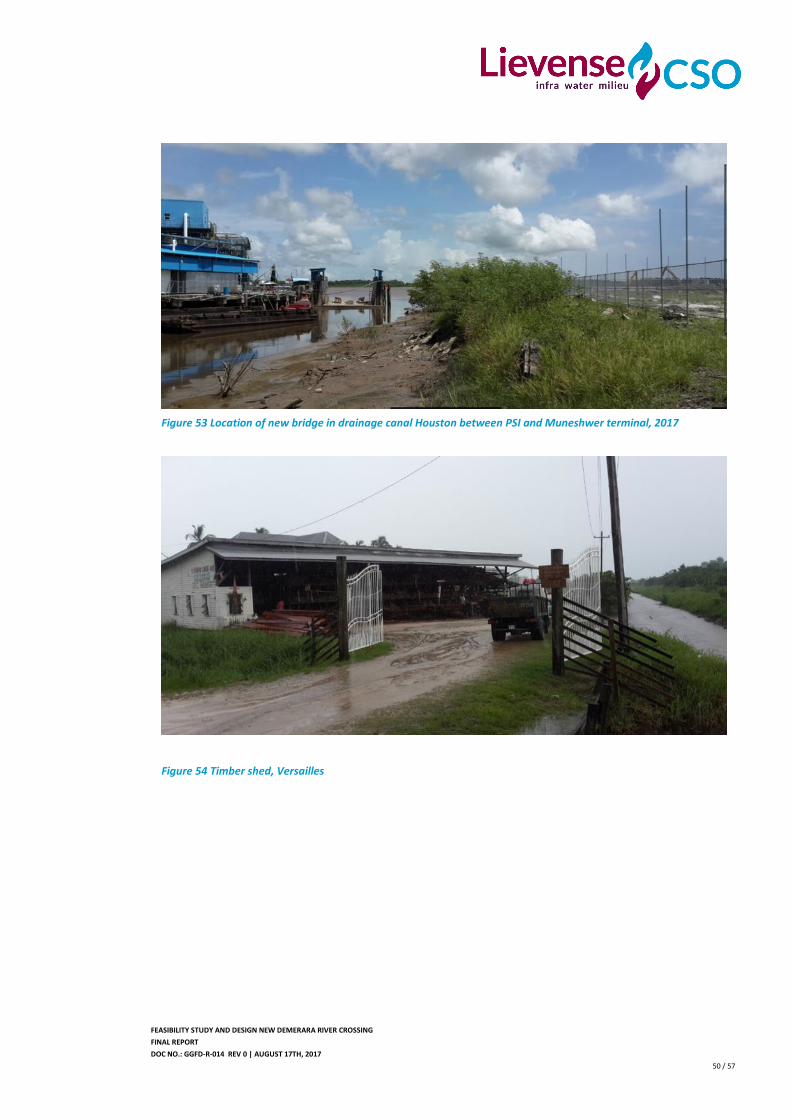
FEASIBILITY STUDY AND DESIGN NEW DEMERARA RIVER CROSSING
FINAL REPORT
DOC NO.: GGFD-R-014 REV 0 | AUGUST 17TH, 2017
50 / 57
Figure 53 Location of new bridge in drainage canal Houston between PSI and Muneshwer terminal, 2017
Figure 54 Timber shed, Versailles
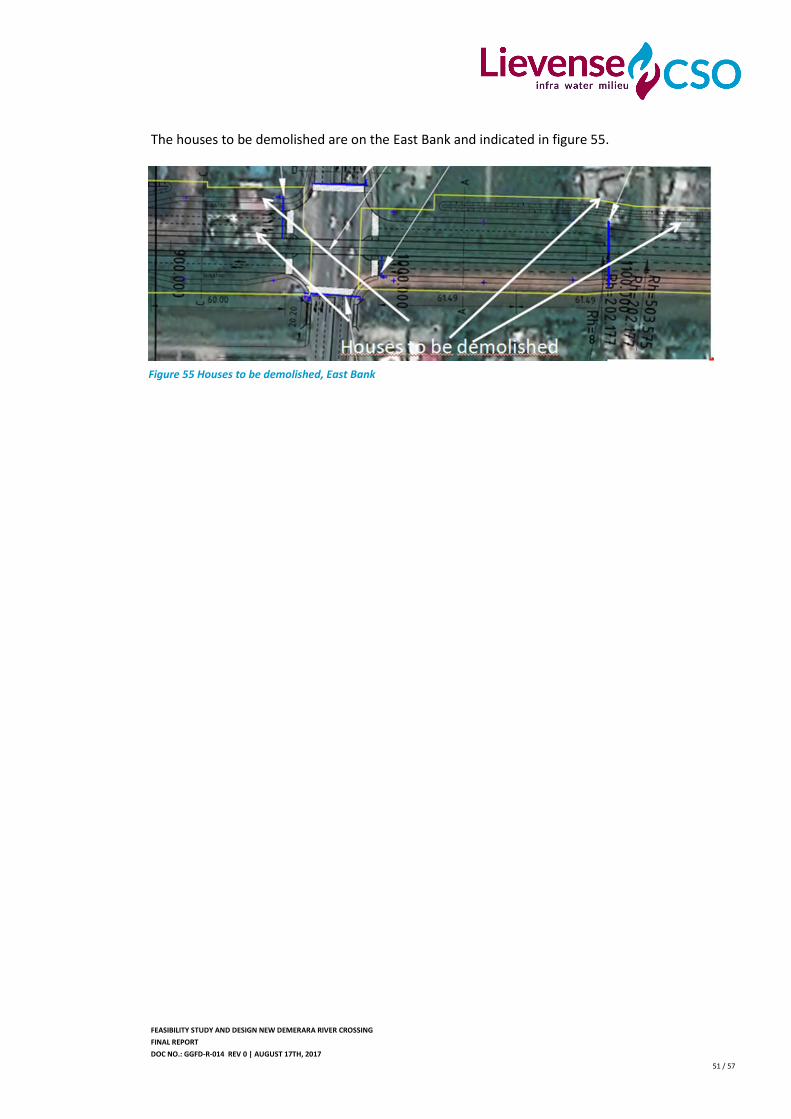
FEASIBILITY STUDY AND DESIGN NEW DEMERARA RIVER CROSSING
FINAL REPORT
DOC NO.: GGFD-R-014 REV 0 | AUGUST 17TH, 2017
51 / 57
The houses to be demolished are on the East Bank and indicated in figure 55.
Figure 55 Houses to be demolished, East Bank
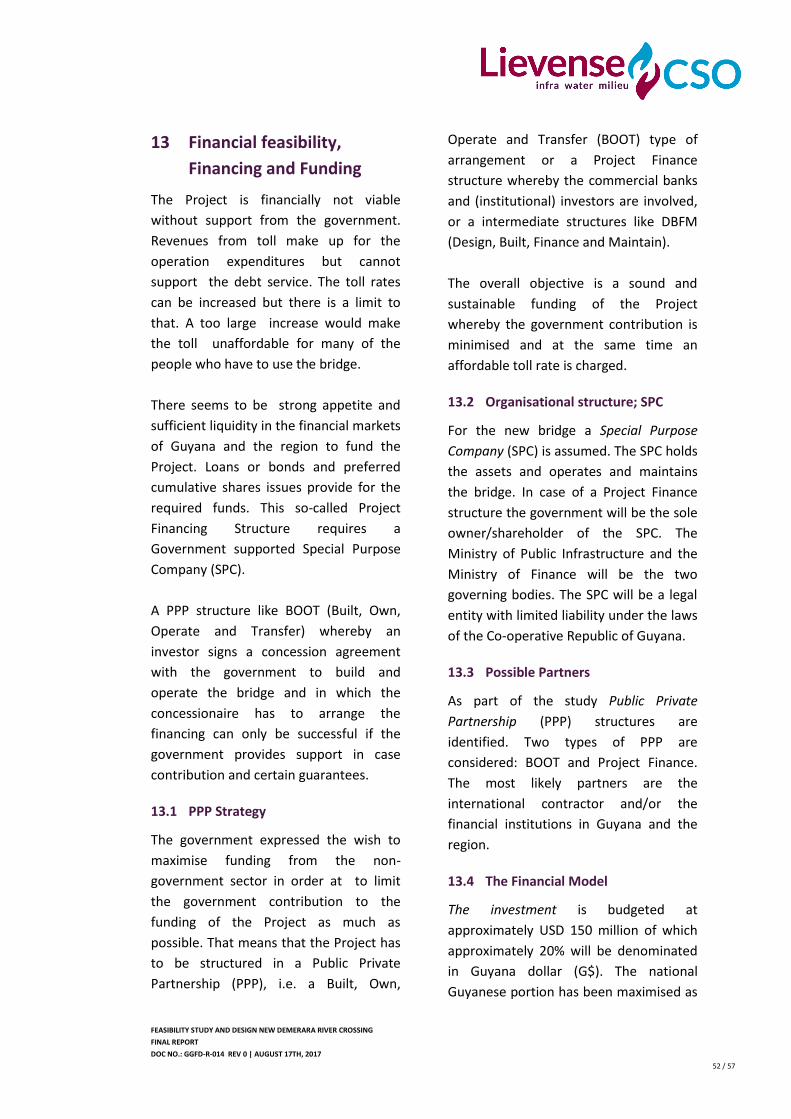
FEASIBILITY STUDY AND DESIGN NEW DEMERARA RIVER CROSSING
FINAL REPORT
DOC NO.: GGFD-R-014 REV 0 | AUGUST 17TH, 2017
52 / 57
13 Financial feasibility,
Financing and Funding
The Project is financially not viable
without support from the government.
Revenues from toll make up for the
operation expenditures but cannot
support the debt service. The toll rates
can be increased but there is a limit to
that. A too large increase would make
the toll unaffordable for many of the
people who have to use the bridge.
There seems to be strong appetite and
sufficient liquidity in the financial markets
of Guyana and the region to fund the
Project. Loans or bonds and preferred
cumulative shares issues provide for the
required funds. This so-called Project
Financing Structure requires a
Government supported Special Purpose
Company (SPC).
A PPP structure like BOOT (Built, Own,
Operate and Transfer) whereby an
investor signs a concession agreement
with the government to build and
operate the bridge and in which the
concessionaire has to arrange the
financing can only be successful if the
government provides support in case
contribution and certain guarantees.
13.1 PPP Strategy
The government expressed the wish to
maximise funding from the non-
government sector in order at to limit
the government contribution to the
funding of the Project as much as
possible. That means that the Project has
to be structured in a Public Private
Partnership (PPP), i.e. a Built, Own,
Operate and Transfer (BOOT) type of
arrangement or a Project Finance
structure whereby the commercial banks
and (institutional) investors are involved,
or a intermediate structures like DBFM
(Design, Built, Finance and Maintain).
The overall objective is a sound and
sustainable funding of the Project
whereby the government contribution is
minimised and at the same time an
affordable toll rate is charged.
13.2 Organisational structure; SPC
For the new bridge a Special Purpose
Company (SPC) is assumed. The SPC holds
the assets and operates and maintains
the bridge. In case of a Project Finance
structure the government will be the sole
owner/shareholder of the SPC. The
Ministry of Public Infrastructure and the
Ministry of Finance will be the two
governing bodies. The SPC will be a legal
entity with limited liability under the laws
of the Co-operative Republic of Guyana.
13.3 Possible Partners
As part of the study Public Private
Partnership (PPP) structures are
identified. Two types of PPP are
considered: BOOT and Project Finance.
The most likely partners are the
international contractor and/or the
financial institutions in Guyana and the
region.
13.4 The Financial Model
The investment is budgeted at
approximately USD 150 million of which
approximately 20% will be denominated
in Guyana dollar (G$). The national
Guyanese portion has been maximised as
FEASIBILITY STUDY AND DESIGN NEW DEMERARA RIVER CROSSING
FINAL REPORT
DOC NO.: GGFD-R-014 REV 0 | AUGUST 17TH, 2017
53 / 57
much as possible to allow maximum
application of the liquidity and appetite
available in Guyana and to optimise the
natural hedge (revenues in G$ versus
Opex and debt service in G$).
In case of a BOOT the financing is
arranged by the owner/sponsor of the
Project. He drafts his own model and
arranges the funding. The government
only sets out rules and terms in a
concession which define amongst others
the required capacities of the river
crossing facilities, the toll rates and the
term of the concession. Government may
need to provide guarantees and provide a
yearly contribution or subsidy if needed.
In a Project Finance structure the
Government/SPC raises the required
funding. The EBITDA (revenues minus
operational cost) shall be sufficient to
cover the debt service (repayment of
loans and bonds as well as interest). If not
sufficient, Government has to contribute
by paying a yearly contribution to cover
the negative cash flow until revenues
have increased and or loans and bonds
are paid back.
13.5 Revenues
The business case of the bridge is based
on revenues from collected toll from the
vehicles as well as from marine traffic
passing the bridge.
The numbers of road traffic have been
taken from the outcome of the traffic
forecast study. A cap on the traffic
demand has been applied. The road
network will become saturated at a
certain point in time. Toll rates applied
are at present rates (scenario 1). In
scenarios 2 and 3 rates have been
increased with 100% and 200%. In all
scenarios a general increase of 9% at the
end of each consecutive third year has
been applied to follow the increase of
cost in time.
There is though a good case to make for
increasing the rates. After all the people
will benefit on travel costs and time. The
majority will have a shorter distance to
travel and they save time since
congestion decreases. There are voices
stating that increasing the rates even
further to triple (increase of 200%) would
still be acceptable.
The existing toll categories and tariffs for
ships are applied, increased with a part of
the amount that will be saved on
demurrage costs as the bridge can open
any time except for rush hours. These
rates are increased charging a toll for the
Ocean Going Vessels in the amount of
USD 1625 (in 2017 USD 250). The tariffs
for marine traffic also grow with steps of
9% every fourth year. As the second
category (smaller vessels like tugs,
trawlers and coastal vessels) basically
have no demurrage cost, the tariff for this
category (trawlers and coastal vessels)
has not been changed.
The limits for increasing the toll rates are
set by affordability, social responsibility,
willingness to pay and what is political
acceptable. There are no alternatives for
crossing Demerara River safely except for
the ferryboats. Raising the tariffs may
imply that the poorer people cannot
afford to use the bridge. From the very
beginning of this Project the government
FEASIBILITY STUDY AND DESIGN NEW DEMERARA RIVER CROSSING
FINAL REPORT
DOC NO.: GGFD-R-014 REV 0 | AUGUST 17TH, 2017
54 / 57
has put emphasise on the fact that the
rates should remain affordable.
13.6 Tax and Dividends
In this Funding Plan it is assumed that the
Project is exempted from paying import
and VAT taxes and that dividend is only
paid out if the Project makes a profit i.e.
positive Net Profit After Tax (NPAT).
FEASIBILITY STUDY AND DESIGN NEW DEMERARA RIVER CROSSING
FINAL REPORT
DOC NO.: GGFD-R-014 REV 0 | AUGUST 17TH, 2017
55 / 57
14 Financial feasibility; toll
rate impact
A business case of the Project has been
developed for Scenario 1 (no increase of
toll except for the compensation of cost
increase). The operational result
(revenues minus operational expenses)
shows strong positive figures. The debt
service (repayment of principal and
interest) is dominant in the financial
projections. The business case of the
Project is financially not viable and
cannot be sustained without Government
contribution. To be able to attract
funding for the investments to be made
long term financing is required. The
market cannot provide such long term
funding, but only medium term funding
resulting in high debt services over the
medium term.
A funding plan has been developed taking
into account lowest government
contribution i.e. maximise non-
governmental financial institutions and
funding, swift arranging and a sustainable
structure which fits the project.
Project costs of the low three lane bridge
at Houston - Versailles are estimated at
USD 150 million, including contractors
cost and additional costs for services,
land acquisition for the approach roads,
and limited budget for a first phase of link
roads. As also pre-financing cost due to
interest during construction have to be
financed, total required funding is
assumed upon USD 170 million.
14.1 Cash available for debt service
In Annex 8 (Financial Feasibility) it is
concluded that the required Debt Service
weighs heavy on the financials of the
Project and are high in comparison with
the Operational Expenditures. Debt
service includes interest and repayments
of loans or bonds. Generally the loans
/bonds are medium term (10-15 year)
and require yearly repayment and
together with the interest the yearly cash
needed for debt service is considerable.
As a result of the high debt service it was
concluded that the Project is not
financially viable without a contribution
from Government to support the cash
shortfall.
14.2 Increase of toll; effect business
case and government contribution
The Financial Model has been run with
the data of four scenarios for road toll. It
was concluded that they are not nearly
enough to cover for the Debt Service as
well, even with the highest increase of
toll rates of 200% on top of the existing
toll rate.
As a result the Government shall arrange
a contribution (subvention) on an annual
basis to cover the gap between the
revenues and the cost. The amounts are
given in table 7.
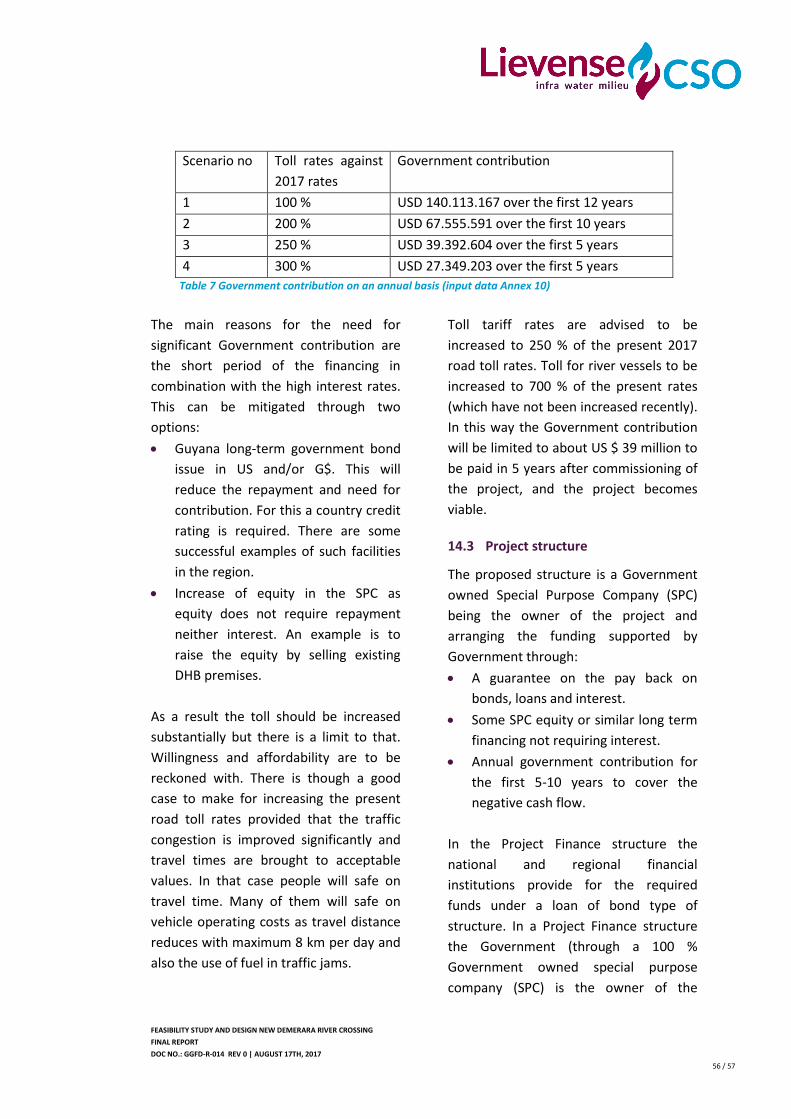
FEASIBILITY STUDY AND DESIGN NEW DEMERARA RIVER CROSSING
FINAL REPORT
DOC NO.: GGFD-R-014 REV 0 | AUGUST 17TH, 2017
56 / 57
Scenario no Toll rates against
2017 rates
Government contribution
1 100 % USD 140.113.167 over the first 12 years
2 200 % USD 67.555.591 over the first 10 years
3 250 % USD 39.392.604 over the first 5 years
4 300 % USD 27.349.203 over the first 5 years
Table 7 Government contribution on an annual basis (input data Annex 10)
The main reasons for the need for
significant Government contribution are
the short period of the financing in
combination with the high interest rates.
This can be mitigated through two
options:
Guyana long-term government bond
issue in US and/or G$. This will
reduce the repayment and need for
contribution. For this a country credit
rating is required. There are some
successful examples of such facilities
in the region.
Increase of equity in the SPC as
equity does not require repayment
neither interest. An example is to
raise the equity by selling existing
DHB premises.
As a result the toll should be increased
substantially but there is a limit to that.
Willingness and affordability are to be
reckoned with. There is though a good
case to make for increasing the present
road toll rates provided that the traffic
congestion is improved significantly and
travel times are brought to acceptable
values. In that case people will safe on
travel time. Many of them will safe on
vehicle operating costs as travel distance
reduces with maximum 8 km per day and
also the use of fuel in traffic jams.
Toll tariff rates are advised to be
increased to 250 % of the present 2017
road toll rates. Toll for river vessels to be
increased to 700 % of the present rates
(which have not been increased recently).
In this way the Government contribution
will be limited to about US $ 39 million to
be paid in 5 years after commissioning of
the project, and the project becomes
viable.
14.3 Project structure
The proposed structure is a Government
owned Special Purpose Company (SPC)
being the owner of the project and
arranging the funding supported by
Government through:
A guarantee on the pay back on
bonds, loans and interest.
Some SPC equity or similar long term
financing not requiring interest.
Annual government contribution for
the first 5-10 years to cover the
negative cash flow.
In the Project Finance structure the
national and regional financial
institutions provide for the required
funds under a loan of bond type of
structure. In a Project Finance structure
the Government (through a 100 %
Government owned special purpose
company (SPC) is the owner of the
FEASIBILITY STUDY AND DESIGN NEW DEMERARA RIVER CROSSING
FINAL REPORT
DOC NO.: GGFD-R-014 REV 0 | AUGUST 17TH, 2017
55 / 57
Project (bridge facilities) and takes out
the financing. The bridge is operated by
the SPC.
The Financial Feasibility has concluded
that in the Project Finance option the
funding could very well be arranged by
the financial markets in Guyana and the
region. There seems to be sufficient
liquidity and appetite with the financial
institutions to provide the required
funding for the Project against
commercial terms and conditions. For the
foreign currency a borrowing sovereign
guarantee is required. On Guyana
currency borrowing softer collateral may
be arranged.
An alternative structure is to seek private
parties willing to engage themselves in a
BOOT project. These parties will take care
of the financing which may be better than
can be funded by Government. However
project costs are higher and the BOOT
business case must result in sufficient risk
coverage and profit for the private
partner and as a result may require
higher toll rates or Government
contribution. It is expected that similar
guarantees from Government will be
required as in the case of Project Finance.
The BOOT requires ad investor to execute
the project arranging the financing
himself. The Government provides a
concession for the bridge and may be
required to provide some additional
support and/or financial contribution. It is
difficult to say if private partners are
willing to do so, also viewing the history
of previous BOOT projects as well as the
country risk related to long term
commitment in local infrastructure. Full
Government guarantees will be required
on revenues. In the procurement parties
with attractive BOOT solutions may be
selected.
In a concessional structure development
institutions or governments provide
funding against soft terms. This option
was not further considered due to the
long time it will take to arrange. The
government seeks a swift implemen-
tation of the project.
14.4 Impact of bridge locations and
configurations on the financial
modelling
Revenue differences between the
different bridge locations are rather
small, as well as different configurations
as traffic is compelling. Purely from a
financial point of view the alternative
which has the lowest investment cost,
requires the smallest government subsidy
and would be the preferred alternative.
FEASIBILITY STUDY AND DESIGN NEW DEMERARA RIVER CROSSING
FINAL REPORT
DOC NO.: GGFD-R-014 REV 0 | AUGUST 17TH, 2017
56 / 57
15 Risk management
In order to find the best solution,
Consultants have made best efforts in
estimating the investment costs as well as
the market conditions for finance. Both
are estimated as median values, meaning
that final numbers may spread and be
higher of lower. There is no safety margin
in the cost as well as the revenue
numbers, as else the decision making
process is influenced by the safety margin
taken. The expected spread needs to be
managed in the development process.
The following most important risks
include in the development stage:
Changes in interest in the market,
resulting to increase of debt service
before bonds are issued.
Higher construction cost than
estimated, due to market
developments, market approach,
scope changes, risks division and
unexpected events.
After commissioning the main risks are:
Acceptance by the public of the
increase in toll.
Stagnating growth of traffic,
providing lower revenues than
forecasted.
Generally the risks in the development
stage are to be managed by a flexible
approach in what can be realized at the
moment of contractual and financial
close. Scope management must be
performed together with the private
partner to reduce costs if needed by
scope management. Such also include
links and viaducts to be developed in a
phased way and if possible alternative
funding sources to be looked for.
Positive developments in costs or
revenues can be used to reduce the
Government contribution.
Risk management during construction
requires a sufficient budget for
unforeseen,. It is advised to shift most of
the risks to the contractor at possibly
higher cost as measures to reduce costs
in this stage are marginal.
To manage risks after commissioning a
good communication strategy to the
public is essential. The moment
construction is visible toll rates to be
increased gradually to the required level
during may help to accept the new rates.
It also may assist in reducing the pre-
financing costs.
Traffic always will grow, but the pace may
be much lower. Growth rate under the
forecast is a cash flow problem the
positive side is that future investments
will be delayed. Government has a large
influence on bridge traffic by its policies
regarding housing, locations of schools
and hospitals as well as employment
generation on the West Bank.
As a result it is recommended to adopt a
flexible approach in the development of
the Project, a careful monitoring of the
process and timely steering, as well a
budget for unforeseen.
FEASIBILITY STUDY AND DESIGN NEW DEMERARA RIVER CROSSING
FINAL REPORT
DOC NO.: GGFD-R-014 REV 0 | AUGUST 17TH, 2017
57 / 57
DISCLAIMER
Traffic forecasts, cost and schedule
estimates as well as the assessments of
the reaction of the market and public
included in this report and its annexes are
based on the Consultant’s interpretation
of data collected and investigated as at
the date hereof, and are susceptible to
change for a variety of reasons including
but not limited to economic conditions,
government actions or inactions,
unforeseen physical conditions, world
financial market, construction market
developments, public attitudes, etc.
Users of this report are deemed to be
aware of the foregoing limitations, and
shall therefore use the content of this
report at their own responsibility.
Annexes
Annex 1. Traffic Projections Demand
Annex 2. Site Investigation
Annex 3. Analysis Road System
Annex 4. Shipping Analysis
Annex 5. Conceptual Design River crossing
Annex 6. Initial Environmental and Social Impact Assessment Report
Annex 7. Economic Feasibility
Annex 8. Financial Feasibility
Annex 9. Basic Design
Annex 10. Financing and Funding Plan
Annex 11. Basic Design Drawings
Annex 12. Basic Design Cost Estimation