Embed Size (px)
Citation preview

THE FEASIBILITY STUDIES ON SONOCHEMICAL PROCESSES
FOR TREATING USED OIL:
TOXIN REDUCTION FOR ELIMINATING RECYCLE INTERFERENCE
by
Chia-Yu (Iris) Yang
A Dissertation Presented to the FACULTY OF THE GRADUATE SCHOOL
UNIVERSITY OF SOUTHERN CALIFORNIA In Partial Fulfillment of the
Requirements for the Degree DOCTOR OF PHILOSOPHY
(ENVIRONMENTAL ENGINEERING)
December 2008
Copyright 2008 Chia-Yu (Iris) Yang

ii
ACKNOWLEDGEMENTS
I am deeply grateful to my advisor, Prof. T. F. Yen, for his consistent support and
encouragement during my unexpected long period of study at USC. Thanks are also due
to my other committee members: Prof. M. M. Pirbazari and Prof. K. S. Shing for their
invaluable comments and suggestions. To other professors from whom I have taken
courses and consulted, I would like to express my appreciation as well.
I wish to express my sincere appreciation to all my colleagues and associates in
Dr. Yen’s group, particularly Dr. Jason Chen, who help me to initiate my interest in
research during the early years of my study here. And I also wish to thank Dr. Jau Ren
Chen, Dr. Frank Shiu, Dr. Joon Park, Mr. Ricky Li, and Dr. Kai Dunn. Their kind
assistance and discussion often inspire me and help me finish my research work. I also
feel an immense gratitude to some wonderful close friends in ENE program at USC, to
Dr. Ann Chang, Dr. Jesse Tu, Dr. Eric Wu, and Dr. Walter Den for their friendships and
companionships.
Finally, I sincerely express my gratitude to my family from the heart, especially
my parents for their generous support over the years, to my sister and brothers for their
love, patience, understanding, and encouragement. This dissertation would not mean
nearly as much to me if it were not for the joy that I know it would bring to them. I
dedicate this dissertation to them.

iii
TABLE OF CONTENTS
ACKNOWLEDGEMENTS ii
LIST OF TABLES viii
LIST OF FIGURES x
ABSTRACT xiii
CHAPTER 1: INTRODUCTION 1
CHAPTER 2: OVERVIEW OF TOXINS IN USED LUBE OIL 10
2.1 Lubricant Oil 10
2.1.1 Base Oils from Petroleum 10
2.1.2 Automotive Lube Oil 13
2.1.3 Used Lube Oil 14
2.2 Used Lube Oils and Their Impacts on Human Health and the Environment 16
2.2.1 Introduction to Used Oil 16
2.2.2 Proper Management of Used Oil 19
2.2.3 Consequences of Releasing Used Oil to the Environment 20
2.3 Review on Existing Recycling and Reuse Options for Used Oils 22
2.3.1 The Importance of Recycling and Reusing of Used Oils 22
2.3.2 Burning for Energy Recovery 24
2.3.3 Reprocessing 26
2.3.4 Re-refining 26
2.3.5 Reclaiming 32
2.3.6 Biochemically-Converting into Valuable Bioproducts 34
2.3.7 Survey on Used Oil Markets and Current Recycle/Reuse Programs 34

iv
2.4 Toxin Reduction and Their Interference in Recycle/Reuse Practices 35
2.4.1 Techno-Economic Evaluation 35
2.4.2 Problems with Contaminants and Associated Hazardous
Byproducts
38
2.4.3 Destruction or Removal of Toxins 40
2.5 A Biochemical Process that Converts Used Oils into Valuable
Products
42
2.5.1 Hydrocarbon to Protein Technology 42
2.5.2 Process Modification and Adjustment by Brookhaven
National Laboratory
43
2.5.3 Problems Encountered in BNL Process 49
2.5.3.1 Products with Poor Quality 49
2.5.3.2 Inconsistency of the Products 52
2.5.4 Proposed Solutions for Problems Encountered in BNL
Process
54
2.5.4.1 Selection of Appropriate Used Oil Feedstock 55
2.5.4.2 Pretreatment by Chemical-Aided Ultrasonic Irradiation 56
2.6 Sources of Used Oil Samples 56
CHAPTER 3: THEORETICAL BACKGROUND 61
3.1 Ultrasound 61
3.1.1 Introduction 61
3.1.2 Free Radicals by Ultrasound 62
3.1.2.1 Aqueous System 62
3.1.2.2 Non-Aqueous System 65
3.1.3 Ultrasonic Applications in Environmental Studies 65
3.1.3.1 Decomposition and Degradation of Pollutants at
Laboratory Scale
65
3.1.3.2 Environmental Cleanup Applications – Case Studies 70
3.1.4 Ultrasonic Applications in Fossil Fuel Related Studies 72
3.1.5 Proposed Chemical-Aided Ultrasonic Treatment on Used Oil 72
3.1.5.1 Micelle and Reverse Micelle in Water-in-Oil Emulsions 74
3.1.5.2 Free Radical Reactions 77

v
3.2 Adsorption 79
3.2.1 Introduction 79
3.2.2 Pysisorption and Chemisorption 85
3.2.3 Adsorbents 86
3.2.4 Destructive Adsorption 87
3.3 Water Separation Techniques 90
3.3.1 General Consideration 91
3.3.2 Membrane Filtration Technique 91
3.3.3 Centrifugation Technique 92
3.3.4 Heating/Microwave Heating Technique 92
3.3.5 Chemical & Electrical Methods 93
3.4 Specific Analytical Techniques for Oil Components 93
3.4.1 Moisture Content 93
3.4.2 Organic Hydrocarbons (BTEX, chlorinated compounds, PAHs, and
PCBs)
94
3.4.3 Heavy Metals 95
3.4.4 Sulfur Content 95
3.4.5 Information of Water/Oil Emulsions 97
3.4.6 Other Evaluation Techniques 98
CHAPTER 4: DESTRUCTION OF HEAVY METALS ON USED LUBE OILS 100
4.1 Introduction 100
4.2 Preliminary Tests Design 100
4.2.1 Factors Affecting the Sonochemical Process 100
4.2.2 Experimental Design – Sonochemical Process 101
4.2.3 Experimental Design – Adsorption Process and Destructive
Adsorption Process
107
4.2.4 Characteristics of the Used Oil Samples in This Study 109
4.2.5 Water-in-Oil Emulsions 112
4.2.6 Difficulties Encountered in Analytical Work 113
4.2.7 Results from Preliminary Tests on Reduction of Heavy Metals from
Used Oil
115

vi
4.3 Optimal Conditions for Destructive Adsorption of Heavy Metals from
Used Oil
122
4.3.1 Water Effect 122
4.3.2 Hydrogen Peroxide Effect 124
4.3.3 Oxidative vs. Reducing Environment 124
4.4 Concluding Remarks 127
CHAPTER 5: DESTRUCTION OF BTEX COMPOUNDS IN USED LUBE
OILS
128
5.1 Introduction 128
5.2 Preliminary Test Runs 128
5.2.1 Factors and Experimental Design 128
5.2.2 Materials and Methods 128
5.2.3 Results of Preliminary Tests on Reduction of BTEX Compounds
from Used Oil
129
5.3 Optimal Conditions for Destructive Adsorption of BTEX Compounds from
Used Oil
140
5.3.1 Water Effect 140
5.3.2 Sodium Borohydride Effect 140
5.3.3 Oxidative vs. Reducing Environment 143
5.4 Concluding Remarks 145
CHAPTER 6: CONCLUSIONS AND RECOMMENDED FUTURE WORK 146
6.1 Summary and Conclusions 146
6.2 Recommended Future Work 148
REFERENCES 150
APPENDICES
Appendix A. Detailed Engineering Layout for the Hydrocarbon to Protein
Process
161

vii
Appendix B. Physical and Health-Hazard Properties of Selected Target
Compounds
165
Appendix C. Survey on Used Oil Markets and Current Recycle/Reuse Programs
in Selected Countries
171

viii
LIST OF TABLES
Table 2-1. Typical Contaminants Found in Used Oils. 16
Table 2-2. Typical Levels of Contaminants Found in Used Oils. 23
Table 2-3. Used Oil not Exceeding any Specification Level is not 25
Subject to this Part When Burned for Energy Recovery.
Table 2-4. Typical Re-refinery Process Stream Characteristics. 32
Table 2-5. PAH Analysis of Re-refined Oil. 41
Table 2-6. Comparisons between Ion Exchange Resin and Biomass from 43
H→ P Process.
Table 2-7. The Worldwide Hydrocarbon to Protein Production in 1975. 41
Table 2-8. Elemental Analysis for Two Original Used Oil Samples. 50
Table 2-9. Removal of Toxic Metals from Used Oil KS1 and KS2 (in %) 53
Table 2-10. Biomass Growth on Used Oils. 54
Table 3-1. The Effect of Physical Parameters on Cavitation. 63
Table 3-2. Selected Examples for Ultrasonic Treatment on Aqueous Pollutants. 67
Table 3-3. Definitions: Adsorption. 80
Table 3-4. Definitions: Powders. 81
Table 3-5. Definitions: Porous Solids. 82

ix
Table 4-1. Comparison of Particle Size, Pore Size, and Surface for 108
Various Adsorbents.
Table 4-2. Characteristics of Oil Samples Used in This Study. 110
Table B-1. Physical and Health Hazard Properties of Heavy Metals. 166
Table B-2. Physical and Health Hazard Properties of BTEX Compounds. 167
Table B-3. Physical and Health Hazard Properties of Chlorinated Hydrocarbons 168
Table B-4. Physical and Health Hazard Properties of PAHs. 169
Table B-5. Physical and Health Hazard Properties of PCBs. 170

x
LIST OF FIGURES
Figure 2-1. Simplified Schematic Diagram of a Typical Refinery. 11
Figure 2-2. Schematic Diagram of Base Oil Production. 12
Figure 2-3. Simplified Used Oil Reprocessing System. 27
Figure 2-4 Simplified Schematic Diagram of a Re-Refining Process for 31
Used Oil.
Figure 2-5. The Effect of Virgin Oil Prices on Payments Made to 37
Generators for Used Oil.
Figure 2-6. The Flow Diagram of the Hydrocarbon to Protein (H → P) Process. 44
Figure 2-7. Current BNL Process at Laboratory Scale. 46
Figure 2-8. Product Yield from Current BNL Process. 47
Figure 2-9. The Method Used in Fast Food Chain Stores to Determine the 60
Remaining Useful Life of the Cooking Oil in Deep-Fat Frying.
Figure 3-1. Schematic Diagram for Remediation of the Ultrasonic-Aided 71
Leachate Treatment System.
Figure 3-2. PCB Soil Detoxification Process. 73
Figure 3-3. Micelle Reversion under Ultrasonic Irradiation. 76
Figure 3-4. Cross Section of a Hypothetical Porous Grain Showing Various 85
Types of Pores
Figure 3-5. Possible Schematic Expression for the Destructive Adsorption 89
Reaction.
Figure 4-1. Experimental Design for Preliminary Studies. 103

xi
Figure 4-2. Schematic Diagram of the Batch System for Ultrasonic 105
Irradiation Reactions.
Figure 4-3. The Effects of Ultrasound and H2O2 on Heavy Metals in Used Oil. 116
Figure 4-4. The Effects of Ultrasound and Water (Under Oxidizing or 117
Reducing Environment) on Heavy Metals in Used Oil.
Figure 4-5. The Effects of Water and H2O2 on Heavy Metals in Used Oil. 119
Figure 4-6. The Effects of Ultrasound and Alkaline Solution on Heavy Metals 120
in Used Oil.
Figure 4-7. The Effects of Different Adsorbent Following Ultrasonic 121
Irradiation on Zn Removal from Used Oil.
Figure 4-8. The Effects of Water Content on Heavy Metal Removal from 123
Used Oil.
Figure 4-9. The Effects of Hydrogen Peroxide Content on Heavy Metal 125
Removal from Used Oil.
Figure 4-10. The Effects of Oxidative or Reducing Environment on 126
Destructive Adsorption of Heavy Metal Removal from Used Oil.
Figure 5-1. The Effects of Ultrasound and H2O2 on BTEX Compounds in 130
Used Oil.
Figure 5-2. The Effects of Ultrasonic Irradiation Time on BTEX Compounds 132
in Used Oil.
Figure 5-3. The Effects of Water and H2O2 on BTEX Compounds in Used Oil. 133
Figure 5-4. The Effects of Ultrasound and Water on BTEX Compounds in 134
Different Used Oil.
Figure 5-5. The Effects of Ultrasound and Water (Under Reducing 135
Environment) on BTEX Compounds in Used Oil.

xii
Figure 5-6. The Effects if Ultrasound and Water (Under Oxidizing or 136
Reducing Environment) on BTEX Compounds in Used Oil.
Figure 5-7. The Effects of Ultrasound and Alkaline Solution on BTEX 138
Compounds in Used Oil.
Figure 5-8. The Effects of Different Adsorbents Following Ultrasonic 139
Irradiation on BTEX Compounds in Used Oil.
Figure 5-9. The Effects of Water Content on BTEX Compounds Removal 141
from Used Oil.
Figure 5-10. The Effects of Sodium Borohydride on BTEX Compounds 142
Removal from Used Oil.
Figure 5-11. The Effects of Oxidative or Reducing Environment on 144
Destructive Adsorption of BTEX Compounds Removal from
Used Oil.
Figure A-1. Biomass Production from Oil Wastes: Fermentation Section. 162
Figure A-2. Biomass Production from Oil Wastes: Lipid Extraction and 163
Product Drying Section.
Figure A-3. Biomass Production from Oil Wastes: Detergent Wash Section. 164

xiii
ABSTRACT
Biochemical processes are well known for their superior performances in the
upgrading of heavy crude oils. Based on a similar experimental strategy, a new
technology was developed using biochemical process for the conversion of fossil fuel
wastes into valuable biomaterials. The technology, developed by Brookhaven National
Laboratory and based on a well-developed “Hydrocarbon to Protein” technology, is able
to convert used oils to commercially valuable products through a biochemical process.
Production and utilization of fossil fuels generate wastes that contain EPA priority
pollutants, such as polyaromatic hydrocarbons (PAH) and toxic metals. Used oil, which
often contains metals, chlorinated hydrocarbons and other organic compounds, including
many that are listed as EPA priority pollutants, is a good example that is generated at a
rate of more than 1.5 billions gallons per year in the U.S. As a result, the associated
impact to the environment is huge when there is uncontrolled dumping and landfilling of
used oil in the environment. Used oil is a valuable resource and a vital source of energy;
it still has lubricating value and heat value. Following the proper treatment to remove
contaminants, used oil can be re-refined into base lube oil, reprocessed as fuel oil, or used
as feedstock to produce petroleum-based products or other commercially valuable
products via different processes. The high contamination levels in some used oils,
however, increase the difficulties in the operations and generate hazardous byproducts as
secondary pollutants. A large portion of the recycled used oil is combusted for energy
utilization (often creates air pollution problems) or thermally destroyed by incineration
(only when the oil has a high concentration of toxic contaminants that makes recycling

xiv
impractical or unsafe).
For BNL’s process, preliminary results showed that biomass generated from used
oil contains 90% delipidated biomass and 10% lipids. The live biomass, delipidated
biomass, and lipid have been proved successful in many applications and have high
market values. However, there are problems encountered in the process, such as the poor
quality and inconsistency of the bioproducts. The contaminants in the used oil are toxic
to the bacteria strains used in the biochemical process and lower product yields. Another
concern is the potential bioaccumulation of these toxins in the bioproducts. A proper
pretreatment process is necessary to remove these toxins from the used oil stock to
enhance the yield efficiency of the bioconversion process and improve the quality of the
bioproducts.
A chemical-aided ultrasonic irradiation method is proposed to remove/degrade the
toxins from used oil. Target contaminants that need to remove from used oil include
heavy metals, chlorinated hydrocarbons, BTEX compounds, PAHs, and PCBs.
Ultrasound irradiation is widely used in environmental cleanup applications to
remove/degrade many toxic compounds in contaminated soils and waters; it is proven to
be effective on many fossil fuel related applications, including upgrading and recovery.
Free radical chain reaction is believed to be the dominant reaction to cause the effects in
these systems. Ultrasonic irradiation has the ability to initiate and enhance the free
radical generation from both water molecules and hydrocarbons. Hence, it could
effectively remove/degrade the toxins in used oil with appropriate chemical additions. If
technically and economically proven feasible, the chemical-aided ultrasonic irradiation
process may be used not only as the pretreatment step for BNL’s biochemical process,

xv
but could also become a pretreatment package in other used oil recycling and
reprocessing options.
To develop a pretreatment package for BNL’s process (biocoversion of used oil),
the chemical-aided ultrasonic irradiation is server as the basic terminology.
Accompanied by destructive adsorption process, the removal efficiency for the
decontamination of used oil is greatly enhanced. Optimal operating conditions will be
examined and from the results of this study, it seems that this process is a feasible option
to pre-treat toxic contaminants before further recycle or reuse options are applied to used
oil.

1
CHAPTER 1
Introduction
Used oil is a valuable resource and a vital source of energy. Oil does not wear out;
it just gets dirty after use. Thus, used oil still has lubricating value and heat value.
Following the proper treatment to remove contaminants, used oil can be re-refined into
base lube oil, reprocessed as fuel oil, or used as feedstock to produce petroleum-based
products or other commercially valuable products via different processes.
Why is the proper management of used oil such an important issue? It is
important because used oil often contain metals, chlorinated hydrocarbons and other
organic compounds, including many that are listed as priority pollutants by the U.S. EPA.
If used oil is mismanaged, the effects upon the environment will be detrimental. Since
used oil is generated in large quantities, estimating more than 1.5 billions gallons per year
in the U.S., that the associated impact to the environment is huge when there is
uncontrolled dumping and landfilling of used oil in the environment. Spilled or dumped
used oil on land can reduce soil productivity and seep into the groundwater to
contaminate our water sources. According to EPA, just one quart of used oil can make 1
million gallons of water undrinkable. When used oil enters surface water, oil films will
block sunlight, impair photosynthesis, and prevent the replenishment of dissolved oxygen,
which lead to the death of aquatic plants and animals. When used oil is dumped down
the drain and enters a sewage treatment plant, very small concentrations of oil in the
wastewater (50 to 100 ppm) can foul sewage treatment processes. Used oil drainage has

2
been reported to account for more than 40% of the total oil pollution (the largest single
source) to American waterways. In addition, both used oil and used oil filters are not
regulated as hazardous waste in most states and allowed to be disposed in municipal
landfills. Hence, the associated environmental problems are unquestionable.
Two major sources of used oil are automotive and industrial used oil. Automotive
used oil tends to have a high concentration of potentially hazardous heavy metals, usually
as the result of the engine or bearing wear, or the inclusion of these metals in oil additives.
Industrial used oil tends to have a high level of chlorinated hydrocarbons and PCBs
through careless management practices. The presence of other toxic organic compounds
like benzene or naphthalene is usually associated with the oil formulation itself.
Currently, the recycling and reuse of used oil are limited to a few options. From
the standpoint of energy conservation, recycling used oil efficiently saves a precious,
nonrenewable resource. The most encouraged option, even by governments, for reuse of
the used oil generated by consumers, is to recycle it back to base lube oil. It does not
only save a tremendous amount of time and money, but more importantly helps to
conserve our natural resources. Used oil can be combusted for energy utilization or
thermally destroyed by incineration. Due to the economic benefit of recycling used oil,
only a very small quantity of used oil is currently incinerated. The oil that is incinerated
generally has a high concentration of toxic contaminants that makes recycling impractical
or unsafe. One of the most common applications for recycled oils is reprocessing them to
be used as fuels. In some cases, however, the contamination levels in used oil are too
high. As a result, it increases the difficulties in the reprocessing operations. Moreover,

3
the hazardous byproducts generated in the recycling processes become secondary
pollutants that are even more difficult to handle.
Production and utilization of fossil fuels generate wastes that contain EPA priority
pollutants, such as polyaromatic hydrocarbons (PAH) and toxic metals. These wastes can
be used as feedstock for biochemical processes. For example, studies showed that
biological methods are capable of recovering metals, especially strategic metals, from
fossil fuel effluents and wastes; the fossil fuel effluents include those derived from coal,
geothermal, oil sand, oil shales and heavy/light petroleums. The recovery of uranium
from black shale was proven feasible, as was the recovery of vanadium and nickel from
petroleum, germanium and molybdenum from coal, and titanium from tar sands. Thus,
biochemical processes can alleviate environmental problems associated with fossil fuel
wastes and produce valuable bioproducts at the same time. Bacteria grown on oil wastes
can be used as biosorbent materials, which is selective and efficient for environmental
clean-up works including radionuclides removal from contaminated water. In addition,
biosurfactants and biopolymers can be produced from oil waste cultures as byproducts.
The produced biopolymers have demonstrated to be effective in enhancing oil recovery
from oil reservoirs. The process is based on using biopolymers to control the sweeping
front in oil recovery.
Biochemical upgrading of petroleum on some crude oils has been proven to cause:
(1) qualitative and quantitative changes in the light and heavy fractions of crudes; (2) a
decrease in asphaltene fraction with a concurrent increase in the concentration of
saturates, aromatics, and resins; (3) a decrease in organic sulfur and nitrogen content with

4
a concurrent biochemical conversion of polar compounds into lighter molecular weight
ones; and (4) a decrease in trace metals concentration, such as V, Ni, As, and Se.
The above findings initiated the development and/or modification of biochemical
processes for the conversion of fossil fuel wastes into valuable biomaterials. The
experimental strategy, based on the experiences gained in the past which deal with the
biochemical upgrading of heavy crude oils, serves as a model in the development of the
new technology. Since 1994, we here at USC have worked with Brookhaven National
Laboratory on a project sponsored by DOE to develop a biochemical process that
converts used oils to commercially valuable products. The basis of the process is adapted
from a well-developed “Hydrocarbon to Protein” technology. Preliminary results showed
that the biomass generated from used oil contains 10% lipids and 90% delipidated
biomass. The live biomass concentrate has been successfully demonstrated in the
bioremediation of oil waste contaminated soil. The delipidated biomass (rich in protein)
is projected to be sold as high protein animal feed. Also, its ability as ion-exchange
materials in uptaking and adsorbing heavy metals has been confirmed. The purity and
properties of the 10% lipids from the process have not yet been evaluated, but potential
markets for these natural and biodegradable lipids are raw material for surfactants,
cosmetics, and medicine.
The change in virgin crude oil price directly affects recycling options for used oils.
If higher-value products other than petroleum products can be recovered or produced
from used oils by some new technologies, larger profit margins could be generated than
those from reprocessed oil or re-refined oil. Unfortunately, not many research studies are

5
making developments for new recycling options of used oils. It is the uniqueness as well
as the superiority of the biochemical process that converts used oils into commercially
valuable products.
The contaminants in the used oils may be toxic to the bacteria strains that are used
in the process and may lower product yields. Another concern is the potential
bioaccumulation of these toxins in the bioproducts. A proper pretreatment process is
necessary to remove these toxins from the used oil stock before it was sent to the
fermentor. Not only the yield efficiency of the bioconversion process would be higher,
but the quality of products can also be improved. When this process is upscaled to a
commercial-size plant, the plant can accept a broader range of used oils as the feedstock
for the process.
At the same time, efforts were made to compare other recycling and reprocessing
options for used oils, and how the toxins were removed from their processes.
Unfortunately, toxin problems are not treated as important issues in most cases. It is
found out that toxins either end up in wastestreams as secondary pollutants to be treated
or simply are released into our environment to cause other problems; they are seldom
destroyed during the process. From environmental point of view, it is not solving the
problem, but rather just passing the problem to another.
A chemical-aided ultrasonic irradiation method is proposed to remove/degrade the
toxins from the used oil. Target contaminants that need to remove from used oil include
heavy metals, chlorinated hydrocarbons, BTEX compounds, PAHs, and PCBs.
Ultrasound irradiation is widely used in environmental cleanup applications to

6
remove/degrade many toxic compounds in contaminated soils and waters; and it is also
proven to be effective on many fossil fuel related applications, including upgrading and
recovery. Free radical chain reaction is believed to be the dominant reaction to cause the
effects in these systems. Ultrasonic irradiation has the ability to initiate and enhance the
free radical generation from
both water molecules and hydrocarbons. Hence, it could effectively remove/degrade the
toxins in used oil with appropriate chemical additions. If technically and economically
proven feasible, the chemical-aided ultrasonic irradiation process may be used not only as
the pretreatment step for BNL’s biochemical process, but could also become a
pretreatment package in other used oil recycling and reprocessing options.
Previous joint efforts with BNL on the biochemical conversion process include
survey on bacteria for bioconverting oil into bioproducts, evaluation on the properties of
bioproducts for capacity and selectivity, and survey on potential markets for bioproducts.
For future work focused on toxin removal/destruction to enhance product yield
and to improve product quality, kinetic studies on the toxins and oil properties analyses
will be the basis for process design in scale-up and pilot-plant studies. By conducting
specific analytic techniques on oil components to assure the adequacy and quality of the
optimal used oil feedstock for the process, product yield and product quality can then be
optimized. Economic analysis for an industrial scale operation will be conducted based
on the modification of the current technology and the add-on pretreatment process. The
outlines of the objects of this study and the research scopes include: (1) proper selection
of used oil samples and optimization of their variations in oil to water ratio;

7
(2) preparation of used oil samples suitable for this research study; (3) choice of specific
analytical techniques for oil components; (4) identification of all the factors for the
chemical-aided ultrasonic irradiation reactions on used oil and optimization of the best
operating conditions; (5) tests on other treatment options in combination with the
chemical-aided ultrasonic irradiation process for better efficiency.
For the limited amount of used oil recycled each year in the United States, current
options for reuse are mainly: reprocessing to fuels or re-refining into base lube oil. These
two options, however, are not creating big profit margins to attract investors into the
business because the profit margins largely depend on the price of crude oils, which is at
a quite steady low in recent years. New technologies to convert used oil into value-added
products are necessary to encourage the recycling of used oil instead of illegal dumping
or disposing the used oil into the environment. The biochemical process developed at
Brookhaven National Laboratory proved to generate various bioproducts from used oil
for many applications and markets. Toxic materials, however, are widely found in used
oil, especially many that are from EPA priority pollutant list. These toxins are creating
problems in the recycling and reprocessing operations; they sometimes are concentrated
and released to the environment to become secondary hazardous wastes. It is essential to
develop a pretreatment process to remove the undesirable toxins for the existing
biochemical process or other used oil recycle and reuse options.
In this research, a chemical-aided ultrasonic irradiation process is proposed for the
decontamination of used oil. Its ability to degrade (not only remove) toxins commonly
found in used oil, such as heavy metals (e.g., As, Ba, Cd, Cr, Pb, and Zn), chlorinated

8
hydrocarbons (CFC-12, CFC-113, and TCE), PAHs and PCBs, is evaluated. Factors that
may affect the feasibility and efficiency of the proposed method will be identified and
optimized in future studies. Besides batch type reactions, continuous flow system will
also be suggested for a better approach, similar to an industrial scale operation.
In this study, different recycling and reprocessing options for used oil that are
currently in practice, are studied. The method by which the contaminants are removed
from their processes is also identified if possible. The proposed method, combined with
simple polishing steps, may also be used as a pretreatment process for other options as
well as for BNL’s biochemical process if technically and economically proven feasible.
The chemical-aided ultrasonic irradiation method is designed to investigate the
feasibility in the decontamination of used oil, i.e., remove or degrade the toxic
compounds. Initial studies will focus on a better understanding of used oil characteristics,
water-in-oil emulsions, and vesicles/micelles. Actual used oil samples collected from
commercial recyclers were used in this study. Specific analytical techniques for the
characterization of used oil components and evaluation of the degradation performances
was also being studied.
The entire dissertation is divided into six chapters. In Chapter 2, the general
reviews on the background as well as properties of both used lube oils and possible
contaminants found in used lube oil. And some of their current treatment alternatives
will be described. Chapter 3 is the theoretical discussion. It begins with the introduction
of ultrasound techniques and followed by adsorption process and destructive adsorption
process, which are used in later research. In Chapter 4, the destruction of heavy metals

9
from used oil samples by ultrasound irradiation, adsorption, destructive adsorption is
described. In Chapter 5, the destruction of BTEX compounds from used oil samples by
ultrasound irradiation, adsorption, destructive adsorption is described. The last chapter,
Chapter 6, contains important conclusions in this dissertation, and recommendations for
future research.

10
CHAPTER 2
Overview of Toxins in Used Lube Oils
2.1 Lubricant Oils
2.1.1 Base Oils from Petroleum
Modern lubricants are mostly formulated from a wide range of base fluids and
different packages of chemical additives. The majority of the base fluids is produced
from the refining of crude oil since large crude oil refining operations can produce base
oils with high quality and excellent performance at an economical price. Base oil
composition may vary depending on the crude oil it is made from. For different
applications, lubricants are formulated by blending different base oils and additives to
meet a series of performance specifications. Hence, formulations and performance
specifications for automotive lubricants, industrial lubricants, aviation lubricants, and
marine lubricants are greatly different.
In a modern refinery, base oil plants (lube plants) are integrated with the
mainstream refinery process. Overall production capacity for lubricant base oils is only a
very small part (about 1 percent) of the total refinery production lines. Figure 2-1
indicates where a lube plant fits into a typical refinery process scheme and the inter-
relationship between each step. Figure 2-2 is a typical process scheme for base oil
production in which the numbers roughly indicate the relative amount of the
intermediates and final products throughout the manufacturing process.

Gases
VacuumDistillation
Alkylation
Gasoline
Deasphalting
Lube Base Oils
AtmosphericDistillation
Crude Oil
Fuel Oil
Bitumen
Figure 2 1 Simplified Schematic Diagram of a Typical Refinery Source Mortier 1997 - . . ( : , )
Desulphurization
CatalyticCracking
Lube Plant
Kerosine
Diesel / Gasoil
Reforming
11

Figure 2-2. Schematic Diagram of Base Oil Production. (Source: Mortier, 1997)
Gas Oil
VacuumDistillation
Extraction Dewaxing Hydrofinishing
Dist. 1
Dist. 2
Dist. 3
DeasphaltingVacuumResidue
(40)
(26) (32) (8) (1)
(24)(25)(33)
(14)
(21)
(18)
(12)
Base Oils
AtmosphericResidue (100)
Bitumen orFuel Oil
AromaticExtracts
Wax LightFuels
12

13
The feedstock for this process is the residue from atmospheric distillation, which
represents only about 50% of the original crude oil in a mainstream refinery process.
2.1.2 Automotive Lube Oil
For special performance specifications, automotive lube oil has unique
characteristics different from industrial lube oils. The most important responsibility of
the automotive lube oil is to form a layer between metal surfaces of various engine parts
so that friction and wear is minimized. It also serves as a sealant to fill the microscopic
ridges and valleys in any metal surfaces to increase the engine’s efficiency.
Lube oil also acts as the coolant in the automatic transmission and engine. It
helps to take away the heat from the combustion of fuel as well as from friction. In
addition, it serves as a cleaning agent to carry away dirt or other debris that may damage
the bearings or other parts that are operated in tight tolerance. Debris is removed through
the engine oil filter or the transmission filter. The detergent additives in the auto lube oil
can combat the combustion by-products. Burning gasoline or diesel fuel produces acids,
moisture, soda, ash and other contaminants. Hence, detergent would fight these by-
products and inhibit their buildup as sludge or varnishes.
In order to meet the performance specification as mentioned above, a specific
additive package is required to prolong the oil’s life and improve oil’s protective qualities.
The major additives in automotive lube oils are listed as follows:
★ Detergents: to keep high temperature engine parts clean and free from deposits.

14
★ Dispersants: to suspend and disperse sludge- and varnishes-forming materials
and prevent them to clog the engine.
★ Anti-wear: to add film strength to prevent wear of heavily loaded surfaces.
★ Friction modifiers: to reduce the friction losses throughout the engine.
★ Corrosion inhibitors: to fight the rust and wear caused by acids and moisture.
★ Oxidation inhibitors: to prevent oil and oxygen combination (produces damaging
materials) and to reduce thickening of the oil and sludge formation.
★ Foam inhibitors: to limit the growth of bubbles and break them up quickly in the
oil, allow the oil pump to only circulate oil, not oil and air throughout the engine.
★ Viscosity Index (VI) improver: to fight viscosity change with temperature
variations.
★ Pour point depressant: to improve the oil’s ability in winter to flow at very low
temperature.
2.1.3 Used Lube Oil
Additive packages blended into base oils range from 10 to 20 percent, by volume,
of the finished lubricants. Performance of the lubricants deteriorates over time as the
additives are chemically changed and the oil becomes contaminated (Mueller Associates,
1989). Contamination sources could be:
(1) the breakdown of the additives and their subsequent reaction;
(2) soot and lead from engine blowby;
(3) dirt and dust; metal particles from engine wear;

15
(4) residual gasoline or diesel fuels from incomplete combustion;
(5) water from combustion, blowby vapors, and rain water/salt water ingress;
(6) the mixing or dumping of other materials (chemicals or other oil types) into
used oil.
Some industrial lubricants, such as transformer oils and hydraulic fluids, can be
treated relatively easily and recycled. They can be readily collected and segregated
without potential cross contamination. These oils may be regenerated to a recognized
standard and returned to the original source while automotive engine oils often require a
more sophisticated treatment to regenerate usable base fluids to acceptable quality.
Automotive used oils tend to have high concentrations of potentially hazardous
heavy metals. Industrial oils tend to have high levels of chlorinated hydrocarbons and
PCBs. The contaminants typically found in used oils are listed in Table 2-1 (Energy and
Environmental Research Corp., 1989). It should be noted that most of these
contaminants are known to be carcinogenic and listed as priority pollutants by the U.S.
EPA. More detailed information about the physical and health-hazard properties for
these contaminants can be found in Appendix B.

16
Table 2-1. Typical Contaminants Found in Used Oils.
Metals Chlorinated Hydrocarbons Other Organic Compounds
Cadmium Dichlorodifluoromethane Benzene
Chromium Trichlorotrifluoroethane Toluene
Arsenic Tetrachloroethylene Xylene
Barium 1,1,1-Trichloroethane Benzo(a)anthracene
Zinc Trichloroethene Benzo(a)pyrene
Lead Total chlorine Naphthalene
PCBs
2.2 Used Lube Oils and Their Impacts on Human Health and the Environment
2.2.1 Introduction to Used Oil
What is used oil? According to Chapter 40 of the Code of Federal Regulations
(40 CFR), Part 279 (Standards for the Management of Used Oil), the definition of used
oil is any oil that has been refined from crude oil, or any synthetic oil, that has been used
and as a result of such use is contaminated by physical or chemical impurities.
According to the California Integrated Waste Management Board, any oil that has been
refined from crude oil and has been put to use is “used oil”. The term “used oil” also
applies to any oil that is no longer useful to the original purchaser as a consequence of
extended storage, spillage or contamination with non-hazardous impurities such as dirt

17
and water. On May 20, 1992, EPA published a listing decision for used oils destined for
disposal. EPA decided not to list these used oils as hazardous wastes according to the
technical criteria for listing in Sections 1004 and 3001 of the Resource Conservation and
Recovery Act (RCRA) and Sections 26.1.1 I(1)(1) and (3) of 40 CFR. Used oil handlers
must determine whether the used oil exhibits a characteristic of hazardous waste. If so,
the handlers must dispose of the waste in accordance with the hazardous waste
regulations in 40 CFR. Disposal of non-hazardous used oil must be performed in
accordance with the Criteria for Classification of Solid Waste Disposal Facilities and
Practices (40 CFR, Part 257) and the Criteria for Municipal Solid Waste Landfills (40
CFR, Part 258). In California and four other states, used oil is listed as a hazardous waste
(Cal. IWMB, 1998). The hazards associated with the used oil come from the various
additives used in its manufacture and from contaminants picked up from use in the
internal combustion engine. More information about used oil will follow in Section 4.
According to Robert Arner of the Northern Virginia Planning District
Commission, in 1994 approximately 90% of the used oil filters in the United States were
disposed of in landfills. This resulted in 17.8 million gallons of oil and 161,500 tons of
steel going to waste. Both of these resources could have been recycled instead.
EPA has exempted used oil filters from hazardous waste requirements since May
of 1992, as long as they are not constructed of terne plate steel (a lead/tin alloy). They
believed that a hazardous waste listing might discourage recycling and result in more
uncontrolled disposals. The basis of the ruling was made from a study of the toxicity
characteristics (TC) of 46 used oil filters. This study found that none of the 35 light-duty

18
vehicle filters that were tested exhibited TC; however, low levels of lead, chromium,
cadmium, and benzene were detected (Peaslee, 1994). On the other hand, it was
determined that five out of the 11 heavy-duty vehicle filters (terne-plated) exhibited TC
for lead. Once the oil filters are collected, they are sent to processing facilities to be
drained of oil (regulations require that filters be hot drained). The filters are then crushed
into flat pucks, compressed into cubes or hemispheres, shredded, or dismantled. This
steel is then available for recycling and re-manufacturing into many different products.
Today, more people are aimed at promoting researches in the field of recycling oil filters
(Peaslee, 1995) so that further pollution, caused by used oil filters which end up in the
landfills, can be stopped.
Non-hazardous used oil (at most states) and sorbent mixtures, by federal law, can
be disposed in landfills as long as they pass the Paint Filter Test. Free liquids, including
oil, have been prohibited in the hazardous waste landfill since RCRA promulgated in
1980. Effective on Oct. 9, 1993, municipal landfills can no longer accept liquid wastes,
including used oil. EPA requires sorbent materials that contain hazardous liquids to be
mechanically processed using a centrifuge or wringer to remove free liquids for land
disposal. Disposal procedures consist of combining conventional used sorbent material
with used oil in a 55-gal steel drum and sending it to a landfill; the cost per drum is
between $150-$350. Many used oil generators are seeking a new sorbent technology in
order to reduce their disposal expenses (Mouche, 1995).

19
2.2.2 Proper Management of Used Oil
If managed properly, used oil is a valuable resource that can be reused either as a
base stock for new lubricants or as a fuel. Only when mismanaged, used oil can threaten
human’s health, damage the environment, and cause long-term liability for the costs of
environmental cleanup upon generator or subsequent handlers.
On May 20, 1992, EPA decided that used oil destined for disposal is not a listed
hazardous waste (U.S. EPA, 1992a). Federal regulations mandate that used oil must be
tested to determine if the used oil is hazardous before it is disposed. If testing or other
procedures find that the oil is hazardous, it must be disposed of as a hazardous waste
under RCRA Subtitle C (U.S. EPA, 1996b). If the used oil is not hazardous, it must be
disposed of in accordance with other federal regulations, such as RCRA Subtitle D (U.S.
EPA, 1996a). In either case, the regulatory requirements are designed to prevent used oil
from endangering human health and the environment.
Furthermore, on September 10, 1992, EPA decided not to list used oil destined for
recycling as a hazardous waste (U.S. EPA, 1992b). EPA determined that used oils that
are properly managed and recycled do not significantly threaten human health or the
environment. Since EPA’s Used Oil Management Standard requires used oil to be
managed in an environmentally safe manner, listing used oil that is to be recycled as a
hazardous waste is not necessary. It is very important, however, to keep used oil from
being contaminated with other hazardous wastes, otherwise, the risks to human health
and the environment will greatly increase, and the costs for proper management will
significantly rise.

20
2.2.3 Consequences of Releasing Used Oil to the Environment
According to EPA, just one quart of used oil is able to make 1 million gallons of
water undrinkable. When used oil enters surface water, oil films will block sunlight,
impair photosynthesis, and prevent the replenishment of dissolved oxygen, which lead to
the death of aquatic plants and animals. When used oil is dumped down the drain and
enters a sewage treatment plant, very small concentrations of oil in the wastewater (50 to
100 ppm) can foul sewage treatment processes. Used oil drainage has been reported to
account for more than 40% of the total oil pollution (the largest single source) to
American waterways (API, 1996). Used oil filters are not regulated as hazardous waste
for most states and are allowed to be disposed in municipal landfills. Serious problems
for the groundwater supplies surrounding the landfills are caused by residual oils from
the filters that leach into the ground. Hence, practicing a good used oil recycling
management is an important step for municipal solid waste reduction (Tchobanoglous,
1993).
Used oil that is dumped onto soil can be washed into surface water by rain or
snow, or it can seep through the soil into groundwater to contaminate our water sources.
Used oil in the soil can also evaporate into the air. The contaminants in used oil that
enter the air through evaporation or improper burning can then settle, or be washed by
rain or melting snow, into surface water or onto soil. The only way to make sure that
used oil will not contaminate either water, soil, or air is to make sure that it is not released
into the environment at all.

21
Since used oil is generated in such large quantities, estimating more than 1.5
billion gallons per year in the U.S., the associated impact to the environment is
tremendously serious when there is uncontrolled dumping and landfilling of used oil in
the environment. EPA data show that more than 33% of used oils generated each year in
the U.S. are illegally dumped. The most uncontrollable used oil source is those do-it-
yourself oil changers (DIYers). According to EPA, only 5 percent of used oil generated
by DIYers is recycled, and the rest is either burned onsite (4 percent), disposed of in trash
(30 percent) or illegally dumped (61 percent). Lack of public education and awareness
and shortage of convenient recycling centers are main reasons why many DIYers do not
participate in the used oil collection program. Of course, they don’t mean to harm the
environment, most just simply don’t realize the damage they may cause through the
improper handling of used oil.
As shown in Table 2-1, there are many harmful constituents in the used oil that
may cause cancer or other health problems if they are inhaled or ingested. For example,
it was reported that burning used oil tagged as the top source of airborne lead emissions
(J. Air Waste Manage. Assoc., 1992), especially in those states where used oil is not
listed as hazardous waste and lead concentration in used oil is not regulated. Used oil,
therefore, is not prohibited for open burning even if lead is present at high concentrations.
Typical levels of contaminants found in used oils are summarized in Table 2-2.
These contaminants not only cause problems when they are released into the
environment through improper management, but sometimes also interfere with the
recycling/reusing operations of used oils. At other times, they are found to be

22
concentrated in the waste streams of the reprocessing or re-refining plants and can cause
further disposal problems.
2.3 Review on Existing Recycling and Reuse Options for Used Oils
2.3.1 The Importance of Recycling and Reusing Used Oils
Used oil is definitely a vital source of energy. Oil doesn’t wear out; it just gets
dirty after use. Used oil can be re-refined into base lube oil, reprocessed as fuel oil, or
used to as feedstock to produce petroleum-based products or other commercially valuable
products via different methods. There are some facts about conserving resources by
proper handling of used oil. Re-refining used oil takes about 1/3 of the energy needed to
refine crude oil to lubricant quality; and one gallon of used lube oil that is re-refined
produces the same 2.5 quarts of lubricating oil as 42 gallons of crude oil does (API, 1996).
Collecting and recycling used oil, therefore, not only protects our environment from used
oil contamination, but also conserves a valuable non-renewable resource.
From the standpoint of energy conservation, recycling used oil efficiently saves a
precious, nonrenewable resource. Only one out of 70 barrels of crude oil is processed
into virgin lube stock. That’s why many oil companies spend billions of dollars on
exploring, recovering, and refining crude oil into quality lube oil. If the used oil
generated by consumers can be recycled back to useful products such as pure lube oil
again and again, tremendous time and money can be saved. More importantly, our
natural resources will be conserved.

23
Table 2-2. Typical Levels of Contaminants Found in Used Oils.
Categories
Components
Automotive Used Oil
Concentrations (ppm)
Industrial Used Oil
Concentrations (ppm)
Metals
Arsenic 5-25 ppm NG
Barium 50-500 ppm NG
Cadmium 2 ppm NG
Chromium 3-30 ppm NG
Lead 100-1200 ppm NG
Zinc 100-1200 ppm NG
Chlorinated Hydrocarbons
Dichlorodifluoromethane ⎫ NG
Trichlorotrifluoroethane ⎪ NG
Tetrachloroethylene ⎬ ⇒ 1000-4000 ppm ⎫
1,1,1-Trichloroethane ⎪ ⎬ ⇒ 1000-6000 ppm
Trichloroethylene ⎭ ⎭
Total chlorine 1000-4000 ppm 1000-6000 ppm
Other Organic Compounds
Benzene 100-300 ppm 100-300 ppm
Toluene 500-5000 ppm 500-5000 ppm
Xylene 500-5000 ppm 500-5000 ppm
Benzo(a)anthracene 10-50 ppm NG
Benzo(a)pyrene 5-20 ppm NG
Naphthalene 100-1400 ppm NG
PCBs NG*-20ppm 100 -1000 ppm
Note: * NG indicates negligible amount detected

24
Many industries found that the capital investment on on-site used oil regeneration
or reuse in the plant returns at a comparable rate, therefore, eliminates a lot of disposal
costs (Nemerow, 1991).
2.3.2 Burning for Energy Recovery
Used oil can be thermally destroyed by incineration or combusted for energy utilization.
Due to the economic benefit of recycling used oil, only a very small quantity of used oil
is currently incinerated. The used oil that is incinerated generally has high concentrations
of toxic contaminants that make recycling impractical or unsafe. Burning used oil is to
utilize oil’s heating value and reduces the consumption of the non-renewable fossil fuels. It can
create significant environmental problems however, by releasing major and trace elements and
organic contaminants to the atmosphere. Proper flue gas pollution control equipment should be
equipped with the cement kilns or industrial/utility boilers to minimize this problem. Otherwise,
only the used oil that meets specified standards for maximum contaminant levels and minimum
heating values can be burned. According to 40 CFR Part 266, all used oil collectors for the
purpose of resale as fuel must document whether or not the waste meets the standards as outlined
in Table 2-3.
EPA has to regulate used oil burning because toxic contaminants can end up in
the smoke and ashes. A service station, county garage or other small site user does not
need a regulatory permit for burning used oil if ALL the following conditions are met:
★ The heater is designed to have a maximum capacity of not more than
500,000 BTUs per hour.

25
★ The heater burns only used oil that the owner or operator generates or that is
received from do-it-yourselfers who changed their oil at home.
★ Absolutely nothing has been added to the used motor oil -- no antifreeze, no
solvents, and no other liquids.
★ The heater is vented to the outdoors.
Table 2-3. Used Oil not Exceeding any Specification Level is not Subject to this Part When Burned for Energy Recovery*. (from 40 CFR, Part 279.11)
Constituent/Property Allowable Level
As < 5 ppm
Cd < 2 ppm
Cr < 10 ppm
Pb < 100 ppm
Halogens < 4000 ppm**
Flash Point 100° F minimum
PCBs < 50 ppm
Note: * The specification does not apply to mixture of used oil and hazardous waste that
continue to be regulated as hazardous waste.
** Used oil containing more than 1000 ppm total halogens is presumed as hazardous
waste unless analyses indicate otherwise.

26
2.3.3 Reprocessing
One of the economically attractive ways to manage used oil is to burn it as fuel.
Thus, most used oil being reprocessed is utilized as fuel. Compared to direct burning, the
major advantage from reprocessing used oil is that it improves the burning quality of
used oil by removing/reducing some contaminants. A typical used oil reprocessing
system is simplified as shown in Figure 2-3. Processes such as adding chemicals, heating,
filtration, and centrifugation or combinations of the above can separate the undesirable
constituents from valuable portions. Odor produced from nitrogen and sulfur species is
the greatest concern in operating these facilities. Severe corrosion may occur in the
equipment when acidic gases from additive elements and water vapors combine during
the process. In reality, processing used oil is a widespread industry in the U.S., although
mostly in small operations. There are more than 200 reprocessors around the country
(Arner, 1992). Reprocessors and re-refiners often have to compete with each other to
acquire used oil stock from independent transporters. Reprocessing, however, is a much
more readily available recycling option than re-refining.
2.3.4 Re-refining
Used oil can be re-refined into base lube oil. Lube oil is a premium substance that
can be re-refined and reused again and again. In general, water and dissolved low boiling
point organic are removed by atmospheric or moderate vacuum distillation. Lube oil is
then recovered and fractionated by distillation. Light ends byproducts are commonly used
for plant combustion fuels. Diesel fraction and gas oil fractions can be recovered as high

27
Air
, W
ate
rE
mis
sio
ns
;S
lud
ge
fro
mTan
k B
ott
om
s
Fig
ure
2-3.
Sim
plif
ied
Use
d O
il R
epro
cess
ing
Sys
tem
. (S
ourc
e: A
rner
, 199
2)
Used
Oil
Co
llecti
on
an
dS
tora
ge
Co
ars
eF
iltr
ati
on
Sett
lin
g/
He
ati
ng
Min
imu
m T
reatm
en
t Tra
in
Wa
ste
Dis
po
sal
Ha
zard
ou
s v
s.
No
nh
azard
ou
sW
aste
Dete
rmin
ati
on
Ad
dit
iona
lTre
atm
en
tO
pti
on
s
Cen
trif
ug
e
Fin
e F
iltr
ati
on
/C
en
trif
ug
e
Ble
nd
ed
wit
hV
irg
in P
rod
uct
or
Oth
er
Used
Oil
s
Che
mic
al
Ad
dit
ion

28
quality byproducts after further advanced treatment. Residual streams from distillation
can be used by asphalt industry as an asphalt flux to produce roofing asphalt, paving
asphalt, insulating materials, and other asphalt based products.
The major differences among all the processes are in how additives, impurities
and sludges are removed. Considering technical feasibility, economical profitability, and
operational easiness, re-refining processes are narrowed down to combinations of solvent
treatment, distillation, hydrotreating, vacuum distillation, clay polishing, chemical
treatment, and demetallization. Marketability of products and byproducts will affect the
combination choices of the processes. Processes, which do not generate hazardous
wastes that are difficult to handle, will be preferred in the future. Another problem is that
the retail acceptance of recycled refined base oils in their blends, not because of quality
issues, but mainly because of public acceptance. The public needs to learn that re-
refining of used motor oil is a very sophisticated process that produces high quality base
lube oil. Re-refined oil carrying the API logo meets the same high quality standards as
lube oil made from crude oils.
Although there are many companies devoting their efforts to developing
technologies for re-refining used oils, profitable used oil re-refining has not been so
widespread due to the high capital and operating cost. The two major base oil re-refiners
in the U.S. are Safety-Kleen (Chicago, IL) and Evergreen Oil (Newark, CA).
Safety-Kleen collected approximately 155 million gallons of used oil, oily water,
and anti-freeze through its branches in 1996. From this total, the collection fee averaged
approximately $0.26 per gallon. Customers begin to recognize the benefits of re-refining

29
and are willing to pay a higher price to have their used oil removed and processed for
reuse. During this year, Safety-Kleen increased its re-refining capacity at its facilities in
East Chicago, Indiana, and Breslau, Canada, to a combined annual capacity of 135
million gallons.
For Evergreen Oil, the current capacity of the re-refinery is 15 million gallons per
year of used lubricating oil feed, which is converted to a high-quality distillate to be used
as Secondary Feed to fluid catalytic cracking plants at nearby refineries (Oil & Gas J.,
1997). The distillate is also suitable for hydrofinishing to produce high-quality lube base
oils. The capacity is planned to double during 1998. The plant is also able to process 30
million gallons per year of oil-contaminated water. This capacity will be increased to 50
million gallons during 1998.
Both Safety-Kleen and Evergreen Oil are using the most recent and advanced
technology -- distillation/hydrotreatment. The process is as shown in Figure 2-4. Not all
available used oil streams are selected to proceed through this process. The better
feedstocks include automotive and railroad crankcase oils, hydraulic and transmission
fluids, and other high quality used oil streams. Potential feedstocks with high water,
excessive contamination, or animal fats are processed as fuel. After pretreatment and
thin-film distillation, the base oil fraction is then hydrotreated under moderate conditions
and yields a range of base oil streams with different viscosities. By-products from this
process are low boiling distillates, gas oils, and non-hazardous asphaltic residues. Metals
are removed in the distillation step while higher-boiling halogenates and polar
compounds are removed in hydrotreating step, thereby reducing the acid number

30
(Brinkman, 1991). Table 2-4 shows the typical re-refinery process stream characteristics
(Pyziak, 1993). Emissions and waste streams from this type of process are limited in
comparison to other older technologies (e.g., treatments by acid/clay, solvent extraction,
and distillation/clay). That’s the reason why recent researches relating re-refining used
oil technologies are mostly concentrating on how to improve the hydrotreating processes
(Bhan, 1986; Brinkman, 1987). Safety-Kleen and Evergreen Oil both distribute re-
refined lubricants, and sell the base oils to be blended by other lubricant marketers in the
United States. Three major oil companies are blending premium quality additive
packages with re-refined base oils, Lyondell Lubricants (Enviroil line), Unocal (Firebird
line), and Chevron (ECO line, Environmentally Conscious Oil line). On June 30, 1988,
EPA issued procurement guidelines for re-refined oil. All federal agencies, and all state
and local government agencies and contractors that use federal funds to purchase such
products, are required to implement a preference program favoring the purchase of re-
refined oil to the maximum extent practicable. President Clinton’s Executive Order on
Recycling further require that by April 20, 1994, federal agencies implement guidelines
for the procurement of re-refined oil-base lubricants for all government vehicles.
Increased consumer, industrial, and government demand taking the lead in the “buy
recycled” movement can create and expand the market for the re-refined oil. The
government can lead the way in building the market for this critical environmental
product and demonstrate that the obstacles of price and performance are proven to be
overcome. A growing market can also successfully overcome distribution and
availability problems.

31
Fig
ure
2-4
. Si
mpl
ifie
d S
chem
atic
Dia
gram
of
aRe-
Ref
inin
g P
roce
ss f
or U
sed
Oil
.
(M
odif
ied
from
Saf
ety-
Kle
en O
il R
ecov
ery
Co.
)
Used
Oil
10
0-N
eu
tra
lB
ase O
il
Reje
cti
on
of
Inap
pro
pri
ate
Feed
Sto
cks
Gas
oil R
eco
vere
da
s R
efin
ery
Fu
el
Fra
cti
on
ati
on
Lu
be O
ilD
isti
lla
tes
Deh
yd
rati
on
Tra
nsp
ort
to
Ble
nd
er
to M
ak
e in
to F
inis
hed
Lu
bri
can
ts
Ch
em
ical
Pre
-tre
atm
ent
Vac
uu
mD
isti
llati
on
300
-Neu
tral
Bas
e O
il
Hyd
rotr
eati
ng
Reac
tor
Asp
ha
lt F
lux S
trip
ped
off
th
e B
ott
om
an
d S
oli
dfo
r R
oo
fin
g M
ate
rials
Wate
r as S
tre
am
is C
oo
led
an
dD
isch
arg
ed
to
Mu
nic
ipal S
ew
ag
eTre
atm
en
t

32
Table 2-4. Typical Re-refinery Process Stream Characteristics.
Feedstock Used oil
Distillation Feed
Hydrotreat Feed
Final Product
Light Heavy Light Heavy
Water % 20 < 1 < 1 < 1 - -
Flash pt. °C > 100 215 154 193 182 210
Cl, ppm 2800 2700 1150 800 < 50 < 50
S, ppm 4000 4000 3000 3000 600 600
Zn, ppm 550 550 < 1 < 1 < 1 < 1
Pb, ppm 70 70 < 1 < 1 < 1 < 1
Re-refined lube oil has to meet strict standards and must be approved by API. It
has to contain at least 40% by volume re-refined oil in the base stock and contain limited
amounts of certain toxic chemicals in base stock:
★ Organic halide < 5ppm total
★ PCBs < 1 ppm total
★ RCRA solvent waste < 1 ppm
★ Metals (Cd, As, Cr, Pb, Ba, Zn < 10 ppm, individual < 2 ppm)
★ Benzo(a)pyrene and benzo(a)anthracene < 5 ppm each
The re-refining of used motor oil is a very efficient process. According to
Evergreen Oil Refinery, 1.41 gallons of wet used motor oil can yield 1 gallon of re-
refined motor oil. Comparing this value to crude oil refining, it would take about 84

33
gallons of crude to yield 1 gallon of motor oil (data from American Petroleum Industry
based on 1995 average yields for U.S. refiners). Of course, we cannot simply compare
those ratios and conclude that refining from crude oil is inefficient. Refining crude oil
obtains a large amount of fuels of various types. Below is the comparison of refining
from used motor oil and refining from crude oil.
Refining one unit of crude oil yields: Re-refining one unit of used motor oil yields:
• 84% fuels (46% gasoline, 38% others) • 5% fuels
• 9% gases • 14% asphalt
• 4% coke • 10% water
• 3% asphalt and road oil • 71% lube oil
• 3% petrochemical feedstocks
• 1% lube oil
2.3.5 Reclaiming
The use of waste lubricants for alternate, less strenuous lubricant applications is a
common practice. Some specific types of industrial oils can be readily segregated and
are suitable for relatively simple reprocessing before being returned to their original
service. Both of these types of recycling are referred to as reclaiming. Typical
processing methods involve filtration and removal of water and volatile decomposition
products under vacuum.
Large industrial customers can arrange for on-site reprocessing (e.g.,
reconditioning of transformer oils at power generation plants), or can collect specific

34
drain oils for off-site reprocessing and return (e.g., reclamation of railway diesel engine
oils). These types of customer-specific reprocessing can be cost-effective when
compared to the expense of new lubricating oils.
2.3.6 Biochemically-Converting into Valuable Bioproducts
The change in virgin crude oil price can directly affect the used oil recycling
options. If the crude oil prices drop, petroleum product prices will fall accordingly.
Gasoline and fuel oil prices track crude oil prices very closely, while lubricating oil
prices react very slow with crude oil price changes since lube oil contains many additives
and other components that add to the final product cost. A drop in crude oil price will
decrease the value of reprocessed oil sold as a fuel supplement and as well as lower the
re-refiners’ revenues. If higher-value products other than petroleum products can be
recovered or produced from the used oil by some new technologies, larger profit margins
could be generated than reprocessed oil or re-refined oil as expected. Unfortunately,
almost no research studies are related to the field that is exploring other recycle/reuse
options for used oils. It is the uniqueness and superiority of the biochemical process to
convert used oils to commercially valuable products.
2.3.7 Survey on Used Oil Markets and Current Recycle/Reuse Programs
Used oil is not only a big problem for the United States; it also creates problems
in every single country since it generates such large quantities of waste. In the process of
evaluating the feasibility of adaptation of the biochemical process for the used oil

35
worldwide, efforts were done in surveying annual quantities of used oil generated and
existing recycle/reuse programs in different countries (API, 1997). Regulatory structure
and enforcement ability on used oil management differs with the country’s size and
political structure. Facilities in each country may also be significantly different from one
another. There were studies stating that used oils may have unique geological
characteristics from place to place (Information Transfer Inc., 1974). It is important for
an individual to acknowledge that it’s not good enough for an individual only not pollute
his own backyard and that everyone must learn to protect the entire environment, no
matter where they are standing on this earth. That’s why we feel that it is crucial for
every country to understand the importance of recycling/reusing the used oils (it counts
one of the biggest waste streams in many countries). The survey on used oil market and
current recycle or reuse programs in some selected countries is attached as Appendix C.
2.4 Toxin Reduction and Their Interference in Recycle/Reuse Practices
2.4.1 Techno-Economic Evaluation
The price of virgin oil dramatically affects the used oil management system
because used oil competes with virgin oil as a source of fuel and as a base stock for
lubricating oil. Like all recycling markets, recycled oil products must be sold at a lower
price than virgin oil products in order to compete. Used oil recyclers must cover the
costs of collecting and recycling used oil, as well as maintain a profit to stay in business.
When the virgin oil price is high, the used oil recyclers make large enough profits that
they can pay generators for the used oil they produce or the transporters for the used oil
36
they collect. When the virgin oil price drops, the used oil recyclers can then have a little
profit margin to pay (or must charge) generators or transporters. Figure 2-5 shows how
the price of virgin fuel oil can affect the used oil generators.
When recyclers and transporters pay for used oil, the service stations, quick-lube
shops, fleet operations, and DIY collection centers have an incentive to have their used
oil recycled off site. As a result, high virgin oil price encourages used oil processing and
re-refining. Conversely, low virgin oil price encourages the onsite burning of used oil
(U.S. EPA, 1994). How to choose a cost-effective recycling option, therefore, depends
on the projected price of virgin oil. Other than that, protecting human health and the
environment must always be the main concern. Choosing the most environmentally
sound used oil management method will minimize potential liability costs and eliminate
fines and other costs associated with enforcement actions for violating environmental
regulations.
Re-refined base oil from used lube oil in general, in comparison to the quality and
technology of virgin base oil, is proven to be economically viable when payments for
feed, production costs, by-product credits and product sell price are all accounted for
(McKeagan, 1992). In some cases, re-refiners have a pay back period as low as 1.4 years
(Ali, 1995), which is more profitable than virgin lube producers and would definitely be
attractive to potential investors.
In order to make BNL’s biochemical process become techno-economically
feasible and fully commercialized, there are some important scopes to achieve. First of
all, improvement on the quality of the bioproducts (live biomass, lipidic biomass, and

37
JAN 1986 JAN 1987 JAN 1988 JAN 1989 JAN 1990
0.10
0.05
0.01
0.01
0.05
0.10
0.15
0.30
0.40
0.50
0.60
0.70
0.80 P
oste
d P
rice
of
Vir
gin
Fuel
Oil
($/
gal)
Price Paid to Generator for Used Oil
Free Zone No Payment No Charge
Charge to Generator
($/g
al)
Worl d Wide Oil Glut
Severe Winter 1989-1990
Iraq Attack on Kuwait
Figure 2-5. The Effect of Virgin Oil Prices on Payments Made to Generators for
Used Oil. (Source: Nolan, 1990)

38
delipidated biomass) will help to ensure these products can be sold to the markets at
higher prices to create larger profit margins. Secondly, if possible, used oil stock from
either generators or transporters needs to be acquired at reasonable price. Large used oil
reprocessors or re-refiners always have their own fleet or collection system to lower the
operation cost on feedstock. The commercialized biochemical plant would have to
compete with these existing facilities in acquiring used oil stock. Lastly, since the
market/application for the bioproducts are not limited to only one option, more profits
actually, should be expected instead of other options.
2.4.2 Problems with Contaminants and Associated Hazardous Byproducts
When the chemical-aided ultrasonic irradiation method was proposed as the
pretreatment process for BNL’s biochemical process, we looked into the possibility to
adopt this method as the pretreatment step for other used oil recycling/reusing processes
if it proves to be economically feasible. Since the undesirable toxic contaminants in used
oil that cause problems in other reclaiming, reprocessing or re-refining operations are the
same.
For reclaiming operation, since only a minimum simple step is applied on the
used oil, the remaining fuel dilution and cracked hydrocarbon molecules often limit
lubricant performance. Acids and metals that are not completely removed may act as
catalysts and may further degrade or shorten the useful life of oil. Additional costs and
long-term liability of the water, fuels, sludges, and residues generated by the drying and

39
filtering process must be considered. These new wastes may need to be further treated
onsite or sent to landfills or incineration plants.
For reprocessing operation, as mentioned earlier, odor produced from nitrogen
and sulfur species is the greatest concern. Severe corrosion may occur in the equipment
when acidic gases from additive elements and water vapors combine during the process.
These problems can be avoided and eliminated if the trouble-making components
removed from the process as early as possible. Wastes generated from each step also
need further handling.
For re-refining operation, less problems are presented. Heavy metals are removed
from the dewatered oil components at the distillation step and then ended in asphalt flux,
while higher-boiling-point halogenates and polar compounds are expected to be removed
in the hydrotreating step. Refer to Table 2-4, it is obvious that chlorinated and sulfur
compounds are not removed until the last hydrotreating step. Unfortunately, data on how
other organic toxins are removed during each step or the concentrations in the final
products are not publicly available. It was claimed by Evergreen Oil that all those
organic contaminants are removed from the distillation step, however, it is really hard to
make believe. Refer to Appendix B, it is obvious that many contaminants have very high
boiling points, which make them end up either in the asphalt flux or gas oil to become the
problem for the byproducts or possibly still stay in the lube oil distillates and go through
the process. According to data compiled from PAHs analyses on many re-refined oils
from different sources/countries (by Biochemisches Institut für Umweltcarcionogene in
Hamburg), PAHs are found in re-refined oil samples at a higher level than those found in

40
unused base oil (see Table 2-5). Some of them do not meet the API standards for
allowable PAHs (individual PAHs < 5ppm) in re-refined base oil (however, the
guidelines for quality acceptance of re-refined base oil in Europe is less stringent
compared to in U.S., for example, 3% for PAH). This may indicate that current re-
refining techniques are not effective enough to remove all PAHs from used oil. The
remaining levels of other organic contaminants in the final re-refined base oil products
are not determined or emphasized for some sensible reasons.
2.4.3 Destruction or Removal of Toxins
From the above comparison, it should be fully understood that, no matter for what
recycling/reusing option, there are many benefits if toxic materials are removed in the
early steps of the entire process. Not only are there fewer problems to interfere the
operation, but a better product quality can also be achieved.
From the environmental point of view, however, the “destruction of toxins” is a
better option than just a “removal of toxins” option. Since toxins removed from used oils
are eventually generated into wastes in some form with their original hazardous
characteristics, further treatment or handling of these hazardous wastes (air, water, sludge)
is still needed. In fact, this sometimes creates other problems in almost all
recycling/reusing operations. Thus, a process that can “degrade” or “decompose” these
toxins to less toxic materials would be favorable because it will eliminate any further
potential environmental hazards.

Table 2-5. PAH Analysis of Re-refined Oil. (Source: Mortier, 1997)
PAH Concentration of Oil Sample (ppm)
Individual PAH Virgin
reference oil 1 2 3 4 5 6 7 8 9
Fluoranthene 0.02 6.74 1.64 2.77 3.26 0.14 1.42 1.78 0.03 0.05
Pyrene 0.42 5.33 2.75 7.16 9.19 0.42 0.60 20.66 0.26 0.36
Benzo(b)naphtho(2,1-d)thiophene
0.34 0.89 1.02 2.29 0.60 0.07 1.24 0.38 0.04 0.03
Benzo(ghi)fluoranthene+ benzo(c)phenanthrene
0.01 1.02 0.11 0.37 0.21 0.12 0.19 0.29 0.03 0.04
Cyclopenta(cd)pyrene <0.01 0.01 0.13 0.05 0.06 <0.01 0.11 0.08 <0.01 <0.01
Benz(a)anthraceane 0.08 5.39 1.05 1.62 2.84 1.13 0.30 0.34 0.07 0.08
Chrysene + triphenylene
2.10 9.47 2.89 4.16 12.65 1.73 6.65 6.26 1.23 1.36
Benzofluorantenes (b+j+k)
0.28 6.84 0.98 1.20 12.32 4.37 2.34 4.93 4.53 5.36
Benzo(e)pyrene 0.41 3.56 1.04 1.41 14.46 6.28 0.65 6.51 11.25 11.20
Benzo(a)pyrene 0.01 0.83 0.--53 0.60 1.65 2.82 0.13 0.31 0.47 0.47
Indeno(1,2,3-cd)pyrene 0.06 0.31 0.22 0.30 2.37 2.30 0.08 1.40 6.10 9.33
Dibenz(a,h)anthracene <0.01 0.26 0.05 0.09 0.12 0.76 0.04 0.04 0.22 0.22
Benzo(ghi)perylene 0.53 1.63 0.86 1.14 5.05 11.49 0.40 5.97 38.50 36.30
Anthanthrene 0.03 0.12 0.09 0.21 0.11 0.16 0.11 0.08 0.60 0.60
Coronene 0.13 0.19 0.10 0.35 1.19 2.30 0.09 0.24 11.40 12.60
Known or suspect carcinogen
4.44 42.49 13.46 3.72 66.08 34.10 19.84 49.27 74.74 77.47
Total PAH content (3-7 rings)
7.5 87.3 22.6 52.5 93.5 49.5 30.2 112.0 67.7 126
41

42
2.5 A Biochemical Process that Converts Used Oils into Valuable Products
2.5.1 Hydrocarbon to Protein Technology
Prior to the early 1970s, Hydrocarbon to Protein Technology has been fully
developed and commercialized. In 1975, there were three major oil groups in the world
which distributed products of proteins from hydrocarbons over 100 million lb/yr, the
worldwide Hydrocarbon to Protein Production in 1975 is as shown below in Table 2-6
(Fong, 1975):
Products from the Standard Oil Company (India) plant were marketed as a human
food supplement, whereas that of BP plants were sold as an animal feed supplement, a
replacement for skimmed milk. Besides gas oil, n-paraffins, ethanol, methanol and
methane (natural gas) were chosen as the feedstock of hydrocarbon to protein process.
This process is especially popular in countries that heavily rely on corn or soybean
imports, for example, western European countries and Japan. Economic feasibility
depends on the price of the hydrocarbons and end use of the products. The most
important step in this technology is fermentation, since the product properties would
depend not only on the choice of feedstock, but also on the choice of microorganisms
(bacterium and yeast) used in the fermentation section. The individual process may be
somewhat different, yet quite similar. A simplified flow diagram of this H → P process
is shown in Figure 2-6. A more detailed engineering design for Hydrocarbon to Protein
Technology can be found in Appendix A.

43
Table 2-6. The worldwide Hydrocarbon to Protein Production in 1975.
Capacity Feedstock
Million lb/yr 1000 Tons/yr
British Petroleum (UK) 33 24.0 Gas oil, n-Paraffins
USSR 44 20.0 n-Paraffins
Standard Oil Co. (India) 10 4.5 Ethanol
Total 107 48.5
2.5.2 Process Modification and Adjustment by Brookhaven National Laboratory
The idea brought up in 1994 at Brookhaven National Laboratory (Biosystems and
Process Sciences Division, Department of Applied Science), Long Island, NY that to
utilize used oil as the starting material in the H → P process was ingenuous. No similar
research, using biological methods to recycle used oil into higher value products, was
performed before. However, bioremediation technology is not an uncommon practice in
clean up of oil polluted sites. It is worthwhile to make an effort to generate something
valuable out of dirty waste. Although the conversion rate or efficiency from used oil may
be lower than that of pure materials such as gas oil, paraffins, natural gas, or methanol.
The advantage is that used oil stock can be obtained for almost “free”. The government
encourages the recycling business by paying commercial collectors incentives for picking
up and managing used oils. In reality, the utilization of used oil as the feed would reduce

44
Oil Biocat. Plant
Fermenter
Products Aqueous layer
Wax product Dewaxed product slurry
Solvent Wax
Refinery
Separation
Cream product Aqueous phase
Drying processWaste water
treatment
Solvent extraction
Lipids Dried biomass
recycle Solvent and detergent extraction
Solvent recycle
Figure 2-6. The Flow Diagram of the Hydrocarbon to Protein (H → P) Process.

45
production costs. At the same time, our environment would have less of an opportunity
to become polluted.
Brookhaven National Laboratory (BNL) has developed a simplified lab-scale
process from H → P technology starting with used oil as feed (see Figure 2-7). The
product yield for each step is presented in Figure 2-8.
Live biomass concentrate was first directly used for the bioremediation of oil
waste contaminated soil. The tests show positive results in the degradation of oil waste
but the process is slow. Oxygen, water, organic fertilizer and inorganic elements such as
N, P, K and Mg may be added to maintain the process.
Biomass generated from the process can be separated into two categories: 10%
lipids, and 90% delipidated biomass. The analysis of the constituents is as follows:
• Delipidated Biomass (90%) • Lipid (10%)
Crude protein 66% Steroid esters 15%
Crude carbohydrate 27% Fatty acids 40%
Crude lipid 6.7% Phosphatidyle-ethanolamine 10%
Phosphatidyle-serine 15%
Phospholipids 10%
The delipidated biomass rich in protein can be sold as high protein animal feed for
$1000/ton. Its ability in the adsorption of heavy metals has also been tested. Adsorption
capacities of metals such as Be, Cr, Co, Cu, As, Cd, and Hg by the raw delipidated
biomass produced from different used oils proved that this product can replace high-cost

46
recycle
Used Oil Stock
Nutrient Feed
Fermenter
Centrifuge
Live BiomassConcentrate
Storage
Lipid Extraction
Biomass Storage
solvent Extract Storage
Dryer
Air Pump
Filter
Lipid Storage
Figure 2-7. Current BNL Process at Laboratory Scale.

47
1 kg of Used Oil
→ 100 liters
Bioconverted: 450 g = 45%
Unreacted: 55%
Crude Dried Biomass
Lipid: 45 g = 10 %
Delipidated Biomass: 400 g = 90%
Solvent Recycle
recycle
Figure 2-8. Product Yield from Current BNL Process.

48
ion exchange resin as an absorbent for metal ions. Although the adsorption capacity of
the delipidated biomass is only 1 meq/gram compared to 5 meq/gram for common ion
exchange resin, its $1/kg cost makes it very competitive in comparison to $200/kg for
resin. The distinctions between common ion exchange resin and the delipidated biomass
are listed in Table 2-7.
Table 2-7. Comparisons between Ion Exchange Resin and Biomass from H→ P Process.
Ion Exchange Resin Biomass from H→ P
Composition synthetic polymer natural polymer
Adsorption capacity 5 meq/gram 1 meq/gram
Selectivity toward ions highly selective highly selective
Stability for recycle use very stable moderate stable
Size (diameter) > 1000 μm 1 ∼ 2 μm
Cost ($/kg) 200 1
Other potential markets, which include known applications in mining & metal
concentration and environmental heavy metal pollution cleanup, still need more research.
The purity and properties of the 10% lipids from the process has not yet been
evaluated. Potential markets for these natural and biodegradable lipids could be raw
materials for surfactants (i.e., soap and detergent), cosmetics (i.e., body and facial cream)
49
and medicines (i.e., drug delivery). Market values will depend on the quality and purity
of the lipid biomass.
2.5.3 Problems Encountered in BNL Process
A laboratory pilot plant (50-gal capacity) has been successfully tested at BNL
using H→P technology. Economics evaluation and process design for the full-scaled
plant with 100,000 ton/yr biomass production are now in progress and seeking
cooperative partners. At this capacity, the plant can treat up to 10% of the annual used oil
currently dumped in the U.S. illegally. However, there are still some problems in this
pilot-scale stage that need to be solved before upscale work can proceed further.
Problems encountered during the development of the technology are explained below:
2.5.3.1 Products with Poor Quality
Some simple physico-chemical methods have been developed to convert any used
oil into a chemical form suitable for this biochemical process. Two used oil samples
were sent from the Los Angeles area to BNL for initial tests. Table 2-8 lists the
elemental analysis of these two used oil samples. It can be seen that some metal
concentrations are amazingly high. Pretreatment processes such as with celite, filtration,
or washing with filtration have been proven by Brookhaven Laboratory to effectively
remove most toxic metals up to 90-100%. In this manner, a broader spectrum of used oil
can be used as the feedstock of this process.

50
Table 2-8. Elemental Analysis for Two Original Used Oil Samples.
Concentration (ppm) KS-1 Oil KS-2 Oil
N in % 0.41 0.04
P2O5 1240 120
K 628 105
Na 1955 419
Ca 3597 523
Mg 960 593
Fe 55475 5967
Mn 428 65
Zn 1466 264
Cu 26 15.6
Pb 9.7 7.2
Cd 1.2 0.12
Co 5.1 3.1
Ni 33 41
Cr 9.7 5.3
Hg 44.4 22.2

51
Pretreatment techniques to remove other toxic organic constituents like
chlorinated hydrocarbons, BTEX, or PAHs, however, were not studied. Although the
possibility of the bioaccumulation effects attributed from these toxic organic compounds
was not well studied, concerns were raised about whether the bioaccumulation of these
toxic materials would affect the quality and public acceptance of the bioproducts.
In effect, it would be better to develop a pretreatment process or a combination of
pretreatment processes that can remove every undesirable compound that is toxic to the
bacteria strains in this process, and at the same time lower the possibility of
bioaccumulation in order to improve the product quality. The important part of this work
is to obtain the characteristics of used oil that is going to be the feedstock of this process
so that an appropriate pretreatment process can be decided. Another noticeable problem
is the unpleasant dark color of the bioproducts, especially since the market of these
bioproducts is aimed towards cosmetics or pharmaceutical applications (for lipidic
biomass). Hence, it greatly lowers the buyers’ interest. Since most used oil looks dirty
because the oil gets dirty after use, unless the color-causing compounds can be identified
and removed prior to the fermentation step, it may be difficult to improve the color from
the final products. For other applications, color may not be a very important issue, but it
is a better add-on benefit if the pretreatment process can also improve the color of the
products.
KS-1 Oil and KS-2 Oil were used oil samples collected from Los Angeles region
and shipped to Brookhaven Laboratory for fermentation tests. From Brookhaven’s data,
100% of metals like Cr, Mn, Co, Ni, Cu, Cd, Hg in used oils KS-1 and KS-2 can be

52
removed by one of the three pretreatment methods mentioned. Removal efficiency for Fe,
Zn, Sr, Ba, Pb in used oils KS-1 and KS-2 can reach 83% - 99.3% (see Table 2-9).
However, to separate the added washing water from oil after the pretreatment was a big
challenge for BNL and not yet successful. Water dispersed in used oil is quite stable and
it is hard to break the emulsion since used oil itself contains surfactants from the additive
packages. This would also be an important issue when we consider other pretreatment
methods.
2.5.3.2 Inconsistency of the Products
Several microbial strains were tested to grow on used oil KS-1 and KS-2 to
compare biomass yield from each strain in order to decide the better strain which
produced higher biomass yield for further use (see Table 2-10). Although most of the
metal contents were removed prior to the fermentation step, microbial strains with a
higher tolerance on heavy metals were considered for the initial studies.
It should be noted that even the same strain of microbes still possibly generate a different
biomass yield when it grows on different used oil. It is difficult to optimize conditions
for fermentation step here since the feedstock of used oil, in reality, may differ from
batch to batch depending on the sources. In the future, it will be important to know how
to pretreat the bulk-size feedstock to become a comparatively consistent source for
microbial strains to grow at the best condition and produce a maximum yield of biomass.
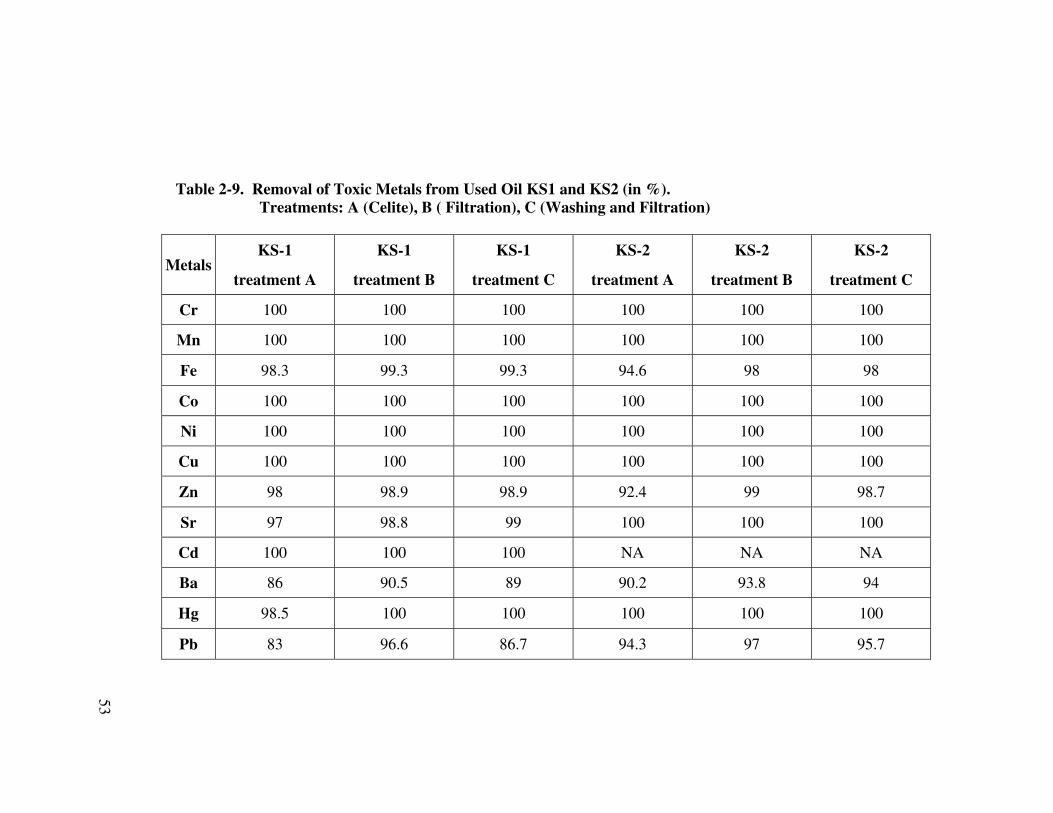
53
Table 2-9. Removal of Toxic Metals from Used Oil KS1 and KS2 (in %). Treatments: A (Celite), B ( Filtration), C (Washing and Filtration)
Metals KS-1
treatment A
KS-1
treatment B
KS-1
treatment C
KS-2
treatment A
KS-2
treatment B
KS-2
treatment C
Cr 100 100 100 100 100 100
Mn 100 100 100 100 100 100
Fe 98.3 99.3 99.3 94.6 98 98
Co 100 100 100 100 100 100
Ni 100 100 100 100 100 100
Cu 100 100 100 100 100 100
Zn 98 98.9 98.9 92.4 99 98.7
Sr 97 98.8 99 100 100 100
Cd 100 100 100 NA NA NA
Ba 86 90.5 89 90.2 93.8 94
Hg 98.5 100 100 100 100 100
Pb 83 96.6 86.7 94.3 97 95.7

54
Table 2-10. Biomass Growth on Used Oils.
(yield, gram of biomass/liter of culture)
Microbial Strains KS-1 Oil KS-2 Oil
Acinetobacter sp. 0.62
Pseudomonas sp. (1) 0.20 1.07
Pseudomonas sp. (1) with detergent 0.09 1.07
Pseudomonas sp. (2) 0.03
Candida sp. 1.20
2.5.4 Proposed Solutions for Problems Encountered in BNL Process
Initially, the responsibility shared in this research project with Brookhaven
National Laboratory is to gather information on worldwide markets of used oil and
current recycle/reuse options available, then to collect some used oil samples for the
initial tests on H → P process conducted in BNL. More efforts involved later include
survey on proper microbial strains, evaluation of the bioproducts, and survey on potential
markets for bioproducts. Problems arose when the bioproducts produced were not of
satisfactory quality concerns. Further worries and considerations about the toxic materials
originally present in used oil made an add-on pretreatment step a necessary and crucial
part of the biochemical process. Until these problems can be solved substantially, any
intention for scale-up and commercialization of the process is not possible to carry on.

55
So we were consulted to develop a pretreatment process in order to remove all toxic
constituents from the used oil before it is fed to the microorganisms. After reviewing the
problems encountered in BNL’s process and other reprocessing/re-refining techniques for
current used oil recycling, we have the following suggestions:
2.5.4.1 Selection of Appropriate Used Oil Feedstock
Used oil could come from different sources, though the two major categories are
automotive used oil and industrial used oil. They may contain a very wide range of
contaminants at various levels, and this makes the quality control and homogeneity of the
used oil feedstock more difficult to achieve. We have also reviewed the two most popular
technologies for used oil recycle/reuse options – reprocessing and re-refining, and we
found out that a screening procedure is necessary to guard and reject any inappropriate
feedstock before it enters the system. In this way, the performance of the system and the
quality of the products can be assured. So we would suggest developing a screening
method to select appropriate used oil feedstock. Although it’s impossible to completely
reject used oil feedstock that contains toxic contaminants (then there won’t be any used
oil bulk qualifying), we can still make the pretreatment process more feasible and
efficient by accepting better feedstock of the used oil. Furthermore, it would reduce the
unnecessary cost for excess pretreatment.

56
2.5.4.2 Pretreatment by Chemical-Aided Ultrasonic Irradiation
Although the pretreatment methods such as celite treatment, filtration, or washing
with filtration developed by BNL were claimed to efficiently remove most of the heavy
metal contents from used oil, these methods may not be useful to remove other toxic
organic constituents. From an economic point of view, it is better to develop one
pretreatment process that can remove all undesirable materials all together. Thus, a
chemical-aided ultrasonic irradiation process is proposed as the pretreatment method.
Ultrasound technology is well known for its applications in destruction of toxins. And
not only limited to lab-scale studies, many clean-up works of pilot-scale operation in real
contaminated sites are proven to be feasible for both technology and economic
considerations. The proposed chemical-aided ultrasonic irradiation method may be a
combined process with many steps, and using adsorption to remove toxic heavy metals
may be one of those steps. A detailed description of this method is illustrated in next
Chapter.
2.6. Sources of Used Oil Samples
Automotive used oils, including engine crankcase oil, diesel engine oil, and hydraulic
brake, transmission, power steering fluids, constitute a large portion of used oils. Sources
of used automotive oils are do-it-yourself oil changers (DIYers), service stations, repair
and maintenance shops, vehicle dealers, truck and taxi fleets, military installations, and
industrial/manufacturing facilities. Another main category of used oils is industrial used
oils, which include lubricating oil, hydraulic fluids, grease, and process oils. In most

57
lubricating and industrial applications, the oil must be replaced by new oil when the
performance of the oil deteriorates over time as additives break down and contaminants
build up. The fraction of the new oil that becomes used oil varies widely for different
applications. For example, only 10 percent of industrial process oils sold, in comparison
to 90 percent of electrical transformer oils, are generated as used oil. The used oil
generation rate for automotive oils is about 60 percent, which is a little bit higher than 52
percent for industrial oils. The recycling rate for automotive oils (≈ 60 to 70 percent),
however, is much higher than that for industrial oils (≈ 25 to 40 percent).
From the experiences, many industrial used oils can be easily recycled and reused
onsite through simple processing steps. In another way, automotive used oils mostly are
collected by commercial recyclers and could become the major source for this research.
However, since used oil is categorized as hazardous waste in California, it’s not easy to
request used oil samples from commercial recyclers or reprocessors/re-refiners. In order
to get representative used oil samples; however, we still tried to acquire samples from big
recyclers or reprocessors/re-refiners. Unfortunately, most of them were not willing to be
involved in situations where they would be in trouble from legal liability. Some simply
rejected the request at once and refused to reveal any information while others would ask
us to provide formal document and permission from their supervising governmental
agencies. The collection of used oil samples really brought some difficulties for this
research study after many frustrated phone requests. Finally, we had to just get a mixed
used lube oil sample by the help of a service station for some initial tests, which, in our
mind, was not so representative. Finally, a mid-size commercial used oil recycler (Leach

58
Co., Compton, CA) kindly provided some used oil samples from its big storage tanks.
However, it was identified later that those were just constituted of used automotive oils.
Used automotive lube oil sample was tested as the feedstock for the biomass
production. Since the characteristics of automotive used oils may be very similar from
batch to batch (need to be verified, of course), it could make the optimal pretreatment
process much simpler to decide.
Another good source of used oil is the used cooking oil. According to the market
research, recycled used cooking oil mostly came from the frying basins of restaurants,
fast food chain stores, and some deep-fat frying snack manufacturers. Used cooking oil
is always collected and recycled in order to process to make soap, paint, feed, fertilizer,
or fuel. Few studies have investigated the possibility of converting used sunflower oil to
diesel fuels (Nye, 1983, Karaosmanolu, 1996 and Cigizoglu, 1997). Used cooking oil
may be another good source for this biochemical process since it may contain good
nutrients for bacteria strains, though it’s presence in solid state at room temperature may
make people think that used cooking oil is not easily re-used. At high fermentation
temperature, however, it should not be difficult to process. Vegetable oil (corn oil, olive
oil…) consists mostly of unsaturated hydrocarbons, while vegetable shortening is
consisted of mostly saturated hydrocarbons through hydrogenation process. Unsaturated
hydrocarbons are very active during excess heating process and easily oxidized into toxic
compounds (color-causing materials). The target undesirable compounds we should be
careful about are amines, hindered phenols, etc., which not only reduce the useful life of
the oil but also are responsible for human health problems (for example, acne formation).

59
It is claimed that fat or oil must be discarded when its polar fraction is more than 25%
(Cuesta, 1993). The manager of the fast food store on campus kindly explained how to
decide if the oil is unfit to use ⎯ by a color comparison method (see Figure 2-9). It is a
common practice for individual restaurant owners to filter oil used for deep-fat frying to
remove food debris, which may accelerate the decomposition of the oil. Together with
the adsorption of soluble impurities, it will extend the life of the oil and provide higher-
quality fried food (Yates, 1992). The number and variety of products in the frying
process are great, but the nutritional and toxicological consequences of their consumption
remain largely unknown. If we want to utilize used cooking oil as the feedstock of the
biochemical process, then these toxic materials are also suggested to be removed prior to
the fermentation stage to avoid any adverse effect. Since no research has been done on
this area, further study is needed.

Chicken,
French
FrenchFries
Fish, & Fries Onion
Ring
Color Chart Put tube here: Compare to color here:
Oil to be dumped → filtered by filter sheet
→ cooled down overnight
→ dumped to collection tank
→ collected by commercial recyclers
Vegetable shortening
Check at 8:00 p.m. once per day
Figure 2-9. The Method Used in Fast Food Chain Stores to Determine the Remaining Useful Life of the Cooking Oil in Deep-Fat Frying. (Source: Carl’s Jr., USC main campus.)
60

61
CHAPTER 3
Theoretical Background
3.1 Ultrasound
3.1.1 Introduction
Ultrasound is the sound wave in which frequencies are beyond the human audible
limit (human hearing range is from 16 Hz to 16 kHz). The upper limit of ultrasound
frequency is not well defined, but is usually 500 MHz for liquids and solids and 5 MHz
for gases. High energy (low frequency) waves, which are known as the power ultrasound
between 20 and 100 kHz, are used mostly for cleaning, plastic welding, and more recent
applications to affect chemical reactivity (Mason, 1988). For a 20kHz ultrasonic unit, the
time period per cycle is 5.0 × 10⁻⁵ second. The collision of water molecules occurs in
less than one quarter of the cycle. Thus, the collision time should have a magnitude of
less than 1.3 × 10⁻³ seconds. As a result, there is high pressure and temperature.
Ultrasound radiation can generate a very high temperature (up to 5000°C) and pressure
(up to 500 atm) at many localized centers (cavitation bubbles) in aqueous solutions. The
effective lifetime of these localized hot spots may be only a few microseconds
(Suslick,1986; and Suslick, 1990). It’s these extreme conditions (high temperature and
pressure), however, that provide an unusual chemical environment (Sulslick, 1989).
Experimentally, the actual cavitation temperature has been measured at 5200 ± 560K for
alkane solvents (Suslick, 1986) and 5075 ± 156K for silicone oil (Flint, 1991).

62
In aqueous sonochemistry, chemical reactions occur at three different regions as
(Chen, 1998): (1) Interiors of collapsing bubbles where extreme conditions of
temperature and pressure exist transiently, which induces chemical reactions yielding
products that are typical of pyrolysis or combustion reactions in the gas phase. (2)
Interfacial regions between the cavitation bubbles and bulk solution where a high
temperature (lower than that of the bubbles) and a high gradient is present. The
nonvolatile solute that accumulates in this region can undergo thermal decomposition and
induce radical reactions. This interfacial reaction zone is estimated to be about 200nm
thick (Suslick, 1990). (3) Bulk solution where the radicals, being produced in the interior
of bubble and in the interfacial region, that survive migration from the interface can
undergo radical reactions with solute present in the bulk solution.
Table 3-1 summarizes some important physical parameters that affect cavitation.
3.1.2 Free Radicals by Ultrasound
3.1.2.1 Aqueous System
Many examples of reactions of hydrated electrons, hydrogen atoms, and hydrated
radicals with substrates have been reviewed (Fendler, 1982). The primary cavitation
reaction under ultrasound is the homolytic dissociation of water molecules into atomic
hydrogen (H) and hydroxyl (OH) radicals. This has been verified by Del Duca et al. (Del
Duca, 1958) using the isotopic exchange method to establish the formation. The principle
products from the ultrasonic irradiation of pure water are H2O2 and H2.
222
) ) )
2 HOHOHHOH +⎯→⎯+⎯⎯→⎯ •• (Eq. 3-1)

63
Table 3-1. The Effect of Physical Parameters on Cavitation. (Source: Chen, 1998)
Parameters Property Effects
Acoustic intensity Period of collapse Resonant bubble radius, probability of cavitation events per unit time
Acoustic frequency Size of cavitation zone Probability of cavitation events per unit volume
Bulk temperature Liquid vapor pressure, gas solubility
Thermal activation
Bubble content, intensity of collapse
Enhanced secondary reaction rates
Static pressure Total applied pressure
Gas solubility
Intensity of collapse
Bubble content
Nature of gas Polytropic ratio
Thermal conductivity
Gas solubility
Chemical reactivity
Intensity of collapse
Intensity of collapse
Bubble content
Primary or secondary sonochemistry
Nature of liquid Vapor pressure
Surface tension
Viscosity
Chemical reactivity
Compressibility of liquid
Intensity of collapse
Transient cavitation threshold
Transient cavitation threshold
Primary or secondary sonochemistry
Gas bubble dynamics
Petreatment of liquid Size distribution of cavitation nuclei
Cavitation threshold
Time of ultrasound Total energy input Extent of reaction, heat dissipation

64
Since hydrogen peroxide is quite active and dissociates easily, its formation is
extremely unstable in the solution. Hence, the collision of two hydroxyl radicals will not
terminate the reaction (Chen, 1990). Hydroxyl radical has a very high oxidizing power
(with potential of 2.80 volts), which is only second to fluorine as oxidants. Hydroxyl
radical is particularly reactive with carbon-carbon double bonds and carbon-chlorine
bonds and is capable of aromatic ring cleavage.
Although applying ultrasound to dilute aqueous solution alone could produce
hydrogen peroxide, the amount is too small to be significant. Saturation of various gases
in the water is proven to enhance the production of hydrogen peroxide to different levels.
Additional hydrogen peroxide may be added to increase free radical concentration in
aqueous solution. Since the bond strength of hydrogen-oxygen (119 kcal mole-1) is much
higher than that of oxygen-oxygen (ca. 37 kcal mole-1) in hydrogen peroxide molecule,
the main effect of ultrasound on hydrogen peroxide results in the cleavage of the O-O
bond and the formation of hydroxyl radicals (Chen, 1998). In ultrasonic cavitation
studies the most common media used are aqueous solutions, because they are good as
solvents for gases and other solutes (e.g., methanol).
When the medium is kept at a reducing environment, hydrogen in water produces
hydrogen atoms. This is supported by the fact that, in the presence of N2 and H2 gas,
ammonia is formed; formaldehyde is formed when CO and H2 are present in water
(Suslick, 1988). A convenient and constant source of hydrogen in the laboratory is
sodium borohydride. The reaction is expressed in Equation 3-2.
(Eq. 3-2) 2224 aBON4HOH2NaBH +⎯→⎯+

65
As for an industrial scale, it is suggested that hydrogen gas bubbles be finely
dispersed to the reactor at a constant rate and appropriate sizes.
3.1.2.2 Non-Aqueous System
Very few studies have been reported for sonolysis of nonaqueous solution.
Although some pioneer studies demonstrated that cavitational effect could occur outside
of water, sonochemistry, in general, had not been popularly observed in most common
volatile organic solvents (or aqueous solutions with volatile organics). The problem may
simply be that many organic liquids have high vapor pressures, which greatly diminish
the intensity of cavitational collapse (Suslick, 1988).
The most famous example for sonolysis of hydrocarbon is the Rice radical-chain
mechanism for alkane pyrolysis (Suslick, 1983). A similar mechanism is usually derived
accordingly for the sonolysis of other hydrocarbons. Ultrasound energy can split
substituted hydrocarbons into alkyl or aryl radicals. These radicals together with the
radicals from water-splitting (if any) can propagate through chain transfer or termination
steps. Polymerization or polycondensation is a consequence of energetic radical attack
when two alkyl radicals collide (Lian, 1994).
3.1.3 Ultrasonic Applications in Environmental Studies
3.1.3.1 Decomposition and Degradation of Pollutants at Laboratory Scale
The use of ultrasound is not limited to more recognized processes such as
cleaning, homogenization, emulsification, sterilization, plastic welding, biological cell

66
O
disruption, and crystallization (Frederick, 1965; and Gooberman, 1968). In addition,
ultrasound technique has been used in the decomposition of environmental pollutants for
several years, which includes phenols, halogenated hydrocarbons, pesticides, herbicides,
humic acids, PAHs and H2S. Degradation and modeling studies are mostly conducted in
dilute aqueous systems; selected examples are summarized in Table 3-2.
From Table 3-2, it can obviously be seen that most studies are conducted in batch-
type reaction systems and with 20 kHz ultrasound frequency. Appropriate reaction time
for enough degradation varies from 30 minutes to 10 hours depending on the nature of
the pollutants. Using argon (Ar) as the purged gas is proved to achieve faster results. In
these cases, ultrasound energy produces atomic OH• and H• radicals. When oxygen is the
saturation gas, sonication leads to HOO• obtained at the expenses of H• (Eq. 3-3). The
chance for recombination of OH• and H• radicals is lowered (Eq. 3-4).
(Eq. 3-3) •• ⎯→⎯+ HOO OH 2
(Eq. 3-4) HOHH 2⎯→⎯+ ••
In argon atmosphere, roughly 80% of the H atoms and OH radicals initially
produced during the ultrasonic irradiation of water recombine. The combination
reactions predominantly form H2, H2O2, and H2O. These reactive species are available in
the medium to react with dissolved target compounds. However, all these studies are
conducted in dilute aqueous system. Almost no study was found related to pollutant
reduction in pure solvent system, or in complex hydrocarbon system.

67
Table 3-2. Selected Examples for Ultrasonic Treatment on Aqueous Pollutants.
Target Compounds System Gas
Purged Reaction
Time Operatin
g pH Hydrogen
Source Efficiency References
Phenols
2-Chlorophenol Batch, 20kHz, 38.1 W/cm2 O2/N2/air 2-40 hrs 3 No 126 μM→ 0 μM Ku, 1997
2-, 3,-, 4-Chlorophenol Batch, 20kHz, 52.1 W/cm2 air 10-15 hrs -- No 80-90 μM → 0 μM Serpone, 1994
p-Nitrophenol Batch, 20kHz, 84 W air 2 hrs 5 No 100 μM → 10 μM Kotronarou, 1991
Halogenated Hydrocarbons
Chloroform batch, 40 kHz, 300 W No 120 min 3.5 H2O2 94% removal Chen, 1990
Phentachlorophenate batch, 530 kHz, 20 W O2/N2/air 200 min 7 No 100 μM → 0 μM Petrier, 1992b
Chlorinated C1/C2 VOCs batch, 20 kHz, 200 W No 40 min 6 → 3 No 72-100% removal Bhatnagar, 1994
CFCs batch/flow, 20 kHz, 160 W No 40 min 7.4 →5.4 No 90% removal Cheung, 1994
Chlorinated mixture batch, ? Ar 6-10 hrs -- No --- Catallo, 1995
CCl4 batch, 20 kHz, 113 W/cm2 Ar/Ar-O3 90 min 6.5 No 400 μM → 4 μM Hua, 1996
Chlorobenzene batch, 20/500 kHz, 30W air 5 hrs -- No 500 μM → 0 μM Petrier, 1998
Pesticides and Herbicides
Parathion batch, 20 kHz, 75 W/cm2 air 120 min 6.1 → 3.1 No 82 μM → 0 μM Kotronarou, 1992a
Humic Acids
Hydroxylbenzoic/tanic acid
batch, 200 kHz, 200 W Ar/air 60 min -- No 100 μM → 0-35 μM Nagata, 1996
Other Compounds
PAHs batch, 20 kHz, 35 W/cm2 Ar 60-120 min 2 NaBH4, H2O2 ≈ 80% reduction Park, 1995
H2S batch, 20 kHz, 75 W/cm2 air 30 min 10 No 196 μM → 0 μM Kotronarou, 1992b
Chlorobenzene, phenols batch, 20 kHz, 130 W Ar 60 min -- No 20-30% removal Seymour, 1997a

68
Many researches have been focused on how to enhance ultrasonic irradiation
efficiency, different reaction parameters such as temperature, pH, static pressure,
ultrasound frequency, solvent choice, and dissolved gas have been studied in depth.
Addition of chemicals, such as NaCl salt, also proved to enhance the oxidation rate by
several folds (Seymour, 1997a) due to hydrophobic interactions.
Higher frequencies (e.g., > 500 kHz) also achieved significant improvement by
producing smaller bubble size and forming larger amounts of hydrogen peroxide (Petrier,
1992a). Another study by Cum and co-workers conducting a model chemical reaction
(iodide to iodine oxidation) at different ultrasonic frequencies, i.e. 20, 40, 60 and 80 kHz,
illustrated the relationship between resonance frequency and bubble radius. They
concluded that selecting an appropriate frequency value of ultrasound is able to drive a
sonochemical reaction to its maximum yield (Cum, 1992).
A straightforward interpretation of the fundamental role played by frequency
indicates that such an effect occurs when bubbles are excited with a radius value at the
center of a statistical distribution curve. Such an event is also made possible by driving
the bubble’s field from its equilibrium distribution state to a different one suitable for the
occurrence of transient cavitation.
While the chemical effects of acoustic cavitation have been extensively
investigated during recent years, little is known about the chemical consequences when
hydrodynamic cavitation is created during the turbulent flow of liquids. One important
exception comes from W. R. Moser and co-workers (Moser, 1995). They utilized
commercially available high-pressure jet fluidizers (capable of pressure drops as high as

69
2 kBar and jet velocities approaching 200 m/s) to prepare nanostructured catalytic
materials. Moser speculated that the unusual properties of his catalysts resulted from
hydrodynamic cavitation within the fluidizer. Suslick and his co-workers (Suslick, 1997)
then use this jet fluidizer to study the chemical reactions caused by hydrodynamic
cavitation within. They found that the chemical effects of hydrodynamic cavitation and
acoustic cavitation respond identically to experimental parameters, especially to the bulk
temperature and nature of the dissolved gas. Another research was done by Moholkar
and his co-workers. They studied the bubble behavior in a hydrodynamic cavitation under
the effect of turbulence (Moholkar, 1997). Before them, it was believed that
hydrodynamically generated cavities were in a stable cavitation mode and hence, not very
useful for the desired sonochemical effects. But Moholkar concluded that the bubble
behavior under turbulent conditions was transient and resembled the behavior of a cavity
under acoustic cavitation. This is an interesting result and opens up a number of
possibilities for the design of cavitating reactors to enhance sonochemical effects.
Recently, there was a study (Seymour, 1997b) that involved the improvement of
reactor configurations (proper focusing and reflection of ultrasound), which was tested on
the oxidation of KI in a batch system (640 kHz, 258 W) saturated with air. A 100%
enhancement was achieved with the newly developed reactor configuration. We
discovered, however, that there are some drawbacks in their design after evaluation. First
of all, the material for the reactor is not very corrosion resistant. Secondly, extensive
cooling with ice bath is strongly required because the reactor would heat up rapidly only
after a few minutes of irradiation.

70
3.1.3.2 Environmental Cleanup Applications ⎯ Case Studies
A lot of environmental cleanup work has utilized sonochemical treatment or
ultrasonic-aided treatment at industrial scale or commercially-available services. Some
of the applications are introduced below.
Water, wastewater and biosolids disinfection using ultrasonic technology has been
studied for a long time in many countries. The TechnoWater Co. in Germany has
developed a commercialized ultrasonic post treatment, which is a patented solution to
avoid the precipitation of lime and rust in drinking water pipes in inhouse-services for
cold and hot water. This process is especially suitable in plants where softening or
dosing is uneconomical or chemical post treatment is not allowed. The main advantages
for this treatment package include low investment costs, low operational costs (power
consumption 5W), good drinking water quality without chemical additives, service
needed once in 4 years, and no excess charges for industrial design.
Atomic Energy of Canada, Ltd. of Chalk River Laboratories, Canada, has
developed and tested a pilot-scale unit to treat acidic soil leachate solution containing low
levels of metals and radionuclides by ultrasonic-aided treatment (as shown in Figure 3-1).
The major difference between this technology and conventional processes is the use of
ultrasonic mixing instead of mechanical agitation within large tanks. The research on this
pilot scale unit was co-supported by U.S. DOE and EPA and tested at EPA sites.
There were many projects sponsored by U.S. EPA and DOE to develop
ultrasonically-assisted chemical destruction process for detoxification of hazardous

71
Fig
ure
3-1.
Sch
emat
ic R
emed
iati
on o
f th
e U
ltra
soni
c-A
ided
Lea
chat
e T
reat
men
t Sy
stem
.
(Sou
rce:
Cha
lk R
iver
Lab
orat
ory)
Cem
en
tati
on
Ult
raso
nic
Sys
tem
#2
Cro
ss-F
low
Mic
rofi
ltrt
aio
n
pH
Ch
em
ical
Oxid
an
tP
recip
ita
nt
Ch
em
ica
l R
ea
gen
ts A
dd
itio
ns
Ult
raso
nic
Sy
ste
m #
1
Ac
idic
So
il L
each
ate
Feed
Dis
so
lve
d S
oli
ds:
5,0
00 t
o 1
0,0
00 p
pm
He
avy
Me
tals
& R
ad
ion
ucli
des)
1,0
00 t
o 2
,000
pp
m
Filte
r P
ress
Su
sp
en
de
d S
oli
ds
Fil
trate
Wet
Ca
ke
Osm
eri
do
us
Mate
rals
To
Dis
po
sal
Filtr
ate
To
Dis
ch
arg
e
Co
nce
ntr
ate

72
materials from contaminated soils. By applying ultrasound energy in-situ coupled with
soil fracturing technology, one successful example is the enhanced destruction PCBs-
contaminated soil cleanup (as shown in Figure 3-2).
Sonication has also been used to study the strength and structure of the sludges
(both anaerobic and activated) in wastewater treatment plant (Morgan, 1992). It gives
useful information about the characterization and desintegration of the sludges. Hence,
the dewaterbility of the sludges can be easily understood.
3.1.4 Ultrasonic Applications in Fossil Fuel Related Studies
Studies involving fossil fuel related fields using ultrasound technique include tar
sand recovery (Sadeghi, 1992), upgrading of heavy oil (Lin, 1993), and upgrading of
asphalt, coal liquid, and oil shale (Sadeghi, 1994). In these cases, free radicals are
generated in organic phase by ultrasound irradiation as illustrated by the Rice radical-
chain mechanism and follow the conventional free radical propagation, inhibition and
termination steps. The addition of radicals (H2O2, benzoyl peroxide, AIBN) into the
reaction has been proven to shorten the reaction time.
3.1.5 Proposed Chemical-Aided Ultrasonic Treatment on Used Oil
It is surprising to know that there have been very few basic researches conducted
or currently in progress related to the treatment of used oil. Most studies are targeted on
improving the efficiency or quality of re-refining and reprocessing technologies.

73
Fig
ure
3-2.
PC
B S
oil D
etox
ific
atio
n P
roce
ss.
(Sou
rce:
Tri
nity
Env
iron
men
tal T
echn
olog
ies,
In
c.)
So
il H
eate
dto
Rem
ov
eM
ois
ture
Hea
t M
ain
tain
ed
to P
rom
ote
Deh
alo
gen
ati
on
Reac
tio
n
So
lven
tR
eco
vere
d fro
mN
on
-PC
B S
oil
Exce
ss C
au
tic
in N
on-P
CB
So
ilis
Neu
trali
zed
No
n-P
CB
So
ilR
etu
rned
to
Exc
ava
tio
n
Pa
rtic
leS
cre
en
ing
So
il P
art
icle
Siz
ing
Ca
usti
cR
eag
en
tA
pro
tic
So
lven
t
So
lve
nt
Pu
rifi
ed
to R
em
ove
An
y S
oil F
ines
PC
BC
on
tam
inate
dS
oil
PC
Bs
Rem
ov
ed
fro
m W
ate
r
Acid
ifie
dW
ate
rA
dd
ed
to S
oil
Wate
rA
cid
ifie
d
PC
B S
olid
sR
ecy
cle
din
to P
roc
ess
Ac
id

74
One study shows the decontamination of low-level radioactive used oil (generated
as waste in a nuclear power plant) by a combined filtration, centrifugation, and chelation
process (Simiele, 1987). Another specific study directly focused on the dechlorination
and ash-removal of used oil (machine oil, automotive oil, and diesel oil) by a combined
chemical-thermal method, total chlorine content in used oil sample was greatly reduced
(Wentz, 1991). The treatment time, however, requires as long as 35 hours to remove
10,000 ppm total chlorine down to 300 ppm for machine oil. The samples also have to be
heated and kept at 280 °C at all times, which is not too economically feasible.
In this study, the method proposed is to utilize a chemical-aided ultrasonic
irradiation process to decontaminate used oil. Since the objective is to remove the
contaminants from used oil or degrade the contaminants in the used oil, the mechanism
for the destruction/removal of an individual group of contaminants under ultrasonic
irradiation can be hypothesized according to many previous studies. Experimental work,
however, is necessary to prove these hypotheses.
One important benefit from using ultrasonic irradiation for toxin reduction is that
the reactions are usually carried at an ambient temperature and pressure, which not only
saves a lot of energy, but also reduces the environmental impact from released toxins.
3.1.5.1 Micelle and Reverse Micelle in Water-in-Oil Emulsions
When water phase and organic phase mix together with the presence of surfactant
(the emulsifying agent), emulsion or even microemulsion is formed. For used lube oil
sample, organic phase volume is much larger than water phase volume, so it is a water-

75
in-oil (W/O) emulsion case. Oil is the continuous phase as water droplets are dispersed
in oil. By definition, micellar aggregates often occur when amphiphilic molecules
(amphiphiles) dissolve in solution and form micelles. The spherical form of micelle
(structure of micellar aggregates) is now generally accepted as approximating the actual
structure (Moroi, 1992), outcomes the lamellar form (proposed by McBain) or rod-like
form (proposed by Debye). According to SARA analyses (by TLC-FID method), the
constituents of unused lube oil or used lube oil are very similar, with approximately
> 98% aromatics, <1% resins, <1% asphaltenes, and no saturates. A Hartley micelle (i.e.,
polar-external spherical micelle) will form when the surfactant molecules migrate into the
reversed (oil external-water internal) micelle and disrupt the polar structure. Micelle
reversion caused by ultrasonic irradiation is illustrated in Figure 3-3.
When water is the dispersed phase in organic phase, the center of the reversed micelle
can be metals, trace water, or other heteroatoms (e.g., S, N compounds). Sonication-
induced cavitation causes the metals, polar and non-polar components to reorganize into
a continuous, single-phase micelle in polar external form (Hartley micelle). When polar
ends face towards the outside, attached molecules, such as metals and heteroatoms, can
easily be removed by effective contact when they are brought outside as the micelle is
reversed. The bondings between surfaces are greatly reduced (chelation for metals and
hydrogen bonding for heteroatoms) so that these molecules can be removed. Metals are
expected to separate from organic phase and stay in the water phase while heteroatoms
may not only separate from the oil phase, but may possibly break down into smaller
molecules by free radical attack.

76
Mg Ca Water
In original W/O emulsion
reversedmicelle
polar end group
aromatic or saturated chain/ring
+ surfactant + sonication
Hartleymicelle
Figure 3-3. Micelle Reversion under Ultrasonic Irradiation (after Sadeghi, 1992).

77
Catalysts or chelating agents may be added into the system to enhance the
dissolution rate of metal molecules in water phase. Some catalysts also have the ability
to initiate or enhance free radical formation, thus further enhance the decontaminating
rate in the process.
Another option in order to enhance the removal of metals and heteroatoms may be
the adjustment of the pH of the water phase. Acidic water may help to extract more
metals from organic phase to water phase. pH effect on the ultrasonic cavitation is also
widely discussed in many studies since it can alter the free radical reactions.
Purging argon gas or other gases into the system under ultrasonic irradiation is
often practiced as a physical enhancement method. This is due to their ability to create
more cavitation bubbles with optimal size. Argon itself does not participate in the
reaction in any chemical way since it is an inert gas. However, when a solution is
saturated with Ar gas, free radicals’ combination route may be different from the route
where O2 is present.
3.1.5.2 Free Radical Reactions
As mentioned in Section 3.1.2.2, when hydrocarbons in the oil samples are
subjected to ultrasonic irradiation, they can be affected in two different ways. First, some
alkyl or aryl radicals may be generated directly from hydrocarbons, and these radicals
together with the radicals from water-splitting (if any) can propagate through chain
transfer or termination steps. In this manner, the constituents of the oil may change due
to the recombination of molecules. FT-IR or SARA analysis can be used to confirm the

78
transformation. Second, free radicals (from water or from hydrocarbons) are able to
attack molecules at positions where there is weaker bonding. The scission or bond
breaking will lead to fused rings in some aromatic compounds. The destruction of PAHs,
PCBs, or BTEX compounds is possible. It is reported in many studies that ultrasonic
energy is effective in breaking C=C and C-Cl bonds; hence, chlorinated compounds can
be degraded accordingly. At the bubble/water interface, thermal decomposition may
occur as one of the degradation pathways for the organic contaminants.
Chemicals, such as H2O2 or NaBH4, can be added into the system to enhance the
degradation efficiency. The effects, however, may be totally opposite. The addition of
H2O2 directly supplies more hydroxyl radicals to initiate more free radical chain reactions
and may possibly reduce the reaction time. Oxidation reactions are expected to occur on
aromatic hydrocarbons. On the other hand, the addition of NaBH4 produces a reducing
environment. This is true when an abundant amount of H2 gas is formed in the system
(eq. 3-2); and consequently, the number of hydroxyl radicals in the system is far less than
that of hydrogen radicals. Hydrogenation reaction will be the major reaction under
reducing environment since the probability for small alkyl radicals to be captured by
hydrogen radicals is increased, forming lighter hydrocarbons. Both chemicals are to be
tested in order to verify which reaction environment is more efficient for decontaminating
used oil.

79
3.2 Adsorption
3.2.1 Introduction
Adsorption phenomena have been known to mankind for a quite long time, and
they are mostly utilized to perform desired bulk separation or purification purposes. The
heart of a adsorption process is usually the porous solid medium. The use of porous solid
is simply that it can provide a very high surface area or high micropore volume and it is
this high surface area or micropore volume that high adsorptive capacity can be achieved.
Since the porous medium is usually associated with very small pores and adsorbate
molecules have to find their way to the interior surface area or micropore volume. This
“finding the way” does give rise to the so-called diffusional resistance towards molecule
flow. Hence, in order to properly understand both the adsorptive capacity and the
diffusional resistance of the adsorption process, we must first understand these basic
components: equilibria and kinetics.
Some of the principal terms and properties associated with adsorption and porous
solids are defined in Table 3-3, Table 3-4, and Table 3-5. These definitions are consistent
with those proposed by the International Union of Pure and Applied Chemistry (IUPAC)
and by the British Standards Institution, and other official organizations.
The term “adsorption” is universally understood to mean the enrichment if one or
more of the components in the region between two bulk phases (i.e. the interfacial layer).
In the present context, one of these phases is necessarily a solid and the other a fluid (i.e.
gas or liquid). The term “adsorption” and “desorption” are often used to indicate the

80
Table 3-3. Definitions: Adsorption. (Rouquerol, 1999)
Term Definition
Adsorption Enrichment of one or more components in an interfacial layer
Adsorbate Substance in the adsorbed state
Adsorptive Adsorbable substance in the fluid phase
Adsorbent Solid material on which adsorption occurs
Chemisorption Adsorption involving chemical bonding
Physisorption Adsorption without chemical bonding
Monolayer capacity either Chemisorbed amount required to occupy all surface sites or Physisorbed amount required to cover surface
Surface coverage Ratio of amount of adsorbed substance to monolayer capacity

81
Table 3-4. Definitions: Powders. (Rouquerol, 1999)
Term Definition
Powder Dry material composed of discrete particles with maximum dimension less than about 1 mm
Fine powder Powder with particle size below about 1 μm
Aggregate Loose, unconsolidated assemblage of particles
Agglomerate Rigid, consolidated assemblage or particles
Compact Agglomerate formed by compression of powder
Acicular Needle-shaped
Surface area Extent of available surface as determined by a given method under stated conditions
Specific surface area Surface area of unit mass of powder, as determined under stated conditions
External surface Area of external surface of particles, as taking account of roughness (i.e. all cavities which are wider than they are deep), but not porosity
Roughness factor Ration of external surface area to area of smoothed envelope around particles
Divided solid Solid made up of more or less independent particles which may be in the form of a powder, aggregate or agglomerate

82
Table 3-5. Definitions: Porous Solids. (Rouquerol, 1999)
Term Definition
Porous solid Solid with cavities or channels which are deeper than their width
Open pore Cavity or channel with access to the surface
Interconnected pore Pore which communicates with other pores
Blind pore (Dead-end pore)
Pore with a single connection to the surface
Closed pore Cavity not connected to the surface
Void Space between particles
Micropore Pore of internal width less than 2 nm
Mesopore Pore of internal width between 2 and 50 nm
Macropore Pore of internal width greater than 50 nm
Pore size Pore width (diameter of cylindrical pore or distance between opposite walls of slit)
Pore volume Volume of pores determined by stated method
Porosity Ratio of total pore volume to apparent volume of particle or powder
Total porosity Ratio of volume of voids and pores (open and closed) to volume occupied by solid
Open porosity Ratio of volume of voids and open pores to volume occupied by solid
Surface area Extent of total surface area as determined by given method under stated conditions
External surface area Area of surface outside pores
Internal surface area Area of pore walls
True density Density of solid, excluding pores and voids
Apparent density Density of material including closed and inaccessible pores, as determined by stated method

83
direction from which the equilibrium states have been approached. Adsorption hysteresis
arises when the amount of adsorbed is not brought to the same level by the adsorption
and desorption approach to a given “equilibrium” pressure or bulk concentration. The
relation, at constant temperature, between the amount adsorbed and equilibrium pressure,
or concentration, is known as the “adsorption isotherm”.
A powder is easily recognized as a mass of small dry particles. And it is
reasonable to apply the term “fine powder” to a material consisting of particles less than
1μm. This unit mass of a fine powder contains a large number of small particles and
hence exhibits an appreciable surface area. For example, in the simplest case of an
assemblage of spherical particles, all with the same diameter, d, the specific surface area,
a, is given by the relation
a = 6/ρd (Eq. 3-5)
where ρis the particle absolute density. The same calculation would apply to cubic
particles, but in this case d would be the edge length of the cube.
It is evident that it is more difficult to define particle size if the particle shape is
not spherical or cubic. With some other simple geometric forms, a single linear
dimension, dx, may be used to calculate the surface area. In particular, when the particle
aspect ratio is sufficiently large, dx is taken as the minimum dimension. Thus, if the
particles are thin or long (i.e. plates or rods), it is the thickness that mainly determines the
magnitude of the specific surface area.

84
The individual particles in a fine powder are usually clustered together in the form
of aggregates or agglomerates. Loosely bonder aggregates are unconsolidated and non-
rigid, but they may be converted into more rigid, consolidated agglomerates as a result of
sintering or ageing. The breakdown, or particle breakdown, of the consolidated material
can be achieved by grinding. The process of agglomeration involved the bridging or
cementation of particles. An agglomerate may be regarded as a “secondary” particle,
which always contains within it some internal surface. In many cases, the internal
surface area is much larger than the external surface area and the agglomerate then
possesses a well-defined pore structure.
The hypothetical types of pores shown in Figure 3-4 relate to the definitions in
Table 3-4. In addition to closed pores and open pores, it is reasonable to distinguish
between blind pores (or dead-end pores) and interconnected pores. Pores which are open
at both sides of a membrane or porous plug are termed “through pores”.
Porosity is usually defined as the ratio of the volume of pores and voids to the
volume occupied by the solid. However, it should be kept in mind that the recorded
value of porosity is not always a simple characteristic property of the material, since it is
likely to depend also on the methods used to assess both the pore volume and the volume
of the solid. The pore volume us usually regarded as the volume of open pores, but it
may include the volume of closed pores.

85
3.2.2 Physisorption and Chemisorption
When adsorption is about the interactions between the solid and the molecules in
the fluid phase, two kinds of forces are involved, namely, either physisorption or
chemisorption. Physisorption forces are the same as those responsible for the
condensation of vapors and the deviations from ideal gas behavior, whereas
chemisorption interactions are essentially those responsible for the formation of chemical
compounds.
R
C
B T
C
I
Figure 3-4. Cross Section of a Hypothetical Porous Grain Showing Various Types of
Pores: closed (C), blind (B), through (T), interconnected (I), together
with some roughness (R). (Rouquerol, 1990)

86
The most important distinguishing features may be summarized as follows:
(1) Physisorption is a general phenomenon with a relatively low degree of specificity
whereas chemisorption is dependent on the reactivity of the adsorbent and adsorptive.
(2) Chemisorbed molecules are linked to reactive parts of the surface and the adsorption
is necessarily confined to a monolayer. At high relative pressures, physisorption
generally occurs as a multilayer.
(3) A physisorbed molecule keeps its identity and on desorption returns to the fluid phase
in its original form. If a chemisorbed molecule undergoes reaction of dissociation, it
loses its identity and cannot be recovered by desorption.
(4) The energy of chemisorption is the same order of magnitude as the energy change in
a comparable chemical reaction. Physisorption is always exothermic, but the energy
involved is generally not much larger than the energy of condensation of the
adsorptive. However, it is appreciably enhanced when physisorption takes place in
very narrow pores.
(5) An activation energy is often involved in chemisorption and at low temperature the
system may not have sufficient thermal energy to attain thermodynamic equilibrium.
Physisorption systems generally attain equilibrium fairly rapidly, but equilibrium
may be slow if the transport process is rate-determining.
3.2.3. Adsorbents
The porous solid of a given adsorption process is surely a critical variable. The
success or failure of the process depends on how the solid performs in both equilibrium

87
and kinetics. A solid with good capacity but slow kinetics is not a good choice as it takes
adsorbate molecules too long a time to reach the interior of particles. On the other hand,
a solid with fast kinetics but low capacity is not good either as a large amount of solid is
required for a given throughput. Thus, a good solid is the one that provides good
adsorptive capacity as well as good kinetics. To satisfy these two requirements, the
following aspects must be followed:
(1) the solid must have reasonably high surface area or micropore volume
(2) the solid must have relatively large pore network for the transport of molecules to
the interior.
Hence, the porous solid must have small pore size with a reasonable porosity,
better have a combination of two pore ranges: the micropore range and macropore range.
3.2.4 Destructive Adsorption
It is reported by Koper and his co-workers (Koper, 1997a and 1997b) that,
ultrafine calcium oxide particles were employed as destructive adsorbents (high surface
area solids that dissociatively chemisorb and immobilize all or fragments of incoming
adsorbates) for three of the most common solvents: trichloroethene (TCE), chloroform,
and tetrachloroethene.
As a one-step approach to the safe destruction of carbon tetrachloride with
ultrafine calcium oxide to give calcium chloride and carbon dioxide (CCl4(g) + 2CaO(s)
→ CO2(g) + 2CaCl2(s)) has also been studied in detail. It also found that calcium oxide
prepared by an aerogel/hypercritical drying method (AP-CaO) is superior to a

88
conventional prepared (CP-CaO) sample, and both are vastly superior to commercial CaO
(CM-CaO). Reaction temperature were about 300 - 500 ℃ and would altered reaction
efficiencies.
Since ultrasound can also provide locally high temperature and pressure in the
solutions, similar situation would be possible to be observed. It is reasonable to make the
assumption that if ultrasonic irradiation is applied following the adsorption process, to the
samples with adsorbents still inside, we would have the following advantages:
(1) Greater chance for radicals or sonic energy wave to hit the target molecules that are
adsorbed tightly inside the pores. Bond cleavage will occur within a thin film
distance from the solid surface by free radicals attack or sonic energy. This is called
“destructive adsorption”. (see Figure 3-5)
(2) Carefully selecting appropriate adsorbents depending on their characteristics and
surface properties, destruction efficiency of the specific molecules or compounds
could be enhanced.
(3) Modification of the surface can enhance or alter the adsorption as well as destruction
of selected molecules or compounds.

89
Ch
arg
ed
Su
rfa
ce
Bo
nd
Bre
ak
ing
De
str
ucti
ve
Ad
so
rpti
on
) )
)
Figu
re 3
-5.
Pos
sibl
e Sc
hem
atic
Exp
ress
ion
for
the
Des
truc
tive
Ads
orpt
ion
Rea
ctio
n.

90
3.3 Water Separation Techniques
Water is considered as a contaminant species that invades lube oil during use. For
any used oil recycling/reuse option, water has to be removed as a waste. For example, in
re-refining process, water is removed in the early dehydration step by flashing the
processing oil at near atmospheric condition. Water vapor is condensed and collected for
treatment. In most cases, phenolic compounds and oil residues are two major concerns in
the wastewater stream that have to be removed according to discharge standards prior to
their discharge to POTW. According to Ms. Burn, a field operating engineer in
Evergreen Oil, the size of the dehydration tower is about 30ft high in order to treat 43,000
gal/day oil during a 24 hr/day operation (the average water content in their used oil
feedstock is 7-8%). For industrial-size operation, flashing/distillation may be a good
choice for the separation of water from lube oil.
For this research, water separation is an important task. After ultrasonic
irradiation treatment, water phase and organic phase in the emulsion samples have to be
separated for individual analyses. Although we are more interested in the concentration
level of pollutants left in the organic phase, it is necessary to determine the wastewater
quality for the purpose of material balance study and for future suggestion of wastewater
treatment options. Furthermore, if water phase can be separated from the organic phase
in pretreatment steps, any consequent treatment in the recycling/reuse process will be
simplified. It is crucial, however, not to alter the characteristics of both water and oil
phase and not to lose targeted contaminants during water separating process. Otherwise,
the results will be highly affected.

91
3.3.1 General Consideration
Demulsification is important for many production or refining industries. The
basic philosophies followed in commercial emulsion breaking include: provide a density
differential between immiscible liquids, increase droplet size, alter the stable emulsion
environment, and remove emulsifying agents. All these actions can enhance the
separation of the phases. Although a stable emulsion is able to separate naturally with
age, immediate separation (made possible by external actions) is often required when
necessary. The selection of demulsification method and proper practice are important in
terms of quality issues, operative issues, and energy conservation concerns. Some
techniques currently practiced are introduced below. An investigation about applying
each technique on used lube oil W/O emulsion samples will be conducted in order to
decide an appropriate demulsification technique.
3.3.2 Membrane Filtration Technique
When oil phase is dispersed in water phase, an oil-in-water emulsion is formed.
Reported by Lin, 1998, it is possible to separate water and oil by membrane processes
(RO or UF) followed a prefiltration step using a microfilter (woven cotton threads to
retain particulates). This technique is successfully demonstrated for the treatment of
waste drawing oil (an O/W emulsion in the cable and wire manufacturing processes).
This method, however, may not be appropriate for W/O demulsification since
transmembrane pressure buildup will be too high to operate feasibly.

92
3.3.3 Centrifugation Technique
For the reprocessing of used lube oil, centrifugation (or combined with fine
filtration) refers to the method in which water is removed from the lube oil phase (see Fig.
4-3). In the study for removing radionuclides from waste lubricating oil, centrifugation is
also used for water separation (Simiele, 1987). It was reported, however, that a long
centrifuging time may be needed for complete separation, depending on the nature of the
emulsions and the performance of the centrifuge.
3.3.4 Heating/Microwave Heating Technique
Increasing the temperature of the emulsion is commonly used in refining and oil-
field industries to enhance emulsion breaking. Heat addition, however, is usually based
on the overall economic picture of a treatment facility, minimum heat input is favored to
avoid the lost of light end products and to save the consumption of flue gas.
Microwave heating emulsification technology is currently used in many chemical
plants and has been successfully demonstrated as effective on crude oil/water emulsions.
A study (Fang, 1995) utilized a domestic microwave oven to successfully separate
synthetic lube oil/water emulsions. From their results, small temperature gradients
through the body of irradiated emulsion proved that viscous water-in-oil emulsions are
heated more quickly and uniformly by microwaves than by conventional convective
heating, providing a faster water-oil separation. Operation of microwave energy at
industrial scale is already proven possible. However, the energy consumption, has to be
minimized to be economically feasible.

93
3.3.5 Chemical & Electrical Methods
Chemicals designed to eliminate or neutralize the effects of emulsifying agents
can effectively resolve emulsions. It is commonly combined with heat or electric field to
shorten the time. The function of the electrical field is to disturb the surface tension of
each droplet, probably by causing polar molecules to reorient themselves, or to provide
induced and oriented charges to adjacent emulsion particles in order to create mutual
attraction. The chemicals used, however, will probably lead to a secondary pollutant
since the separated water may contain high levels of chemicals for discharge. For this
research, since trace level determination of some contaminants is needed, chemical
addition is not strongly considered since it may interfere with the analytical work.
3.4 Specific Analytical Techniques for Oil Components
A series of specific analytical procedures have been established to characterize
used oil. According to Section 5, what we are concerned about in used oil are
contaminants targeted to be removed, especially heavy metals, BTEX compounds,
chlorinated hydrocarbons, PAHs, and PCBs. The analytical techniques to determine
these components and other oil properties are summarized below:
3.4.1 Moisture Content
Moisture content is also considered as one of the contaminants in used lube oil
since virgin lube oil does not contain detectable amount of moisture. Water
contamination is an economic concern for everyone dealing with used oil because of the
94
added cost associated with handling the water (e.g., dehydrating step in re-refining). In
our proposed treatment process, however, a certain amount of water may be needed to
create an optimum water/oil ratio for perfect emulsion. Thus, we have to measure the
water content in the original used oil sample, sometimes we may need to add some water
(distilled water or other waters with specific properties) to make the sample needed for
the treatment.
However, laboratory methods for quantitatively determining water content in oil
are mostly expensive (such as Karl Fisher method), time consuming and give a poor
accuracy result, such as the distillation method. Hence, a convenient test kit
“HydroScout™” developed by Dexsil Corporation (Hamden, CT) is used in the study.
The HydroScout™ system is designed to accurately and quickly measure the
water (especially the dissolved water) content in used oil (or in other petroleum oil
products). The test uses a specially formulated CaH2 reagent to quantitatively convert all
water contained in the oil sample to H2 gas. The reaction is carried out in a sealed tube
and the resulting pressure is measured using a specially designed meter. The results are
displayed directly in percent and it takes only two minutes to finish one measurement.
The measuring ranges are 0-20 v/v% (mode A) and 20-100 v/v% (mode B) with a
detection limit of 0.15 v/v%.
3.4.2 Organic Hydrocarbons (BTEX, chlorinated compounds, PAHs, and PCBs)
The concentration of individual BTEX compounds (benzene, toluene,
ethylbenzene, and xylene) and chlorinated compounds (dichlorodifluoromethane,

95
trichlorotrifluoroethane, tetrachloroethylene, 1,1,1-trichloroethane, trichloroethene, and
total chlorine) in either oil or in water sample is determined by GC-MS (EPA Method
8260, with purge and trap).
The concentration of individual PAH compounds in either oil or in water sample
is determined by GC-FID (EPA Method 8100).
The concentration of PCBs (individual Aroclor species) in either oil or in water
sample is determined by GC-ECD (EPA Method 8080). Due to the high sulfur content in
the oil phase as interference, pretreatment cleanup for the oil samples is necessary.
3.4.3 Heavy Metals
Individual metal concentration in oil or in water is determined by ICP-MS. After
proper dilution (for oil phase, 10 or 20mg oil to 1ml ultra-pure HNO3), samples are
placed in small teflon tubes and subjected to acid digestion while heated at >100ºC under
pressure for at least 24 hours and later washed with 1% dilute HNO3. Metal concentration
is then determined by ICP-MS (Fission, Model PQII-Plus). Although more than 60
elements can be determined for every sample in one scan, As, Ba, Cd, Cr, Pb, and Zn will
be our major concerns. Any metal with an exceptionally high concentration also needs
special attention.
3.4.4 Sulfur Content
Sulfur is viewed as an index of inherent antioxidant capacity in virgin lube oil.
With re-refined oils, hydrocarbons that were inherently oxidatively unstable would have

96
been oxidized during previous use. It is necessary to identify the types of sulfur content,
both in virgin lube oil and used oil, in order to better understand the role that sulfur plays.
Total sulfur content in an oil sample is determined by a sulfur-in-oil analyzer,
Model SLFA-20/20T manufactured by Horiba Ltd., Japan. The measuring principle for
this unit is the non-dispersive x-ray fluorescent (NDXRF) analysis, with a measuring
range of 0-5 m/m%, repeatability of 15 ppm, and a detection limit of 20 ppm. It also uses
the automatic C/H ratio compensation function to solve the problem of measurement
error, which is caused by different types of oil. Any oil sample with water content more
than 1v/v%, however, is not recommended to determine its total sulfur content with this
instrument since noticeable deviation from actual concentration is expected to occur.
Different organo-sulfur type can be determined by GC-MS. The type of sulfur
compounds in lube oil may change after use and may change further after ultrasonic
irradiation. It’s important, therefore, to differentiate the sulfur type as well as measure
the total sulfur content. Although the total sulfur content in the used oil sample may not
change after treatment, but the individual sulfur species may change.
After ultrasonic treatment, some sulfur may be present in water phase as sulfate or
sulfide. Sulfate concentration in water can be determined by turbidimetric method
(Standard Method 4500-SO42-, Part E). Sulfide concentration in water can be determined
by iodometric method (Standard Method 4500-S2-, Part F).

97
3.4.5 Information of Water/Oil Emulsions
The crucial point about applying ultrasound energy to destroy or decompose the
pollutants in the oil-based sample is to make good water/oil emulsions. It is important to
define, therefore, what is a good water/oil emulsion. Both light microscope and scanning
electron microscope (SEM) have been used to study the size distribution of emulsion by
direct observation. The resolution and depth of field from SEM are significantly better
than in comparison to what can be achieved through optical microscopy. The optical and
electron microscopic techniques, however, are quite complimentary in terms of the
information that they can provide. Optical microscopy, in fluorescence mode or with
polarized light, can provide information about the organic phases in the emulsion.
Electron microscopy, through the X-rays excited in the sample, can provide information
about the inorganic and mineral phases present (Schramm, 1992). The practical lower
limit of emulsion sizing with optical microscopy is at the level of 0.5 μm, with the limit
as low as 0.1 μm or less for electron microscopy with direct observation of the frozen
sample. Even lower limit such as 0.01 μm or less can be achieved with replicas and
transmission electron microscopy.
Light polarizing microscopy (Leitz, model SM-LUX-POL) is initially used to
observe the emulsion. First, we only checked if water and oil were in good emulsifying
state. Later, we measure the micelle size if necessary, which may be needed for
determining optimized ultrasound frequency. Since preparation of suitable emulsion
samples for SEM observation is difficult, there is no intention to utilize SEM as a tool at

98
this time unless the data from light microscope are not sufficient to provide information
for this study.
3.4.6 Other Evaluation Techniques
PCBs content in used oil is essential for determining how the used oil is going to
be recycled or treated. Hence, it’s important to screen PCBs content in bulk used oil. If
PCBs content is too high, then the used oil cannot be reprocessed or re-refined. Many
screening techniques have been developed for PCBs in used oil, such as total organic
halide methods, simplified chromatographic procedures, x-ray fluorescence, or total
chlorine determination. The last method is the basis for many commercial colorimetric
kits in field test use; unfortunately, these kits only give semiquantitative results. For
lower regulatory limits of 50ppm, there is always some uncertainty about the accuracy.
A new technique using thermal neutron activation analysis (ITAN) was proposed
(Sutcliffe, 1989). Although it produces faster and more accurate PCBs results at a very
low cost, it requires access to a reactor and trained personnel, which does not seem very
applicable and convenient.
The techniques mentioned above are mostly adapted from determination methods
of common oil samples. Since it’s not popular or necessary to characterize used oil
samples; it’s rare to see a specific method developed mainly for used oil analysis.
However, there are still some interesting techniques available. For example, FT-IR
technique can be used to monitor lube oil condition coupled with an automated
Spectrum™ Used Oil Analyzer (by Perkin-Elmer). When used oil is compared to fresh

99
oil with parameters (shown at different wavelengths) such as soot, hydroxyl, glycol,
NOx/carboxylate, sulfate, antiwear loss, ester breakdown, and fuel contaminants in FT-IR
spectrums, it provides information on the state of the oil itself and the engine from which
the oil comes and ensures that an engine is operating with optimum efficiency.
Another technique used to evaluate the remaining useful life (RUL) of lubricant in
the engine/equipment is the Remaining Useful Life Evaluation Routine (RULER™).
This method utilizes voltammetric technique to indicate how much additive depletion has
occurred (Jefferies, 1998). By tracking the readings over operating time, the user is able
to identify abnormal operating conditions and predict necessary oil changes.

100
CHAPTER 4
Destruction of Heavy Metals in Used Lube Oils
4.1 Introduction
This chapter deals with the study on destruction of heavy metals in various used
lube oil samples. Factors such as surfactant type, H2 source, radical source, water content,
reaction time, purging gas, catalysts that could possibly affect the destruction efficiencies
were studied. Sonochemical process, adsorption process, and combined destructive
adsorption process will be evaluated individually and the destruction efficiencies will be
compared. .
4.2 Preliminary Test Runs
4.2.1 Factors Affecting the Sonochemical Process
The initial study for applying the sonochemical process on the treatment of used
oil is concentrated to investigate some factors that may affect the feasibility as well as the
efficiency of the sonochemical process. Factors include:
• surfactant type/concentration, if needed
• H2 source type and concentration, if needed
• radical source type and concentration, if needed

101
There are many other factors will also affect the sonochemical process, the
optimum condition for these factors will be determined in future studies. Here are some
potential parameters that need to be determined:
• optimum amount of water in water/oil emulsions
• optimal reaction time
• optimal reaction temperature
• pH/conductivity/OPR of the water in the emulsions
• purging gas type and optimal flow rate
• energy level and frequency of ultrasound
• additional catalysts or chemicals
The reaction kinetics for individual contaminant would be different as expected,
thus, the optimization design, therefore, should consider every single contaminant
involved, and tries to get the balance from all aspects.
4.2.2 Experimental Design – Sonochemical Process
Since the size of the used oil sample acquired from different source is individually
different, it is important to decide how to take representative subsamples each time from
the original big sample bottles (at least with volume size of one gallon) before conducting
any experiment. A procedure was determined ⎯ the big sample bottles were shaken with
inversion for 30 seconds and then allowed to settle for 15 seconds. This allowed the
coarsest particles (if any) to settle, but included a representative sample of the other

102
constituents at most homogeneous state. Then, appropriate amounts of used oil samples
were quickly poured out from the big bottles directly to smaller bottles (125mL) for
ultrasonic irradiation treatment or to the blender to make emulsion samples.
The experimental design for the preliminary studies is illustrated in Figure 4-1.
The experiments were conducted in a way to study how the factors, mentioned in
previous section, would affect the feasibility or efficiency of the reaction.
For each different used oil sample, in order to know if the emulsifying condition is good
enough for effective ultrasonic irradiation reaction, the water-in-oil emulsion state first
has to be observed under microscope (S0). Also the water content in original used oil
sample has to be measured first (S0). According to information from many sources, water
content reported in used oil ranges from 5% to 20%. The four used oil samples acquired
for this study, however, all contain very low water content, e.g., below detection limit of
0.15v/v% for the two automotive used oil samples and the hydraulic fluid sample, and
merely 3.99v/v% for the mixed used oil sample. It is very possible that when we
acquired the samples from the sources, the samples were just taken randomly from their
big holding towers. Depending on from what level or what position they were drawn,
the oil samples may not be so representative already. Ideally, we need to have an optimal
water content to form effective-size vesicles and micelles in the water-in-oil emulsions so
that the ultrasonic irradiation is then able to separate or break down toxins. Since water
is considered as a contaminant for any used oil reuse process, extra water should be
added as little as possible in order not to create too much trouble in water/oil separation
step later on. From this point of view, 20m/m% is the maximum amount of water

103
Use
d O
il
Wate
r
Fig
ure
4-1.
Exp
erim
enta
l Des
ign
for
Pre
limin
ary
Stud
ies.
S1
S2
S3
S4
S5
S6
S7
S8
Ult
raso
nic
Sy
ste
m
Ble
nder
S1
S2
S3
S4
(Optio
nal)
Surf
act
ant
( O
nly
when o
il an
d w
ate
r do n
ot em
uls
ify w
ell.
)O
ptio
nal:
Hydro
ge
n s
ou
rce
or
oth
er
chem
icals
S0
Hydro
gen s
ou
rce
or
oth
er
chem
icals

104
considered to add into original used oil samples for making emulsions (S1). (It is easier
to prepare a specific weight of used oil samples than a specific volume ofused oil. Hence,
in this study, oil samples are all prepared by weight.) If samples that are more
representative could be acquired in the future (with higher average water content), then
more efforts will be made on this subject.
Since the water-in-oil emulsion samples are quite different than any samples ever
studied with ultrasonic irradiation (mostly dilute aqueous system, or heavy fossil fuels),
there are still some factors that not clearly known which will affect our system. For
example, the gas environment or the addition of different chemicals (hydrogen source or
radical sources) may have different effects in our system from in other systems. Thus,
experiments should be designed in a way to identify the effects made by those factors,
positively or negatively.
To make water/oil emulsion samples, a domestic blender (Hamilton Beach/
Proctor-Silex, Inc., Model 56200) with 16 speed selection and a LO/HI power range was
used. The maximum motor power is 425 Watt. Emulsion samples were prepared with
different selections of speed and time. Microscopic examination was used to check the
stability of the emulsion. An optimal speed/time combination will be decided for
preparation of future samples.
For each test run, 75g of raw used oil sample or emulsified sample was
transferred into 125-mL reaction bottle and subjected to ultrasonic irradiation. The
schematic of the batch system for ultrasonic irradiation reactions used in initial test runs
is shown in Figure 4-2.

105
Water Bath
ArgonGas Inlet
Connect toControl Panel& Power Supply
UltrasoundConverter
Reaction Bottle
Figure 4-2. Schematic Diagram of the Batch System for Ultrasonic Irradiation Reactions.

106
The ultrasound instrument is manufactured from Sonics & Materials, Inc. (Model
VCX-600). This model has an operating frequency of 20kHz and an estimated intensity,
with a titanium tip of 0.25-in (0.6-cm) sonication probe, of about 35 W/cm2. A big water
bath was used to keep the operating temperature at 25 ± 5ºC. During the sonication
irradiation process, 5 m3/min of 99% compressed argon was applied to the sample.
Although a higher degradation rate is expected with purged argon (Park, 1995), its effect
in this new type of samples is not yet clear. Presently, argon is the only gas tested in the
initial studies and other types of dissolved gas may be studied later.
Two different chemicals were separately added in different runs. A solution of 1
wt% hydrogen peroxide (Mallinckrodt Chemical Co.) was applied in one shot to the
samples before the irradiation reaction was initiated. Also, 0.5 wt% sodium borohydride
(Wilshire Chemical Co.) was added in two different ways: once before the irradiation
reaction, or four times after every 15 minutes during the irradiation reaction. This is to
avoid H2 gas being released from the samples too quickly to generate a sufficient amount
of radicals in the system. The results from the two different ways and the effects from
adding two different chemicals will be compared. Then, the possible radical chain
reaction pathway and the preferred operating system (oxidizing or reducing environment)
can be identified.

107
4.2.3 Experimental Design – Adsorption Process and Destructive Adsorption
Process
Four different adsorbent materials were selected in the adsorption test runs:
alumina (Al2O3), silica gel (SiO2), GAC (Calgon BPL) and PAC (Calgon WPH). The
first two are widely used in column chromatography as adsorption and filtration media,
and they are also very good catalysts. GAC and PAC are commonly used adsorbents in
environmental applications. The simple comparison about the size, pore size, and surface
area for these adsorbents is shown Table 4-1.
Adsorption Reaction was carried in 125mL bottles subjects to 2 hrs constant
shaking at 20℃. The amount of adsorbents used is in 20% wt.
Samples were then subject to ultrasonic irradiation under the following conditions:
(1) 5 m3/min Ar gas
(2) 25 ± 5 ℃
(3) 60 min irradiation time
(4) Sodium borohydride @1wt% was added every 15 min

Table 4-1. Comparison of Particle size, Pore Size and Surface Area for Various Absorbents.
Particle size Pore size Surface area (Å) (m2/g)
Alumina 75 – 180 μm 58 155 (Al2O3) 80-200 mesh
Silica Gel 75 – 250 μm 150 300
(SiO2) 60-200 mesh
GAC 4.75mm × 2mm 20 – hundreds 800-1000 (Calgon BPL) 4 × 10 mesh
PAC 45 μm (90%+) 20 – hundreds 800-1000
(Calgon WPH) 325 mesh
108

109
4.2.4 Characteristics of the Used Oil Samples in This Study
Four different used oil samples were in this study, they are:
Sample Label Sample Description
LA-UO1 Used automotive lube oil from recycler in L.A. area
LA-UO2 Mixed used lube oil from a bug re-refining facility
BNL-UO1 Used automotive lube oil from Brookhaven Laboratory
BNL-UO2 Used hydraulic fluids from Brookhaven Laboratory
Besides these used oil samples, two different brands of clean lube oil, Pennzoil
10W-30 (labeled P-10W-30) and Valvoline 10W-30 (labeled V-10W-30) are purchased
from Target store for the purpose of blank study. The reason for choosing 10W-30 grade
for comparison is because it is the most popular used one, especially with Southern
California’s weather condition.
The characteristics of the four original used oil samples and two unused
automotive lube oil samples are listed in Table 4-2. It is obvious that there are some
problems encountered with the acquired used oil samples.
First, the water content in the four used oil samples is too low when compared to
reported values (possible 5%-20%, with average 7%-8% most common). In addition to
conducting reactions with the original used oil samples, some samples were prepared by
adding about 20% distilled water by weight (about 17% by volume, confirmed by water
content measurement) ⎯ the maximum water content ever reported, and mechanically

Table 4-2. Characteristics of Oil Samples Used in This Study.
Sample Water Sulfur Benzene Toluene EthlBzne Xylene PAHsa
PCBsb
Chlorinatedc
Label (v/v%) (m/m%) (ppm) (ppm) (ppm) (ppm) Compounds
LA-UO1 0.05 0.3139 ND 136 116 535 ND ND ND
LA-UO2 3.99 0.3442 23.2 406 393 823 ND ND ND
BNL-UO1 0.05 0.3138 13.4 305 113 591 ND ND ND
BNL-UO2 0.11 0.1399 ND 9.28 11.8 25 ND ND ND
P-10W-30 0 0.3721 ND ND ND ND ND ND ND
V-10W-30 0 0.2895 ND ND ND ND ND ND ND
Sample As Ba Cd Cr Pb Zn Al B Ca Cu Mg
Label (ppm) (ppm) (ppm) (ppm) (ppm) (ppm) (ppm) (ppm) (ppm) (ppm) (ppm)
LA-UO1 0.02 3.04 0.10 8.63 10.65 388.14 46.00 109.36 171.28 34.49 441.94
LA-UO2 0.21 14.42 0.51 19.85 24.24 403.96 57.93 118.42 204.94 37.20 422.21
BNL-UO1 0.17 0.08 0.03 21.52 4.26 906.24 40.36 239.48 203.43 101.27 969.16
BNL-UO2 0.03 0.06 0.01 9.90 0.15 88.95 14.67 54.57 58.04 1.84 7.65
P-10W-30 ND 0.05 0.00 4.81 0.16 140.99 13.40 65.19 67.86 1.04 279.38
V-10W-30 ND 0.75 ND 4.77 0.18 175.95 17.45 49.07 82.33 1.42 164.41
aPAHs compounds measured include 14 different individual PAH listed in Table 2-5. bPCBs compounds measured include: Aroclor 1016, 1221, 1232, 1242, 1248, 1254. cChlorinated compounds measured include: dichlorodifluoromethane, trichlorotrifluoroethane, tetrachloroethylene, 1,1,1-trichloroethane, trichloroethene.
110

111
mixed by the blender. It is expected when finer and more homogeneously dispersed
vesicles are formed, more interfacial contacts between the two phases will occur, which
can enhance the ultrasonic irradiation reactions. The mechanical force (blender) used to
make the emulsion, however, may create an emulsion state in the emulsified sample
which is a lot different from its natural form.
Secondly, many contaminants such as PAHs, PCBs, and chlorinated compounds
were not found in any of the four used oil samples as predicted. BTEX compounds and
heavy metals did present in these four used oil samples, however, the levels of
concentrations were mostly much lower than typical values (Refer to Table 2-2). The
reason for why such deviated and not-so-representative samples were acquired probably
was due to the fact that these samples were taken from some upper levels of the holding
towers. Thus, they were already cleaner than the average condition. Contaminants tend
to settle at the bottom of the big holding tower with particulates or colloids after a period
of holding time. It is possible that the water was already separated out and stayed at the
bottom of the holding tower, so very low water content was found in original four used
oil samples. The lack of PAHs, PCBs, and chlorinated compounds is hard to explain. It
may be because the cross contamination did not occur in the sources of the four used oil
samples. It is obvious that these samples may not be representative enough for the
feasibility studies about ultrasound’s ability to decompose every potential contaminant in
used oil. On the other hand, it could also be the fact that it is just too difficult to acquire
used oil samples containing all potential contaminants within; if this is the case, then the
current four used oil samples may still tell us some stories. In the first few test runs

112
applying ultrasonic irradiation on the four used oil samples, only heavy metals and BTEX
compounds could be investigated. For future studies, synthetic used oil samples with
known constituents will be prepared in order to systematically control the consistency of
the experimental samples.
For sulfur determination, total sulfur measured in the unused lube oil or used lube
oil is about 0.3wt% or even to 0.4wt%. Sulfur is added to base lube oil (contains total
sulfur at only 0.05wt% for 100 neutral base oil and 0.07wt% for 300 neutral base oil)
from the additive packages and should be removed during the recycling operations. In
most cases, sulfur compounds produce acidic gases to cause corrosion problems in the
treatment facilities. Thus, it is better to remove sulfur compounds early from the process
flow. Unfortunately, they are always not removed until the last step (Refer to Table 2-4,
in re-refining system), or only release as acidic gases (in reprocessing system) to create
problems. Total sulfur content in treated samples is not determined due to incomplete
water separation. The samples valid for total sulfur measurement by Horiba SLFA-20 are
limited for whose water content is under 1%. The procedure for identifying different
sulfur compounds in any oil phase by GC-MS is still under development in BNL and will
be ready to routinely conduct the determination of different types of sulfur compounds
after the database is completely set up.
4.2.5 Water-in-Oil Emulsions
When the original used oil sample was observed under light microscope, a well-
dispersed water-in-oil emulsifying state was clearly seen. Oil immersion technique and

113
both regular/polarized light modes were used to focus beyond the cover slide and prevent
the interference from trapped air bubbles. Since used oil must have certain levels of
surfactants carried from its additive package, it seems that a good emulsion is naturally
formed without further addition of surfactants. After extra water was added into used oil
and mechanically mixed by the blender, the emulsion sample was also observed under
light microscope. Finer and more homogeneously dispersed vesicles were observed.
Emulsion samples were prepared with different selections of speed and time. The
stability of the emulsion was checked by microscopic examination. However, the size of
the vesicles is not measured at this time due to instrumental unavailability but will be
determined for comparison later. An optimal speed/time combination will be decided for
preparation of future samples.
4.2.6 Difficulties Encountered in Analytical Work
There were several problems encountered during the analytical procedures. First,
it was discovered that the inhomogeneity of the used oil samples could cause inconsistent
results unless the samples were prepared with special care at each step. The bulk sample
had to be continuously stirred and the representative portion had to be carefully
transferred to make emulsions or used as it is for the test runs. When water and oil are
separated after the reaction, representative samples have to be taken from each phase for
analysis. For analysis conducted by GC (e.g., PAHs, PCBs, BTEX, and chlorinated
hydrocarbons), the amount of sample taken for preparation of the dilution is no more than
one gram. For metal analysis by ICP-MS, only 20 mg or even 10 mg was taken from

114
each sample for preparation. It is obvious that if a sample taken for analysis is not from a
homogeneous solution, replicated results cannot even be anticipated for the same sample
matrix. Thus, it is critical to develop a secure sampling procedure for both water and oil
phase samples in order to obtain reliable and reproducible results. Especially,
homogeneity for oil phase samples needs more efforts to achieve due to the viscous
property of oil. For the analyses that are performed in other facilities (BNL analytical lab,
or other commercial labs), specific instruction should be given to the technicians
involved to use same sampling techniques and procedures.
Secondly, it should be noted that used oil samples may be aged through time and
some of the constituents may change or be released. A blank sample, therefore, has to be
prepared in each set of test runs for analysis; it will serve as the new baseline to compare
the degradation efficiency.
Lastly, the dirty and complex nature of the used oil samples makes the trace level
analyses a little difficult. For example, a cleaning procedure to remove some interference
factors is required for all samples; otherwise, PCBs peaks cannot be clearly identified and
quantified. The detection limit for determining the organic contaminants (PCBs, PAHs,
and chlorinated compounds) in the oil phase is very high since further concentration of
these components in oil phase is very difficult and there is too much interference from the
samples themselves.

115
4.2.7 Results from Preliminary Tests on Reduction of Heavy Metals from Used Oil
The experimental data from preliminary tests showing ultrasonic irradiation effect
on heavy metals are presented in Figures 4-3 to 4-7. The experiments were conducted by
varying the operating conditions as mentioned in the last section. Metal determination by
ICP-MS has a very low detection limit of ppb level, however, a big variation could be
observed even in the same sample matrix when the sample that is taken and prepared for
acid digestion is not taken from a homogeneous bulk.
The results depicted in Figure 4-3 correspond to the ultrasonic irradiation
experiments for identifying the effects of ultrasound and hydrogen peroxide on heavy
metals, such as Ba, Cd, Cr, Pb, and Zn. Arsenic is not discussed here since it presented a
very low concentration level in the original four used oil samples. In these experimental
runs, the greatest reduction in metal content was observed when hydrogen peroxide was
added to emulsified sample (A1-W-OH-US60).
The effects of water (for creating emulsion) and hydrogen peroxide on heavy
metal removal from used oil by ultrasonic irradiation are presented in Figure 4-4. The
results indicate that the addition of hydrogen peroxide could only enhance heavy metal
removal rate when extra water was added to the original used lube oil and mechanically
emulsified. Extra water alone could not enhance the removal of heavy metal without
adding hydrogen peroxide. The results also indicate that hydrogen peroxide is effective
only when a certain amount of water is present.

116
0.00
20.00
40.00
60.00
80.00
100.00
120.00
A1 A1-W A1-W-
US60
A1 A1-W-OH A1-W-
OH-US60
Re
ma
inin
g M
eta
l C
on
ten
t (%
)Ba Cd Cr Pb Zn
Operating Condition:
(1) 5 m3/min Ar gas
(2) 25±5ºC
A1: LA-UO1 automotive used oil sample
W: distilled water 20wt% added and emulsified
OH: hydrogen peroxide 1wt% added
US60: ultrasonic irradiation for 60 minutes
Figure 4-3. The Effects of Ultrasound and H2O2 on Heavy Metals in Used Oil.

117
0.00
20.00
40.00
60.00
80.00
100.00
120.00
140.00
A1 A1-W-OH-US60 A1-W-H2(1)-US60 A1-W-H2(4)-US60
Rem
ain
ing
Meta
l C
on
ten
t (%
)Ba Cd Cr Pb Zn
Operating Condition:
(1) 5 m3/min Ar gas
(2) 25±5ºC
A1: LA-UO1 automotive used oil sample
W: distilled water 20wt% added and emulsified
OH: hydrogen peroxide 1wt% added
H2(1): sodium borohydride 0.5wt%, added once
H2(4): sodium borohydride 0.5wt%, added four times
US60: ultrasonic irradiation for 60 minutes
Figure 4-4. The Effects of Ultrasound and Water (under Oxidizing or
Reducing Environment) on Heavy Metals in Used Oil.

118
The comparison of the effects of ultrasound under oxidative and reduced
environment is depicted in Figure 4-5. It indicates that hydrogen peroxide seemed to
better in removing heavy metals than sodium borohydride (i.e., under reducing
environment).
For the set of experiments conducted using alkaline water (with addition of
Na2SiO3) instead of distilled water to emulsify the used oil samples, the results, as shown
in Figure 4-6 indicate that alkaline condition had very little effect in enhancing the
removal of heavy metals from used oil.
The results from the destructive adsorption process of removing heavy metals
from used oils were depicted in Figure 4-7. Only Zn was selected as the target for
measurement at this preliminary test run. It is clearly to see that either GAC or PAC is
not a good selection for removing heavy metals from used oil. Both of them alone
seemed not only unable to remove the heavy metals from used oil. When they combined
with subsequent ultrasonic irradiation, the GAC test run can merely approach the same
efficiency as ultrasonic irradiation run alone, however, the PAC test run indicates that the
usage of PAC can alter the efficiency of heavy metal removal from used oil in a very
undesirable direction.
Though alumina alone can remove about 30% of Zn from used oil, however,
when subsequent ultrasonic irradiation was applied, it did not improve the removal
efficiency in a noticeable way compared to ultrasonic irradiation test run alone. Overall,
silica gel seemed to perform superiorly in this destructive adsorption case since though

119
0.00
20.00
40.00
60.00
80.00
100.00
120.00
140.00
A1 A1-US60 A1-W-
US60
A1 A1-OH-
US60
A1-W-OH-
US60
Rem
ain
ing
Meta
l C
on
ten
t (%
)
Ba Cd Cr Pb Zn
Operating Condition:
(1) 5 m3/min Ar gas
(2) 25±5ºC
A1: LA-UO1 automotive used oil sample
W: distilled water 20wt% added and emulsified
OH: hydrogen peroxide 1wt% added
US60: ultrasonic irradiation for 60 minutes
Figure 4-5. The Effects of Water and H2O2 on Heavy Metals in Used Oil.
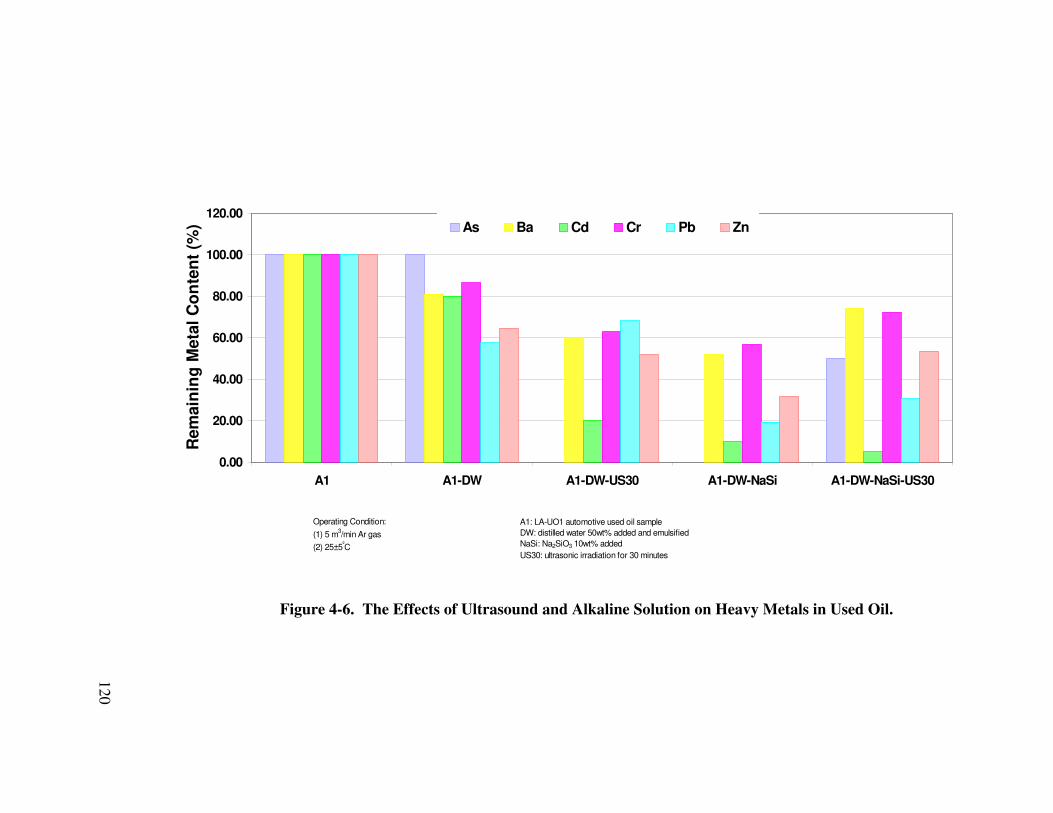
0.00
20.00
40.00
60.00
80.00
100.00
120.00
A1 A1-DW A1-DW-US30 A1-DW-NaSi A1-DW-NaSi-US30
Rem
ain
ing
Meta
l C
on
ten
t (%
) As Ba Cd Cr Pb Zn
Operating Condition:
(1) 5 m3/min Ar gas
(2) 25±5ºC
A1: LA-UO1 automotive used oil sample
DW: distilled water 50wt% added and emulsified
NaSi: Na2SiO3 10wt% added
US30: ultrasonic irradiation for 30 minutes
Figure 4-6. The Effects of Ultrasound and Alkaline Solution on Heavy Metals in Used Oil.
120
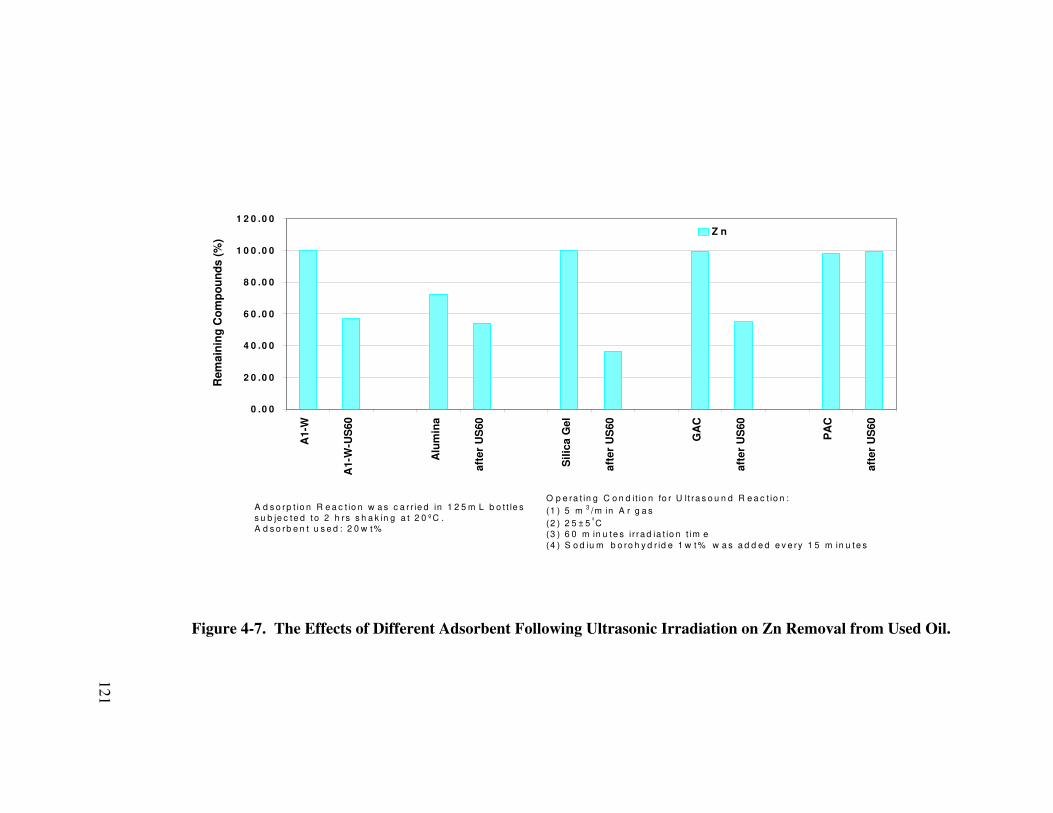
0 .0 0
2 0 .0 0
4 0 .0 0
6 0 .0 0
8 0 .0 0
1 0 0 .0 0
1 2 0 .0 0
A1-W
A1-W
-US
60
Alu
min
a
aft
er
US
60
Sil
ica G
el
aft
er
US
60
GA
C
aft
er
US
60
PA
C
aft
er
US
60
Rem
ain
ing
Co
mp
ou
nd
s (
%)
Z n
O p e ra t in g C o n d it io n fo r U lt ra s o u n d R e a c t io n :
(1 ) 5 m 3 /m in A r g a s
(2 ) 2 5 ± 5 ºC
(3 ) 6 0 m in u te s i r ra d ia t io n t im e
(4 ) S o d iu m b o ro h y d r id e 1 w t% w a s a d d e d e v e ry 1 5 m in u te s
A d s o rp t io n R e a c t io n w a s c a r r ie d in 1 2 5 m L b o t t le s
s u b je c te d t o 2 h rs s h a k in g a t 2 0 ºC .
A d s o rb e n t u s e d : 2 0 w t%
Figure 4-7. The Effects of Different Adsorbent Following Ultrasonic Irradiation on Zn Removal from Used Oil.
121

122
itself alone cannot remove metal constituent from used oil, when subsequent ultrasonic
irradiation was applied with silica gel still inside the used oil samples, it can enhance the
removal efficiency of metal constituent from used oil almost 20% more.
4.3 Optimal Conditions for Destructive Adsorption of Heavy Metals from Used Oil
According to the results from the preliminary test runs, the operating conditions
that gave better performance in destructive adsorption reaction of heavy metal removal
from used oil are:
(1) with hydrogen peroxide present in the emulsified sample
(2) oxidative environment is better
(3) silica gel is the best adsorbent candidate
Thus, with this information in mind, we can optimize the reaction conditions for
Heavy metal removal from used oil.
4.3.1 Water Effect
The study of the effects of water content on heavy metal removal is depicted in
Figure 4-8. The proper amount of water added is crucial to the emulsification of the oil
samples to gain better heavy metal removal rate. However, too much water added to the
oil sample would increase the difficulty later on to separate the water from oil sample.
Hence, from Figure 4-8, we may suggest 20% water content is good enough as the
optimal water content in emulsification of used oil samples.

123
0.00
10.00
20.00
30.00
40.00
50.00
60.00
70.00
80.00
90.00
100.00
10 15 20 25
Water Content (%)
Rem
ain
ing
Meta
l C
on
ten
t (%
)Ba Cd Cr Pb Zn
Operating Condition:
(1) 5 m3/min Ar gas
(2) 25±5ºC
LA-UO1 automotive used oil sample
Hydrogen peroxide 1wt% added
Ultrasonic irradiation for 60 minutes
Figure 4-8. The Effects of Water Content on Heavy Metal Removal from Used Oil.

124
4.3.2 Hydrogen Peroxide Effect
The study of the effects of hydrogen peroxide content on heavy metal removal is
shown in Figure 4-9. Though 1.5% of hydrogen peroxide can give slightly better
removal efficiencies on heavy metals from used oil than 1.0% of hydrogen peroxide used
in the preliminary test runs. However, if we consider from the economic point of view
when this application expands to large scale, it would be more cost-effective using 1.0%
of hydrogen peroxide as the optimal condition.
4.3.3 Oxidative vs. Reducing Environment
In preliminary study, we only use sodium borohydride as the catalysis in the
destructive adsorption reaction since the removal efficiencies for BTEX is much better
under reducing environment. However, it is still worthwhile to study if the removal
efficiencies for heavy metals could be better under oxidative environment. From Figure
4-10, it is clearly to see that when sodium borohydride is added into the used oil sample
every 15 min during the 1-hr reaction, actually it would give very similar result that
hydrogen peroxide can achieve in heavy metal removal from used oil. Hence, for optimal
operating conditions, we can go for either way. However, BTEX compounds removal
efficiency as well as heavy metal removal efficiency from used oil, both should be
considered equally important. Thus, reducing environment may be still the better choice
for destructive adsorption process in used oil de-toxification.

125
0.00
20.00
40.00
60.00
80.00
100.00
Silica Gel W-OH-US60 W-H(4)-US60
Hydrogen Peroxide Content (%)
Rem
ain
ing
Meta
l C
on
ten
t (%
)Ba Cd Cr Pb Zn
Operating Condition:
(1) 5 m3/min Ar gas
(2) 25±5ºC
LA-UO1 automotive used oil sample
Distilled Water 20% added and emulsified
Ultrasonic irradiation for 60 minutes
Figure 4-9. The Effects of Hydrogen Peroxide Content on Heavy Metal Removal
from Used Oil.

126
0.00
20.00
40.00
60.00
80.00
100.00
120.00
Silica Gel W-OH-US60 W-H(4)-US60
Rem
ain
ing
Meta
l C
on
ten
t (%
)
Ba Cd Cr Pb Zn
Operating Condition:
(1) 5 m3/min Ar gas
(2) 25±5ºC
LA-UO1 automotive used oil sample
OH: Hydrogen peroxide 1wt% added
H(4):Sodium borohydride 1wt% addded
every 15 min
Ultrasonic irradiation for 60 minutes
Figure 4-10. The Effects of Oxidative or Reducing Environment on
Destructive Adsorption of Heavy Metal Removal from Used Oil.

127
4.4 Concluding Remarks
Based on the limited results from this Chapter, several conclusions can be drawn
as follow:
(1) The destructive adsorption process, using silica gel as the adsorbent, aided
with following ultrasonic irradiation for heavy metal removal from used lube
oil samples is feasible.
(2) The optimal operating conditions for this proposed process are: 20% water as
the emulsifier, 1wt% of sodium borohydride is added every 15 min for the 1-
hr reaction time to keep the reaction environment under a reducing condition
for better removal efficiency.
128
CHAPTER 5
Destruction of BTEX Compounds in Used Lube Oils
5.1 Introduction
This chapter deals with the study on destruction of BTEX compounds in various
used lube oil samples. Same factors such as surfactant type, H2 source, radical source,
water content, reaction time, purging gas, catalysts that could possibly affect the
destruction efficiencies were studied as in last chapter. Sonochemical process, adsorption
process, and combined destructive adsorption process will be also evaluated individually
and the destruction efficiencies will be compared. .
5.2 Preliminary Test Runs
Same experimental approach and design were carried as in last chapter for the
removal of BTEX compounds from used oil samples.
5.2.1 Factors and Experimental Design
Please refer to Section 4.2.1 through Section 4.2.3.
5.2.2 Materials and Methods
Please refer to Section 4.2.4 through Section 4.2.6.

129
5.2.3 Results of Preliminary Tests on Reduction of BTEX Compounds from Used Oil
The experimental data showing ultrasonic irradiation effect on BTEX compounds
are presented in Figures 5-1 to 5-7. The experiments were conducted by varying the
operating conditions including water content, irradiation time, and addition of chemicals
such as hydrogen peroxide, sodium borohydride, and sodium ortho-silicate. Since
benzene is not detected in any of the four original used oil samples, so only three other
compounds, toluene, ethylbenzene, and xylene are discussed in the results. (BTEX
compounds – mentioned later in this section and in all the figures, represents only these
three compounds.)
For blank sample run, the original sample was placed in the apparatus setup and
subjected to the same operating condition as others: it was purged 5 m3/min argon gas at
25 ± 5℃ for 60 minutes without turning off the power of ultrasound. The analytical data
for this sample will be the basis to compare the removal efficiency, eliminating the effect
from purged argon gas.
The results depicted in Figure 5-1 correspond to the ultrasonic irradiation
experiments for identifying the effects of ultrasound and hydrogen peroxide on BTEX
compounds in used lube oil samples collected in Los Angeles area (LA-UO1, in short of
A1). Among these experimental runs, the greatest reduction in BTEX compounds was
observed when hydrogen peroxide was added to the emulsified sample (A1-W-OH-US60
run).

0.00
20.00
40.00
60.00
80.00
100.00
120.00
A1 A1-W A1-W-
US60
A1 A1-W-OH A1-W-
OH-US60
Rem
ain
ing
BT
EX
Co
mp
ou
nd
s (
%)
Toluene Ethylbenzene Xylene
Operating Condition:
(1) 5 m3/min Ar gas
(2) 25±5ºC
A1: LA-UO1 automotive used oil sample
W: distilled water 20wt% added and emulsified
OH: hydrogen peroxide 1wt% added
US60: ultrasonic irradiation for 60 minutes
Figure 5-1. The Effects of Ultrasound and H2O2 on BTEX Compounds in
Used Oil.
130

131
To study the effect of irradiation time, experimental runs were conducted with two
different irradiation duration times. The results depicted in Figure 5-2 indicate that a
greater BTEX removal rate was achieved with longer irradiation time.
The effects of water (for creating emulsion) and hydrogen peroxide on BTEX
compounds removal from used oil by ultrasonic irradiation are presented in Figure 5-3.
The results indicate that when no hydrogen peroxide was added, extra water and
enhanced emulsification alone could not increase the removal rate for BTEX compounds
under ultrasonic irradiation. The results, however, also indicate that the addition of
hydrogen peroxide could only enhance BTEX removal rate when extra water was added
to the original used lube oil and mechanically emulsified. An opposite effect (low
removal rate) was even observed when hydrogen peroxide was added to the original used
lube oil samples, which were directly subject to ultrasonic irradiation without further
emulsification. This may suggest that hydrogen peroxide is effective only when a certain
amount of water is present.
The results depicted in Figure 5–4 correspond to the ultrasonic irradiation
experiments for different used oil samples. The data also indicate that hydrogen peroxide
could promote the removal rate of BTEX compounds from different used oils that are in
an enhanced emulsified state.
The comparison of the effects of ultrasound under oxidative and reduced
environments is depicted in Figure 5-5 and 5-6. The results in Figure 5-5 indicate that
the periodical addition of sodium borohydride achieved a better BTEX removal
efficiency than single addition prior to the irradiation. Extra water and enhanced
emulsification, however, seemed unnecessary for sodium borohydride to be effective.

0.00
20.00
40.00
60.00
80.00
100.00
120.00
A1 A1-W-OH A1-W-OH-US30 A1-W-OH-US60
Rem
ain
ing
BT
EX
Co
mp
ou
nd
s (
%)
Toluene Ethylbenzene Xylene
Operating Condition:
(1) 5 m3/min Ar gas
(2) 25±5ºC
A1: LA-UO1 automotive used oil sample
W: distilled water 20wt% added and emulsified
OH: hydrogen peroxide 1wt% added
US30: ultrasonic irradiation for 30 minutes
US60: ultrasonic irradiation for 60 minutes
Figure 5-2. The Effect of Ultrasonic Irradiation Time on BTEX Compounds in
Used Oil.
132

0.00
20.00
40.00
60.00
80.00
100.00
120.00
A1 A1-US60 A1-W-
US60
A1 A1-OH-
US60
A1-W-
OH-US60
Re
ma
inin
g B
TE
X C
om
po
un
ds
(%
)
Toluene Ethylbenzene Xylene
Operating Condition:
(1) 5 m3/min Ar gas
(2) 25±5ºC
A1: LA-UO1 automotive used oil sample
W: distilled water 20wt% added and emulsified
OH: hydrogen peroxide 1wt% added
US60: ultrasonic irradiation for 60 minutes
Figure 5-3. The Effects of Water and H2O2 on BTEX Compounds in Used Oil.
133

0.00
20.00
40.00
60.00
80.00
100.00
120.00
A1
A1-O
H-U
S60
A1-W
-OH
-US
60
A2
A2-O
H-U
S60
A2-W
-OH
-US
60
B2
B2-O
H-U
S60
B2-W
-OH
-US
60
Re
ma
inin
g B
TE
X C
om
po
un
ds
(%
)Toluene Ethylbenzene Xylene
Operating Condition:
(1) 5 m3/min Ar gas
(2) 25±5ºC
A1: LA-UO1 automotive used oil sample
A2: LA-UO2 mixed used oil sample
B2: BNL-02 hydraulic fluid sample
W: distilled water 20wt% added and emulsified
OH: hydrogen peroxide 1wt% added
US60: ultrasonic irradiation for 60 minutes
Figure 5-4. The Effects of Ultrasound and Water on BTEX Compounds in Different
Used Oils.
134

0.00
20.00
40.00
60.00
80.00
100.00
120.00
A1 A1-H2(1)-
US60
A1-W-H2(1)-
US60
A1-H2(4)-
US60
A1-W-H2(4)-
US60
Rem
ain
ing
BT
EX
Co
mp
ou
nd
s (
%)
Toluene Ethylbenzene Xylene
Operating Condition:
(1) 5 m3/min Ar gas
(2) 25±5ºC
A1: LA-UO1 automotive used oil sample
W: distilled water 20wt% added and emulsified
H2(1): sodium borohydride 0.5wt%, added once
H2(4): sodium borohydride 0.5wt%, added four times
US60: ultrasonic irradiation for 60 minutes
Figure 5-5. The Effects of Ultrasound and Water (under Reducing Environment)
on BTEX Compounds in Used Oil.
135

0.00
20.00
40.00
60.00
80.00
100.00
120.00
A1 A1-W-OH-US60 A1-W-H2(1)-US60 A1-W-H2(4)-US60
Re
ma
inin
g B
TE
X C
om
po
un
ds
(%
)
Toluene Ethylbenzene Xylene
Operating Condition:
(1) 5 m3/min Ar gas
(2) 25±5ºC
A1: LA-UO1 automotive used oil sample
W: distilled water 20wt% added and emulsified
OH: hydrogen peroxide 1wt% added
H2(1): sodium borohydride 0.5wt%, added once
H2(4): sodium borohydride 0.5wt%, added four times
US60: ultrasonic irradiation for 60 minutes
Figure 5-6. The Effects of Ultrasound and Water (under Oxidizing or Reducing
Environment) on BTEX Compounds in Used Oil.
136

137
From Figure 5-6, it can be concluded that sodium borohydride seemed more
effective in removing BTEX compounds than hydrogen peroxide when it is periodically
added to the reaction system.
One set of experiments was conducted using alkaline water (with addition
Na2SiO3) instead of distilled water to emulsify the used oil samples. The results depicted
in Figure 5-7 indicate that alkaline condition had a poor effect on the removal of BTEX
compounds from used oil samples.
The results from the destructive adsorption process of removing BTEX
compounds from used oils were depicted in Figure 5-8. Alumina is out of question the
one that gives the poorest performance. And it is also clearly to see that either GAC or
PAC alone is a good selection for removing BTEX compounds from used oil, especially
GAC can remove as high as 98% of BTEX compounds from used oil. However, when
they combined with subsequent ultrasonic irradiation, the GAC test run indicate that
around 20 – 30% adsorbed BTEX compounds was released from GAC and get back into
the used oil. Though PAC test run does not show any desorption of BTEX compounds
after further ultrasound irradiation, its overall removal efficiency is not as good as what
silica gel performs.
Overall, silica gel seemed to perform superiorly again in this destructive
adsorption case as it did in last Chapter. Though itself alone cannot remove BTEX
compounds from used oil as GAC can, when subsequent ultrasonic irradiation was
applied with silica gel still inside the used oil samples, it can enhance the removal
efficiency of BTEX compounds from used oil almost 30% more.

0
20
40
60
80
100
120
A1 A1-DW A1-DW-US30 A1-DW-NaSi A1-DW-NaSi-
US30
Re
ma
inin
g B
TE
X C
om
po
un
ds
(%
)Toluene Ethlybenzene Xylene
Operating Condition:
(1) 5 m3/min Ar gas
(2) 25±5ºC
A1: LA-UO1 automotive used oil sample
DW: distilled water 50wt% added and emulsified
NaSi: Na2SiO3 10wt% added
US30: ultrasonic irradiation for 30 minutes
Figure 5-7. The Effects of Ultrasound and Alkaline Solution on BTEX
Compounds in Used Oil.
138

0.00
20.00
40.00
60.00
80.00
100.00
120.00
A1
-W
A1
-W-U
S6
0
Alu
min
a
US
60
Sil
ica
Ge
l
US
60
GA
C
US
60
PA
C
US
60
Re
ma
inin
g B
TE
X C
om
po
un
ds
(%
) Benzene Toluene Ethylbenzene Xylene
Operating Condition for Ultrasound Reaction:
(1) 5 m3/min Ar gas
(2) 25±5ºC
(3) 60 minutes irradiation time
(4) Sodium borohydride 1wt% was added every 15 minutes
Adsorption Reaction was carried in 125mL bottles
subjected to 2 hrs shaking at 20ºC.
Adsorbent used: 20wt%
Figure 5-8. The Effects of Different Adsorbent Following Ultrasonic Irradiation on BTEX Compounds in Used Oil.
139

140
5.3 Optimal Conditions for Destructive Adsorption of BTEX Compounds from
Used Oil
In order to meet the consistency with the optimal conditions for destructive
adsorption of heavy metals from used oil, not only the results from the preliminary test
runs have to evaluated, also the conclusion from Section 4.3 is necessarily to the
operating conditions that gave better performance in destructive adsorption reaction of
BTEX Compounds removal from used oil
5.3.1 Water Effect
The study of the effects of water content on BTEX compounds removal is
depicted in Figure 5-9. Very similar result to the heavy metal removal can be concluded,
we may still suggest 20% water content is good enough as the optimal water content in
emulsification of used oil samples.
5.3.2 Sodium Borohydride Effect
The study of the effects of sodium borohydride content on BTEX compounds
removal from used oil is shown in Figure 5-10. Though 1.5% of sodium borohydride
can give slightly better removal efficiencies on heavy metals from used oil than 1.0% of
hydrogen peroxide used in the preliminary test runs. Same consideration could be
applied here as in Section 4.3.2, from the economic point of view when this application
expands to large scale, it would be more cost-effective using 1.0% of sodium borohydride
as the optimal condition.

0.00
20.00
40.00
60.00
80.00
10 15 20 25
Water Content (%)
Rem
ain
ing
BT
EX
Co
mp
ou
nd
s (
%)
Benzene Toluene Ethylbenzene Xylene
Operating Condition:
(1) 5 m3/min Ar gas
(2) 25±5ºC
LA-UO1 automotive used oil sample
Sodium borohydride 1wt% addded every 15 min
Ultrasonic irradiation for 60 minutes
Figure 5-9. The Effects of Water Content on BTEX Compounds Removal from
Used Oil.
141

0.00
10.00
20.00
30.00
40.00
50.00
60.00
0.5 1 1.5
Sodium Borohydride Added Every 15 min (wt%)
Rem
ain
ing
BT
EX
Co
mp
ou
nd
s (
%)
Benzene Toluene
Ethylbenzene Xylene
Operating Condition:
(1) 5 m3/min Ar gas
(2) 25±5ºC
LA-UO1 automotive used oil sample
Distilled Water 20% added and emulsified
Ultrasonic irradiation for 60 minutes
Figure 5-10. The Effects of Sodium Borohydride on BTEX Compounds
Removal from Used Oil.
142

143
5.3.3 Oxidative vs. Reducing Environment
In preliminary study, we only use sodium borohydride as the catalysis in the
destructive adsorption reaction since the removal efficiencies for BTEX compounds
subject to ultrasonic irradiation reaction alone is much better under reducing environment.
However, it is necessary to study if the removal efficiencies for BTEX compounds could
be better under oxidative environment undergoing destructive desorption reaction. From
Figure 5-11, it is clearly to see that when sodium borohydride is added into the used oil
sample every 15 min during the 1-hr reaction, actually it would give a better result that
hydrogen peroxide can achieve in BTEX compounds removal from used oil. Hence, for
optimal operating conditions, reducing environment may be still the better choice for
destructive adsorption process in used oil de-toxification for both heavy metals as well as
BTEX compounds.

0.00
20.00
40.00
60.00
80.00
100.00
Silica Gel W-OH-US60 W-H(4)-US60
Rem
ain
ing
BT
EX
Co
mp
ou
nd
s (
%)
Benzene Toluene Ethylbenzene Xylene
Operating Condition:
(1) 5 m3/min Ar gas
(2) 25±5ºC
LA-UO1 automotive used oil sample
OH: Hydrogen peroxide 1wt% added
H(4):Sodium borohydride 1wt% addded
every 15 min
Ultrasonic irradiation for 60 minutes
Figure 5-11. The Effects of Oxidative or Reducing Environment on
Destructive Adsorption of BTEX Compounds Removal from
Used Oil.
144

145
5.4 Concluding Remarks
Based on the limited results from this Chapter, several conclusions can be drawn
as follow:
(1) The destructive adsorption process, using silica gel as the adsorbent, aided
with following ultrasonic irradiation for BTEX Compounds removal from
used lube oil samples is feasible.
(2) The optimal operating conditions for this proposed process are: 20% water as
the emulsifier, 1wt% of sodium borohydride is added every 15 min for the
1-hr reaction time to keep the reaction environment under an reducing
condition for better removal efficiency.

146
CHAPTER 6
Conclusions and Recommended Future Work
6.1 Summary and Conclusions
This dissertation is the preliminary study of sonochemical process and destructive
desorption process enhanced by sonochemical process for the toxin reduction of used oil.
The main two categories of toxins focused in this study are heavy metals and BTEX
compounds. These two categories of toxic contaminants intruded into lube oil during its
usage will eventually end up in the used lube oil bulk and cause severe problems in any
current options for recycling and reuse of used lube oils. Thus it is
The following summarizes some of the important conclusions which are based on
the work and materials presented in this dissertation. Also, some recommendations that
could improve the understanding the applicability of these processes are made for future
study.
(1) Used oil is a valuable resource and a vital source of energy. Oil does not wear out;
it just gets dirty after use. Thus, used oil still has lubricating value and heat value.
Following the proper treatment to remove contaminants, used oil can be re-refined
into base lube oil, reprocessed as fuel oil, or used as feedstock to produce
petroleum-based products or other commercially valuable products via different
processes.

147
(2) The proper management of used oil is a very important issue because used oil
often contains metals, chlorinated hydrocarbons and other organic compounds,
including many that are listed as priority pollutants by the U.S. EPA. If used oil
is mismanaged, the effects upon the environment will be detrimental. Since used
oil is generated in large quantities, estimating more than 1.5 billions gallons per
year in the U.S., that the associated impact to the environment is huge when there
is uncontrolled dumping and landfilling of used oil in the environment.
(3) Two major sources of used oil are automotive and industrial used oil. Automotive
used oil tends to have a high concentration of potentially hazardous heavy metals,
usually as the result of the engine or bearing wear, or the inclusion of these metals
in oil additives. Industrial used oil tends to have a high level of chlorinated
hydrocarbons and PCBs through careless management practices. The presence of
other toxic organic compounds like benzene or naphthalene is usually associated
with the oil formulation itself.
(4) The destructive adsorption process, using silica gel as the adsorbent, aided with
following ultrasonic irradiation for both heavy metal removal as well as BTEX
compounds removal from used lube oil samples is feasible. And the removal
efficiencies for both categories of toxic contaminants are better than undergone
ultrasonic irradiation alone.
(5) The proper amount of water added is crucial to the emulsification of the used oil
samples to gain better heavy metal removal or BTEX compounds removal
efficiencies. However, too much water added to the used oil sample would

148
increase the difficulty in separating water from oil and may cause unexpected
problems to the following recycle or reuse options.
(6) The optimal operating conditions for this proposed process are: 20% water as the
emulsifier, 1wt% of sodium borohydride is added every 15 min for the 1-hr
reaction time to keep the reaction environment under an reducing condition for
better removal efficiency.
(7) Cost estimation or techno-economic evaluation for this proposed process has not
been considered in this thesis due to the insufficient information. And it has to be
compared against some other currently readily-in-use options in this industry in
order to evaluate both the economic and technical feasibility to expand this
application to used oil recycle industry.
6.2 Recommended Future Work
(1) The intensity of ultrasound would affect the degree of chemical reaction. The use
of high power and continuous-type ultrasound need to be studied. They may
enhance the removal efficiencies of the process.
(2) Though it is preferred to conduct the reaction process under room temperature
from the energy-saving point of view, however, the effect of temperature on the
removal efficiency also needs to be determined.
(3) Destructive adsorption reaction is reported feasible on the destruction of some
chlorinated hydrocarbons at reaction temperature of 300-500℃. Since chlorinated
hydrocarbon is also a potential contaminant category in used oil (especially used

149
industrial lube oil), this could be interest research direction. Because though
ultrasonic reaction is often carried out at near room temperature, but the sample
under ultrasonic irradiation is actually contains many many high-temperature and
high-pressure spots locally, thus maybe similar results could be drawn as other
destructive adsorption of reported chlorinated compounds.

150
REFERENCES
Ali, Mohammad Farhat, Faizur Rahman, and Abdullah J. Hamdan, (1996). Techno-Economic Evaluation of Waste Lube Oil Re-refining. Int. J. of Production Economics, 42(April 1): 263-73. American Petroleum Institute, (1996). National Used Oil Collection Study, Washington, DC, May. American Petroleum Institute, (1997). Study of Used Motor Oil Recycling in Eleven
Selected Countries, Washington, DC, November. April, Gary C., and Sheri D. Powell, (1994). Project Rose® (Recycled Oil Saves Energy): Alabama’s Used Oil Recycling Program. Waste. Manag., 14(3-4): 237-241. Arner, R., (1992). Used Oil Recycling Markets and Best Management Practice in the United States. Presented to the National Recycling Congress, Boston, MA, September. Basmadjin, Diran, (1997). The Little Adsorption Book: A Practical Guide for Engineers
and Scientists. CRC Press, Boca Raton, FL. Berlan, J., and J. Timothy Mason, (1992). Sonochemistry: from Research Laboratories to Industrial Plants. Ultrasonics, 30(4): 203-212. Bhan, O. K., W.P. Tai, and D.W. Brinkman, (1986). Hydrotreat Used Lube Oil. Hydro.
Proc. (International edition), 65(April): 67-8. Bhatnagar, Ashish, and H. Michael Cheung, (1994). Sonochemical Destruction of Chlorinated C1 and C2 Volatile Organic Compounds in Dilute Aqueous Solution. Environ. Sci. Technol., 28 (8): 1481-1486. Brinkman, Dennis W., (1987). Technologies for Re-refining Used Lubricating Oil. Lub.
Eng., 43 (5): 324-328. Brinkman, Dennis, W., (1991). Large Grasstroots Lube Rerefinery in Operation. Gas
Oil J., 89: 60-63 California Integrated Waste Management Board, (1997). California’s Used Oil
Recycling Program, Used Oil Recycling Rate Biannual Report: 1997. Pub. #333-97-021, Sacramento, CA, December. California Integrated Waste Management Board, (1998). California’s Used Oil
Recycling Program. Pub. #332-97-014, Sacramento, CA, April.

151
Catallo, W. James, and Thomas Junk, (1995). Sonochemical Dechlorination of Hazardous Wastes in Aqueous Systems. Waste Manage., 15 (4): 303-309. Chen, J.R., X.-W. Xu, A.S. Lee, and T.F. Yen, (1990). A Feasibility Study of Dechlorination of Chloroform in Water by Ultrasound in the Presence of Hydrogen Peroxide. Environ. Technol., 11: 829-836. Chen, J. R., (1998). The Feasibility Studies of Radical-Induced Dehalogenation Process: Destruction of Chloroform, PBB, and PCB. Ph.D. Dissertation. Civil and Environmental Engineering Department, University of Southern California. Cheung, H. Michael, Ashish Bhatnagar, and Greg Jansen, (1991). Sonochemical Destruction of Chlorinated Hydrocarbons in Dilute Aqueous Solution. Environ. Sci.
Technol., 25(8): 1510-1512 Cheung, H. Michael, and Shreekumar Kurup, (1994). Sonochemical Destruction of CFC 11 and CFC 113 in Dilute Aqueous Solution. Environ. Sci. Technol., 28(9): 1619-1622. Cigizoglu, K. Bari, Turgut Özakta, and Fìlìz Karaosmanoglu, (1997). Used Sunflower Oil as an Alternative Fuel for Diesel Engines. Energy Sources, 19(6): 559-566. Cintas, Pedro, and Jean-Louis Luche, (1999). Green Chemistry: The Sonochemical Approach. Green Chemistry, (6): 115-125. Colussi, A.J., Hui-Ming Hung, and Michael R. Hoffmann, (1999). Sonochemical degradation Rates if Volatile Solutes. J. Phys. Chem. A (103): 2696-2699. Colussi, A.J., and M.R. Hoffmann, (1999). Vapor Supersaturation in Collapsing Bubbles. Relevance to the Mechanisms of Sonochemistry and Sonoluminescence. J. Phys. Chem.
A (103): 11336-11339. Crittenden, Barry, and W. John Smith, (1998). Adsorption Technology & Design. Butterworth-Heinemann, Jordan Hill, Oxford. Cuesta, C., F.J. Sanchez-Muniz, and C. Garrido-Polonio, (1993). Thermoxidative and Hydrolytic Changes in Sunflower Oil Used in Fryings with a Fast Turnover of Fresh Oil. J. Am. Oil Chem. Soc., 70(Nov.): 1069-1073. Cum, G., G. Galli, and R. Gallo, (1992). Role of Frequency in the Ultrasonic Activation of Chemical Reactions. Ultrasonics, 30(4): 267-270. Dandik, Levent, H. Ayse Aksoy, and Ayse Erdem-Senatalar, (1998). Catalytic Conversion f Used Oil to Hydrocarbon Fuels in a Fractionating Pyrolysis Reactor. Energy & Fuels, 12(6): 1148-1152.

152
Del Duca, M.E., M.O. Yeager, and F. Hovorka, (1958). Isotopic Techniques in the Study of the Sonochemical Formation of Hydrogen Peroxide. J. Acoustic Soc. Am., 30(4): 301. De Visscher, Alex., Peter Van Eenoo, and David Drijvers, (1996). Kinetic Model for the Sonochemical Degradation of Monocyclic Aromatic Compounds in Aqueous Solution. J.
Phys. Chem., 100: 11636-11642. Do, Duong D., (1998). Adsorption Analysis: Equilibria and Kinetics. Imperial College Press, London, UK. dos Reis, M. Alves, and M.Silva Jeronimo, (1988). Waste Lubricating Oil Rerefining by Extraction-Flocculation. 1. A Scientific Basis to Design Efficient Solvents. Ind. Eng.
Chem. Res., 27: 1222-1228. dos Reis, M. Alves, (1991). Waste Lubricating Oil Refining by Extraction – Flocculation. 3. A Pilot Study. Ind. Eng. Chem. Res., 30(11): 2449-2456. Dougherty, Erika L., Michael R. Overcash, and Arnold L. McPeters, (1991). Estimated TCDD Photodegradation in Waste Motor Oil. Haz. Waste Haz. Mat., 8(4): 313-317. Downing, Sherri, Scott Marckini, and Bill Rondeau, (1997). Chlorine Dioxide Provides Solutions for Waste Oil Refinery. Water/Eng. Manage., 144(Feb.):. 34-37+. Eaton, Andrew D., Lenore S. Clesceri, and Arnold E. Greenberg, ed., (1995). Standard
Methods for the Examination of Water and Wastewater. 19th ed., APHA, AWWA, WEF, American Public Health Association, Washington DC. Energy and Environmental Research Corporation, (1988). Guide to Oil Waste
Management Alternatives. Irvine, CA, April. Fang, C.S., and P.M.C. Lai, (1995). Microwave Heating and Separation of Water-in-Oil Emulsions. Journal of Microwave Power & Electromagnetic Energy, 30(1): 46-57. Fendler, J.H., (1982). Membrane Mimetic Chemistry, John Wiley & Sons, New York, NY. Flint, E. B., and K.S. Suslick, (1991). The Temperature of Cavitation. Sci., 253: 1397-1399. Fong, Wing Sien, (1975). Proteins from Hydrocarbons. Supplement Report No. 60A prepared by the process economic program of Stanford Research Institute, Menlo Park, CA.

153
Frederick, Julian R., (1965). Ultrasonic Engineering. John Wiley & Sons, Inc., New York, NY. Gallup, Darrell L., (1996). Reducing the Leachable Lead Content of Used Oil Filter Paper. Environ. Prog., 15(1): 62-68. Gödde, U., and A. Golloch, (1991). Determination of Total Chlorine in Waste Oil. Fresenius J. Anal Chem., (339): 15-18. Gooberman, G.L., (1968). Ultrasonics: Theory and Applications. Hart Publishing Co. Inc., New York, NY. Gourgouillon, Didier, Luc Schrive, and Stephane Sarrade, (2000). An environmental friendly process for the regeneration of used oils. Environ Sci Technol , 34(16): 3469-3473.
Harbison, Raymond D., (ed.), (1998). Hamilton & Hardy’s Industrial Toxicology. 5th ed., Mosby-Year Book Inc., St. Louis, MI. Harrison, Charles, (1994). The Engineering Aspects of a Used Oil Recycling Project. Waste Manag., 14(3-4): 231-235. Hansen, Charles M., (2000). Hansen Solubility Parameters: A User’s Handbook. CRC Press. Boca Raton, FL. Henglein, Arnim, Daniel Herburger, and Maritza Gutierrez, (1992). Sonochemistry: Some Factors that Determine the Ability of a Liquid to Cavitate in an Ultrasonic Field. J.
Phys. Chem., 96 (Feb. 6): 1126-1130. Herrmann, N., and J, McClements, (1999). Ultrasonic Propagation in Highly Concentrated Oil-in-Water Emulsions. Langmuir, (15): 7937-7939. Hess, L. Y., (1979). Reprocessing and Disposal of Waste Petroleum Oils. Noyes Data Corporation, Park Ridge, NJ. Hong, Qi, Joanna L. Hardcastle, Ross A, J, McKeown, Frank Marken, and Richard G. Compton, (1999). The 20 kHz Sonochemical Degradation of Trace Cyanide and Dye Stuffs in Aqueous Media. New J. Chem., 23(8): 845-849. Hua, Inez, and Michael R. Hoffmann, (1996). Kinetics and Mechanism of the Sonolytic Degradation of CCl4: Intermediates and Byproducts. Environ. Sci. Technol., 30(3): 864-871.

154
Hunicke, R.L., (1990). Industrial Applications of High Power Ultrasound for Chemical Reactions. Ultrasonics, 28(Sept.): 291-294. Information Transfer Inc., (1974). Proceedings of the International Conference on Waste
Oil Recovery and Reuse, February 12-14, 1974, Washington, DC, sponsored by Association of Petroleum Re-Refiners, Washington, DC. Ingale, Muralidhar N., and Vijaykumar V. Mahajani, (1995). A Novel Way to Treat Refractory Waste: Sonication Followed by Wet Oxidation (SONIWO). J. Chem. Technol.
Biotechnol., 64(Sept.): 80-86. Irwin, William A. and Richard A. Liroff, (1974). Used Oil Law in the United States. Prepared for Office of Research and Development, U.S. Environmental Protection Agency. U.S. Government Printing Office, Washington, DC. J. Air Waste Manage. Assoc., Editor Board, (1992). Burning Used Oil Tagged as Top Source of Airborne Lead Emissions. J. Air & Waste Manage. Assoc., 42(Jan.): 8+. Jefferies, Adrian, and Jo Ameye, (1998). RULER™ and Used Engine Oil Analysis Programs©. Lub. Eng., 54(5): 29-34. Kang, Joon-Wun, (1998). Kinetics and Mechanism of the Sonolytic Destruction of Methyl tert-Butyl Ether by Ultrasonic Irradiation in the Presence of Ozone. Environ. Sci.
Technol., 32(20): 3194-3199. Karagosmanoglu, Fìlìz, Ülker Gürbüz Beker, (1996). Used Oil as a Fuel Oil Alternative. Energy Sources, 18(6): 637-644. Kendall, Douglas S., Stanley D. Schoenwald, and Marcela Siao, (1995). The Determination of Sulfur and Chlorine in Used Oil by X-ray Fluorescence, ICP and Ion Chromatography. Hazardous Waste & Hazardous Materials, 12 (4): 373-380.
Kiselev, V. F. (Vsevolod Fedorovich), and O.V. Krylov, (1989). Adsorption and
Catalysis on Transition Metals and Their Oxides. Springer-Verlag, New York, NY. Koper, Olga, Isabelle Lagadic,and Kenneth J. Klabunde, (1997a). Destructive Adsorption of Chlorinated Hydrocarbons on Ultrafine (Nanoscale) Particles of Calcium Oxide. 2. Chem. Mater. (9): 838-848. Koper, Olga, and Kenneth J. Klabunde, (1997a). Destructive Adsorption of Chlorinated Hydrocarbons on Ultrafine (Nanoscale) Particles of Calcium Oxide. 3. Chloroform, Trichloroethene, and Tetrachloroethene. Chem. Mater. (9): 2481-2485.

155
Kotronarou, A., G. Mills, and, M.R. Hoffmann, (1991). Ultrasonic Irradiation of p-Nitrophenol in Aqueous Solution. J. Phys. Chem., 95(May 2): 3630-3638. Kotronarou, A., G. Mills, and Michael.R. Hoffmann, (1992a). Decomposition of Parathion in Aqueous Solution by Ultrasonic Irradiation. Environ. Sci. Technol., 26(7): 1460-1462. Kotronarou, A., G. Mills, and M.R. Hoffmann, (1992b). Oxidation of Hydrogen Sulfide in Aqueous Solution by Ultrasonic Irradiation. Environ. Sci. Technol., 26(12): 2420-2428. Ku, Young, Kuo-Yi Chen, and Kuen-Chyr Lee, (1997). Ultrasonic Destruction of 2-Chlorophenol in Aqueous Solution. Water Res., 31(Apr.): 929-935. Lai, Edward P.C., and Robert S. Vucic, (1993). Kinetic Study of the Degradation of Lubricating Motor Oil by Liquid Chromatography and Photoacoustic Spectrometry. Fresenius J. Anal Chem., (347): 417-422. Larsen, B., R. Tilio, and S. Kapila, (1991). A DMSO-Based Cleanup Procedure for Determination of PCBs in Waste Oil. Chemosphere, (8-10): 1077-1084. Lian, H., and T.F. Yen, (1994). Air-Blown Asphalt Made from Temperature and Ambient Pressure under Ultrasound, Asphaltic Particles in Fossil Fuel Exploration, Recovery,
Refining, and Production Process, Plenum Press, New York, NY, p. 193-203. Lin, Jun-Gaw, and Ying-Shih Ma, (1999). Magnitude of Effect of Reaction Parameters on 2-Chlorophenol Decomposition by Ultrasonic Process. J. Hazardous Materials B, 66: 291-305. Lin, Jiunn-Ren, and Teh Fu Yen, (1993). An Upgrading Process through Cavitation and Surfactant. Energy & Fuels, 7(1): 111-118. Lin, S.H., and W.J. Lan, (1998). Waste oil/water emulsion treatment by membrane processes. Journal of Hazardous Materials, 59(2-3): 189-199. Luche, Jean-Louis, (1998). Synthetic Organic Sonochemistry. Plenum Press, New York, NY. Mason, Timothy J., and J. Phillip Lorimer, (1988). Sonochemistry: Theory, Applications
and Uses of Ultrasound in Chemistry. Ellis Horwood Limited, West Sussex, England. McClements, D.J., (1996). Principles of Ultrasonic Droplet Size Determination in Emulsions. Langmuir. (12): 3454-3464.

156
Mason, Timothy J., (Ed), (1990). Chemistry with Ultrasound. Elsevier, London, UK. Mason, T.J., (1992). Industrial Sonochemistry: Potential and Practicality. Ultrasonics, 30(3): 192-196. Mason, Timothy J. (1999). Sonochemistry. Oxford University Press, Oxford, UK. McKeagan, David J., (1992). Economics of Rerefining Used Lubricants. Lub. Eng., 48(5): 418-423. Moholkar, Vijayanand S., and Aniruddha B. Pandit, (1997). Bubble Behavior in Hydrodynamic Cavitation: Effect of Turbulence. AIChE J., 43(6): 1641-1648. Moliner, Rafael, María Lázaro, and Isabel Suelves, (1997). Valorization of Lube Oil Waste by Pyrolysis. Energy & Fuels, 11(6): 1165-1170. Morgan, J.W., and C.F. Forster, (1992). A Comparative Study of the Sonication of Anaerobic and Activated Sludges. J. Chem. Tech. and Biotechnol., 55(1): 53-58. Moroi, Yoshikiyo, (1992). Micelles: Theoretical and Applied Aspects. Plenum Press, New York, NY. Mortier, R.M., and S.T. Orszulik, (Ed.), (1997). Chemistry and Technology of Lubricants, Blackie Academic & Professional, Great Britain. Moser, W.R., B.J. Marshik, J. Kingsley, M. Lemberger, R. Willette, A. Chan, Joseph E. Sunstrom, A. Boye, (1995). The Synthesis and Characterization of Solid-State Materials Produced by High Shear-Hydrodynamic Cavitation. J. Mater. Res., 10(9): 2322-2335. Mouche, Carol, (1995). Managing Used Oil: Sorbent Technologies Promote Compliance with Used Oil Standards. Pollution Eng., 27(Oct.): 40-43. Mueller Associates, Inc., (1989). Waste Oil: Reclaiming Technology, Utilization, and
Disposal. Noyes Data Corp., Park Ridge, NJ. Nagata, Yoshio, Kyozo Hirai, Hiroshi Bandow, and Yasuaki Maeda, (1996). Decomposition of Hydroxybenzoic and Humic Acids in Water by Ultrasonic Irradiation. Environ. Sci. Technol. 30(4): 1133-1138. Nemerow, Nelson L., and Avijit Dasgupta, (1991). Industrial and Hazardous Waste
Treatment. Van Nostrand Reinhold, New York, NY, p 658-661, 691-692. Nolan, J.J., C. Harrism and P.O. Cavanaugh, (1990). Used oil: Disposal Options,
Management Practices and Potential Liability. 3 rd ed. Government Institutesm Inc., Rockville, MD.

157
Nye, M. J., T.W. Williamson, and S. Deshpande, (1983). Conversion of Used Frying Oil to Diesel Fuel by Transesterification: Preliminary Tests. J. Am. Oil Chem. Soc., 60(Aug.): 1598-1601. Oil & Gas J., Editing Board, (1997). Depoisoning Process Turns Used Oil into Valuable Feed. Oil. Gas. J., 95: 61. O'Keefe, William, (1988). What is the Best Way to Sample and Inspect Lube Oil (Question and Answers). Power, 132 (Jan.): 69-70. Özgülsün, Aykut, and Filiz Karaosmanoğlu, (1999). Environmental Friendly Lubricating Oil Candidate. Appl. Biochem. Biotechnol., (77-79): 83-89. Park, J.K., and T.F. Yen, (1995). Ultrasonic Degradation of Polycyclic Aromatic Hydrocarbons, Bioremediation of Recalcitrant Organics, Vol. 7 of In-situ and Onsite
Bioremediation, Battele Press, Columbus, OH, p. 31-39. Peaslee, Kent D., (1994). Recycling Used Automotive Oil Filters. JOM, 46: 44-46. Peaslee, Kent D., (1995). Researcher Targets Recycling of Oil Filters. Advanced
Materials & Processes, 148(Nov.): 6. Personal communication: Ms. Jean Burn, Evergreen Oil, Newark, CA. 1-510-795-4401. Mr. Sean Campbell, Cal. Int. Waste Manage. Board, Sacramento, CA. 1-800-466-4744. Mr. James Prado, Rosemead Oil, Santa Fe Spring, CA. 1-562-941-3261 Mr. Greg Hutchison, Safety-Kleen, Chicago, IL. 1-800-535-5407. Petrier, Christian, Andre Jeunet, and Jean-Louis Luche, (1992a). Unexpected Frequency Effects on the Rate of Oxidative Processes Induced by Ultrasound. J. Am. Chem. Soc. 114(Apr. 8): 3148-3150. Petrier, Christian, Marc Micolle, and Gerard Merlin, (1992b). Characteristics of Pentachlorophenate Degradation in Aqueous Solution by Means of Ultrasound. Environ.
Sci. Technol., 26(8): 1639-1642. Petrier, Christian, Yu Jiang, and Marie-Francoise Lamy, (1998). Ultrasound and Environment: Sonochemical Destruction of Chloroaromatic Derivatives. Environ. Sci.
Technol., 32(8): 1316-1318. Pradyot, Patnaik, (1992). A Comprehensive Guide to the Hazardous Properties of
Chemical Substances. Van Nostrand Reinhold, New York. Pyziak, Tom, and Dennis W. Brinkman, (1993). Recycling and Re-Refining Used Lubricating Oils. Lub. Eng., 49(May): 339-346.

158
Rouquerol, Françose, Jean Rouquerol, and Kenneth Sing, (1999). Adsorption by
Powders & Porous Solids – Principles, Methodology and Applications. Academic Press, London. Rouquerol, J., (1990). Impact of Science on Society, UNESCO, Paris, (157): 5. Sadeghi, Kazem M., Mohammad-Ali Sadeghi, Jih-Fen Kuo, Long-Kuan Jang, Jiunn-Ren Lin, and The Fu Yen, (1992). A New Process for Tar Sand Recovery. Chem. Eng.
Comm., 117: 191-203. Sadeghi, Kazem M., Henrique C.G. do Nascimento, Mohammad-Ali Sadeghi, Lian Sheng Wang, Yu Wang, and Teh Fu Yen, (1994). Polynuclear Aromatic Compounds in Coal and Oil Shale Wastewater: an Environmental Concern. Fuel Sci. Technol. Int’l, 12(10): 1393-1412. Sadeghi, Kazem M., Jiunn-Ren Lin, and The Fu Yen, (1994). Sonochemical Treatment of Fossil Fuels. Energy Sources, 16: 439-449. Schramm, Laurier, L., (Ed.), (1992). Emulsions: Fundamental and Applications in the
Petroleum Industry. American Chemical Society, Washington, DC. Serpone, Nick, Rita Terzian, and Hisiao Hidaka, (1994). Ultrasonic Induced Dehalogenation and Oxidation of 2-, 3-, and 4-Chlorophenol in Air-Equilibrated Aqueous Media. Similarities with Irradiated Semiconductor Particulates. J. Phys. Chem., 98(Mar. 10): 2634-2640. Seymour, James D., and Ram B. Gupta, (1997a). Oxidation of Aqueous Pollutants Using Ultrasound: Salt-Induced Enhancement. Ind. & Eng. Chem. Res., 36(9): 3453-3457. Seymour, James D., Henry C. Wallace, and Ram B. Gupta, (1997b). Sonochemical Reactions at 640kHz Using an Efficient Reactor. Oxidation of Potassium Iodide. Ultrasonics Sonochemitry., 4: 289-293. Shah, Y.T., A.B. Pandit, and V.S. Moholkar, (1999). Cavitation Reaction Engineering. Kluwer Academic / Plenum Publishers, New York, NY. Shekerov, O.S., and L.D. Raigorodskii, (1990). X-Ray Spectrometric Analysis of Used Lubricating Oil. ??? 1196-1198. Simiele, Gerald A., Robert A. Gjeld, and Carlton Robertson, (1987). Radioactive Decontamination of Waste Oil by Filtration, Centrifugation, and Chelation. Nuclear
Chem. Waste Manage., 7(3-4): 257-263.

159
Skala, Dejan U., Marko D. Saban, and Aleksandar M. Orlovic, (1991). Hydrotreating of Used Oil: Prediction of Industrial Trickle-Bed Operation from Pilot-Plant Data. Indus. &
Eng. Chem. Res., 30 (Sept.): 2059-2065. Suri, Rominder P.S., Michael R. Paraskewich, Jr., and Qibin Zhang, (1999). Effect of Process Variables on Sonochemical Destruction of Aqueous Trichloroethylene. Environ.
Eng Sci., 16(5): 345-352. Sutcliffe, Carol R., Ernest S. Gladney, Deanna M. Seitz, and George H. Brooks, (1989). Comparison of Screening Techniques for Polychlorinated Biphenyls in Waste Oils. Anal.
Chem., 61(23): 2682-2686. Suslick, K.S., J.J. Gawienoski, P.F. Schubert, H.H. Wang, (1983). Alkane Sonochemistry. J. Phys. Chem., 87: 2299-2301. Suslick, K.S., D.A. Hammerton, and R.E. Cline Jr., (1986). The Sonochemical Hot Spot. J. Am. Chem. Soc., 108: 5641-5642. Suslick, Kenneth S., (Ed), (1988). Ultrasound: It’s Chemical, Physical, and Biological
Effects. VCH, New York, NY. Suslick, Kenneth S., (1989). The Chemical Effects of Ultrasound. Sci. Am., 260(Feb.): 80-86. Suslick, K.S., (1990). Sonochemistry. Sci., 247:1439-1445. Suslick, Kenneth S., Millan M. Mdleleni, and Jeffrey T. Ries, (1997). Chemistry Induced by Hydrodynamic Cavitation. J. Am. Chem. Soc., 119(Oct. 1): 9303-9304. Taucher-J-A., (1992). PCDD, PCDF, and PCB Emission under Variable Operating Conditions from a Waste Oil Furnace. Chemosphere, 25(7-10): 1429-1433. Tchobanoglous, George, Hilary Theisen, and Samuel A. Vigil, (1993). Integrated Solid
Waste Management. McGraw-Hill, New York, NY, p 754-758. Thomson, William J., (2000). Introduction to Transportation Phenomena. Prentice Hall, Upper Saddle River, NJ. The Merck Index on CD ROM: An Encyclopedia of Chemicals, Drugs, and Biologicals, (1996). ver. 12:1, Chapman & Hall, London. U.S. Environmental Protection Agency, (1992a). Final Listing Decision for Used Oils Destined for Disposal. Fed. Reg., 57(98): 21524-21534. May 20.

160
U.S. Environmental Protection Agency, (1992b). Hazardous Waste Management System; Identification and Listing of Hazardous Waste; Recycled Used Oil Management Standards. Fed. Reg., 57(176): 41566-41626. September 10. U.S. Environmental Protection Agency, (1994). Environmental Regulations and
Technology: Managing Used Motor Oil. EPA/625/R-94/010, Office of Research and Development, Washington, DC, December. U.S. Environmental Protection Agency, (1996a). 40 CFR, Parts 190-259 (The Resource
Conservation and Recovery Act, Subtitle D, Regulations). U.S. Environmental Protection Agency, (1996b). 40 CFR, Parts 260-299 (The Resource
Conservation and Recovery Act, Subtitle C, Regulations). Wentz, C.A., and F. Basler, (1991). The Dechlorination of Used Oil Products. Hazardous Waste & Hazardous Materials, 8(1): 55-68. Wu, Jiann M., H.S. Huang, and C.D. Livengood, (1992). Ultrasonic Destruction of Chlorinated Compounds in Aqueous Solution. Environ. Progress, 11(Aug): 195-201. Yasuda, Keiji, Misako Tachi, Yoshiyuki Bando, and Masaaki Nakamura, (1999). Effect of Liquid Mixing on Performance of Porphyrin Decomposition by Ultrasonic Irradiation. J. Chem. Eng. Jpn, 32(3): 347-349. Yates, R.A., and J.D. Caldwell, (1992). Adsorptive Capacity of Active Filter Aids for Used Cooking Oil. J. Am. Oil Chem. Soc., 69(Sept.): 894-897.

161
Appendix A
Detailed Engineering Layout for the Hydrocarbon to Protein Process
Biomass Production from Oil Wastes:
(1) Fermentation Section
(2) Lipid Extraction and Product Drying Section
(3) Detergent Wash Section

Waste Oil Tank
Sludge
Nutrient Feed Tank
Mixing Tank
Air Pump
Culture
FermentorCulture
Fermentor
Concentrated Active Biomass Storage
Centrifuge
Autolyzer
Heat Exchanger
To Lipid Extraction andProduct Drying Section
To Scrubber
Figure A-1. Biomass Production from Oil Wastes: Fermentation Section.
162
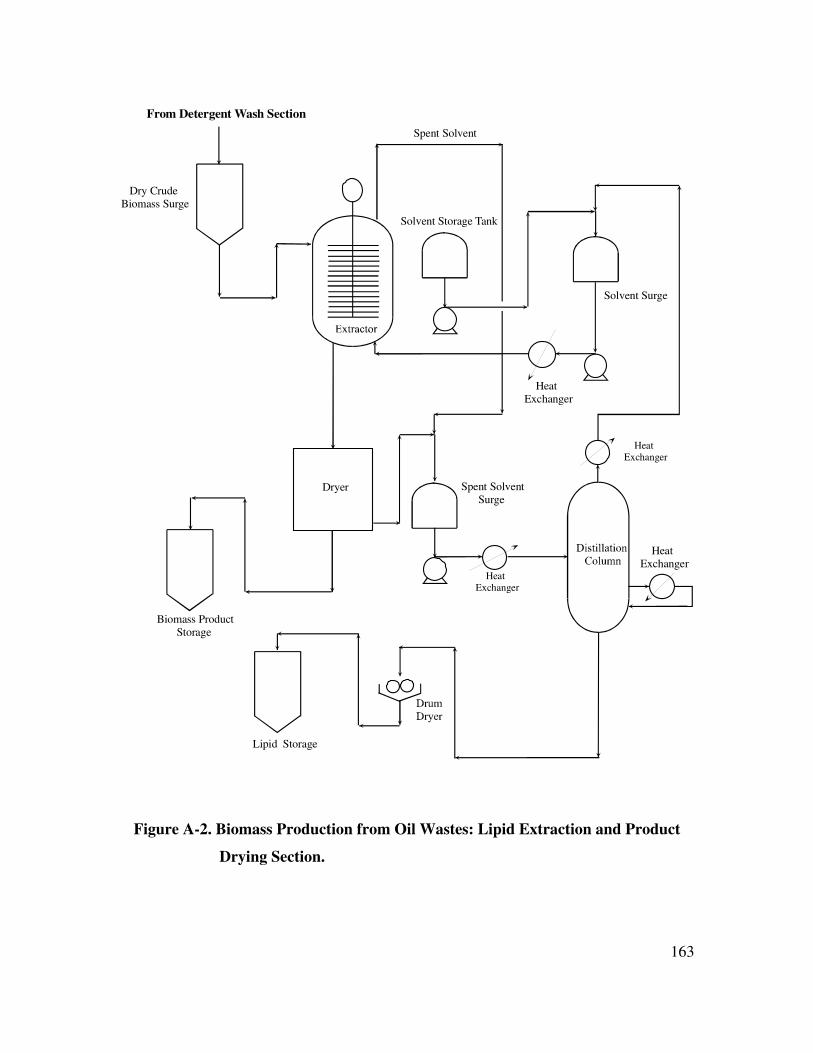
Solvent Storage Tank
Solvent Surge
Dry CrudeBiomass Surge
Spent Solvent
Spent Solvent Surge
Dryer
Biomass Product Storage
Lipid Storage
HeatExchanger
HeatExchanger
HeatExchanger
HeatExchanger
From Detergent Wash Section
Figure A-2. Biomass Production from Oil Wastes: Lipid Extraction and Product
Drying Section.
163

SprayDryer
Wash Tank
DetergentFeed Hopper
Detergent Solution Makeup
Centrifuges
HeatExchanger
DewaxedWaste Oil Surge
Centrifuges
To Lipid Extraction andProduct Drying Section
From Fermentation Section
Figure A-3. Biomass Production from Oil Wastes: Detergent Wash Section.
164

165
Appendix B
Physical and Health Hazard Properties of Selected Target Compounds
(1) Heavy Metals
(As, Ba, Cd, Cr, Pb, Zn)
(2) BTEX Compounds
(benzene, toluene, xylene)
(3) Chlorinated Hydrocarbons
(dichlorodifluoromethane, trichlorotrifluoroethane,
trichloroethene, tetrachloroethylene, 1,1,1-trichloroethane)
(4) PAHs
(benzo(a)anthracene, benzo(a)pyrene, naphthalene)
(5) PCBs

166
Table B-1. Physical and Health Hazard Properties of Heavy Metal.s
Name and
Symbol
m.p.
(°C)
b.p.
(°C)
Carcinogenic
?
RCRA Waste?
MCL (mg/L)
EPA Priority
Pollutant ?
Health Hazards
Arsenic
As 650 1380 Yes Yes, 5.0 Yes
All arsenic compounds are toxic, the toxicity varying with the oxidation state of the metal and the solubilities.
Barium
Ba 710 1600 No Yes, 100 No
Toxic routes include inhalation and ingestion. Ingestion of barium salts can be lethal to humans.
Cadmium
Cd 321 767 Yes Yes, 1.0 Yes
Toxic routes are inhalation or ingestion. Cadmium is a poison that is accumulated in liver and kidneys.
Chromium
Cr 1900 2642 Yes Yes, 5.0 Yes
Among all chromium compounds, only the hexavalent salts are a prime health hazard.
Lead
Pb 327.5 1740 No Yes, 5.0 Yes
Toxic routes of exposure are food, water, and air. Toxic effects depend on the dose and nature of lead salts.
Zinc
Zn 419.5 908 No No Yes
Inhalation of fumes and ingestion of sol salts may result in fever, nausea, skin irritation, and vomiting.

Table B-2. Physical and Health Hazard Properties of BTEX Compounds.
Name and
Structure
b.p.
(°C)
Carcinogenic
?
RCRA Waste (#)
MCL (mg/L)
EPA Priority
Pollutants?
Health Hazards
Benzene
80.1 suspected Yes (U019) Yes
Toxic effects from inhalation, ingestion and skin contact. Symptoms are distorted perception, nausea, vomiting and headache. Irritant to eyes, nose, and respiratory tract. Target organs are blood, bone narrow, central nervous and respiratory system, skin, and eyes.
Toluene
CH 3
110.7 No Yes (U220) Yes
Exposure routes are inhalation, ingestion and skin absorption. Affected Organs are central nervous system, liver, kidneys, and skin. Symptoms are distorted perception, euphoria, confusion, headache, and dizziness. May be accumulated in fatty tissues, cause bone narrow depression or anemia.
Xylene
CH 3
CH 3
137-140 No Yes (U239) Yes
Target organs are central nervous system, eyes, gastrointestinal tract, kidneys, liver, blood, and skin. Irritates eyes, nose, throat, causes nausea, vomiting, headache, dizziness, abdominal pain, and dermatitis. Inhalation and skin absorption are major route of exposures. May accumulate in adipose tissue and blood.
167

168
Table B-3. Physical and Health Hazard Properties of Chlorinated Hydrocarbons.
Compound Name
(Other Common Name)Structure
b.p.
(°C)
Carcinogenic
?
RCRA
(#)
EPA
Priority
Pollutants?
Health or
Environmental Hazard
Concerns
Dichlorodifluoromethane
(Freon-12, CFC-12) CCl2F2 -29.8 No Yes No
Cause ozone layer destruction, banned in 1994.
Trichlorotrifluoroethane
(Freon-113, CFC-113) ClCF2CCl2F 46-48 No No No
Cause ozone layer destruction, banned in 1990.
Trichloroethene
(Trichloroethylene,
trichloride, trielene)
CCl2=CHCl 86.7 Yes Yes
(U228) Yes
Toxic effects from inhalation and oral intake. Symptoms are headache, dizziness, nausea, and diarrhea.
Tetrachloroethylene
(Perchloroethylene,
Ethylenetetrachloride)
Cl2 C=C Cl2 121 Yes Yes
(U210) Yes
Exposure routes are inhalation, ingestion and skin contact. Affected Organs are central nervous system, eyes, and skin.
1,1,1-Trichloroethane
(Methylchloroform,
Chlorothene)
CH3CCl3 74.1 No Yes
(U226) Yes
Exposure to the vapors may be lethal to humans. Prolonged skin contact may cause defatting and reddening of eyes.

Table B-4. Physical and Health Hazard Properties of PAHs.
Name and Structure m.p./b.p.
(°C)
Carcinogenic
?
RCRA Waste (#)
MCL (mg/L)
EPA Priority
Pollutants? Health Hazards
Benzo[a]Anthracene
160 Yes Yes (U108) Yes
No report on oral toxicity, but highly toxic by intravenous procedures. Carcinogenicity is correlated to its bioalkylation at the site of injection.
Benzo[a]Pyrene
179 / 311 Yes Yes (U022) Yes
Poor absorption by gastrointestinal tract. Carcinogenicity affects lungs, skin, liver, kidney, and blood. Exhibits teratogenic effect. A mutagen, showed positive in a histidine reversion-Ames test and in-vitro SCE human lymphocytes.
Naphthalene
80.2 / 218 No Yes (U165) Yes
Irritation to eyes, skin, respiratory tract, injury to cornea, headache, nausea, through inhalation or indigestion or skin absorption. Damage to liver, kidney, blood, and central nervous system.
169

Table B-5. Physical and Health Hazard Properties of PCBs.
Structure b.p.
(°C) Carcinogenic ?
RCRA
Waste?
EPA Priority
Pollutants? Health Hazards
Biphenyl
2 2 3
4
5 6
’
4
5 6
3 ’
’
’ ’
2,2',6,6': ortho position 3,3',5,5': meta position
4,4': para position
(halogen atoms are attached to the biphenyl ring)
275 to
450 Yes Yes Yes
PCBs are moderately toxic substances that have been found to cause cancers and to induce birth defects. Occupational exposures to PCBs exhibit a broad range of adverse health effects on the skin, eyes, mucous membranes, and digestive and neurological systems. The severity of the health hazard depends on the concentration and chlorine content of the PCBs. PCBs with higher chlorine contents are more toxic than are the lower ones.
170

171
Appendix C
Survey on Used Oil Markets and Current Recycle/Reuse Programs in
Selected Countries
(1) State of California
(2) USA
(3) France
(4) Sweden
(5) United Kingdom
(6) Germany
(7) Mexico
(8) Brazil
(9) Japan
(10) New Zealand

172
(1) State of California
The data shown next page is from the report of the California Integrated Waste
Management Board (Cal. IWMB, 1997). To account for oil consumed during usage,
including leakage or combustion, the recycling rate must be adjusted first according to
the estimation that 60 percent of all lubricating oils and 52% of industrial oils are
generated as used oil. And after adjusting proportionate share of California oil recycled
out of state, adjusted lubricating oil recycling rate is between 64% and 75%, and adjusted
industrial oil recycling rate is only between 27% and 46%.
Year Lubricating Oil Industrial Oil
Sales Recycled Sales Recycled
1993 139.4 60.8 86.7 13.7
1994 141.9 59.1 78.3 16.5
1995 141.7 52.0 117.3 18.6
1996 136.2 54.3 141.0 19.8
1997 (Jan-Jun) 71.3 28.3 71.3 9.9
(unit: in millions of gallons)
(2) USA
In May of 1992, the United States Environmental Protection Administration (U.S.
EPA) issued standards establishing a presumption that all used oil is to be recycled unless
a used oil handler disposes of used oil or sends used oil for disposal. Specific
requirements and exemptions are listed in 40 CFR Part 279. Currently most states have
adopted the federal used oil management standards, though some states have made some
reversions. Five states including California have adopted a more stringent approach to
used oil management by defining used oil as a hazardous waste.
Estimated by U.S. EPA, about 1.5 billion gallons used oil is generated per year.
Of that total, 12 % recycled into high quality products
56 % burned
32 % disposed illegally

173
It is surprised to know that approximately only 12 percent are recycled into high
quality products while the rest is either burned (56 percent) as low-grade fuel primary for
space heaters, commercial and industrial boilers; or disposed illegally (32 percent) by
landfilling, burning, or dumping. Since the used oil that is burned is only minimally
cleaned, as a result, harmful metals and other contaminants in the used oil could be
released into our environment. Furthermore, burning used oil is not recycling used oil to
its highest and best value.
(3) France
France imposes a very active used motor oil management program in order to
conserve the nation’s oil supply and to protect the environment by recycle and reuse the
used oil. The used oil collection program in France is currently administered by Agence
de l’Environment et de la Maîtrise de l’Energie (ADEME).
In 1990, a report by ADEME indicated that a total of 945,576 kilotons of oil is
sold annually in France (most recent data available) and more than half of this oil is for
automotive uses. The amount of used motor oil that has been collected for recycling or
reuse has increased from about 50 percent in 1990 to 78 percent in 1995. Used oil
treatment facilities in France are re-refining plants, combustion plants, reclaiming plants,
or reprocessing plants. Direct burning, combustion accounts for more than 50 percent of
used oil disposal. Re-refining of used oil then accounts for about 42 percent, while about
6 percent oil used oil is reclaimed. The most concern for the used oil management in
France is the toxic contaminants like PCBs, chlorine, and heavy metals in used oil.
(4) Sweden
There is no national used motor oil recycling program in Sweden, but used motor
oil is classified and managed as hazardous waste. Since no national collection system is
available to regulate the collection work, some gas stations offer environmental services
such as used oil and used battery collection. About 70 percent of used motor oil in
Sweden is collected and delivered to the cement industry to be used as fuel and
incinerated effectively under controlled conditions.

174
(5) United Kingdom
Total used oil production is 1 billion liters (≈ 264.20 million gallons) per year. Of
that total, about 500 millions liters (≈132.10 million gallons) of the used oil are collected.
And among the collected used oil, about 240 millions liters (≈ 63.41 million gallons) are
recycled.
(6) Germany
Germany regulates the collection, transportation, and disposal of used oil. And it
is remarkable that of the 690 kilotons of used motor oil produced annually (Feb. 1996
data); the government reported that 94 percent is collected and is either reprocessed
(diesel, ship or gas oils) or burned (in cement kilns or as special waste).
(7) Mexico
A proposal for updated used oil management program in Mexico is currently
under active development and will be soon reviewed and approved by Secretariat of
Social Development (Secretaría de Desarrollo Social – SEDESOL). Used motor oil has
been regulated as hazardous waste in Mexico since 1988. The hierarchy for the treatment
of used oils and lubricants established in the rule is in the following order: (1) re-refining,
(2) combustion, (3) incineration, and (4) confinement. In 1996, an estimated 300 million
liters of used motor oil was generated in Mexico. But the information about the end uses
of used oil remained uncertain.
(8) Brazil
Resolution Number 9, of August 31, 1993, is the national legislation on used
motor oil recycling in Brazil. In the resolution, recycling is described as either recycling
through regeneration or recycling though use. Discarding lubricant oils into the
environment and the production/sale of unrecyclable new oil of both domestic and
imported origin are prohibited. The law requires all used lubricant oil to be recycled.
Recycle or reuse of used oil could be through re-refining, combustion for power

175
generation, or incineration. The gas stations (marketers) collect used oil and sell to the
reprocessing companies, who then recycle the oil and sell it back to the marketers.
(9) Japan
Used oil recycling program in Japan is not at national level, nor major legislation
is specifying the requirements for the management. However, though there are more than
40 million passenger cars and over 21 million trucks, buses, and other special purpose
vehicles in Japan, almost no motor oil is changed by DIYers. Thus the collection and
recycle percentage for used motor oil is very high.
Collected Recycled
Lubricating oil [ton] 1,588,000 900,000
Cooking oil [kliter] 400,000 250,000
The percentages for the option of the collected used lubricating oil are as follow:
60.1% burned as fuel, 1.5% reprocessed for lubricating oil, 38.4% incinerated.
The end uses of the recycled cooking oil are soap, paint, feed, fertilizer, and fuel.
Due to lack of DIY motor oil changers in Japan, it is expected that there is very little
public awareness or knowledge about used motor oil issues. Also, the information about
the contaminants in used oil is not reported publicly. The technologies for reclamation or
recycle are comparatively low and can be improved. Most reclaimers are having business
only at small-scale.
(10) New Zealand
Each year, between 60 and 70 million liters of lubricating oil is used in New
Zealand and 40-60% of this amount is consumed during use. The rest, estimated about
30 million liters are generated annually as waste. Of this 30 million liters, 7 million liters
of used oil are re-refined by Dominion Oil and sold in the marketplace as motor oil. The
remaining 23 million liters are currently disposed of in ways that may be harmful to the
environment.