Embed Size (px)
Citation preview

ISSN 2085-4811, eISSN: 2579-6089
297
Feasibility Analysis of Implementation 3G
Macro Additional Sector JABO Area using
Techno-Economic Approach
Iwan Krisnadi and Intan Kumalasari Tanjung
Electrical Engineering, Mercu Buana University, Jakarta
[email protected]; [email protected]
Abstract
The increasing number of operators, making competition in the telecommunications industry are becoming increasingly stringent. These circumstances spurred operators to compete in achieving the best quality of services. Macro Additional 3G Sector (LTC) Project is one effort of the operator in maintaining the quality of data services. The general philosophy of the design of telecommunications networks are getting the best performance with minimal implementation costs. In this work will be analyzed with the techno-economic approach for the feasibility of the implementation of 3G Macro Additional Sector Project by operator telecommunication in Jakarta. Analysis model used is based on the principle of techno-economic by throughput and number of user approach with bottom-up models, to determine the design of 3G Macro Additional Sector Project, and then measure the feasibility of the costs incurred for the implementation of 3G Macro Additional the Sector Project.
Keywords: Low Throughput, users demand,, Revenue, CAPEX, OPEX,
NPV, IRR, PBP
Abstrak Meningkatnya jumlah operator, membuat persaingan di industri telekomunikasi menjadi semakin ketat. Keadaan ini membuat operator bersaing dalam mencapai kualitas layanan terbaik. Proyek Macro Additional 3G Sector (LTC) merupakan salah satu upaya operator dalam menjaga kualitas layanan data. Filosofi umum perancangan jaringan telekomunikasi mendapatkan kinerja terbaik dengan biaya implementasi minimal. Dalam karya ini akan dianalisis dengan pendekatan tekno-ekonomi untuk kelayakan pelaksanaan Proyek Sektoral Macro Macro oleh operator telekomunikasi di Jakarta. Model analisis yang digunakan didasarkan pada prinsip tekno-ekonomi melalui throughput dan jumlah pendekatan pengguna dengan model bottom-up, untuk mengetahui disain Proyek Sektor Tambahan Makro 3G, lalu mengukur kelayakan biaya yang dikeluarkan untuk implementasi 3G. Makro Tambahan Proyek Sektor.
Kata kunci: Throughput rendah, permintaan pengguna, Pendapatan,
CAPEX, OPEX, NPV, IRR, PBP
298 IncomTech, Jurnal Telekomunikasi dan Komputer, vol.3, no.3, 2017
ISSN 2085-4811, eISSN: 2579-6089
Received December 2016
Accepted for Publication January 2017
DOI: 10.22441/incomtech.v7i3.1173
1. BACKGROUND
The development of Internet technology and wireless communication have
changed the pattern of users of telecommunications services to stay connected and
serviced anywhere, anytime and any application. Number of Internet users in
Indonesia increased from year to year. Based on data from APJII, the data of
internet users in 2006 reached 16 million, and increased from year to year, so that
in 2012 reached 60 million. APJII projecting Internet users in 2015 reached 139
million. Increasing the number of Internet users is not separated from the 3G
technology that makes it easy for Internet users to access mobile data. Increasing
the number of subscribers will have an impact on the quality of data to be
received. More users are accessing the data, then the quality will decline. The
pattern of communication needs can be met with unlimited resources via the
internet, especially on 3G networks. But along with these developments,
experiences and satisfaction of users of telecommunications services are still not
fulfilled as expected due to the speed and services are still limited. Besides, the
number of data users is increasing every day.
It is a challenge for operators to always be able to meet the expectations of
customers so that business operations can continue. Therefore operators try to
implement 3G Macro Additional Sector Project which is expected to meet rising
demand and customer satisfaction, particularly in data services. Here is the
background of the problem that caused the operator to implementing 3G Macro
Additional Sector Project: 1. The increasing number of users in the service of HSDPA. 2. The discovery of 3G cells which is very low throughput (below 400 Kbps)
in the area with the number of users more than 40. 3. Prediction of 3G traffic will continue to increase along with the increasing
number of subscribers and the volume of capacity required to meet the needs of customers annually.
4. Due to the three things above (high user, high traffic and low throughput) are advised to do the sharing for 3G traffic, this can be done in two ways: 1. Develop / contruction of newsite. 2. 3G Macro Additional Sector
2. LITERATURE REVIEW
Previous research related to this research are as following below: 1. Analisa Perbandingan Perancangan dan Kelayakan Implementasi Jaringan
LTE dan wimax di Area Urban, Sub Urban dan Rural dengan pendekatan techno economy by Usep Taufiq Hidayat [18] In this research do the economic analyzed for implementation of LTE
Release 10 network and mobile WiMAX on Surabaya. Determined of
number of sites do by using methode of overage and capacity analysis.
Result of number of sites needed obtained by looking at the highest number
of sites based on result of coverage and capacity analysis. Based on overall
Krisnadi and Kumalasari, Feasibility Analysis of Implementation 3G Macro Additional .. 299
ISSN 2085-4811, eISSN: 2579-6089
analysis show that mobile WiMAX implementation is more feasible
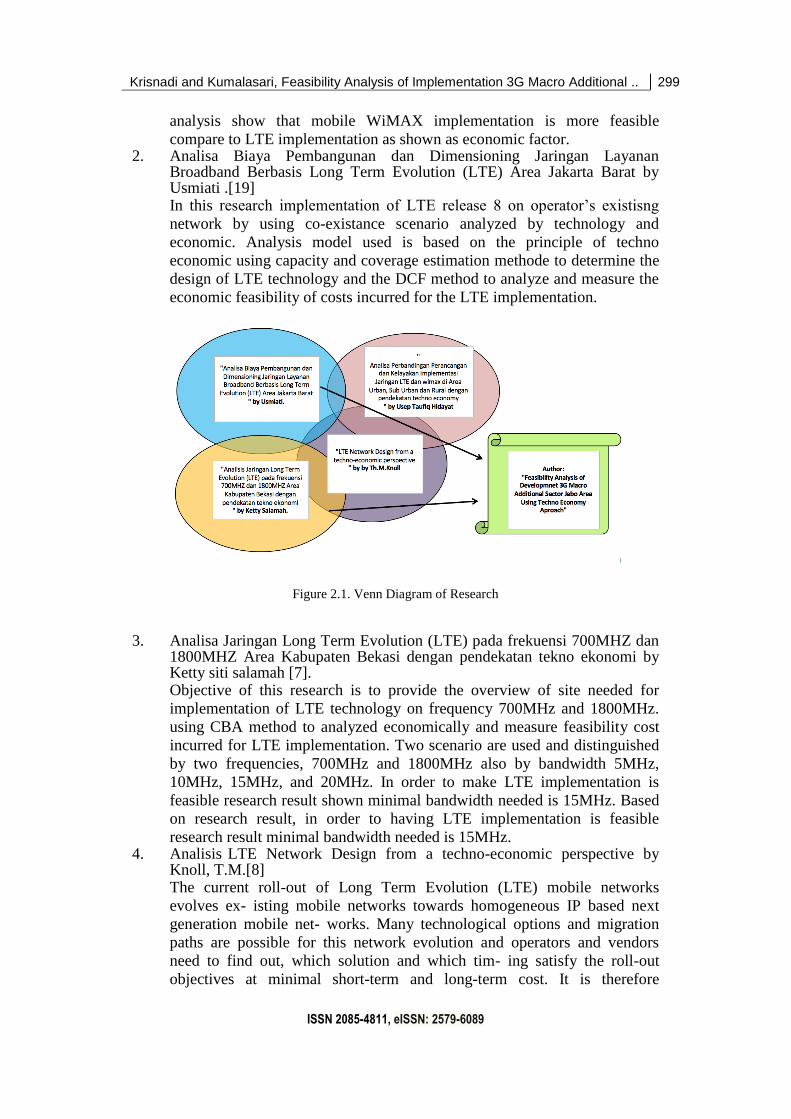
compare to LTE implementation as shown as economic factor. 2. Analisa Biaya Pembangunan dan Dimensioning Jaringan Layanan
Broadband Berbasis Long Term Evolution (LTE) Area Jakarta Barat by Usmiati .[19] In this research implementation of LTE release 8 on operator’s existisng
network by using co-existance scenario analyzed by technology and
economic. Analysis model used is based on the principle of techno
economic using capacity and coverage estimation methode to determine the
design of LTE technology and the DCF method to analyze and measure the
economic feasibility of costs incurred for the LTE implementation.
Figure 2.1. Venn Diagram of Research
3. Analisa Jaringan Long Term Evolution (LTE) pada frekuensi 700MHZ dan
1800MHZ Area Kabupaten Bekasi dengan pendekatan tekno ekonomi by Ketty siti salamah [7]. Objective of this research is to provide the overview of site needed for
implementation of LTE technology on frequency 700MHz and 1800MHz.
using CBA method to analyzed economically and measure feasibility cost
incurred for LTE implementation. Two scenario are used and distinguished
by two frequencies, 700MHz and 1800MHz also by bandwidth 5MHz,
10MHz, 15MHz, and 20MHz. In order to make LTE implementation is
feasible research result shown minimal bandwidth needed is 15MHz. Based
on research result, in order to having LTE implementation is feasible
research result minimal bandwidth needed is 15MHz. 4. Analisis LTE Network Design from a techno-economic perspective by
Knoll, T.M.[8] The current roll-out of Long Term Evolution (LTE) mobile networks
evolves ex- isting mobile networks towards homogeneous IP based next
generation mobile net- works. Many technological options and migration
paths are possible for this network evolution and operators and vendors
need to find out, which solution and which tim- ing satisfy the roll-out
objectives at minimal short-term and long-term cost. It is therefore

300 IncomTech, Jurnal Telekomunikasi dan Komputer, vol.3, no.3, 2017
ISSN 2085-4811, eISSN: 2579-6089
necessary to model the incurred capital expenditures (CAPEX) and op-
erational expenditures (OPEX) in order to estimate the total cost of
ownership (TCO) of the resulting setup. The conference contribution
outlines the respective model aim, structure and assumptions based on a
simple LTE roll-out example scenario and gives an overview on the techno-
economic results.
2.1 3G Network Architecture
In principle, the transmission on the UMTS radio interface is different from the
GSM 2.5G stage. therefore introduced UTRAN as the new RAN in UMTS.
Figure 2.2 3G network architecture [2]
1.UTRAN
UMTSRAN consists of a radio network system (RNS) where each RNS includes
RNC. Iub interface is open, meaning that the network operators can obtain from
one vendor Node B and RNC from other vendors.
2. RNC
RNC controls the Node B called the CRNC (controlling RNC). CRNC
responsible for manage the radio resources available to the Node B. RNC linking
the EU and CN called SRNC (serving RNC).
3.Node B
Node B is the physical unit to send / receive frequencies in the cell. Single Node
B can support both FDD and TDD mode and can be co-located with the GSM
BTS.
Krisnadi and Kumalasari, Feasibility Analysis of Implementation 3G Macro Additional .. 301
ISSN 2085-4811, eISSN: 2579-6089
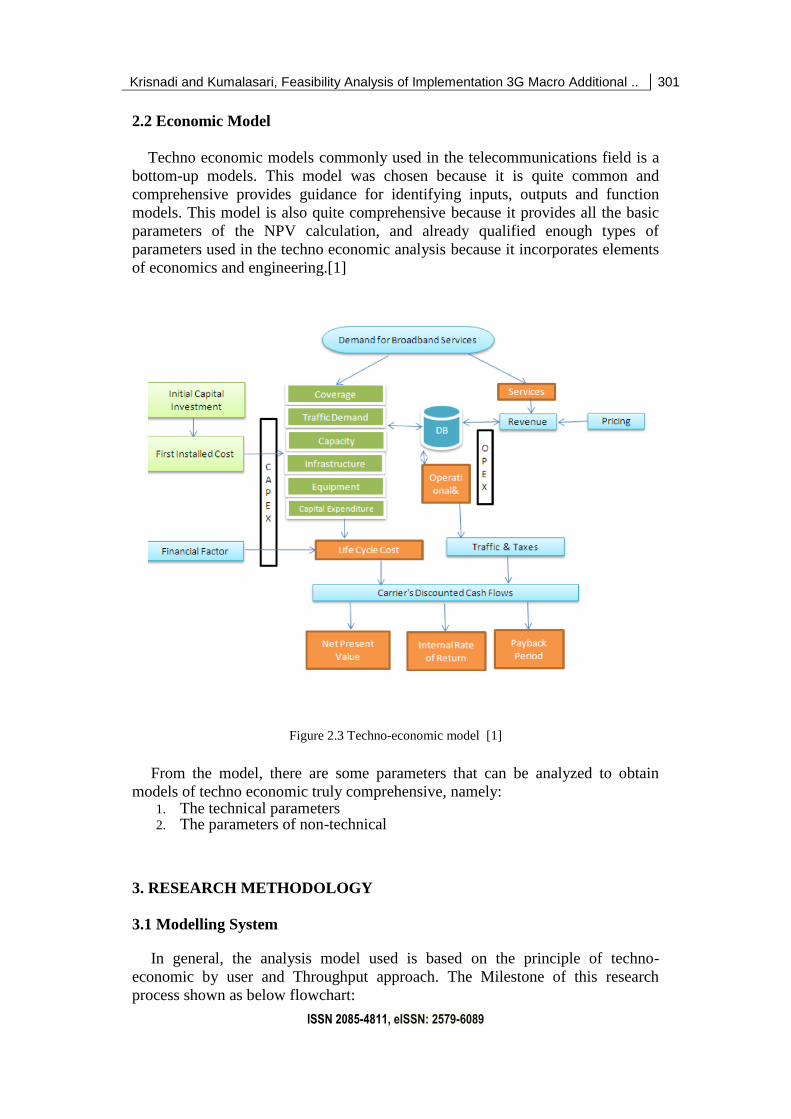
2.2 Economic Model
Techno economic models commonly used in the telecommunications field is a
bottom-up models. This model was chosen because it is quite common and
comprehensive provides guidance for identifying inputs, outputs and function
models. This model is also quite comprehensive because it provides all the basic
parameters of the NPV calculation, and already qualified enough types of
parameters used in the techno economic analysis because it incorporates elements
of economics and engineering.[1]
Figure 2.3 Techno-economic model [1]
From the model, there are some parameters that can be analyzed to obtain
models of techno economic truly comprehensive, namely: 1. The technical parameters 2. The parameters of non-technical
3. RESEARCH METHODOLOGY
3.1 Modelling System
In general, the analysis model used is based on the principle of techno-
economic by user and Throughput approach. The Milestone of this research
process shown as below flowchart:

302 IncomTech, Jurnal Telekomunikasi dan Komputer, vol.3, no.3, 2017
ISSN 2085-4811, eISSN: 2579-6089
Figure 3.1. Research Process Flow Diagram
3.2 Existing Condition Jabo Area Telkomsel's 3G Network
Jakarta Special Capital Region has an area of ± 662.33 km including the
Thousand Islands area of land spread in Jakarta Bay. Geographically Jakarta area
is located between 106 ° 22 '42 "E to 106 ° 58' 18" E and -5 ° 19 '12 "latitude to -6
° 23' 54" latitude. The boundaries of the area of Jakarta is:• Sebelah Utara
berbatasan dengan Laut Jawa
• East side is bordered by Bekasi District
• South side is bordered by Bogor Regency
• West side is bordered by Tangerang Regency.
Telkomsel network spread throughout Indonesia, Java, Sumatra,
Kalimantan, Sulawesi to Papua. For Jabodetabek area alone, consisting of 28 and
72 061 RNC cell. As seen in Figure 3.1 plot the results of the map info.

Krisnadi and Kumalasari, Feasibility Analysis of Implementation 3G Macro Additional .. 303
ISSN 2085-4811, eISSN: 2579-6089
Figure 3.2 3G Network for Jabodetabek Area
By conducting statistical observations operator can monitor, collect data and
analyze trends throughput, traffic and users today and can perform taskforced. It
is a challenge for operators to always be able to meet the expectations of
customers so that business operations can continue. Of statistical observations
found in many cells with very low throughput (below 400 Kbps) in the area with
the number of users more than 40. It causes inconvenience in the use of customer
service and breaking the connection so strongly influence the level of customer
satisfaction. Due to this it is suggested to do the sharing for 3G traffic.
3.3 Filter Low Throughput Cell
Throughput is the value that indicates the size of the actual amount of
information that can be transferred within a certain time. Of statistical
observations conducted over three weeks, the downward trend found in many cell
throughput (Low Throughput Cell). Throughput 3G KPI value is <400 kbps, keep
in mind that the value of each KPI in each operator can be different. The
downward trend in the value of throughput KPI values in some RNC can be seen
more clearly by analyzing statistical data as shown below:

304 IncomTech, Jurnal Telekomunikasi dan Komputer, vol.3, no.3, 2017
ISSN 2085-4811, eISSN: 2579-6089
Figure 3.3 Graph of statistical data throughput
3.4 Number of User
One of the performance parameters of the network traffic is the number of
users. Number of users in a cell determine the performance of a network,
including 3G. More number of user in one cell, traffic will be congested as well.
In this work, the value of KPI for 3G users in one cell is 40 (KPI value of each
operator can be different). From the results of statistical taken for 3 weeks found
some cells that have a number of user > 40. The following graphs show the
number of users that occupy by each cell:
Figure 3.4 Graph of statistics of increment cell user
Krisnadi and Kumalasari, Feasibility Analysis of Implementation 3G Macro Additional .. 305
ISSN 2085-4811, eISSN: 2579-6089
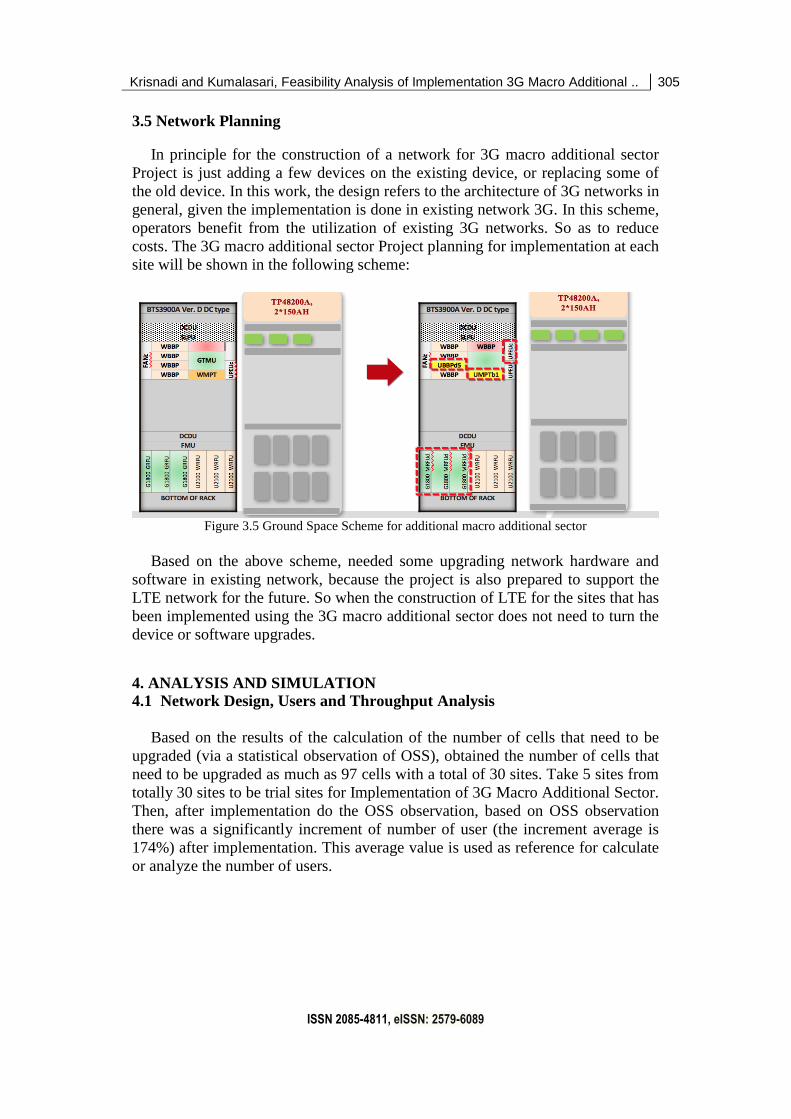
3.5 Network Planning
In principle for the construction of a network for 3G macro additional sector
Project is just adding a few devices on the existing device, or replacing some of
the old device. In this work, the design refers to the architecture of 3G networks in
general, given the implementation is done in existing network 3G. In this scheme,
operators benefit from the utilization of existing 3G networks. So as to reduce
costs. The 3G macro additional sector Project planning for implementation at each
site will be shown in the following scheme:
Figure 3.5 Ground Space Scheme for additional macro additional sector
Based on the above scheme, needed some upgrading network hardware and
software in existing network, because the project is also prepared to support the
LTE network for the future. So when the construction of LTE for the sites that has
been implemented using the 3G macro additional sector does not need to turn the
device or software upgrades.
4. ANALYSIS AND SIMULATION
4.1 Network Design, Users and Throughput Analysis
Based on the results of the calculation of the number of cells that need to be
upgraded (via a statistical observation of OSS), obtained the number of cells that
need to be upgraded as much as 97 cells with a total of 30 sites. Take 5 sites from
totally 30 sites to be trial sites for Implementation of 3G Macro Additional Sector.
Then, after implementation do the OSS observation, based on OSS observation
there was a significantly increment of number of user (the increment average is
174%) after implementation. This average value is used as reference for calculate
or analyze the number of users.
306 IncomTech, Jurnal Telekomunikasi dan Komputer, vol.3, no.3, 2017
ISSN 2085-4811, eISSN: 2579-6089
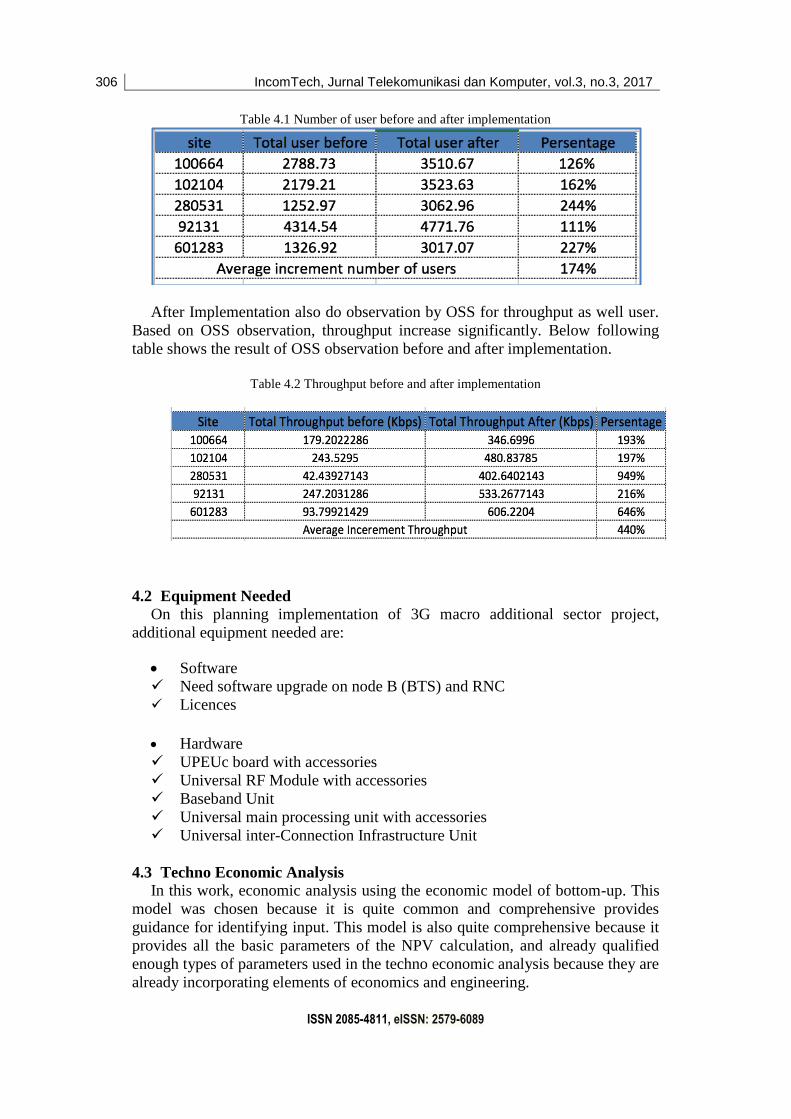
Table 4.1 Number of user before and after implementation
After Implementation also do observation by OSS for throughput as well user.
Based on OSS observation, throughput increase significantly. Below following
table shows the result of OSS observation before and after implementation.
Table 4.2 Throughput before and after implementation
4.2 Equipment Needed
On this planning implementation of 3G macro additional sector project,
additional equipment needed are:
Software
Need software upgrade on node B (BTS) and RNC
Licences
Hardware
UPEUc board with accessories
Universal RF Module with accessories
Baseband Unit
Universal main processing unit with accessories
Universal inter-Connection Infrastructure Unit
4.3 Techno Economic Analysis
In this work, economic analysis using the economic model of bottom-up. This
model was chosen because it is quite common and comprehensive provides
guidance for identifying input. This model is also quite comprehensive because it
provides all the basic parameters of the NPV calculation, and already qualified
enough types of parameters used in the techno economic analysis because they are
already incorporating elements of economics and engineering.
Krisnadi and Kumalasari, Feasibility Analysis of Implementation 3G Macro Additional .. 307
ISSN 2085-4811, eISSN: 2579-6089
Market parameters relating to the service area and market segment, output
are NPV, IRR, CAPEX, OPEX per year. Output may include sensitivity analysis
and cost details.
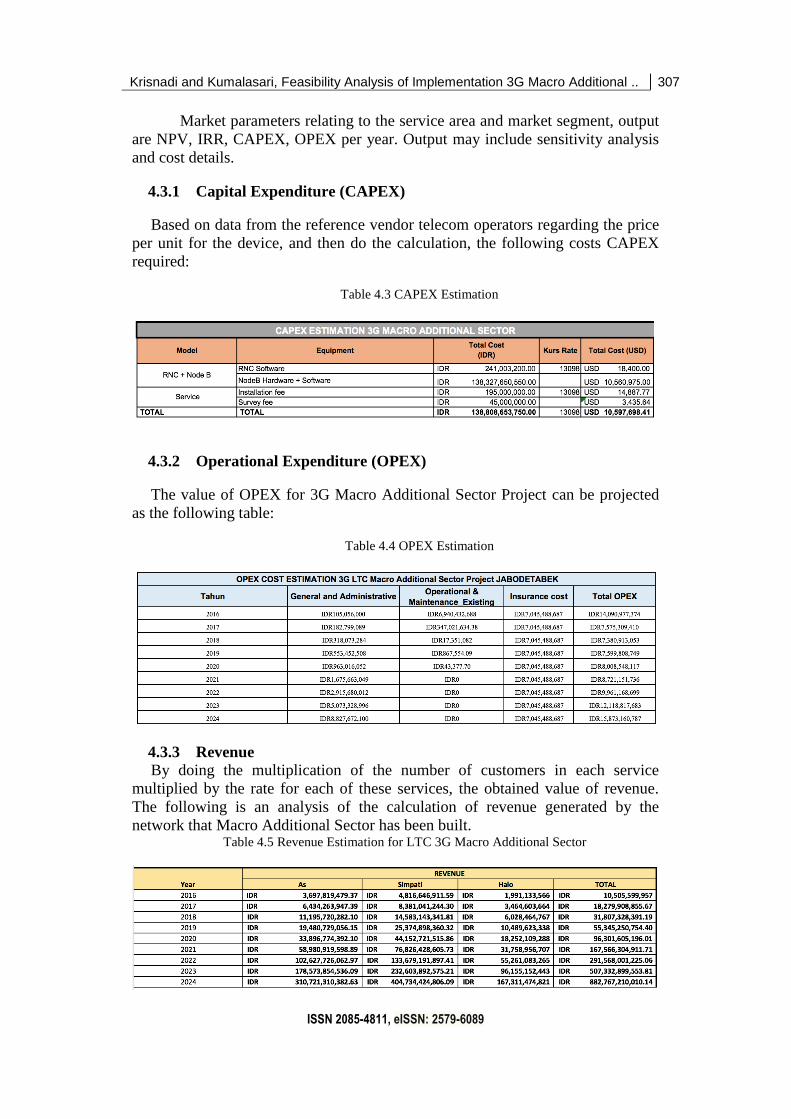
4.3.1 Capital Expenditure (CAPEX)
Based on data from the reference vendor telecom operators regarding the price
per unit for the device, and then do the calculation, the following costs CAPEX
required:
Table 4.3 CAPEX Estimation
4.3.2 Operational Expenditure (OPEX)
The value of OPEX for 3G Macro Additional Sector Project can be projected
as the following table:
Table 4.4 OPEX Estimation
4.3.3 Revenue
By doing the multiplication of the number of customers in each service
multiplied by the rate for each of these services, the obtained value of revenue.
The following is an analysis of the calculation of revenue generated by the
network that Macro Additional Sector has been built. Table 4.5 Revenue Estimation for LTC 3G Macro Additional Sector

308 IncomTech, Jurnal Telekomunikasi dan Komputer, vol.3, no.3, 2017
ISSN 2085-4811, eISSN: 2579-6089
Figure 4.1 Revenue Estimation 3G Macro Additional Sector
4.3.4 Economic Analysis
Calculation of the economy in this work is used the following parameters:
Table 4.6 Economic Parameter
Parameter Value
Rate IDR.
13.098/$
MARR 17%
Period 8 Year
Tax 25%
From the above parameters used MARR value of 17%, assuming that the
margin due to the risk factor of 5% plus the 12% tax rate so that the value of
MARR is 17%. While the tax parameters used was 25%, based on Law No. 36
Year 2008 regarding Income Tax. Here are the results of techno economic
feasibility analysis:
Krisnadi and Kumalasari, Feasibility Analysis of Implementation 3G Macro Additional .. 309
ISSN 2085-4811, eISSN: 2579-6089
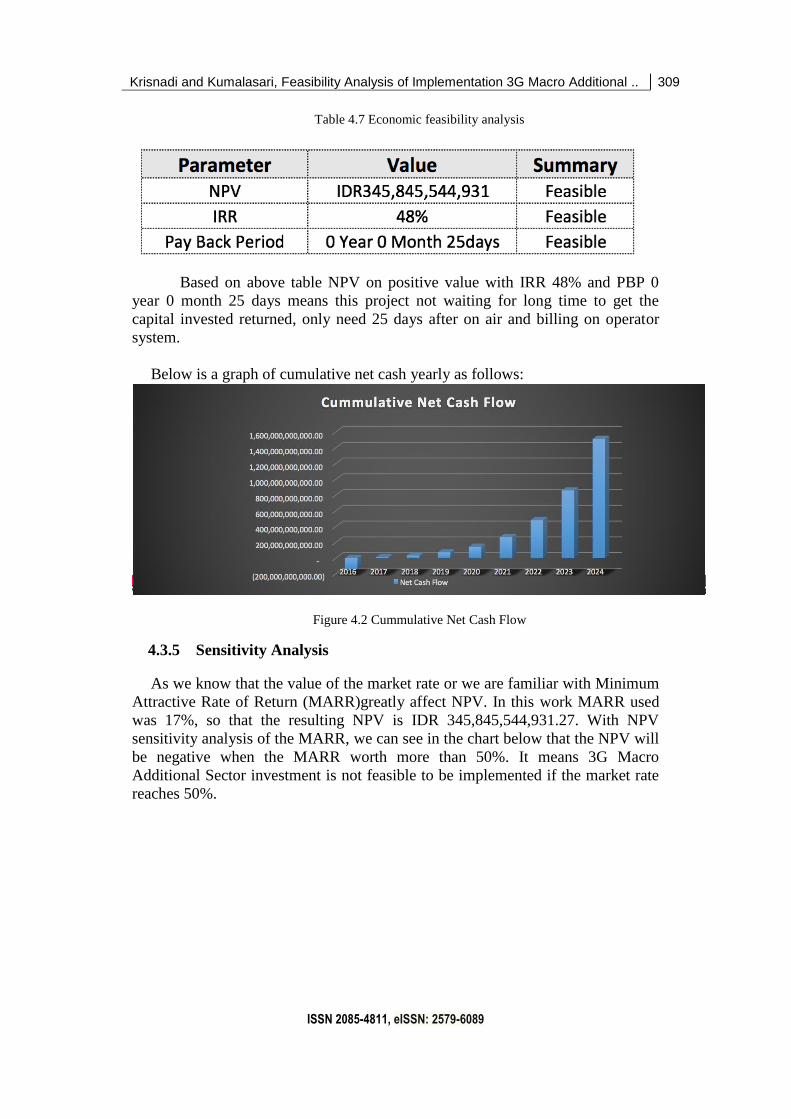
Table 4.7 Economic feasibility analysis
Based on above table NPV on positive value with IRR 48% and PBP 0
year 0 month 25 days means this project not waiting for long time to get the
capital invested returned, only need 25 days after on air and billing on operator
system.
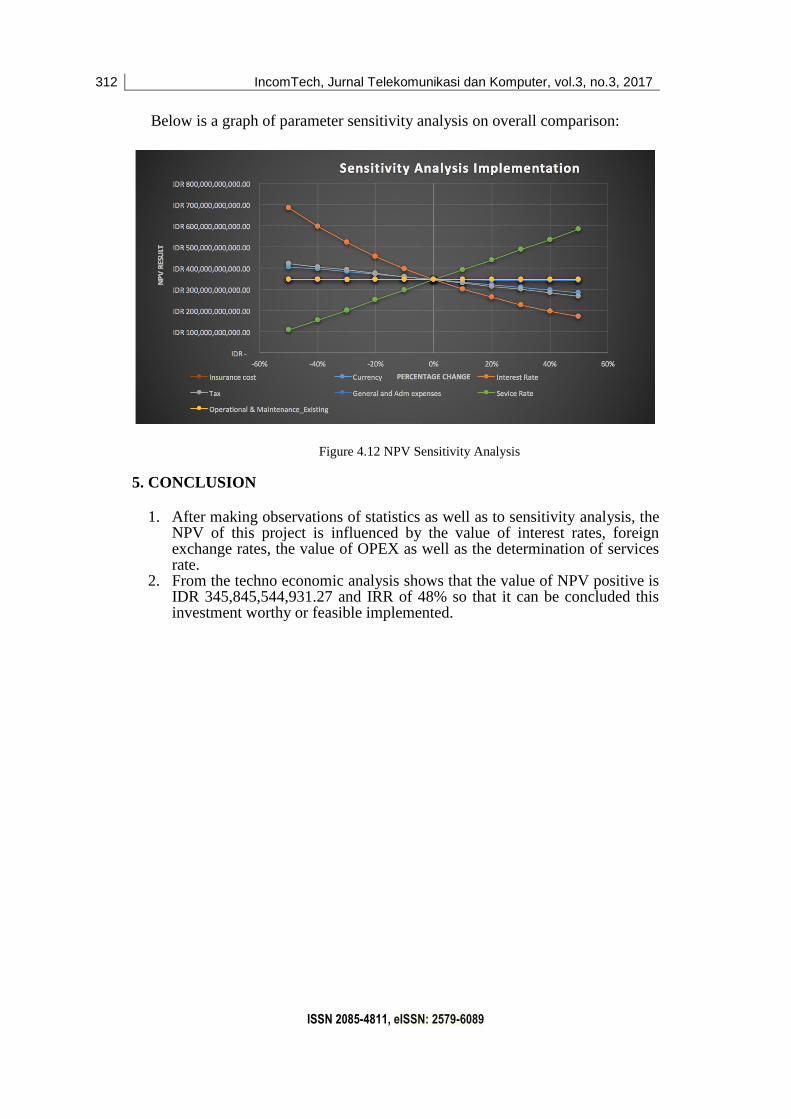
Below is a graph of cumulative net cash yearly as follows:
Figure 4.2 Cummulative Net Cash Flow
4.3.5 Sensitivity Analysis
As we know that the value of the market rate or we are familiar with Minimum
Attractive Rate of Return (MARR)greatly affect NPV. In this work MARR used
was 17%, so that the resulting NPV is IDR 345,845,544,931.27. With NPV
sensitivity analysis of the MARR, we can see in the chart below that the NPV will
be negative when the MARR worth more than 50%. It means 3G Macro
Additional Sector investment is not feasible to be implemented if the market rate
reaches 50%.

310 IncomTech, Jurnal Telekomunikasi dan Komputer, vol.3, no.3, 2017
ISSN 2085-4811, eISSN: 2579-6089
Figure 4.8 Sensitivity Analysis NPV to MARR
Figure 4.9 NPV Sensitivity Analysis to value of CAPEX (change of exchange
value)
From the graph above it can be seen that changes in currency exchange
rates affect the value of eligibility. Based on the data obtained, the NPV would be
drastically reduced when there is an increase exchange rate is above 30% of the
value of the currency, which is Rp.17.027 / USD.

Krisnadi and Kumalasari, Feasibility Analysis of Implementation 3G Macro Additional .. 311
ISSN 2085-4811, eISSN: 2579-6089
Here is an NPV sensitivity analysis to OPEX.
Figure 4.10 NPV Sensitivity Analysis to value of OPEX
From the graph above it can be seen that between the value of existing
OPEX, general costs and adm is the largest operational cost with the steepest
slope among other operational costs, which means the value of common costs and
administration significantly affect NPV.
If performed sensitivity analysis of the service rate, will be seen the influence
of operator revenue generated, which substantially affect the feasibility of an
investment. The following is an analysis of the sensitivity of the NPV to changes
in rates.
Figure 4.11 NPV Sensitivity Analysis to change of Service Rate
312 IncomTech, Jurnal Telekomunikasi dan Komputer, vol.3, no.3, 2017
ISSN 2085-4811, eISSN: 2579-6089
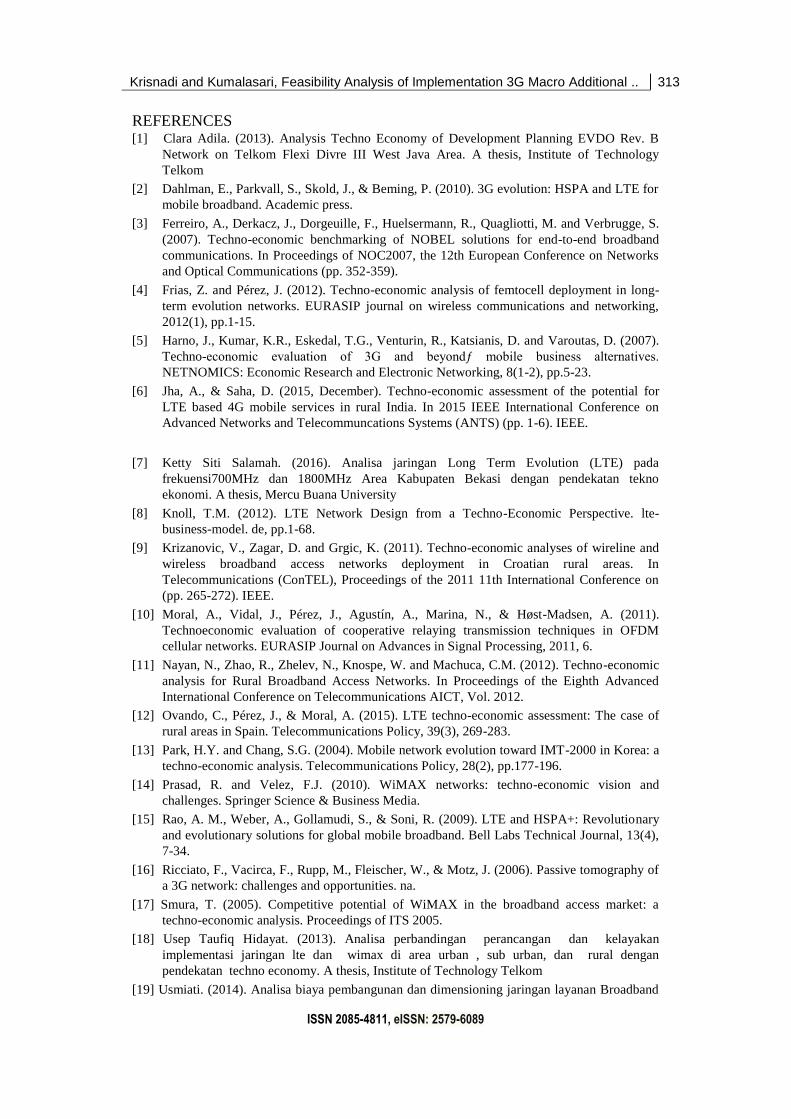
Below is a graph of parameter sensitivity analysis on overall comparison:
Figure 4.12 NPV Sensitivity Analysis
5. CONCLUSION
1. After making observations of statistics as well as to sensitivity analysis, the NPV of this project is influenced by the value of interest rates, foreign exchange rates, the value of OPEX as well as the determination of services rate.
2. From the techno economic analysis shows that the value of NPV positive is IDR 345,845,544,931.27 and IRR of 48% so that it can be concluded this investment worthy or feasible implemented.
Krisnadi and Kumalasari, Feasibility Analysis of Implementation 3G Macro Additional .. 313
ISSN 2085-4811, eISSN: 2579-6089
REFERENCES [1] Clara Adila. (2013). Analysis Techno Economy of Development Planning EVDO Rev. B
Network on Telkom Flexi Divre III West Java Area. A thesis, Institute of Technology
Telkom
[2] Dahlman, E., Parkvall, S., Skold, J., & Beming, P. (2010). 3G evolution: HSPA and LTE for
mobile broadband. Academic press.
[3] Ferreiro, A., Derkacz, J., Dorgeuille, F., Huelsermann, R., Quagliotti, M. and Verbrugge, S.
(2007). Techno-economic benchmarking of NOBEL solutions for end-to-end broadband
communications. In Proceedings of NOC2007, the 12th European Conference on Networks
and Optical Communications (pp. 352-359).
[4] Frias, Z. and Pérez, J. (2012). Techno-economic analysis of femtocell deployment in long-
term evolution networks. EURASIP journal on wireless communications and networking,
2012(1), pp.1-15.
[5] Harno, J., Kumar, K.R., Eskedal, T.G., Venturin, R., Katsianis, D. and Varoutas, D. (2007).
Techno-economic evaluation of 3G and beyondƒ mobile business alternatives.
NETNOMICS: Economic Research and Electronic Networking, 8(1-2), pp.5-23.
[6] Jha, A., & Saha, D. (2015, December). Techno-economic assessment of the potential for
LTE based 4G mobile services in rural India. In 2015 IEEE International Conference on
Advanced Networks and Telecommuncations Systems (ANTS) (pp. 1-6). IEEE.
[7] Ketty Siti Salamah. (2016). Analisa jaringan Long Term Evolution (LTE) pada
frekuensi700MHz dan 1800MHz Area Kabupaten Bekasi dengan pendekatan tekno
ekonomi. A thesis, Mercu Buana University
[8] Knoll, T.M. (2012). LTE Network Design from a Techno-Economic Perspective. lte-
business-model. de, pp.1-68.
[9] Krizanovic, V., Zagar, D. and Grgic, K. (2011). Techno-economic analyses of wireline and
wireless broadband access networks deployment in Croatian rural areas. In
Telecommunications (ConTEL), Proceedings of the 2011 11th International Conference on
(pp. 265-272). IEEE.
[10] Moral, A., Vidal, J., Pérez, J., Agustín, A., Marina, N., & Høst-Madsen, A. (2011).
Technoeconomic evaluation of cooperative relaying transmission techniques in OFDM
cellular networks. EURASIP Journal on Advances in Signal Processing, 2011, 6.
[11] Nayan, N., Zhao, R., Zhelev, N., Knospe, W. and Machuca, C.M. (2012). Techno-economic
analysis for Rural Broadband Access Networks. In Proceedings of the Eighth Advanced
International Conference on Telecommunications AICT, Vol. 2012.
[12] Ovando, C., Pérez, J., & Moral, A. (2015). LTE techno-economic assessment: The case of
rural areas in Spain. Telecommunications Policy, 39(3), 269-283.
[13] Park, H.Y. and Chang, S.G. (2004). Mobile network evolution toward IMT-2000 in Korea: a
techno-economic analysis. Telecommunications Policy, 28(2), pp.177-196.
[14] Prasad, R. and Velez, F.J. (2010). WiMAX networks: techno-economic vision and
challenges. Springer Science & Business Media.
[15] Rao, A. M., Weber, A., Gollamudi, S., & Soni, R. (2009). LTE and HSPA+: Revolutionary
and evolutionary solutions for global mobile broadband. Bell Labs Technical Journal, 13(4),
7-34.
[16] Ricciato, F., Vacirca, F., Rupp, M., Fleischer, W., & Motz, J. (2006). Passive tomography of
a 3G network: challenges and opportunities. na.
[17] Smura, T. (2005). Competitive potential of WiMAX in the broadband access market: a
techno-economic analysis. Proceedings of ITS 2005.
[18] Usep Taufiq Hidayat. (2013). Analisa perbandingan perancangan dan kelayakan
implementasi jaringan lte dan wimax di area urban , sub urban, dan rural dengan
pendekatan techno economy. A thesis, Institute of Technology Telkom
[19] Usmiati. (2014). Analisa biaya pembangunan dan dimensioning jaringan layanan Broadband

314 IncomTech, Jurnal Telekomunikasi dan Komputer, vol.3, no.3, 2017
ISSN 2085-4811, eISSN: 2579-6089
berbasis Long Term Evolution (LTE) Area Jakarta Barat. A thesis, Mercu Buana University.
[20] Telkomsel (2015). Annual Report, accessed from: http://www.telkomsel.com/about/investor-
relations/25-Annual-Report.html
[21] XL (2015). Annual Report, accessed from: http://www.xl.co.id/corporate/id/inves
tor/informasi/laporan-tahunan


![Infrastructural Voids in congested cities [New York]_Report](https://img.pdfslide.us/doc/110x75/568c0eba1a28ab955a91891d/infrastructural-voids-in-congested-cities-new-yorkreport.jpg)