Embed Size (px)
Citation preview
1
Fear, Institutionalized Racism, and Empathy (FIRE): A Holistic Measure of White Americans’ 21st Century Racial Attitudes
Christopher D. DeSante1 Candis W. Smith
Indiana University UNC at Chapel Hill
Abstract
For nearly 75 years, scholars of American public opinion have sought to measure Whites' attitudes towards Blacks. Political scientists, sociologists, and psychologists have invented and revised myriad ways to measure what one could refer to as “racial prejudice.” With each passing revision, scholars who believe they have captured new forms of racial animus are met with opposition from those who believe that old-fashioned anti-Black affect is a thing of the past. These scholars often cite conservative ideology or race-neutral “principles” as the primary source of variation in racial attitudes, contending that most measures of racial animus are capturing ideology or policy preferences as opposed to modern racism (c.f. Carmines et al. 2011). We directly answer these claims by collecting a surfeit of attitudinal measures in order to simultaneously estimate the relationship between cognitive beliefs about the racial status quo, and emotional reactions to racism. First, we uncover two higher-order dimensions that undergird Whites’ racial attitudes. Second, we validate a four-item version of our new battery. Finally, we validate these four items using the 2016 Cooperative Congressional Election Study, which included our measures on the Common Content.
1 Corresponding author; drafted for the 2018 annual meeting of the American Political Science Association. [email protected]
2
Introduction
In the very first sentence of their seminal article, “Prejudice and Politics: Symbolic
Racism Versus Racial Threats to the Good Life,” Donald Kinder and David Sears (1981)
wrote: “although theories of prejudice have been extensively catalogued, empirical
confrontations between competing theories are surprisingly rare.” This paper aims to be
one of those rare “empirical confrontations.” Nearly 40 years ago, Kinder and Sears sought
to measure and explain the modern configuration of white Americans’ racial attitudes.
They tested their theory of “symbolic racism” against competing hypotheses related to
“racial threats to whites’ private lives,” and ultimately showed how symbolic racism could
explain anti-black voting behavior. Since then, the measures for symbolic racism (and later
“racial resentment”) have become the standard way political scientists measure racial
prejudice.
In this paper we do something similar, arguing that the theory of symbolic racism
(or racial resentment) is an insufficient explanation for the complex structure of racial
attitudes in contemporary America. Just as Kinder and Sears set out to first test whether it
was “realistic group conflict theory” or “abstract, moralistic resentments of blacks” that
was undergirding whites’ racial prejudices, here we aim to show that the construct of
symbolic racism, by itself, paints an incomplete picture of those racial attitudes.
Specifically, we test whether additional, more emotional aspects, may help to explain the
structure of these attitudes. In the pages below, we first review the theory of racial
resentment and symbolic politics, and then discuss research from social psychology on the
emotions likely to amplify particular racial attitudes. We look at the concepts of fear and
racial empathy, which is manifested as anger about racial injustice.
3
Using original survey data, we conclude that two distinct higher-order dimensions
structure how Whites think about racial issues in contemporary American politics. The first
dimension involves Whites’ awareness and recognition of the systemic racial bias against
non-Whites in America. The second is much more emotional in nature, and has to do with
how Whites feel about racial minorities and racism in America. Taken together, this new
way of conceptualizing the dimensionality of Whites’ racial attitudes helps us understand
the evolution of racial attitudes, racial discrimination, and the nature of modern racism.
This paper proceeds in five distinct parts, with its ultimate goals to both provide a
comprehensive structural map of Whites’ racial attitudes and validate the use of a new
combination of survey items. First, we briefly review the difficulties associated with
measuring racial prejudice as well as the historical approaches used across several
disciplines. Second, we turn to the debate within political science on whether racial policy
attitudes are influenced most by emotional affect, ideological principles, or prejudice.
Third, we discuss our standards for a good measure with regards to racial attitudes and
prejudice. Fourth, we analyze a large number of previously validated attitudinal measures
and arrive at a second-order factor solution which indicates two higher-order dimensions
that undergird Whites’ racial attitudes. Finally, we conclude by deriving and validating a
four-item short form of our measure which was included on the 2016 Cooperative
Congressional Election Study common content (n = 64,000).
Asking Whites about Racial Prejudice Racial prejudice (racism) is a particularly difficult concept to both operationalize and
measure. While scholars have struggled with measuring difficult concepts across
disciplines, we would argue that the measurement of prejudice is one of the most difficult
4
things to capture in political science, especially in surveys. As we well know, prejudice is
unlikely to be openly or directly expressed in response to survey questions (Finkel 1988,
Berinsky 2004). Asking a survey respondent to place themselves on (for example) an 11-
point scale from zero (“not racist at all”) to ten (“extremely racist”) would likely result in
data that was not very meaningful, although those data would probably indicate that many
respondents did not hold racist attitudes. Secondly, based on the numerous revisions to
how we measure prejudice, Americans’ racial attitudes seem to be ephemeral, constantly
changing how they are displayed (DeSante and Smith, forthcoming). As Whites grow
accustomed to new methods of asking their opinions on both racial minorities and policies
that are both implicitly and explicitly racialized in nature, aggregate measures of racial
prejudice ebb.
Historically, asking Whites what they thought of other groups was relatively
straightforward. Respondents would be given a list of (about 80) adjectives including
“intelligent,” “ignorant”, “kind,” and “courteous” – and they would then be asked to assign
each of those characteristics to various races and ethnicities (Katz and Braly 1933). These
early studies, conducted primarily on undergraduates at Princeton, were among the first to
confirm common racial and ethnic stereotypes held by Whites. Germans were seen as
scientifically minded; Italians as impulsive; the Irish as pugnacious; and “Negroes” as
superstitious, lazy, and ignorant. While these stereotypes still persist, how acceptable they
are to voice has changed drastically over time. For example, Whites today are far less likely
to believe that the differences between whites and Blacks are due to Blacks having an
“inborn disability.” While 25.7% of Whites agreed with that in the 1977 General Social
5
Survey (GSS), that proportion has gradually fallen to be just about 7.1% in 2014 (GSS). The
same is true for questions that tap natural extensions of “biological racism.”
For example, in the 1992 American National Election Study (ANES), Whites were
asked to rate both Whites and Blacks on their levels of intelligence. 43.5% rated the groups
equally, 5.3% rated Blacks as more intelligent and over half (51.2%) rated Whites as more
intelligent. Over twenty years later, in the face-to-face portion of the 2012 ANES, those
numbers had shifted; 3% rated Blacks more intelligent, 57% rated the two groups equally
and only 40% of Whites rated their race as more intelligent. The endorsement of
stereotypes, however, seem to remain unchanged. Even in 2014, 50% of White ANES
respondents reported Blacks to be lazier than Whites, a small reduction from 54% in 1992;
preliminary data from the 2016 ANES also paint the same picture. These revised but still
unrefined measures of racial prejudice seem to paint a picture that is a far cry from
America having moved into a post-racial era. If anything, these data indicate that racial
attitudes are a core component of most Whites’ political belief systems.
While these measures of old-fashioned racism provide leverage in explaining
Whites’ opinions on racial (and racialized policies), they are no longer as commonly used as
explanatory variables: biological racism is no longer something Whites will openly endorse,
deflating the variance and therefore explanatory power of those measures. Early work by
Kinder and Sears (1981), and later by Kinder and Sanders (1996), sought to remedy this by
providing a newer measure of racial prejudice. This measure, which goes by many names –
new racism, symbolic racism, and racial resentment – is a measure which blends both anti-
Black affect with certain core beliefs about America, measuring both an individuals’
commitment to core principles as well as whether the respondent believes Blacks are
6
acting in a way that runs afoul of those same principles. The problem that many critics have
with the questions that comprise the racial resentment battery is that they are not only
measuring prejudice but also measure ideological or principled commitments.
For example, one statement for the racial resentment battery asks respondents how
strongly they agree with this statement: “it’s really a matter of some people not trying hard
enough; if blacks would only try harder they could be just as well off as whites.” This survey
measure is, by its design, measuring two different concepts. First, it is asking respondents
to voice an opinion about whether hard work is met with material success. Second, it asks
whether the respondent believes that if Blacks only worked harder they would they be as
well off as Whites with an affirmative response implicitly indicating a belief that Blacks are
not working as hard as Whites. We are certainly not the first scholars to point out the
double-barreled nature of these items, as Huddy and Feldman point out that the racial
resentment battery asks Whites “to agree with complex statements that could garner
support for reasons other than racial prejudice” (2009, 426). Some have even argued that
the principled (ideological) component of racial resentment, which manifests as opposition
to racial policies, is actually larger than the part intended to capture old-fashioned racism.
As Carmines et al. find, the latent factor being captured by the four racial resentment items
is actually “primarily a measure of the very thing that it is supposed to explain – racial
policy attitudes” (2011, 100).
For most political scientists, however, the racial resentment battery is the current
best approximation of modern racial attitudes held by Whites. While there has been
significant criticism of this measure (e.g. Sniderman and Tetlock 1986, Kluegel and Bobo
1993, Sniderman and Piazza 1993, Stoker 1998, Sniderman, et al. 2000, Wilson and Davis
7
2011) a number of recent works have pointed to its usefulness, especially in explaining
Whites’ attitudes during Obama’s presidency (Tesler and Sears 2010; Tesler 2013; DeSante
2013; Tesler 2016). Still, there may be a better way of measuring the structure and
relationship between modern anti-black affect and whatever “principles” the racial
resentment battery seems to be capturing.
Accepting that the original measure was conflating both principles and prejudice,
Davis and Wilson (2011) set out to do just this, developing a revised form of the racial
resentment scale called Explicit Racial Resentment. This measure was developed in order to
better separate conservative values, most notably a sense of “rugged individualism,” from
the anti-black component of racial resentment. In developing their scale, Davis and Wilson
note that their questions “mainly differ from past resentment measures in their explicit
connection between the source of the resentful feelings and the targeted racial group”
(2011, 121). Instead of asking respondents about whether they believe “blacks have gotten
less than they deserve,” the Explicit Racial Resentment scale lives up to its name, explicitly
asking respondents how they feel about statements like: “For African Americans to succeed
they need to stop using racism and slavery as excuses.” This is a move in the right direction,
but still might be missing some of the complexity of Whites’ racial attitudes. In our efforts
to map the landscape of racial attitudes, we should build upon these and other validated
measures that may enrich our understanding of whatever nuance structures Whites’
attitudes.
Ideally, any measure that aims to capture modern racial attitudes would meet four
tests for validity (Carmines and Zeller 1979; DeVellis 2012). First, it would have face
validity; we should know what we are measuring by the questions that are being asked.
8
Second, it should have a level of convergent validity; items which attempt to measure
similar constructs ought to covary together in predictable ways. Third, it should have
predictive validity: we should be able to predict that which we set out to explain. In this
case, our target is to explain both old-fashioned racism as well as beliefs about certain
racialized policies. Finally, the measure should have discriminant validity; not only should
the measure predict what it sets out to, but it should also be unrelated to measures to
which it is not theoretically related. Below, we discuss a few newer measures of racial
attitudes that meet these requirements.
Other Previously Validated Measures of Whites’ Racial Attitudes The Color-Blind Racial Attitudes Scale
Previous work has shown an increasing desire among young Whites for political
correctness and avoidance of discussions surrounding racial issues (Jackson 2008). This
avoidance largely stems from the perception that talking about race these days is “fraught
with the risks of misunderstanding and social sanction”; in other words, the social norms of
contemporary society guide Whites’ motivation to “avoid the appearance of prejudice”
(Apfelbuam, Sommers and Norton 2008:918). As research has shown (DeSante and Smith,
N.D.), younger Whites in particular have racial attitudes that are likely to be expressed
through a colorblind lens, as colorblindness is a “culturally sensitive approach to
intergroup contact” (Frankenberg 1993, Carr 1997, Bonilla-Silva, et al. 2004, Forman 2006,
Apfelbaum, et al. 2008, Bonilla-Silva 2014 [1997]).
In order to tap into this class of attitudes, Neville et al. (2000) developed the Color-
Blind Racial Attitudes Scale (CoBRAS). This scale, which contains 20 Likert-style items,
assesses the cognitive aspects of colorblind racial attitudes around three kinds of
9
unawareness: Whites’ unawareness regarding personal privilege related to race,
institutionalized racism, and blatant racial issues.2
The Psycho-social Costs of Racism to Whites Scale
While the CoBRAS items help us to examine cognitive awareness of racial inequality
and privilege, the Psycho-social Costs of Racism to Whites (PCRW) scale was developed to
get at the quasi-emotional aspects of Whites’ perceptions of racism in America. Developed
by Spanierman and colleagues (Spanierman and Heppner 2004, Spanierman, et al. 2006,
Poteat and Spanierman 2008), this set of items examines the costs borne by some Whites
for living in a society that they believe to be disadvantaging racial minorities. Like the
CoBRAS measure, these survey items get at beliefs about White privilege, but ask
respondents how they feel about race and racial inequality in America. Ultimately, there are
three sub-scales which address Whites’ “empathetic reactions toward racism,” levels of
“White guilt,” and how strongly “Whites fear other races.” The empathetic subscale consists
of questions which ask a respondent’s level of agreement with statements like “I become
sad when I think about racial injustice” or “I am angry that racism exists.” We believe this
subscale adds nuance to our understanding of Whites’ racial attitudes as it might tap into,
to borrow Tesler’s term, a “racially progressive” respondent’s desire to be anti-racist.
2For the construction and validation of these scales, we encourage reading the original Neville et al. (2000) piece. The first, Whites’ unawareness regarding personal privilege related to race, is measured with questions that ask about benefits Whites receive, including asking how strongly someone agrees that “White people in the U.S. have certain advantages because of the color of their skin.” The second component, which measures Whites’ unawareness regarding institutional racism, includes statements like “social policies, such as affirmative action, discriminate unfairly against white people.” Finally, to measure an unawareness regarding blatant racial issues, respondents are asked to indicate their agreement with statements like: “racism is a major problem in the U.S.” (reverse coded) and “racial problems in the U.S. are rare, isolated situations.” These measures broaden our analysis regarding the structure of Whites’ racial attitudes in that these items explicitly ask a respondent to recognize institutional discrimination in the United States. Not only are the items only asking about a single construct at a time, but being “colorblind” in their phrasing, none of the measures explicitly mention Blacks.
10
The second sub-scale, regarding White guilt, gets at whether an individual ever feels
shame about benefiting from racial inequalities, or if they feel good about being White. One
question we think is particularly useful involves personal accountability: “being White
makes me feel personally responsible for racism.” Beyond the simple institutional versus
structural explanations that one may have regarding racial inequality (Kluegel and Smith
1986; Smith 2014), these types of questions get at whether an individual believes that they
benefit from being White and whether they have emotional reactions to that. Finally, as an
increasing amount of research shows that Whites are aware of their racial identity and
their whiteness, we believe these might be the types of questions more likely to resonate
with younger Whites. While previous research suggested that Whites were unaware of
their race, as the demographics of the U.S. change, Whites are becoming more aware of
their racial identity (Wong and Cho 2005, McDermott and Samson 2005).
The third and final subscale from the PCRW battery taps Whites’ fear of other racial
groups, asks how much they trust members of other racial groups, and further asks
whether they “feel safe in most neighborhoods, regardless of the racial composition.” While
these might be affected by social desirability, they provide a direct contrast with Whites’
levels of empathy for racial minorities. These questions move past asking about resentment
and principles and, similar to the studies of anger-based racial resentment (Banks and
Valentino 2012; Banks 2014), perhaps capture respondents’ gut-level reactions to their
experiences with non-Whites. While some may be skeptical of a scale that implies Whites
have costs associated with racism, we would remind them that the variance in this scale is
what we can leverage. Certainly there are some Whites who might feel guilty about racial
11
privilege, but it might be those who feel neither guilt nor empathy that will help us
understand the structure underlying Whites’ racial attitudes.
Empirical Strategy
We believe that the best way to create a better understanding of how these
measures work together is to simply ask a large number of Whites every one of the
aforementioned questions. Having data on all of the various scales and subscales would
allow us to complete a few important tasks: first, we are able to verify the structure of each
of the constructs and those constructs that are thought to be multidimensional can be
tested as such. Second, this provides us a mechanism to test how racial resentment and
explicit racial resentment, commonly used by political scientists, are related to several
novel survey batteries that have already been independently verified in other disciplines.
Finally, asking this many attitudinal questions gives us a unique amount of leverage to
construct a map of Whites’ racial attitudes and enables us to visualize not just which
attitudes are held and how strongly – but also which clusters of attitudes are correlated
with other types of attitudes and what this larger structure can explain.
Given this approach, we now find ourselves with five competing scales to explain
how Whites’ organize their racial attitudes, each with its own theoretical link to old-
fashioned racial prejudice as well as opinions regarding racial policies: principled ideology;
Kinder and Sanders’ racial resentment (RR, 4 survey items); Davis and Wilson’s explicit
racial resentment (EXR, 5 items); Apfelbuam et al.’s Color-blind Racial Animus Scale
(CoBRAS, 20 items); Spanierman’s psycho-social costs of racism to Whites (PCRW, 15
items). Additionally, both the CoBRAS and the PCRW are multidimensional in nature; each
having three sub-scales representing a different facet of Whites’ racial attitudes. We ought
12
to begin by examining the structure of each of these multidimensional constructs to be sure
that the data fit their hypothesized structure. In order to do this, empirically, we should use
a series of confirmatory factor analyses (CFA). Upon completing these initial analyses, we
will then estimate how all of these latent factors fit together.
Theoretical Expectations Borrowing from the previous literature on racial resentment, Explicit Racial Resentment,
CoBRAS, and PCRW, we hypothesize that the factor solutions should follow those
theoretically defined and previously confirmed in other data. In particular, we predict that
all of the resentment items (both the Kinder and Sanders version as well as the explicit
version) would load on a single latent dimension, which we will simply label “resentment.”
We also anticipate a three-factor solution for the color-blind racial attitudes scale (CoBRAS)
and another three-factor solution to the psycho-social costs of racism to Whites (PCRW).
To parse out the difference between principled conservatism and racial attitudes, we also
measure “conservative ideology;” specifically, we rely on a handful of questions, including
the traditional seven-point ideology measure, a rating of how favorably the respondent
viewed the Tea Party, a dichotomous variable indicating whether the respondent
supported marriage equality, a general question on taxes versus governmental spending,
and finally a question on how best to deal with a budget deficit if one had to either raise
sales taxes or raise income taxes. We believe that these are fair representations of both the
preference for limited government as well as what are often thought of as conservatism’s
core issues. As a result, we anticipate a single-factor model will fit these survey measures
quite well.
13
When it comes to how all these attitudes fit together, we have some preliminary
hypotheses. Based on our reading of the subscales and the language in the questions, we
expect that two factors should ultimately structure all of the measures. A close reading of
the survey items (which appear below) will show that many of the survey items are asking
whether the respondent agrees with an empirical observation about the world: statements
about the past and present and whether Blacks are “making excuses” or not trying hard
enough. Even the items that discuss the concept of fairness do not include any emotional
attribution. However, the items in the three PCRW subscales all contain language that is
specific to emotions the respondents may feel: anger, shame, pride, and fear.
While we are not going to speculate on which, to borrow Banks and Valentino’s
(2012) term, “emotional substrates” undergird racial attitudes. We only hypothesize that
these items were designed to capture emotional reactions in a way that makes them unique
from the other items. Thus, our first hypothesis is that these subscales from the PCRW will
form a latent “quasi-emotional” dimension:
H1: There will be a second-order factor consisting of questions that relate to the emotional reactions of White respondents.3
Furthermore, given how the other items ask for empirical assessments of facts, or at
least beliefs about the empirical state of race relations in American society, we expect that
those items will load on a second distinct dimension representing a recognition of the
3 While there is debate in the psychology literature about whether “resentment” itself is an emotion, scholars agree that it is not one of the six “primary” emotions from the Ekman model (fear, anger, sadness, disgust, happiness, and surprise) or the eight from Plutchik’s (2001) model (joy, sadness, acceptance, disgust, fear, anger, surprise, and anticipation). We are agnostic on the exact roots of the emotions, and the direction of any sort of causality between emotions and racial attitudes. Still, we have strong evidence to suggest that these items are tapping something different than the others.
14
racial status quo. Even experiencing guilt, which some believe to be a combination of
primary emotions, requires a white respondent to acknowledge that systemic inequalities
exist and are in their favor. For example, unawareness of White privilege may be closely
related to feelings of resentment because Whites may believe that racism is no longer a
problem. Therefore, we would predict that people who are unaware of white privilege may
also be likely to feel a sense of resentment towards Blacks, if they believe Blacks appear to
be gaining from a special set of policies that should, theoretically, be afforded to all
Americans. These kinds of beliefs all involve, we would argue, misperceptions about the
reality of race in America today. As a result, we think that most of the other items should
load together on a dimension that indicates respondents’ awareness of this reality:
H2: There will be at least one second-order factor related to questions which measure the recognition and awareness of racial inequalities and racism in contemporary American society. In order to test this in a confirmatory way, we conduct an additional confirmatory
factor analysis that hypothesizes an eight-factor solution: a single factor representing
resentment, a single factor representing ideology, three factors related to the CoBRAS, and
finally three factors representing aspects of the PCRW. If we can confirm that an eight-
factor solution adequately fits the data, with each survey item loading on its hypothesized
dimension, we can then move on to analyze the relationship between these unobserved
dimensions by way of a second-order factor analysis. Similar to a basic factor-analytic
model, a second-order factor model can be thought of as a factor analysis of factors,
ultimately testing if higher-order dimensions can account for the variance observed
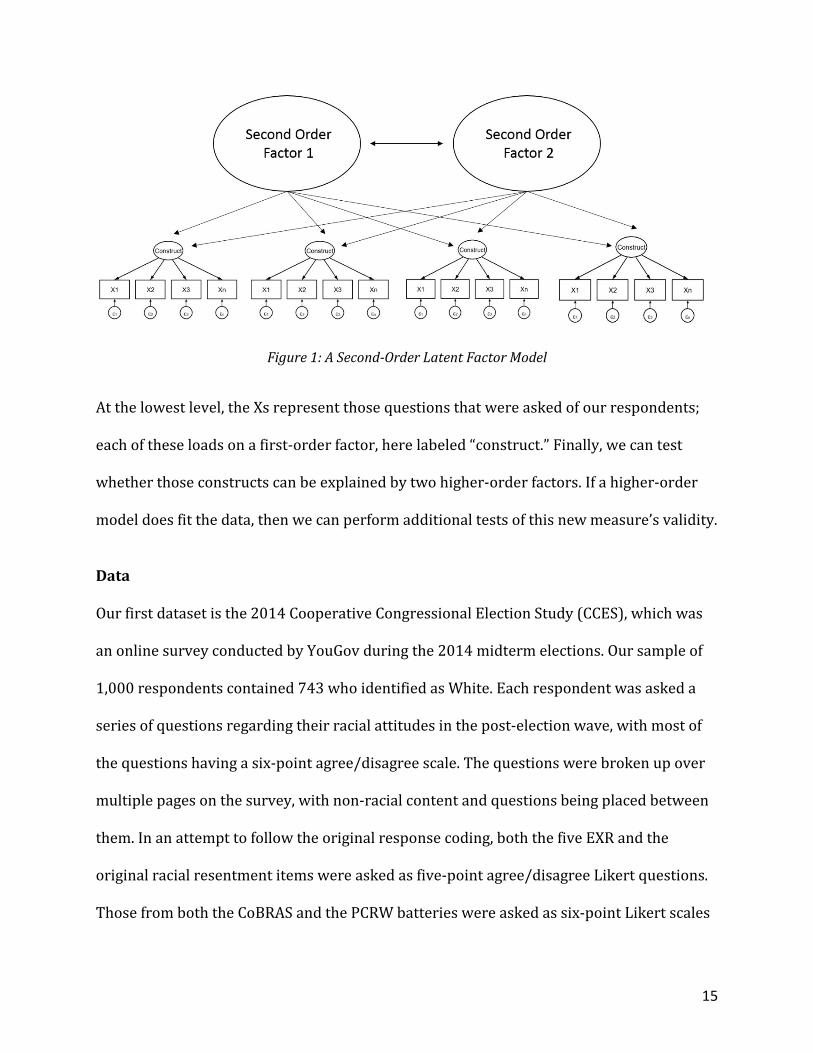
between lower-level variables. Graphically, the concept is illustrated, below, in figure 1:
15
Figure 1: A Second-Order Latent Factor Model
At the lowest level, the Xs represent those questions that were asked of our respondents;
each of these loads on a first-order factor, here labeled “construct.” Finally, we can test
whether those constructs can be explained by two higher-order factors. If a higher-order
model does fit the data, then we can perform additional tests of this new measure’s validity.
Data Our first dataset is the 2014 Cooperative Congressional Election Study (CCES), which was
an online survey conducted by YouGov during the 2014 midterm elections. Our sample of
1,000 respondents contained 743 who identified as White. Each respondent was asked a
series of questions regarding their racial attitudes in the post-election wave, with most of
the questions having a six-point agree/disagree scale. The questions were broken up over
multiple pages on the survey, with non-racial content and questions being placed between
them. In an attempt to follow the original response coding, both the five EXR and the
original racial resentment items were asked as five-point agree/disagree Likert questions.
Those from both the CoBRAS and the PCRW batteries were asked as six-point Likert scales
16
(replacing “neither agree nor disagree” with “somewhat agree” and “somewhat disagree”).
The exact wording for all of our measures can be found in the tables in this manuscript. In
total, we have 45 items of interest: nine questions that measure “racial resentment,” five
that we believe proxy conservative ideology, sixteen questions that measure color-blind
racial attitudes, and finally fifteen items that measure the psycho-social costs of racism to
Whites. Additional variables were collected to serve as dependent variables to test the
predictive validity of each of our measures.
Results We begin by confirming the fit of each of the constructs separately. Each of the tables
presents factor loadings (with the first loading for each factor constrained to be 1.0) as well
as several goodness-of-fit statistics. Aside from the traditional χ2 statistic, which ought to be
statistically indistinguishable from zero for models that fit the data well (i.e. statistically
insignificant), we also present the comparative fit index (CFI), the Tucker-Lewis Index
(TLI), and the root mean square error of approximation (RMSEA). In terms of assessing
how well the data fit the hypothesized models, we would ideally have a CFI and TLI which
are both close to 1.0, an RMSEA under 0.05, and a χ2 statistic that is statistically
insignificant.4 All factor loadings are statistically significant from zero unless otherwise
noted. The results of these confirmatory factor analyses appear below in Appendix A as
Tables A1-A4. As the central hypotheses of this paper concern higher-order factors, we
4 Unlike other tests of hypotheses, typically in structural equation modeling an insignificant χ2 statistic is an indicator of good model fit whereas a large χ2 indicates the model is not supported by the data. For a detailed discussion of the goodness-of-fit measures, see Bentler and Bonett (1980), Bentler (1990), or Bollen and Long (1993).
17
believe it is enough to say that the factor structures all fit as theorized and validated
elsewhere.
To test our main hypotheses, we can fit a second-order confirmatory factor-analytic
model using the raw survey data. To do this involves simultaneously estimating factor
loadings for each of the eight first-order factors and also estimating how those factors load
onto two higher-order latent variables. As this model estimates 83 different parameters
(factor loadings, thresholds, co-variances, and error co-variances), we refrain from a
tabular presentation of our results. In terms of the traditional measures of model fit, the
second-order factor analysis fits the data very well: the ratio of chi-squared to degrees of
freedom is below 2 (1.64), the CFI is 0.97, TLI is 0.96, and the RMSEA is below 0.04. The
second-order factor loadings are shown below in table 5; all factor loadings are
significantly different from zero at conventional levels.5
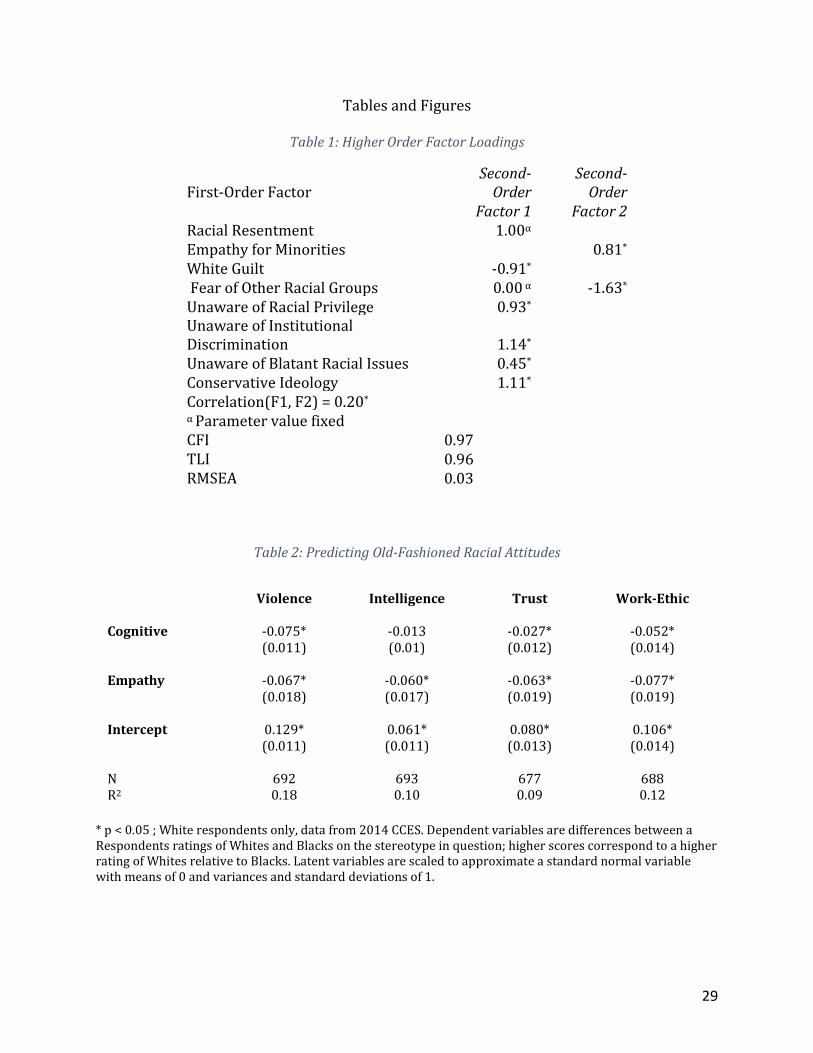
[Table 1 about Here]
The items that load onto the first of the two higher-order factors include Racial
Resentment, political ideology, White Guilt, and the three subscales of the CoBRAS having
to do with unawareness surrounding racial issues. The second dimension is defined
primarily by fear of other races being opposed to empathetic reactions to racism. The
factor loadings are illustrated in figure 3 in such a way that higher scores relate to more
positive attitudes towards Blacks and other minorities, higher levels of empathy for racial
minorities, as well as an increased awareness regarding racial issues. More specifically,
respondents who score higher on Factor 1 are more aware of racism, are less racially
5 The smallest test statistic (a z-statistic), in absolute terms, for any of the factor loadings is 6.88, which corresponds to a p-value far below 0.001.
18
resentful, and are less ideologically conservative; they are also likely to have some level of
“white guilt” from the PCRW battery. All of these sub-factors consist of items that relate to
White respondents’ understanding and awareness of race, racism, and the racial privilege
Whites enjoy in America. This second-order factor may indicate how knowledgeable an
individual is regarding the racial status quo. Consequently, we think of this as the more
“cognitive” dimension.6
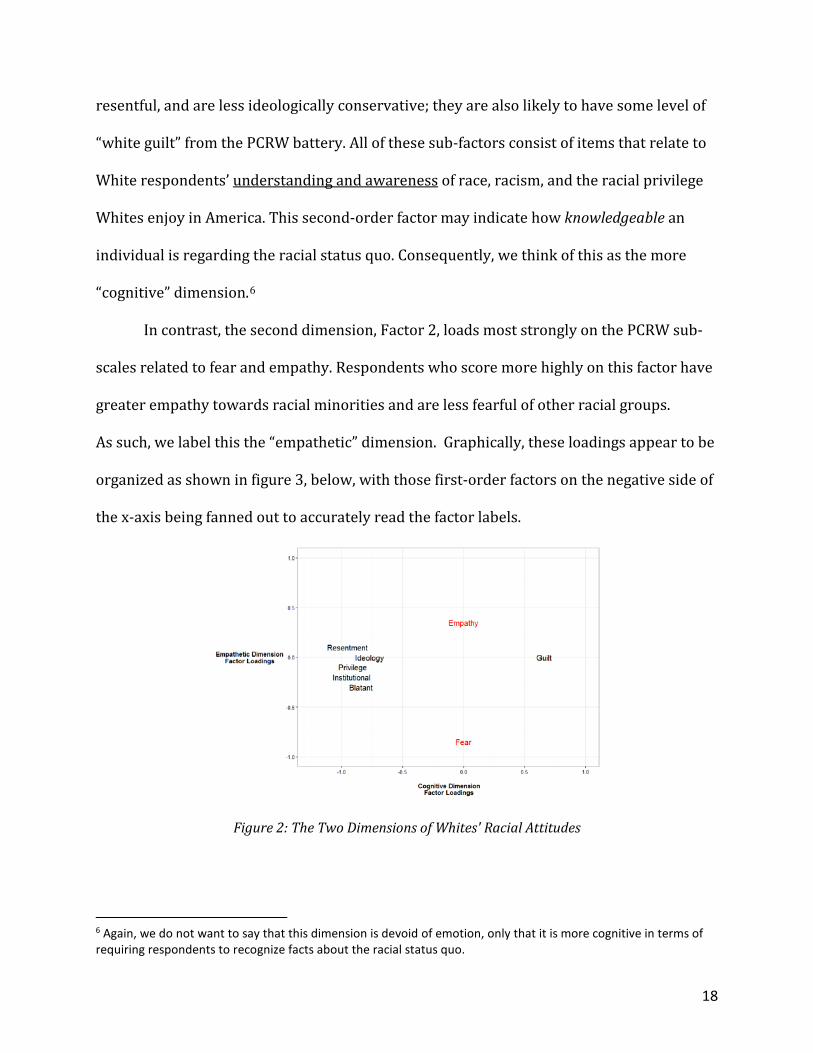
In contrast, the second dimension, Factor 2, loads most strongly on the PCRW sub-
scales related to fear and empathy. Respondents who score more highly on this factor have
greater empathy towards racial minorities and are less fearful of other racial groups.
As such, we label this the “empathetic” dimension. Graphically, these loadings appear to be
organized as shown in figure 3, below, with those first-order factors on the negative side of
the x-axis being fanned out to accurately read the factor labels.
Figure 2: The Two Dimensions of Whites' Racial Attitudes
6 Again, we do not want to say that this dimension is devoid of emotion, only that it is more cognitive in terms of requiring respondents to recognize facts about the racial status quo.
19
The two factors are only slightly correlated (r=0.11), and combined explain between 60-
90% of the variance in the first-order factors, a very promising result in line with our main
hypotheses.
To begin evaluating the predictive validity of these two dimensions, we examined
how they relate to three different classes of dependent variables: the aforementioned old-
fashioned racism measures, evaluations of several racial policies (both implicitly and
explicitly racialized) and evaluations of several race-neutral policies. We would expect that
dependent variables that are linked to race will also be significantly related to both of our
higher-order factors. Those that are not linked to race, either by explicitly mentioning a
racial group or by the process of racialization (cf. Tesler 2014; Tesler 2016), might still be
related to the cognitive dimension which can serve as a proxy measure of ideological
conservativism. As our dependent variables for old-fashioned racism are continuous, and
support for the policies we selected are dichotomous, we present the two different types of
linear models separately. In both tables the independent variables (our second-order
factors) are approximately distributed as standard normal random variables with means of
approximately zero and variances and standard deviations of approximately one. Table 2,
below, presents the first set of ordinary least squares estimates predicting “old-fashioned”
racist stereotypes:
[Table 2 About Here]
As our results in the table indicate, both the second-order cognitive and empathetic
dimensions are related to old-fashioned stereotypes (with the exception of the relationship
between the cognitive dimension and ratings on intelligence). Still, taking the results for
differences on perceptions of each group as “violent,” which was coded as the difference
20
between two variables (each continuous and coded to run from zero to one), we notice that
both dimensions are related to this old-fashioned attitude. Specifically, when each of the
latent variables are set at their means (approximately zero), Whites rate their group more
favorably by about 12% of the total scale. As they become more cognizant of systemic
racism, this is met with a decrease in old-fashioned racism. The same relationship also
holds for empathy: as Whites become increasingly empathetic, the perceived differences
between Whites and Blacks on all of these dimensions decrease. The value-added of the
two-dimensional model with regards to racial stereotypes should be clear by examining the
size and significance of the coefficients for “empathy” in table 6. With the exception of the
coefficient on “violence,” empathy and fear appear to be more strongly linked to the old-
fashioned measures of racial prejudice than the dimension which contains measures of
racial resentment.
[Table 3 about Here]
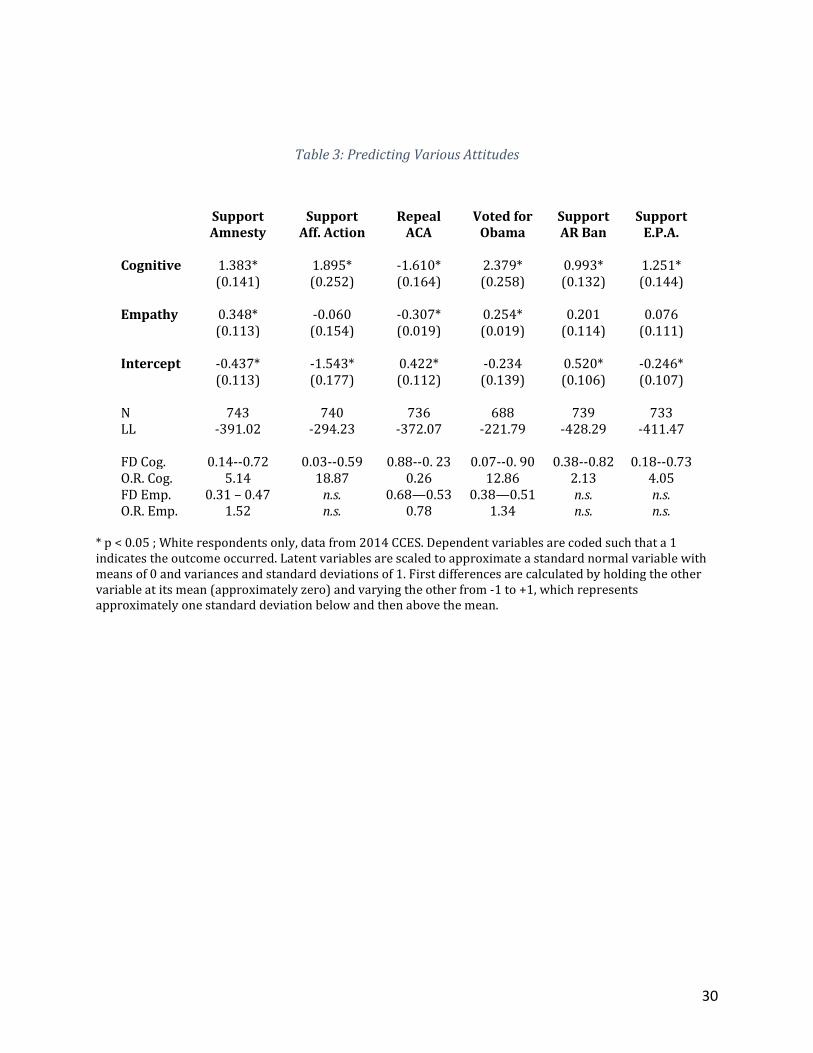
Table 3, above, presents the logistic regression estimates for six different variables
of varying racial content: supporting amnesty for illegal immigrants (“granting legal status
to all illegal immigrants with jobs”), supporting affirmative action as a means to “correct for
past discrimination,” whether the individual believes the Affordable Care Act (Obamacare)
should be repealed, whether they would support a ban on assault rifles/weapons, and
whether they would support the Environmental Protection Agency’s increased
enforcement of the Clean Air Act. While views on the last two variables will certainly be
influenced by ideology, they lack any overt ties to race. Thus, we expect that only the first
dimension ought to help explain those attitudes and the second dimension should not. In
terms of the other policies, we would expect that both of our higher-order dimensions will
21
be able to significantly explain variance on attitudes regarding implicitly and explicitly
racialized policies. This is, indeed, exactly what we find with one notable exception:
attitudes regarding affirmative action seem to be unrelated to the fear-empathy dimension.
We believe this is primarily due to how the question is worded, as it explicitly references
“past discrimination” as the reason for the policy.
As the results from a logistic regression are not immediately interpretable, table 3
also presents first differences and odds ratios. These were calculated by setting the other
factor at its mean (approximately zero) and allowing the independent variable in question
to vary from -1 to 1, which approximates a shift from one standard deviation below the
mean to one standard deviation above the mean. The results in the first column indicate
that moving from one standard deviation below the mean to one standard deviation above
the mean on the cognitive dimension changes the probability that a respondent would
support granting legal status to undocumented immigrants from 0.14 to 0.72, about a five-
fold increase. Moreover, an equivalent shift on the empathy dimension produces a similar
though smaller result, increasing the probability of supporting amnesty from 0.31 to 0.47.
The odds ratio of 1.52 indicates that those who are higher on empathy are about 52% more
likely to support amnesty than those who have below average levels of empathy. The
results are similar for our other racialized policies. Those who are high on the cognitive
dimension are nearly 19 times more likely to support affirmative action than those who
score below average on that dimension; those who are above the mean on both dimensions
also wish to repeal Obamacare at a lower rate and were more likely to vote for Obama in
2012. Finally, looking at the policies without any explicit racial content, we see that only
the dimension that captures ideology is related to opinions regarding gun control and
22
support for the EPA.7 Thus we have shown that the two dimensions are strong predictors
of old-fashioned racism as well as attitudes on racialized policies, but not necessarily linked
to policies devoid of any racial content.
The Four-Item FIRE Scale
Our findings up until this point were based on asking fewer than 1,000 White
Americans to answer nearly 50 questions solely about their perceptions of race and
inequality in order to map racial attitudes, but this line of questioning is not well suited to
the average social scientist’s budget; asking 50 questions is neither practical nor necessary.
In order to provide researchers with a “short form” for these racial attitudes in two
dimensions, we conducted a series of computational tests to see which smaller subset of
items would explain the most variance in our two second-order dimensions.8
The four-item short form of our FIRE scale, an acronym for Fear, (acknowledgement
of) Institutional Racism, and Empathy, appears below. Based on our findings heretofore,
these items were included on the 2016 Cooperative Congressional Election Study common
content, which surveyed over 60,000 Americans in the fall of that year. Below, we conclude
our analysis by discussing the scale’s summary statistics, covariates, and predictive power.
Four-Item FIRE Scale: • I am fearful of people of other races. • White people in the U.S. have certain advantages because of the color of their skin. • Racial problems in the U.S. are rare, isolated situations. • I am angry that racism exists.
7 Obviously thoughts on gun control, or any opinions related to interpretations of the Second Amendment, could be closely associated with racial attitudes. We chose this policy because it is not obviously linked to the fear/empathy dimension and thus provides a mechanism for testing our theory. 8 This was done by finding the combination of four items that a) included items from both dimensions b) produced two Eigenvalues greater than 1.0, and c) explained the most variance on each of the second-order dimensions. For more details, see Appendix B.
23
Below we present basic summary statistics for the four items asked of over 40,000
White respondents – including the distribution of responses, averages, standard deviations,
and correlations with standard covariates of interest (partisanship, ideology, age, income,
and racial resentment).
[Table 4 about Here]
Considering the attention that racial attitudes were given during the run-up to the
2016 election, we sought to test the predictive power of these measures as they relate to
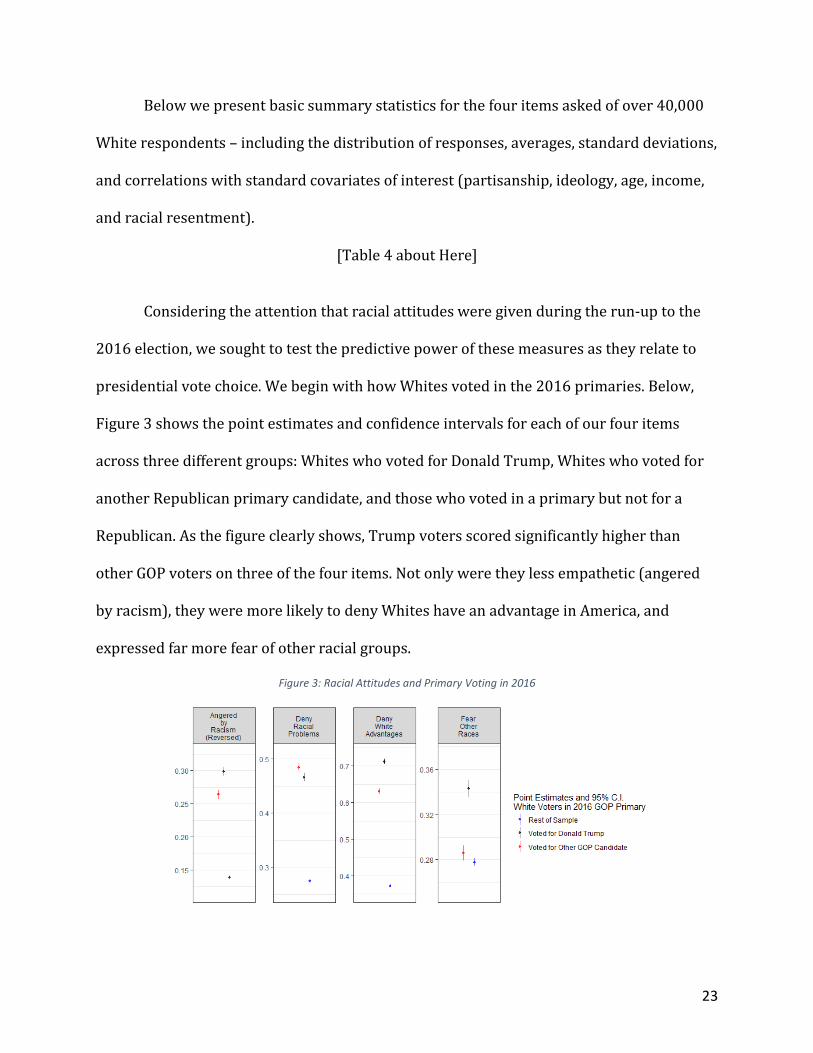
presidential vote choice. We begin with how Whites voted in the 2016 primaries. Below,
Figure 3 shows the point estimates and confidence intervals for each of our four items
across three different groups: Whites who voted for Donald Trump, Whites who voted for
another Republican primary candidate, and those who voted in a primary but not for a
Republican. As the figure clearly shows, Trump voters scored significantly higher than
other GOP voters on three of the four items. Not only were they less empathetic (angered
by racism), they were more likely to deny Whites have an advantage in America, and
expressed far more fear of other racial groups.
Figure 3: Racial Attitudes and Primary Voting in 2016
24
Democratic primary voters, on the other hand, score far lower on each of the items –
although in terms of racialized fear, they are statistically indistinguishable from the
Republicans who voted for someone other than Donald Trump in the 2016 primaries. Now
we turn to how these items relate to voting behavior in the general election.
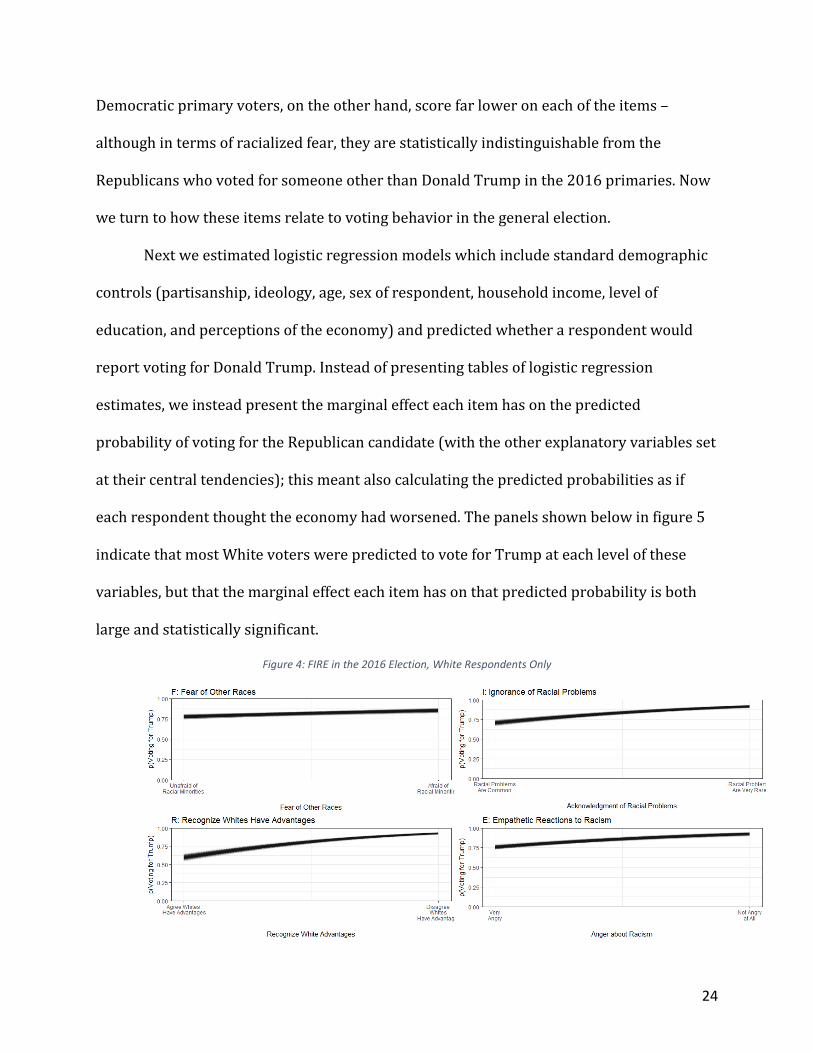
Next we estimated logistic regression models which include standard demographic
controls (partisanship, ideology, age, sex of respondent, household income, level of
education, and perceptions of the economy) and predicted whether a respondent would
report voting for Donald Trump. Instead of presenting tables of logistic regression
estimates, we instead present the marginal effect each item has on the predicted
probability of voting for the Republican candidate (with the other explanatory variables set
at their central tendencies); this meant also calculating the predicted probabilities as if
each respondent thought the economy had worsened. The panels shown below in figure 5
indicate that most White voters were predicted to vote for Trump at each level of these
variables, but that the marginal effect each item has on that predicted probability is both
large and statistically significant.
Figure 4: FIRE in the 2016 Election, White Respondents Only
25
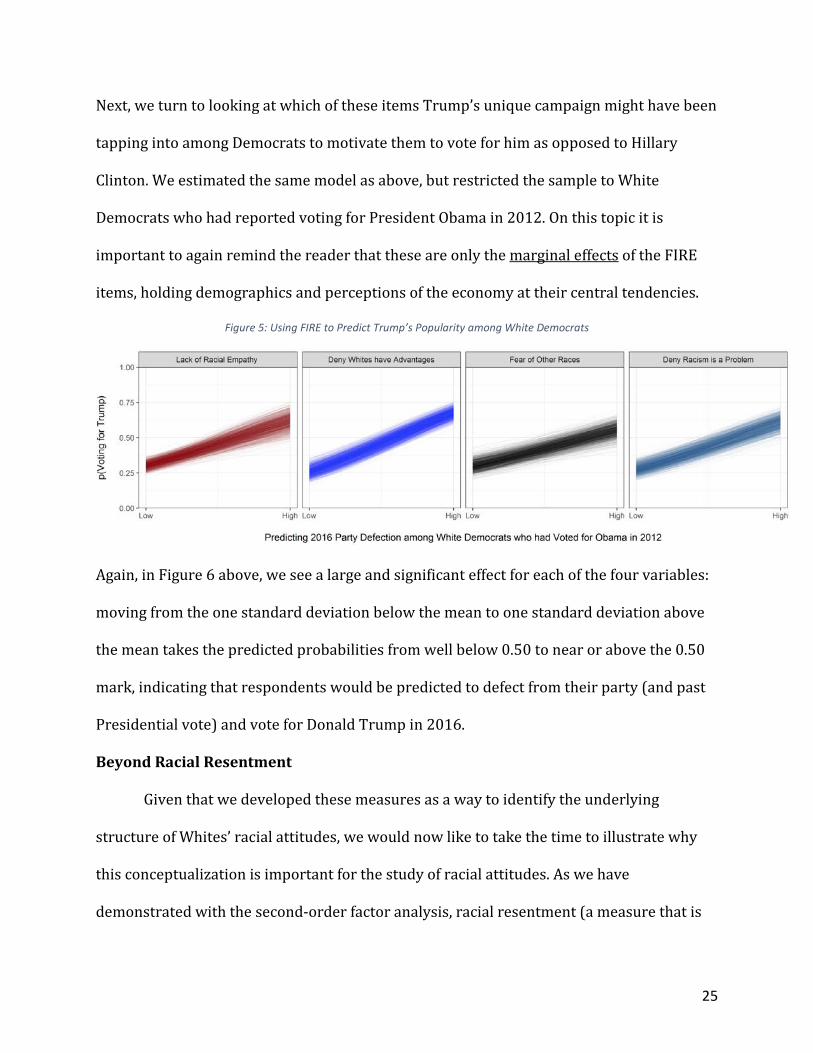
Next, we turn to looking at which of these items Trump’s unique campaign might have been
tapping into among Democrats to motivate them to vote for him as opposed to Hillary
Clinton. We estimated the same model as above, but restricted the sample to White
Democrats who had reported voting for President Obama in 2012. On this topic it is
important to again remind the reader that these are only the marginal effects of the FIRE
items, holding demographics and perceptions of the economy at their central tendencies.
Figure 5: Using FIRE to Predict Trump’s Popularity among White Democrats
Again, in Figure 6 above, we see a large and significant effect for each of the four variables:
moving from the one standard deviation below the mean to one standard deviation above
the mean takes the predicted probabilities from well below 0.50 to near or above the 0.50
mark, indicating that respondents would be predicted to defect from their party (and past
Presidential vote) and vote for Donald Trump in 2016.
Beyond Racial Resentment
Given that we developed these measures as a way to identify the underlying
structure of Whites’ racial attitudes, we would now like to take the time to illustrate why
this conceptualization is important for the study of racial attitudes. As we have
demonstrated with the second-order factor analysis, racial resentment (a measure that is
26
very useful and correlates well with a number of policy preferences) is but one aspect of
Whites’ racial attitudes. A second dimension, concerned with the fear of other racial groups
as well as empathetic reactions to racism, also explains how Whites think about race in
America today. One attitude in particular that has been asked over the years, and is
certainly related to “old fashioned racism” (Tesler 2016, 19-20), relates to how comfortable
an individual would be with a member of their family marrying someone of a different race
(an attitude that covaries with racial resentment).
Certainly, a White respondent might not want someone in their family to marry
someone of a different race because they believe that person is violating traditional
American norms and values. Yet there may be a different way of understanding Whites’
feelings about inter-racial marriage, one that even Kinder and Sears acknowledge in their
paper: fear.9 We predict that the fear of racial minorities, more than symbolic racism,
would be of particular importance in understanding how Whites think about inter-racial
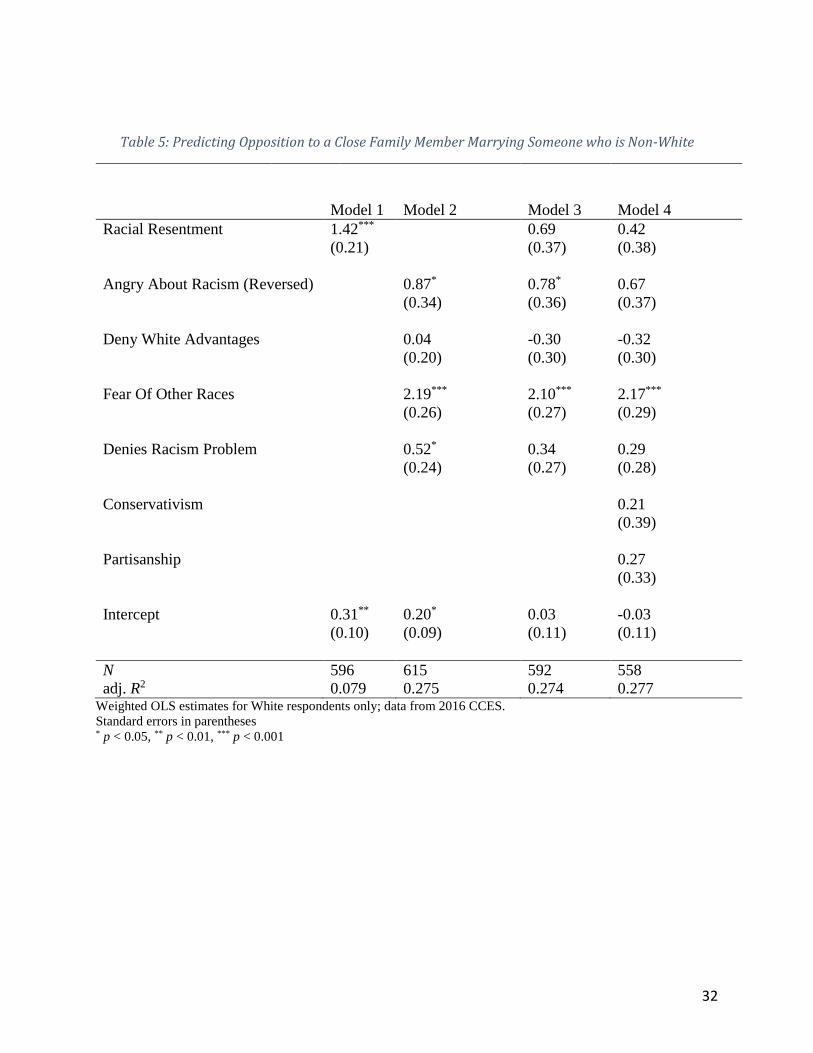
marriage. To test this hypothesis, we estimated four equations predicting agreement with
the statement “it would make me feel uneasy if a close relative of mine was planning to
marry someone who was a member of another race,” which was coded to run from 0
(strongly disagree) to 5 (strongly agree). The first two columns in Table 5, below, compare
the effects that racial resentment and our FIRE items have on a respondent’s opposition to
inter-racial marriage.
[Table 5 About Here]
9 As Kinder and Sears note in their original paper, fear of racial minorities (particularly fear of black violence) can have a strong effect on attitudes (1981, p.422) even after controlling for symbolic racism.
27
Model 1 shows that racial resentment is statistically significantly related to
discomfort with interracial marriage, and explains about 8% of the variance (R2). Model 2
shows that three of our four measures are statistically related to this attitude, and the item
measuring fear of other races has the largest coefficient; the model also explains over three
times the variance in the dependent variable that racial resentment does. Models 3 and 4
indicate what happens when we control for all the measures simultaneously and even
when we include other measures of ideology and partisanship (Model 4); not only does
racial resentment lose its statistical significance, but it does not help to explain any
additional variance once the FIRE measures are included in the prediction equation. It is
worth noting that this comparison of R2 values is the same test that Kinder and Sears used
to validate their theory of symbolic racism as opposed to racial threat.
Discussion
This paper began by quoting Kinder and Sears’ observation that “empirical
confrontations between competing theories [of prejudice] are surprisingly rare.” With that
spirit of competition in mind, this paper has discussed both the theoretical link between
racial attitudes and several sets of survey items. By using several independently verified
batteries of racial attitudinal measures, we have developed and estimated a new higher-
order map of White Americans’ racial attitudes. As we currently do not know of any other
paper in political science that has presented both the breadth and depth of these survey
items on such a large sample, our work is the first to show that racial resentment is only
one component of a more complex and multidimensional set of attitudes. The first
dimension includes not only the principles and ideology that critics of racial resentment
28
are so quick to point to as alternative explanations, but also measures of White guilt as well
as reflections on White privilege (another measure that may be new to political scientists).
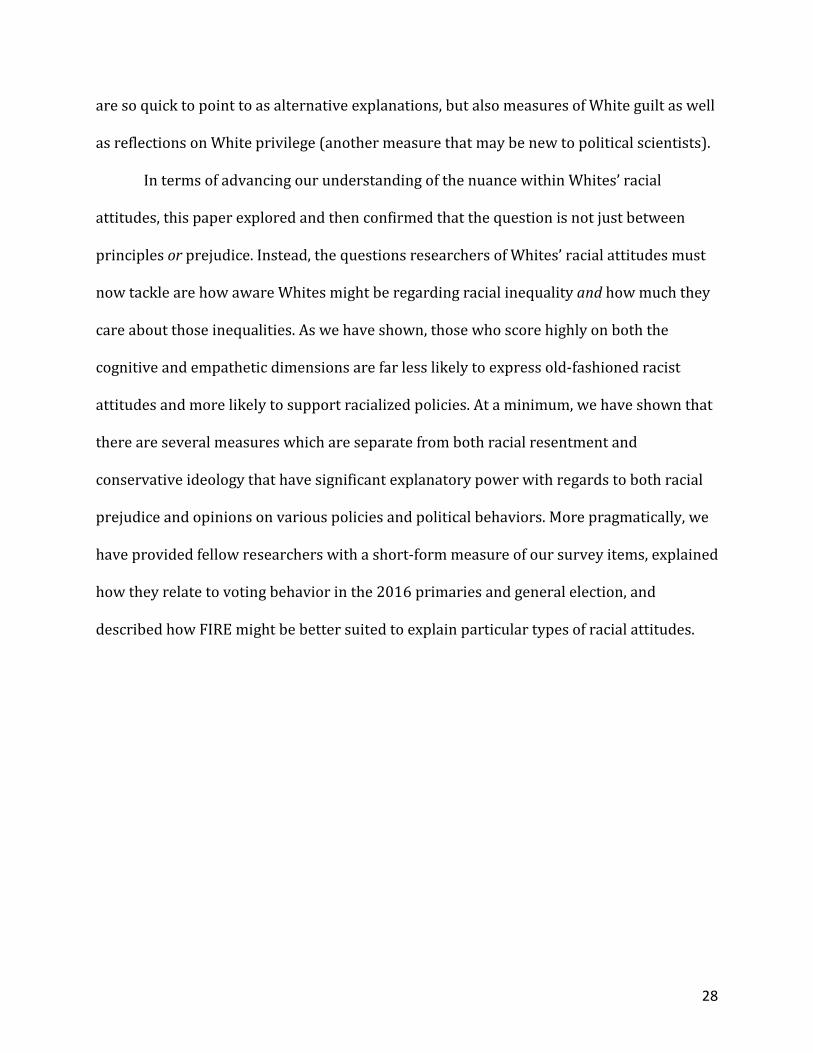
In terms of advancing our understanding of the nuance within Whites’ racial
attitudes, this paper explored and then confirmed that the question is not just between
principles or prejudice. Instead, the questions researchers of Whites’ racial attitudes must
now tackle are how aware Whites might be regarding racial inequality and how much they
care about those inequalities. As we have shown, those who score highly on both the
cognitive and empathetic dimensions are far less likely to express old-fashioned racist
attitudes and more likely to support racialized policies. At a minimum, we have shown that
there are several measures which are separate from both racial resentment and
conservative ideology that have significant explanatory power with regards to both racial
prejudice and opinions on various policies and political behaviors. More pragmatically, we
have provided fellow researchers with a short-form measure of our survey items, explained
how they relate to voting behavior in the 2016 primaries and general election, and
described how FIRE might be better suited to explain particular types of racial attitudes.
29
Tables and Figures
Table 1: Higher Order Factor Loadings
First-Order Factor Second-
Order Second-
Order Factor 1 Factor 2 Racial Resentment 1.00α Empathy for Minorities 0.81* White Guilt -0.91* Fear of Other Racial Groups 0.00 α -1.63* Unaware of Racial Privilege 0.93* Unaware of Institutional Discrimination 1.14* Unaware of Blatant Racial Issues 0.45* Conservative Ideology 1.11* Correlation(F1, F2) = 0.20* α Parameter value fixed CFI 0.97 TLI 0.96 RMSEA 0.03
Table 2: Predicting Old-Fashioned Racial Attitudes
Violence Intelligence Trust Work-Ethic Cognitive -0.075* -0.013 -0.027* -0.052* (0.011) (0.01) (0.012) (0.014) Empathy -0.067* -0.060* -0.063* -0.077* (0.018) (0.017) (0.019) (0.019) Intercept 0.129* 0.061* 0.080* 0.106* (0.011) (0.011) (0.013) (0.014) N 692 693 677 688 R2 0.18 0.10 0.09 0.12
* p < 0.05 ; White respondents only, data from 2014 CCES. Dependent variables are differences between a Respondents ratings of Whites and Blacks on the stereotype in question; higher scores correspond to a higher rating of Whites relative to Blacks. Latent variables are scaled to approximate a standard normal variable with means of 0 and variances and standard deviations of 1.
30
Table 3: Predicting Various Attitudes
Support
Amnesty Support
Aff. Action Repeal
ACA Voted for
Obama Support AR Ban
Support E.P.A.
Cognitive 1.383* 1.895* -1.610* 2.379* 0.993* 1.251* (0.141) (0.252) (0.164) (0.258) (0.132) (0.144) Empathy 0.348* -0.060 -0.307* 0.254* 0.201 0.076 (0.113) (0.154) (0.019) (0.019) (0.114) (0.111) Intercept -0.437* -1.543* 0.422* -0.234 0.520* -0.246* (0.113) (0.177) (0.112) (0.139) (0.106) (0.107) N 743 740 736 688 739 733 LL -391.02 -294.23 -372.07 -221.79 -428.29 -411.47 FD Cog. 0.14--0.72 0.03--0.59 0.88--0. 23 0.07--0. 90 0.38--0.82 0.18--0.73 O.R. Cog. 5.14 18.87 0.26 12.86 2.13 4.05 FD Emp. 0.31 – 0.47 n.s. 0.68—0.53 0.38—0.51 n.s. n.s. O.R. Emp. 1.52 n.s. 0.78 1.34 n.s. n.s.
* p < 0.05 ; White respondents only, data from 2014 CCES. Dependent variables are coded such that a 1 indicates the outcome occurred. Latent variables are scaled to approximate a standard normal variable with means of 0 and variances and standard deviations of 1. First differences are calculated by holding the other variable at its mean (approximately zero) and varying the other from -1 to +1, which represents approximately one standard deviation below and then above the mean.

31
Table 4: FIRE and Covariates
Racial
Fear
White
Advantages
Racial
Problems
Angry Racism
Exists
1=Strongly Agree (raw %) 2.05 22.58 5.37 54.70
2=Somewhat Agree 12.31 24.05 15.91 24.05
3=Neither Agree/Disagree 22.47 17.95 17.25 16.18
4=Somewhat Disagree 25.40 14.77 31.26 2.90
5=Strongly Disagree 37.56 20.54 29.98 2.06
Non-Response Rate (%) 0.21 0.10 0.23 0.11
N 40,099 40,099 40,099 40,099
Weighted Mean (NRs dropped) 3.83 2.97 3.58 1.77
Weighted Standard Deviation 1.13 1.45 1.22 0.99
Correlation with Partisanship -0.12 0.53 -0.37 0.33
Correlation with Ideology -0.16 0.57 -0.71 0.36
Correlation with Age -0.06 0.11 0.00 0.09
Correlation with Education 0.09 -0.22 0.06 -0.04
Correlation with Racial Resentment 0.16 0.72 0.51 0.45
32
Table 5: Predicting Opposition to a Close Family Member Marrying Someone who is Non-White
Model 1 Model 2 Model 3 Model 4 Racial Resentment 1.42*** 0.69 0.42 (0.21) (0.37) (0.38)
Angry About Racism (Reversed) 0.87* 0.78* 0.67 (0.34) (0.36) (0.37)
Deny White Advantages 0.04 -0.30 -0.32 (0.20) (0.30) (0.30)
Fear Of Other Races 2.19*** 2.10*** 2.17*** (0.26) (0.27) (0.29)
Denies Racism Problem 0.52* 0.34 0.29 (0.24) (0.27) (0.28)
Conservativism 0.21 (0.39)
Partisanship 0.27 (0.33)
Intercept 0.31** 0.20* 0.03 -0.03 (0.10) (0.09) (0.11) (0.11)
N 596 615 592 558 adj. R2 0.079 0.275 0.274 0.277
Weighted OLS estimates for White respondents only; data from 2016 CCES. Standard errors in parentheses * p < 0.05, ** p < 0.01, *** p < 0.001
33
References Apfelbaum, Evan P., Samuel R. Sommers, and Michael I. Norton. 2008. "Seeing Race and
Seeming Racist? Evaluating Strategic Colorblindness in Social Interaction." Journal of personality and social psychology 95: 918-32.
Banks, Antoine J, and Nicholas A Valentino. 2012. "Emotional Substrates of White Racial Attitudes." American Journal of Political Science 56: 286-97.
Bentler, Peter M, and Douglas G Bonett. 1980. "Significance Tests and Goodness of Fit in the Analysis of Covariance Structures." Psychological bulletin 88: 588.
Bentler, Peter M. 1990. "Comparative Fit Indexes in Structural Models." Psychological bulletin 107: 238.
Berinsky, Adam J. 2004. Silent Voices : Public Opinion and Political Participation in America. Princeton, N.J. ; Oxford: Princeton University Press.
Bollen, Kenneth A, and J Scott Long. 1993. Testing Structural Equation Models. Vol. 154: Sage.
Bonilla-Silva, Eduardo. 2014 [1997]. Racism without Racists: Color-Blind Racism and the Persistence of Racial Inequality in the United States. 4th ed. Lanham: Rowman and LIttlefield Publishers, Inc.
Bonilla-Silva, Eduardo, Amanda Lewis, and David G. Embrick. 2004. ""I Did Not Get That Job Because of a Black Man...": The Story Lines and Testimonies of Color-Blind Racism." Sociological Forum 19: 555-81.
Carr, Leslie G. 1997. " Colorblind" Racism. Thousand Oaks, CA: Sage Publications. DeSante, Christopher D. 2013. "Working Twice as Hard to Get Half as Far: Race, Work
Ethic, and America’s Deserving Poor." American Journal of Political Science. DeSante, Christopher D. and Candis W. Smith. forthcoming. "Less Is More: A Cross-
Generational Analysis of the Nature, and Role of Racial Attitudes in the 21st Century." The Journal of Politics.
DeSante, Christopher D. and Candis W. Smith. ND. Unpublished Book Manuscript. "Racial Stasis: Millennials and the Stagnation of Racial Attitudes."
Feldman, Stanley, and Leonie Huddy. 2005. "Racial Resentment and White Opposition to Race-Conscious Programs: Principles or Prejudice?". American Journal of Political Science 49: 168-83.
Forman, Tyrone. 2006. "Color-Blind Racism and Racial Indifference: The Role of Racial Apathy in Facilitating Enduring Inequalities." In The Changing Terrain of Race and Ethnicty, eds. Maria Krysan and Amanda E. Lewis. New York: Russell Sage Foundation.
Frankenberg, Ruth. 1993. White Women, Race Matters: The Social Construction of Whiteness. Minneapolis: University of Minnesota.
Jackson, John L. Jr. 2008. Racial Paranoia: The Unintended Consequences of Political Correctness. New York: Basic Civitas.
Kluegel, James R., and Lawrence Bobo. 1993. "Dimensions of Whites' Beliefs About the Black-White Socioeconomic Gap." In Prejudice, Politics, and the American Dilemma, eds. Paul M. Sniderman, Philip E. Tetlock and Edward G. Carmines. Stanford, CA: Stanford University Press.
34
Kluegel, James R., and Eliot R. Smith. 1986. Beliefs About Inequality: Americans' Views of What Is and What Ought to Be. New York: Aldine De Gruyter.
Neville, Helen A., Roderick L. Lilly, Georgia Durham, Richard M. Lee, and LaVonne Browne. 2000. "Construction and Initial Validation of the Color-Blind Racial Attitudes Scale (Cobras)." Journal of Counseling Psychology 47: 59-70.
Plutchik, R. 2001. The Nature of Emotions: Human emotions have deep evolutionary roots, a fact that may explain their complexity and provide tools for clinical practice. American Scientist, 89(4), 344-350.
Poteat, V Paul, and Lisa B Spanierman. 2008. "Further Validation of the Psychosocial Costs of Racism to Whites Scale among Employed Adults." The Counseling Psychologist 36: 871-94.
Sniderman, Paul M, and Thomas Leonard Piazza. 1993. The Scar of Race. Cambridge: Belknap Press of Harvard University Press.
Sniderman, Paul M., Gretchen C. Crosby, and William G. Howell. 2000. "The Politics of Race." In Racialized Politics: The Debate About Racism in America, eds. David O. Sears, Jim Sidanius and Lawrence Bobo. Chicago: University of Chicago Press.
Sniderman, Paul M., and Philip E. Tetlock. 1986. "Symbolic Racism: Problems of Motive Attribution in Political Analysis." Journal of Social Issues 42: 129-50.
Spanierman, Lisa B, and Mary J Heppner. 2004. "Psychosocial Costs of Racism to Whites Scale (Pcrw): Construction and Initial Validation." Journal of Counseling Psychology 51: 249-62.
Spanierman, Lisa B, V Paul Poteat, Amanda M Beer, and Patrick Ian Armstrong. 2006. "Psychosocial Costs of Racism to Whites: Exploring Patterns through Cluster Analysis." Journal of Counseling Psychology 53: 434-41.
Stoker, Laura. 1998. "Understanding Whites' Resistance to Affirmative Action: The Role of Principled Commitments and Racial Prejudice." In Perception and Prejudice: Race and Politics in the United States, eds. Jon Hurwitz and Mark Peffley. New Haven: Yale University Press.
Tesler, Michael. 2013. "The Return of Old-Fashioned Racism to White Americans’ Partisan Preferences in the Early Obama Era." Journal of Politics 75: 110-23.
———. 2012. "The Spillover of Racialization into Health Care: How President Obama Polarized Public Opinion by Racial Attitudes and Race." American Journal of Political Science 56: 690-704.
Tesler, Michael, and David O. Sears. 2010. Obama's Race: The 2008 Election and the Dream of a Post-Racial America. Chicago: Chicago University Press.
Wilson, David C., and Darien W. Davis. 2011. "Reexamining Racial Resentment: Conceptualization and Content." The ANNALS of the American Academy of Political and Social Sciences 634: 117-33.
Appendix A
Table A1: CFA for Racial Resentment
Explicit Racial Resentment Loading Racial Resentment Loading
I don't understand why race is any different from what other people have to deal with.
1.00*
Generations of slavery and discrimination have created conditions that make it difficult for Blacks to work their way out of the lower class. -1.02
I resent any special considerations that Africans Americans receive because it's unfair to other Americans.
1.17
The Irish, Italians, Jews and many other minorities overcame prejudice and worked their way up. Blacks should do the same without any special favors. 1.07
For African Americans to succeed they need to stop using racism and slavery as excuses. 1.16
It's really a matter of some people not trying hard enough; if blacks would only try harder they could be just as well off as whites. 1.15
Special considerations for African Americans place me at an unfair disadvantage because I have done nothing to harm them. 1.13
Over the past few years blacks have gotten less than they deserve. -0.85
African Americans bring up race only when they need to make an excuse for their failure. 1.21
Goodness of Fit Statistics
CFI 1.00 TLI 1.00 RMSEA 0.00 Chi-Squared 20.68 d.f. 21 P-value 0.48
N 743
* denotes loadings fixed to 1.00
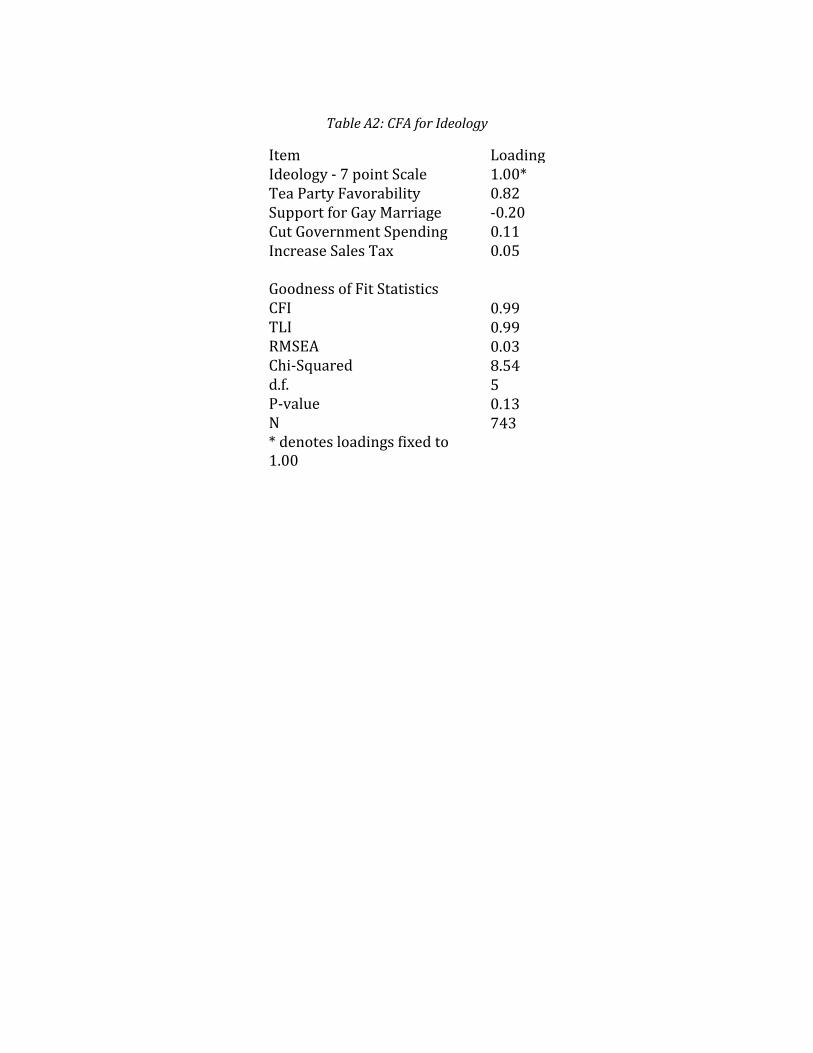
Table A2: CFA for Ideology
Item Loading Ideology - 7 point Scale 1.00* Tea Party Favorability 0.82 Support for Gay Marriage -0.20 Cut Government Spending 0.11 Increase Sales Tax 0.05 Goodness of Fit Statistics CFI 0.99 TLI 0.99 RMSEA 0.03 Chi-Squared 8.54 d.f. 5 P-value 0.13 N 743 * denotes loadings fixed to 1.00
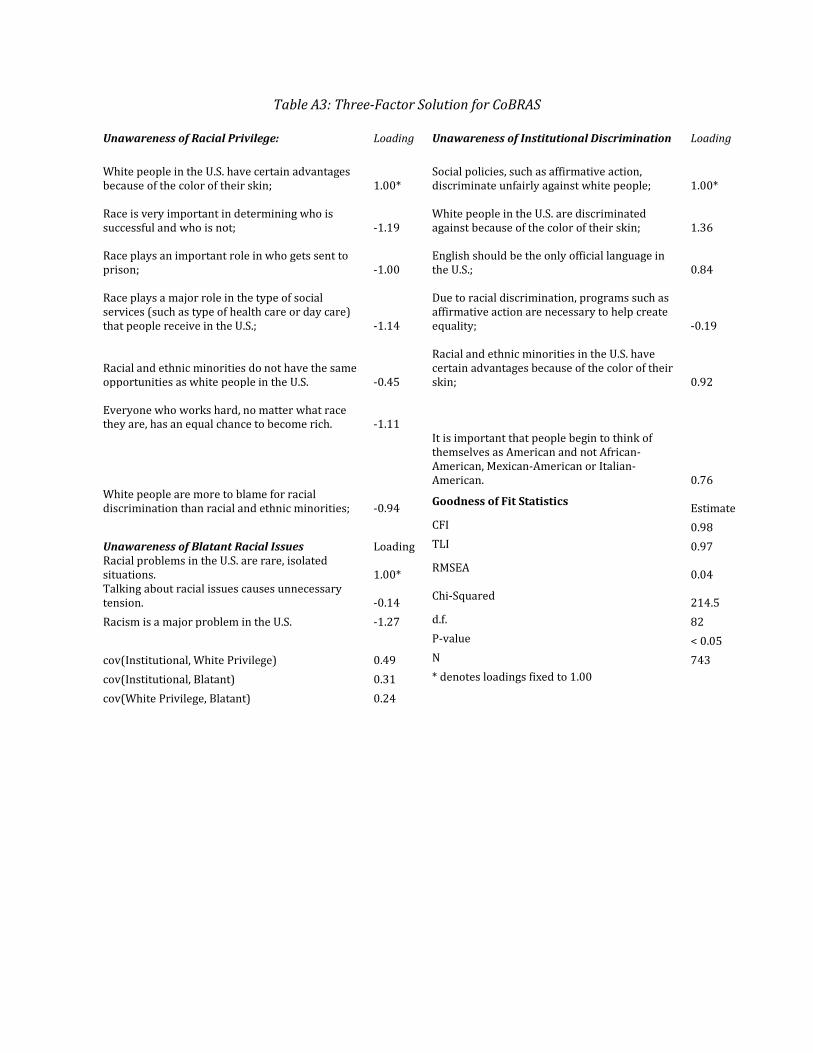
Table A3: Three-Factor Solution for CoBRAS
Unawareness of Racial Privilege: Loading Unawareness of Institutional Discrimination Loading White people in the U.S. have certain advantages because of the color of their skin; 1.00*
Social policies, such as affirmative action, discriminate unfairly against white people; 1.00*
Race is very important in determining who is successful and who is not; -1.19
White people in the U.S. are discriminated against because of the color of their skin; 1.36
Race plays an important role in who gets sent to prison; -1.00
English should be the only official language in the U.S.; 0.84
Race plays a major role in the type of social services (such as type of health care or day care) that people receive in the U.S.; -1.14
Due to racial discrimination, programs such as affirmative action are necessary to help create equality; -0.19
Racial and ethnic minorities do not have the same opportunities as white people in the U.S. -0.45
Racial and ethnic minorities in the U.S. have certain advantages because of the color of their skin; 0.92
Everyone who works hard, no matter what race they are, has an equal chance to become rich. -1.11
It is important that people begin to think of themselves as American and not African-American, Mexican-American or Italian-American. 0.76
White people are more to blame for racial discrimination than racial and ethnic minorities; -0.94 Goodness of Fit Statistics Estimate
CFI 0.98 Unawareness of Blatant Racial Issues Loading TLI 0.97 Racial problems in the U.S. are rare, isolated situations. 1.00* RMSEA 0.04 Talking about racial issues causes unnecessary tension. -0.14 Chi-Squared 214.5 Racism is a major problem in the U.S. -1.27 d.f. 82
P-value < 0.05 cov(Institutional, White Privilege) 0.49 N 743 cov(Institutional, Blatant) 0.31 * denotes loadings fixed to 1.00 cov(White Privilege, Blatant) 0.24
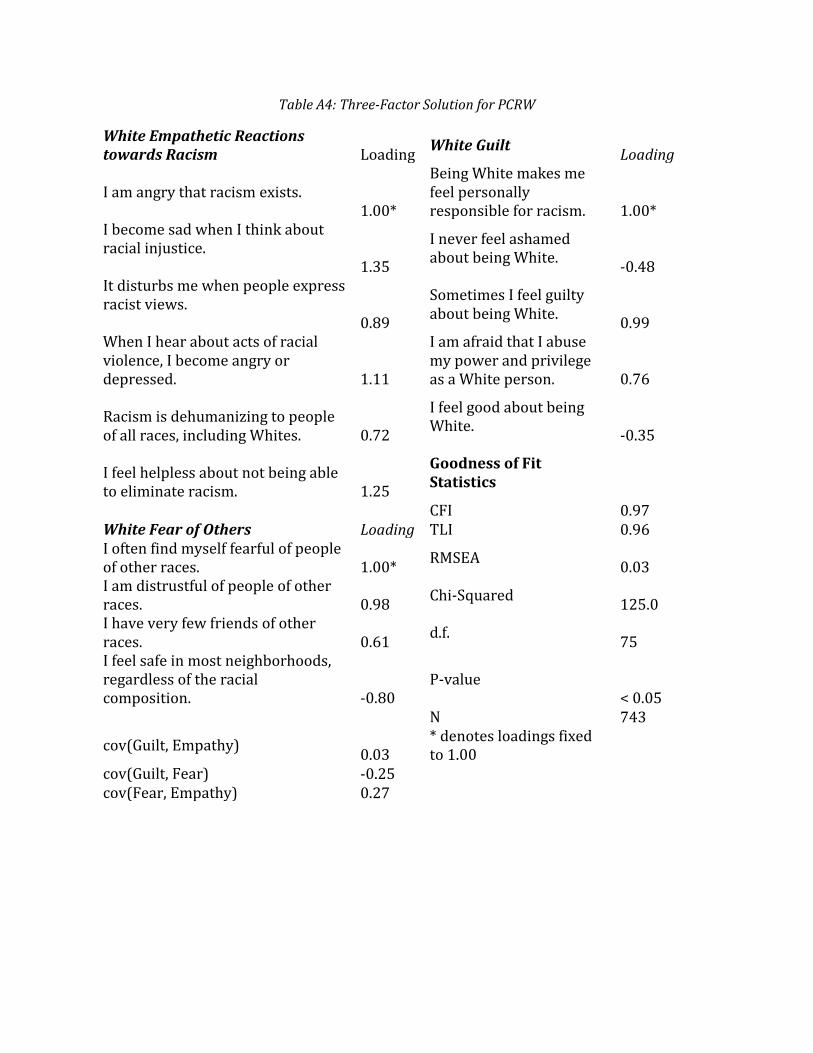
Table A4: Three-Factor Solution for PCRW
White Empathetic Reactions towards Racism Loading White Guilt Loading
I am angry that racism exists. 1.00*
Being White makes me feel personally responsible for racism. 1.00*
I become sad when I think about racial injustice. 1.35
I never feel ashamed about being White. -0.48
It disturbs me when people express racist views. 0.89
Sometimes I feel guilty about being White. 0.99
When I hear about acts of racial violence, I become angry or depressed. 1.11
I am afraid that I abuse my power and privilege as a White person. 0.76
Racism is dehumanizing to people of all races, including Whites. 0.72
I feel good about being White. -0.35
I feel helpless about not being able to eliminate racism. 1.25
Goodness of Fit Statistics
CFI 0.97 White Fear of Others Loading TLI 0.96 I often find myself fearful of people of other races. 1.00* RMSEA 0.03 I am distrustful of people of other races. 0.98 Chi-Squared 125.0 I have very few friends of other races. 0.61 d.f. 75 I feel safe in most neighborhoods, regardless of the racial composition. -0.80
P-value < 0.05
N 743
cov(Guilt, Empathy) 0.03 * denotes loadings fixed to 1.00
cov(Guilt, Fear) -0.25 cov(Fear, Empathy) 0.27
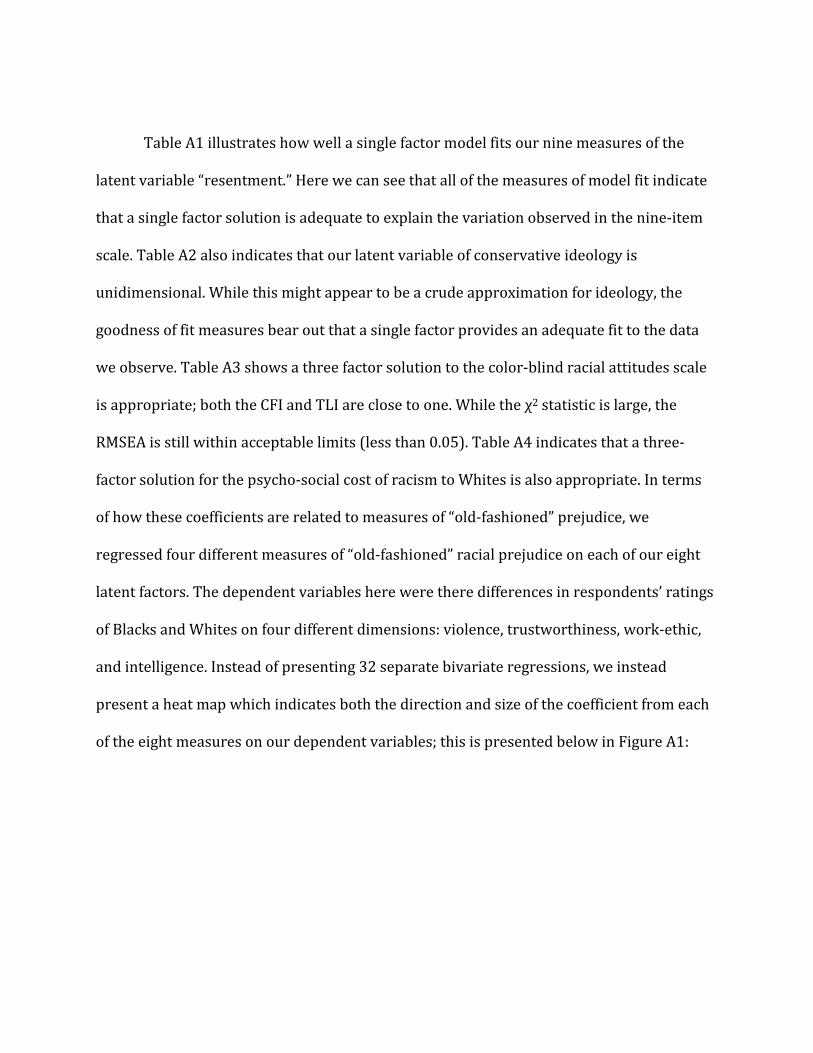
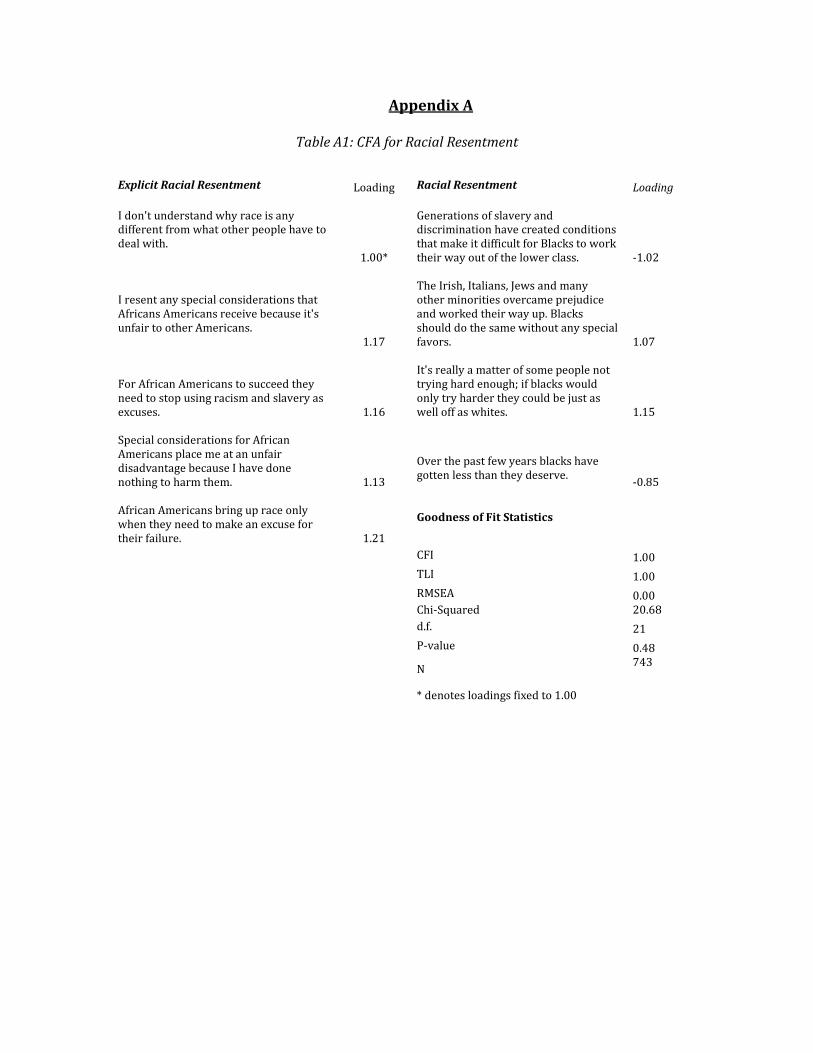
Table A1 illustrates how well a single factor model fits our nine measures of the
latent variable “resentment.” Here we can see that all of the measures of model fit indicate
that a single factor solution is adequate to explain the variation observed in the nine-item
scale. Table A2 also indicates that our latent variable of conservative ideology is
unidimensional. While this might appear to be a crude approximation for ideology, the
goodness of fit measures bear out that a single factor provides an adequate fit to the data
we observe. Table A3 shows a three factor solution to the color-blind racial attitudes scale
is appropriate; both the CFI and TLI are close to one. While the χ2 statistic is large, the
RMSEA is still within acceptable limits (less than 0.05). Table A4 indicates that a three-
factor solution for the psycho-social cost of racism to Whites is also appropriate. In terms
of how these coefficients are related to measures of “old-fashioned” prejudice, we
regressed four different measures of “old-fashioned” racial prejudice on each of our eight
latent factors. The dependent variables here were there differences in respondents’ ratings
of Blacks and Whites on four different dimensions: violence, trustworthiness, work-ethic,
and intelligence. Instead of presenting 32 separate bivariate regressions, we instead
present a heat map which indicates both the direction and size of the coefficient from each
of the eight measures on our dependent variables; this is presented below in Figure A1:
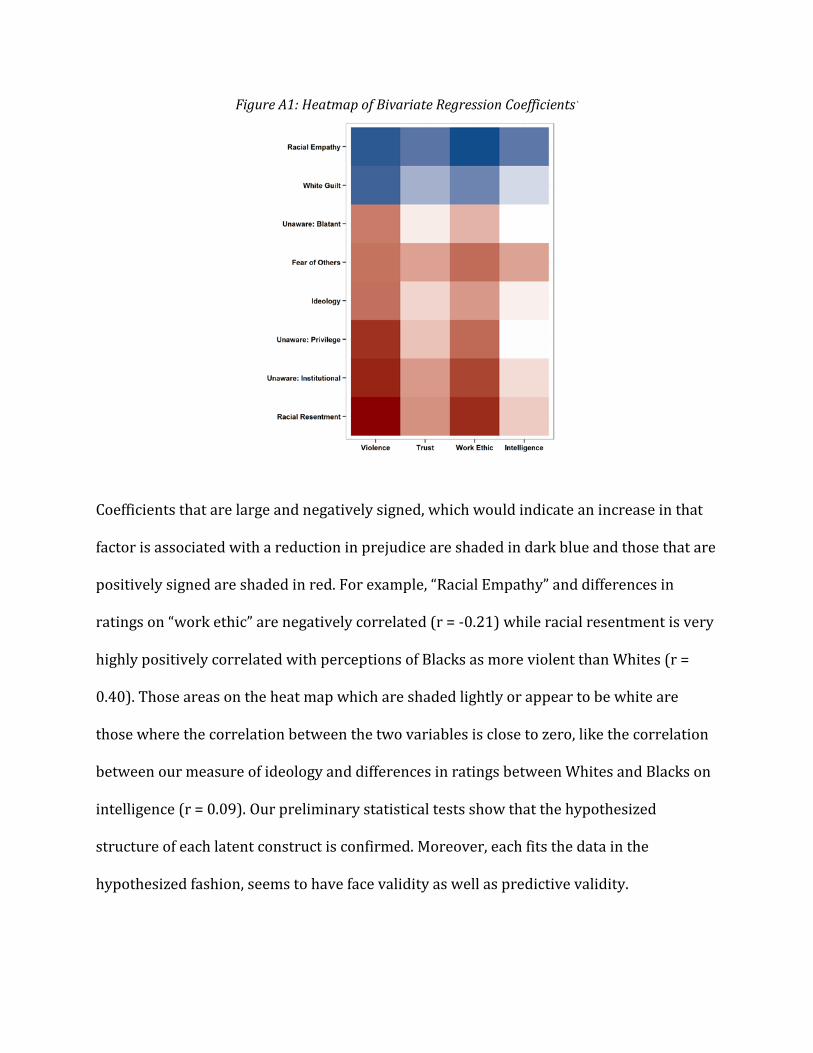
Figure A1: Heatmap of Bivariate Regression Coefficients`
Coefficients that are large and negatively signed, which would indicate an increase in that
factor is associated with a reduction in prejudice are shaded in dark blue and those that are
positively signed are shaded in red. For example, “Racial Empathy” and differences in
ratings on “work ethic” are negatively correlated (r = -0.21) while racial resentment is very
highly positively correlated with perceptions of Blacks as more violent than Whites (r =
0.40). Those areas on the heat map which are shaded lightly or appear to be white are
those where the correlation between the two variables is close to zero, like the correlation
between our measure of ideology and differences in ratings between Whites and Blacks on
intelligence (r = 0.09). Our preliminary statistical tests show that the hypothesized
structure of each latent construct is confirmed. Moreover, each fits the data in the
hypothesized fashion, seems to have face validity as well as predictive validity.
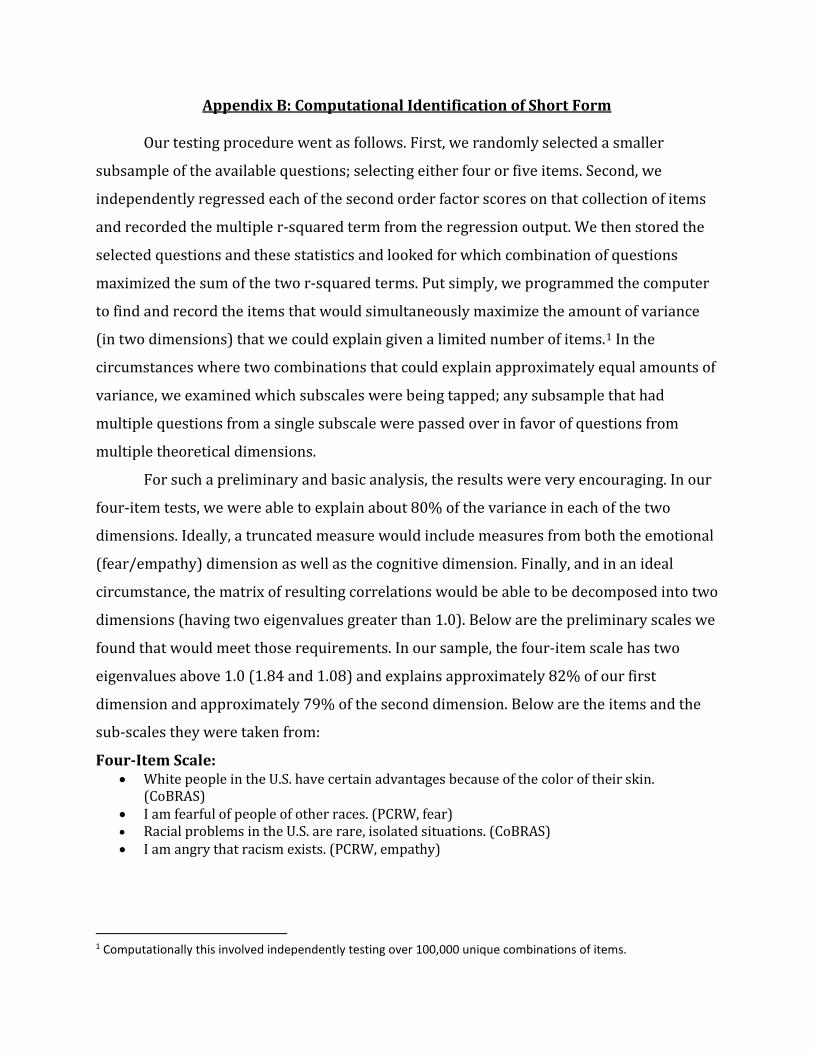
Appendix B: Computational Identification of Short Form
Our testing procedure went as follows. First, we randomly selected a smaller
subsample of the available questions; selecting either four or five items. Second, we
independently regressed each of the second order factor scores on that collection of items
and recorded the multiple r-squared term from the regression output. We then stored the
selected questions and these statistics and looked for which combination of questions
maximized the sum of the two r-squared terms. Put simply, we programmed the computer
to find and record the items that would simultaneously maximize the amount of variance
(in two dimensions) that we could explain given a limited number of items.1 In the
circumstances where two combinations that could explain approximately equal amounts of
variance, we examined which subscales were being tapped; any subsample that had
multiple questions from a single subscale were passed over in favor of questions from
multiple theoretical dimensions.
For such a preliminary and basic analysis, the results were very encouraging. In our
four-item tests, we were able to explain about 80% of the variance in each of the two
dimensions. Ideally, a truncated measure would include measures from both the emotional
(fear/empathy) dimension as well as the cognitive dimension. Finally, and in an ideal
circumstance, the matrix of resulting correlations would be able to be decomposed into two
dimensions (having two eigenvalues greater than 1.0). Below are the preliminary scales we
found that would meet those requirements. In our sample, the four-item scale has two
eigenvalues above 1.0 (1.84 and 1.08) and explains approximately 82% of our first
dimension and approximately 79% of the second dimension. Below are the items and the
sub-scales they were taken from:
Four-Item Scale: • White people in the U.S. have certain advantages because of the color of their skin.
(CoBRAS) • I am fearful of people of other races. (PCRW, fear) • Racial problems in the U.S. are rare, isolated situations. (CoBRAS) • I am angry that racism exists. (PCRW, empathy)
1 Computationally this involved independently testing over 100,000 unique combinations of items.
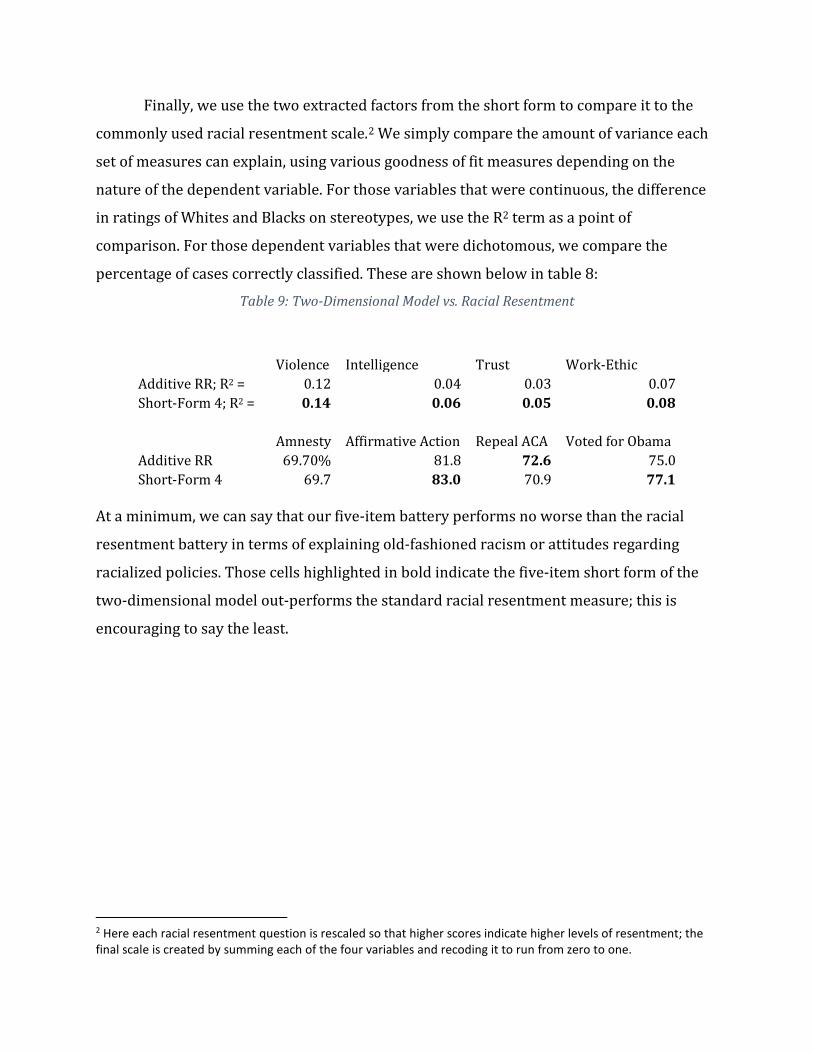
Finally, we use the two extracted factors from the short form to compare it to the
commonly used racial resentment scale.2 We simply compare the amount of variance each
set of measures can explain, using various goodness of fit measures depending on the
nature of the dependent variable. For those variables that were continuous, the difference
in ratings of Whites and Blacks on stereotypes, we use the R2 term as a point of
comparison. For those dependent variables that were dichotomous, we compare the
percentage of cases correctly classified. These are shown below in table 8:
Table 9: Two-Dimensional Model vs. Racial Resentment
Violence Intelligence Trust Work-Ethic Additive RR; R2 = 0.12 0.04 0.03 0.07 Short-Form 4; R2 = 0.14 0.06 0.05 0.08
Amnesty Affirmative Action Repeal ACA Voted for Obama
Additive RR 69.70% 81.8 72.6 75.0 Short-Form 4 69.7 83.0 70.9 77.1
At a minimum, we can say that our five-item battery performs no worse than the racial
resentment battery in terms of explaining old-fashioned racism or attitudes regarding
racialized policies. Those cells highlighted in bold indicate the five-item short form of the
two-dimensional model out-performs the standard racial resentment measure; this is
encouraging to say the least.
2 Here each racial resentment question is rescaled so that higher scores indicate higher levels of resentment; the final scale is created by summing each of the four variables and recoding it to run from zero to one.