Embed Size (px)
Citation preview

FE Post Processing
• Plotting• Campbell Diagram• Goodman Diagram• Fracture• Yield• Principal Stress
POST PROCESSING PLOTS

Deformed Shape Plot
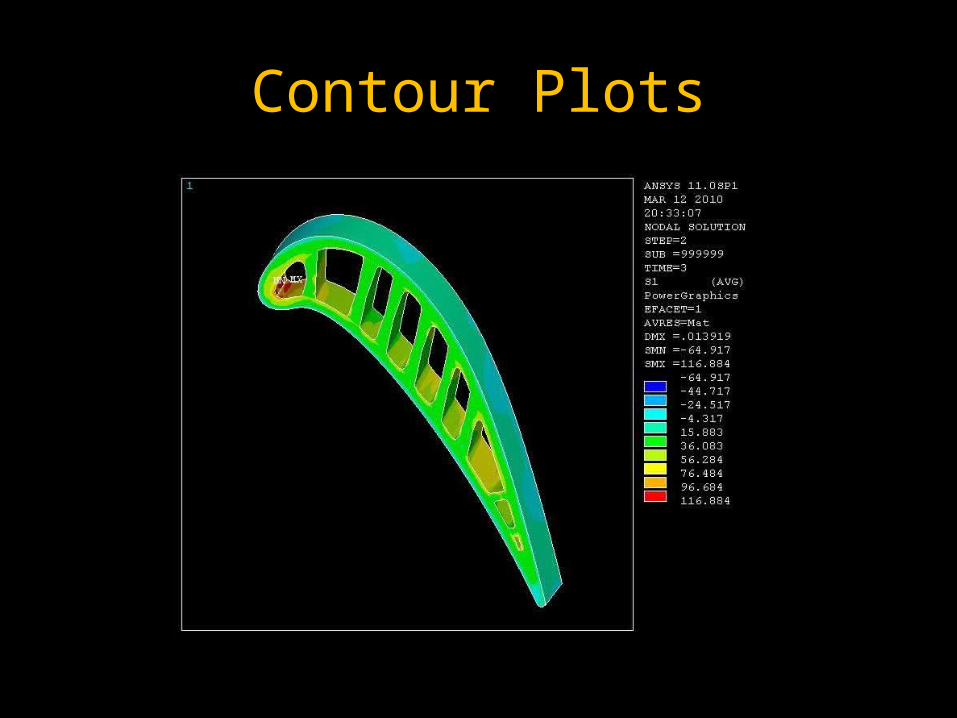
Contour Plots

History Plot

Invert Colors for Hard CopiesInvert Colors for Hard Copies

CAMPBELL DIAGRAMS

Campbell Diagram
0
500
1000
1500
2000
2500
3000
3500
0 2000 4000 6000 8000 10000 12000 14000
Fre
qu
en
cy -
Hz
Rotation Rate - RPM
Mode 1
Mode 2
Mode 3
EO: 1
EO: 3
EO: 6
EO: 10
EO: 11
EO: 12
EO: 15
Idle
Red Line

Probabilistic Campbell Diagram
0
500
1000
1500
2000
2500
3000
3500
0 2000 4000 6000 8000 10000 12000 14000
Fre
qu
en
cy -
Hz
Rotation Rate - RPM
Mode 1
Mode 2
Mode 3
EO: 1
EO: 3
EO: 6
EO: 10
EO: 11
EO: 12
EO: 15
Idle
Red Line

GOODMAN DIAGRAMS
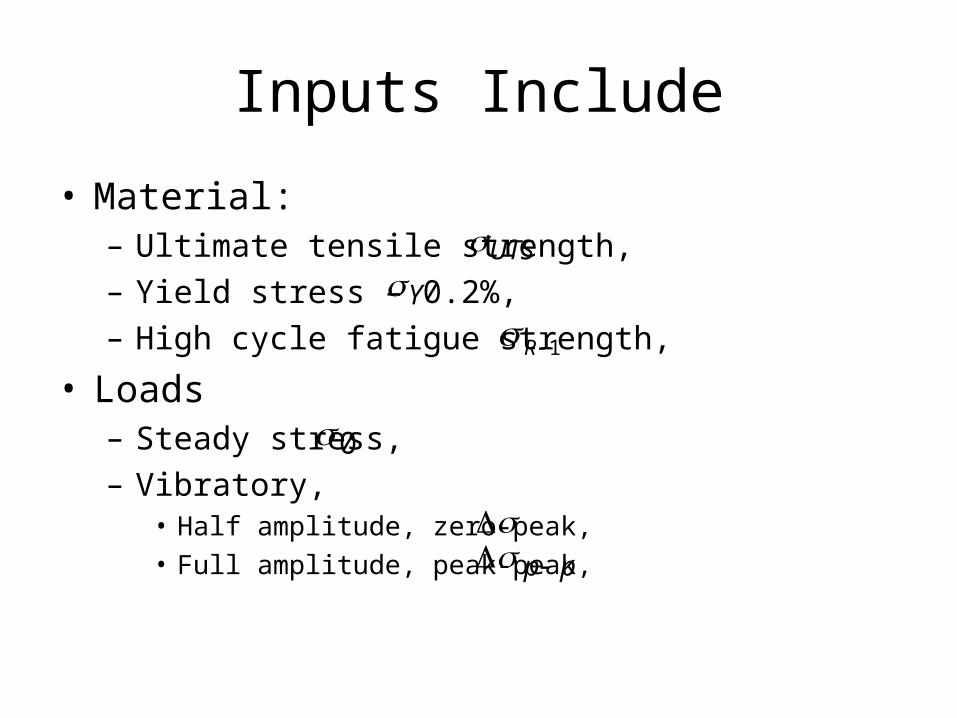
Inputs Include
• Material:– Ultimate tensile strength, – Yield stress – 0.2%,– High cycle fatigue strength,
• Loads– Steady stress,– Vibratory,
• Half amplitude, zero-peak, • Full amplitude, peak-peak,
UTS
Y
1R
0
pp

Load Inputs
max
min
R
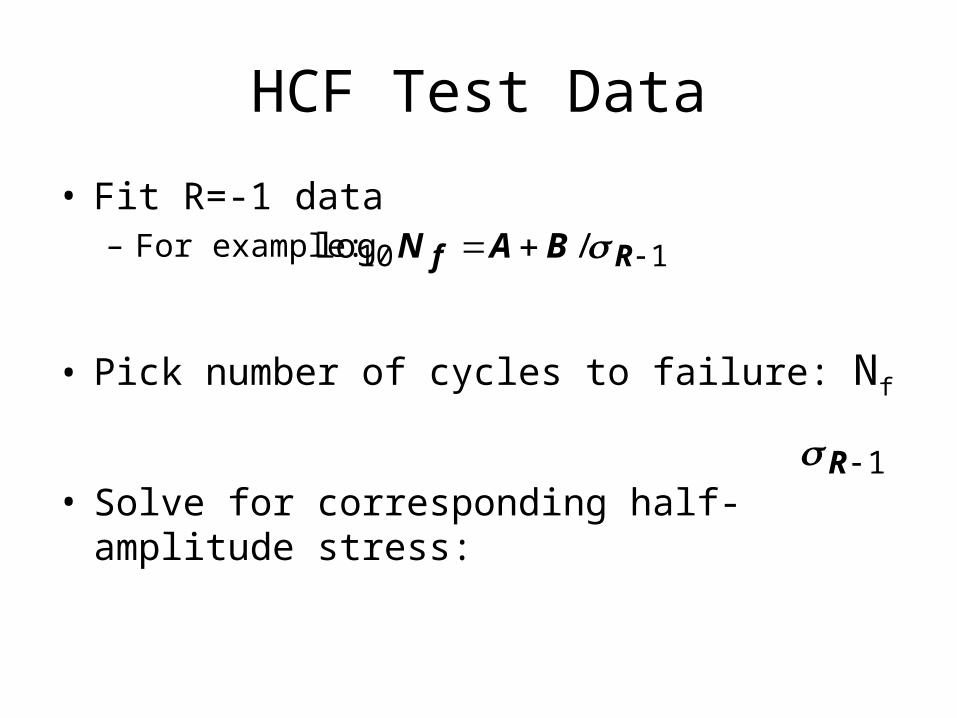
HCF Test Data
• Fit R=-1 data– For example:
• Pick number of cycles to failure: Nf
• Solve for corresponding half-amplitude stress:
110 /log Rf BAN
1R

Goodman DiagramMaterial Inputs
110 /log Rf BAN
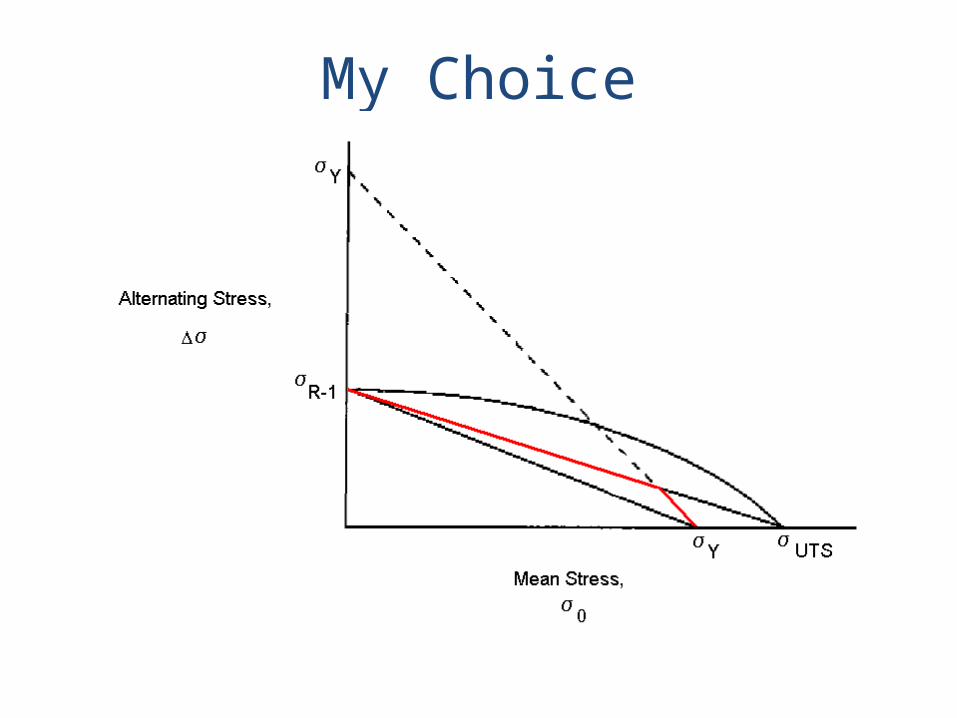
My Choice
FRACTURE MECHANICS

Fracture Modes

Stress Intensity FactorMode I
Stresses near crack tip are singular and vary as the inverse square root of distance from crack tipKI is the stress intensity factor
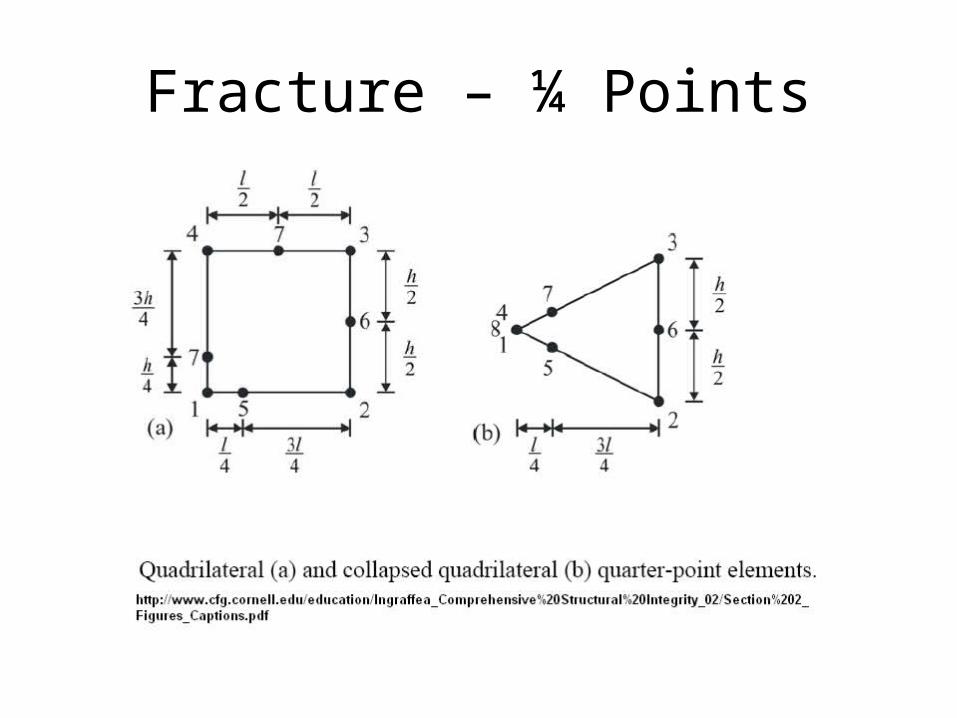
Fracture – ¼ Points
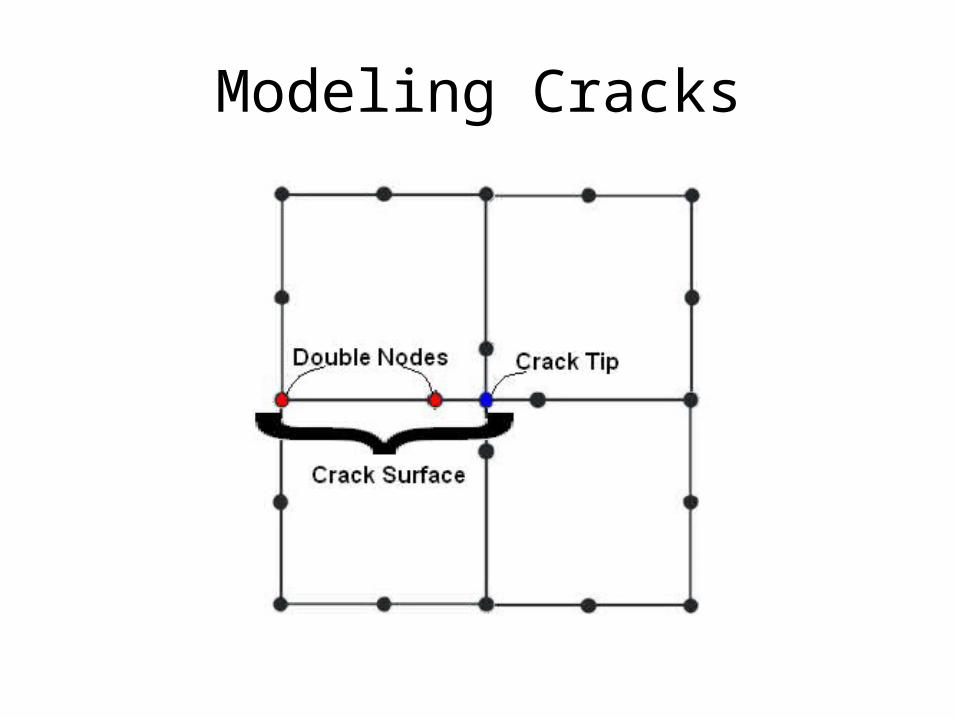
Modeling Cracks

VON MISES STRESS&
PLASTIC YIELDING

Von Mises Stress
zzyzxz
yzyyxy
xzxyxx
is the stress tensor
3zzyyxxp
is the equivalent hydrostatic pressure
p
p
p
sss
sss
sss
s
zzyzxz
yzyyxy
xzxyxx
zzyzxz
yzyyxy
xzxyxx
is the deviatoric stress

Invariants of Stress
• Invariants do not change values when coordinate system is rotated.
• The first invariant of the stress is
• The second invariant of the deviatoric stress is
• The third invariant of the deviatoric stress is the determinant.
.31 pI zzyyxx
.2
1 2222222222 zzyzxzyzyyxyxzxyxx sssssssssJ
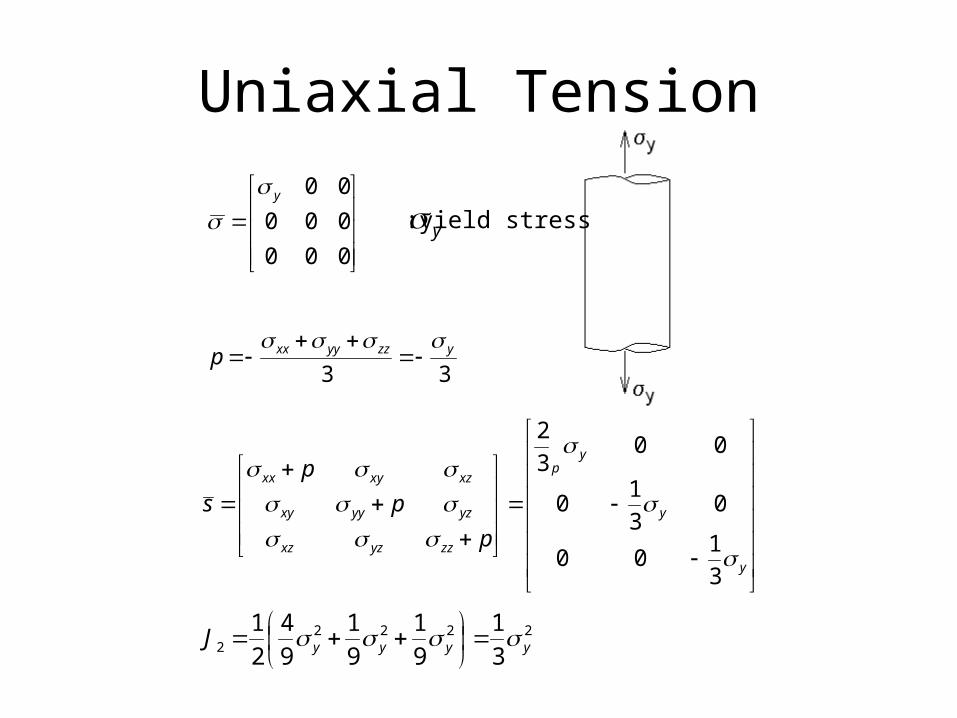
Uniaxial Tension
000
000
00y
33yzzyyxxp
y
y
yp
zzyzxz
yzyyxy
xzxyxx
p
p
p
s
3
100
03
10
003
2
22222 3
1
9
1
9
1
9
4
2
1yyyyJ
:yield stressy

Equivalent Mises Stress
• Yielding occurs when
• Or when equivalent stress
• When yielding occurs
• Stress ratio is
03
1 22 yJ
23JvM
yvM
yvM /

PRINCIPAL STRESSES

Principal Stresses
• Eigenvalues of stress tensor (matrix) are principal stresses– All values are real– Order is 1:maximum, 2: intermediate, 3:minimum
• Associated eigenvectors are normal to face• Use maximum principal stress for fracture
1
2
3
x
y
z

STRESS CONTOURS

Ansys Stress Contour Plots

FE Post Processing• Plotting
– Includes displaced, contour, and scatter plots• Campbell Diagram
– Finds important resonances• Goodman Diagram
– Predicts high cycle fatigue life• Fracture
– Indicates failure due to crack propagation• Yield
– Establishes yield through the use of equivalent (Mises) stress• Principal Stress
– Aids in determining failure due to presence of flaws