Embed Size (px)
Citation preview
FDI LOCATION DETERMINANTS in Central and Eastern European Countries
DIANA VIORELA MATEI
SUPERVISOR: PROF. DR. ANA TERESA TAVARES LEHMANN October, 2007
Master Thesis in Economics

To my “mountains”
Biographical note
Diana Matei was born in Bucharest, Romania in 1980.
In 2003, she graduated the Academy of Economic Studies in Bucharest with a Major in
Management. In the last semester of the undergraduate course, she joined the co-
operation and mobility programme Erasmus Mundus obtaining a scholarship at the
Faculty of Economics of Porto (FEP), University of Porto, Portugal.
After graduating, she enrolled in the Masters of Economics, Specialisation in
International Economics, at FEP. During this period, she joined Aerosoles – Investvar
Group, the largest Portuguese footwear group, presently being in charge with the
international operations of the firm on the Indian and, to a less extent, Romanian
markets.

II
Acknowledgments
This study gained shape, was a great experience and was completed due to, luckily, a
great number of persons that stood by me with kindness and generous support. This in
itself it is a tremendous thing and one of the richest gains I could ever had.
I owe considerably to my supervisor Prof. Ana Teresa Tavares Lehmann to whom I
express my deepest gratitude. Besides the fact that I have learnt enormously under her
supervision I want to thank for her incredible kindness, patience, confidence, good
humour with me throughout the last years. Thank you!
Special thanks to Prof. Francisco Castro that encouraged every step of this experience
which would have not have started without his guidance. His great humour, capacity to
motivate and help were invaluable.
I want to thank the Department of Economics of University of Porto and all my
Professors for their contribution and interest.
Many thanks to my colleagues from Aerosoles for all the friendship and care that they
showed me. Especially I would like to thank Luís, Angela, Pedro, Marco, Mario, Salete,
Mónica, Sonia, Jose Alberto and Gabriela.
I am grateful to my family for the constant support and sacrifice, especially to my
parents, that “sunt cei mai buni parinti pe care mi i-as fi dorit vreodata”. This period was
also enriched by the “big universe” of the residence, Roxana, Ana, Shinji, Sunita, Dona
Angela, Chirapa, Predee, Katia, Smaranda, Andrei, Laurentiu, Mariana, Ela, An, Jose
Luis, that proved to me that friendship has no borders. I extend my heartfelt thanks to
Ceza and Andrei Mardare for a great support in difficult moments, great humour and
friendship. A great gain of my staying in Porto was the exceptional bond of friendship
with a very great person, Alina Petrescu.
In the end but not at last I want to thank to a special person, Paulo, that helped me
immensely accomplishing this project, believed and supported me every moment with
patience, care and great humour.
Please all accept my appreciation and gratitude for being next to me in this journey and
for showing me the “sunny sidewalk” of it.
It was a learning process and probably I would do many things in a different way.
Unnecessary to say, all inconsistencies and errors are my own.
III
Abstract
Foreign Direct Investment (FDI) has become increasingly important in financing
growth and investment in host countries. FDI is deemed desirable for several reasons,
among which the fact that it is usually a vehicle for economic development (e.g. via
positive impacts on the balance of payments, promoting exports, creating employment
and transferring a vast array of resources – financial, technological, organisational
competence), a partial substitute for foreign aid and a promoter of economic stability.
Giving its raising importance and implications, countries entered a competition to
attract it. Central and Eastern European Countries (CEECs), which, until the early 1990s
were closed to FDI, are now among the most proactive emerging economies as regards
FDI attraction policies, and are establishing themselves as relevant players in the
European Union’s ‘race’ for FDI.
This dissertation focuses on Central and Eastern European former state-planned
economies and investigates why multinationals (MNEs) chose to locate their
investments in these countries.
The most important FDI location determinants are identified based on an integration of
leading theoretical frameworks from the International Business and Economics
literature, aiming to explain location/relocation of investments (Product Life Cycle and
Internationalisation Theories), FDI location due to market failure (Internalisation
Theory), relative location advantages (OLI framework and Agglomeration), as well as
on state-of-the-art empirical literature on FDI determinants (particularly on CEECs).
The relevance of these determinants, about which several hypotheses are formulated, is
tested empirically through a panel data econometric estimation method on a sample of
10 CEECs over the twelve year period between 1993 and 2004.
The main findings are that market potential, privatisation and agglomeration factors
have significant effects upon FDI location choice, helping to explain the attractiveness
for FDI of these host countries. In contrast with a considerable part of extant empirical
literature, labour costs, trade openness and industrial concentration appear not to be the
most relevant factors explaining FDI location choice within Central and Eastern Europe.
This suggests that investors into CEECs in this period were mainly motivated by
market-related factors, by the one-off opportunities offered through privatisation and by
agglomeration due to economies of urbanisation. Even if often investors prefer low cost

IV
locations, this does not influence their location choice within CEE. These findings may
also indicate that the relevance of FDI determinants changes over time (costs per se
being more important in the past than in the most recent years as regards location in
CEECs), and that, in a location choice, different determinants apply to distinct
investors.
Keywords: Foreign Direct Investment, Multinational Enterprises, CEECs, location
determinants, panel data models
V
Resumo
O Investimento Directo Estrangeiro (IDE) tem-se tornado cada vez mais importante no
financiamento do desenvolvimento e investimento nos países receptores. O IDE é
considerado positivo por varias razões, entre as quais o facto de ser um veículo para o
desenvolvimento económico (e.g. através de impactos favoráveis na balança de
pagamentos, promoção de exportações, criação de postos de trabalho e transferência de
um vasto leque de recursos – financeiros, tecnológicos, competências organizacionais),
um substituto parcial para a ajuda externa e um promotor de estabilidade económica.
Dada a sua crescente importância e implicações, a competição com vista a atraí-lo é
cada vez mais tenaz. Os Países da Europa Central e do Leste (PECOs) que, até ao início
da década de 1990, se encontravam fechados ao IDE, encontram-se actualmente entre as
mais proactivas economias no que diz respeito a políticas que visem atrair o IDE, e
estão a estabelecer-se como participantes de peso na “corrida” protagonizada por países
da UE ao IDE.
Esta dissertação debruça-se sobre economias previamente controladas pelo estado na
Europa Central e do Leste e investiga as razões que levam empresas multinacionais a
escolher estes países como recipientes de investimento.
Os determinantes mais importantes da localização do IDE são identificados com base na
integração das mais relevantes teorias e literatura pertinente de Economia e Negócio
Internacional, com o objectivo de explicar a localização/relocalização de investimentos
(Teoria da Ciclo da Vida do Produto e Teoria da Internacionalização), a localização do
IDE quando existem falhas colapso de mercados (Teoria da Internalização), vantagens
relativas da localização (Paradigma Ecléctico e Teoria da Aglomeração), assim como
em recente literatura empírica respeitante aos determinantes do IDE (particularmente
nos PECOs).
A relevância destes determinantes, a respeito dos quais diversas hipóteses são
formuladas, é testada de forma empírica através de um método econométrico de
estimação (dados em painel) com base num universo de 10 PECOs ao longo do período
de doze anos entre 1993 e 2004.
As principais conclusões são que factores relacionados com o potencial do mercado, a
privatização e a aglomeração têm efeitos significativos na escolha da localização do
VI
IDE, ajudando a explicar o grau de atractividade para o IDE que estes países de têm. Em
contraste com uma parte considerável da literatura empírica existente, o custo da mão de
obra, o grau de abertura do mercado e o nível de concentração industrial não parecem
ser os factores relevantes na determinação da localização do IDE na Europa Central e do
Leste. O modelo empírico contido nesta dissertação sugere que investidores nos PECOs
têm sido motivados primordialmente por factores relacionados com o mercado, por
oportunidades únicas oferecidas pela privatização e pela aglomeração resultante de
economias de urbanização. Ainda que os investidores prefiram localizações com baixos
custos, este factor não parece influenciar a sua escolha dentro da Europa Central e do
Leste. Estas conclusões podem também indicar que a relevância dos determinantes do
IDE muda com o tempo (os custos em si tendo sido mais importantes no passado do que
em anos recentes no que diz respeito à localização nos PECOs), e que, na escolha de
uma localização, determinantes diferentes aplicam-se a investidores distintos.
Palavras chave: Investimento Directo Externo, Empresas Multinacionais,
determinantes de localização, PECOs, dados em painel
VII
TABLE OF CONTENTS ACKNOWLEDGMENTS ............................................................................................................II
ABSTRACT................................................................................................................................ III
RESUMO..................................................................................................................................... V
LIST OF TABLES....................................................................................................................VIII
LIST OF FIGURES .................................................................................................................... IX
LIST OF ACRONYMS ............................................................................................................... X
INTRODUCTION AND PLAN OF THE DISSERTATION ....................................................... 1
1 THEORETICAL FOUNDATIONS ..................................................................................... 4 1.1 OVERVIEW................................................................................................................................. 4 1.2 PRODUCT LIFE CYCLE ............................................................................................................... 4 1.3 INTERNATIONALISATION PROCESS MODELS .............................................................................. 7 1.4 INTERNALISATION THEORY........................................................................................................ 9 1.5 THE ECLECTIC PARADIGM ........................................................................................................ 12 1.6 AGGLOMERATION.................................................................................................................... 15 1.7 MOTIVATIONS FOR FOREIGN PRODUCTION............................................................................... 20 1.8 CONCLUDING REMARKS .......................................................................................................... 21
2 EMPIRICAL LITERATURE ON THE FDI DETERMINANTS AND RESEARCH HYPOTHESES ........................................................................................................................... 22
2.1 MARKET FACTORS ................................................................................................................... 23 2.2 LABOUR COSTS ........................................................................................................................ 28 2.3 TRADE OPENNESS .................................................................................................................... 36 2.4 PRIVATISATION ....................................................................................................................... 41 2.5 AGGLOMERATION INDICATORS................................................................................................ 45
3 EMPIRICAL INVESTIGATION....................................................................................... 52 3.1 OVERVIEW............................................................................................................................... 52 3.2 DATA AND EMPIRICAL CONTEXT.............................................................................................. 52
3.2.1 Proxies for the relevant variables ...................................................................................... 53 3.2.2 Descriptive data analysis ................................................................................................... 64
3.3 MODEL SPECIFICATION ............................................................................................................ 66 3.4 ESTIMATION RESULTS.............................................................................................................. 69 3.5 DISCUSSION OF RESULTS ......................................................................................................... 72
4 CONCLUSIONS................................................................................................................ 81 4.1 MAIN CONTRIBUTIONS............................................................................................................. 83 4.2 LIMITATIONS OF THE STUDY .................................................................................................... 84 4.3 FUTURE RESEARCH .................................................................................................................. 85
REFERENCES............................................................................................................................ 87
VIII
LIST OF TABLES TABLE 2.1: HOST COUNTRY FDI DETERMINANTS ....................................................................................... 23 TABLE 2.2: SUMMARY OF EMPIRICAL STUDIES ON FDI INCLUDING MARKET SIZE AS A DETERMINANT ....... 26 TABLE 2.3: SUMMARY OF EMPIRICAL STUDIES ON FDI DETERMINANTS INCLUDING LABOUR COSTS AS A
DETERMINANT ......................................................................................................................... 33 TABLE 2.4: SUMMARY OF EMPIRICAL STUDIES ON FDI INCLUDING OPENNESS TO TRADE AS A DETERMINANT
................................................................................................................................................ 39 TABLE 2.5: SUMMARY OF EMPIRICAL PAPER ON FDI DETERMINANTS INCLUDING PRIVATISATION ............. 44 TABLE 2.6: SUMMARY OF EMPIRICAL STUDIES ON FDI INCLUDING AGGLOMERATION ECONOMIES AND
INFRASTRUCTURE INDICATORS ................................................................................................ 50 TABLE 3.1 VARIABLES AND THEIR EXPECTED SIGNS................................................................................... 64 TABLE 3.2: DESCRIPTIVE STATISTICS ......................................................................................................... 65 TABLE 3.3: CORRELATION MATRIX............................................................................................................. 66 TABLE 3.4: RANDOM EFFECTS ESTIMATION RESULTS ................................................................................. 70 TABLE 3.5: VARIANCE INFLATION FACTORS TEST....................................................................................... 71 TABLE 3.6: HYPHOTESIS: EXPECTED AND OBTAINED SIGNS ........................................................................ 73
IX
LIST OF FIGURES FIGURE 1.1: PRODUCT LIFE CYCLE............................................................................................................... 4 FIGURE 1.2: THE ESTABLISHMENT CHAIN – INTERNATIONALISATION THEORY............................................. 8 FIGURE 1.3: THE OLI TRIUMVIRATE ........................................................................................................... 13 FIGURE 3.1: FDI STOCKS IN SELECTED COUNTRIES, 1993-2004.................................................................. 54 FIGURE 3.2: GDP IN SELECTED COUNTRIES, 1993-2004 ............................................................................. 55 FIGURE 3.3: UNIT LABOUR COST IN SELECTED COUNTRIES, 1993-2004 ...................................................... 58 FIGURE 3.4: ANNUAL COMPENSATION PER EMPLOYEE IN SELECTED COUNTRIES, 1993-2004 ..................... 58 FIGURE 3.5: PRIVATISATION REVENUES IN SELECTED COUNTRIES, 1993-2004 ........................................... 60 FIGURE 3.6: TRADE OPENNESS IN SELECTED COUNTRIES, 1993-2004 ......................................................... 61 FIGURE 3.7: INTERNET PENETRATION IN SELECTED COUNTRIES, 1993-2004............................................... 62 FIGURE 3.8: INDUSTRIAL CONCENTRATION IN SELECTED COUNTRIES, 1993-2004 ...................................... 62

X
LIST OF ACRONYMS
2SLS Two Stage Least Squares
3SLS Three Stage Least Squares
AMECO Annual Macro Economic database
CEE Central and Eastern Europe
CEECs Central and Eastern European Countries
CIS Commonwealth of Independent States
EBRD European Bank for Reconstruction and Development
EEC European Economic Community
EIRO European Industrial Relations Observatory
EU European Union
ESA European System of Accounts
FDI Foreign Direct Investment
GDP Gross Domestic Product
GLS Generalised Least Squares
GMM Generalised Method of Moments
GNP Gross National Product
IB International Business
ICT Information and Communication Technologies
ILO International Labour Organisation
IMF International Monetary Fund
M&A Mergers and Acquisitions
MNE Multinational Enterprise
OECD Organisation for Economic Cooperation and Development
OLI Ownership, Location and Internalisation
OLS Ordinary Least Squares
OPT Outward Processing Trade
PLC Product Life Cycle
POLS Pooled Ordinary Least Squares
R&D Research and Development
RTD Research and Technical Development

XI
SEE Southern and Eastern Europe
SIC Standard Industrial Classification
UNCTAD United Nations Conference on Trade and Development
US United States of America
USSR Union of Soviet Socialist Republics
VIF Variance Inflation Factors
1
Introduction and Plan of the Dissertation
The importance of foreign direct investment (FDI) to development is generally
acknowledged (Mudambi, 2001; OECD, 2001). Compared to other forms of capital
flows, FDI is preferred because more than being a vehicle for the transfer of capital, it
usually facilitates the transfer of technology, promotes corporate governance practices,
fosters human capital development and it is more stable than other capital flows
(OECD, 2001). Its relative stability, notably in periods of crises affecting emerging
economies1, resulted in it being called the “good cholesterol” (Hausmann and
Fernández–Arias, 2000). Within this framework, the location of FDI and the factors
driving FDI location decisions become important issues. Another worth mentioning
phenomenon refers to the recent and significant increase in FDI flows towards
developing countries.
The beginning of the 1990s brought a number of important events impacting on the
World market, such as the fall of the Iron Curtain, the economic opening of China and
major changes in the economic and political regimes in several Latin American
countries. The reintegration of these emerging economies in the world economy, along
with the noteworthy progress in communication technology and transports, the
reduction of trade barriers and restrictions on international capital flows, and the ever
more intense globalisation of production magnified significantly the importance of FDI,
and influenced its ever more diversified spatial allocation. The world FDI stock was
almost 12 trillion US dollars in 2006 compared to only 1.5 trillion US dollars in 1989.
Within this period, the share of developing countries and transition countries in global
FDI stocks increased (from 20.5% in 1990 to 30% in 2006) (UNCTAD, 2007).
However, FDI allocation between these countries is notoriously asymmetric and the
determinants that motivate investors to target a certain location need to be better
identified and understood.
1 The term “emerging economies” was first used by Antoine van Atgmael (1981) who coined the expression in order to replace the negative connotation “third world” ; it means an economy with low-to-middle per capita income that is fast growing
2
This dissertation aims to shed light on the relevance of these determinants, particularly
focusing on the case of CEECs during their transition towards a market economy (i.e.
since 1989 until recent years). In doing so, the dissertation contributes to understanding
FDI in CEE and to link it to relevant theories; and to examine the main FDI motivations
influencing investors’ location choice.
Within this context, and more specifically, the analysis seeks to address the following
research question: “Why do MNEs locate their investments in Central and Eastern
Europe?”
Various determinants, which were selected based on a thorough review of the available
literature, are tested in order to answer the research question. These include traditional
indicators such as market potential; labour costs; transition-specific indicators e.g.
privatisation; trade openness and agglomeration. The analysis focuses on ten CEECs
over the period 1993-2004, which is, considering the literature, one of the longest time
spans for this range of CEECs used in an empirical study. With the purpose of testing
quantitatively the relevance of the above mentioned factors, a panel data analysis is run
using a random effects model.
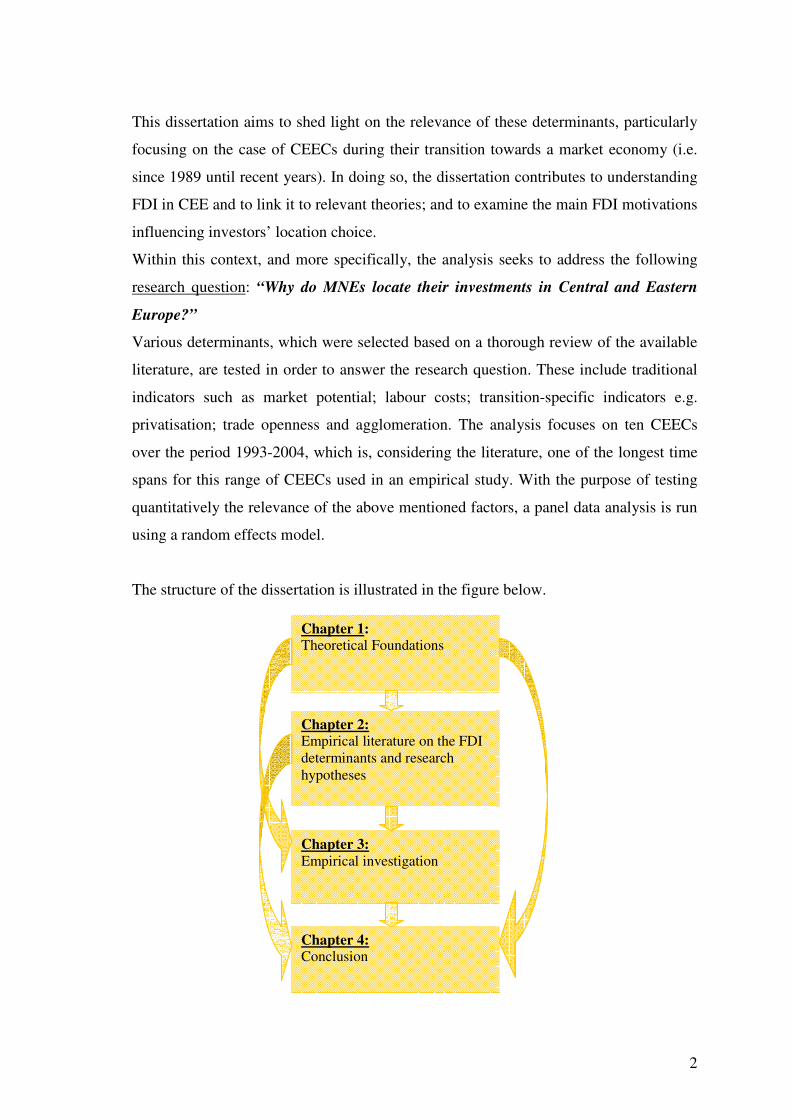
The structure of the dissertation is illustrated in the figure below.
Chapter 1: Theoretical Foundations
Chapter 2: Empirical literature on the FDI determinants and research hypotheses
Chapter 3: Empirical investigation
Chapter 4: Conclusion
3
The first chapter will lay down the theoretical bases underlying this study, explaining
which conceptual frameworks are more useful in order to capture and understand the
relevant dimensions of the phenomenon under research (FDI location determinants).
After this identification and integration of the most applicable theoretical approaches, a
review and discussion of the leading empirical literature on FDI determinants
(particularly focusing on the context under analysis, CEE) is conducted in Chapter 2.
Chapter 3 includes the empirical part (and, indeed, the core of this dissertation),
undertaking a panel data econometric estimation testing the relevance of selected FDI
determinants on a sample of ten CEECs over a period of twelve years (1993-2004). The
final section concludes, establishes the implications and limitations of the study, and
presents some avenues for future research.
4
1 Theoretical foundations
1.1 Overview This chapter aims to bring into attention some of the most relevant theories and
paradigms that exist in the international business (IB) literature and that help to better
define and answer this dissertation’s question: why do multinationals choose CEECs as
investment locations?
The selected theories thought to explain the FDI location are: Product life Cycle,
Internationalisation, Internalisation, the OLI Paradigm and Agglomeration theory.
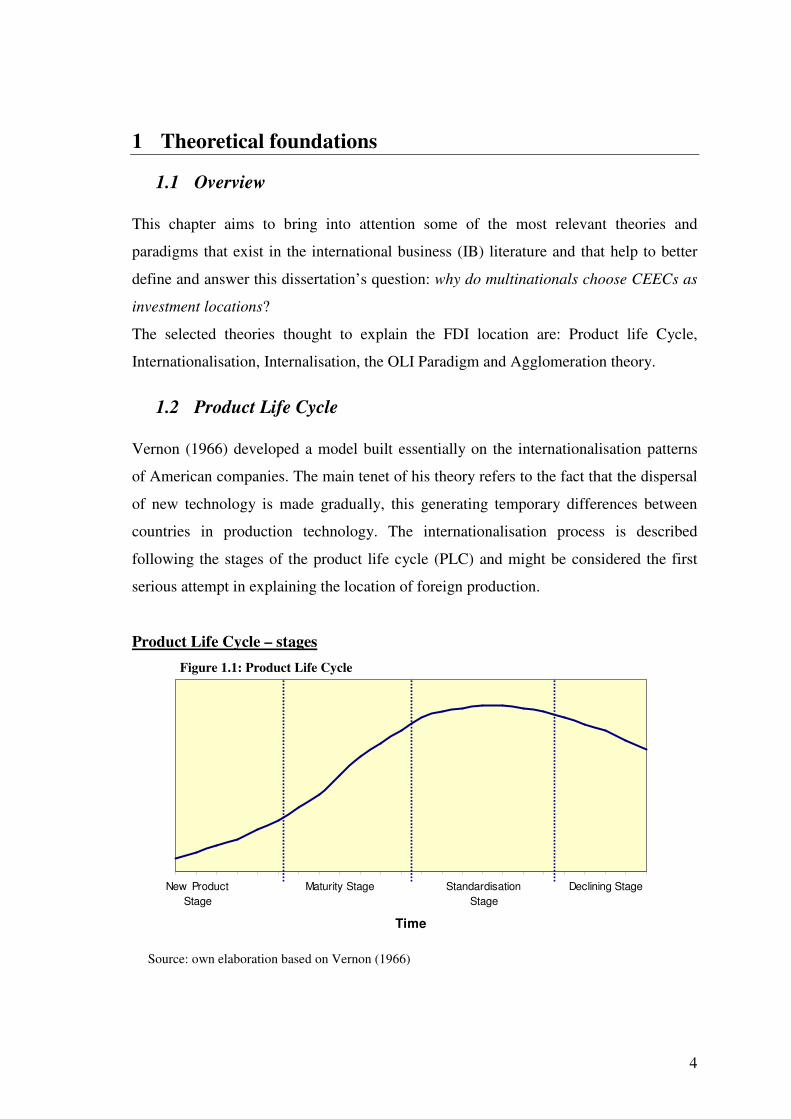
1.2 Product Life Cycle Vernon (1966) developed a model built essentially on the internationalisation patterns
of American companies. The main tenet of his theory refers to the fact that the dispersal
of new technology is made gradually, this generating temporary differences between
countries in production technology. The internationalisation process is described
following the stages of the product life cycle (PLC) and might be considered the first
serious attempt in explaining the location of foreign production.
Product Life Cycle – stages Figure 1.1: Product Life Cycle
New ProductStage
Maturity Stage StandardisationStage
Declining Stage
Time
Source: own elaboration based on Vernon (1966)
5
First stage: New Product Stage
The theory was explained from the perspective of the US market, which is characterised
by high average income, high unit labour costs and relatively unrationed capital. These
conditions influence both consumer and industrial goods and create a strong incentive
for R&D to take place. US companies develop innovations and choose the US as a
location for production due to “locational considerations that extend beyond simple
factor cost analysis plus transport considerations” (Vernon, 1966: 196), notably:
ease of communication with the home market;
necessity of using specialised labour;
need for flexibility;
the price inelasticity of the demand due to the high degree of product
differentiation and the high average income;
there is no demand overseas the production being sold only on the home market;
at this stage there is no internationalisation.
Second stage: Maturing Product Stage
At this stage, demand and production expand, the demand abroad develops and US
companies start exporting. As the product still has a high price and satisfies the needs of
high income consumers, the privileged location for exporting is Western Europe.
Some standardisation occurs, thus the uncertainty and the need for flexibility declines.
The presence of monopoly profits stimulates more companies to enter the market (be it
home or export market), although these firms cannot entirely compete based on the
product’s characteristics. In their attempt to maintain the monopoly position, the
innovating incumbent firms start to consider investing in foreign locations. Because
manufacturing processes of maturing products still require significant inputs from the
local economy, such investments are made in developed countries.
In case a foreign subsidiary is established, production cost differences between rivals
are usually differences due to scale, labour costs and transportation costs implied in
exporting the product back to the home country.
As products and technologies mature, the initial advantages are gradually lost. First, the
former innovations are substituted by imitation products manufactured in other
developed countries, and then made in developing countries.
6
Third stage: Standardised Product Stage
Standardisation appears when output volume is high and uncertainty is low. Once set up
in larger markets, offshore production facilities would serve local markets with local
production, substituting for exports. The market would expand, since the product’s price
would be reduced by local production (lower labour costs and elimination of transport
costs). This lower price would encourage the growth of markets in less developed
countries, which might well be served not from the home country factories but from
foreign establishments. As the product becomes standardised, the firm might invest in
the fastest growing less developed countries, where economic growth has created new
markets and investments might be located. At a later stage in the standardisation of
some products, less developed countries can offer comparative advantages for the
location of production.
Fourth Stage: Declining Product Stage
This fourth stage of the PLC was added by marketing scholars (Kotler, 1980).
The location of production is moved to even cheaper facilities by investing in less
developed countries, the market is shrinking and the tastes of the consumers changed
probably due to the fact that more innovative products are introduced. Price competition
is very intense and the product is sold at cheaper prices. Depending upon the product
type and profitability, production might be discontinued.
Vernon’s theory can be considered a theory of relocation of industries over time.
However, the evolution of MNEs suffered some changes since he developed his model
(well established network of MNEs around the world, high decrease of the gap between
US and the other developed countries, increased ability of local companies to imitate
products). Vernon himself wrote later a critique of his own model (Vernon, 1979),
suggesting that it was much less general than he had posited earlier.
Vernon’s dynamic approach aims in fact to explain market-seeking FDI and tries to link
the company’s specific advantages to the location advantages of the host countries.
The choice of locating investments in CEECs can be partly explained by the PLC. CEE
can be seen as a developing market characterised by relatively low labour costs and
relatively skilled labour and by the existence of new needs and an increased demand. In
accordance to Vernon’s model foreign investments would be placed in CEE in the third
7
phase of PLC. The first countries to attract FDI should be the most developed, which is
indeed confirmed because Hungary, Czech Republic and Poland received the largest
investments in the area in the 1990s. An interesting remark made by Magyar Nemzeti
Bank (2005) supports the pertinence of the PLC model for CEE. They asserted that
many FDI projects from Western countries originate indirectly from the US. The US
MNEs placed their investments in Western Europe and at a next stage these investments
were relocated in CEE. The motivation for relocation might consist on the fact that
CEECs are able to catch-up with the new technologies; the demand exists due to larger
markets, increasing income and cultural proximity leading to a convergence in
convergence in tastes. These are some reasons due to which the PLC could explain
investment relocation in CEE.
1.3 Internationalisation Process Models Internationalisation is a key issue in international economics and international business
research. There are multiple definitions that look to explain the term; it is seen as a
process in which specific attitudes or orientations are associated with successive stages
in the evolution of international operations, “a process of increasing involvement in
international operations” (Welch and Luostarinen, 1988: 8) or “the process by which
firms both increase their awareness of the direct and indirect influences of international
transactions on their future, and establish and conduct transactions with other countries”
(Beamish, 1990: 77). Since the late 1950s, the interest in the internationalisation process
of the firm grew, as did research in the area. With Johanson and Wiedersheim-Paul
(1975), Johanson and Vahlne (1977) and Luostarinen (1979), the focus changed to an
analysis of the international activities’ features and of the difference between growth at
home and internationalisation.
Johanson and Wiedersheim-Paul (1975) analysed the location dynamics of firms. They
suggested that internationalisation is a gradual process rather than a large, spectacular
foreign investment. They considered that first the firm develops in the domestic market
and internationalisation is the consequence of a series of incremental decisions. The
lack of knowledge and resources are considered the main obstacles to
internationalisation. Focusing on the experience of four small Swedish firms (their first
8
Impa
ct o
f peo
ple
and
com
mun
icat
ion;
dev
elop
men
t of
mar
ketin
g si
de o
f the
firm
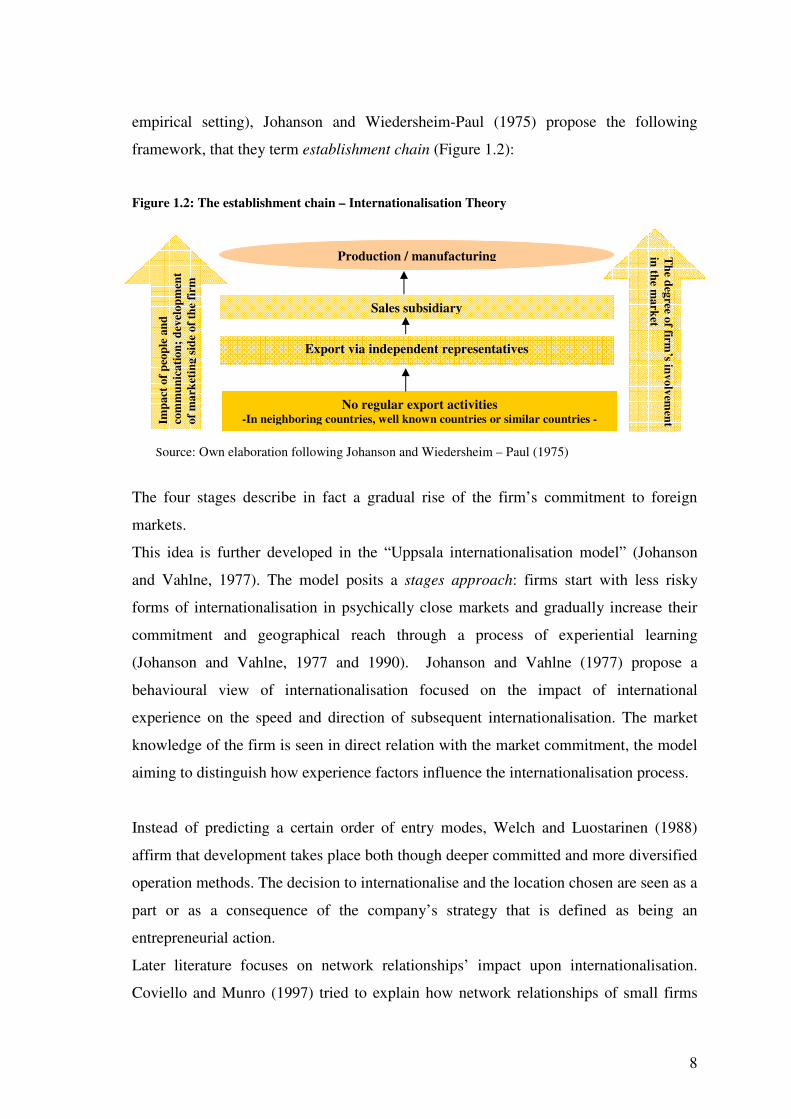
empirical setting), Johanson and Wiedersheim-Paul (1975) propose the following
framework, that they term establishment chain (Figure 1.2):
Figure 1.2: The establishment chain – Internationalisation Theory
Source: Own elaboration following Johanson and Wiedersheim – Paul (1975)
The four stages describe in fact a gradual rise of the firm’s commitment to foreign
markets.
This idea is further developed in the “Uppsala internationalisation model” (Johanson
and Vahlne, 1977). The model posits a stages approach: firms start with less risky
forms of internationalisation in psychically close markets and gradually increase their
commitment and geographical reach through a process of experiential learning
(Johanson and Vahlne, 1977 and 1990). Johanson and Vahlne (1977) propose a
behavioural view of internationalisation focused on the impact of international
experience on the speed and direction of subsequent internationalisation. The market
knowledge of the firm is seen in direct relation with the market commitment, the model
aiming to distinguish how experience factors influence the internationalisation process.
Instead of predicting a certain order of entry modes, Welch and Luostarinen (1988)
affirm that development takes place both though deeper committed and more diversified
operation methods. The decision to internationalise and the location chosen are seen as a
part or as a consequence of the company’s strategy that is defined as being an
entrepreneurial action.
Later literature focuses on network relationships’ impact upon internationalisation.
Coviello and Munro (1997) tried to explain how network relationships of small firms
Sales subsidiary
Export via independent representatives
Production / manufacturing
No regular export activities -In neighboring countries, well known countries or similar countries -
The degree of firm
’s involvement
in the market
9
influence the foreign market selection and the mode of entry. The internationalisation
model they proposed has only three stages: foreign market intention (year 0-1), active
involvement and evaluation (year 1-3) and committed involvement (year 3+). The
decision to internationalise appears very rapid and the modes of entry are multiple and
different.
Internationalisation models cover four theoretical perspectives: economic, behavioural,
network and entrepreneurship-based. Although knowledge and learning are the key
aspects in internationalisation models, due to the global changes in the economic world,
internationalisation is not so simplistic anymore. Concepts such as born globals
(McKinsey & Co., 1993), i.e. firms which have intensive exports during the first two
years after their foundation, high technology start-ups (Jolly et al., 1992) that have from
the start their strategy pointed towards global niche markets, international new ventures
(Oviatt and McDougall, 1994) and leapfrogging situations (Hedlund and Kverneland,
1985) appear increasingly often when the theme of discussion is internationalisation.
The studies mentioned above could guide our search upon location by explaining the
variation in expansion processes. In the specific case of CEECs “the pattern observed in
regard to host and source country of FDI inflow is greatly consistent with the
predictions of the Uppsala School” (Tondel, 2001: 33). Mainly due to the fact that
before 1989 CEECs were not integrated in the world market, uncertainty and risk
dissuaded foreign investors.
These factors and the need for local knowledge affect the degree of their implication on
the market and might support the sequential entry described by Uppsala school. As in
the case of the PLC, internationalisation explains the relocation of investments, however
it is explained through the fact that the incremental process is due to lack of knowledge
about the foreign country and tendency to avoid uncertainty.
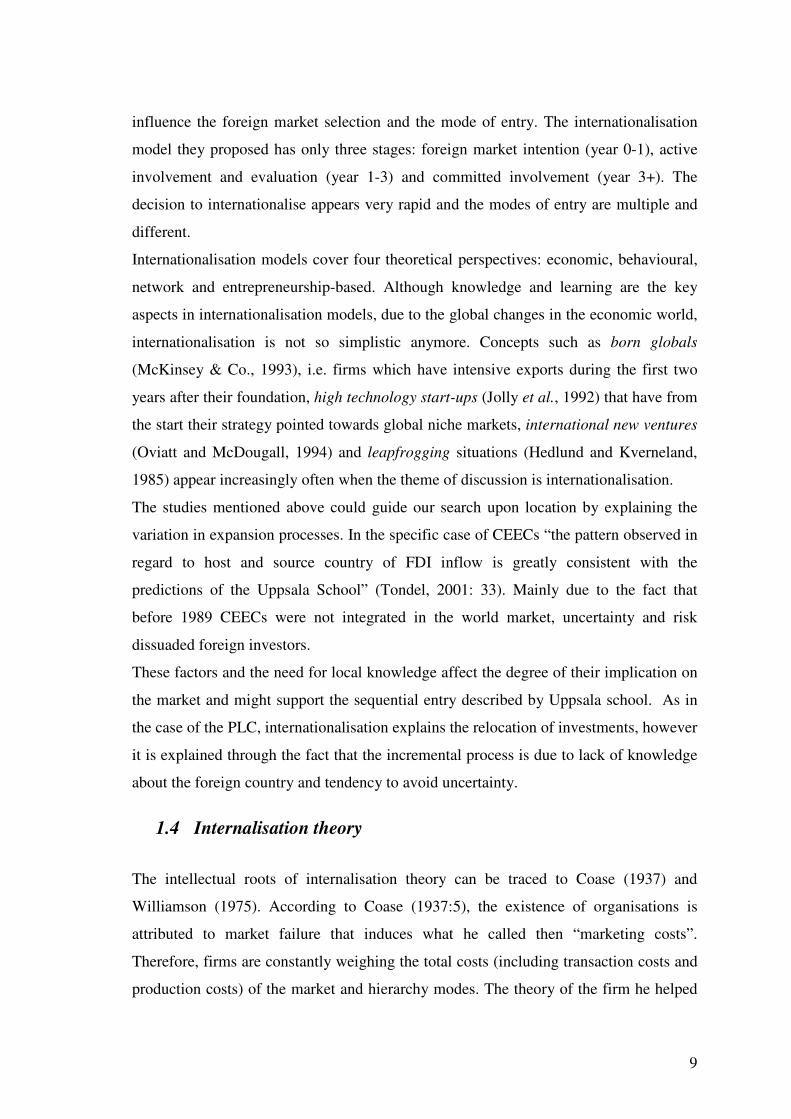
1.4 Internalisation theory
The intellectual roots of internalisation theory can be traced to Coase (1937) and
Williamson (1975). According to Coase (1937:5), the existence of organisations is
attributed to market failure that induces what he called then “marketing costs”.
Therefore, firms are constantly weighing the total costs (including transaction costs and
production costs) of the market and hierarchy modes. The theory of the firm he helped
10
to found considered new forms of productive activities such as franchises, sub-
contracting and other non-standard forms of organization.
Williamson (1975, 1981) followed up that companies want to minimise their total costs,
which are made up of both production and transaction costs. An important contribution
of this author rests in identifying the variables (frequency, uncertainty, asset specificity)
that determine whether market or hierarchy are going to have lower transaction costs in
various circumstances.
Transaction costs have been defined as “costs of arranging a contract ex ante and
monitoring and enforcing it ex post” (Matthews, 1986: 906) and as “costs of running the
economic system” (Arrow, 1969: 48). The concept of transaction costs has been widely
used to analyse different issues. These include analysis of organisational structures (for
example whether vertical integration is preferable to contracting), causes of market
failure (asymmetric information) and policy choices (administration costs associated
with policy implementation). More specific the types of transaction costs are (Dahlman,
1979):
- search and information costs (before the transaction at least one of the parts has
to search for a possible partner and inform him/her about the prospect);
- bargaining and decision costs (costs with travels, lawyers, other specialists,
warranties, prepayments, payments in instalments);
- policing and enforcement costs (costs with monitoring or policing the other
party in order to be sure that the contract is respected).
Buckley and Casson (1976) transformed internalisation into a full theory of
international business and multinational activity. Other important contributors to this
theory are Hennart (1982, 1987, 2000) and Rugman (1981).
Based on empirical evidence on the global pattern and evolution of FDI, and building
upon the theory of the firm (Coase, 1937), Buckley and Casson transferred the centre of
attention of international business literature from the country specific analysis towards
industry level and firm level determinants of international investment flows.
Internalisation theory, as developed by Buckley and Casson (1976), has three main
assumptions:
i) companies maximise profits in a world of imperfect markets;
11
ii) when markets for intermediate products are imperfect, the incentives to avoid them
appear by creating internal markets, meaning that the activities that are linked are
controlled by common ownership;
iii) internalisation of markets across boundaries generates the appearance of
multinational enterprises
Two types of markets are analysed with particular detail, notably the market for
intermediate products in certain multistage production processes and the market for
knowledge (Buckley and Casson, 1976). These authors emphasise the ability to
innovate as the crucial firm-specific advantage that determines internalisation across
international boundaries. They conclude that the incentive to internalise depends on the
interplay of industry- specific, region- specific, nation-specific and firm-specific factors.
Using “location effect” criteria, a national market is served either by local firms or by
exports (Buckley and Casson, 1979: 55). The location strategy depends upon several
factors as (Buckley and Casson, 1979: 56):
- increasing return to scale in many activities that leads to “relocation of plants
involved in quite remote stages of production, and to reorganisation of the
entire network of trade” ;
- modern businesses perform many activities other than routine production
(marketing and R&D). These activities influence location because their costs
differ from the ones of the routine production and because they employ a
“locational pull on routine production”;
- markets are imperfectly competitive; Therefore, MNEs are not in many cases
price takers in intermediate product and factor markets;
- government intervention – influence of taxes, tariffs and other regulations;
- ownership effect.
Buckley and Casson (1976) conclude that, because of market imperfections, the optimal
location cannot be chosen based only on evaluating the regional production cost as it
was done under the assumption of perfect markets where all firms are price takers and
the only barrier to trade relates to transport. In turn, Rugman (1981) proposed the idea
that MNEs appear because of the internalisation of the failure of the market for
information. Casson (1998) made other important contributions by setting the theory of
12
the firm within a holistic view of the economy, where the information flow has
potentially the same importance as the material flow.
Internalisation theory posits that MNEs are created when international market
transactions for intermediate goods are brought inside the firm, or internalised, in order
to reduce the cost of organising or controlling transactions. The theory helps us in
determining what the boundaries of the company are and what activities should be
internalised. Knowledge plays an important role when assessing transaction costs.
The implications upon location choice are relevant. In order for transaction costs to be
evaluated, MNEs’ decision-makers should be knowledgeable about the imperfections
existing in a certain location, otherwise without facing them there would be no need for
such a decision. Internalisation thus explains FDI location choice in any market
characterised by market failure. CEE is one such market. The main transaction costs
that are encountered in this region refer to lack of transparency and imperfect
information as well as unstable bargaining situations, mainly due to the fact that
markets were created before institutions (Meyer, 2001).
Being a “new” market with a new and relatively high demand, in many situations MNEs
are not price takers and they prefer to maintain their ownership advantage instead of
selling or transferring knowledge.
Internalisation theory does not explain why overseas production is considered the most
attractive mean of exploiting the firm’s advantage. The eclectic paradigm proposed by
Dunning (1977) addresses this issue.
1.5 The eclectic paradigm Dunning (1977) proposed a general framework seeking to explain the existence and the
growth of multinational enterprises. The eclectic paradigm aimed to be a synthesis of
extant theories relevant to explain international production (including, among others,
the product life cycle, internalisation theory, and international trade theories).
Dunning's eclectic framework, or “OLI Paradigm” (1977, 1981, 1988) combines the
effects of ownership factors (rent-producing firm skills), location factors (environmental
13
differences), and internalisation factors (transaction-related concerns), to explain the
structural choice of exports, licensing, or investment to enter a foreign host market.
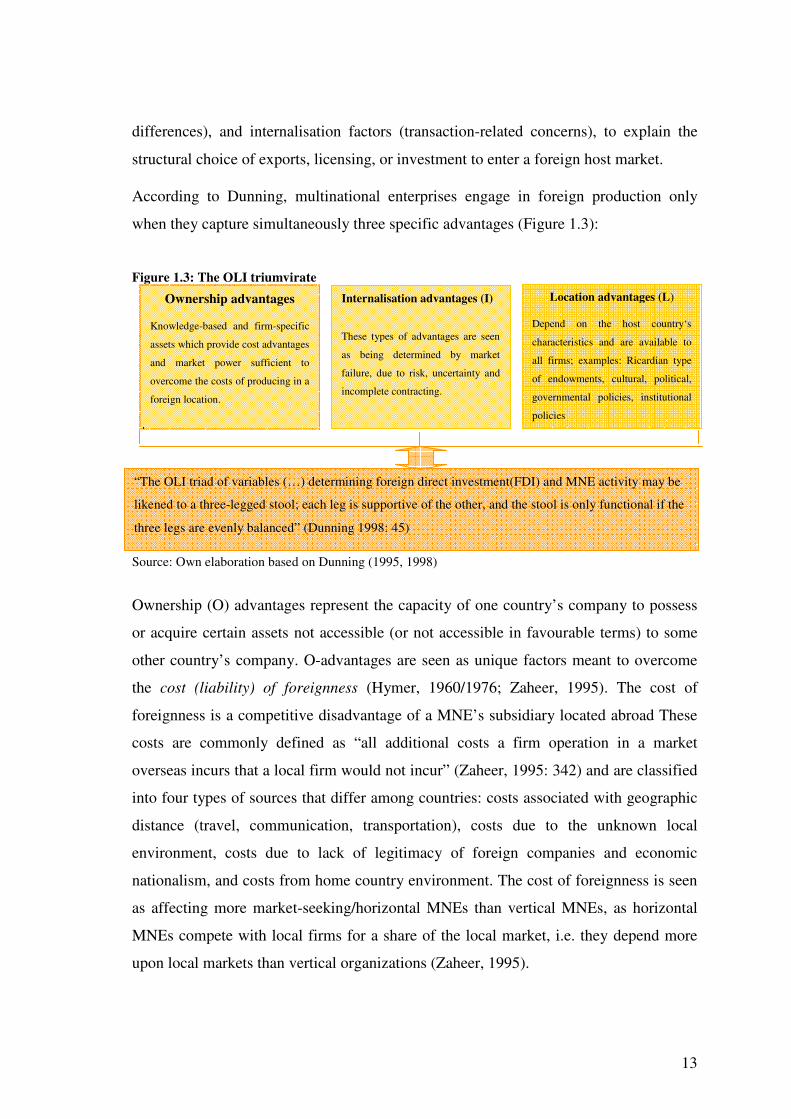
According to Dunning, multinational enterprises engage in foreign production only
when they capture simultaneously three specific advantages (Figure 1.3):
Figure 1.3: The OLI triumvirate
Source: Own elaboration based on Dunning (1995, 1998)
Ownership (O) advantages represent the capacity of one country’s company to possess
or acquire certain assets not accessible (or not accessible in favourable terms) to some
other country’s company. O-advantages are seen as unique factors meant to overcome
the cost (liability) of foreignness (Hymer, 1960/1976; Zaheer, 1995). The cost of
foreignness is a competitive disadvantage of a MNE’s subsidiary located abroad These
costs are commonly defined as “all additional costs a firm operation in a market
overseas incurs that a local firm would not incur” (Zaheer, 1995: 342) and are classified
into four types of sources that differ among countries: costs associated with geographic
distance (travel, communication, transportation), costs due to the unknown local
environment, costs due to lack of legitimacy of foreign companies and economic
nationalism, and costs from home country environment. The cost of foreignness is seen
as affecting more market-seeking/horizontal MNEs than vertical MNEs, as horizontal
MNEs compete with local firms for a share of the local market, i.e. they depend more
upon local markets than vertical organizations (Zaheer, 1995).
Ownership advantages Knowledge-based and firm-specific
assets which provide cost advantages
and market power sufficient to
overcome the costs of producing in a
foreign location.
Internalisation advantages (I)
These types of advantages are seen
as being determined by market
failure, due to risk, uncertainty and
incomplete contracting.
Location advantages (L) Depend on the host country‘s
characteristics and are available to
all firms; examples: Ricardian type
of endowments, cultural, political,
governmental policies, institutional
policies
“The OLI triad of variables (…) determining foreign direct investment(FDI) and MNE activity may be
likened to a three-legged stool; each leg is supportive of the other, and the stool is only functional if the
three legs are evenly balanced” (Dunning 1998: 45)
14
Hymer (1960/1976) asserted that, in order to prevail over the disadvantages they face
when competing with indigenous firms, MNEs must have some advantages specific to
their ownership. This idea was inspired by Bain’s (1956) work that saw the costs of
foreignness as a barrier to competition in domestic markets (Bailey and Driffield, 2002).
Dunning refers that location factors (country-level factor price advantages) determine
the choice of production site; and that internalisation (transaction cost) factors dictate
whether overseas production will be organised through markets (licensing) or
hierarchies (FDI). Although Dunning does include certain aspects of the oligopoly
power model and of location economics, he relies on internalisation arguments to justify
the use of one entry mode or another after the product and market are selected. He also
continues to define multinationality by the use of FDI.
The advantages of internalisation are determined by market failure encountered in CEE.
Various imperfections, risks and uncertainties are present on these markets and can be
avoided by internalising them within the firm.
Location (L) advantages are external to firm and, in order to identify them, Dunning
(1977) proposed to analyse first the network (the O-advantages) and then to determine
how that precise location facilitates internalisation of intermediate product markets. The
location advantages arise from differences in factor endowment, transport costs and
distance, artificial barriers, and infrastructure and incentives existent at different foreign
locations.
A set of location variables are specified, the most important being the following:
- the spatial distribution of natural and created resource endowments and
markets;
- input prices;
- quality and productivity;
- international transport and communication costs;
- investment incentives and disincentives;
- artificial barriers to trade in goods and services;
- economies of centralisation of R&D production and marketing;
15
- institutional framework for resource allocation and cross country ideologies;
- language, cultural, business, political differences and environmental conditions.
The OLI framework offered by Dunning (1977) is very often used in the literature to
explain the location of international business. Location advantages contribute to
competitive advantage. Analysing the variables proposed by Dunning (1977), we
observe that advantages may appear at three levels: country, industry and firm level.
The OLI paradigm helps in explaining why MNEs invest in CEE and why CEECs
attract FDI. There is clear evidence that MNEs which located their investments in CEE
possess ownership advantages such as technological assets, firm specific knowledge-
based assets, logistic and distribution advantages or a strong commercial brand; and are
able to carry out their activity and to overcome the costs of producing in these emerging
markets. CEE’s market is imperfect; therefore there is often the need for internalisation.
In order to close the triumvirate, the location (L) advantages are considered. The
propensity of a firm to initiate foreign production will depend also on the specific
advantages of its home country compared with resource implications and advantages of
locating in another country. The strategic location is the location that has a comparative
advantage against the home country. CEECs can be such a location and the potential
determinants that give this advantage are discussed in later chapters.
Compared to the other theories mentioned (PLC, internationalisation and
internalisation) the OLI paradigm may be a too general and static theory of FDI
involvement (Axinn and Matthyssens, 2001) but it is the first one to name and specify
the strategic location and nevertheless presents an adequate approach for analysing why
do MNEs invest in CEE.
1.6 Agglomeration
The role of agglomeration economies for location choice became an important subject
in urban, regional and international economics. The main idea is that the clustering of
economic activities results in costs savings and productivity increase for companies
influencing in this way their location (Hilber and Voicu, 2007).
16
The early agglomeration concept was defined by Marshall (1890) as being a spatial
concentration of firms that magnifies the initial advantages of the location. Cost-saving
scale effects might be obtained as a result of the concentration of industrial facilities in a
single location. These cost effects determined by agglomeration are called
agglomeration economies. Agglomeration economies might take place within the same
industry (localisation economies) or might appear at the regional level (urbanisation
economies).
Marshall’s (1890) work emphasises such scale effects. The main idea consists on the
fact that a firm located near other firm benefits from external economies which appear
from:
- deep labour pools (because of the high level of flexibility);
- better information and access to information (encourages R&D activities); and
- well-developed intermediate input suppliers (reduces the transaction cost).
Marshall (1890) describes very well agglomeration advantages in what he coined the
industrial district. The pool of specialists and trained employees is expected to grow
when industry expands in a certain location. In Marshall’s opinion, locational clustering
of firms leads to the increase of other companies’ learning processes due to the
exchange of ideas. It is like a snowball effect, “if one man starts a new idea, it is taken
up by others and combined with suggestions of their own; and thus it becomes the
sources of further new ideas” (Marshall, 1890: 271).
Two important factors related to the agglomeration concept are externalities and
positive spillovers. By externalities, we understand the costs or benefits of transactions
that are not reflected in prices (Griliches, 1979). These might be divided into two types:
technological externalities (that occur from non-market interactions between firms that
have the same location) and pecuniary externalities (that appear because of the market
interactions and might be part of activities that influence the cost) (Griliches, 1979).
Because the newly created knowledge can be appropriated only to a limited extent,
knowledge obtained by one firm might spill over to other firms. Knowledge spillovers
are geographically bounded to the region where the knowledge was created (Feldman
and Audretsch, 1999). Knowledge spillovers appear when the knowledge created by one
agent can be used by another without costs or, with fewer costs than the value of the
knowledge (Jaffe, 1996).
17
A significant implication for the present research is the emphasis on the importance of
space. Knowledge spillovers diffuse faster in agglomerations, the importance of space
coming from the assumption that dispersal of knowledge as a positive externality it is
spatially limited (Döring and Schnellenbach, 2004). In the case of tacit knowledge is
even more obvious that proximity is important, due to the fact that it is transferred
through direct interaction between individuals. Other implication they reached is that
when certain locations have a larger stock of knowledge, they tend to be characterised
by sustained growth rates, increasing returns and other positive externalities that attract
new investors.
An important remark consists on the fact that the existence of a too large or too small
technological gap does not encourage the diffusion of spillovers (Cohen and Levinthal,
1990; Perez, 1997; Tavares and Young, 2005). Other determinants of absorptive
capacity are: cultural and psychic distance, degree of foreign ownership, trade
protection and institutional framework, nature of industries and host countries, size of
the firm and the development level of the country. If the economic framework is not
favourable then “there are no spillovers if there is nothing to spill into” (Tavares and
Young, 2005: 6).
A relevant concept to this dissertation is clustering. Very often, agglomeration and
clustering are used synonymously, but there is a slight difference between them. There
are various definitions of the term cluster, the most commonly used being given by
Porter (1990: 16) that sees a cluster as a geographically proximate group or geographic
concentration of “interconnected companies, specialised suppliers and service providers,
firms in related industries and associated institutions (…) in particular fields that
compete but also cooperate (…) linked by commonalities and complementarities”.
The definition of cluster is based on the strength of inter-firm linkages giving more
importance to specialisation, while agglomeration is based upon locational
concentration and gives equal importance to proximity and specialisation. Krugman
(1991) argued that the origin of clusters exists due to economies of scale rather than
comparative advantage. Porter (1990) asserted that clusters improve the access to
specialised inputs and information and the rate of success and innovation, lowering
simultaneously the barriers to new business formation. He stated that “traditional”
18
agglomeration economies were focused on cost minimisation, while nowadays a shift to
productivity occurred.
Another perspective that gives importance to location and agglomeration is the new
economic geography. This literature suggests (Fujita, 1988; Krugman, 1991; Venables,
1996) that firms tend to locate where other companies from the industry are located, its
defining issue being “how to explain the formation of a large variety of economic
agglomeration (or concentration) in geographical space” (Fujita and Krugman, 2004:
140). A key framework for the new economic geography is Krugman’s (1991) core-
periphery model. The model considers two forces that are explained in terms of more
fundamental micro decisions: the centripetal force that pulls economic activity together
and the centrifugal force that pushes it apart. He demonstrated how the interactions
among increasing returns, transport costs and factor mobility can cause changes in the
economy’s spatial structure. The first assumption is that when a larger number of
companies are located in the same region, more varieties are produced there. The labour
force from that region has a better access to a higher number of varieties and also a
higher income comparing to the workers that are located in other regions. This situation
will attract workers leading to the creation of a larger market. Hence, there is an
incentive to concentrate production in one region and due to the savings related to
transportation cost, that incentive is increased. In this way is created “circular causation
of forward linkages (the incentive of workers to be close to the producers of consumer
goods) and backward linkages (the incentive for producers to concentrate where the
market is larger)” (Fujita and Krugman, 2004: 145). If the described linkages prevail
over the centrifugal force, manufacturing is concentrated in one region and the economy
will follow a core-periphery pattern2 (Fujita and Mori, 2005).
Oligopolistic Reaction
A concept that has agglomeration implications is oligopolistic reaction, introduced by
Knickerbocker (1973) in order to explain the motivation of the companies that are
following the leaders. For a better understanding of the term, we may consider the
definition given by Head et al. (2002: 454) that defined it as the “decision of one firm to
invest overseas raises competing firms’ incentives to invest in the same country”. 2 Myrdal (1957) developed a cumulative causation model demonstrating that most peripheral regions are doomed because of the cumulative causation pattern leading to the appearance of vicious circles.
19
Knickerbocker (1973) asserts that in an oligopolistic industry the companies would tend
to follow each other’s location choices. He considered three elements necessary for the
oligopolistic reaction to take place:
- risk aversion – the more risk-averse the oligopolist is, greater chances are that
he will invest in the same country as its rivals did;
- uncertainty; and
- the presence of oligopoly.
Once positive spillovers exist between companies that have the same location,
companies obtain larger profits from clustering than from dispersing. One of the
advantages which clustering offers is knowledge diffusion. That knowledge is one of
the most important elements considered for agglomeration economies is generally
accepted. Knowledge is seen as dependent on time and context and hence is
continuously evolving. Hayek (1945) emphasised in economic literature the notion of
dispersed knowledge, stating that such dispersion might appear spatially or among
individuals. Later, the theory of economic growth (Solow, 1956; Swan, 1956) and the
new growth theory (Romer, 1991) have shown that the availability of knowledge and its
spatial diffusion are an important base for growth processes and at the same time they
influence the speed of such processes.
Agglomeration may often explain MNEs’ behaviour when choosing a location for their
investments. Agglomeration creates a strategic location with easy access to international
communications networks (which can be a relevant advantage offered by CEECs
compared to other emerging countries), high quality external services, and good
linkages between companies. An usual assumption in the 1990s was that manufacturing
located in the EU “core” would shift to the “periphery”. The extent to which this
process took place is an interesting research subject, yet beyond the scope of this
dissertation. Certainly, industrial agglomerations were created in the CEECs (among
others, Hungary and its localisation economy in electronics; the urbanisation economy
created in the Prague–Bratislava–Györ triangle) and their importance in attracting new
FDI must be investigated. A survey made by Ernst and Young (2003) among business
leaders placed the number of firms as being one of the first four most relevant criteria in
choosing a location for new investments.
20
1.7 Motivations for foreign production
FDI scholars identified various motivations that support international production. Based
in Behrman (1972), Dunning (1993) classified the motivations for FDI in natural
resource –seeking, market-seeking, efficiency-seeking, and strategic asset-seeking.
Natural resource-seeking refers to the need to obtain natural resources that are location
specific, and that cannot be found (at least in the same conditions) in the home country.
This might be determined by the immobility of resources or by high transport costs that
would occur in case of obtaining it from other locations.
Market-seeking is driven by the aim of supplying the local market or markets that
situate in the proximity of the host country, and may be motivated by positive or
negative location advantages such as taking advantage of large growing markets, avoid
the import barriers, reduce uncertainty, have better access to information, reduce
transaction costs or avoid high transportation cost. These ideas are based on Myrdal
(1957) and Hirschman (1958)3.
In its two forms (products and processes), efficiency–seeking aims to gain from the
availability of and cost reduction of the factor endowments in different countries.
Investments based on this cost-focused motivation “tend to be more ‘footloose’ than
those justified by other (more embedded or location-dependent) motivations” (Tavares,
2001: 47).
Strategic-asset seeking registered a rapid growth in relevance the last decades (Dunning,
1998). In this case, MNEs look for assets that might be critical in the long-term and are
not obtainable at home. Agglomerations may offer the opportunity to tap into strategic
assets.
Dunning proposed motivations search to exploit firm specific advantages (Nachum and
Zaheer, 2002), except strategic asset-seeking, that does not imply use of an extant O-
advantage.
Other motivations for engaging in FDI are the competitive pressure exercised by major
competitors that originates the “follow the leader” behaviour (Knickerbocker, 1973). In
the last two decades, FDI motivations, and their relative importance, changed
significantly. Presently, the most important motivations appear to be efficiency- and
3 Hirschman (1957) referred to the importance of the backward and forward linkages of firms.
21
asset-seeking objectives, the latter emphasising mainly intangible assets, especially the
ones embodied in human resources (Dunning, 2002). Nachum and Zaheer (2002) and
Govindarajan and Gupta (2001) proposed a re-categorisation of the FDI motivations in
broader ones: Growth (would include market-seeking), Efficiency (including all
motivations based on cost), Knowledge (intellectual and social capital) and Competitive
Position (motivations implying international expansion).
Regarding our specific case, CEE, at least in the beginning of the transition, market-
seeking was the dominant FDI motivation (Kaminski, 2006; Lankes and Venables,
1996). Natural resource-seeking was not very important, except in a few industries (oil
refineries, tourism). Cheap labour is considered to be one of the most important
variables of efficiency-seeking. In later years, the transition from market-seeking to
efficiency –seeking and network-type integrated FDI took place.
1.8 Concluding remarks This chapter provided a review of the most important theories that make the foundation
of our research question related particularly to FDI location. PLC explains the
relocation of investment focusing on the timing of innovations, effects of economies of
scale and, to a smaller degree, the role of uncertainty. Internationalisation addresses the
relocation of investment using a model of incremental commitment to FDI location,
knowledge and learning being the key aspects considered. Internalisation suggests that
market failure is the main reason for which MNEs locate their activities in foreign
locations. The relevance of strategic location is explained by the OLI paradigm and
agglomeration theory. According to the mentioned theories, economies of scale, market
failure, comparative advantage, and agglomeration effects are factors that should be
considered when analysing the determinants driving FDI location decision.
22
2 Empirical literature on the FDI determinants and research hypotheses
Investments are made where conditions are favourable. Various location factors are
considered to influence MNEs’ decisions when choosing to carry out their production
overseas. Several determinants were empirically tested in order to establish their
significance for FDI location. This chapter aims to review extant leading empirical
literature, then to posit hypotheses based on findings derived from such state-of-the-art
literature.
Location determinants depend upon the motivation for FDI, the economic and business
environment of the potential host country and upon the mode of entry or expansion
chosen (Dunning, 2002).
The chapter starts by examining the literature aimed at testing FDI determinants
particularly that focus more on CEECs. Based on its conclusions and on the theoretical
background presented, the main hypotheses of the research are formulated.
A general classification of the determinants is presented in Table 2.1. From the
determinants enumerated the most important for the research theme will be selected and
discussed.
23
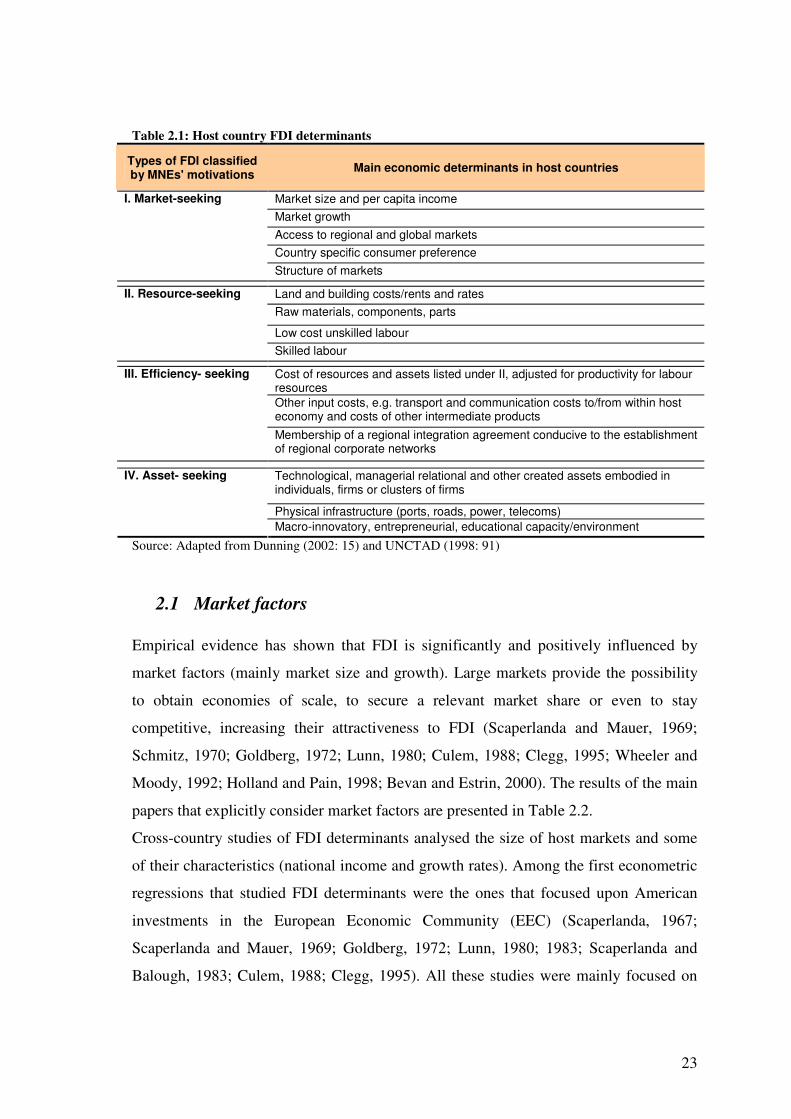
Table 2.1: Host country FDI determinants
Source: Adapted from Dunning (2002: 15) and UNCTAD (1998: 91)
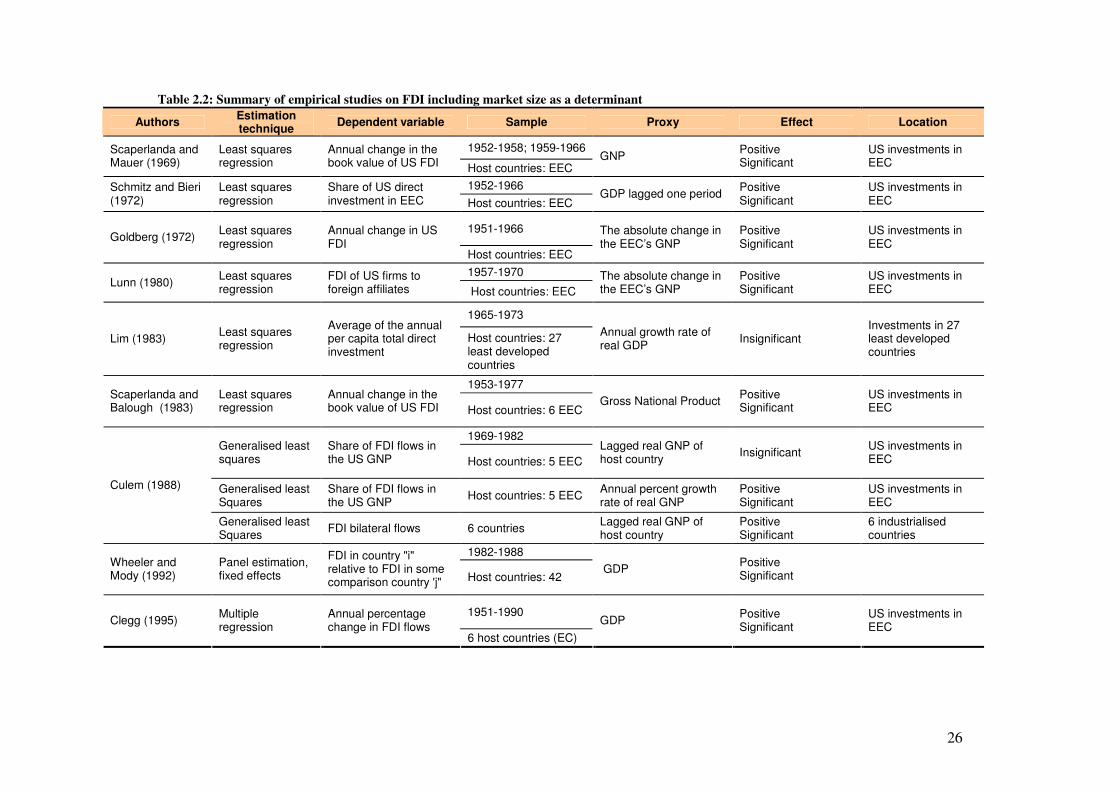
2.1 Market factors Empirical evidence has shown that FDI is significantly and positively influenced by
market factors (mainly market size and growth). Large markets provide the possibility
to obtain economies of scale, to secure a relevant market share or even to stay
competitive, increasing their attractiveness to FDI (Scaperlanda and Mauer, 1969;
Schmitz, 1970; Goldberg, 1972; Lunn, 1980; Culem, 1988; Clegg, 1995; Wheeler and
Moody, 1992; Holland and Pain, 1998; Bevan and Estrin, 2000). The results of the main
papers that explicitly consider market factors are presented in Table 2.2.
Cross-country studies of FDI determinants analysed the size of host markets and some
of their characteristics (national income and growth rates). Among the first econometric
regressions that studied FDI determinants were the ones that focused upon American
investments in the European Economic Community (EEC) (Scaperlanda, 1967;
Scaperlanda and Mauer, 1969; Goldberg, 1972; Lunn, 1980; 1983; Scaperlanda and
Balough, 1983; Culem, 1988; Clegg, 1995). All these studies were mainly focused on
Types of FDI classified by MNEs' motivations Main economic determinants in host countries
Market size and per capita income Market growth Access to regional and global markets Country specific consumer preference
I. Market-seeking
Structure of markets
Land and building costs/rents and rates Raw materials, components, parts
Low cost unskilled labour
II. Resource-seeking
Skilled labour
Cost of resources and assets listed under II, adjusted for productivity for labour resources Other input costs, e.g. transport and communication costs to/from within host economy and costs of other intermediate products
III. Efficiency- seeking
Membership of a regional integration agreement conducive to the establishment of regional corporate networks
Technological, managerial relational and other created assets embodied in individuals, firms or clusters of firms
Physical infrastructure (ports, roads, power, telecoms)
IV. Asset- seeking
Macro-innovatory, entrepreneurial, educational capacity/environment
24
market factors and on the level of tariff discrimination. Scaperlanda (1967) using data
for 1951-1964 (divided into two periods, 1951 -1958 and 1951-1964) studied the impact
of EEC creation upon the US FDI inflows in Western Europe. He found that the
formation of the new market had no significant impact upon US FDI inflows to Europe.
Scaperlanda and Mauer (1969) used a different period in their analysis (1952-1966
divided into two time periods: pre- and post-EEC), and found market size significant
but not market growth.
The results regarding the significance of the determinants obtained within that period
are inconclusive because, due to different time horizons and lack of technical rigour, the
results change from study to study (Tavares, 2001). Another limitation of the analysis at
that time was the fact that the hypothesis was based on the neoclassical assumptions
(Mundell, 1957) i.e. stating that FDI and trade are substitutes (Castro, 2000; Tavares,
2001).
Subsequent studies (Schmitz, 1970; Goldberg, 1972; Lunn, 1980; Culem, 1988; Clegg,
1995) considered the possibility that FDI and trade are complements. Schmitz (1970)
expanded the Scaperlanda and Mauer’s (1969) work, and using data for the same period
(1952-1966) obtained evidence that market growth (EEC formation) influenced
positively US FDI inflows. Other studies found market size and market growth
significant for US FDI into the EEC (Goldberg, 1972; Lunn, 1980; Clegg, 1995).
Within the reviewed studies, there are few that found that market size and/or market
growth are insignificant in attracting FDI (Lim, 1983; Culem, 1988). Lim (1983)
studied FDI determinants in twenty-seven developing countries, concluding that foreign
investors are more concerned with the economic performance in the long run than with
recent market growth.
Several proxies were employed to measure market factors. Among them we can find
GDP per capita, total GDP, and public consumption. The present research uses GDP
growth rate for market potential.
For the specific region under analysis (CEE) different findings were registered.
Carstensen and Toubal (2004: 6) refer that an econometric analysis of the market size
impact upon FDI inflows in CEE should be carefully developed because there is a
“perverse but spurious relationship between FDI and market size if this is simply
measured as the actual output of the host country”.
25
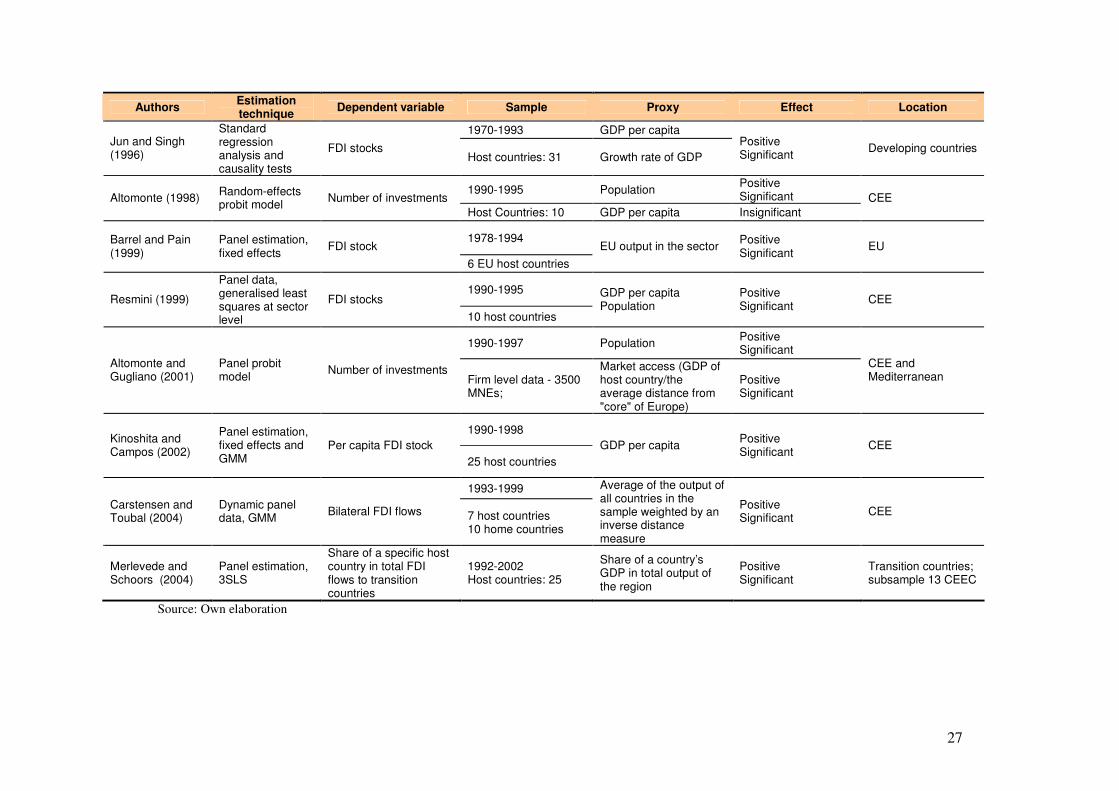
Resmini (1999) investigated sectoral patterns of FDI in CEECs, trying to determine to
which extent FDI in different sectors reacts to the same characteristics of the host
country. She used a panel data of FDI in the manufacturing sector of 10 CEECs for the
period 1990-1995 and found market size, transition stage, degree of openness of the
economy and manufacturing concentration statistically significant.
Altomonte and Guagliano (2001) constructed a panel probit model of FDI determinants
(over the 1990-1997 period for three thousand and five hundred European
multinationals in three industries), investigating the FDI attractiveness of CEE and of
the Mediterranean countries. They reaffirm the importance of market size and its
positive influence for every sector and location studied.
Carstensen and Toubal (2004) carried out an econometric analysis for the period 1993-
1999 comprising ten OECD countries and seven countries from CEE. When deciding
the proxy for market potential, they did not consider only the host market but also the
markets of all neighbouring countries, using as a proxy the average of the output of all
countries in the sample weighted by an inverse distance measure which is derived on a
region-to-region basis using transportation costs. From all the traditional variables
market potential was found the most significant variable.
Kinoshita and Campos (2002) examined FDI location determinants in twenty-five
transition countries from CEE and former USSR between 1990 and 1998.
Agglomeration and host country characteristic determinants were taken into account.
Without the agglomeration effect their model showed market size as being the most
important determinant. Once the agglomeration effect was introduced (one year lagged-
stock of FDI is used as a proxy) market size became no longer an important
determinant.
Most of the empirical evidence shows, therefore that market factors are significant
locational determinants. Reviewed investigations, both at country and sectoral level,
suggested that most MNEs, regardless of their industry, invested in the CEECs to find
new market opportunities. Giving the size and the growing potential of the CEE market
and the possibility of obtaining economies of scale, a positive association with FDI is
expected.
Hypothesis 1 Inward FDI is positively influenced by market growth.
26
Table 2.2: Summary of empirical studies on FDI including market size as a determinant
Authors Estimation technique Dependent variable Sample Proxy Effect Location
1952-1958; 1959-1966 Scaperlanda and Mauer (1969)
Least squares regression
Annual change in the book value of US FDI Host countries: EEC
GNP Positive Significant
US investments in EEC
1952-1966 Schmitz and Bieri (1972)
Least squares regression
Share of US direct investment in EEC Host countries: EEC
GDP lagged one period Positive Significant
US investments in EEC
1951-1966 Goldberg (1972) Least squares
regression Annual change in US FDI
Host countries: EEC
The absolute change in the EEC’s GNP
Positive Significant
US investments in EEC
1957-1970 Lunn (1980) Least squares
regression FDI of US firms to foreign affiliates Host countries: EEC
The absolute change in the EEC’s GNP
Positive Significant
US investments in EEC
1965-1973
Lim (1983) Least squares regression
Average of the annual per capita total direct investment
Host countries: 27 least developed countries
Annual growth rate of real GDP Insignificant
Investments in 27 least developed countries
1953-1977 Scaperlanda and Balough (1983)
Least squares regression
Annual change in the book value of US FDI Host countries: 6 EEC
Gross National Product Positive Significant
US investments in EEC
1969-1982 Generalised least squares
Share of FDI flows in the US GNP Host countries: 5 EEC
Lagged real GNP of host country Insignificant US investments in
EEC
Generalised least Squares
Share of FDI flows in the US GNP Host countries: 5 EEC Annual percent growth
rate of real GNP Positive Significant
US investments in EEC
Culem (1988)
Generalised least Squares FDI bilateral flows 6 countries Lagged real GNP of
host country Positive Significant
6 industrialised countries
1982-1988 Wheeler and Mody (1992)
Panel estimation, fixed effects
FDI in country "i" relative to FDI in some comparison country 'j" Host countries: 42
GDP Positive Significant
1951-1990 Clegg (1995) Multiple
regression Annual percentage change in FDI flows
6 host countries (EC) GDP Positive
Significant US investments in EEC
27
Authors Estimation technique Dependent variable Sample Proxy Effect Location
1970-1993 GDP per capita Jun and Singh (1996)
Standard regression analysis and causality tests
FDI stocks Host countries: 31 Growth rate of GDP
Positive Significant Developing countries
1990-1995 Population Positive Significant Altomonte (1998) Random-effects
probit model Number of investments Host Countries: 10 GDP per capita Insignificant
CEE
1978-1994 Barrel and Pain (1999)
Panel estimation, fixed effects FDI stock
6 EU host countries EU output in the sector Positive
Significant EU
1990-1995 Resmini (1999)
Panel data, generalised least squares at sector level
FDI stocks 10 host countries
GDP per capita Population
Positive Significant CEE
1990-1997 Population Positive Significant
Altomonte and Gugliano (2001)
Panel probit model Number of investments
Firm level data - 3500 MNEs;
Market access (GDP of host country/the average distance from "core" of Europe)
Positive Significant
CEE and Mediterranean
1990-1998 Kinoshita and Campos (2002)
Panel estimation, fixed effects and GMM
Per capita FDI stock 25 host countries
GDP per capita Positive Significant CEE
1993-1999 Carstensen and Toubal (2004)
Dynamic panel data, GMM Bilateral FDI flows 7 host countries
10 home countries
Average of the output of all countries in the sample weighted by an inverse distance measure
Positive Significant CEE
Merlevede and Schoors (2004)
Panel estimation, 3SLS
Share of a specific host country in total FDI flows to transition countries
1992-2002 Host countries: 25
Share of a country’s GDP in total output of the region
Positive Significant
Transition countries; subsample 13 CEEC
Source: Own elaboration
28
2.2 Labour costs Extant literature focusing on the influence of labour costs on FDI is rather inconclusive;
some studies find it relevant (Caves, 1974; Saunders, 1982; Bevan and Estrin, 2000) while
others find it insignificant (Owen, 1982; Gupta, 1983; Papanastassiou and Pearce, 1990).
Among those studies that find labour costs significant, some find it positive (Swain and
Wang, 1995; Walkenhorst, 2004; Bénassy-Quéré and Lahrèche-Révil, 2005 and Boudier-
Bensebaa, 2005) while others find that labour costs affect negatively FDI (Lansbury et al.,
1996; Barrel and Pain, 1999; Bevan et al., 2004).
Due to the low mobility of employment a significant influence of labour costs implies a
change in the production location to regions where the labour is cheaper.
Before reviewing some of the most important papers it is important to define the concept
“labour costs”. ILO (2006)4 defines labour costs as being “the cost incurred by the
employer in the employment of labour” and containing the “remuneration for work
performed, payments in respect of time paid for but not worked, bonuses and gratuities, the
cost of food, drink and other payments in kind, cost of workers’ housing borne by
employers, employers’ social security expenditures, cost to the employer for vocational
training, welfare services and miscellaneous items, such as transport of workers, work
clothes and recruitment, together with taxes regarded as labour cost”.
In general, labour costs comprise: wage cost (which constitute the largest part of labour
costs), other components (such as cost of food, bonuses, etc.) and taxes5 (which are
imposed on employment or on payrolls directly affect the cost to employers of employing
labour).
Part of the empirical evidence shows that the influence of labour costs on FDI differs
according to the type of industry (labour or capital intensive), to the investment’s
orientation, [domestic or export oriented (Agarwal, 1997)] and to the level of the host
country development (developed and less developed countries) (Castro, 2000)].
4 ILO, website http://laborsta.ilo.org/applv8/data/c6e.html accessed on 12/12/2006 5 The taxes are requested by statistic resolution to be considered separately in order to facilitate international comparisons.
29
Insignificant evidence was found mostly for investments made in developed countries.
Owen (1982) analysed inter-industry determinants of FDI in the Canadian manufacturing
industry and found that the wage cost differential between the US and Canada was
insignificant. Gupta (1983) following up Owen (1982) reached the same conclusion after
running a similar model for US investments in Canada. For the same countries, opposite
results were obtained when the productivity was considered also in the analysis (Caves,
1974; Saunders, 1982) (UNCTC, 1992). Buckley and Dunning (1976) when analysing US
FDI in the United Kingdom, tested the influence of labour costs by using a comparative
wage bill productivity (gross output per £1 wage bill) and concluded that the influence was
insignificant.
Kravis and Lipsey (1982) aimed to understand how the behaviour of MNEs changed the
location of world’s manufacturing production and tested the determinants of US MNEs’
decisions regarding the location of their activities. In order to estimate the significance of
labour costs in the host countries they used as a proxy the units labour cost, which is the
ratio between the quality adjusted average wage for each country and the output per
worker. They reached the conclusion that the explanatory power of labour costs is weak.
US companies tend to export from high-wage countries but labour costs are not a major
influence on the location of export production.
Culem (1988), following the way paved by Scaperlanda and Mauer (1969), Schmitz and
Bieri (1972) and Lunn (1980) in analysing US investments into the EEC tested the
significance of two other locational determinants, namely unit labour costs and export
flows. Among all determinants used (tariff discrimination, market size, market growth,
exports, interest rate and labour costs), the search for low labour costs (expressed by unit
labour cost and unit labour cost differential between host and investing country) did not
appear to have motivated US FDI in EEC. Similar results were obtained when running the
same model for EEC’s investments in the US. Regarding the locational determinants intra-
EEC, the coefficient of unit labour cost is significant and negative while the unit labour
cost differential appears to be significant and positive. Culem (1988: 900) explains this
paradox by the fact that “ceteris paribus, investors prefer low labour costs foreign
locations, although this does not motivate their FDI”.
30
Wheeler and Mody (1992) reached the conclusion that labour costs and infrastructure
quality are the most relevant coefficients for developing countries. They aimed to extend
the existing empirical work at that time by considering the agglomeration and the risk’s
influence along with classical location factors such as labour costs and market size. Using a
data set of forty-two countries for the period 1982-1988, they found labour costs (expressed
by average hourly wage in manufacturing) highly significant in the developing countries
and still having a high elasticity in the developed economies.
In the specific case of CEE, after the end of the Communist period, the gap in terms of
productivity and real wages between the former socialist and the developed countries was
high despite the location proximity. The low wages were supposed to create a high
incentive for Western economies to relocate their production and thus large FDI inflows to
enter CEE (Meyer, 1997). Despite the qualified workforce, the productivity is low and the
level of technical skills is not supported by “high managerial skills, nor entrepreneurial
culture or willingness to take business risks” (Meyer, 1997: 6).
The efficiency-seeking strategies of MNEs in CEE are explained in relevant literature
mainly in terms of wage costs (Resmini, 1999, Altomonte and Gugliano, 2001). The
question if labour costs have a considerable importance when choosing a location is still a
debate theme (Holland and Pain, 1998). In the analysed literature, labour costs are not
considered isolated but along with other variables. Resmini (1999) found that wage cost
differential between EU and CEECs is insignificant when choosing a FDI location,
inexpensive labour being an incentive for outward processing trade (OPT) and not for
investments. In CEE’ case the reasoning is supported by the fact that in the long run wage
differentials are going to become irrelevant. In the beginning of the 1990s, OPT drove
CEECs manufacturing, especially in traditional industries such as clothing and leather and
shoes (Lemoine, 1998). Cost-related considerations were important in the first phase of
transition. In the late 1990s, FDI accelerated and industries like machinery, automotive and
transport equipment gained importance. Compared to Asia, internationalisation based
exclusively on cost considerations “had much less importance for emerging exporters in
Europe than for a country such as China” (Lemoine, 1998: 159). The sectoral distribution
31
of FDI shows that comparative advantages of CEECs are in capital and natural resource-
intensive sectors and less in labour-intensive sectors.
Lansbury et al. (1996) in their attempt to test the FDI determinants in CEE and to
determine why Hungary and the Czech Republic attracted more FDI than Poland, used a
panel data set for fourteen separate OECD investing countries and three host economies for
the period 1991-1993. They suggested that relative labour cost is an important determinant
for location in Central European economies and revealed that relative labour costs are
important when making the distribution of FDI within CEEC.
In their survey, Lankes and Venables (1996) state that the wages of unskilled workers and
the presence of skilled workers have a significant effect upon the investors decision to
choose a certain location within Eastern Europe. They also suggest that productivity
differences can affect the location decision, except in the case of investors that intend to
bring new technologies with them.
Using a panel data, Bevan and Estrin (2000) state the contrary. They found that unit labour
cost is an important variable when choosing a location, the attraction consisting in labour
that is relatively inexpensive and productive. Positive evidence regarding the importance of
relative labour cost for FDI location is also found by Carstensen and Toubal (2004).
As can be observed, different findings characterise the influence of labour costs upon FDI
location in CEE. Most of the literature considers that low labour costs exert a negative
influence upon FDI. At the same time, it was proved that the industries with higher wages
and a higher wage growth attracted more FDI (Bedi and Cieslik, 2002) and even that labour
costs had a positive influence upon FDI. It was relevant for certain industries and for the
first phase of transition, but taking into consideration EU accession, on the long term its
importance is expected to be less relevant (Agarwal, 1997).
MNEs might have moved their production facilities or opened new subsidiaries due to low
labour costs in CEE compared to their home country, but it does not necessarily imply that
they have chosen among CEECs the location with lowest labour costs. If the FDI
motivation is mostly efficiency-driven a negative correlation shall exist between labour
costs and FDI.
32
Following the OLI framework, the location choice among CEECs could be explained by
the comparative advantage given by the cost of labour. In conclusion and despite the mixed
results in the empirical literature, we give currency to this theoretical expectation and we
advance the following hypothesis:
Hypothesis 2 Inward FDI is negatively influenced by labour costs.
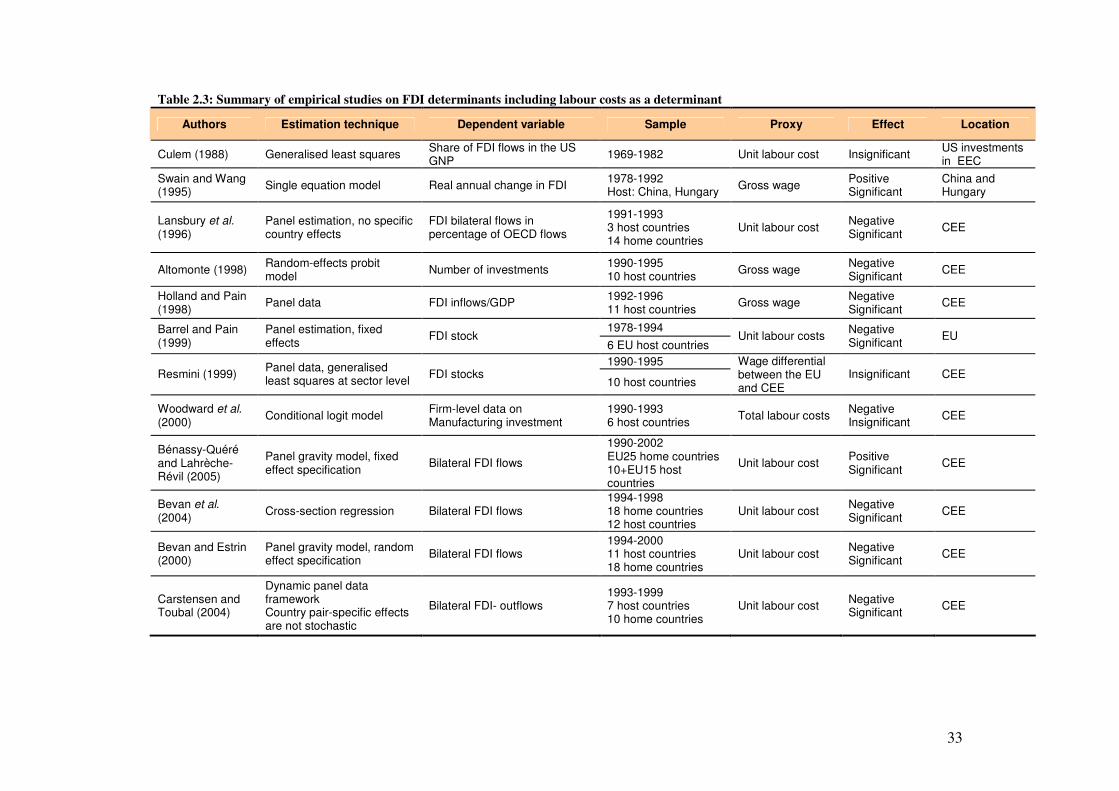
33
Table 2.3: Summary of empirical studies on FDI determinants including labour costs as a determinant
Authors Estimation technique Dependent variable Sample Proxy Effect Location
Culem (1988) Generalised least squares Share of FDI flows in the US GNP 1969-1982 Unit labour cost Insignificant US investments
in EEC Swain and Wang (1995) Single equation model Real annual change in FDI 1978-1992
Host: China, Hungary Gross wage Positive Significant
China and Hungary
Lansbury et al. (1996)
Panel estimation, no specific country effects
FDI bilateral flows in percentage of OECD flows
1991-1993 3 host countries 14 home countries
Unit labour cost Negative Significant CEE
Altomonte (1998) Random-effects probit model Number of investments 1990-1995
10 host countries Gross wage Negative Significant CEE
Holland and Pain (1998) Panel data FDI inflows/GDP 1992-1996
11 host countries Gross wage Negative Significant CEE
1978-1994 Barrel and Pain (1999)
Panel estimation, fixed effects FDI stock
6 EU host countries Unit labour costs Negative
Significant EU
1990-1995 Resmini (1999) Panel data, generalised
least squares at sector level FDI stocks 10 host countries
Wage differential between the EU and CEE
Insignificant CEE
Woodward et al. (2000) Conditional logit model Firm-level data on
Manufacturing investment 1990-1993 6 host countries Total labour costs Negative
Insignificant CEE
Bénassy-Quéré and Lahrèche-Révil (2005)
Panel gravity model, fixed effect specification Bilateral FDI flows
1990-2002 EU25 home countries 10+EU15 host countries
Unit labour cost Positive Significant CEE
Bevan et al. (2004) Cross-section regression Bilateral FDI flows
1994-1998 18 home countries 12 host countries
Unit labour cost Negative Significant CEE
Bevan and Estrin (2000)
Panel gravity model, random effect specification Bilateral FDI flows
1994-2000 11 host countries 18 home countries
Unit labour cost Negative Significant CEE
Carstensen and Toubal (2004)
Dynamic panel data framework Country pair-specific effects are not stochastic
Bilateral FDI- outflows 1993-1999 7 host countries 10 home countries
Unit labour cost Negative Significant CEE
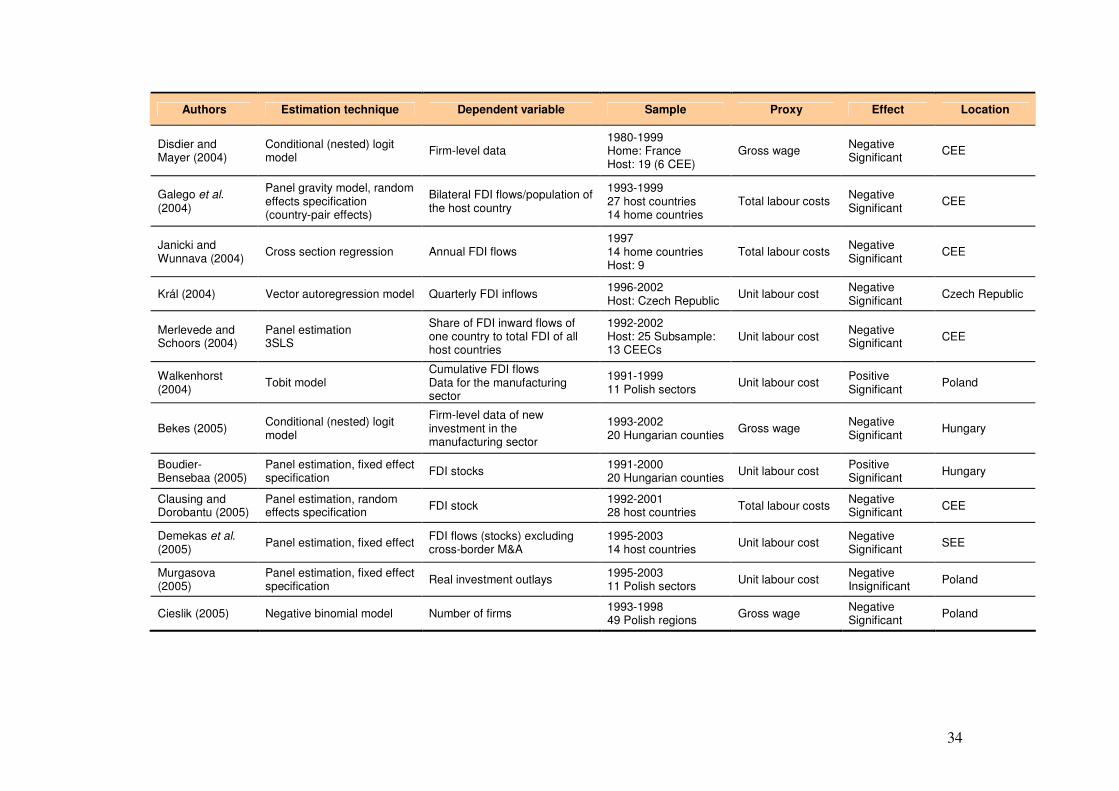
34
Authors Estimation technique Dependent variable Sample Proxy Effect Location
Disdier and Mayer (2004)
Conditional (nested) logit model Firm-level data
1980-1999 Home: France Host: 19 (6 CEE)
Gross wage Negative Significant CEE
Galego et al. (2004)
Panel gravity model, random effects specification (country-pair effects)
Bilateral FDI flows/population of the host country
1993-1999 27 host countries 14 home countries
Total labour costs Negative Significant CEE
Janicki and Wunnava (2004) Cross section regression Annual FDI flows
1997 14 home countries Host: 9
Total labour costs Negative Significant CEE
Král (2004) Vector autoregression model Quarterly FDI inflows 1996-2002 Host: Czech Republic Unit labour cost Negative
Significant Czech Republic
Merlevede and Schoors (2004)
Panel estimation 3SLS
Share of FDI inward flows of one country to total FDI of all host countries
1992-2002 Host: 25 Subsample: 13 CEECs
Unit labour cost Negative Significant CEE
Walkenhorst (2004) Tobit model
Cumulative FDI flows Data for the manufacturing sector
1991-1999 11 Polish sectors Unit labour cost Positive
Significant Poland
Bekes (2005) Conditional (nested) logit model
Firm-level data of new investment in the manufacturing sector
1993-2002 20 Hungarian counties Gross wage Negative
Significant Hungary
Boudier-Bensebaa (2005)
Panel estimation, fixed effect specification FDI stocks 1991-2000
20 Hungarian counties Unit labour cost Positive Significant Hungary
Clausing and Dorobantu (2005)
Panel estimation, random effects specification FDI stock 1992-2001
28 host countries Total labour costs Negative Significant CEE
Demekas et al. (2005) Panel estimation, fixed effect FDI flows (stocks) excluding
cross-border M&A 1995-2003 14 host countries Unit labour cost Negative
Significant SEE
Murgasova (2005)
Panel estimation, fixed effect specification Real investment outlays 1995-2003
11 Polish sectors Unit labour cost Negative Insignificant Poland
Cieslik (2005) Negative binomial model Number of firms 1993-1998 49 Polish regions Gross wage Negative
Significant Poland
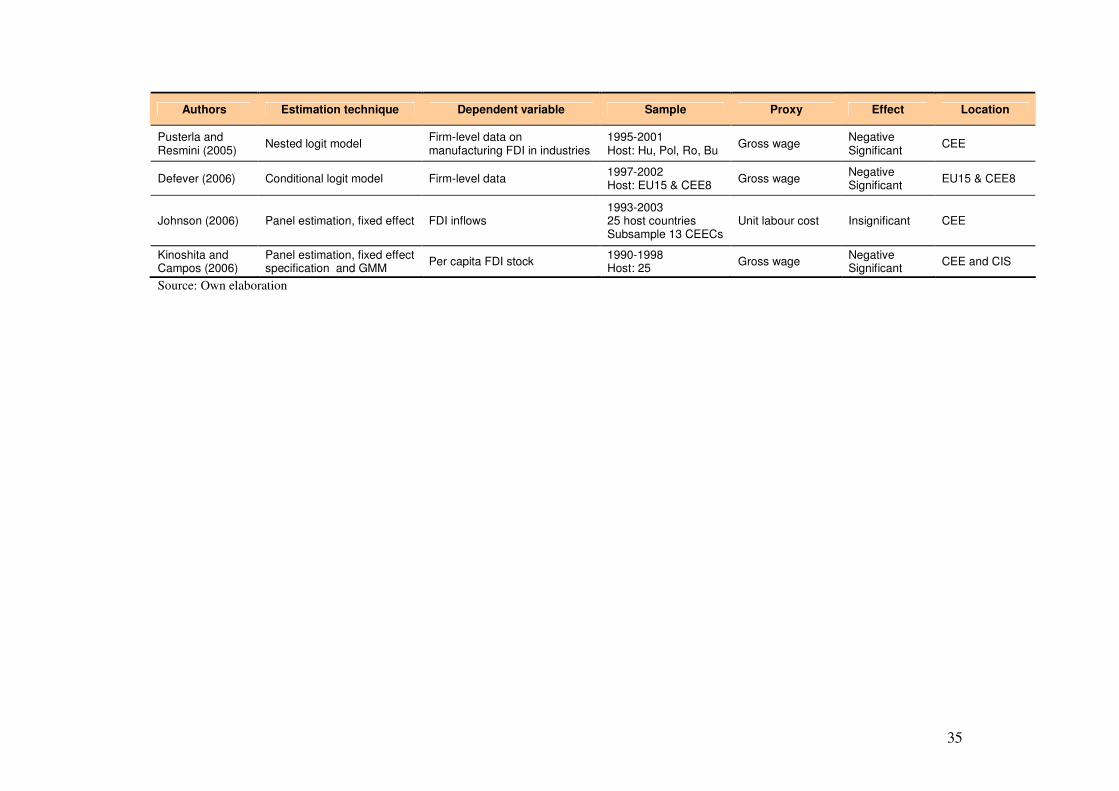
35
Authors Estimation technique Dependent variable Sample Proxy Effect Location
Pusterla and Resmini (2005) Nested logit model Firm-level data on
manufacturing FDI in industries 1995-2001 Host: Hu, Pol, Ro, Bu Gross wage Negative
Significant CEE
Defever (2006) Conditional logit model Firm-level data 1997-2002 Host: EU15 & CEE8 Gross wage Negative
Significant EU15 & CEE8
Johnson (2006) Panel estimation, fixed effect FDI inflows 1993-2003 25 host countries Subsample 13 CEECs
Unit labour cost Insignificant CEE
Kinoshita and Campos (2006)
Panel estimation, fixed effect specification and GMM Per capita FDI stock 1990-1998
Host: 25 Gross wage Negative Significant CEE and CIS
Source: Own elaboration
36
2.3 Trade openness There is a vast literature analysing the impact of trade on FDI (Culem, 1988; Jun and
Singh, 1996; Lansbury et al., 1996; Holland and Pain, 1998; Resmini, 1999; Pistoresi,
2000; Galego et al., 2004; Botri� and Šufli�, 2005; Aizenman and Noy, 2005 and Blonigen,
2005).
There are two views in what concerns the relation between FDI and trade. One considers
that horizontal FDI6 substitutes trade (Buckley and Casson, 1981; Markusen, 1984,
Horstman and Markusen, 1992). According to Buckley and Casson (1981) MNEs, in order
to avoid high fixed and transportation costs (when exporting) and trade barriers, prefer to
invest and substitute exports. Providing the same market with a direct sale from a
subsidiary, the above mentioned costs are lowered but the fixed costs involved increase.
Once the host market is large enough to obtain economies of scale, MNEs tend to progress
from exports to FDI (Blonigen, 2005). Such evidence was found for the Japanese
companies that entered the US market (Head et al., 1994; Blonigen, 2005).
The other view considers that FDI complements trade. Vertical FDI7 divides the production
process into stages and each stage is located in the country that has the best locational
attributes. Each plant exports the intermediate product to other plants; hence vertical FDI
complements trade (Helpman and Krugman, 1985).
However, the sourcing strategies and the integration strategies of multinationals became
more complex. MNEs invest sometimes in low-cost countries in order to establish export
platforms to supply other locations around the world.
In empirical research, openness to trade is often expressed as the ratio of trade (imports plus
exports) to GDP, by the import tariffs of the host country or by using dummy variables for
trade agreements. There is mixed evidence concerning the significance of trade openness as
a FDI determinant. Most studies confirm the hypothesis that FDI is more oriented to
tradable sectors, a country’s degree of openness to international trade being thus important
6 Horizontal FDI seeks to serve the host market. MNEs duplicate companies that already exist in the home country or other location. This type of investment replaces usually the exports or the licensing. (Uppenberg and Ries, 2004) 7 Vertical FDI consists of internalisation of a production chain within MNEs; different stages of production are located in different countries in function of the comparative advantage of each country. (Uppenberg and Ries, 2004)
37
(Culem, 1988; Jun and Singh, 1996; Lansbury et al., 1996; Holland and Pain, 1998;
Resmini, 1999; Pistoresi, 2000; Galego et al., 2004; Botri� and Šufli�, 2005). Schmitz and
Bieri (1972) found openness to be insignificant; in turn, Wheeler and Mody (1992) stated a
weak link for the electronics industry.
Chakrabarti (2001), while questioning the robustness of various FDI determinants,
concluded that the correlation between trade openness and FDI is robust to changes in the
conditioning information set. Singh and Jun (1995) stated that export orientation is one of
the strongest FDI determinants but at the same supported the tariff jumping hypothesis,
what seems to contradict their first conclusion.
In the context of CEECs, the literature analysed reveals a positive correlation between FDI
and trade openness. The main findings are summarised in Table 2.4.
Lansbury et al. (1996) – when studying the main motivations of fourteen OECD countries
to invest in three CEECs between 1991-1993- obtained evidence that investments are more
likely to originate from countries with strong existing trade linkages with CEECs. Also, the
authors consider that this would have implications upon the pattern of investment in the
region as the trade is progressively more oriented towards the EU.
The same idea is expressed by Fontagné (1999) that, in his empirical analyses reached the
conclusion that the cause-effect relationship appears to have been inverted; if before mid-
1980s openness to trade generated direct investment, there is evidence that direct
investment now generates trade. Jun and Singh (1996), when analysing FDI determinants in
39 countries between 1970-1993, found exports to be a significant determinant in ‘high FDI
countries’8 but less significant for ‘low FDI countries’; they performed also a causality test
between exports and FDI indicating that there is a dynamic relationship between them.
In the same line with Lansbury et al. (1996) in their panel data analysis of FDI
determinants in 11 CEECs detected that past trade linkages have a significant impact on the
level of inward investment.
Resmini (1999), in a sectoral analysis carried out for ten CEECs, found a positive
correlation between trade openness and FDI. She concluded that the European investors
8 Jun and Singh (1996) consider as high FDI countries China, Mexico, Portugal, Spain, Egypt, Greece, Malaysia, Thailand
38
Hypothesis 3 Inward FDI is positively influenced by openness to trade.
have been attracted by the possibility of reducing production costs, mostly labour costs
especially as they were intending to export.
Campos and Kinoshita (2002), in their attempt to test the most relevant indicators for
transition economies, used a panel data of twenty five countries for the period 1990-1998.
Their results showed that trade openness is an important attractor for the less developed of
the transition countries (CIS), but less relevant for the more developed ones.
Most findings indicate that investors prefer countries with liberal trade regimes, located
eventually in regions with national free-trade arrangements. Previous linkages with host
markets would help especially small and medium sized companies to take advantage of the
opportunities offered by a developing market structure (Bod, 1997; Holland and Pain,
1998). Part of the investments could be in marketing subsidiaries established to support
exports by parent companies (Lansbury, 1996; Lankes and Venables, 1996).
There are several reasons for which trade openness would help to attract FDI. Investors
know better the local markets if they had previously trade relations in that location.
Knowing better the local market increases the chances to take advantage of the investment
opportunities that appear; especially in a developing market where the information
asymmetry is bigger.
A country that has a higher degree of openness tends to be more competitive at an
international level, and might indicate the existence of a higher productivity, competitive
products and a more liberal trade regime.
Also, once “exports to a foreign market reach a certain threshold, foreign production costs,
trade barriers and especially scale economies at the plant level may be such that it is more
advantageous to supply the market from a local production unit” (Culem, 1988: 900).
Based on the literature review, and an own view regarding the theme the following
hypothesis is tested:
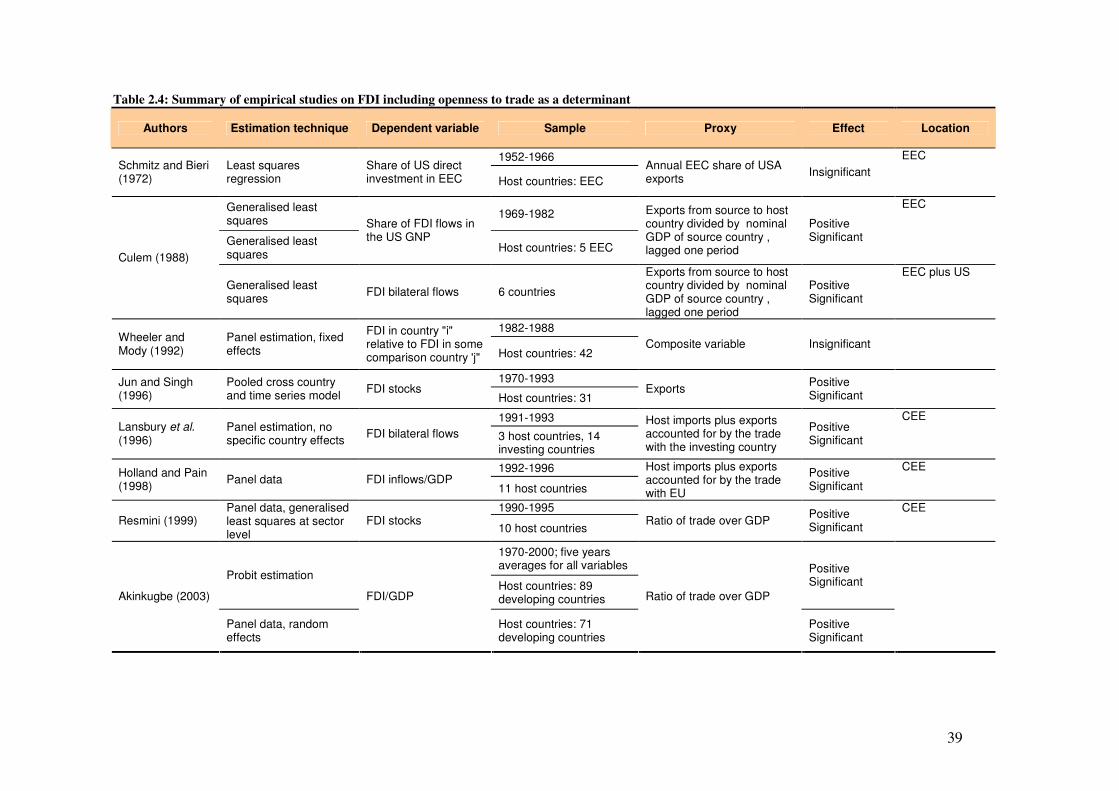
39
Table 2.4: Summary of empirical studies on FDI including openness to trade as a determinant
Authors Estimation technique Dependent variable Sample Proxy Effect Location
1952-1966 Schmitz and Bieri (1972)
Least squares regression
Share of US direct investment in EEC Host countries: EEC
Annual EEC share of USA exports Insignificant
EEC
Generalised least squares 1969-1982
Generalised least squares
Share of FDI flows in the US GNP
Host countries: 5 EEC
Exports from source to host country divided by nominal GDP of source country , lagged one period
Positive Significant
EEC
Culem (1988)
Generalised least squares FDI bilateral flows 6 countries
Exports from source to host country divided by nominal GDP of source country , lagged one period
Positive Significant
EEC plus US
1982-1988 Wheeler and Mody (1992)
Panel estimation, fixed effects
FDI in country "i" relative to FDI in some comparison country 'j" Host countries: 42
Composite variable Insignificant
1970-1993 Jun and Singh (1996)
Pooled cross country and time series model FDI stocks
Host countries: 31 Exports Positive
Significant
1991-1993 Lansbury et al. (1996)
Panel estimation, no specific country effects FDI bilateral flows 3 host countries, 14
investing countries
Host imports plus exports accounted for by the trade with the investing country
Positive Significant
CEE
1992-1996 Holland and Pain (1998) Panel data FDI inflows/GDP
11 host countries
Host imports plus exports accounted for by the trade with EU
Positive Significant
CEE
1990-1995 Resmini (1999)
Panel data, generalised least squares at sector level
FDI stocks 10 host countries
Ratio of trade over GDP Positive Significant
CEE
1970-2000; five years averages for all variables
Probit estimation Host countries: 89 developing countries
Positive Significant
Akinkugbe (2003)
Panel data, random effects
FDI/GDP
Host countries: 71 developing countries
Ratio of trade over GDP
Positive Significant
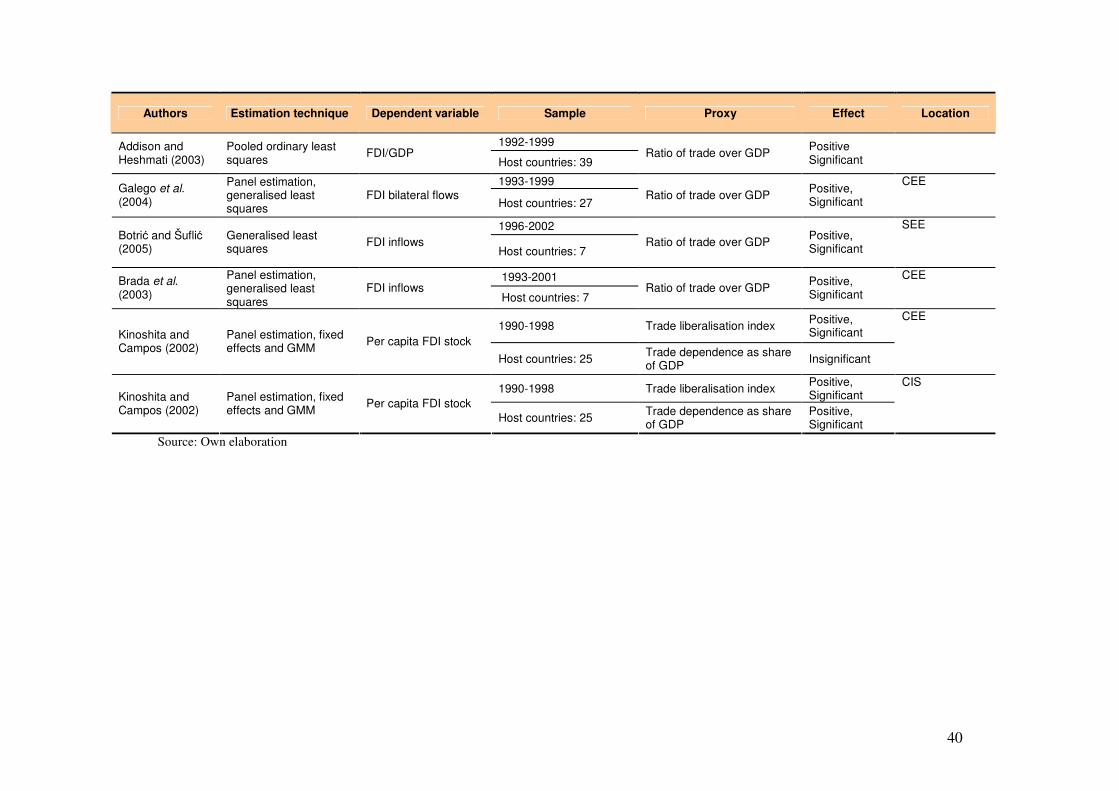
40
Authors Estimation technique Dependent variable Sample Proxy Effect Location
1992-1999 Addison and Heshmati (2003)
Pooled ordinary least squares FDI/GDP
Host countries: 39 Ratio of trade over GDP Positive
Significant
1993-1999 Galego et al. (2004)
Panel estimation, generalised least squares
FDI bilateral flows Host countries: 27
Ratio of trade over GDP Positive, Significant
CEE
1996-2002 Botri� and Šufli� (2005)
Generalised least squares FDI inflows
Host countries: 7 Ratio of trade over GDP Positive,
Significant
SEE
1993-2001 Brada et al. (2003)
Panel estimation, generalised least squares
FDI inflows Host countries: 7
Ratio of trade over GDP Positive, Significant
CEE
1990-1998 Trade liberalisation index Positive, Significant Kinoshita and
Campos (2002) Panel estimation, fixed effects and GMM Per capita FDI stock
Host countries: 25 Trade dependence as share of GDP Insignificant
CEE
1990-1998 Trade liberalisation index Positive, Significant Kinoshita and
Campos (2002) Panel estimation, fixed effects and GMM Per capita FDI stock
Host countries: 25 Trade dependence as share of GDP
Positive, Significant
CIS
Source: Own elaboration
41
2.4 Privatisation Privatisation is the transfer of ownership rights of state-owned enterprise to the private
sector representing the process through which the liberalisation of the market is made. It
was often argued that privatisation has a political dimension especially because it is
strongly related to the government credibility and its ability of influencing the investors’
willingness to pay (Bortolotti et al., 2003). However, extant literature provided evidence
that privatisation improves the financial and operating performance of the companies
(D’Souza and Megginson, 1999; Dewenter and Malatesta, 2001; Bortolotti et al, 2003).
Related to FDI, privatisation is a special case of acquisition and has two aspects: an FDI-
policy dimension and a competition-policy dimension. If privatisation welcomes foreign
investors, it broadens the scope of FDI (UNCTAD, 2003).
In the explored empirical studies that investigated the relation between privatisation and
FDI, privatisation was mainly analysed from three points of view: privatisation method,
privatisation timing and privatisation intensity.
The privatisation method (voucher, direct sales or management buy-out)9 reflects the
privatisation policy - the voucher and management buy-out schemes are considered to offer
fewer opportunities to foreign investors (Holland and Pain, 1998).
Privatisation intensity is measured by the proceeds from privatisation as a share of GDP.
The proceeds from privatisation cover all sales of public assets to private entities through
public offers, direct sales, management and employee buyouts, concessions or licensing
agreements, and joint ventures (World Bank, 2001).
Different countries applied large–scale privatisation programs, including developed
economies as France and the UK, as well as developing ones (Mexico, China, and Brazil).
9 Voucher privatisation or mass privatisation - occurs when a substantial portion of an economy’s public assets is transferred to a large group of private buyers. Usually, this is made through public distribution of shares to citizens, either for free or a minimum charge. (Estrin, 1996) Sale To Outside Owners or Direct sales is the transfer of ownership and control to private investors whose expertise ought to guarantee a successful performance of the firm in a competitive environment. (Estrin, 1996) Management Buy Out (MBO). When the managers and/or executives of a company purchase controlling interest in a company from existing shareholders. (Estrin, 1996)
42
For the last two decades, the most ambitious programs were carried out in the transition
economies of CEE.
One of the key determinants of the FDI level in CEECs that offers strong incentives for
location of strategic investments is privatisation (Lansbury, 1996; Holland and Pain, 1998).
Privatisation represented 60 percent of all FDI inflows to CEE during 1991-1993
(UNCTAD, 1995), a year later accounting for only 18 percent of them (UNCTAD, 1996).
The timing of the privatisation process and the privatisation form appeared to be the
primary determinants of the allocation of FDI in CEEC (Lansbury et al., 1996; Meyer,
1998; Lankes and Venables, 1996; Bevan and Estrin, 2000).
The method of privatisation was found by several studies to be a significant variable. Direct
privatisation through cash sales attracted higher inward investments than the one realised
through voucher schemes (Holland and Pain, 1998).
Holland and Pain (1998) run a panel date for the period 1992-1996 using data from ten
accession countries plus Croatia. They found the method of privatisation to be particularly
important with a positive sign signifying that the countries that applied the cash sales
method have attracted more inflows than the countries that used voucher privatisation (on
average in the first group of countries inflows of FDI relative to GDP are 1,74 percent
points higher than the inflows of countries that applied voucher method). The method of
privatisation appeared to be a more important FDI determinant than the private sector share,
another usual proxy.
Lansbury et al. (1996) used as a proxy for privatisation the private sector the share of GDP,
and found it statistically significant and positive for all CEECs analysed supporting the idea
that, in short term, the strength of investment in these economies is possible to strongly
depend on the privatisation programmes. Their results suggested also that the privatisation
timing is very important. Indeed, the Višegrad countries10, the first ones in the area that
implemented privatisation programmes, attracted larger amounts of FDI compared to the
other CEECs.
10 The Višegrad Group is and alliance of four countries (Czech Republic, Poland, Hungary and Slovakia) created in 1991 for the purpose and furthering their European integration (Source : http://visegradgroup.eu/main.php )
43
Privatisation is seen also as a component of the perceived risk of the host country.
Altomonte (1998) and Bevan and Estrin (2000) used the private sector share of the host
country to estimate country risk. Carstensen and Toubal (2004) considered the method and
level of privatisation closely correlated to the effectiveness of corporate governance.
Regarding the timing of privatisation, Lansbury et al. (1996) found that Višegrad countries,
where the timing of privatisation was rapidly made, attracted more FDI compared to other
CEECs.
Merlevede and Schoors (2004) after running a panel data for CEECs, reached the
conclusion that the relation between FDI and privatisation is more complex. They found
that non-direct methods of privatisation determined the locals to own the companies while
direct privatisation had an immediate positive effect.
Employing a dynamic panel data to determine the factors that attracted FDI to CEE,
Carstensen and Toubal (2004) concluded that the decision to invest in CEE relied heavily
on the level and method of privatisation. The low direct investments registered in Romania
and Bulgaria were justified by the inadequate privatisation laws that did not encourage
sales to outside owners. The same positive influence but with a lower correlation was found
by Bellak and Leibrecht (2005).
It may then be expected that privatisation has a positive influence on FDI flows. This
positive relation between FDI and privatisation revenues is grounded on several arguments
such as the fact that a higher degree of privatisation involves more investment
opportunities, offers the first-mover advantage, promotes competition, improves delivery of
public services and infrastructure and facilitates the transition to a market economy.
“A great part of FDI has been undertaken in the framework of privatisation of state-owned
enterprises (Lansbury et al. 1996) and hence there are fears that the growth of FDI in
Central Europe may slow as privatisation programmes run out of steam” (Agarwal, 1997:
100). These arguments lead us to posit the following hypothesis:
Hypothesis 4 Inward FDI is positively influenced by privatisation.
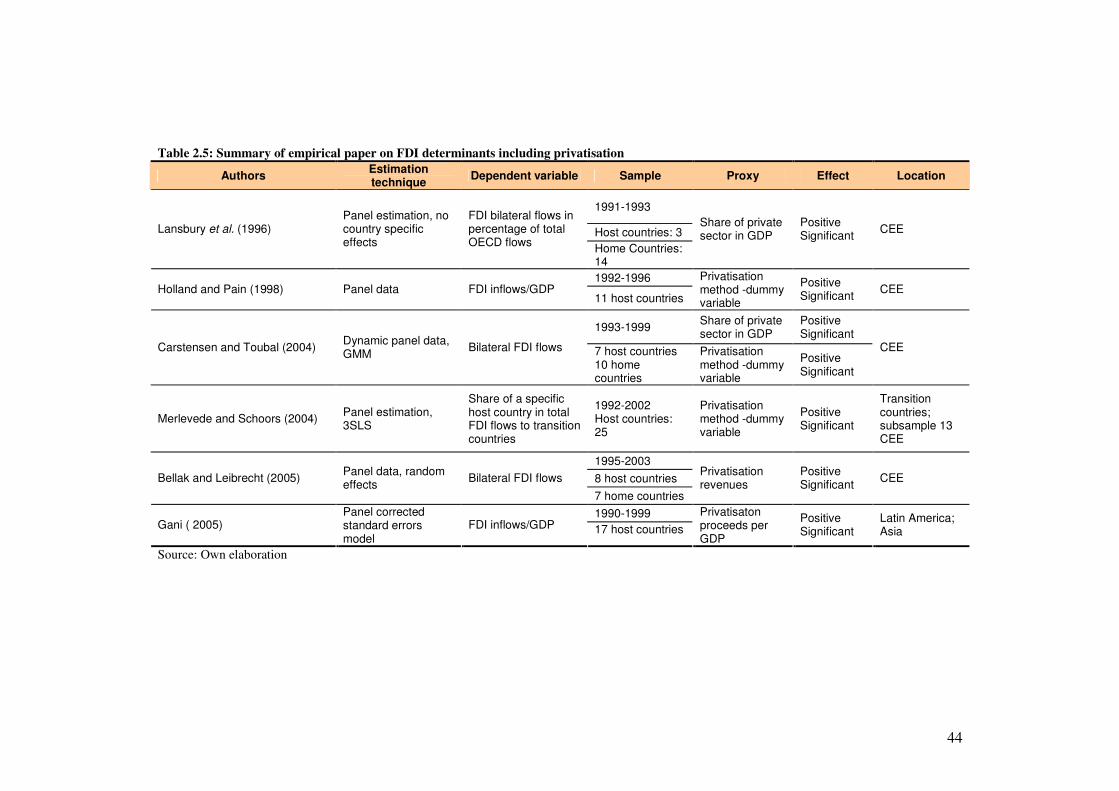
44
Table 2.5: Summary of empirical paper on FDI determinants including privatisation
Authors Estimation technique Dependent variable Sample Proxy Effect Location
1991-1993
Host countries: 3 Lansbury et al. (1996) Panel estimation, no country specific effects
FDI bilateral flows in percentage of total OECD flows Home Countries:
14
Share of private sector in GDP
Positive Significant CEE
1992-1996 Holland and Pain (1998) Panel data FDI inflows/GDP
11 host countries
Privatisation method -dummy variable
Positive Significant CEE
1993-1999 Share of private sector in GDP
Positive Significant
Carstensen and Toubal (2004) Dynamic panel data, GMM Bilateral FDI flows 7 host countries
10 home countries
Privatisation method -dummy variable
Positive Significant
CEE
Merlevede and Schoors (2004) Panel estimation, 3SLS
Share of a specific host country in total FDI flows to transition countries
1992-2002 Host countries: 25
Privatisation method -dummy variable
Positive Significant
Transition countries; subsample 13 CEE
1995-2003 8 host countries Bellak and Leibrecht (2005) Panel data, random
effects Bilateral FDI flows
7 home countries
Privatisation revenues
Positive Significant CEE
1990-1999 Gani ( 2005)
Panel corrected standard errors model
FDI inflows/GDP 17 host countries Privatisaton proceeds per GDP
Positive Significant
Latin America; Asia
Source: Own elaboration
45
2.5 Agglomeration indicators Recent literature on FDI (Barrell and Pain, 1999; Basile et al., 2003; Fujita and Krugman,
2004; Kinoshita and Campos, 2006) suggests that firms tend to localise in industrial
agglomerations. Agglomeration offers several benefits and among the most important are:
access to a more stable labour market, a better infrastructure, availability of intermediate
goods, production services, skilled labour and knowledge spillovers between adjoining
firms.
As explained in the first chapter, there are two types of agglomeration-related economies:
localisation economies (that appear within the same industry) and urbanisation economies
(that appear at the regional level). To analyse the effect of localisation economies upon
FDI, proxies as the number of plants in the same industry in the same region, number of
firms in the same region controlled by the same parent firm and R&D indicators were used
(Head et al. 1994a, 1994b, 1998; Basile et al., 2003 and Hilbert and Voicu, 2006).
The infrastructure determinants might indicate the existence of urban agglomerations;
among the proxies employed in the literature are density of roads, number of phones and
number of internet users per number of inhabitants and others (Wheeler and Mody, 1992;
Choi, 2002; Botri� and Šufli�, 2005; Kinoshita and Campos, 2006). A summary of the
papers consulted is presented in Table 2.6.
Head et al. (1994a), using data on Japanese investments in the US for the period 1979-1987
estimated the effects of four types of agglomeration variables on the location choice
(number of establishments in same 4-digit level SIC, number of plants operating in same 4-
digit level SIC in the year before investment began its activity, number of establishments in
same manufacturer-led keiretsu and the border state activity). They found that the Japanese
investment has a follow-the-leader pattern and that the location of the Japanese investments
is significantly influenced by the location of previous Japanese investments in the same
industry or keiretsu. In case the countries of origin effects are missing, it resulted that the
Japanese firms locate in regions where there are a relatively large number of US
establishments in the same area of activity. Furthermore, they suggest that neither natural
resources, nor specialised labour, drive location choice by themselves.
46
Agglomeration theory asserts that investment in interconnected industries is self-
reinforcing but there is no assumption concerning the location choice of the first investor.
Head et al. (1994b) carried on another study by using a different data set (1980–1992) and
new proxies (labour market conditions, proximity to markets, state investment-promotion
policies and agglomeration variables). This time they try to call attention to the impact of
state governments’ incentives upon location choices of Japanese investors in the United
States. They found that governmental promotion efforts influenced significantly the
Japanese investments from a location point of view. The variable with the most significant
impact was labour subsidies. The simulation led to another noteworthy result, by competing
and creating at least one foreign trade zone, the states diminished the advantage of one state
over another. They asserted that the inter-country competition might lead to a smaller
welfare compared to the one that could have been obtained in the absence of the
governmental promotional programs. Head et al. (1999) reinforced these ideas by using an
improved econometric model and introducing some new proxies for the same variables.
Wheeler and Mody (1992) confirmed the relevance of agglomeration for FDI location using
qualitative data (infrastructure quality). Barrell and Pain (1999) using an industry–level
panel data set (six EU countries from 1978 to 1994) obtained significant positive effect
from both agglomeration variables used. They reached the conclusion that labour costs are
not as important as they were once, particularly for companies that perform with high
technology. “Contiguity to major centres of production and research is now equally, if not
more, important” (p. 931).
The importance of agglomeration economies is confirmed also by Basile et al. (2003). They
modelled location choices as an outcome of profit maximization using a data set for 5761
plants located in eight EU countries. After testing the influence of overall agglomerations
(expressed by the log of the number of manufacturing plants in the same industry), foreign
firms’ agglomeration (expressed by the log number of foreign-owned firms within one
region and sector) and MNEs experience (expressed by log of number of firm in the same
region controlled by the same parent company), they concluded that the profit that a MNE
receives from a given region is positively correlated with the number of subsidiaries of the
same parent in the same region. Experience gained in a certain context increases MNEs
47
ability to obtain profit from that location and creates incentives to establish in the same
location.
Lansbury et al. (1996) when investigating the main FDI determinants in three CEECs,
obtained evidence that infrastructure has a positive influence upon FDI location even
though it was not one of the most influent determinants. Resmini (1999), in her analysis of
EU FDI flows into CEE at a sector level, found that an increase in the concentration of the
manufacturing sector reduces the FDI stocks. The negative reaction could be explained by a
large dispersion of the foreign economic activities in the region.
Disdier and Mayer (2003), in their attempt to determine whether the motivations of location
decisions by foreign investors in Eastern Europe are similar to those explaining the location
choice in Western Europe, use information about individual firm location choices over a set
of nineteen EU and CEE economies. The results revealed that the presence of
agglomeration effects influences positively the location decision of the French companies,
but these effects are less strong in CEE than in EU countries. A possible explanation
consisted in the existence of a stronger competition between the firms in CEE, fact that
generates a dispersion of economic activities.
Hilbert and Voicu (2006), applying a country level logit set-up for Romania, found that
among the most important location determinants are the external economies from industry
specific fixed assets, as well as endowment effects11. The simulation revealed that an
increase in the number of foreign plants in a certain industry and the increase in service
employment density determine an increase the location’s FDI attractiveness.
Using the model proposed by Cheng and Kwan (2000) for twenty-five transition economies
between 1990 and 1998, Campos and Kinoshita (2003) reached the conclusion that the
main determinants of FDI in transition are agglomeration, the degree of liberalisation and
the quality of the bureaucracy.
An important factor that might affect the concentration of economic activity is the existence
of modern infrastructure (Fujita and Thisse, 2002).
11 Endowment effects is a hypothesis that people value more what they have relative to what they do not have (Dalton, 2003) and in this specific case “represent an alternative mechanism through which localization can arise” (Hilbert and Voicu 2006: 5)
48
ICT (information and communication technology) is considered to be key determinant of
FDI (Gholami et al., 2005). Economies equipped with essential ICT infrastructure have
been moving towards an information-based economy that breaks some of the geographic
limitations. Internet penetration and other ICT indicators embody the infrastructure aspect
but at the same time they include an indication of skills and productivity, transfer of
technology and reduced transition costs. UNCTAD (2001) acknowledges that, although the
Internet penetration increases the mobility of MNEs, they have the tendency to concentrate
geographically because of agglomeration effects.
Choi (2003), using bilateral FDI data from 14 countries to 53 host countries, found that an
increase in the number of internet hosts or users determines an increase in the FDI inflows.
This author suggested that the progress of the Internet will contribute to the worldwide
increase in cross-border FDI.
Ko (2007) presented a two-stage game in order to demonstrate that positive/negative
network externalities (measured as the ratio of number of Internet users to the total
population) are associated with the Internet penetration encourage/discourage FDI. A
negative correlation between FDI and Internet penetration was found for the developing
countries and justified by the fact that the augment in Internet use increased MNEs’ costs.
In the case of developed countries were registered positive externalities were registered,
hence an increase in Internet use determined an increase in the FDI stocks.
Gholami et al. (2005) in their panel data estimation for 23 developed and developing
countries concluded that the availability of advanced infrastructure is an essential concern
in decisions on investment location for foreign investors. Their estimation results show a
positive relation between ICT and FDI, especially in the case of the new industrialised
countries as Singapore, South Africa, Malaysia and India.
Other authors found out that the lack of communication technology is an inhibiting factor
for economic growth in less developed countries (Matambalya and Wolf, 2001; Addison
and Heshmati, 2003).
Mody’s (1997) survey of international firms in Hong Kong, Singapore and Taiwan showed
that advanced infrastructure was one of the most important considerations for MNEs in
choosing the location of regional headquarters, services and sourcing operations.
49
The role of infrastructure and services in attracting foreign investments was illustrated by
various authors. It had driven the internationalisation processes of many service companies,
particularly in activities that imply a close relationship between supplier and client, on the
basis of a “follow-the-customer” model (Kindleberger, 1983; Mariotti and Piscitello, 1995).
Based on all the evidence reviewed and on the theoretical background (OLI paradigm –
location advantages, internalisation, and agglomeration) we posit the subsequent
hypothesis:
Hypothesis 5 Inward FDI is positively influenced by agglomeration.
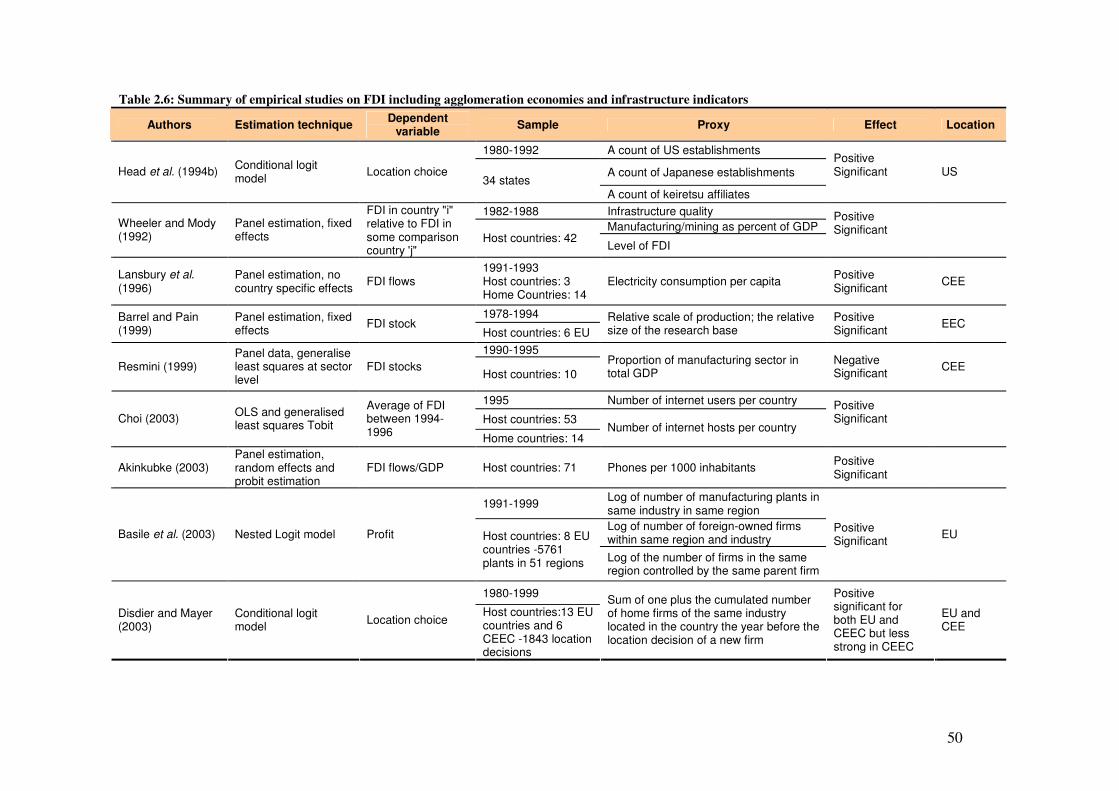
50
Table 2.6: Summary of empirical studies on FDI including agglomeration economies and infrastructure indicators
Authors Estimation technique Dependent variable Sample Proxy Effect Location
1980-1992 A count of US establishments
A count of Japanese establishments Head et al. (1994b) Conditional logit model Location choice
34 states A count of keiretsu affiliates
Positive Significant
US
1982-1988 Infrastructure quality Manufacturing/mining as percent of GDP Wheeler and Mody
(1992) Panel estimation, fixed effects
FDI in country "i" relative to FDI in some comparison country 'j"
Host countries: 42 Level of FDI
Positive Significant
Lansbury et al. (1996)
Panel estimation, no country specific effects FDI flows
1991-1993 Host countries: 3 Home Countries: 14
Electricity consumption per capita Positive Significant CEE
1978-1994 Barrel and Pain (1999)
Panel estimation, fixed effects FDI stock
Host countries: 6 EU Relative scale of production; the relative size of the research base
Positive Significant EEC
1990-1995 Resmini (1999)
Panel data, generalise least squares at sector level
FDI stocks Host countries: 10
Proportion of manufacturing sector in total GDP
Negative Significant CEE
1995 Number of internet users per country
Host countries: 53 Choi (2003) OLS and generalised least squares Tobit
Average of FDI between 1994-1996 Home countries: 14
Number of internet hosts per country
Positive Significant
Akinkubke (2003) Panel estimation, random effects and probit estimation
FDI flows/GDP Host countries: 71 Phones per 1000 inhabitants Positive Significant
1991-1999 Log of number of manufacturing plants in same industry in same region Log of number of foreign-owned firms within same region and industry Basile et al. (2003) Nested Logit model Profit Host countries: 8 EU
countries -5761 plants in 51 regions Log of the number of firms in the same
region controlled by the same parent firm
Positive Significant EU
1980-1999
Disdier and Mayer (2003)
Conditional logit model Location choice
Host countries:13 EU countries and 6 CEEC -1843 location decisions
Sum of one plus the cumulated number of home firms of the same industry located in the country the year before the location decision of a new firm
Positive significant for both EU and CEEC but less strong in CEEC
EU and CEE
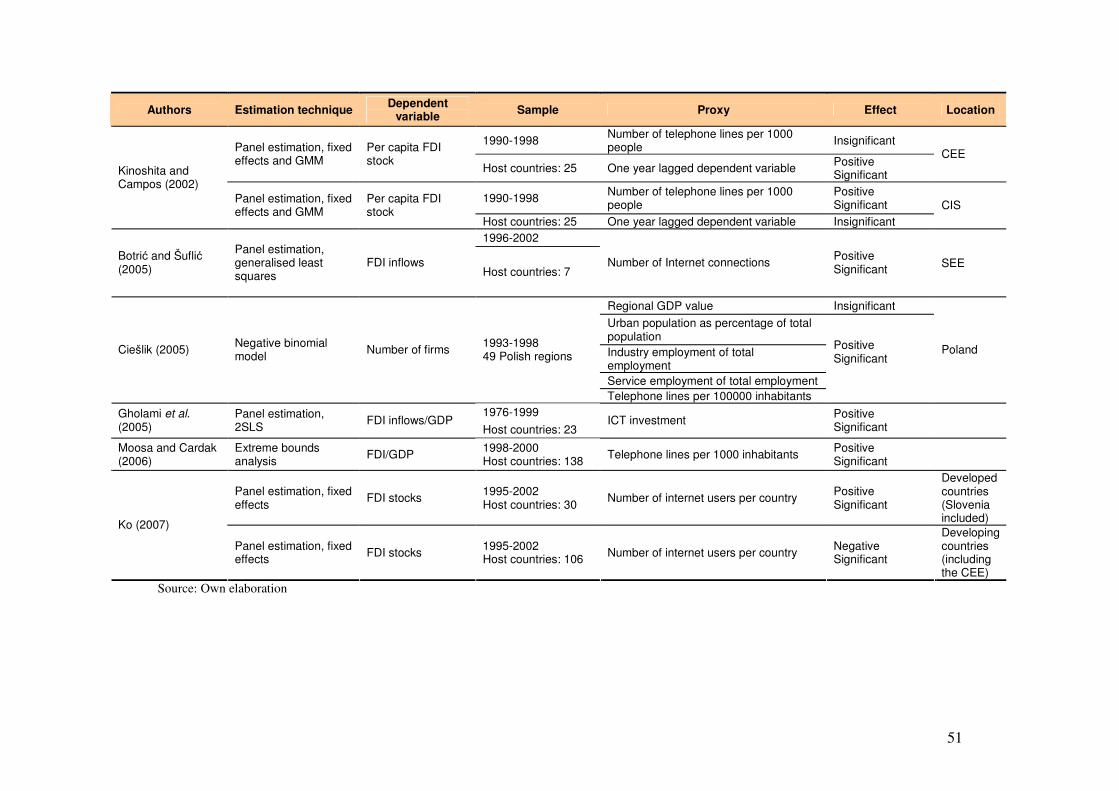
51
Authors Estimation technique Dependent variable Sample Proxy Effect Location
1990-1998 Number of telephone lines per 1000 people Insignificant Panel estimation, fixed
effects and GMM Per capita FDI stock
Host countries: 25 One year lagged dependent variable Positive Significant
CEE
1990-1998 Number of telephone lines per 1000 people
Positive Significant
Kinoshita and Campos (2002)
Panel estimation, fixed effects and GMM
Per capita FDI stock
Host countries: 25 One year lagged dependent variable Insignificant CIS
1996-2002 Botri� and Šufli� (2005)
Panel estimation, generalised least squares
FDI inflows Host countries: 7
Number of Internet connections Positive Significant
SEE
Regional GDP value Insignificant Urban population as percentage of total population Industry employment of total employment Service employment of total employment
Ciešlik (2005) Negative binomial model Number of firms 1993-1998
49 Polish regions
Telephone lines per 100000 inhabitants
Positive Significant
Poland
1976-1999 Gholami et al. (2005)
Panel estimation, 2SLS FDI inflows/GDP
Host countries: 23 ICT investment Positive
Significant
Moosa and Cardak (2006)
Extreme bounds analysis FDI/GDP 1998-2000
Host countries: 138 Telephone lines per 1000 inhabitants Positive Significant
Panel estimation, fixed effects FDI stocks 1995-2002
Host countries: 30 Number of internet users per country Positive Significant
Developed countries (Slovenia included) Ko (2007)
Panel estimation, fixed effects FDI stocks 1995-2002
Host countries: 106 Number of internet users per country Negative Significant
Developing countries (including the CEE)
Source: Own elaboration
52
3 Empirical investigation
3.1 Overview
This chapter is the empirical core of the dissertation and it presents the econometric
specification of the models used to test the hypotheses, the estimation strategy and a
potential explanation of the empirical results obtained. The main objective is to test
which factors affected FDI location in CEE. In the previous chapters, by reviewing the
theoretical and empirical background of FDI location determinants, the potential
motivations for investing in CEECs were brought into attention. This section presents
the proxies for the variables described in Chapter 2 and assigns their expected sign
based on the previously discussed hypotheses. In order to test the impact of the selected
variables (market, labour costs, privatisation, degree of openness, infrastructure and
industrial concentration), a random effects model is employed to an unbalanced panel of
relevant data.
3.2 Data and empirical context The determinants underlying FDI location decisions can be analysed using firm-level or
macro data. Typically there are two approaches: the first approach implies the
regression of the probability of locating the investment in a specific location based on
different location-specific determinants this involving the use of firm-level data; the
second approach uses the amount of FDI as a dependent variable, and a more macro-
based analysis is made. The choice between the two approaches is conditioned by data
availability, as well as by the specific aims of the research.
Most empirical studies run the analysis at an aggregate level, even if different authors
suggest that not all questions regarding the FDI location can be answered on the basis of
aggregate data (Buch et al., 2004; Resmini, 1999).
The goal of this dissertation is to test some of the factors that led multinationals to
choose Central and Eastern Europe as a location for their investments. The research is
based on data for ten host countries over a period of twelve years. As no published firm-
level datasets are available and as the multiple country setting made not viable a survey,
macro-level data is used.
53
The choice of host countries (Bulgaria, Czech Republic, Estonia, Hungary, Latvia,
Lithuania, Poland, Romania, Slovakia and Slovenia) was determined by the amount of
FDI stocks accumulated after 1989, by the market size as well as by the availability of
data. Intentionally, Russia and other satellite states of the Former Soviet Union were
excluded as their situation represents special cases that require detailed country-specific
explanations. Most econometric studies analysed the Višegrad economies. This study
includes more distant markets that should separate any effects determined by very close
proximity to the European Union.
The time period considered is restricted by the research objective as well as by the data
availability. FDI location in CEE after the fall of the Iron Curtain (1989) is analysed.
Among the countries used in the study are the Czech Republic and Slovakia, that
appeared in 1993, when Czechoslovakia split into the two states. Hence, available data
for the two countries may be found only from 1993.
3.2.1 Proxies for the relevant variables
3.2.1.1 Dependent variable Inward FDI stock The present study uses inward FDI stock (expressed in millions of US dollars) as a
dependent variable for the ten transition countries considered for the years 1993 to
2004.
FDI measures used in the relevant literature are mainly FDI flows and FDI stocks. In
the absence of direct measures, international production (defined as production under
foreign ownership) is more appropriately measured at national level by outward and
inward FDI stocks (Bellak and Cantwell, 2004).
FDI stocks are calculated by considering the accumulated flows taken from the annual
balance of payments (annual differences in stocks equals the flows) or represent book
values (annual flows from the balance of payments may be larger or smaller than
differences in annual stocks) (Bellak et al., 2006; Eurostat, 2006).
FDI stock is the value of the share of capital and reserves (including retained profits)
attributable to the parent enterprise, plus the net indebtedness of affiliates to the parent
enterprise (UNCTAD, 2006). Data on FDI stocks is presented at book value or
historical cost, the latter reflecting prices at the time when the investment was made.
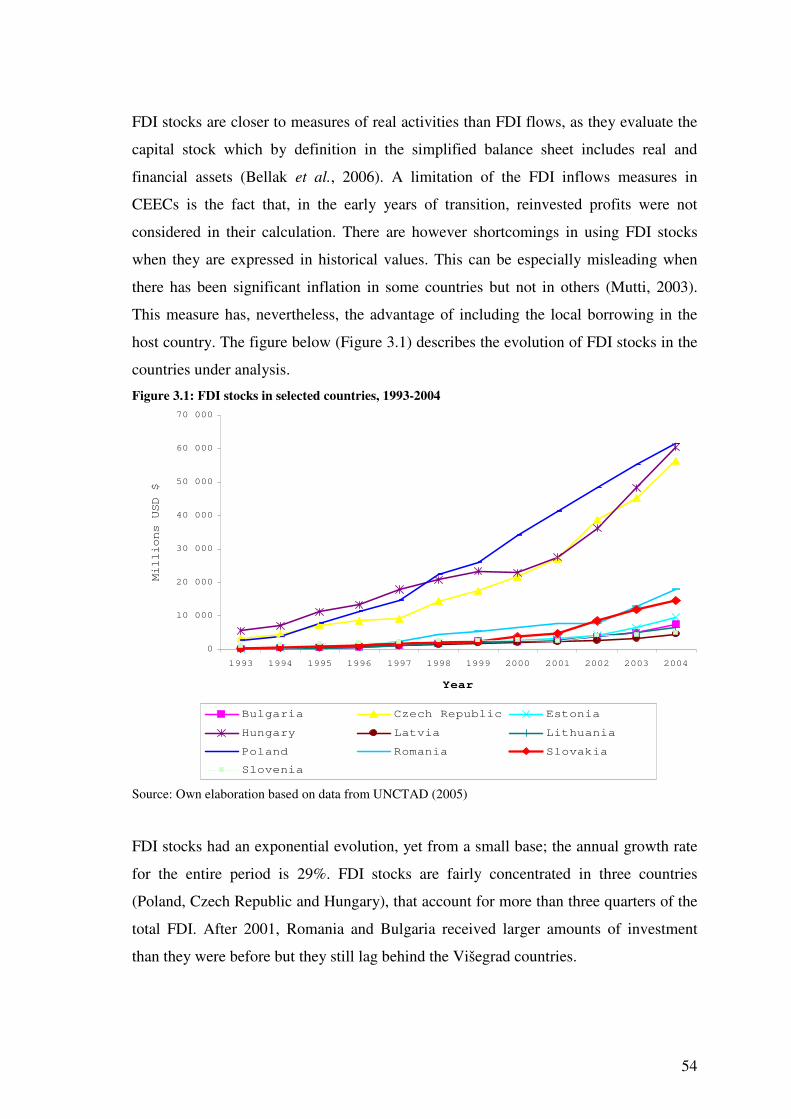
54
FDI stocks are closer to measures of real activities than FDI flows, as they evaluate the
capital stock which by definition in the simplified balance sheet includes real and
financial assets (Bellak et al., 2006). A limitation of the FDI inflows measures in
CEECs is the fact that, in the early years of transition, reinvested profits were not
considered in their calculation. There are however shortcomings in using FDI stocks
when they are expressed in historical values. This can be especially misleading when
there has been significant inflation in some countries but not in others (Mutti, 2003).
This measure has, nevertheless, the advantage of including the local borrowing in the
host country. The figure below (Figure 3.1) describes the evolution of FDI stocks in the
countries under analysis.
Figure 3.1: FDI stocks in selected countries, 1993-2004
0
10 000
20 000
30 000
40 000
50 000
60 000
70 000
1993 1994 1995 1996 1997 1998 1999 2000 2001 2002 2003 2004
Year
Millions USD $
Bulgaria Czech Republic Estonia
Hungary Latvia Lithuania
Poland Romania Slovakia
Slovenia
Source: Own elaboration based on data from UNCTAD (2005)
FDI stocks had an exponential evolution, yet from a small base; the annual growth rate
for the entire period is 29%. FDI stocks are fairly concentrated in three countries
(Poland, Czech Republic and Hungary), that account for more than three quarters of the
total FDI. After 2001, Romania and Bulgaria received larger amounts of investment
than they were before but they still lag behind the Višegrad countries.
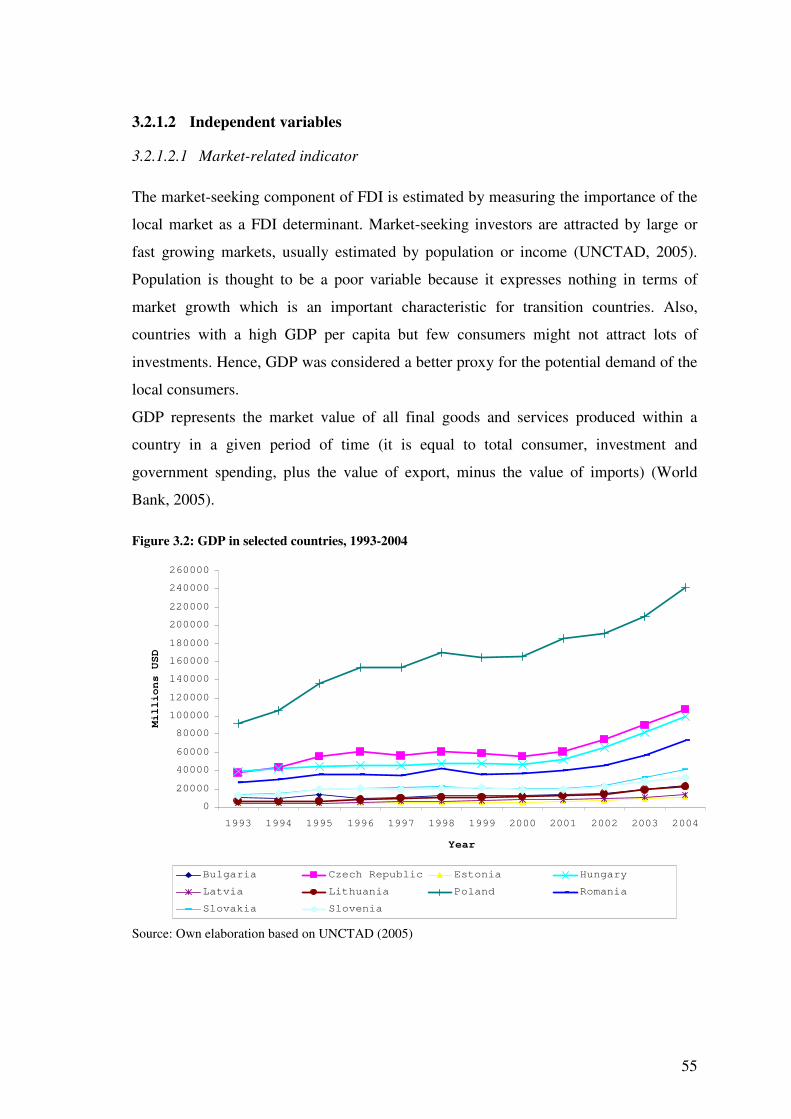
55
3.2.1.2 Independent variables
3.2.1.2.1 Market-related indicator The market-seeking component of FDI is estimated by measuring the importance of the
local market as a FDI determinant. Market-seeking investors are attracted by large or
fast growing markets, usually estimated by population or income (UNCTAD, 2005).
Population is thought to be a poor variable because it expresses nothing in terms of
market growth which is an important characteristic for transition countries. Also,
countries with a high GDP per capita but few consumers might not attract lots of
investments. Hence, GDP was considered a better proxy for the potential demand of the
local consumers.
GDP represents the market value of all final goods and services produced within a
country in a given period of time (it is equal to total consumer, investment and
government spending, plus the value of export, minus the value of imports) (World
Bank, 2005).
Figure 3.2: GDP in selected countries, 1993-2004
0
20000
40000
60000
80000
100000
120000
140000
160000
180000
200000
220000
240000
260000
1993 1994 1995 1996 1997 1998 1999 2000 2001 2002 2003 2004
Year
Millions USD
Bulgaria Czech Republic Estonia Hungary
Latvia Lithuania Poland Romania
Slovakia Slovenia
Source: Own elaboration based on UNCTAD (2005)
56
Generally, CEECs registered an increase in GDP. Figure 3.2 indicates that Poland,
Czech Republic, Hungary and Romania registered the highest volumes of GDP. Poland,
despite a slowdown in the early 2000’s, had one of the largest growths since the
beginning of the transition period. The high GDP level in Poland is also justified by the
fact that it is the largest market in CEEC. Romania, even if it is the second largest one,
does not exceed the GDP level registered by Czech Republic and Hungary. The GDP in
Slovenia and Slovakia had an exponential evolution, it underwent a short slump in the
beginning of 2000 but recovered subsequently. Estonia, Lithuania and Latvia have the
lowest GDP but they are also the smallest countries in the region.
3.2.1.2.2 Efficiency related indicator – labour costs The cost of labour has a potential major effect upon the location decision, especially for
multinationals that are looking to produce labour intensive goods and then export.
Based on the reviewed literature on Chapter 2 (Holland and Pain, 1998; Altomonte,
1998; Bevan and Estrin, 2000; Bevan et al., 2004; Carstensen and Toubal, 2004;
Leibrecht and Bellak, 2005 and Kinoshita and Campos, 2006) lower labour costs seem
to matter. However, it is important to relate them to productivity (Bellak et al., 2007).
Lower labour costs usually mean lower productivity (Faucompret et al., 1998).
Different studies have shown that productivity in CEE is considerably inferior than that
registered in Western Europe. Faucompret et al. (1998) made a survey among Belgian
companies that located their production in CEEC and showed that 73% of them find
productivity lower or much lower in that region when compared to the home country.
An European project (RTD, 2007)12 reveals significant productivity gaps between the
EU-15 and CEE. Given such differences in productivity, total labour costs are thus not
the most satisfactory measure for labour costs when analysing the investment decision
in CEE. Hence, an adequate measure of labour costs shall capture labour productivity as
well.
Following Leibrecht and Bellak (2005), unit labour costs are used as a proxy. Due to
lack of data, it was not possible to compute the real unit labour costs that the mentioned
authors considered in their panel, but the nominal indicator. The unit labour costs (ulc)
are calculated through the following ratio: 12 CEEC Productivity Gap Determinants Database, http://www.iwh-halle.de/projects/productivity-gap/field_work/Field_work.htm accessed on 26/08/2007.
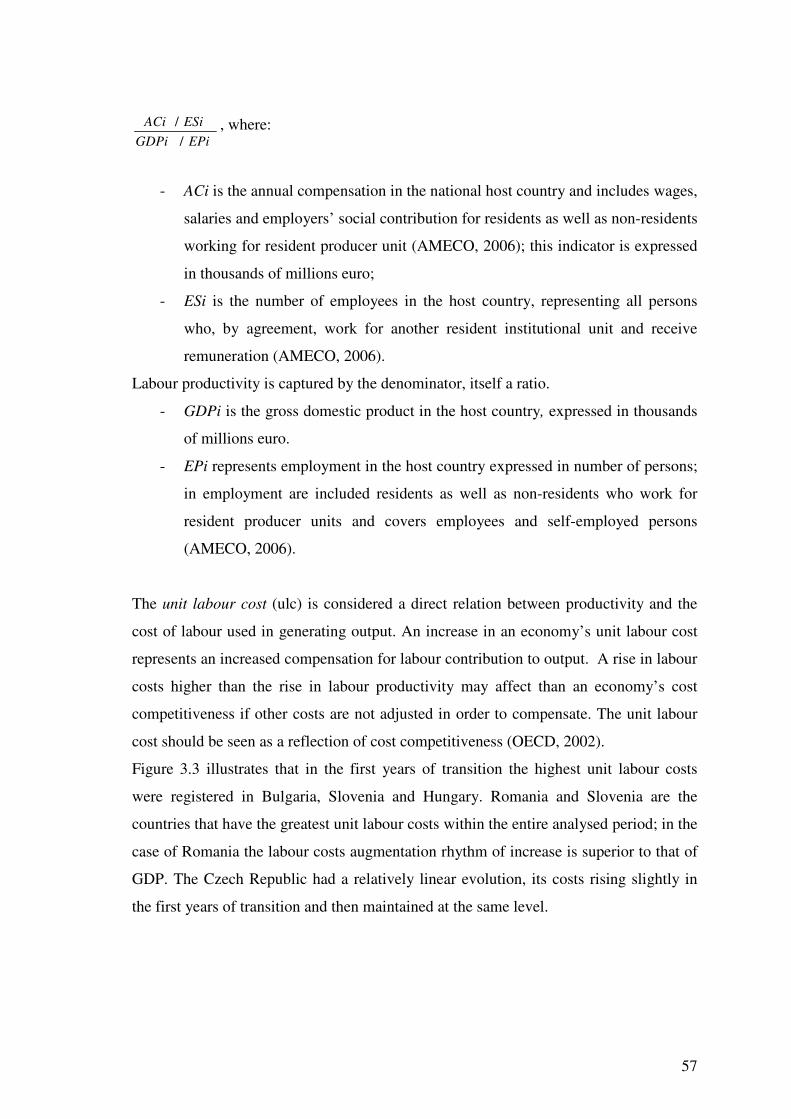
57
EPiGDPiESiACi
// , where:
- ACi is the annual compensation in the national host country and includes wages,
salaries and employers’ social contribution for residents as well as non-residents
working for resident producer unit (AMECO, 2006); this indicator is expressed
in thousands of millions euro;
- ESi is the number of employees in the host country, representing all persons
who, by agreement, work for another resident institutional unit and receive
remuneration (AMECO, 2006).
Labour productivity is captured by the denominator, itself a ratio.
- GDPi is the gross domestic product in the host country, expressed in thousands
of millions euro.
- EPi represents employment in the host country expressed in number of persons;
in employment are included residents as well as non-residents who work for
resident producer units and covers employees and self-employed persons
(AMECO, 2006).
The unit labour cost (ulc) is considered a direct relation between productivity and the
cost of labour used in generating output. An increase in an economy’s unit labour cost
represents an increased compensation for labour contribution to output. A rise in labour
costs higher than the rise in labour productivity may affect than an economy’s cost
competitiveness if other costs are not adjusted in order to compensate. The unit labour
cost should be seen as a reflection of cost competitiveness (OECD, 2002).
Figure 3.3 illustrates that in the first years of transition the highest unit labour costs
were registered in Bulgaria, Slovenia and Hungary. Romania and Slovenia are the
countries that have the greatest unit labour costs within the entire analysed period; in the
case of Romania the labour costs augmentation rhythm of increase is superior to that of
GDP. The Czech Republic had a relatively linear evolution, its costs rising slightly in
the first years of transition and then maintained at the same level.
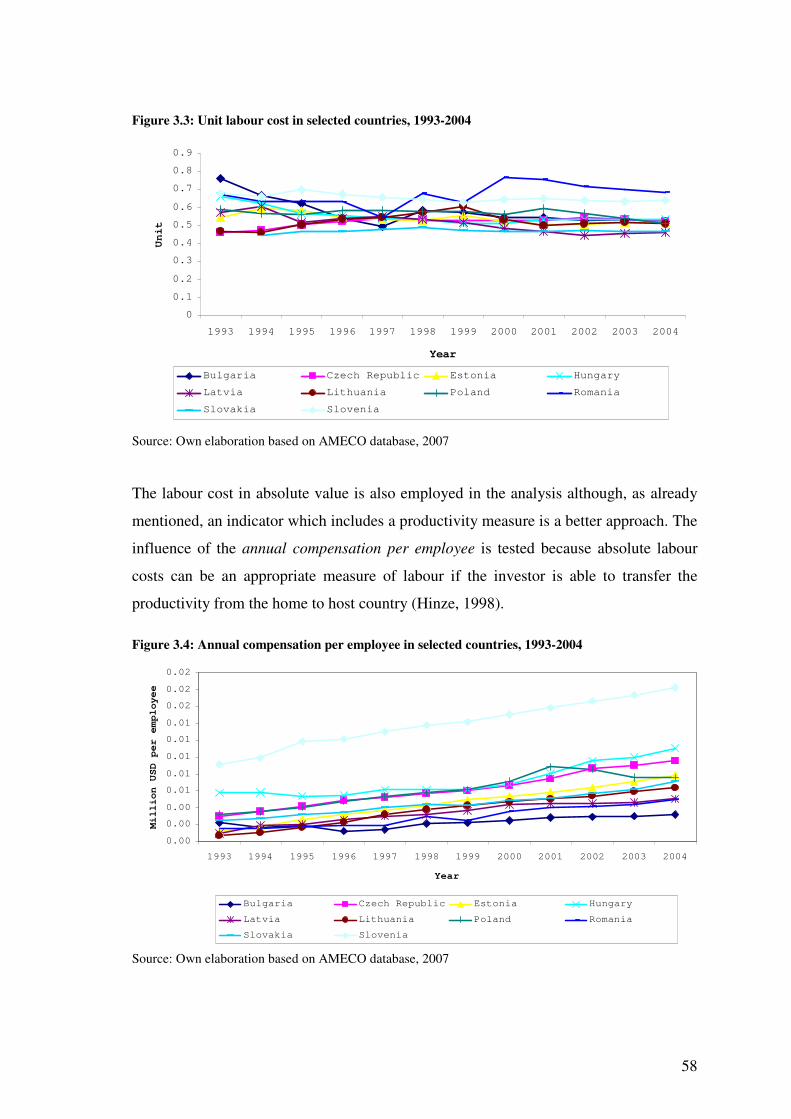
58
Figure 3.3: Unit labour cost in selected countries, 1993-2004
0
0.1
0.2
0.3
0.4
0.5
0.6
0.7
0.8
0.9
1993 1994 1995 1996 1997 1998 1999 2000 2001 2002 2003 2004
Year
Unit
Bulgaria Czech Republic Estonia Hungary
Latvia Lithuania Poland Romania
Slovakia Slovenia
Source: Own elaboration based on AMECO database, 2007
The labour cost in absolute value is also employed in the analysis although, as already
mentioned, an indicator which includes a productivity measure is a better approach. The
influence of the annual compensation per employee is tested because absolute labour
costs can be an appropriate measure of labour if the investor is able to transfer the
productivity from the home to host country (Hinze, 1998).
Figure 3.4: Annual compensation per employee in selected countries, 1993-2004
0.00
0.00
0.00
0.01
0.01
0.01
0.01
0.01
0.02
0.02
0.02
1993 1994 1995 1996 1997 1998 1999 2000 2001 2002 2003 2004
Year
Million USD per employee
Bulgaria Czech Republic Estonia Hungary
Latvia Lithuania Poland Romania
Slovakia Slovenia
Source: Own elaboration based on AMECO database, 2007
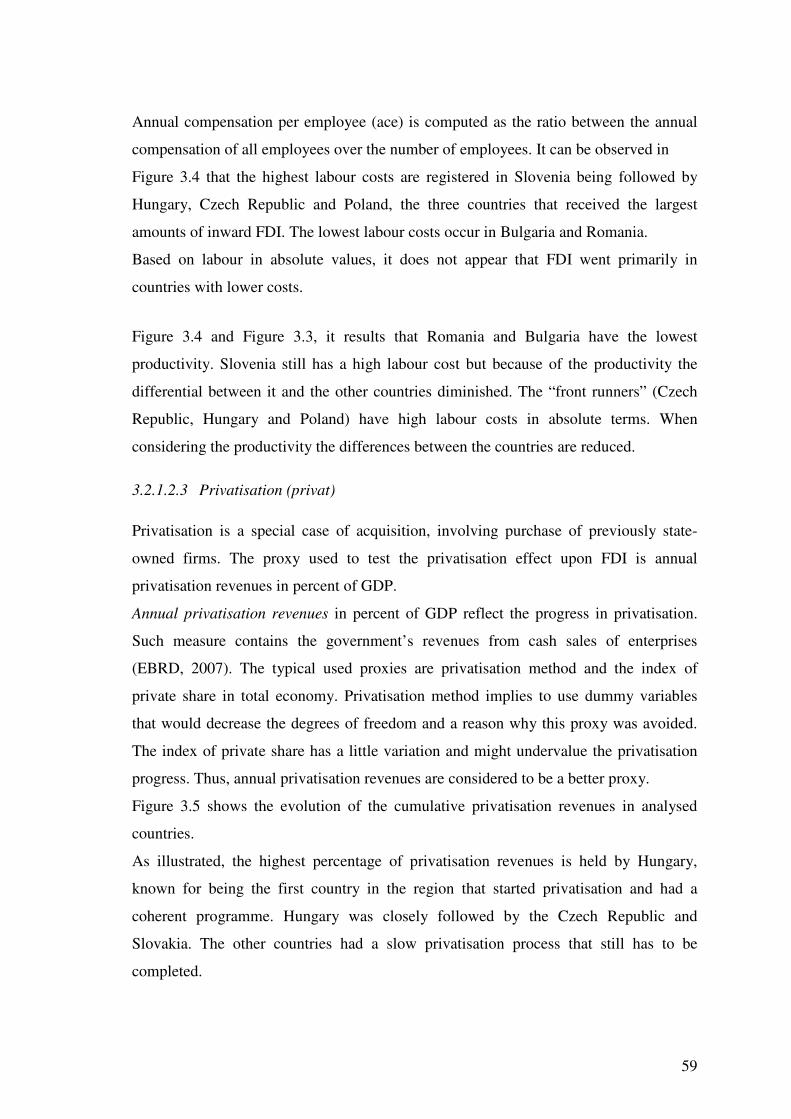
59
Annual compensation per employee (ace) is computed as the ratio between the annual
compensation of all employees over the number of employees. It can be observed in
Figure 3.4 that the highest labour costs are registered in Slovenia being followed by
Hungary, Czech Republic and Poland, the three countries that received the largest
amounts of inward FDI. The lowest labour costs occur in Bulgaria and Romania.
Based on labour in absolute values, it does not appear that FDI went primarily in
countries with lower costs.
Figure 3.4 and Figure 3.3, it results that Romania and Bulgaria have the lowest
productivity. Slovenia still has a high labour cost but because of the productivity the
differential between it and the other countries diminished. The “front runners” (Czech
Republic, Hungary and Poland) have high labour costs in absolute terms. When
considering the productivity the differences between the countries are reduced.
3.2.1.2.3 Privatisation (privat) Privatisation is a special case of acquisition, involving purchase of previously state-
owned firms. The proxy used to test the privatisation effect upon FDI is annual
privatisation revenues in percent of GDP.
Annual privatisation revenues in percent of GDP reflect the progress in privatisation.
Such measure contains the government’s revenues from cash sales of enterprises
(EBRD, 2007). The typical used proxies are privatisation method and the index of
private share in total economy. Privatisation method implies to use dummy variables
that would decrease the degrees of freedom and a reason why this proxy was avoided.
The index of private share has a little variation and might undervalue the privatisation
progress. Thus, annual privatisation revenues are considered to be a better proxy.
Figure 3.5 shows the evolution of the cumulative privatisation revenues in analysed
countries.
As illustrated, the highest percentage of privatisation revenues is held by Hungary,
known for being the first country in the region that started privatisation and had a
coherent programme. Hungary was closely followed by the Czech Republic and
Slovakia. The other countries had a slow privatisation process that still has to be
completed.
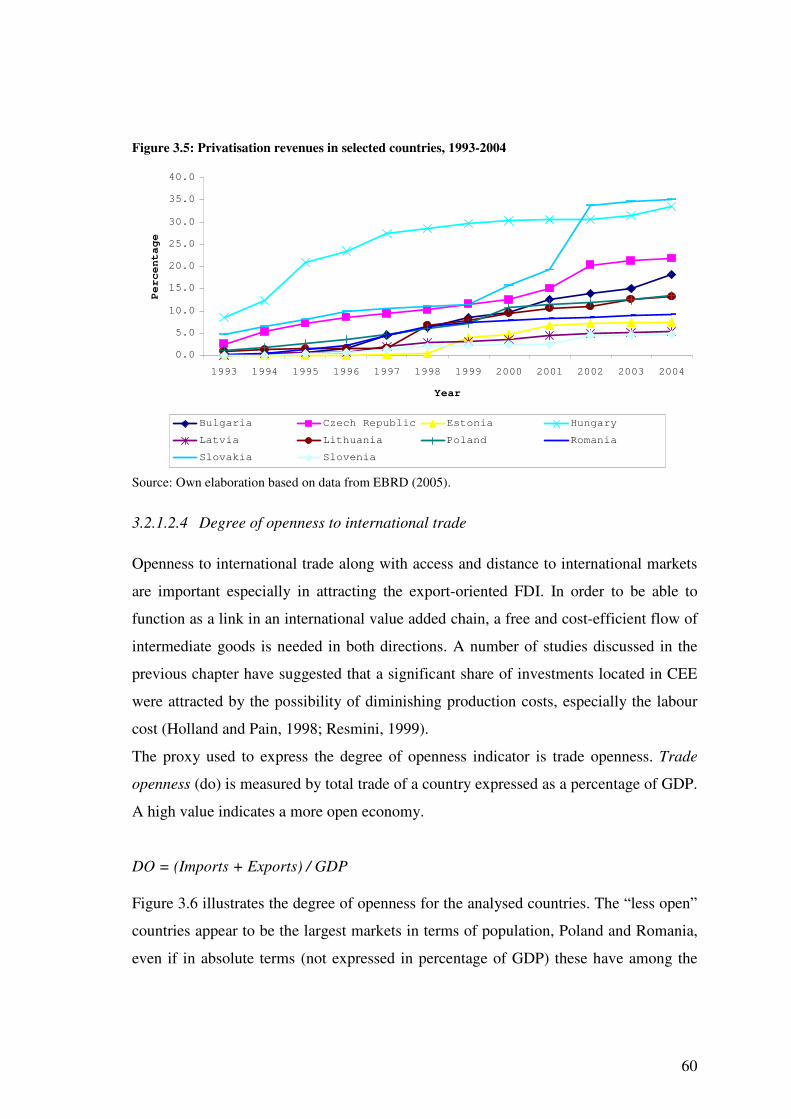
60
Figure 3.5: Privatisation revenues in selected countries, 1993-2004
0.0
5.0
10.0
15.0
20.0
25.0
30.0
35.0
40.0
1993 1994 1995 1996 1997 1998 1999 2000 2001 2002 2003 2004
Year
Percentage
Bulgaria Czech Republic Estonia Hungary
Latvia Lithuania Poland Romania
Slovakia Slovenia
Source: Own elaboration based on data from EBRD (2005).
3.2.1.2.4 Degree of openness to international trade Openness to international trade along with access and distance to international markets
are important especially in attracting the export-oriented FDI. In order to be able to
function as a link in an international value added chain, a free and cost-efficient flow of
intermediate goods is needed in both directions. A number of studies discussed in the
previous chapter have suggested that a significant share of investments located in CEE
were attracted by the possibility of diminishing production costs, especially the labour
cost (Holland and Pain, 1998; Resmini, 1999).
The proxy used to express the degree of openness indicator is trade openness. Trade
openness (do) is measured by total trade of a country expressed as a percentage of GDP.
A high value indicates a more open economy.
DO = (Imports + Exports) / GDP Figure 3.6 illustrates the degree of openness for the analysed countries. The “less open”
countries appear to be the largest markets in terms of population, Poland and Romania,
even if in absolute terms (not expressed in percentage of GDP) these have among the
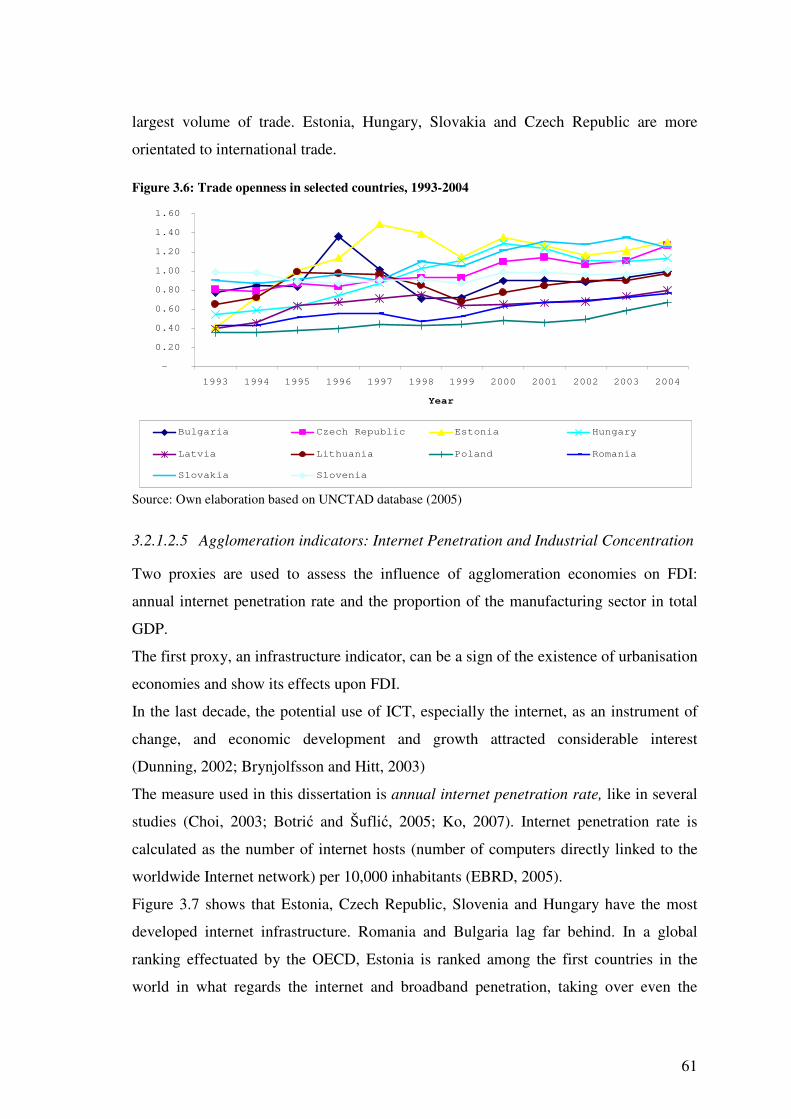
61
largest volume of trade. Estonia, Hungary, Slovakia and Czech Republic are more
orientated to international trade. Figure 3.6: Trade openness in selected countries, 1993-2004
-
0.20
0.40
0.60
0.80
1.00
1.20
1.40
1.60
1993 1994 1995 1996 1997 1998 1999 2000 2001 2002 2003 2004
Year
Bulgaria Czech Republic Estonia Hungary
Latvia Lithuania Poland Romania
Slovakia Slovenia
Source: Own elaboration based on UNCTAD database (2005)
3.2.1.2.5 Agglomeration indicators: Internet Penetration and Industrial Concentration
Two proxies are used to assess the influence of agglomeration economies on FDI:
annual internet penetration rate and the proportion of the manufacturing sector in total
GDP.
The first proxy, an infrastructure indicator, can be a sign of the existence of urbanisation
economies and show its effects upon FDI.
In the last decade, the potential use of ICT, especially the internet, as an instrument of
change, and economic development and growth attracted considerable interest
(Dunning, 2002; Brynjolfsson and Hitt, 2003)
The measure used in this dissertation is annual internet penetration rate, like in several
studies (Choi, 2003; Botri� and Šufli�, 2005; Ko, 2007). Internet penetration rate is
calculated as the number of internet hosts (number of computers directly linked to the
worldwide Internet network) per 10,000 inhabitants (EBRD, 2005).
Figure 3.7 shows that Estonia, Czech Republic, Slovenia and Hungary have the most
developed internet infrastructure. Romania and Bulgaria lag far behind. In a global
ranking effectuated by the OECD, Estonia is ranked among the first countries in the
world in what regards the internet and broadband penetration, taking over even the
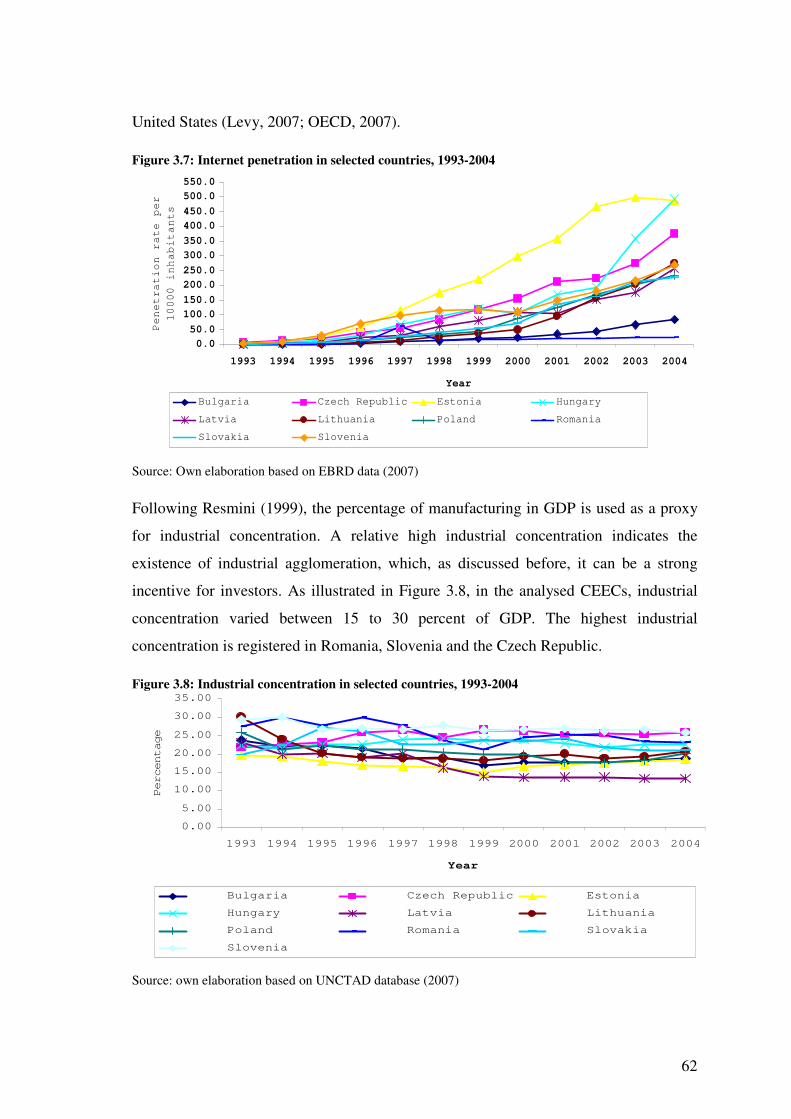
62
United States (Levy, 2007; OECD, 2007). Figure 3.7: Internet penetration in selected countries, 1993-2004
0.050.0
100.0150.0200.0250.0300.0350.0400.0450.0500.0550.0
1993 1994 1995 1996 1997 1998 1999 2000 2001 2002 2003 2004
Year
Penetration rate per
10000 inhabitants
Bulgaria Czech Republic Estonia Hungary
Latvia Lithuania Poland Romania
Slovakia Slovenia
Source: Own elaboration based on EBRD data (2007)
Following Resmini (1999), the percentage of manufacturing in GDP is used as a proxy
for industrial concentration. A relative high industrial concentration indicates the
existence of industrial agglomeration, which, as discussed before, it can be a strong
incentive for investors. As illustrated in Figure 3.8, in the analysed CEECs, industrial
concentration varied between 15 to 30 percent of GDP. The highest industrial
concentration is registered in Romania, Slovenia and the Czech Republic. Figure 3.8: Industrial concentration in selected countries, 1993-2004
0.00
5.00
10.00
15.00
20.00
25.00
30.00
35.00
1993 1994 1995 1996 1997 1998 1999 2000 2001 2002 2003 2004
Year
Percentage
Bulgaria Czech Republic Estonia
Hungary Latvia Lithuania
Poland Romania Slovakia
Slovenia
Source: own elaboration based on UNCTAD database (2007)
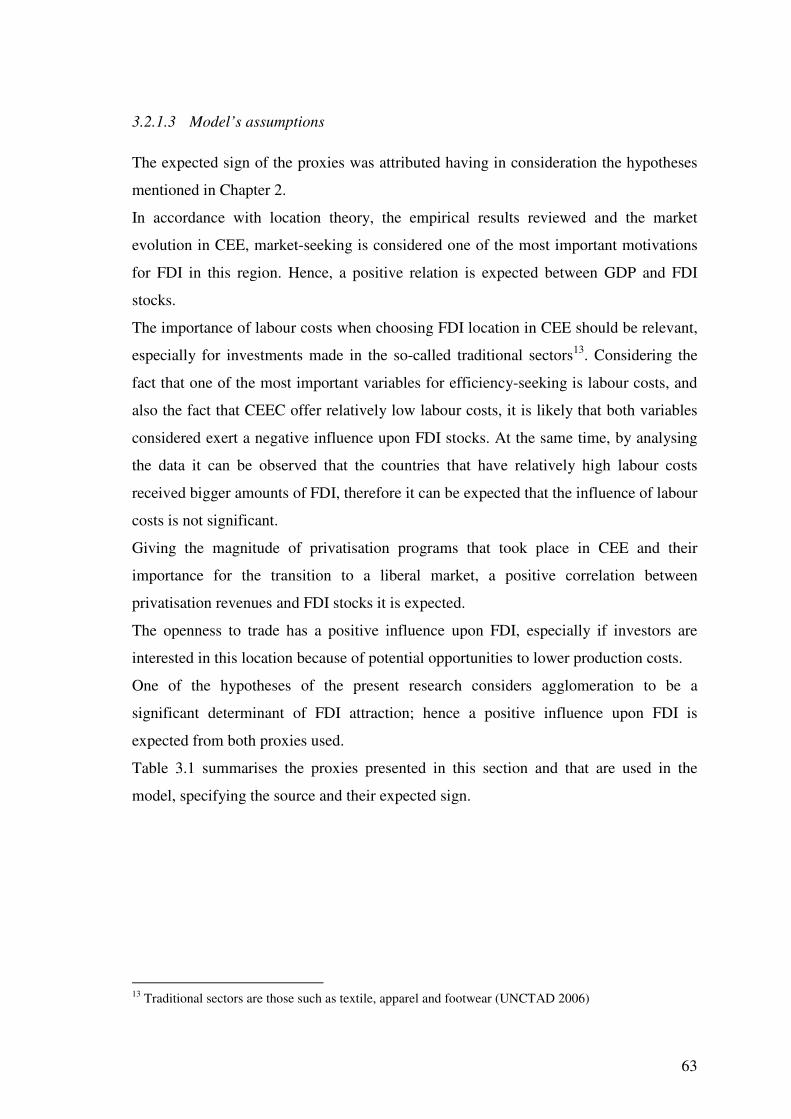
63
3.2.1.3 Model’s assumptions The expected sign of the proxies was attributed having in consideration the hypotheses
mentioned in Chapter 2.
In accordance with location theory, the empirical results reviewed and the market
evolution in CEE, market-seeking is considered one of the most important motivations
for FDI in this region. Hence, a positive relation is expected between GDP and FDI
stocks.
The importance of labour costs when choosing FDI location in CEE should be relevant,
especially for investments made in the so-called traditional sectors13. Considering the
fact that one of the most important variables for efficiency-seeking is labour costs, and
also the fact that CEEC offer relatively low labour costs, it is likely that both variables
considered exert a negative influence upon FDI stocks. At the same time, by analysing
the data it can be observed that the countries that have relatively high labour costs
received bigger amounts of FDI, therefore it can be expected that the influence of labour
costs is not significant.
Giving the magnitude of privatisation programs that took place in CEE and their
importance for the transition to a liberal market, a positive correlation between
privatisation revenues and FDI stocks it is expected.
The openness to trade has a positive influence upon FDI, especially if investors are
interested in this location because of potential opportunities to lower production costs.
One of the hypotheses of the present research considers agglomeration to be a
significant determinant of FDI attraction; hence a positive influence upon FDI is
expected from both proxies used.
Table 3.1 summarises the proxies presented in this section and that are used in the
model, specifying the source and their expected sign.
13 Traditional sectors are those such as textile, apparel and footwear (UNCTAD 2006)
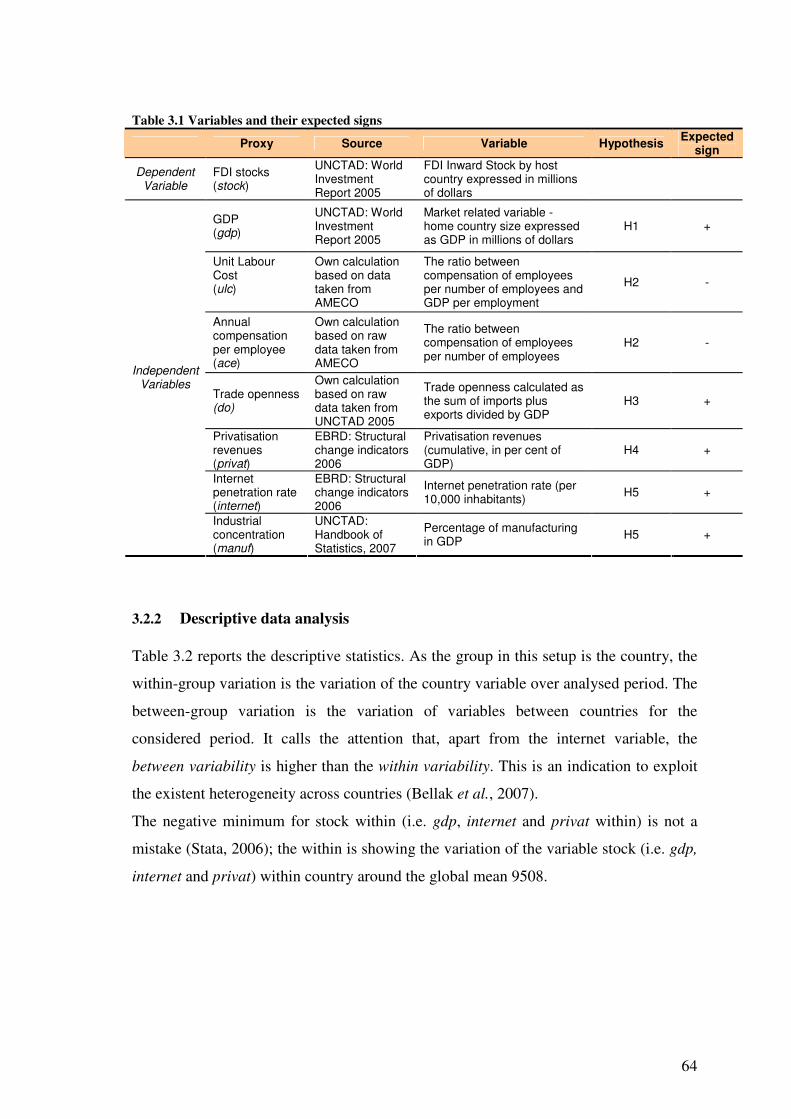
64
Table 3.1 Variables and their expected signs
Proxy Source Variable Hypothesis Expected sign
Dependent Variable
FDI stocks (stock)
UNCTAD: World Investment Report 2005
FDI Inward Stock by host country expressed in millions of dollars
GDP (gdp)
UNCTAD: World Investment Report 2005
Market related variable - home country size expressed as GDP in millions of dollars
H1 +
Unit Labour Cost (ulc)
Own calculation based on data taken from AMECO
The ratio between compensation of employees per number of employees and GDP per employment
H2 -
Annual compensation per employee (ace)
Own calculation based on raw data taken from AMECO
The ratio between compensation of employees per number of employees
H2 -
Trade openness (do)
Own calculation based on raw data taken from UNCTAD 2005
Trade openness calculated as the sum of imports plus exports divided by GDP
H3 +
Privatisation revenues (privat)
EBRD: Structural change indicators 2006
Privatisation revenues (cumulative, in per cent of GDP)
H4 +
Internet penetration rate (internet)
EBRD: Structural change indicators 2006
Internet penetration rate (per 10,000 inhabitants) H5 +
Independent Variables
Industrial concentration (manuf)
UNCTAD: Handbook of Statistics, 2007
Percentage of manufacturing in GDP H5 +
3.2.2 Descriptive data analysis Table 3.2 reports the descriptive statistics. As the group in this setup is the country, the
within-group variation is the variation of the country variable over analysed period. The
between-group variation is the variation of variables between countries for the
considered period. It calls the attention that, apart from the internet variable, the
between variability is higher than the within variability. This is an indication to exploit
the existent heterogeneity across countries (Bellak et al., 2007).
The negative minimum for stock within (i.e. gdp, internet and privat within) is not a
mistake (Stata, 2006); the within is showing the variation of the variable stock (i.e. gdp,
internet and privat) within country around the global mean 9508.
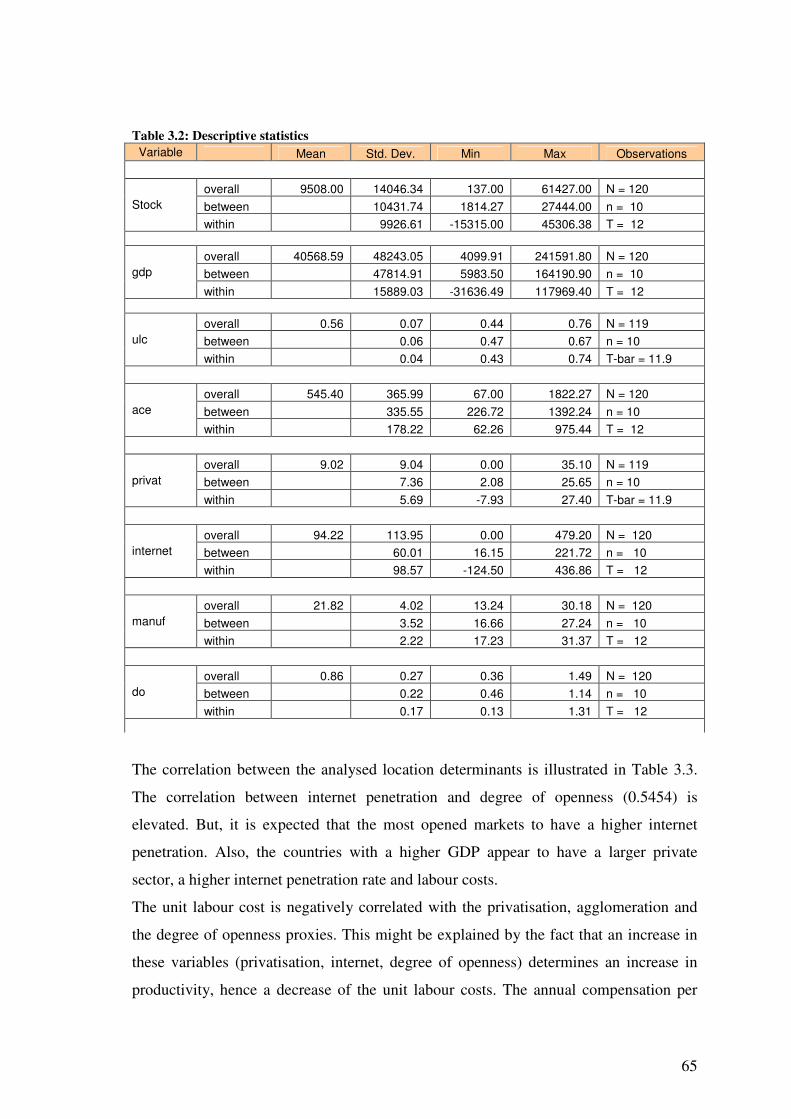
65
Table 3.2: Descriptive statistics
Variable Mean Std. Dev. Min Max Observations
overall 9508.00 14046.34 137.00 61427.00 N = 120 between 10431.74 1814.27 27444.00 n = 10 Stock
within 9926.61 -15315.00 45306.38 T = 12
overall 40568.59 48243.05 4099.91 241591.80 N = 120 between 47814.91 5983.50 164190.90 n = 10 gdp
within 15889.03 -31636.49 117969.40 T = 12
overall 0.56 0.07 0.44 0.76 N = 119 between 0.06 0.47 0.67 n = 10 ulc
within 0.04 0.43 0.74 T-bar = 11.9
overall 545.40 365.99 67.00 1822.27 N = 120 between 335.55 226.72 1392.24 n = 10 ace
within 178.22 62.26 975.44 T = 12
overall 9.02 9.04 0.00 35.10 N = 119 between 7.36 2.08 25.65 n = 10 privat
within 5.69 -7.93 27.40 T-bar = 11.9
overall 94.22 113.95 0.00 479.20 N = 120 between 60.01 16.15 221.72 n = 10 internet
within 98.57 -124.50 436.86 T = 12
overall 21.82 4.02 13.24 30.18 N = 120 between 3.52 16.66 27.24 n = 10 manuf
within 2.22 17.23 31.37 T = 12
overall 0.86 0.27 0.36 1.49 N = 120 between 0.22 0.46 1.14 n = 10 do
within 0.17 0.13 1.31 T = 12
The correlation between the analysed location determinants is illustrated in Table 3.3.
The correlation between internet penetration and degree of openness (0.5454) is
elevated. But, it is expected that the most opened markets to have a higher internet
penetration. Also, the countries with a higher GDP appear to have a larger private
sector, a higher internet penetration rate and labour costs.
The unit labour cost is negatively correlated with the privatisation, agglomeration and
the degree of openness proxies. This might be explained by the fact that an increase in
these variables (privatisation, internet, degree of openness) determines an increase in
productivity, hence a decrease of the unit labour costs. The annual compensation per
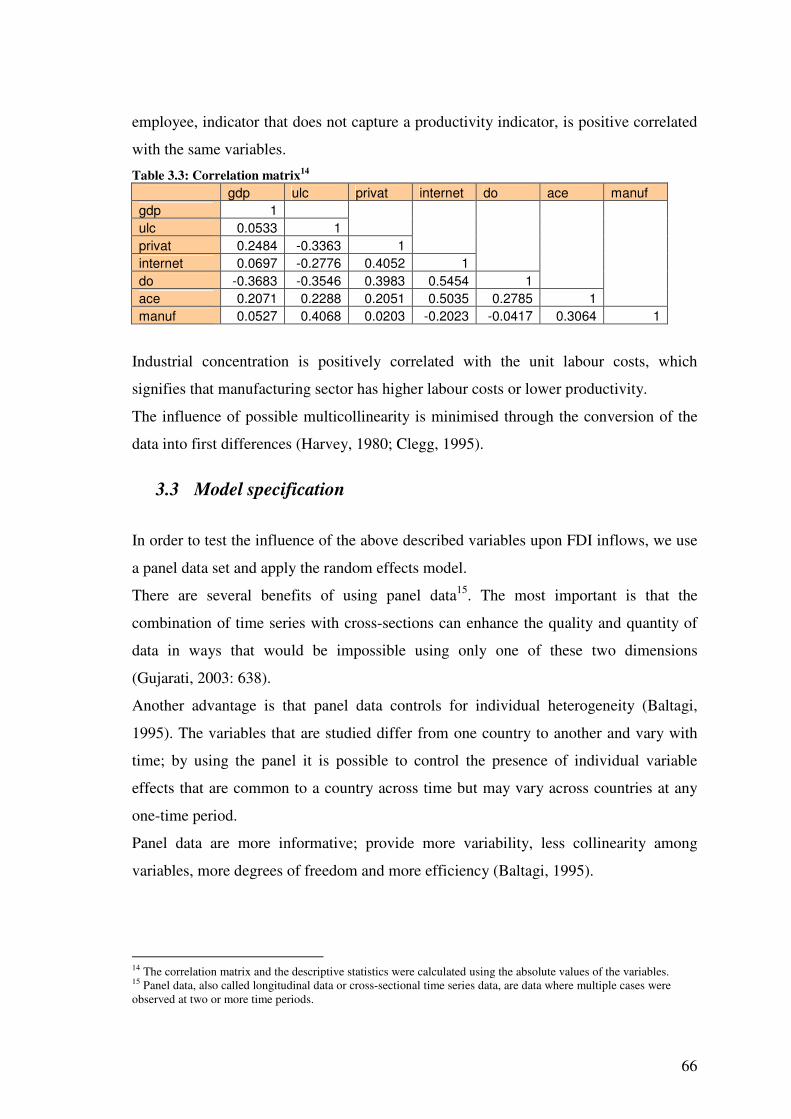
66
employee, indicator that does not capture a productivity indicator, is positive correlated
with the same variables.
Table 3.3: Correlation matrix14 gdp ulc privat internet do ace manuf gdp 1 ulc 0.0533 1 privat 0.2484 -0.3363 1 internet 0.0697 -0.2776 0.4052 1 do -0.3683 -0.3546 0.3983 0.5454 1 ace 0.2071 0.2288 0.2051 0.5035 0.2785 1 manuf 0.0527 0.4068 0.0203 -0.2023 -0.0417 0.3064 1
Industrial concentration is positively correlated with the unit labour costs, which
signifies that manufacturing sector has higher labour costs or lower productivity.
The influence of possible multicollinearity is minimised through the conversion of the
data into first differences (Harvey, 1980; Clegg, 1995).
3.3 Model specification
In order to test the influence of the above described variables upon FDI inflows, we use
a panel data set and apply the random effects model.
There are several benefits of using panel data15. The most important is that the
combination of time series with cross-sections can enhance the quality and quantity of
data in ways that would be impossible using only one of these two dimensions
(Gujarati, 2003: 638).
Another advantage is that panel data controls for individual heterogeneity (Baltagi,
1995). The variables that are studied differ from one country to another and vary with
time; by using the panel it is possible to control the presence of individual variable
effects that are common to a country across time but may vary across countries at any
one-time period.
Panel data are more informative; provide more variability, less collinearity among
variables, more degrees of freedom and more efficiency (Baltagi, 1995).
14 The correlation matrix and the descriptive statistics were calculated using the absolute values of the variables. 15 Panel data, also called longitudinal data or cross-sectional time series data, are data where multiple cases were observed at two or more time periods.
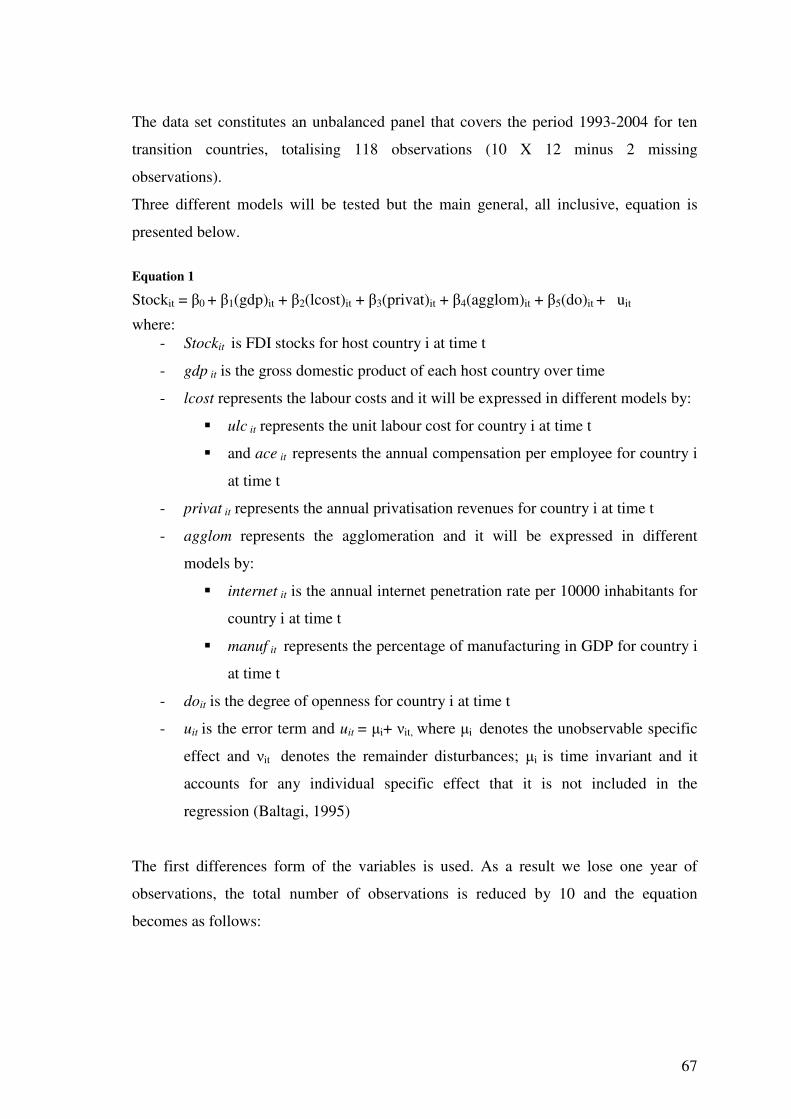
67
The data set constitutes an unbalanced panel that covers the period 1993-2004 for ten
transition countries, totalising 118 observations (10 X 12 minus 2 missing
observations).
Three different models will be tested but the main general, all inclusive, equation is
presented below.
Equation 1
Stockit = �0 + �1(gdp)it + �2(lcost)it + �3(privat)it + �4(agglom)it + �5(do)it + uit
where: - Stockit is FDI stocks for host country i at time t
- gdp it is the gross domestic product of each host country over time
- lcost represents the labour costs and it will be expressed in different models by:
� ulc it represents the unit labour cost for country i at time t
� and ace it represents the annual compensation per employee for country i
at time t
- privat it represents the annual privatisation revenues for country i at time t
- agglom represents the agglomeration and it will be expressed in different
models by:
� internet it is the annual internet penetration rate per 10000 inhabitants for
country i at time t
� manuf it represents the percentage of manufacturing in GDP for country i
at time t
- doit is the degree of openness for country i at time t
- uit is the error term and uit = �i+ �it, where �i denotes the unobservable specific
effect and �it denotes the remainder disturbances; �i is time invariant and it
accounts for any individual specific effect that it is not included in the
regression (Baltagi, 1995)
The first differences form of the variables is used. As a result we lose one year of
observations, the total number of observations is reduced by 10 and the equation
becomes as follows:
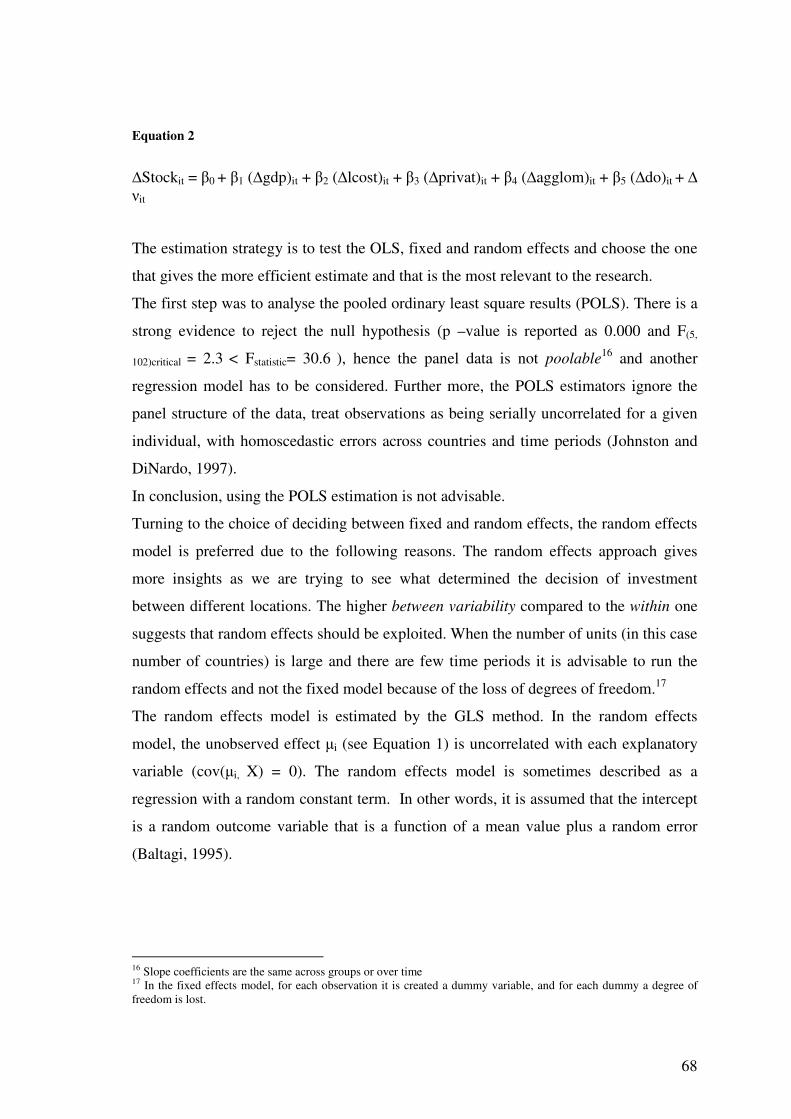
68
Equation 2
�Stockit = �0 + �1 (�gdp)it + �2 (�lcost)it + �3 (�privat)it + �4 (�agglom)it + �5 (�do)it + � �it
The estimation strategy is to test the OLS, fixed and random effects and choose the one
that gives the more efficient estimate and that is the most relevant to the research.
The first step was to analyse the pooled ordinary least square results (POLS). There is a
strong evidence to reject the null hypothesis (p –value is reported as 0.000 and F(5,
102)critical = 2.3 < Fstatistic= 30.6 ), hence the panel data is not poolable16 and another
regression model has to be considered. Further more, the POLS estimators ignore the
panel structure of the data, treat observations as being serially uncorrelated for a given
individual, with homoscedastic errors across countries and time periods (Johnston and
DiNardo, 1997).
In conclusion, using the POLS estimation is not advisable.
Turning to the choice of deciding between fixed and random effects, the random effects
model is preferred due to the following reasons. The random effects approach gives
more insights as we are trying to see what determined the decision of investment
between different locations. The higher between variability compared to the within one
suggests that random effects should be exploited. When the number of units (in this case
number of countries) is large and there are few time periods it is advisable to run the
random effects and not the fixed model because of the loss of degrees of freedom.17
The random effects model is estimated by the GLS method. In the random effects
model, the unobserved effect �i (see Equation 1) is uncorrelated with each explanatory
variable (cov(�i, X) = 0). The random effects model is sometimes described as a
regression with a random constant term. In other words, it is assumed that the intercept
is a random outcome variable that is a function of a mean value plus a random error
(Baltagi, 1995).
16 Slope coefficients are the same across groups or over time 17 In the fixed effects model, for each observation it is created a dummy variable, and for each dummy a degree of freedom is lost.
69
3.4 Estimation results Table 3.4 shows the estimation results. All coefficients carry the expected sign.
Before accepting the regression results the statistical significance shall be analysed. A p
of 5 percent or less is the generally accepted point at which to reject the null hypothesis.
In Model 1, the p value indicates that the only variables of which variation determine a
variation in the FDI stock are the gross domestic product, the privatisation and internet
penetration, all being strongly significant. The unit labour cost and trade openness
appear to be insignificant.
The predicted equation shows that the FDI increases with 0.24 when the gross domestic
product goes up by one, with 251.15 when the privatisation goes up by one and
augments by 27.92 when the internet penetration rate increases by one. In case the
tested variables are zero the predicted FDI stock is equal to 194.41, but this result is
insignificant therefore shall not be considered.
In Model 2, the unit labour cost is dropped and the annual compensation per employees
is tested in order to verify if the correlation between labour costs and FDI changes when
the productivity is not considered. The results show that both labour costs-related are
insignificant.
Gdp, privatisation and internet penetration rate remain highly significant (at 1%), their
coefficient values being very closed to obtained in the first model. The influence of
trade openness is insignificant as in the first model.
In Model 3, compared to Model 1, the industrial concentration variable is introduced.
The results are very similar to the ones registered in the previous models: gdp, privat
and internet are highly significant (the elasticity values are almost similar with the ones
obtained in the first models), while do and ulc appear to remain insignificant. Industrial
concentration appears to be negatively correlated with FDI but it is insignificant, hence
its sign cannot be taken into consideration.
There are R-square (R2) values relating to within-groups and between-groups. The
coefficient of determination is a summary measure that tells how well the sample
regression line fits the data (Gujarati, 1995). The closer R-square is to 1, the more the
model fits the data. In our case and considering all models, 88 to 92 percent of FDI
stocks variation is explained by the differences of the chosen variables between
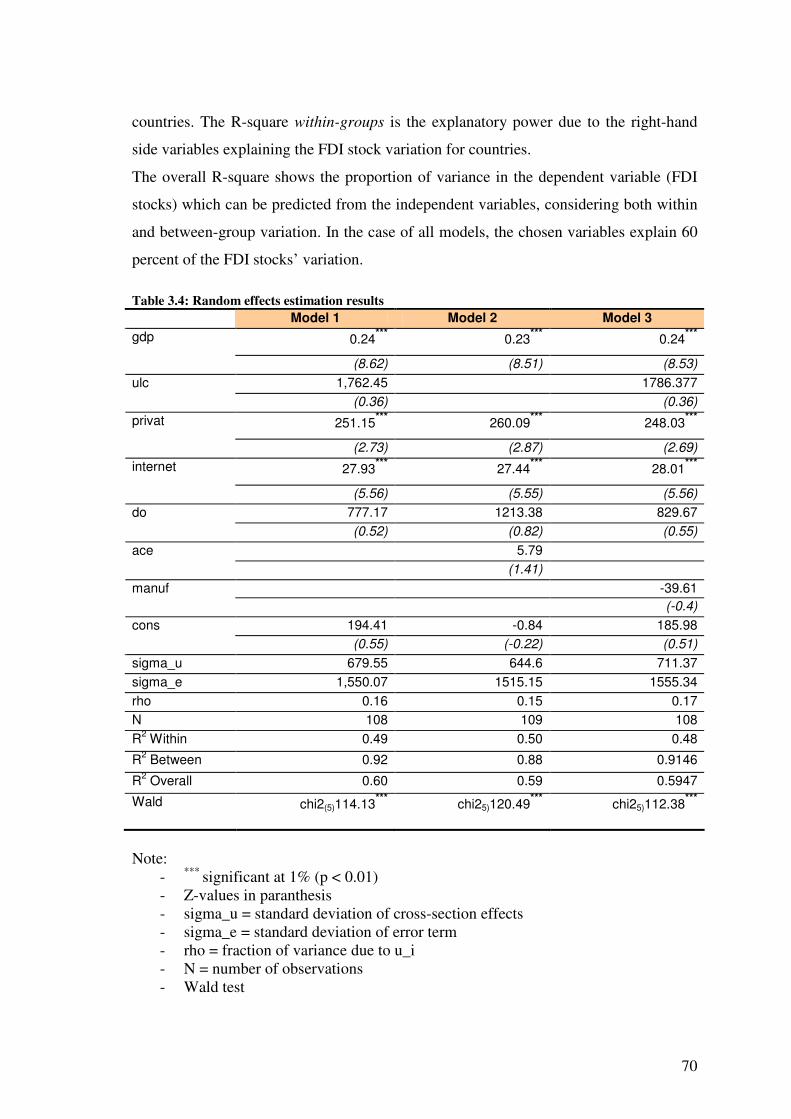
70
countries. The R-square within-groups is the explanatory power due to the right-hand
side variables explaining the FDI stock variation for countries.
The overall R-square shows the proportion of variance in the dependent variable (FDI
stocks) which can be predicted from the independent variables, considering both within
and between-group variation. In the case of all models, the chosen variables explain 60
percent of the FDI stocks’ variation.
Table 3.4: Random effects estimation results Model 1 Model 2 Model 3
0.24*** 0.23*** 0.24*** gdp
(8.62) (8.51) (8.53) 1,762.45 1786.377 ulc
(0.36) (0.36)
251.15*** 260.09*** 248.03*** privat
(2.73) (2.87) (2.69)
27.93*** 27.44*** 28.01*** internet
(5.56) (5.55) (5.56) 777.17 1213.38 829.67 do (0.52) (0.82) (0.55)
5.79 ace (1.41) -39.61 manuf (-0.4)
194.41 -0.84 185.98 cons (0.55) (-0.22) (0.51)
sigma_u 679.55 644.6 711.37 sigma_e 1,550.07 1515.15 1555.34 rho 0.16 0.15 0.17 N 108 109 108 R2 Within 0.49 0.50 0.48
R2 Between 0.92 0.88 0.9146
R2 Overall 0.60 0.59 0.5947
Wald chi2(5)114.13*** chi25)120.49*** chi25)112.38***
Note:
- *** significant at 1% (p < 0.01) - Z-values in paranthesis - sigma_u = standard deviation of cross-section effects - sigma_e = standard deviation of error term - rho = fraction of variance due to u_i - N = number of observations - Wald test
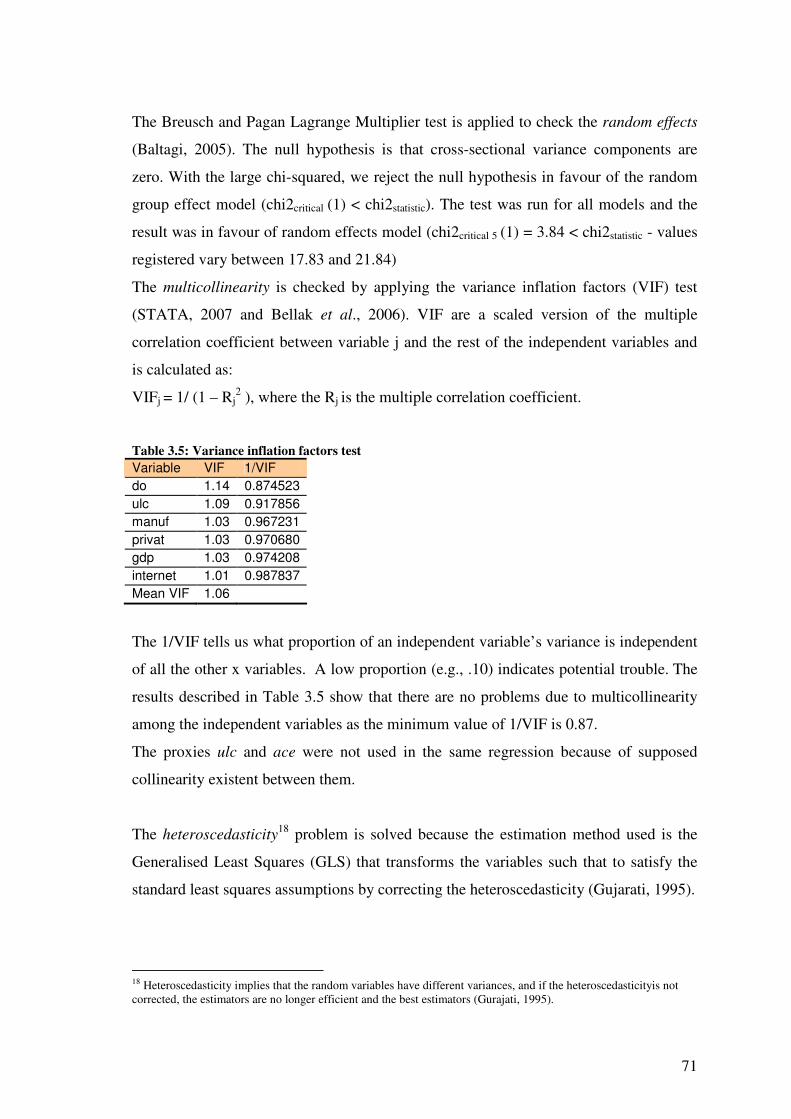
71
The Breusch and Pagan Lagrange Multiplier test is applied to check the random effects
(Baltagi, 2005). The null hypothesis is that cross-sectional variance components are
zero. With the large chi-squared, we reject the null hypothesis in favour of the random
group effect model (chi2critical (1) < chi2statistic). The test was run for all models and the
result was in favour of random effects model (chi2critical 5 (1) = 3.84 < chi2statistic - values
registered vary between 17.83 and 21.84)
The multicollinearity is checked by applying the variance inflation factors (VIF) test
(STATA, 2007 and Bellak et al., 2006). VIF are a scaled version of the multiple
correlation coefficient between variable j and the rest of the independent variables and
is calculated as:
VIFj = 1/ (1 – Rj2 ), where the Rj
is the multiple correlation coefficient.
Table 3.5: Variance inflation factors test Variable VIF 1/VIF do 1.14 0.874523 ulc 1.09 0.917856 manuf 1.03 0.967231 privat 1.03 0.970680 gdp 1.03 0.974208 internet 1.01 0.987837 Mean VIF 1.06
The 1/VIF tells us what proportion of an independent variable’s variance is independent
of all the other x variables. A low proportion (e.g., .10) indicates potential trouble. The
results described in Table 3.5 show that there are no problems due to multicollinearity
among the independent variables as the minimum value of 1/VIF is 0.87.
The proxies ulc and ace were not used in the same regression because of supposed
collinearity existent between them.
The heteroscedasticity18 problem is solved because the estimation method used is the
Generalised Least Squares (GLS) that transforms the variables such that to satisfy the
standard least squares assumptions by correcting the heteroscedasticity (Gujarati, 1995).
18 Heteroscedasticity implies that the random variables have different variances, and if the heteroscedasticityis not corrected, the estimators are no longer efficient and the best estimators (Gurajati, 1995).
72
The robustness is checked by dropping host countries. First were dropped Bulgaria and
Romania as they are the ones that lag behind the other countries in receiving FDI. The
values of the coefficients remain almost the same, the significance is unchanged, the
only change is that ulc and do become highly insignificant. When dropping the
Višegrad countries, the significance and the coefficients remain the same except for the
trade openness that becomes significant at 10%. The result might have an explanation.
As the countries that remained in the analysis are localised far away (compared to the
Višegrad counterparts), trade relations gain importance.
In conclusion, the variables that appear to influence FDI stocks are gdp, privatisation
and the internet penetration rate. The elasticities presented in Table 3.4 show that
privatisation is one of the strongest motivation for FDI location in CEECs. A raise of
the privatisation revenues in GDP with 1 percent increases the FDI stocks with more or
less 250 million dollars. A similar elasticity was obtained by Carstensen and Toubal
(2004); they found that a raise of 1 percent in the market share of private business leads
on average to additional 242 million dollars of bilateral FDI to the host country.
An increase of 1 million dollars in GDP determines an increase of 0.24 million dollars
in the FDI stock. The same positive correlation is found between the internet
penetration rate and the dependent variable; if the number of internet hosts increases
with 1 leads to an increase of 28 million dollars in FDI stocks. For the significant
variables the value of the coefficients does not change significantly between the models.
Unit labour costs, annual compensation per employee, degree of openness, export
orientation and industrial concentration are found to be insignificant.
3.5 Discussion of results
Since 1989, the FDI trend to CEE was uneven and also varied among countries, some of
them, such as Hungary, Czech Republic and Poland, have attracted more FDI than the
others. This study attempts to explain what determined the foreign investors to place
their business in these locations. The econometric model applied in order to test the
hypotheses focused particularly on market-related factors, efficiency-related factors,
transition-specific factors, trade openness and agglomeration. The comparison between
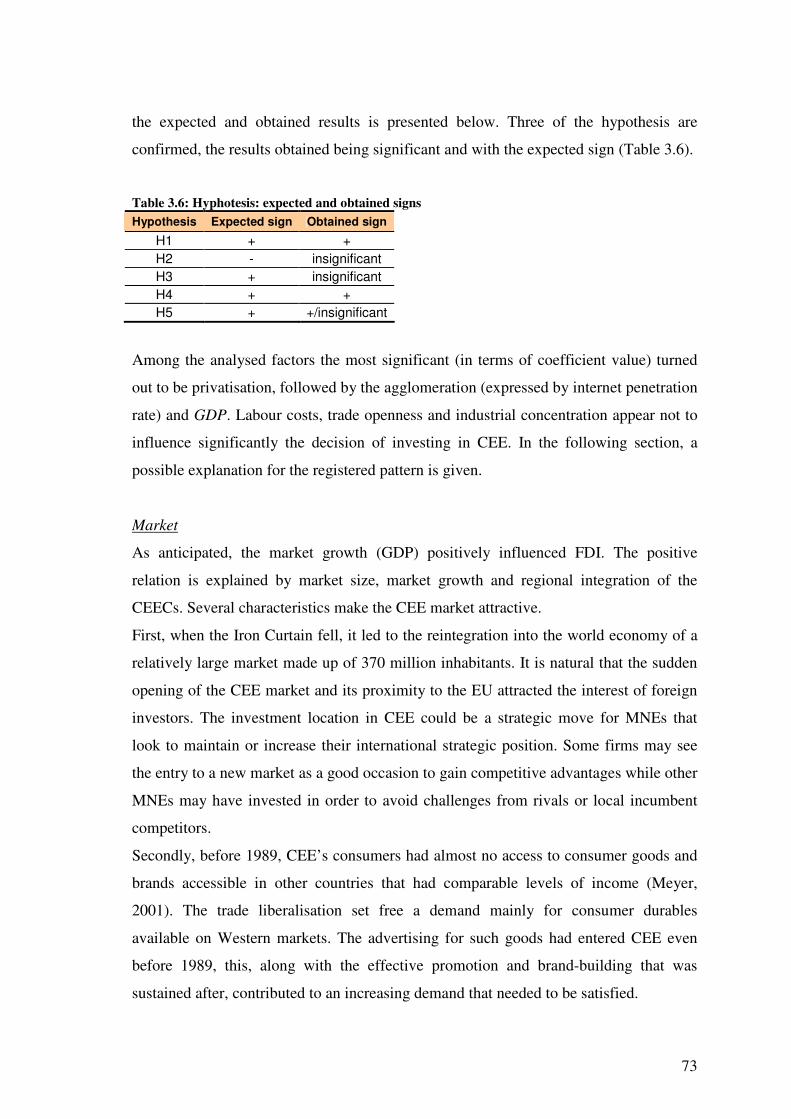
73
the expected and obtained results is presented below. Three of the hypothesis are
confirmed, the results obtained being significant and with the expected sign (Table 3.6).
Table 3.6: Hyphotesis: expected and obtained signs Hypothesis Expected sign Obtained sign
H1 + + H2 - insignificant H3 + insignificant H4 + + H5 + +/insignificant
Among the analysed factors the most significant (in terms of coefficient value) turned
out to be privatisation, followed by the agglomeration (expressed by internet penetration
rate) and GDP. Labour costs, trade openness and industrial concentration appear not to
influence significantly the decision of investing in CEE. In the following section, a
possible explanation for the registered pattern is given.
Market
As anticipated, the market growth (GDP) positively influenced FDI. The positive
relation is explained by market size, market growth and regional integration of the
CEECs. Several characteristics make the CEE market attractive.
First, when the Iron Curtain fell, it led to the reintegration into the world economy of a
relatively large market made up of 370 million inhabitants. It is natural that the sudden
opening of the CEE market and its proximity to the EU attracted the interest of foreign
investors. The investment location in CEE could be a strategic move for MNEs that
look to maintain or increase their international strategic position. Some firms may see
the entry to a new market as a good occasion to gain competitive advantages while other
MNEs may have invested in order to avoid challenges from rivals or local incumbent
competitors.
Secondly, before 1989, CEE’s consumers had almost no access to consumer goods and
brands accessible in other countries that had comparable levels of income (Meyer,
2001). The trade liberalisation set free a demand mainly for consumer durables
available on Western markets. The advertising for such goods had entered CEE even
before 1989, this, along with the effective promotion and brand-building that was
sustained after, contributed to an increasing demand that needed to be satisfied.
74
Third, compared to other developing countries in Latin America and Asia and due to the
fact that the trade barriers almost disappeared as a result of the Central European Free
Trade Agreement, the dimension of the CEECs might be seen as insignificant; but the
geographical and cultural proximity might have attracted a considerable number of
European MNEs. Immediately after opening up, the FDI inflows were low, but as the
liberalisation of the market advanced the FDI inflows also increased.
Fourth, as the applied model showed, the FDI volume and its allocation between the
countries is a dependent of the market potential. A higher GDP indicates a higher
potential demand and a larger market. Larger markets can accommodate more
companies and can offer conditions for obtaining economies of scale. The growth
stimulates investments as the demand is increasing. Poland, Czech Republic and
Hungary had the largest GDP among the studied countries and they attracted the biggest
volume of investments. Romania is the second biggest market after Poland in terms of
population and territory but its “stop and go transition” slowed the growth and, despite
its potential, attracted fewer investments.
Fifth, national markets are very important for the investments in the service sector
(UNCTAD, 1998). As most of the services are not tradable, in order to be offered on a
foreign market the companies must open subsidiaries in those locations. Before 1989,
all services in CEECs were provided by state monopolies, after opening up a big
demand appeared in the service sector. FDI in manufacturing sector was higher than in
services until the privatisation of banks, telecommunication and utilities was opened to
foreigners (UNCTAD, 2003).
The opening of the new market and its potential regional integration due to the
proximity to the European Union might have attracted first the interest of foreign
investors. The increasing demand, the potential of gaining comparative advantages and
economies of scale, the opportunity for maintaining or enhancing the global position
can be some of the features offered by CEE market that led MNEs to locate their
investments in this region.
Another factor that contributed to the opening of CEE market within the analysed
period is privatisation.
75
Privatisation
The model results show the expected positive correlation between FDI stocks and
privatisation.
Privatisation in the CEECs was a complex process as, before 1989, almost everything
was governed by the public sector. As the privatisation process in CEECs had
considerable proportions, a close relationship was developed between FDI and
privatisation, although it was not an equal one; “privatisation has undoubtedly
dominated FDI inflows in most CEECs, FDI has not been the dominant form of
privatisation”. (Kalotay and Hunya, 2000: 39)
There are several reasons that explain why privatisation influenced positively inward
FDI into CEECs.
One of the reasons consists on the fact that privatisation facilitated the transition to an
open market and indicated the commitment to private ownership. These two features are
important for the MNEs when choosing a location as they indicate an open business
environment. Privatisation also promoted competition and improved the climate for
more FDI, reassuring investors about the continuation of liberal policies in the future.
This is a dimension of FDI – privatisation relation that refers to the market conditions
created through privatisation. A simple analysis of the data supports the empirical
finding, Hungary and Czech Republic started the privatisation process earlier and
received greater investment amounts compared when compared to the other CEECs. In
Poland the privatisation has been slow and accelerated only after 1997. In Romania and
Bulgaria it was delayed for longer, only in the end of the 1990s it started to progress.
Another dimension of the FDI – privatisation relation is that privatisation was the form
through which MNEs entered these markets. In CEE, for different sectors, privatisation
was the dominant FDI form of entry (in the automotive industry in Czech Republic and
Romania, and in telecommunications, transportation and bank industry in most CEECs)
even if there were differences in motives and strategies (UNCTAD, 1998, 2000).
Privatisation-based foreign investment may lead to follow up investment by input and
service suppliers of parent companies and to FDI by rival companies. Even if FDI
accounted only to a certain extent for the increase of the private sector in CEECs
because of the lack or limitation of host investors, when a state-owned asset of a certain
size was privatised the majority of bidders were foreign (UNCTAD, 2003). Until 1995,
76
privatisation related FDI in Czech Republic accounted for almost all FDI. Hungary is
believed to have almost exhausted its privatisation-related FDI potential, the decrease in
FDI inflows registered in the end of 90s being justified by it (Hunya, 1998; Sass, 2004).
Hungary, Estonia and, to a certain extent, Poland tried to attract privatisation related
FDI; the other countries in CEE introduced methods that were favouring foreign firms
only in the end of the 1990s. As per Kalotay and Hunya (2000) the governments of
some countries under the financial strain of debt servicing and budget deficits were
pressed to increase revenues from privatisations.
MNEs had different motivation for engaging in privatisation-related FDI in CEECs,
some looked for the first-mover advantage offered by the privatisation programme,
others because they saw merits in their market positions (Antalóczy, 1997 in Kalotay
and Hunya, 2000) or because they wished to increase sales by becoming a local firm. In
terms of MNEs strategies, most studies underlined the relative market-seeking nature of
privatisation-related FDI in CEECs. (Kalotay and Hunya, 2000)
The countries (Hungary, Czech Republic and Poland) that initiated early the
privatisation process and encouraged foreign participation received bigger amounts of
FDI. As discussed above this evolution can be explained by the fact that big
privatisation programs in CEECs, either with foreign participation or not, helped in
creating a better climate for FDI; also, foreign acquisitions were more numerous in the
locations were the privatisation-related FDI was encouraged.
Agglomeration
In order to express agglomeration, two proxies were used: internet penetration rate and
industrial concentration. The results obtained showed that internet penetration positively
influences inward FDI while the industrial concentration appears to be insignificant.
Extant literature showed that factors such as increasing returns, market failure and
spatial competition may favour the appearance of industrial agglomerations (Fujita and
Thisse, 1996). Agglomeration economies are not only industry-specific (economies of
localisation or specialisation) but urban-specific (economies of urbanisation) also
(Barrios et al., 2006). The results of the present research showed that economies of
urbanisation positively influenced FDI, but economies of localisation are not so relevant
for MNEs location decisions.
77
The positive influence of internet usage upon FDI can have various explanations.
First, a high penetration rate suggests the existence of an urban agglomeration (more
inhabitants use the internet, more access points are needed and an infrastructure to
invest in). It signifies that more economic activities are taking place in that location
where an infrastructure already exists, a fact that might influence investors to place their
subsidiaries there.
Secondly, it is supposed that the internet users have certain skills and that the climate is
modernised enough to have this type of service. Internet usage can be seen as a skill and
it is already considered a literacy indicator (Economist Intelligence Unit and IBM,
2007). CEECs have a sufficiently skilled labour work to absorb the new technology.
Third, it indirectly improves productivity, brings knowledge, lowers the international
communication and search costs (making easier the entrance into a new market) and
increases transparency. Business to Business, Business to Consumer and Business to
Government are good examples of these advantages. It might help allowing large
suppliers to avoid retailers and contact the customers directly, implementing software
programs and creating direct connections between subsidiaries and headquarters at
lower costs.
All the above described circumstances create a climate that helps attracting FDI.
Estonia and Slovenia are in the top of the world ranking in what concerns the broadband
usage. (Economist Intelligence Unit, 2007) Czech Republic and Hungary have also a
high internet penetration rate. Romania and Bulgaria have the less developed
infrastructure and are the countries that received the smallest magnitude of investments.
The results show that investors chose to locate their subsidiaries in countries that have a
more advance infrastructure.
The other proxy used for expressing industry-specific agglomeration is industrial
concentration. The estimation suggested that there is no correlation between industrial
concentration and FDI as the former appears to be statistically insignificant. Hence, the
industrial tradition that is characteristic to some of the CEECs and the supposed
advantages offered by it (such as skilled labour force, existing linkages) do not
influence the investors when choosing the location in CEE. This can be justified by the
fact that there are no important industrial concentrations in CEE.
78
Another reason is the fact that the weight of manufacturing in GDP is decreasing and
services start gaining more importance. Even if CEECs have a tradition in industry, an
industrial restructuring took place because of the low productivity, old equipments and
bad management; the output and employment suffered in the first stage (UNCTAD,
2003). Part of the restructuring of the manufacturing enterprises was made with the
help of foreign investments but it cannot be stated that in general it was one of the
strong motivations to invest in CEECs. On average, within the studied years, more than
60% of the inward FDI in CEE was attracted by financial, wholesale,
telecommunication and transport activities, tourism, social and personal services. The
countries that received a higher percentage of FDI in manufacturing are Romania and
Slovakia (OECD, 2005; National Banks, 2006)
Also, the level of industrial concentration appears to be quite homogeneous among
CEE, a fact that can also explain its insignificance when choosing the location.
The distinction between urbanisation and localisation economies was mentioned also by
various authors. Henderson (1988) showed that urbanisation economies and localisation
economies have a different influence upon industries location according to the type of
industry. Traditional industries tend more to locate in regions where economies of
localisation dominate, while the business services and modern industries tend to locate
in urbanisation economies (Audretsch and Feldman, 1996).
Labour costs
Labour costs appear to be insignificant when choosing a FDI location in CEE. Both
proxies used (including/excluding a productivity measure) showed that labour costs do
not influence the investors’ decision. Although the hypothesis and most of the reviewed
empirical literature state the opposite, the finding is not surprising and several
explanations can justify it.
CEE might have attracted investments due to its cheap labour but once the decision was
taken to locate it there, finding the cheapest possible labour within a region
characterised already by low wage might not be so important. Hungary, Czech
Republic, Poland and Slovenia have the highest annual compensation per employee but
they received the biggest amounts of investments, while Romania and Bulgaria, which
registered cheaper labour costs, received less FDI. In the case of CEE a higher labour
79
cost might embody a better qualified personnel and a more stable labour policy. For
example the labour legislation in Romania and Bulgaria was very controversial and
might have created the impression of a higher risk to investors (EIRO, 2005).
In terms of unit labour cost (that includes a productivity measure) Romania and
Bulgaria have the highest labour costs being followed by Slovenia, Lithuania, Poland
and Hungary. This finding reinforces the idea that the high annual compensation
registered by the most advanced countries in CEEC might signify that the personnel is
relatively better skilled and more productive. The existent differences in labour cost
terms between the studied countries are not so significant in order to have a strong
influence upon the location choice. CEE is a location that registered low labour costs
and as the countries are not very heterogeneous from this point of view, the choice of
the host country, as the model results suggested, is made taking in consideration other
determinants.
Another explanation for the statistical insignificance obtained might consist on the fact
that low labour costs were an incentive for OPT and not necessarily for direct
investments (Lemoine, 1998). Especially in the first years of its transition, CEE was an
important location for OPT, particularly in manufacturing sectors such as textile and
footwear (the share of OPT in CEE’s exports represented 20% of total exports in the
beginning of the 1990) (Lemoine, 1998).
The influence of wage costs on FDI decisions varies among industries, depending on
their factor combinations (labour or capital intensive) and investment motives (domestic
or export market oriented) (Agarwal, 1997). In CEECs, in a first phase of transition, the
traditional sectors in manufacturing might have offered low labour costs advantages but
as these sectors decrease, these advantages do not exist to such extent as they used to.
The time span used includes also the last years of transition when the wage differential
was not so well-defined anymore. CEE still has low labour costs, compared to most of
the countries in the Western Europe, but the difference is not as relevant as in the
beginning of the transition period and has higher costs than some locations in Asia.
Also, the wage costs are not as central in many investments as they once were,
especially for companies making high technology products. Contiguity to major centres
of production and research is now equally if not more important (Barrel and Pain,
1999).
80
Trade openness
The openness to international trade appears not to affect the FDI decision in the case of
CEEC, as the degree of openness resulted to be statistically insignificant. Several
reasons may justify the obtained result.
The analysed countries are quite homogeneous in what regards their openness to trade, a
fact that could have determined that investors were not influenced in their choice by this
factor.
The countries that are more liberal in their trade approach tend to export more and this
might attract foreign investors, especially ones which are export-driven (Bevan and
Estrin, 2000). Resmini (1999) suggested that the export-driven investors were attracted
mainly by low labour costs (which give the possibility of reducing the costs) and by the
degree openness. The results of the present thesis suggest that low labour costs were not
the main attraction for the investors; hence, the MNEs were not necessarily and mainly
export-driven being interested in lowering the production costs and afterwards
exporting.
Maybe an analysis taken in the bilateral inflows frame, where the home countries are
specified, would give a different result.
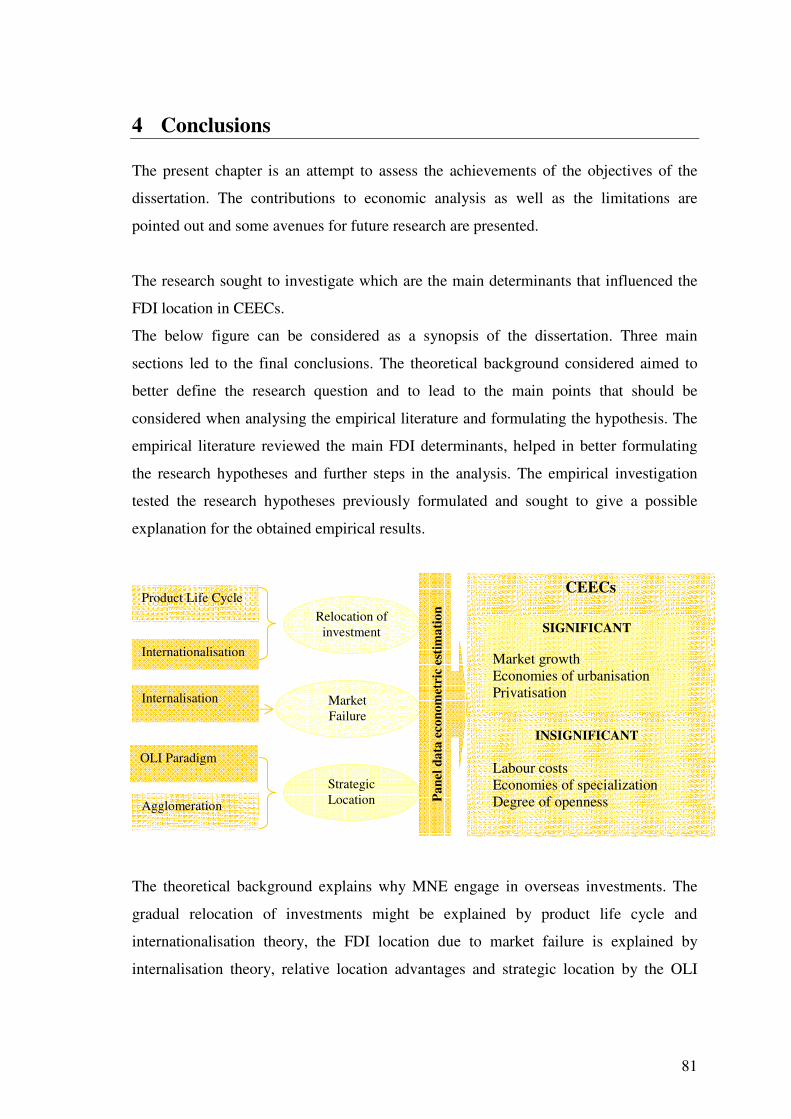
81
4 Conclusions The present chapter is an attempt to assess the achievements of the objectives of the
dissertation. The contributions to economic analysis as well as the limitations are
pointed out and some avenues for future research are presented.
The research sought to investigate which are the main determinants that influenced the
FDI location in CEECs.
The below figure can be considered as a synopsis of the dissertation. Three main
sections led to the final conclusions. The theoretical background considered aimed to
better define the research question and to lead to the main points that should be
considered when analysing the empirical literature and formulating the hypothesis. The
empirical literature reviewed the main FDI determinants, helped in better formulating
the research hypotheses and further steps in the analysis. The empirical investigation
tested the research hypotheses previously formulated and sought to give a possible
explanation for the obtained empirical results.
The theoretical background explains why MNE engage in overseas investments. The
gradual relocation of investments might be explained by product life cycle and
internationalisation theory, the FDI location due to market failure is explained by
internalisation theory, relative location advantages and strategic location by the OLI
Product Life Cycle
Internationalisation
Relocation of investment
Internalisation Market Failure
OLI Paradigm
Agglomeration
Strategic Location
CEECs
Pane
l dat
a ec
onom
etri
c es
timat
ion
INSIGNIFICANT Labour costs Economies of specialization Degree of openness
SIGNIFICANT
Market growth Economies of urbanisation Privatisation
82
paradigm and agglomeration theory. Based on this and on the empirical literature, the
main determinants considered for CEECs were selected and tested.
The results are consistent with the FDI trend in the region and with the studied
literature.
The empirical results proved that, at a country level, the most significant factors that
influenced the investment decision in the region were:
1. Market growth, confirming the fact that one of the most important FDI
motivations for MNEs in CEEC was the opportunity of finding a new market
regardless of the activity sector.
2. Privatisation. The existent literature recognises the importance of the
privatisation process in CEEC but our results show that this is the most relevant
factor when it comes to attracting investments. This finding is in accordance
with UNCTAD’s (2003) statement that investment related to privatisation has
been the dominant form of inflows into CEEC, especially in the 1990’s. This
conclusion should be emphasized because, once the privatisation process is
completed, the FDI competitiveness of the countries is diminished and new FDI
incentives should be offered. As an example, in 2000, in Hungary and in 2003,
in Czech Republic, the FDI flows decreased significantly mainly due to the end
of privatisation (Sass, 2004; UNCTAD, 2004).
3. Agglomeration (due to economies of urbanisation). This determinant has two
dimensions: it expresses the ICT infrastructure level and it can be seen also as a
“market facilitating instrument” (Dunning, 2002:10). The countries that were
better endowed with an ICT infrastructure attracted more investments.
Surprisingly, at first sight, labour costs, trade openness and industrial concentration are
not influencing the investment decision in the CEEC. This supports one of the recent
statements in the literature that labour costs are not in many investments as central as
they once were. Among the insignificant variables the trade openness presents the most
difficult problem of interpretation.
For investors in the CEE market, the most important motivations appear to be market-
seeking (market growth) and asset-seeking (infrastructure). The privatisation is a one-
83
off opportunity and difficult to include in any FDI type. Resource-seeking (labour costs)
and efficiency-seeking (trade openness) appear not to be relevant.
Briefly, one of the main incentives of investors in CEECs was the domestic market-
seeking which assumed, at least initially, mainly the form of acquisition of privatised
firms. MNEs preferred to locate their investments in agglomeration areas which did not
necessarily take the form of agglomerations within the same industry (as the industrial
concentration resulted to be an insignificant determinant) but nevertheless qualify as
regional agglomerations.
4.1 Main contributions The dissertation contributes to deepen the knowledge in what regards the FDI location
determinants in CEE. In order to assess FDI motivations properly the theoretical
approaches are related to the research question providing a better comprehension of the
investments motivation.
Another contribution is the thorough review of the empirical literature on FDI
determinants. More than sixty state-of-art papers dealing with FDI location
determinants were reviewed in order to provide a comprehensive survey for the most
important FDI location determinants in CEE. The empirical studies illustrate a wide
diversity of results with regard to size, sign and significance of analysed determinants
coefficients. Despite the diversity and the fact that strict comparisons between different
empirical investigations cannot be done (due to different methodologies, data sources,
etc.) several conclusions could be drawn. The main findings of such studies were that
the motivations to invest in CEE are mainly market-related and cost-related,
agglomerations and trade openness are also important, especially in the sectorial
analysis.
These results suggested that the FDI in CEE is mainly horizontal as it is more market
oriented.
In terms of methodology, in order to test the hypotheses regarding the significance of
the main location determinants, a panel data econometric estimation was conducted by
applying a random effects model to the first differences of the variables. Panel data is
84
one of the best methodologies suited to answer the research question, given the fact that
the combination of time series with cross sections can enhance the quality and quantity
of data and individual heterogeneity can be controlled for.
Compared to the extant empirical literature, the present dissertation considered one of
the longest time spans in a one-way panel data model run for CEE. This might imply a
better accuracy of the results obtained.
The time span (1993-2004) included the first years of transition and, for most of the
countries, the later stage of transition. For this period, the main location determinants in
the analysed CEECs were mostly market-related. Despite the fact that the literature is
conclusive in what concerns the negative effect of labour costs, the cost-related factors
appear to be insignificant, suggesting that CEECs do not have a significant comparative
advantage in labour costs, and that many cost-oriented investors were discouraged by
low productivity.
The dissertation enhances the knowledge regarding the FDI trends in CEEC, helping to
better understand the competitiveness of the countries located in this area and to draw
policy implications of such findings.
4.2 Limitations of the study One of the limitations is the exclusion from the analysis of some location factors (due to
lack of meaningful data) that, given the specificity of CEE, could affect the FDI location
decision. Such factors are:
- country risk variables that could express the legal, political and economic
environment. For CEE this is an important aspect and, given the different stages
that they reached within the transition period to a market economy, the country
competitiveness in attracting FDI depends upon it. This omission is due to lack
of meaningful data;
- special investment incentive indicators;
- a better agglomeration indicator. A lagged dependent variable was initially
considered to express agglomeration. In this case a dynamic panel data
85
estimation should have been carried out by applying the GMM estimator of
Arellano and Bond (Arellano and Bond, 1991). However, the number of
observations is too small in order to use such a method, thus resulting in it being
discarded.
In the analysis it couldn’t be used the real unit labour cost but only the nominal unit
labour because of the missing data (Purchasing Power Parity). Real unit labour costs
focus more directly on the profitability pressures associated with the employment of
labour than nominal unit labour costs do, hence it is preferable to be used in the analysis
(Bellak et al., 2007).
These are some limitations to the study which are, at the same time, an open door for
future research, as explained subsequently.
4.3 Future research
All the above mentioned limitations can be considered in the future for an improved
analysis.
Regarding the level of analysis and data source improvements could be made.
The findings of the present research are obtained for a country-level regardless of the
sector of activity. An interesting approach would be to run the analysis at a sectoral,
industry-level in order to detect the comparative advantages of these. Such findings
could help in detecting in more detail the location advantages.
The data source of the present research was obtained from various international
organisations. A valuable work would consist in creating a database based on a survey
made in collaboration with the main investors in these locations.
The present study considers almost the entire period of transition. A viable future
analysis would be to divide the transition period and to compare the FDI determinants
in the first and last years of transition.
The relation of FDI with trade in CEE is often inconclusive, mainly due to the supposed
causality between the two variables. A more profound analysis of the relationship
86
should be undertaken. The implications of the OPT in CEE and why it was preferred to
FDI, is another interesting research theme.
In the present analysis, a recently considered indicator, internet penetration rate, is used.
There is an incipient literature that analyses the influences of the potential use of ICT,
especially the internet, upon FDI location. Given the increased importance of internet in
business environment a more profound analysis of the relationship between internet and
FDI should be carried on.
Over the last two decades important contributions related to FDI location determinants
were brought about, but as the world economic scenario is continuously changing and at
a faster rate than it used to, the relation between FDI and potential location determinants
should remain an important research theme.
References
Ádám, Z. (2004), “Autonomy and Capacity: A State-Centred Approach to Post-Communist Transition in Central Europe”, UCL Working paper No. 40, Centre for the Study of Economic and Social Change in Europe, London: University College London, http://www.ssees.ucl.ac.uk/economic.htm accessed on 10/05/2007.
Addison T. and A. Heshmati (2003), “The New Global Determinants of FDI Flows to Developing Countries: the Importance of ICT and Democratisation”, revised version of the paper originally presented for the UNU/WIDER on the New Economy in Development, 10-11 May 2002, Helsinki, http://www.researchictafrica.net /modules. php?op=modload&name=News&file=article&sid=384 accessed on 15/06/2007.
Agarwal, J. P. (1997), “European Integration and German FDI: Implications for Domestic Investment and Central European Countries”, National Institute Economic Review, Vol. 160, No. 1, pp. 100-111.
Aizenman, J. and I. Noy (2005), “FDI and Trade – Two Way Linkages?” INFINITI Conference Paper, Dublin, June 2005, http://econ.ucsc.edu/faculty/ accessed on 15/06/2007.
Akinkugbe, O. (2003), “Flow of Foreign Direct Investment to Hitherto Neglected Developing Countries”, WIDER Discussion Paper No. 2003/02, World Institute for Development Economic Research, Tokyo: United Nations University. http://www. regulateonline.org/content/view/29/32/ accessed on 12/12/2006.
Altomonte, C. (1998), “FDI in the CEEC’s and the Theory of Real Options: An Empirical Assessment”, LICOS Discussion Paper 76, Leuven: Centre for Transition Economics, http://ideas.repec.org/p/lic/licosd/7698.html accessed on 10/02/2006.
Altomonte, C. and C. Guagliano (2001), “Competing Locations? Market Potential and FDI in Central and Eastern Europe vs the Mediterranean”, LICOS Discussion Paper No. 108, Leuven: Centre for Transition Economics, http://econpapers. repec.org/paper/liclicosd/10801.html accessed on 10/02/2006.
AMECO (2006), Annual Macroeconomic Database, http://ec.europa.eu/ economy_ finance /indicators_en.htm accessed on 20/10/2006.
Arellano, M. and S. Bond (1991), “Some Tests of Specification for Panel Data: Monte Carlo Evidence and an Application to Employment Equations”, Review of Economic Studies, Vol. 58, No. 2, pp. 277-297.
Arrow, K. J. (1969), “The Organization of Economic Activity: Issue Pertinent to the Choice of Market Versus Non Market Allocations”, Analysis and Evaluation of Public Expenditures, The PPB System, US Joint Economic Committee, 91st Congress (editors),1st Session, Washington (DC): US Government Printing Office, pp. 59-73.
Athreye, S. (2000), “Agglomeration and Growth, a Study of the Cambridge Hi-Tech Clusters”, SIEPR Discussion Paper No. 00-42, Stanford CA: Stanford Institute for Economic Policy Research, http://papers.ssrn.com/sol3/papers.cfm?abstract_id= 302958 accessed on 15/06/2007.
Audretsch, D. B. and M. P. Feldman (1996), “R&D Spillovers and the Geography of Innovation and Production”, American Economic Review, Vol. 86, No.3, pp. 630-640.
Axinn, C and P. Matthyssens (2001), “Limits of Internationalisation Theories in an Unlimited World”, International Marketing Review, Vol. 19, No. 5, pp. 436-449.
Baltagi, B. H. (1995), Econometric Analysis of Panel Data, Chichester: John Wiley & Sons Ltd.
Bailey, D. and N. Driffield (2002), “Hymer and Uneven Development Revisited: Foreign Direct Investment and Regional Inequalities”, Contributions to Political Economy, Vol. 21, No. 1, pp. 55-68.
Bain, J. S., (1956), Barriers to New Competition, Cambridge: Harvard University Press.
Barrios, S., H. Görg and E. Strobl (2006), “Multinationals’ Location Choice, Agglomeration Economies and Public Incentives”, International Regional Science Review, Vol. 29, No. 1, pp. 81-107.
Barrell, R. and N. Pain (1999), “Domestic Institutions, Agglomerations and Foreign Direct Investment in Europe”, European Economic Review, Vol. 43, No. 4, pp. 925-934.
Basile, R., D. Castellani and A. Zanfei (1993), “Location choices of Multinational Firms in Europe: the Roles of National Boundaries and EU Policies”, Quaderni di Economia, Matematica e Statistica No. 78, Urbino: University of Urbino, http://ideas.repec.org/p/wpa /wuwpit/0310001.html accessed on 12/09/2006.
Beamish, P. W. (1990), “The Internationalisation Process for Smaller Ontario Firms: a Research Agenda”, In Rugman A. M. (editor), Research in Global Strategic Management- International Business, Greenwich (CT): JAI Press, pp. 77-92.
Békés, G. (2005), “Location of Manufacturing FDI in Hungary: How Important are Inter-Company Relationships?”, MNB Working Paper No. 2005/7, Budapest: Magyar Nemzeti Bank, http://ideas.repec.org/p/mnb/wpaper/2005-07.html accessed on 20/12/2006.
Bedi, A. and A. Cieslik (2000), “Foreign Direct Investment and Host Country Regional Export Performance: Evidence from Poland”, ORPAS Working Paper Series No. 322, Hague: Institute of Social Studies, http://econpapers.repec.org/paper/isswpaper /322.htm accessed on 07/01/2007.
Behrman, J. N. (1984), Industrial Policies: International Restructuring and Transnationals, Lexington: Lexington Books.
Bellak, C. (2004), “The Impact of Enlargement on the Race for FDI”, Working Paper No. 86, Department of Economics, Vienna: Vienna Economics University, http://www. wu-wien.ac.at/inst/vw1/papers/wu-wp86.pdf accessed on 25/08/2006.
Bellak, C. and J. Cantwell (2004), “Revaluing the Capital Stock of International Production”, International Business Review, Vol. 13, Issue 1, pp. 1-18.
Bellak, C. and M. Leibrecht (2005), “Are Tax Rates Drives of Foreign Direct Investment in Central and East European Countries? Some Empirical Evidence”, Preliminary draft prepared for the workshop on relocation, Hamburg 2005, International Tax Coordination SFB, http://www2.wu-wien.ac.at/taxlaw/sfb/index.php?module = ContentExpress&func=display&btitle=CE&mid=&ceid=80 accessed on 27/09/2006.
Bellak, C., M. Leibrecht and R. Römisch (2006), “New Evidence on the Tax Burden of MNC Activities in Central and East European New Member States”, Discussion Paper Nr. 2, International Tax Coordination SFB, http://epub.wu-wien.ac.at/dyn/virlib /wp/showentry?ID=epub-wu-01_882 accessed on 10/06/2006.
Bellak, C., M. Leibrecht and A. Riedl (2007), “Labour Costs and FDI Flows to the CEECs: A Survey of the Literature and Some Empirical Evidence”, Structural Change and Economic Dynamics, forthcoming 2007, Department of Economics, Vienna: Vienna Economics University, http://www2.wu-wien.ac.at/taxlaw /sfb/index.php?module=ContentExpress&func=display&btitle=CE& mid=&ceid=80 accessed on 15/04/2007.
Bénassy-Quéré, A. and A. Lahrèche-Révil (2005),”Corporate Taxation and FDI Within the EU25”, Paper Presented at the 2nd Euroframe Conference on Economic Policy Issues in the European Union, Vienna, http://www.euroframe.org/fileadmin/ user_upload/euroframe/docs/2005/session7/eurof05_lahreche.pdf accessed on 15/12/2006.
Bénassy-Quéré, A., L. Fontagne and A. Lahrèche-Révil (2005) “How Does FDI React to Corporate Taxation?”, International Tax and Public Finance, Vol. 12, Issue 5, pp. 583–603.
Bennett J., S. Estrin, J. Maw and G. Urga (2004), “Privatisation Methods and Economic Growth in Transition Economies”, CEPR Discussion Paper 4291, London: Centre for Economic and Policy Research, http://www.ipc.umich.edu/edts/pdfs/BEMU july152003%20_latest_%20short%20version.pdf accessed on 30/05/2006.
Bevan A. and S. Estrin (2000), “The Determinants of Foreign Direct Investment in Transition Economies”, CEPR Discussion Paper 2638, London: Centre for Economic and Policy Research, http://papers.ssrn.com/sol3/papers.cfm?abstract_id= 258070 accessed on 05/01/2007.
Bevan, A., S. Estrin and K. Meyer (2004) “Foreign Investment Location and Institutional Development in Transition Economies”, International Business Review, Vol. 13, No. 1, pp. 43-64.
Bitzenis, A. (2003), “Universal Model of Theories Determining FDI. Is There Any Dominant Theory? Are FDI Inflows in the CEEC Countries and Especially Bulgaria A Myth?”, European Business Review, Vol. 15, No. 2, pp. 94-124.
Blonigen, B. A. (2005), “A Review of the Empirical Literature on FDI Determinants”, NBER Working Paper No. 1129, Cambridge (MA): National Bureau of Economic Research, http://papers.ssrn.com/sol3/papers.cfm?abstract_id=258070 accessed on 12/04/2006.
Bod, P. (1997), “German Capital in Hungary: Is There a Special Relationship?” Discussion Paper No. IGS97/4, Institute for German Studies, Birmingham: University of Birmingham, http://www.igs.bham.ac.uk/research/projects.shtml accessed on 10/02/2006.
Bortolotti, B., M. Fatini and D. Siniscalco (2003), “Privatisation Around the World: Evidence from Panel Data”, Journal of Public Economics, Vol. 88, Issue 1-2, pp. 305-322.
Botri�, V. and L. Šufli� (2005), “Main Determinants of Foreign Direct Investment in the South European Countries”, paper presented at the 2nd Euroframe Conference on Economic Policy Issues in the European Union, June 3rd, 2005, Vienna, http://www.euroframe.org/fileadmin/user_upload/euroframe/docs/2005/session2/eurof05_botric.pdf accessed on 12/12//2006.
Boudier-Bensebaa, F. (2005), “Agglomeration Economies and Location Choice: Foreign Direct Investment in Hungary”, Economics of Transition, Vol. 13, No. 4, pp. 605–628.
Brada, J. C. and V. Tomšík (2003), “Reinvested Earning Bias, the “Five Percent” Rule and the Interpretation of the Balance of Payments – with An Application to Transition Economies”, CEPR Working Paper No. 543, London: Centre for Economic and Policy Research, http://ideas.repec.org/p/wdi/papers/2003-543.html accessed on 12/01/2007.
Brynjolfsson, E. and L. Hitt (2003), “Computing Productivity – Firm Level Evidence”, MIT Sloan Working Paper No. 139, Cambridge: Centre for e-Business MIT, http://papers.ssrn.com/sol3/papers.cfm?abstract_id=290325 accessed on 12/06/2007.
Buch, M. C., J. Kleinert, A. Lipponer and F. Toubal (2005), “Determinants and Effects of Foreign Direct Investment: Evidence from German Firm Level Data”, Economic Policy, Vol. 20, Issue 41, pp. 53-108.
Buckley, P. J. and M. Casson (1976), The Future of the Multinational Enterprise, London: MacMillan.
Buckley, P. J. and M. Casson (1979), “A Theory of International Operations”, in P. J. Buckley and P. N. Ghauri (editors), The Internationalisation of the Firm, London: International Thomson Business Press.
Buckley, P. J. and J. H. Dunning (1976), “The Industrial Structure of US Direct Investment in the UK”, Journal of International Business Studies, Vol. 7, Issue 2, pp. 5-13.
Campos, N. F. and Y. Kinoshita (2002), “Foreign Direct Investment as Technology Transferred: Some Panel Evidence from the Transition Economies”, CEPR Discussion Paper No. 3417, London: Centre for Economic and Policy Research, http://papers.ssrn.com/sol3/papers.cfm?abstract_id=321086 accessed on 02/02/2007.
Cantwell J. (2000), “A Survey of Theories of International Production”, in C. N. Pitelis and R. Sugden (editors), The Nature of the Transnational Firm, London: Routledge, pp. 11-56.
Cantwell, J. and C. Bellak (1998), “How Important is Foreign Direct Investment?” Oxford Bulletin of Economics and Statistics, Vol. 60, No. 1, pp. 99-106.
Casson, M. (1998), “An Entrepreneurial Theory of the Firm”, in N. J. Foss and V. Mahnke (editors), Competence, Governance and Entrepreneurship: Advances in Economic Strategy Research, Oxford: Oxford University Press, pp. 116-145.
Castro, F. B. (2000), Foreign Direct Investment in the European Periphery: The Competitiveness of Portugal, Unpublished PhD Thesis, CIBUL, Leeds: University of Leeds.
Carstensen, K. and F. Toubal (2004), “Foreign Direct Investment in Central and Eastern European Countries: A Dynamic Panel Analysis”, Journal of Comparative Economics, Vol. 32, No. 1, pp. 3–22.
Caves, R. E. (1974), “Multinational Firms, Competition and Productivity in Host Countries Markets”, Economica, Vol. 41, Issue 162, pp. 176-193.
Chakrabarti, A (2001), “The Determinants of Foreign Direct Investment: Sensitivity Analyses of Cross-Country Regressions”, Kyklos, Vol. 54, Issue 1, pp. 83-113.
Chen, S. (2005), “Extending Internationalisation Theory: A New Perspective on International Technology Transfer and its Generalization”, Journal of International Business Studies, Vol. 36, Issue 2, pp. 231-245.
Cheng, L. K. and Y. Kwan (2000), “What are the Determinants of the Location of Foreign Direct Investment? The Chinese Experience”, Journal of International Economics, Vol. 51, No. 2, pp. 379-400.
Choi, C. (2003), “Does Internet Stimulate Inward Foreign Direct Investment?”, Journal of Policy Modelling, Vol. 25, No. 4, pp. 319-326.
Cieslik, A. (2005), “Regional Characteristics and the Location of Foreign Firms within Poland”, Applied Economics, Vol. 37, No. 8, pp. 863-874.
Clausing, K. A. and C. L. Dorobantu (2005) “Re-Entering Europe: Does European Union Candidacy Boost Foreign Direct Investment?”, Economics of Transition, Vol. 13, No. 1, pp. 77–103.
Clegg, J. (1995), “The Determinants of United States Foreign Investment in the European Community: A Critical Re-Evaluation”, mimeo, Bath: University of Bath.
Coase, R. H. (1937), “The Nature of the Firm”; Economica, New Series, Vol. 4, No. 16, pp. 386-405.
Cohen, W. M. and D. A. Levinthal (1990), “Absorptive Capacity: A New Perspective on Learning and Innovation”, Administrative Science Quarterly, Vol. 35, No. 1, pp. 128-152.
Coviello, N. E. and H. J. Munro (1997), “Network Relationships and the Internationalisation Process of Small Software Firms”, International Business Review, Vol. 6, No. 4, pp. 361-86.
Culem, C. G. (1988), “The Locational Determinants of Foreign Direct Investments Among Industrialized Countries”, European Economic Review, Vol. 32, No. 4, pp. 885-904.
Czech National Bank (2006), Statistics Department, Balance of Payments, http://www.cnb.cz/ en/statistics/bop_stat/fdi/index.html accessed on 26/03/2006
Dahlman, C. J. (1979). “The Problem of Externality”, Journal of Law and Economics, Vol. 22, No. 1, pp. 141–162.
Dalton, P. S. (2003), “What Have We Learned About Loss Aversion and Endowment Effect? Still an Anomaly?”, mimeo, Warwick : University of Warwick.
Defever, F. (2006), “Functional Fragmentation and the Location of Multinational Firms in the Enlarged Europe”, Regional Science and Urban Economics, Vol. 36, No. 5, pp. 658-677.
Demekas, D. G., B. Horvath, E. Ribakar and Y. Wu (2005), “Foreign Direct Investment in Southeastern Europe: How (and How Much) Can Policies Help?”, IMF Working Paper 110, Washington (DC): IMF, http://www.imf.org/external/pubs/ft/wp/2005/ wp05110.pdf accessed on 02/03/2007.
Dewenter, K. L and P. H. Maltesta (2001), “State-Owned and Privately Owned Firms: An Empirical Analysis of Profitability, Leverage and Labour Intensity”, The American Economic Review, Vol. 91, No. 1, pp. 320-334.
Disdier, A. C. and T. Mayer (2004), “How Different is Eastern Europe? Structures and Determinants of Location Choices by French Firms in Eastern and Western Europe”, Journal of Comparative Economics, Vol. 32, No. 2, pp. 280-296.
Djankov, S. and G. Pohl (1997), “Restructuring of Large Firms in Slovakia”, Finance and Private Sector Development Division, Europe and Central Asia Technical
Department, Washington (DC): World Bank, http://ideas.repec.org/p/wbk/wbrwps /1758.html accessed on 26/07/2006.
Djankov, S. and B. Hoekman (1999), “Foreign Investment and Productivity Growth in Czech Enterprises”, Policy Research Working Paper No. 2115, World Bank Development Group, Washington (DC): World Bank, http://www-wds.worldbank.org/servlet/WDSContentServerWDSP/IB/1997/04/01/0000092653971126124242/Rendered/PDF/multi0page.pdf accessed on 26/07/2006.
Döring, T. and J. Schnellenbach (2004), “What Do We Know About Geographical Knowledge Spillovers and Regional Growth? Theory and Evidence”, Discussion Paper Series “Fiscal federalism and national growth”, No. 2, Marburg, http://papers. ssrn.com/sol3/papers.cfm?abstract_id=753386 accessed on 20/04/2006.
Dumitriu I. and G. Hunya (2002), “Economic Restructuring Through FDI in Romania”, 7th EACES conference, Forli, Italy, http://ecoserver.gelso.unitn.it/eaces/work/Papers /Economic%20Restructuring%20through.pdf accessed on 20/06/2006.
Dunning, J. H. (1977), “Trade, Location of Economic Activity and the MNE: A Search for An Eclectic Approach”, in B. Ohlin, P. Hesselborn and M. Wijkman, (editors), The International Allocation of Economic Activity, London: Holmes and Meier.
Dunning, J. H. (1981), International Production and the Multinational Enterprise, London: George Allen and Unwin.
Dunning, J. H. (1993), Multinational Enterprises and the Global Economy, Reading: Addison-Wesley.
Dunning, J. H. (1998), “Location and the Multinational Enterprise: A Neglected Factor?”, Journal of International Business Studies, Vol. 29, No. 1, pp. 45-66.
Dunning, J. H. (1999), “A Rose by Any Other Name..? FDI Theory in Retrospect and Prospect”, Mimeo, University of Reading and Rutgers University.
Dunning, J. H. (2001), “The Eclectic (OLI) Paradigm of International Production: Past, Present and Future”, Journal of the Economics of Business, Vol. 8, No. 2, pp. 173-190.
Dunning, J. H. (2001), “The Key Literature on IB Activities: 1960-2000”, in A. M. Rugman and T. L. Brewer (editors), The Oxford Handbook of International Business, Oxford: Oxford University Press, pp. 36-68.
Dunning, J. H. (2002), “Determinants of Foreign Direct Investment: Globalization Induced Changes and the Role of FDI Policies”, Economist Intelligence Unit’s World Investment Prospects, London, http://wbln0018.worldbank.org/eurvp/web.nsf/Pages /Paper+ by+Dunning/$File/DUNNING+1.PDF accessed on 25/05/2007.
Dunning, J. H. and J. R. Dilyard (1999), “Towards a General Paradigm of Foreign Direct and Foreign Portfolio Investment”, Transnational Corporations, Vol. 8, No. 1, pp. 1-52.
D’Souza, F. and W.L. Megginson, (1999), “The Financial and Operating Performance of Privatized Firms During the 1990s"”, The Journal of Finance, Vol. 54, No. 4, pp. 1397-1438.
EBRD (2007), Structural Change Indicators, http://www.ebrd.com/ accessed on 07/01/2007.
Economist Intelligence Unit (2004), Country Briefings; http://www.economist.com accessed on 08/04/2006.
Economist Intelligence Unit and IBM (2007), The 2007 E-Readiness Rankings, Raising the Bar, London: The Economist and IBM Institute for Business Value, http://graphics.eiu.com/files/ad_pdfs/2007Ereadiness_Ranking_WP.pdf accessed on 20/06/2007.
EIRO (2006), Minimum Wages in Europe, EIRO Study, http://www.eurofound.europa. eu/eiro/index.htm accessed on 10/01/2007.
Ernst & Young (2003), “EU Enlargement – European Centres Distribution On the Move?”, Cap Gemini Ernst & Young, Netherlands, http://www.nfia.com /logistics/pdfs/EUreport.pdf accessed on 10/05/2007.
Estrin, S. (1996), “Privatisation in Central and Eastern Europe”, CERT Discussion Paper No. 9605, Edinburgh: Centre for Economic Reform and Transformation, http://www.som.hw.ac.uk/cert/wpa/1996/dp9605.pdf accessed on 25/10/2006.
EUROSTAT, Statistic Data, http://epp.eurostat.ec.europa.eu/portal accessed on 12/03/2006.
Farkašová, E. (2002), “Regional Aspects of the Effect of Foreign Direct Investment”, BIATEC, Vol. 10, No. 6, pp. 14-17.
Faucompret, E. J. Konings and H. Vandenbussche (1998), “The Integration of Central and Eastern Europe in the European Union: Trade and Labour Market Adjustment”, LICOS Discussion Paper No. 75, Leuven: Centre for Institutions and Economic Performance, http://ideas.repec.org/p/lic/licosd/7598.html accessed on 14/12/2006.
Feldman, M. P. and D. B. Audretsch (1999), “Innovation In Cities: Science-Based Diversity Specialisation and Localised Competition”, European Economic Review, Vol. 43, Issue 2, pp. 409-429.
Fontagné, L. (1999), “Foreign Direct Investment and International Trade – Complements or Substitutes”, OECD Science, Technology and Industry Working Papers, 1999/3, Paris: OECD Publishing, http://ideas.repec.org/p/oec/stiaaa/1999-3-en.html accessed on 13/04/2006.
Fujita, M. (1988), “A Monopolistic Competition Model of Spatial Agglomeration: A Differentiated Products Approach”, Regional Science and Urban Economics, Vol. 18, Issue 1, pp: 87-124.
Fujita, M. and J. F. Thisse (1996), “Economics of Agglomeration”, Journal of the Japanese and International Economies, Vol. 10, No. 4, pp. 339-378.
Fujita, M. and P. Krugman (2004), “The New Economic Geography: Past, Present and the Future”, Papers in Regional Science, Vol. 83, Issue 1, pp. 139-164.
Fujita, M. and T. Mori (2005), “Frontiers of the New Economic Geography”, Papers in Regional Science Vol. 84, No. 3, pp. 377–407.
Galego, A., C. Vieira and I. Vieira (2004) “The CEEC as FDI Attractors, A Menace to the EU Periphery?”, Emerging Markets Finance and Trade, Vol. 40, Issue 5, pp. 74-91.
Gani, A. (2005), “Foreign Direct Investment and Privatisation”, USPEC Working Papers No. 5, Suva: University of South Pacific, http://www.usp.ac.fj/fileadmin/files /schools/ssed/economics/working_papers/2005/wp2005_06.pdf accessed on 15/10/2006.
Glaister, K. W. and H. Atanasova (1998), “Foreign Direct Investment in Bulgaria: Patterns and Prospects”, European Business Review, Vol. 98, No. 2, pp. 122-134.
Gholami, R., S. Lee and A. Heshmati (2005), “The Causal Relationship Between ICT and FDI”, WIDER Research Paper No. 2005/26, Helsinki: World Institute for Development Economics Research, http://www.wider.unu.edu/publications /rps/rps2005/rp2005-26.pdf accessed on 14/08/2007.
Goldberg, M. A. (1972), “The Determinants of US Direct Investments in the EEC: Comment”, American Economic Review, Vol. 62, No. 4, pp. 692–699.
Govindarajan, V. and A. Gupta (2001), “Building an Effective Global Business Team”, MIT Sloan Management Review, Vol. 42, No. 4, pp. 63-71.
Griliches, Z. (1979), “Issues In Assessing the Contribution of R&D to Productivity Growth”, Bell Journal of Economics, Vol. 10, No. 1, pp. 92–116.
Gujarati, D. (1995), Basic Econometrics, 3rd Edition, New York: McGraw-Hill-Irwin.
Gunter V. and G. Roubal (2004), “Accession of the CEE-States to the EU”, Tokyo Club, 09-10 February, Washington, http://www.tcf.or.jp/data/20040209-10_Hans-Gunther_Vieweg_-_Gabariele_Roubal.pdf accessed on 28/04/2007.
Gupta, V. K. (1983), “Simultaneous Determination of Structure, Conduct and Performance in Canadian Manufacturing”, Oxford Economic Papers, Vol. 35, No. 3, pp. 281-301.
Hayek, F. A. (1945), “The Use of Knowledge in Society”, American Economic Review, Vol. 35, No. 4, pp. 519-530.
Harvey, A. C. (1980), “On Comparing Regression Models in Levels and First Differences”, International Economic Review, Vol. 21, No. 3, pp. 707-720.
Hausmann, R. and E. Fernández-Arias (2000), “Foreign Direct Investment: Good Cholesterol?”, Research Department Working Paper Series No. 417, Prepared for the Seminar “The New Wave of Capital Inflows: Sea Change or Just Another Tide” 2000 Annual Meetings of the Board of Governors, Inter-American Development Bank and Inter-American Investment Corporation, http://www1.worldbank.org/economicpolicy /globalization/documents/fdi.pdf accessed on 20/07/2007.
Head K., J. Ries and D. Swenson (1994), “Agglomeration Benefits and Location Choice: Evidence from Japanese Manufacturing Investment in the United States”, NBER Working Paper No. 4767, Cambridge: National Bureau of Economic Research, http://www.nber.org/papersbyprog/ITI.html accessed on 20/12/2006.
Head K., J. Ries and D. Swenson (1994), “The attraction of Foreign Manufacturing Investments: Investment Promotion and Agglomeration Economies”, NBER Working Paper, No. 4878, Cambridge: National Bureau of Economic Research, http://www.nber.org/papersbyprog/ITI.html accessed on 20/12/2006.
.Head K., T. Mayer and J. Ries (2002), “Revisiting Oligopolistic Reaction: Are Decisions on Foreign Direct Investment Strategic Complements?” Journal of Economics and Management Strategy, Vol. 11, No. 3, pp. 453-472.
Hedlund, G. and A. Kverneland (1985), “Are Strategies for Foreign Markets Changing? The Case of Swedish Investment in Japan”, International Studies of Management and Organisation, Vo. 15, No. 2, pp. 41-59.
Helpman, E. (2006), “Trade, FDI and the Organization of Firms”, Journal of Economic Literature, Vol. 44, No. 3, pp. 589-630.
Helpman, E. and P. Krugman (1985), Market Structure and Foreign Trade: Increasing Returns, Imperfect Competition and International Economy, Cambridge (MA): MIT Press.
Henderson, V. (1988), Urban Development: Theory, Fact and Illusion, New York: Oxford University Press.
Hennart, J. F. (1982), Theory of Multinational Enterprise, Ann Arbor: University of Michigan Press.
Hennart, J. F. (1987), “Transaction Costs and the Multinational Enterprise: The Case of Tin”, Business and Economic History, Second Series, Vol. 16, No. 4, pp. 147-159.
Hennart, J. F. (2000), “Theories of the Multinational Enterprise”, in A.M. Rugman and T. L. Brewer (editors), The Oxford Handbook of International Business, Oxford: Oxford University Press, pp. 127-145.
Hilber A. C. and I. Voicu (2006), “Agglomeration Economies and the Location of Foreign Direct Investment: Quasi-Experimental Evidence from Romania”, Research Papers in Environmental and Spatial Analysis No. 105, London: The London School of Economics and Political Science, http://papers.ssrn.com/sol3/papers. cfm?abstract _id=889373 accessed on 20/05/2007.
Hirschman, A. (1958), The Strategy of Economic Development, New Haven (CT): Yale University Press.
Holland, D. and N. Pain (1998), “The Diffusion of Innovations in Central and Eastern Europe: A Study of the Determinants and Impact of Foreign Direct Investment”, NIESR Discussion Papers No. 137, London: National Institute of Economic and Social Research.
Horstman, I. J. and J. R. Markusen (1992), “Endogenous Market Structures in International Trade (Natura Facit Saltum)”, Journal of International Economics, Vol. 32, Issue 1-2, pp. 109-129.
Hošková, A. (2001), “Impact of Foreign Direct Investment on the Economy of Slovakia”, Bratislava: National Bank of Slovakia, Institute of Monetary and Financial Studies, http://www.nbs.sk/BIATEC /HOSKOAN.PDF accessed on 18/11/2006.
Hymer, S. H. (1960/1976), The International Operations of National Firms: A Study of Direct Foreign Investment, PhD thesis, Published posthumously, Cambridge (MA): MIT Press, 1976.
Hungarian Central Statistical Office (2006), http://portal.ksh.hu/portal accessed on 24/02/2006.
Hunya, G. (2000), “Recent Trends, Policies and Challenges in SEE Countries”, Working Papers on International Investment, Paris: Organisation for Economic Co-operation and Development, http://www.oecd.org/dataoecd /47/5/2074778.pdf accessed on 21/10/2007.
Hunya, G. (2002), “FDI in South-Eastern Europe in the Early 2000s”, A Study Commissioned by the Austrian Ministry of Economy and Labour, Vienna: The Vienna Institute for International Economic Studies (WIIW), http://www.oecd.org /dataoecd/52/30/1940829.pdf accessed on 26/10/2007.
Hurst, C. and K. Uppenberg (2002), “Investment Issues in South-Eastern Europe”, Economic and Financial Report (2000/02), Luxembourg: European Investment Bank, http://www.eib.org/attachments/efs/efr00n02.pdf accessed on 25/01/2007.
IMF (2000), “World Economic Outlook - Focus on Transition Economies”, Washington (DC): International Monetary Fund, http://www.imf.org/external/pubs/ft/weo /2000/02/ accessed on 10/01/2007.
Jaffe, A. B. (1996), “Economic Analysis of Research Spillovers Implications for the Advanced Technology Program”, Washington (DC): Advance Technological Progam, http://www.atp. nist.gov/eao/gcr708.htm#II.A#II.A accessed on 12/01/2007.
Janicki, H. P. and P. V. Wunnava (2004) “Determinants of Foreign Direct Investment: Empirical Evidence from EU Accession Candidates”, Applied Economics, Vol. 36, No. 5, pp. 505-509.
Javorcik, B., K. Saggi and M. Spatareanu (2004), “Does It Matter Where You Come From? Vertical Spillovers from Foreign Direct Investment and the Nationality of Investors”, World Bank Policy Research Working Paper No. 3449, Washington (DC): World Bank, http://ideas.repec.org/p/wbk/wbrwps/3449.html accessed on 01/11/2005.
Johanson, J. and J. Vahlne (1977), “The Internationalisation Process of the Firm – A Model of Knowledge Development and Increasing Market Commitments”, Journal of International Business Studies, Vol. 8, No. 1, reprinted in P. J. Buckley and P. N. Ghauri (editors), The Internationalization of the Firms: A Reader, 2nd edition, London: International Thomson Business Press.
Johanson, J. and F. Wiedersheim – Paul (1975), “The Internationalisation of the Firm: Four Swedish Cases”, Journal of Management Studies, Vol. 12, No. 3, pp. 305-322.
Johnson, A. (2006), “FDI Inflows to the Transition Economies in Eastern Europe: Magnitude and Determinants”, CESIS Working Paper No. 59, Stockholm: Centre of Excellence for Science and Innovation Studies, Royal Institute of Technology, http://www.infra.kth.se /cesis/documents/WP59.pdf accessed on 22/02/2007.
Johnston, J. and J. DiNardo (1997), Econometric Methods, 4th edition., New York: McGraw-Hill.
Jolly, V. K., M. Alahuhta and J. P. Jeannet (1992), “Challenging the Incumbents: How High-Technology Starts-Up Compete Globally”, Journal of Strategic Change, Vol. 1, No. 2, pp. 71-82.
Judit, L. and K. Janák (1995), Research and Development, Resources Statistics Department, Cultural Statistics Section of Hungarian Central Statistic Office, http://portal.ksh.hu/portal/page?pageid=38,119919&_dad=portal& schema=PORTAL accessed on 15/10/2007.
Jun, K. W. and H. Singh (1996), “The Determinants of Foreign Direct Investment in Developing Countries”, Transnational Corporations, Vol. 5, No. 2, pp. 67-105.
Kalotay, K. and G. Hunya (2000), “Privatisation and FDI in Central and Eastern Europe”, Transnational Corporations, Vol. 9, No. 1, pp. 39-63.
Kaminski, B. (2006), Foreign Direct Investment and Central Europe’s Reintegration into Global Economy, Washington D.C: College Park and World Bank.
Kaminski, B. and B. Smarzynska (2001), “Foreign Direct Investment and Integration into Global Production and Distribution Networks: The Case of Poland”, World Bank Research Working Paper No. 2646, Washington (DC): The World Bank Development Research Group, http://papers.ssrn.com/sol3/papers.cfm?abstract id=632714 accessed on 16/05/2007.
Kinoshita, Y. and N. F. Campos (2002), “The Location Determinants of Foreign Direct Investment in Transition Economies”, William Davidson Institute and CEPR,
http://project.iss.u-tokyo.ac.jp/nakagawa/members/papers/3(9)kinoshita.final.pdf accessed on 20/12/2006.
Kinoshita, Y. and N. F. Campos (2006), “A Re-Examination of Determinants of Foreign Direct Investment in Transition Economies”, William Davidson Institute and CEPR, http://www.econ.sinica.edu.tw/activities/past/20060222.pdf accessed on 20/12/2006.
Kogut, B. and U. Zander (1993), “Knowledge of the Firm and the Evolutionary Theory of the Multinational Corporation”, Journal of international business studies, Vol. 24, No. 4, pp. 625-636.
Ko, K. W. (2007), “Internet Externalities and Location of Foreign Direct Investment: A Comparison Between Development and Developing Countries”, Information Economics and Policy, No. 19, No. 1, pp. 1-23.
Konings, J. (2004), “The Employment Effect of Foreign Direct Investment”, European Investment Bank Papers, Vol. 9, No. 1, pp. 87-108.
Kotler, P. (1980), Principles of Marketing, Englewood Cliffs N.J.: Prentice Hall, Inc.
Knickerbocker, F. (1973), Oligopolistic Reaction and Multinational Enterprise, Cambridge, MA: Harvard University Press.
Kravis, I. B. and R. E. Lipsey (1982), “The Location of Overseas Production for Export by US Multinational Firms”, Journal of International Economics, Vol. 12, No. 3/4, pp. 201-223.
Král, P. (2004), “Identification and Measurement of Relationships Concerning Inflow of FDI: The Case of the Czech Republic”, CNB Working Paper No. 5, Prague: Czech National Bank, http://ideas.repec.org/p/cnb/wpaper/2004-05.html accessed on 15/02/2007.
Krugman, P. R (1991), Geography and Trade, Cambridge (MA): MIT Press.
Lankes, H. P. and A. J Venables (1996), “Foreign Direct Investment in Economic Transition: The Changing Pattern of Investments”, Economies of Transition, Vol. 4, No. 2, pp. 331-347.
Lansbury, M., N. Pain and K. Smidkova (1996), “Foreign Direct Investment in Central Europe Since 1990: An Econometric Study”, National Institute Economic Review, Vol. 156, No. 1, pp. 104-113.
Lemoine, F. (1998), “Integrating Central and Eastern Europe in the European economy”, Working Paper Series 1063, UCAIS Berkeley Roundtable on the International Economy, Berkeley: University of California, http://ideas.repec.org/p/cdl/ucbrie/ 1063.html accessed on 14/03/2007.
Leibrecht, M. and C. Bellak (2005), “Foreign Direct Investment in Central and Eastern European Countries: A Panel Data Study”, http://www.itax.at/pdf/bellak_leibrecht nottingham.pdf accessed on 20/06/2006.
Levy, S. (2007), “U.S.’s Broadband Penetration is Lower than Even Estonia’s”, Newsweek, July 2/July 7 2007.
Lim, D. (1983), “Fiscal Incentives and Direct Foreign Investment in Less Developed Countries”, Journal of Development Studies, Vol. 19, No. 2, pp. 207-212.
Loustarinen, R. (1979), “Internationalisation of the Firm. An Empirical Study of the Internationalisation of Firms with Small and Open Domestic Market, With Special Emphasis on Lateral Rigidity as Behavioural Characteristic in Strategic Decision-Making”, Series A, No. 30., Helsinki: Helsinki School of Economics.
Lunn, J. (1980), “Determinants of US Direct Investment in the EEC Further Evidence”, European Economic Review, Vol. 13, Issue 1, pp. 93-101.
Lunn, J. (1983), “Determinants of US direct Investment in the EEC Revisited Again”, European Economic Review, Vol. 21, Issue 3, pp. 391-393.
Magyar Nemzeti Bank (2005), “Foreign Direct Investment Hungary 1995-2003”, Budapest: Magyar Nemzeti Bank, http://www.mnb.hu/Engine.aspx accessed on 26/09/2006.
Mariotti, S., and L.Piscitello, (1995), "Information Costs and Location of FDIs within the Host Country: Empirical Evidence from Italy", Journal of International Business Studies, Vol. 26, No. 4, pp. 815-841.
Markusen, J. R. (1984), “Multinationals, Multi-Plant Economies, and Gains from Trade”, Journal of International Economics, Vol. 16, No. 3/4, pp. 205-226.
Markusen, J. R. and K. E. Maskus (1999), “Multinational Firms: Reconciling Theory and eEvidence”, NBER Working Paper No. 7163, Cambridge (MA): National Bureau of Economic Research, http://ideas.repec.org/p/nbr/nberwo/7163.html accessed on 26/09/2006.
Marshall, A. (1920), Principles of Economics, London: Macmillan.
Matambalaya, F. and S.Wolf, (2001), “The Role of ICT for the Performance of SMEs in East Africa”, ZEF Discussions Papers on Development, No. 42, Centre for Development and Research, Bonn: University of Bonn.
Matthews, R. (1986), “The Economics of Institutions and the Source of Growth”, Economic Journal, No. 96, No. 384, pp. 903-918.
McKinsey &Co. (1993), “Emerging Exporters. Australia’s High Value-Added Manufacturing Exporters”, McKinsey & Company and the Australian Manufacturing Council, Melbourne.
Merlevede, B. and K. Schoors (2004), “Determinants of Foreign Direct Investment in Transition Economies”, Department of Economics and CERISE, Centre for Russian International Socio-Political and Economic Studies, Ghent: Ghent University,
http://www.eui.eu/ECO/Conferences/accession_countries/papers/EUIconferenceMay2004_paperMerlevede.pdf accessed on 10/01/2007.
Meyer, K. E. (1997), “The Determinants of West-East Business: An Analysis of Ownership Advantages”, CEES Working Paper No. 003, Copenhagen: Centre for East European Countries, http://papers.ssrn.com/sol3 /papers.cfm? abstract_id=11084 accessed on 20/10/2006.
Meyer, K. E. (1998), Direct Investment in Economies in Transition, Aldershot: Edward Elgar.
Meyer, K. E. (2001), “International Business Research on Transition Economies”, in: T. Brewer and A. Rugman, (editors), Oxford Handbook of International Business, Oxford: Oxford University Press.
Meyer, K. E., S. Estrin, and S. Bhaumik (2004), “Greenfield Versus Cooperative Entry in Emerging Economies: A Resource-Based and Institutional Perspective”, Centre for New and Emerging Markets Discussion Paper Series, No. 33, London: London Business School.
MIGA-FIAS Research Project (2005), “Competing for FDI”, Investing in Development Series, No. 31916, Washington: World Bank.
Mody, A. (1997), Infrastructure Strategies in East Asia: The Untold Story, Washington (DC): World Bank.
Moosa, I. A. and B. A. Cardak (2006), “The Determinants of Foreign Direct Investment: An Extreme Bound Analysis”, Journal of Multinational Financial Management, Vol. 16, No. 2, pp. 199-211.
Moucque, D. (2000), “A Survey of Socio-Economic Disparities between the Regions of the EU”, European Investment Bank Papers, Vol. 5, No. 2, Luxembourg: European Investment Bank.
Mudambi, R. (2001), “The Location of the Multinational Firm: A Survey”, Discussion Papers in International Investment and Management No. 291, Reading: University of Reading, http://papers.ssrn.com/sol3/papers.cfm?abstract_id=304359 accessed on 20/04/2006.
Mundell, R. A. (1957), “International Trade and Factor Mobility”, The American Economic Review, Vol. 47, No. 3, pp. 321-335.
Murgasova Z. (2005), “Post-Transition Investment Behaviour in Poland: A Sectoral Panel Analysis”, IMF No. 184, Washington (DC): International Monetary Fund http://papers.ssrn.com/sol3 /papers.cfm ?abstract id=888053 accessed on 25/01/2007.
Mutti, J. H. (2003), Foreign Direct Investment and Tax Competition, Washington DC: Institute for International Economics.
Myrdal, G. (1957), Economic Theory and Underdeveloped Regions, London: Duckworth.
Nachum, L. and S. Zaheer, “MNES in the Digital Economy?”, Work Paper No. 236, ESRC Centre for Business Research, Cambridge: University of Cambridge.
Nellis, J. (2002), “The World Bank, Privatisation and Enterprise Reform in Transition Economies- a Retrospective Analysis”, The World Bank Operations Evaluation Department, Washington (DC): World Bank.
OECD (2005), Investment Policy Reviews Romania, Paris: Organisation for Economic Co-operation and Development.
OECD, Statistics Portal; http://www.oecd.org/statsportal/0,3352,en_2825_293564_1_1_ 1_1_1,00.html accessed on 26/05/2006.
OECD (2002), The OECD Economic Outlook: Sources and Methods, Paris: Organisation for Economic Co-operation and Development.
OECD (2001), “Growth, Technology, Transfer and Foreign Direct Investment”, OECD Global Forum on International Investment, 26-27 November 2001, Mexico City, http://www.oecd.org/publications/0,3353,en_2649_201185_1_1_1_1_1,00.html accessed on 20/06/2006.
Oviatt, B. M. and P. P. McDougall (1994), “Toward a Theory of International New Ventures”, Journal of International Business Studies, Vol. 25, First Quarter, pp. 45-64.
Owen, R. F. (1982), “Inter-industry Determinants of Foreign Direct Investment: A Canadian Perspective”, in A. M. Rugman, (editor), New Theories of Multinational Enterprises, London: Croom Helm.
Papanastassiou, M. and R. D. Pierce (1990), “Host Countries Characteristics and the Sourcing Behaviour of UK Manufacturing Industry”, Discussion Paper in International Investment and Business Studies, Series B, Vol. 3, No. 140, Department of Economics, Reading: University of Reading.
Perez, T. (1997), “Multinational Enterprises and Technological Spillovers: An Evolutionary Model”, Journal of Evolutionary Economics, Vol. 7, No. 2, pp. 169-92.
Pistoresi B. (2000), “Investimenti diretti esteri e fattori di localizzazione: L’America Latina e il Sud Est Asiatico”, Rivista di Politica Economia, Vol. 90, pp. 27-44.
Porter, M. E. (1990), The Competitive Advantage of Nations, London: Macmillan.
Przybylska, K. and A. Malina (2000), “The Determinants of Foreign Direct Investment in Transforming Economies: Empirical Evidence from Poland”, Statistics in Transition, Vol. 4, No. 5, pp. 883-889.
Pusterla, F. and L. Resmini (2005), “Where Do Firms Locate in Transition Countries? An Empirical Investigation”, ISLA Working Paper No. 20, Centre for research on Latin American Studies and Transition Economies, Milano: Bocconi University, ftp://ftp.unibocconi.it/pub /RePEc /slp/papers /islawp20.pdf accessed on 23/02/2007.
Resmini, L. (1999), “The Determinants of Foreign Direct Investment into the CEECs: New Evidence from Sectoral Patterns”, LICOS Discussion Paper No. 83, Leuven: Centre for Transition Economics, http://ideas.repec.org/p/lic/licosd/8399.html accessed on 25/03/2006
Romanian Agency for Foreign Investment, http://www.arisinvest.ro/ accessed on 10/01/2006.
Romer, D. (2001), Advanced Macroeconomics, Boston (MA): McGraw-Hill.
Rosenthal, S. S. and W. C. Strange (2001), “The Determinants of Agglomeration”, Journal of Urban Economics, Vol. 50, No. 2, pp. 191-229.
Rugman, A. M. (1981), Inside the Multinationals: The Economics of Internal Markets, New York: Columbia University Press.
Rugman, A. M. and A. Verbeke, Location (2001), “Competitiveness and the Multinational Enterprise”, in A. M. Rugman and T. L. Brewer, (editors), The Oxford Handbook of International Business, Oxford: Oxford University Press, pp. 36-68.
Rugman, A. M. and A. Verbeke (2002), “Extending the Theory of the Multinational Enterprise: Internalisation and Strategic Management Perspectives”, Journal of International Business Studies, Vol. 34, No. 2, pp. 125-137.
Sabol, T. and A. Hošková (2003), “Foreign Direct Investment in the Slovak Economy and Its Influence on the Business Sector”, BIATEC, Vol. 11, No. 1, pp. 19-22.
Sass, M. (2004), “FDI in Hungary - The First Mover Advantage and Disadvantage”, EIB Papers, Vol. 9, European Investment Bank Papers, Luxembourg: European Investment Bank.
Saunders, R. (1982), “The Determinants of Interindustry Variation of Foreign Ownership in Canadian Manufacturing”, The Canadian Journal of Economics, Vol. 15, No. 1, pp. 77-84.
Scaperlanda, A (1967), “The E.E.C. and US Foreign Investment: Some Empirical Evidence”, Economic Journal, Vol. 77, No. 305, pp. 22-26.
Scaperlanda, A. and R. S Balough, (1983), “Determinants of US Direct Investment in the EEC”, European Economic Review, Vol. 21, No. 3, pp. 381-390.
Scaperlanda, A. and L. J. Mauer (1969), “The Determinants of US Direct Investment in the EEC”, American Economic Review, Vol. 59, No. 4, pp. 558-566.
Schmitz, A. (1970), “The Impact of Trade Blocs on Foreign Direct Investment”, The Economic Journal, Vol. 80, No. 319, pp. 724-731.
Schmitz, A. and J. Bieri (1972), “EEC Tariffs and U.S. Direct Investment”, European Economic Review, Vol. 3, No. 3, pp. 259-270.
Singh, H. and K. W. Jun (1995), “Some New Evidence on Determinants of Foreign Direct Investment in Developing Countries”, World Bank Policy Research Working Paper No. 1531, Washington (DC): World Bank, http://econpapers.repec.org/paper /wbkwbrwps/1531.htm accessed on 15/01/2007.
Stanek, P. (2005), “Questionnaire for EIRO Comparative Study on Relocation of Production and Industrial Relations – Case of Slovakia”, Bratislava: Slovak Academy of Science, Institute of Slovak and World Economy.
STATA(2006), Resources and Support, http://www.stata.com/support/faqs/stat/#models accessed on 20/05/2006.
Swan T. W. (1956), "Economic Growth and Capital Accumulation", Economic Record, Vol. 32, No. 2, pp. 334-61.
Swain, N. J. and Z. Q. Wang (1995) “The Determinants of Foreign Direct Investment in Transforming Economies: Empirical Evidence from Hungary and China”, Weltwirtschaftliches Archiv, No. 131, No. 2, pp. 359-82.
Solow, R. M. (1956), “A Contribution to the Theory of Economic Growth”, Quarterly Journal of Economics, Vol. 70, No. 1, pp. 65-94.
Tavares, A. T. (2001), Systems, Evolution and Integration: Modelling the Impact of Economic Integration on Multinationals’ Strategies, Unpublished PhD thesis, Department of Economics, Reading: University of Reading.
Tavares, A. T. and S. Young (2005), “FDI and Multinationals: Patterns, Impacts and Policies”, International Journal of the Economic Business, Vol. 12, No. 1, pp. 3-17.
Tondel, L. (2001), “Foreign Direct Investment During Transition: Determinants and Patterns in Central and Eastern Europe and the Former Soviet Union", Chr. Michelsen Institute Working Paper No. 2001:9, Bergen: Chr. Michelsen Institute.
Tirole, J. (1993), The Theory of Industrial Organization, Cambridge (MA): MIT press.
Tripon, C. (2003), “Foreign Direct Investment in Romania, Challenging the Romanian Legal Framework using the Delaware Model of Company Law”, Unpublished Doctoral dissertation, Legal Studies Department, Budapest: Central European University.
UNCTAD (1995), World Investment Report: Transnational Corporations and Competitiveness, New York (NY): UN.
UNCTAD (1996), World Investment Report: Investment, Trade and International Policy Arrangements, New York (NY): UN.
UNCTAD (2000), World Investment Report: Cross Border Mergers and Acquisitions and Development, New York (NY): UN.
UNCTAD (2001), World Investment Report: Promoting Linkages, New York (NY): UN.
UNCTAD (2003), World Investment Directory Central and Eastern Europe, Vol. 8, New York (NY): UN.
UNCTAD (2005), Handbook of statistics, international finance - Part Six, New York (NY): UN.
UNCTAD (2006), Statistics, Sources and Notes, http://www.unctad.org/Templates/ Page.asp?intItemID=1633&lang=1 accessed on 15/08/2007
UNCTAD (2006), World Investment Report 2006: FDI from Developing and Transition Economies: Implications for Development, New York (NY): UN.
UNCTAD (2007), World Investment Report 2007: Transnational Corporations, Extractive Industries and Development, New York (NY): UN.
UNCTAD (2006), Foreign Direct Investment Database, FDI on-line, http://stats.unctad. org/FDI/ReportFolders/ReportFolders.aspx accessed on 24/06/2006.
UNCTC (1992), The Determinants of Foreign Direct Investment - A survey of the Evidence, New York (NY): UN.
UNCTC (1998), World Investment Report 1998: Trends and Determinants, New York (NY): UN.
Uppenberg, K. and A. Riess (2004), “Determinants and Growth Effects of Foreign Direct Investments”, EIB Papers, Vol. 9, No. 1, European Investment Bank Papers, Luxembourg: European Investment Bank.
Van Ark, B. (1999), “Economic Growth and Labour Productivity in Europe: Half a Century of East-West Comparisons”, Groningen Growth and Development Centre, Groningen: University of Groningen, http://www.eco.rug.nl/ggdc accessed on 20/01/2007.
Vernon, R. (1966), “International Investment and International Trade in the Product Cycle”, Quarterly Journal of Economics, Vol. 80, No. 2, pp. 190-207.
Vernon, R. (1979), “The Product Cycle Hypothesis in a New International Environment”; Oxford Bulletin of Economics and Statistics, Vol. 41, No. 4, pp. 255-267.
Walkenhorst, P. (2004), “Economic Transition and the Sectoral Patterns of Foreign Direct investment”, Emerging Markets Finance and Trade, Vol. 40, No. 2, pp. 5-26.
Wallace, C., C. Haerpfer and R. Latcheva (2004), “The Informal Economy in East-Central Europe 1991-1998”, Sociological Series No. 64, Vienna: Institute for Advanced Studies.
Welch, L. S., and R. K. Luostarinen (1988), "Internationalization: Evolution of a Concept", Journal of General Management, Vol. 14, No. 2, pp. 36-64.
Wheeler, D. and A. Mody (1992), “International Investment Location Decisions – the Case of U.S. firms”, Journal of International Economics, Vol. 33, pp. 57-76.
Wood, G. A. and J. B. Parr, (2005), “Transaction Costs, Agglomeration Economies, and Industrial Location, Growth and Change”, Vol. 36, No. 1, pp. 1-15.
Woodward, D. P., R. J. Rolfe, P. Guimaraes and T. Doupnik (2000), “Taxation and the Location of Foreign Direct Investment in Central Europe” in K. Fatemi (editor), The New World Order–Internationalism, Regionalism and the Multinational Corporations, New York: Pergamon.
Wooldridge, J. (2006), Econometric Analysis of Cross Section and Panel data, San Diego: University of California, http://www.ats.ucla.edu/stat/ accessed on 25/06/2006.
World Bank (2001), Global Development Finance 2001, Washington (DC): World Bank.
World Bank (2005), World Development Indicators, http://www.worldbank.org/ accessed on 12/01/2006.
Williamson, O. (1975), Markets and Hierarchies, New York: The Free Press.
Williamson, O. (1981). “The Modern Corporation: Origins, Evolution, Attributes”, Journal of Economic Literature, Vol. 19, No. 4, pp. 1537–1568.
Zaheer, S. (1995), “Overcoming the Liability of Foreignness”, Academy of Management Journal, Vol. 38, No. 2, pp. 341-363.
Zemplinerová, A. (2003), “The Importance of Foreign-owned Enterprises in Catching-up Process”, In Liebscher, J. Christl, P. Mooslechner and D. Ritzberger-Grünwald (editors), The Economic Potential of a Larger Europe, Cheltenham (UK) and Northampton (MA): Edward Elgar, pp. 97-109.
Zylbersztajn, D. and E. Farina (1999), “Strictly Coordinated Food-Systems: Exploring the Limits of the Coasian Firm”, International Food and Agribusiness Management Review, Vol. 2, No. 2, pp. 249-265.