Embed Size (px)
Citation preview

FCT Annual Report 2010
DELIVERING GROWTH
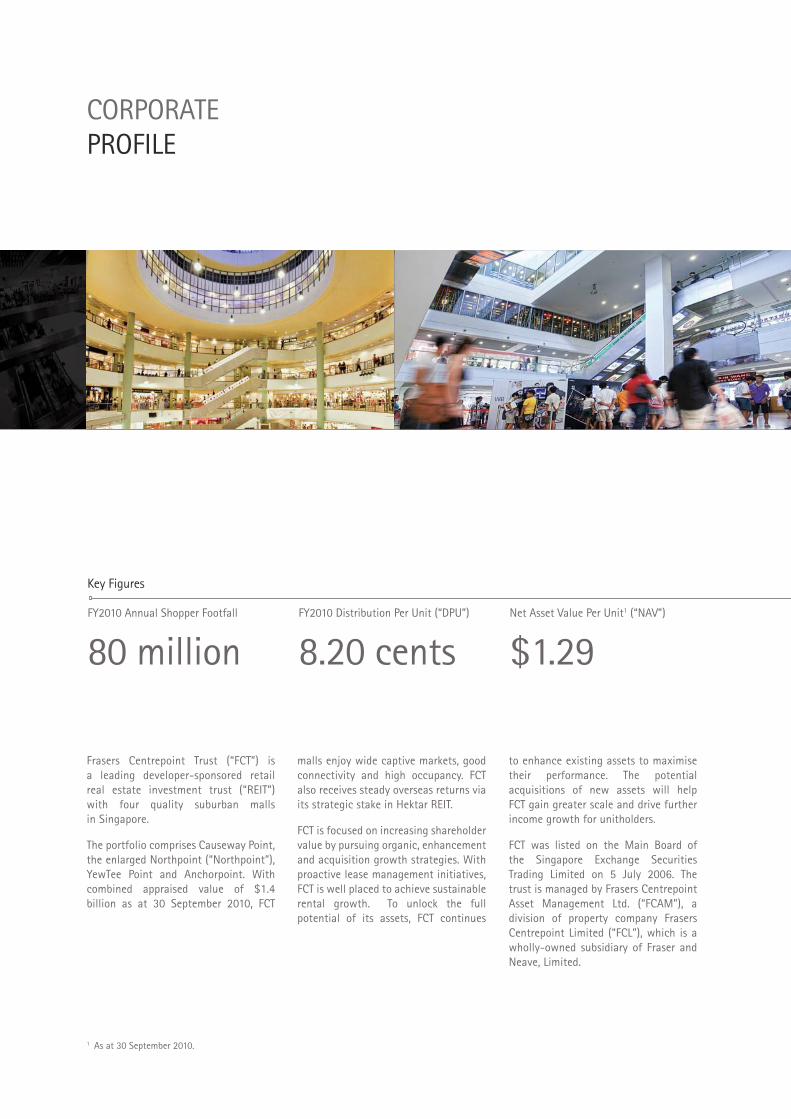
malls enjoy wide captive markets, good connectivity and high occupancy. FCT also receives steady overseas returns via its strategic stake in Hektar REIT.
FCT is focused on increasing shareholder value by pursuing organic, enhancement and acquisition growth strategies. With proactive lease management initiatives, FCT is well placed to achieve sustainable rental growth. To unlock the full potential of its assets, FCT continues
Key Figures
FY2010 Distribution Per Unit (“DPU”)
8.20 centsFY2010 Annual Shopper Footfall
80 millionNet Asset Value Per Unit1 (“NAV”)
$1.29
to enhance existing assets to maximise their performance. The potential acquisitions of new assets will help FCT gain greater scale and drive further income growth for unitholders.
FCT was listed on the Main Board of the Singapore Exchange Securities Trading Limited on 5 July 2006. The trust is managed by Frasers Centrepoint Asset Management Ltd. (“FCAM”), a division of property company Frasers Centrepoint Limited (“FCL”), which is a wholly-owned subsidiary of Fraser and Neave, Limited.
Frasers Centrepoint Trust (“FCT”) is a leading developer-sponsored retail real estate investment trust (“REIT”) with four quality suburban malls in Singapore.
The portfolio comprises Causeway Point, the enlarged Northpoint (“Northpoint”), YewTee Point and Anchorpoint. With combined appraised value of $1.4 billion as at 30 September 2010, FCT
CORPORATE PROFILE
1 As at 30 September 2010.
01 CORPORATE PROFILE
Editorial
Corporate Profile 01
FCT at a Glance 02
Portfolio Overview 04
Letter to Unitholders 06
Acquisition Growth 08
Enhancement Growth 10
Organic Growth 12
Key Events 14
Organisational Details
Organisational Structure 17
Board of Directors 18
Trust Management Team 20
Property Management Team 22
Investor Relations 24
Community Engagement 26
Operational & Financial Review
Operational 29 & Financial Review
Portfolio Review 33
Capital Resources 36
Risk Management 37
Market Overview 38
Mall Profiles
Causeway Point 40
Northpoint 42
YewTee Point 44
Anchorpoint 46
Hektar REIT 48
Corporate Governance 51
Financials
Financial Statements 65
Additional Information 113
Statistics of Unitholders 114
Notice of Annual 116 General Meeting
From left to right
Causeway Point Northpoint YewTee Point Anchorpoint
02
FCT AT A GLANCE
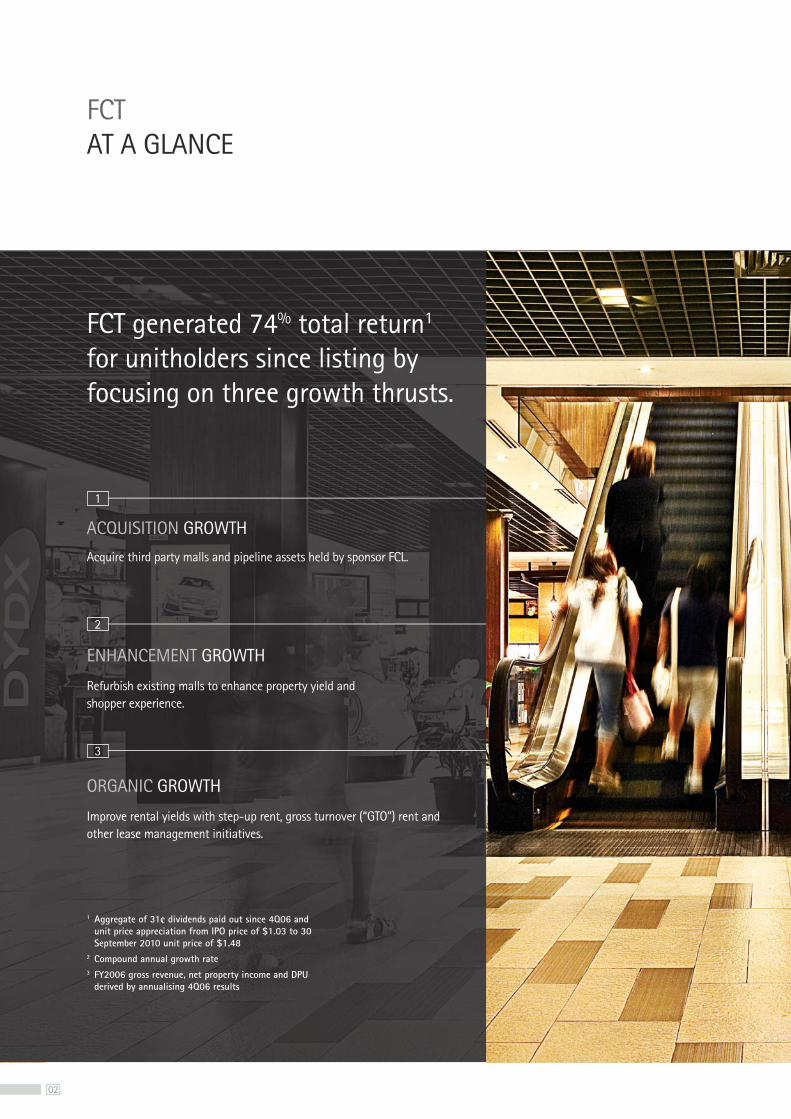
FCT generated 74% total return1 for unitholders since listing by focusing on three growth thrusts.
ACQUISITION GROWTH
Acquire third party malls and pipeline assets held by sponsor FCL.
ENHANCEMENT GROWTH
Refurbish existing malls to enhance property yield and shopper experience.
ORGANIC GROWTH
Improve rental yields with step-up rent, gross turnover (“GTO”) rent and other lease management initiatives.
1
2
3
1 Aggregate of 31¢ dividends paid out since 4Q06 and unit price appreciation from IPO price of $1.03 to 30 September 2010 unit price of $1.48
2 Compound annual growth rate3 FY2006 gross revenue, net property income and DPU
derived by annualising 4Q06 results
03 FCT AT A GLANCE
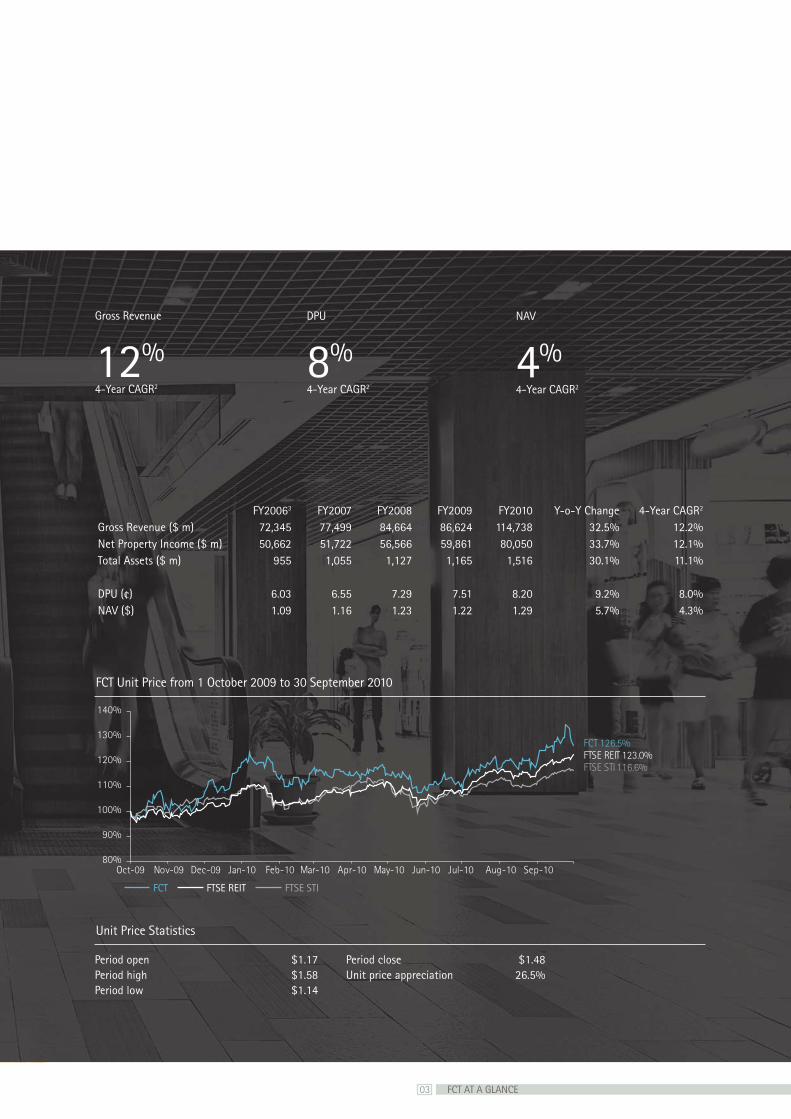
Period open $1.17 Period close $1.48Period high $1.58 Unit price appreciation 26.5%Period low $1.14
Unit Price Statistics
Gross Revenue
12%4-Year CAGR2
FTSE REIT
DPU
8%4-Year CAGR2
NAV
4%4-Year CAGR2
FCT Unit Price from 1 October 2009 to 30 September 2010
FCT 126.5%
FTSE STI 116.6%
FTSE REIT 123.0%
80%
90%
100%
110%
120%
130%
140%
Oct-09 Nov-09 Dec-09 Jan-10 Feb-10 Mar-10 Apr-10 May-10 Jun-10 Jul-10 Aug-10 Sep-10
FCT FTSE STI
FY20063 FY2007 FY2008 FY2009 FY2010 Y-o-Y Change 4-Year CAGR2
Gross Revenue ($ m) 72,345 77,499 84,664 86,624 114,738 32.5% 12.2%Net Property Income ($ m) 50,662 51,722 56,566 59,861 80,050 33.7% 12.1%Total Assets ($ m) 955 1,055 1,127 1,165 1,516 30.1% 11.1%
DPU (¢) 6.03 6.55 7.29 7.51 8.20 9.2% 8.0%NAV ($) 1.09 1.16 1.23 1.22 1.29 5.7% 4.3%
04
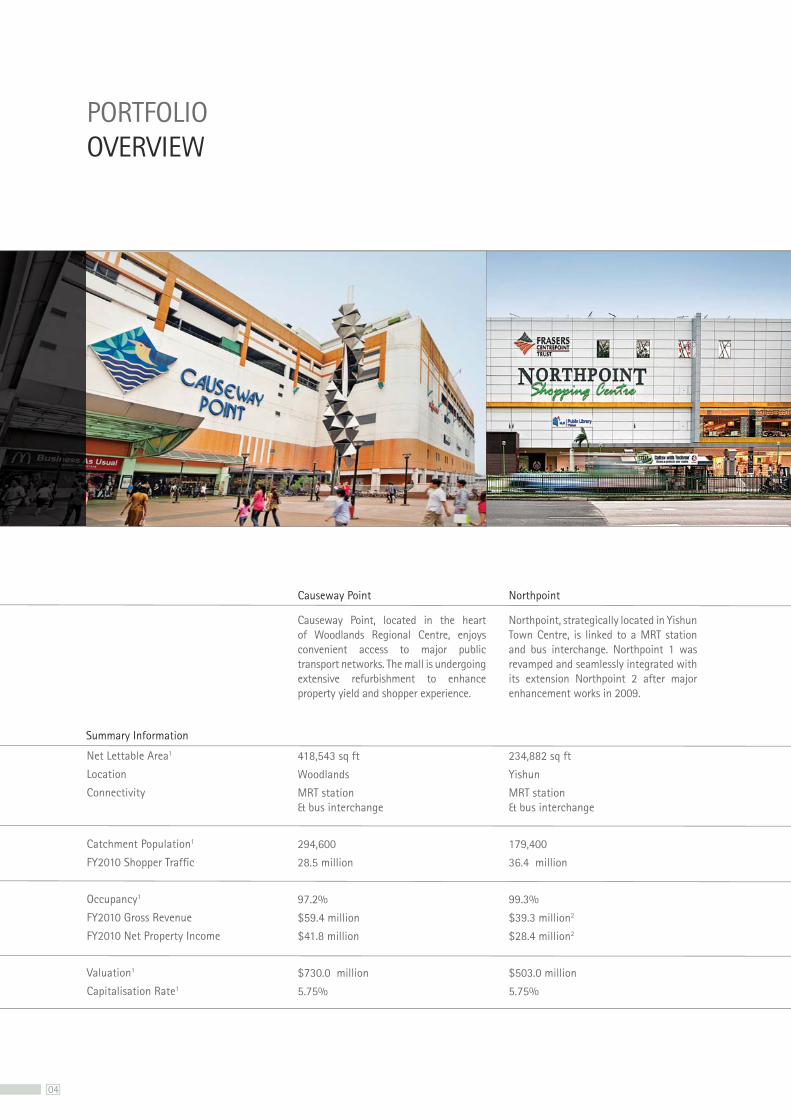
Causeway Point, located in the heart of Woodlands Regional Centre, enjoys convenient access to major public transport networks. The mall is undergoing extensive refurbishment to enhance property yield and shopper experience.
418,543 sq ft
Woodlands
MRT station & bus interchange
294,600
28.5 million
97.2%
$59.4 million
$41.8 million
$730.0 million
5.75%
Northpoint, strategically located in Yishun Town Centre, is linked to a MRT station and bus interchange. Northpoint 1 was revamped and seamlessly integrated with its extension Northpoint 2 after major enhancement works in 2009.
234,882 sq ft
Yishun
MRT station & bus interchange
179,400
36.4 million
99.3%
$39.3 million2
$28.4 million2
$503.0 million
5.75%
Net Lettable Area1
Location
Connectivity
Catchment Population1
FY2010 Shopper Traffic
Occupancy1
FY2010 Gross Revenue
FY2010 Net Property Income
Valuation1
Capitalisation Rate1
PORTFOLIO OVERVIEW
Causeway Point Northpoint
Summary Information
05 PORTFOLIO OVERVIEW
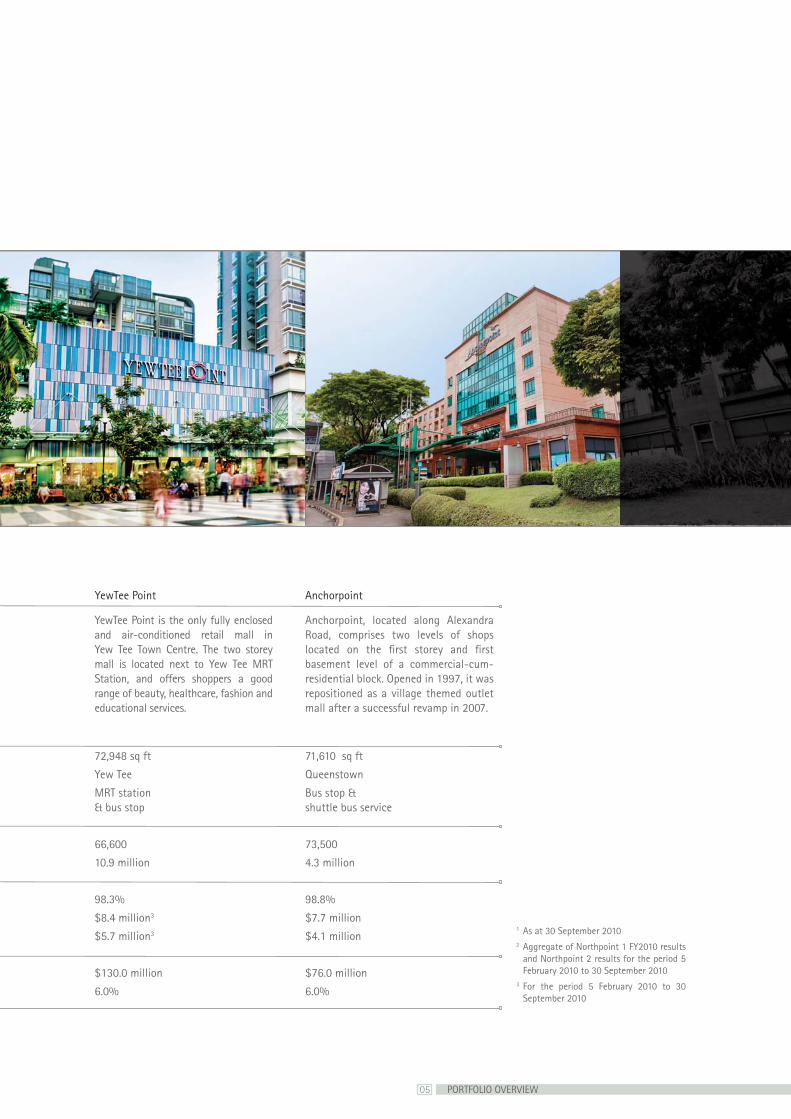
Anchorpoint, located along Alexandra Road, comprises two levels of shops located on the first storey and first basement level of a commercial-cum-residential block. Opened in 1997, it was repositioned as a village themed outlet mall after a successful revamp in 2007.
71,610 sq ft
Queenstown
Bus stop & shuttle bus service
73,500
4.3 million
98.8%
$7.7 million
$4.1 million
$76.0 million
6.0%
YewTee Point is the only fully enclosed and air-conditioned retail mall in Yew Tee Town Centre. The two storey mall is located next to Yew Tee MRT Station, and offers shoppers a good range of beauty, healthcare, fashion and educational services.
72,948 sq ft
Yew Tee
MRT station & bus stop
66,600
10.9 million
98.3%
$8.4 million3
$5.7 million3
$130.0 million
6.0%
AnchorpointYewTee Point
1 As at 30 September 20102 Aggregate of Northpoint 1 FY2010 results
and Northpoint 2 results for the period 5 February 2010 to 30 September 2010
3 For the period 5 February 2010 to 30 September 2010
06
LETTER TO UNITHOLDERS
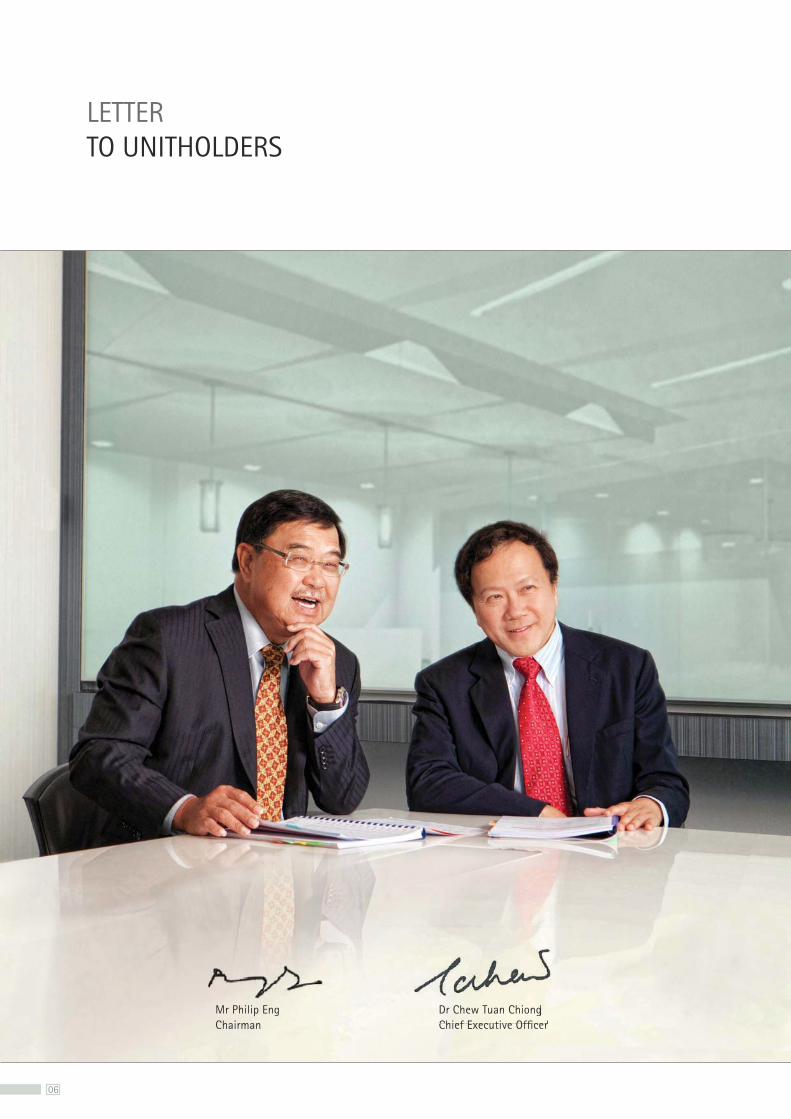
Mr Philip EngChairman
Dr Chew Tuan ChiongChief Executive Officer
Mr Philip Eng Dr Chew Tuan ChiongChief Executive Officer
07 LETTER TO UNITHOLDERS
Active Community EngagementAs an integral member of the community, FCT malls foster closer relationships with residents by actively sponsoring social and community events. Details of its considerable corporate social responsibility programme may be found in the “Community Engagement” section of the Annual Report. Highlights of community events sponsored by FCT include the “Rice for a Good Cause” charity initiative, which raised over 19,000 bowls of rice for needy families and the “National Youth Business Challenge”, which gave students the opportunity to test their retail and entrepreneurship skills.
Multiple AccoladesIn December 2009, Asiamoney Magazine conferred the prestigious “Small-Cap Corporate of the Year in Singapore” award on FCT. The magazine polls fund managers and analysts annually to determine the best managed companies in Asia. Asiamoney lauded FCT for its resilient financial performance during the economic downturn and shareholder friendly policies. We are also pleased to receive affirmation from an independent party that FCT upkeeps the highest standards of corporate governance. In September 2010, CLSA ranked FCT in the top quartile for corporate governance in Asia.
Positive OutlookFCT is firing on all cylinders. The rental outlook for next year is positive as economists expect a buoyant economy to translate into higher retail sales. Bedok Point, developed by the sponsor of FCT, was completed in November 2010. The mall is the only enclosed shopping centre in Bedok residential district and serves a large population catchment of 295,000 residents. Bedok Point will be a prime acquisition target for FCT once operations stabilise and capital market conditions are favourable. Causeway Point, the dominant mall in Woodlands regional centre, is set to get a new lease of life with the commencement of refurbishment works. Costing $72 million, the enhancement programme is designed to extract maximum value from the mall. The focus of the enhancement works will be to alter its trade mix and reconfigure its layout to release prime retail space. Net property income at the mall is targeted to increase by approximately 20%, delivering a return on investment of 13% for the enhancement programme.
AcknowledgementsWe wish to thank and express our gratitude to Mr Christopher Tang, who stepped down as Chief Executive Officer in March 2010. Christopher deftly led FCT through the recent global financial crisis, and was instrumental in the successful acquisitions of Northpoint 2 and YewTee Point. We are delighted that Christopher will continue to contribute to FCT by remaining as a Director of the Board. In addition, special mention goes to our staff for their dedication and commitment to make FCT a premier retail REIT. Last but not least, we wish to express our sincere appreciation to our tenants, shoppers, business partners and unitholders for their strong support of FCT.
Dear unitholders,
We are delighted to share with you the progress that FCT has made in the Financial Year ended 30 September 2010 (“FY2010”).
Record EarningsFor the fourth year in a row, FCT has delivered strong year-on-year earnings growth to unitholders. Gross revenue grew 32% from last year to a record $114.7 million in FY2010. Similarly, DPU grew 9% from the previous year to a new high of 8.2 cents. The contributions from newly acquired assets and the refurbished Northpoint 1 were instrumental in driving the excellent FY2010 results.
Since listing in 2006, gross revenue and DPU have grown by compound annual growth rates of 12% and 8% respectively. This exceptional earnings trend is even more remarkable when viewed against the backdrop of the recent financial upheavals of the global financial crisis.
Greater Size and Liquidity The acquisition of Northpoint 2 and YewTee Point in February 2010 reinforced FCT’s position as a leading Singapore retail REIT. The acquisitions enlarged asset base by 30% to $1.5 billion, giving the trust greater market penetration and better economies of scale. Both acquisitions were immediately accretive to unitholders, even though FCT issued new units to part-finance the deal. The private placement exercise itself was a resounding success. Close to half of the 137 million new units issued were allotted to new investors, significantly increasing free float.
Unlocked Portfolio ValueAt Northpoint 1, asset enhancement works were completed in December 2009. The revamped Northpoint 1 offers residents a brand new shopping experience while delivering higher rents and net property income to FCT. We are pleased that since completion of enhancement works, Northpoint 1 has consistently outperformed projected quarterly net property income of $4.5 million. Occupancy has reached 99% as at September 2010, with the mall delivering a net property income yield of one and half times more compared to pre-refurbishment.
Robust Portfolio PerformanceThe portfolio performed robustly over the last twelve months. Portfolio occupancy remained high at 98% in September 2010, even though we have commenced the refurbishment of Causeway Point. The other malls in the portfolio maintained occupancy levels of close to 100%. FY2010 rental reversions remained healthy, with a total of 39 leases renewed at an average of 7% increment above preceding rental rates. Shopper traffic for FY2010 tipped 80 million, boosted by additional footfalls from YewTee Point and the reinvigorated Northpoint. FCT recognised a revaluation surplus of $42.5 million in FY2010, with all properties recording higher valuations.
08
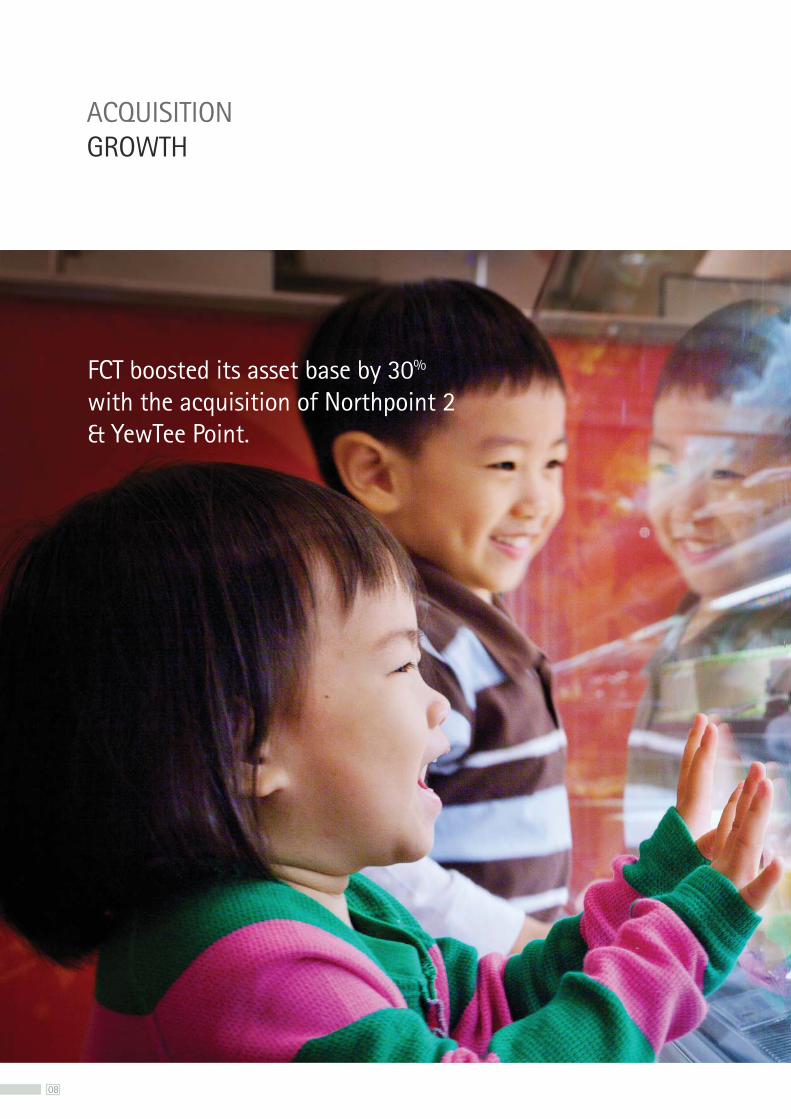
ACQUISITION GROWTH
FCT boosted its asset base by 30% with the acquisition of Northpoint 2 & YewTee Point.
09
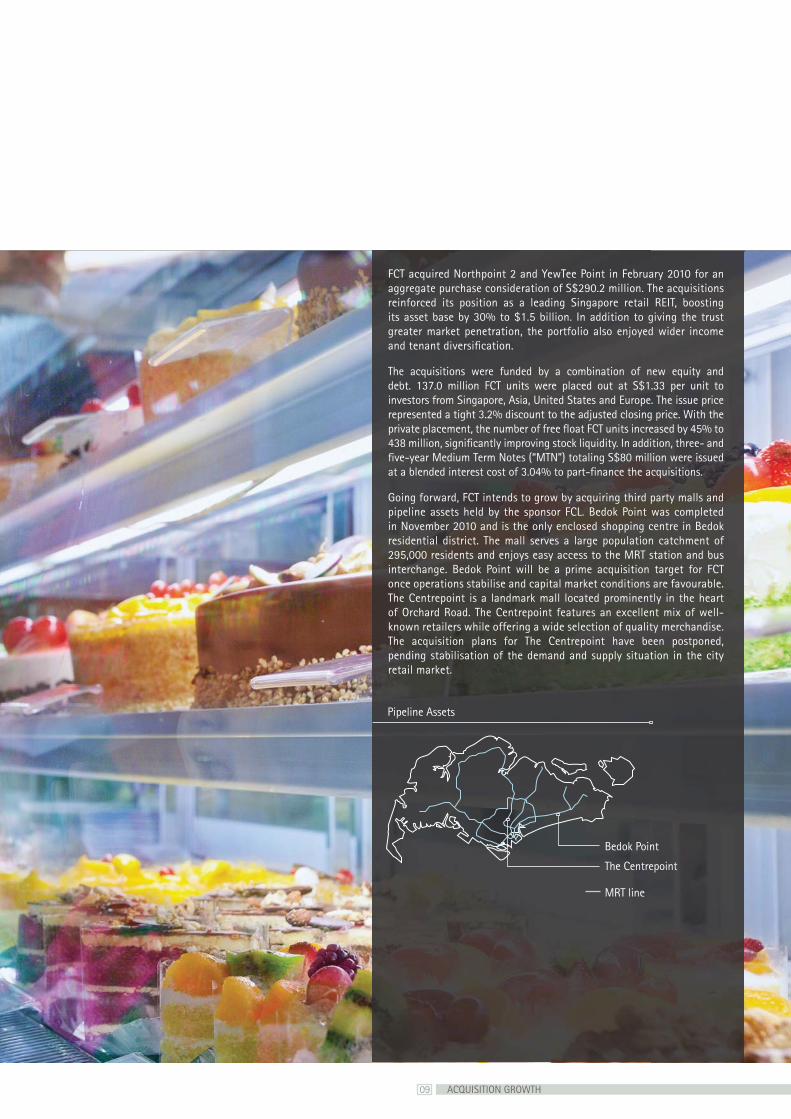
FCT acquired Northpoint 2 and YewTee Point in February 2010 for an aggregate purchase consideration of S$290.2 million. The acquisitions reinforced its position as a leading Singapore retail REIT, boosting its asset base by 30% to $1.5 billion. In addition to giving the trust greater market penetration, the portfolio also enjoyed wider income and tenant diversification.
The acquisitions were funded by a combination of new equity and debt. 137.0 million FCT units were placed out at S$1.33 per unit to investors from Singapore, Asia, United States and Europe. The issue price represented a tight 3.2% discount to the adjusted closing price. With the private placement, the number of free float FCT units increased by 45% to 438 million, significantly improving stock liquidity. In addition, three- and five-year Medium Term Notes (“MTN”) totaling S$80 million were issued at a blended interest cost of 3.04% to part-finance the acquisitions.
Going forward, FCT intends to grow by acquiring third party malls and pipeline assets held by the sponsor FCL. Bedok Point was completed in November 2010 and is the only enclosed shopping centre in Bedok residential district. The mall serves a large population catchment of 295,000 residents and enjoys easy access to the MRT station and bus interchange. Bedok Point will be a prime acquisition target for FCT once operations stabilise and capital market conditions are favourable. The Centrepoint is a landmark mall located prominently in the heart of Orchard Road. The Centrepoint features an excellent mix of well-known retailers while offering a wide selection of quality merchandise. The acquisition plans for The Centrepoint have been postponed, pending stabilisation of the demand and supply situation in the city retail market.
Pipeline Assets
ACQUISITION GROWTH
Bedok Point
The Centrepoint
MRT line

10
ENHANCEMENT GROWTH
Causeway Point is undergoing refurbishment to enhance property yield and shopper experience.
11
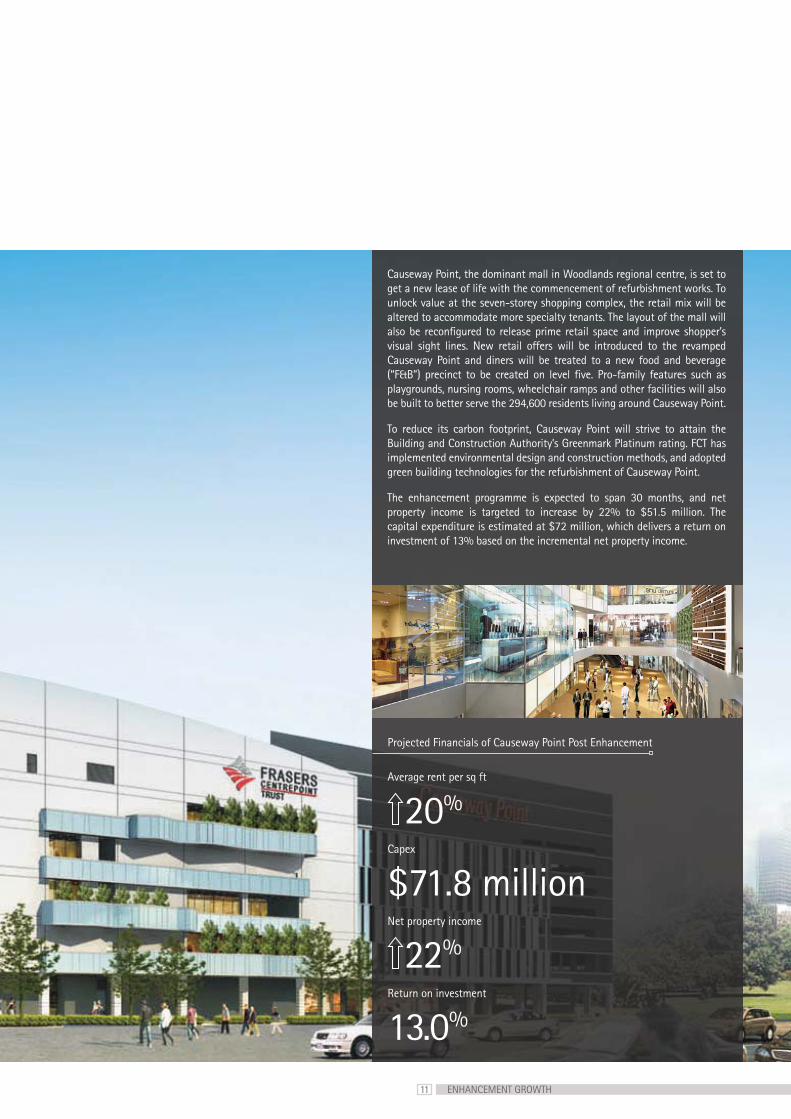
Causeway Point, the dominant mall in Woodlands regional centre, is set to get a new lease of life with the commencement of refurbishment works. To unlock value at the seven-storey shopping complex, the retail mix will be altered to accommodate more specialty tenants. The layout of the mall will also be reconfigured to release prime retail space and improve shopper’s visual sight lines. New retail offers will be introduced to the revamped Causeway Point and diners will be treated to a new food and beverage (“F&B”) precinct to be created on level five. Pro-family features such as playgrounds, nursing rooms, wheelchair ramps and other facilities will also be built to better serve the 294,600 residents living around Causeway Point.
To reduce its carbon footprint, Causeway Point will strive to attain the Building and Construction Authority’s Greenmark Platinum rating. FCT has implemented environmental design and construction methods, and adopted green building technologies for the refurbishment of Causeway Point.
The enhancement programme is expected to span 30 months, and net property income is targeted to increase by 22% to $51.5 million. The capital expenditure is estimated at $72 million, which delivers a return on investment of 13% based on the incremental net property income.
Projected Financials of Causeway Point Post Enhancement
Average rent per sq ft
20%
Capex
$71.8 millionNet property income
22%
Return on investment
13.0%
ENHANCEMENT GROWTH
12
ORGANIC GROWTH
FCT renewed rents at an average of 7% increment above preceding rental rates in FY2010.
13
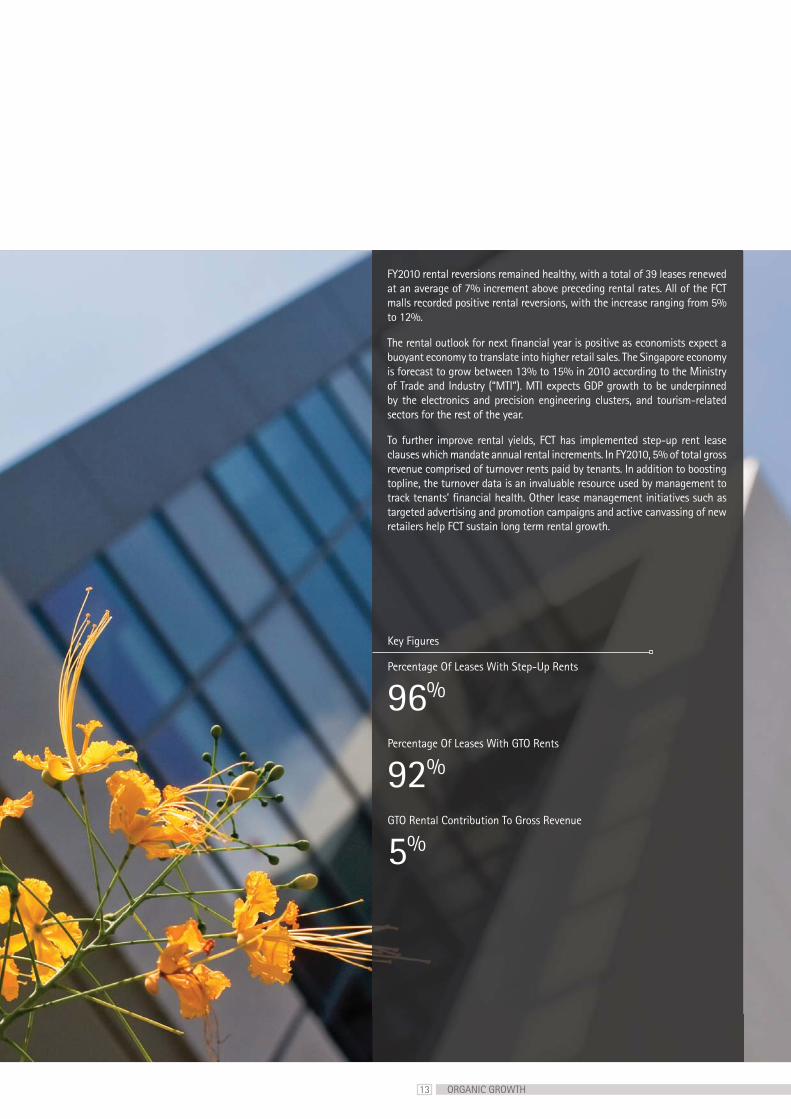
FY2010 rental reversions remained healthy, with a total of 39 leases renewed at an average of 7% increment above preceding rental rates. All of the FCT malls recorded positive rental reversions, with the increase ranging from 5% to 12%.
The rental outlook for next financial year is positive as economists expect a buoyant economy to translate into higher retail sales. The Singapore economy is forecast to grow between 13% to 15% in 2010 according to the Ministry of Trade and Industry (“MTI”). MTI expects GDP growth to be underpinned by the electronics and precision engineering clusters, and tourism-related sectors for the rest of the year.
To further improve rental yields, FCT has implemented step-up rent lease clauses which mandate annual rental increments. In FY2010, 5% of total gross revenue comprised of turnover rents paid by tenants. In addition to boosting topline, the turnover data is an invaluable resource used by management to track tenants’ financial health. Other lease management initiatives such as targeted advertising and promotion campaigns and active canvassing of new retailers help FCT sustain long term rental growth.
Key Figures
Percentage Of Leases With Step-Up Rents
96%
Percentage Of Leases With GTO Rents
92%
GTO Rental Contribution To Gross Revenue
5%
ORGANIC GROWTH

14
KEY EVENTS
December 2009Asiamoney Magazine conferred the “Small-Cap Corporate of the Year in Singapore” award on FCT.
January 2010Unitholders approved all resolutions tabled at the inaugural Annual General Meeting (“AGM”).
Unitholders approved the acquisitions of Northpoint 2 & YewTee Point at an Extraordinary General Meeting (“EGM”).
FCT completed the private placement exercise of 137.0 million new units to part-finance the acquisitions of Northpoint 2 & YewTee Point.
February 2010FCT acquired Northpoint 2 & YewTee Point for an aggregate purchase consideration of $290.2 million.
FCT issued $55 million MTN due 2013 and $25 million MTN due 2015 to part-finance the acquisitions of Northpoint 2 & YewTee Point.
Dr Chew Tuan Chiong succeeded Mr Christopher Tang as the Chief Executive Officer of FCAM.
March 2010Northpoint was relaunched after completing enhancement works costing $39 million.
15 KEY EVENTS
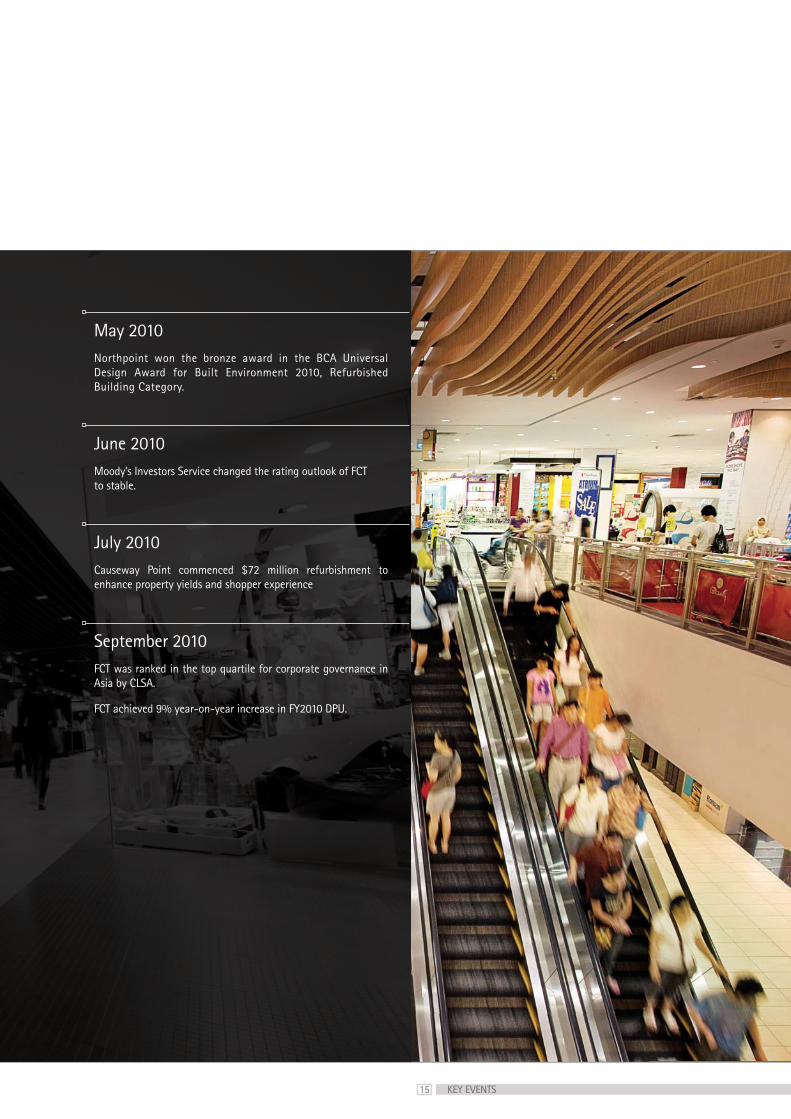
May 2010 Northpoint won the bronze award in the BCA Universal Design Award for Built Environment 2010, Refurbished Building Category.
June 2010Moody’s Investors Service changed the rating outlook of FCT to stable.
July 2010C auseway Point commenced $72 million refurbishment to enhance property yields and shopper experience
September 2010FCT was ranked in the top quartile for corporate governance in Asia by CLSA.
FCT achieved 9% year-on-year increase in FY2010 DPU.

16
Organisation Structure
Board of Directors
Trust Management Team
Property Management Team
Investor Relations
Community Engagement
17
ORGANISATION STRUCTURE
ORGANISATION STRUCTURE
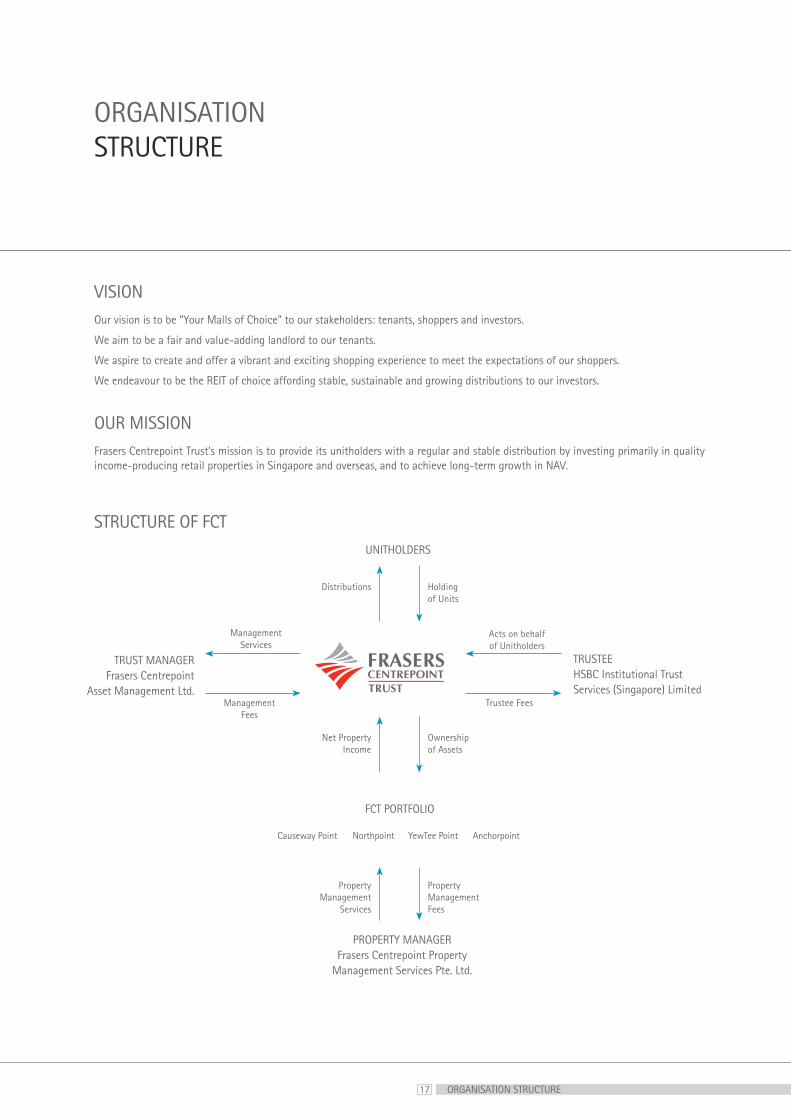
VISIONOur vision is to be “Your Malls of Choice” to our stakeholders: tenants, shoppers and investors.
We aim to be a fair and value-adding landlord to our tenants.
We aspire to create and offer a vibrant and exciting shopping experience to meet the expectations of our shoppers.
We endeavour to be the REIT of choice affording stable, sustainable and growing distributions to our investors.
OUR MISSIONFrasers Centrepoint Trust’s mission is to provide its unitholders with a regular and stable distribution by investing primarily in quality income-producing retail properties in Singapore and overseas, and to achieve long-term growth in NAV.
UNITHOLDERS
TRUST MANAGERFrasers Centrepoint
Asset Management Ltd.
TRUSTEEHSBC Institutional TrustServices (Singapore) Limited
PROPERTY MANAGERFrasers Centrepoint Property
Management Services Pte. Ltd.
Northpoint AnchorpointYewTee PointCauseway Point
Acts on behalf of Unitholders
Management Services
Ownership of Assets
Property Management Fees
Holding of Units
Trustee FeesManagement Fees
Net Property Income
Property Management
Services
Distributions
STRUCTURE OF FCT
FCT PORTFOLIO
18
BOARD OF DIRECTORS
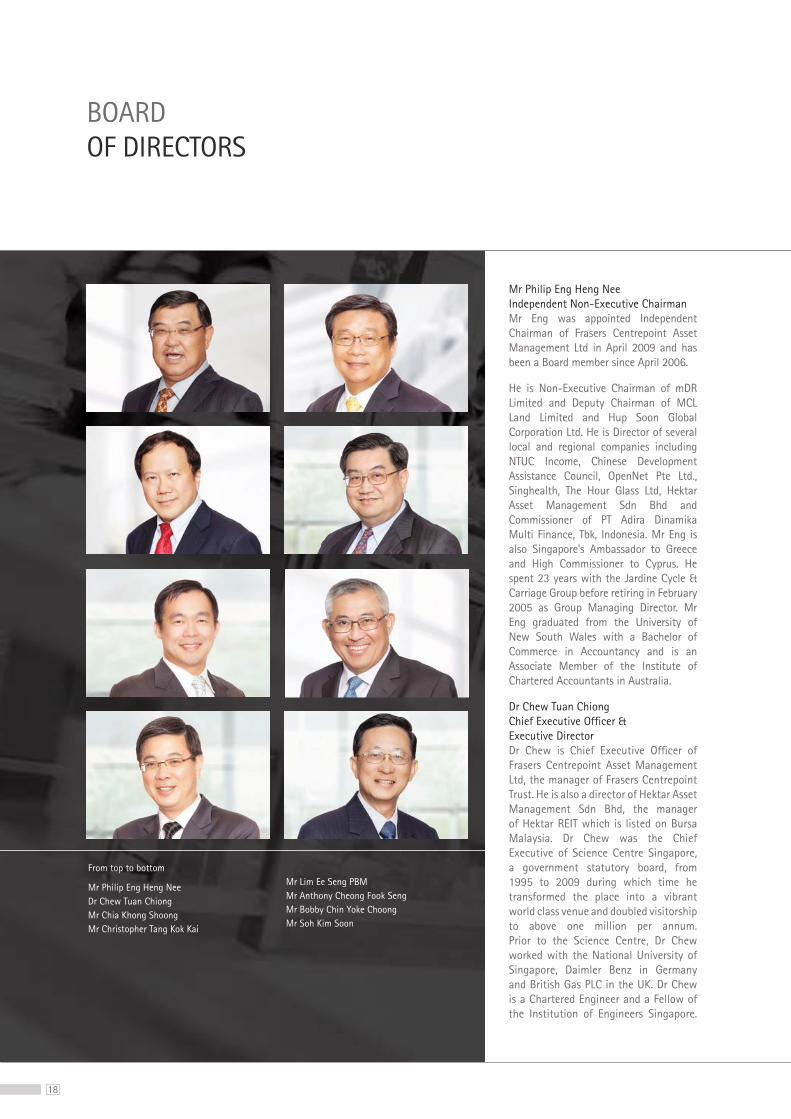
Mr Philip Eng Heng NeeIndependent Non-Executive ChairmanMr Eng was appointed Independent Chairman of Frasers Centrepoint Asset Management Ltd in April 2009 and has been a Board member since April 2006.
He is Non-Executive Chairman of mDR Limited and Deputy Chairman of MCL Land Limited and Hup Soon Global Corporation Ltd. He is Director of several local and regional companies including NTUC Income, Chinese Development Assistance Council, OpenNet Pte Ltd., Singhealth, The Hour Glass Ltd, Hektar Asset Management Sdn Bhd and Commissioner of PT Adira Dinamika Multi Finance, Tbk, Indonesia. Mr Eng is also Singapore’s Ambassador to Greece and High Commissioner to Cyprus. He spent 23 years with the Jardine Cycle & Carriage Group before retiring in February 2005 as Group Managing Director. Mr Eng graduated from the University of New South Wales with a Bachelor of Commerce in Accountancy and is an Associate Member of the Institute of Chartered Accountants in Australia.
Dr Chew Tuan Chiong Chief Executive Officer & Executive Director Dr Chew is Chief Executive Officer of Frasers Centrepoint Asset Management Ltd, the manager of Frasers Centrepoint Trust. He is also a director of Hektar Asset Management Sdn Bhd, the manager of Hektar REIT which is listed on Bursa Malaysia. Dr Chew was the Chief Executive of Science Centre Singapore, a government statutory board, from 1995 to 2009 during which time he transformed the place into a vibrant world class venue and doubled visitorship to above one million per annum. Prior to the Science Centre, Dr Chew worked with the National University of Singapore, Daimler Benz in Germany and British Gas PLC in the UK. Dr Chew is a Chartered Engineer and a Fellow of the Institution of Engineers Singapore.
From top to bottom
Mr Philip Eng Heng Nee Dr Chew Tuan Chiong Mr Chia Khong Shoong Mr Christopher Tang Kok Kai
Mr Lim Ee Seng PBMMr Anthony Cheong Fook SengMr Bobby Chin Yoke ChoongMr Soh Kim Soon
19
A former government scholar, Dr Chew holds a doctorate from University of Cambridge, an M Eng from the National University of Singapore, and a B Eng (1st Class Hons) from Monash University. Dr Chew has been awarded the Sugden Award by the Combustion Institute (UK) and the Public Administration Medal (Silver) (Singapore).
Mr Chia Khong ShoongNon-Executive DirectorMr Chia is the Chief Financial Officer of Frasers Centrepoint Limited (“FCL”) and has over 15 years of experience in financial, commercial and strategic issues across a number of different sectors in Southeast Asia, North America and Europe. Prior to joining FCL, he worked at HSBC, Salomon Smith Barney / Citigroup and Schroders on corporate finance advisory, M&A and capital market related matters.
Mr Chia is a director of Frasers Property (China) Limited, which is listed on the Hong Kong Stock Exchange, and a director of Frasers Centrepoint Asset Management (Commercial) Ltd, the manager of Frasers Commercial Trust. He holds a Bachelor of Commerce in Accounting and Finance with First Class Honours from the University of Western Australia and also a MPhil in Management Studies from Cambridge University.
Mr Christopher Tang Kok Kai Non-Executive DirectorMr Tang is the Chief Executive Officer of Frasers Centrepoint Commercial, the FCL division which is responsible for commercial property investment, development and management, fund and asset management. Mr Tang has over 20 years of experience in asset management, investment management, marketing and operations in the real estate and manufacturing industries. Prior to joining the Fraser & Neave Group in 2001, he held senior positions with DBS Bank, DBS Land and British Petroleum. He is also a
director of Hektar Asset Management Sdn Bhd, the manager of Hektar REIT, a REIT listed on Bursa Malaysia and Frasers Centrepoint Asset Management (Commercial) Ltd, the manager of Frasers Commercial Trust. Mr Tang holds a Masters in Business Administration and a Bachelor of Science Degree from the National University of Singapore.
Mr Lim Ee Seng PBMNon-Executive DirectorMr Lim Ee Seng has been Group Chief Executive Officer of FCL since October 2004. He is Chairman of Frasers Property (China) Limited, listed on the Hong Kong Stock Exchange. He is also a director of Frasers Centrepoint Asset Management (Commercial) Ltd, the manager of Frasers Commercial Trust.
Mr Lim has about 30 years of experience in the real estate industry. Prior to joining FCL, he was Managing director of MCL Land Limited. Mr Lim holds a Masters Degree in Project Management from National University of Singapore and a Bachelors Degree in Civil Engineering from University of Singapore. He is the 2nd Vice President of Real Estate Development Association of Singapore and a Fellow of the Institute of Directors, Singapore.
Mr Anthony Cheong Fook Seng Non-Executive DirectorMr Cheong is the Group Company Secretary of Fraser & Neave Group. Mr Cheong joined the Fraser & Neave Group in Times Publishing Limited as Corporate General Manager (Group Finance) and Company Secretary in 2001. Mr Cheong currently holds directorships on the Boards of a number of subsidiaries of the Fraser & Neave Group including FCL, Fraser & Neave Holdings Bhd and Asia Pacific Investment Pte Ltd. Mr Cheong is a member of the Institute of Chartered Accountants in England and Wales and a non-practising member of the Institute of Certified Public Accountants of Singapore.
Mr Bobby Chin Yoke ChoongIndependent Non-Executive DirectorMr Chin is the Chairman of Singapore Totalisator Board. He is a member of the Council of Presidential Advisers and serves on the boards of the Competition Commission of Singapore and Singapore Labour Foundation. He is also on the Board of Trustees of Singapore Indian Development Association. Mr Chin was the Managing Partner of KPMG Singapore from 1992 until his retirement in September 2005. He is a member of the Institute of Certified Public Accountants of Singapore and an associate member of the Institute of Chartered Accountants in England & Wales. Mr Chin served as a Board member of Urban Redevelopment Authority from 1997 to 2006 and was its Chairman from 2001 to 2006.
Mr Chin is a director of several listed companies including Oversea-Chinese Banking Corporation Limited, Yeo Hiap Seng Limited, Neptune Orient Lines Limited, Ho Bee Investment Limited, Sembcorp Industries Ltd and AV Jennings Limited.
Mr Soh Kim SoonIndependent Non-Executive DirectorMr Soh is currently Chairman of ORIX Investment and Management Private Limited and ORIX Leasing Singapore Limited. Prior to this, Mr Soh was Senior Managing Director with DBS Bank, where he held key senior positions in both business and support functions during his 29 year tenure. Mr Soh also sits on the Boards of EnGro Corporation Limited and NTUC Income Insurance Cooperative Limited. Mr Soh is a B.A. (Hons) graduate of the University of Singapore and an Associate of the Chartered Institute of Bankers.
BOARD OF DIRECTORS
20
FRASERS CENTREPOINT ASSET MANAGEMENT LTD. TRUST MANAGEMENT TEAM
Dr Chew Tuan Chiong Chief Executive Officer & Executive Director Tuan Chiong works closely with the Board of Directors to formulate the overall business and investment strategy of FCT. He is responsible for the overall management and planning of the strategic direction of FCT, as well as overseeing the day-to-day operations.
Please refer to the Board of Directors section for details of Tuan Chiong’s
Mr Jack Lam Deputy CEO & Head, InvestmentJack assists the CEO in formulating and executing management plans and strategies, and in overseeing the day-to-day operations of FCT. Concurrently, Jack leads the Investment team that is responsible for identifying, evaluating and executing investment opportunities, with a view to growing and enhancing FCT’s asset portfolio and investment return.
Jack has over 17 years of experience in the local and regional real estate markets, spanning a variety of roles in investment, asset management, advisory and research. He has been involved in REIT management since the industry’s inception in Singapore in 2002. Jack holds a Master of Business Administration in Finance (with Distinction) from the University of Leeds, UK and a Bachelor of Engineering (Civil) degree from the National University of Singapore.
From left to right
Dr Chew Tuan Chiong Mr Jack Lam Ms Lim Poh TinMs Teo Siaw ShienMr James Goh Chat-Shen

21
Ms Lim Poh TinAssistant General ManagerPoh Tin’s responsibilities includes formulating business and asset enhancement plans in relation to FCT’s properties with short, medium and long term objectives. This involves working together with the Property Manager to ensure that the property business plans are executed diligently.
Poh Tin has 23 years of real estate asset and property management experience. She holds Diplomas in Building Maintenance and Management from Ngee Ann Technical College and Management Studies from Singapore Institute of Management. She obtained her Bachelor of Science Honours degree in Real Estate Management from Oxford Brookes University.
TRUST MANAGEMENT TEAM
Ms Teo Siaw Shien Financial Controller Siaw Shien is responsible for the finances of FCT and provides support in areas of secretariat compliance, taxation and treasury.
Siaw Shien has over 18 years of accounting and finance experience. She graduated from the National University of Singapore with a Bachelor of Accountancy degree. She is a Singapore Certified Public Accountant and is a member of the Institute of Certified Public Accountants of Singapore. Siaw Shien also holds a Master of Science (Real Estate) degree from the National University of Singapore
Mr James Goh Chat-ShenHead, Investor Relations & Research James oversees FCT’s investor relations strategy. He focuses on investor targeting, media and shareholder communication, and providing market intelligence and research support to management.
James has over 10 years of experience in the investor relations and analytical research field. He is a CFA charter holder and a graduate of Nanyang Technological University with a Bachelor of Accountancy (Honours) degree.
22
FRASERS CENTREPOINT PROPERTY MANAGEMENT SERVICES PTE. LTD. PROPERTY MANAGEMENT TEAM
Ms Alison WongActing General ManagerMs Alison Wong leads the property management team which is responsible for the provision of property, lease and project management and marketing communication services for FCT malls.
Ms Wong has over 19 years of experience in areas of asset and lease management, property management and development, business development, Singapore and international marketing. She holds a Bachelor of Science (Honours) in Estate Management from the National University of Singapore.
Mr Jeffrey Wong Head, Service QualityJeffrey is responsible for developing and spearheading service strategy and initiatives for FCT malls.
Jeffrey has over 25 years experience in hospitality management with international hotel groups, and was a pioneer member of the Frasers
Hospitality management team since 1998. He holds a Bachelor of Science Degree in Hotel Management from the University of Nevada, Las Vegas, as well as a Post Graduate Diploma in Business Administration from the University of Surrey
Mr Edward Kway Head, EngineeringEdward’s responsibilities include engineering, building operations, security and carpark operations for FCT.
Edward has over 26 years of experience in the building industry, of which 14 years been spent in the hospitality industry. An Electrical Engineer by training and a qualified Fire Safety Manager, he also holds a Bachelor of Business Management and Economics degree from Charles Sturt University, Australia.
Ms See San SanHead, Leasing San San heads the leasing function across all FCT malls. She is responsible for
planning the desired trade and tenant mix of the malls with the objective of ensuring optimum rental returns.
San San has over 20 years of marketing and management experience in the retail, industrial and residential sector. She holds a Bachelor Degree in Estate Management from the National University of Singapore and a Graduate Diploma in marketing from the Marketing Institute of Singapore.
Mr Raymond Chan Senior Manager, Advertising & PromotionsRaymond is responsible for the marketing communication matters of FCT malls, overseeing the media planning & production, casual leasing, sales promotions, sponsorship and customer services. He is also responsible for the A&P budgets and implementation of standard system and work processes across all FCT malls.
Raymond has more than 15 years of experience in the shopping centre
From left to right(1st row)Ms Alison WongMr Jeffrey Wong Mr Edward Kway Ms See San SanMr Raymond Chan
(2nd row)Mr Andre Lobo Ms Angela NgMs Molly Lim Ms Carrianne ChewMs Cynthia NgMs Yvonne Chow

23
industry. Prior to joining the property industry, he spent over 8 years as a foreign services officer with the Singapore Ministry of Foreign Affairs. Raymond holds a joint Business Studies Diploma from Ngee Ann Technical College & Polytechnic of Central London.
Mr Andre Lobo Senior Manager, Advertising & PromotionsAndre oversees the advertising and promotional planning and public relations for FCT malls.
Andre has over 22 years of experience in the industry. He graduated from the National University of Singapore with a Bachelors Degree in Business Administration.
Ms Angela NgManager, Retail Design Management Angela oversees the review and approval of designs for shop fit-outs. She also develops retail design guidelines and participates in the conceptualization of asset enhancement initiatives and feasibility studies.
Angela has more than eight years of real estate experience, with expertise in retail design. She holds a Diploma in Interior Design from the National Design Academy, London.
Ms Molly Lim Senior Centre Manager, Causeway PointMolly has more than 20 years of experience in leasing commercial properties, which includes 16 years of shopping centre management. She graduated from the National University of Singapore with a Bachelor of Social Sciences (Honours) degree majoring in Economics. She also holds a Graduate Diploma in Business Administration from the Singapore Institute of Management.
Ms Carrianne ChewCentre Manager, Northpoint Carrianne has more than 10 years of experience in various aspects of real estate and property management. She graduated from the National University of Singapore with a Bachelor of Science (Honours) Degree in Estate Management.
Ms Cynthia NgCentre Manager, YewTee Point Cynthia has more than 8 years of experience in building and property management. She holds a Diploma in Building and Property Management from Singapore Polytechnic and obtained her Bachelor of Science (Honours) Degree in Real Estate from National University of Singapore.
Ms Yvonne Chow Assistant Centre Manager, AnchorpointYvonne has more than 12 years of property management experience. She obtained her Bachelor of Business (Property) degree from University of South Australia.
PROPERTY MANAGEMENT TEAM
24
OverviewFCT is committed to transparent communications with unitholders and the broader investment community by providing extensive and timely disclosure of material information.
AwardsIn December 2009, Asiamoney Magazine conferred the “Small-Cap Corporate of the Year in Singapore” award on FCT. The magazine polls fund managers and analysts annually to determine the best managed companies in Asia. Asiamoney lauded FCT for its resilient performance during the economic downturn and shareholder friendly policies.
In September 2010, CLSA ranked FCT in the top quartile for corporate governance in Asia. FCT won acclaim from CLSA for voluntarily implementing poll voting and enforcing high governance standards.
Significant EventsIn January 2010, unitholders approved all resolutions tabled at the AGM, and approved the acquisitions of Northpoint 2 and YewTee Point at the EGM.
In February 2010, FCT completed the private placement of 137.0 million new units to investors at an issue price of $1.33 per unit. The issue price represented a 3.2% discount to the adjusted closing price; the tightest discount achieved by Singapore REITs since October 2007. While the placement was strongly supported by existing and new investors, 46% of the placement units were allotted to new investors to broaden the investor base.
Investor Outreach ProgrammeFCT proactively meets new and existing unitholders to present the latest developments, financial performance and strategic initiatives of the trust. Sell-side analysts and journalists meet management at quarterly results briefings for in-depth discussions of financial and operational performance. Management meets local institutional investors regularly to update them on the progress of the trust. FCT also organises site tours for analysts and fund managers who are keen to see the malls in operation. To broaden the shareholder base of FCT, management actively participates in investor conferences and overseas roadshows. In FY2010, FCT attended local conferences organised by Citigroup, Daiwa, Deutsche Bank and UBS, and participated in roadshows to Hong Kong, Japan, Australia and Europe.
In FY2010, FCT met 240 investors and analysts in 150 meetings. FCT continues to be well supported by institutional investors, with over 70% of its free float held by institutional investors based in 18 countries. Many of the institutional investors have value and growth orientation with mid to long term investment horizons.
Analyst Coverage 14 brokerage houses provide research coverage on FCT as at 30 September 2010.
INVESTOR RELATIONS
Bank of America-Merrill Lynch CLSA Credit Suisse CIMB-GK Citigroup Daiwa DBS Vickers DMG & Partners JP Morgan OCBC Securities RBS Standard Chartered UBS UOB Kay Hian
25
WebsiteThe FCT website is a key information resource for unitholders. It contains detailed operational and financial spreadsheets, SGX announcements, annual reports, press releases and presentation slides.
URL: www.fraserscentrepointtrust.com
Email updatesUnitholders can sign up for email updates via FCT website to keep abreast of the latest developments on the trust.
EnquiriesUnitholders with queries relating to FCT or their unitholding may contact:
The ManagerFrasers Centrepoint Asset Management Ltd James Goh Chat-Shen Head, Investor Relations & Research Tel: (65) 6276-4882
Email: [email protected]
Unit RegistrarBoardroom Corporate & Advisory Services Pte Ltd Phone: (65) 6536-5355 Fax: (65) 6536-1360
Website: www.boardroomlimited.com
FY2011 Financial Calendar1
24 January 2011 Annual General Meeting 24 January 2011 1Q FY2011 Results Announcement End January 2011 1Q FY2011 Distribution
20 April 2011 2Q FY2011 Results Announcement End April 2011 2Q FY2011 Distribution
25 July 2011 3Q FY2011 Results Announcement End July 2011 3Q FY2011 Distribution
24 October 2011 4Q FY2011 Results Announcement End October 2011 4Q FY2011 Distribution
1 Dates are indicative and are subject to change
INVESTOR RELATIONS

26
COMMUNITY ENGAGEMENT
Recycling Drive Northpoint, October 2009 & June 2010
Northpoint partnered Motorola to organise an exhibition explaining the recycling process and to educate the public on the proper disposal of old electronic equipment. Shoppers were also encouraged to bring in their old electronic devices for recycling at the exhibition booth.
Launch of Youth Olympic Games Countdown Clock Causeway Point, February 2010
On 27th February 2010, the North West Community Development Council (“NWCDC”) launched the Youth Olympic Games (“YOG”) Countdown Clock at Causeway Point atrium. The Guest of Honour for the event was Dr Vivian Balakrishnan, Minister for Community Development, Youth and Sports. More than 800 students from the North West district put up song and dance performances as well as a cheer display to rally the residents to gear them up for the YOG.
“Rice for a Good Cause” Charity Initiative Northpoint, March 2010
Northpoint together with NWCDC launched the “Rice for a Good Cause” charity initiative. From 12th to 21st March, shoppers who spent $100 or more at Northpoint received a pack of rice with a Bento box. To encourage shoppers to donate the complimentary packs of rice, Northpoint pledged to match all rice donations that were collected. The response from shoppers was overwhelming as more than 19,000 bowls of rice were collected for the needy. Dr Chew Tuan Chiong, accompanied by staff and representatives of Joy Centre Neighbourhood Link and NWCDC, visited needy families in Yishun to deliver rice and other household essentials.
Visit By Rainbow Centre Children Northpoint, March 2010
More than 30 children with special needs from Rainbow Centre previewed the new 5,400 sq ft rooftop water playground at Northpoint ahead of its official opening. Accompanied by teachers and helpers, the children aged between two and five years, had a wonderful time with the many water features and ground sprays. After the fun session at the playground, the children proceeded to the atrium for refreshments and an art and craft session.
From left to right
Launch of YOG Countdown Clock
“Our Kampong History” Exhibition
YOG Partners Recognition Ceremony

27 COMMUNITY ENAGEMENT
“Our Kampong History” Exhibition Causeway Point, April 2010
Causeway Point hosted the “Our Kampong History” exhibition from 12th to 17th April 2010 as part of People’s Association’s 50th anniversary celebration. Organised by People’s Association and Sembawang grassroots organizations, the event was officially launched by Health Minister Mr Khaw Boon Wan. Besides showing the development of Sembawang and Nee Soon areas since the 1960s, the exhibition also highlighted other interesting facts and history of the constituency.
Arts at the Mall @ South West YewTee Point, June 2010
YewTee Point played host to a series of arts and cultural performances from schools and local talents. There was participation by performing students from Temasek Polytechnic, Kesenian Si Anak Tari, as well as belly dancing performances from the Desert Roses. Organised by the South West Community Development Council, the events brought performing arts closer to the heartlands and provided a platform for local talent groups to showcase their artistic talents.
National Youth Business Challenge 2010 Causeway Point, July 2010
Frasers Centrepoint Malls and Ngee Ann Polytechnic kicked off the 2nd National Youth Business Challenge at Causeway Point on 3rd July 2010. The two-day event saw 40 teams from 28 secondary schools pit their entrepreneurship skills against each other as they vied for the Ngee Ann-FCM Challenge Trophy and other prizes. Placed in a real-life retail situation spanning mall opening hours, more than 350 youths put their marketing and selling skills to the test. The Challenge Trophy was won by four spirited students from Pathlight School. Besides the overall title, the Pathlight team also bagged a Gold Award and a “Top Most Earth Friendly Enterprise” Award.
YOG Partners Recognition Ceremony September 2010
FCT malls, as part of Frasers Centrepoint Malls, received official recognition from the YOG organising committee for its support and sponsorship of the YOG. Dr Chew Tuan Chiong received the award, which was jointly handed out by Deputy Prime Minister Teo Chee Hean, and Dr Vivian Balakrishnan, Minister for Community Development, Youth and Sports.

28
Operational & Financial Review
Portfolio Review
Capital Resources
Risk Management
Market Outlook
29
OPERATIONAL & FINANCIAL REVIEW
OPERATIONAL & FINANCIAL REVIEW
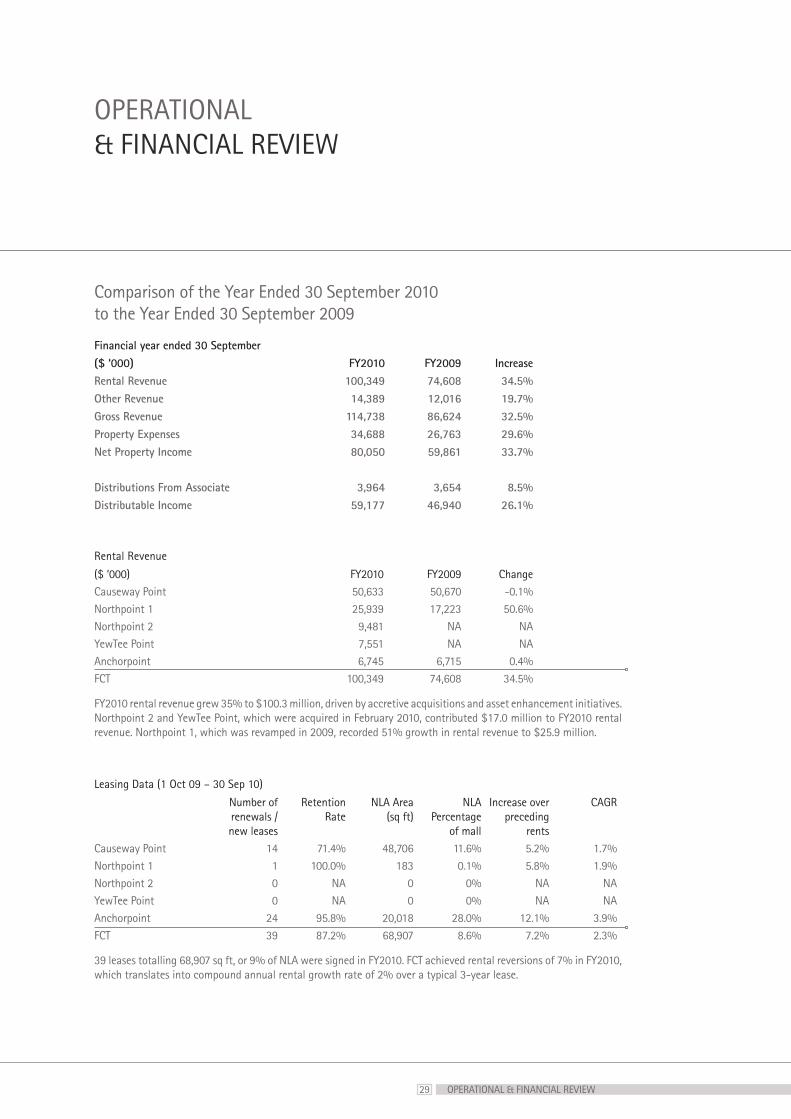
Comparison of the Year Ended 30 September 2010 to the Year Ended 30 September 2009
Financial year ended 30 September($ ‘000) FY2010 FY2009 IncreaseRental Revenue 100,349 74,608 34.5%Other Revenue 14,389 12,016 19.7%Gross Revenue 114,738 86,624 32.5%Property Expenses 34,688 26,763 29.6%Net Property Income 80,050 59,861 33.7%
Distributions From Associate 3,964 3,654 8.5%Distributable Income 59,177 46,940 26.1%
Rental Revenue
($ ‘000) FY2010 FY2009 ChangeCauseway Point 50,633 50,670 -0.1%Northpoint 1 25,939 17,223 50.6%Northpoint 2 9,481 NA NAYewTee Point 7,551 NA NAAnchorpoint 6,745 6,715 0.4%FCT 100,349 74,608 34.5%
FY2010 rental revenue grew 35% to $100.3 million, driven by accretive acquisitions and asset enhancement initiatives. Northpoint 2 and YewTee Point, which were acquired in February 2010, contributed $17.0 million to FY2010 rental revenue. Northpoint 1, which was revamped in 2009, recorded 51% growth in rental revenue to $25.9 million.
Leasing Data (1 Oct 09 – 30 Sep 10)
Number of renewals / new leases
Retention Rate
NLA Area (sq ft)
NLA Percentage
of mall
Increase over preceding
rents
CAGR
Causeway Point 14 71.4% 48,706 11.6% 5.2% 1.7%Northpoint 1 1 100.0% 183 0.1% 5.8% 1.9%Northpoint 2 0 NA 0 0% NA NAYewTee Point 0 NA 0 0% NA NAAnchorpoint 24 95.8% 20,018 28.0% 12.1% 3.9%FCT 39 87.2% 68,907 8.6% 7.2% 2.3%
39 leases totalling 68,907 sq ft, or 9% of NLA were signed in FY2010. FCT achieved rental reversions of 7% in FY2010, which translates into compound annual rental growth rate of 2% over a typical 3-year lease.
30
OPERATIONAL & FINANCIAL REVIEW
(CONTINUED)
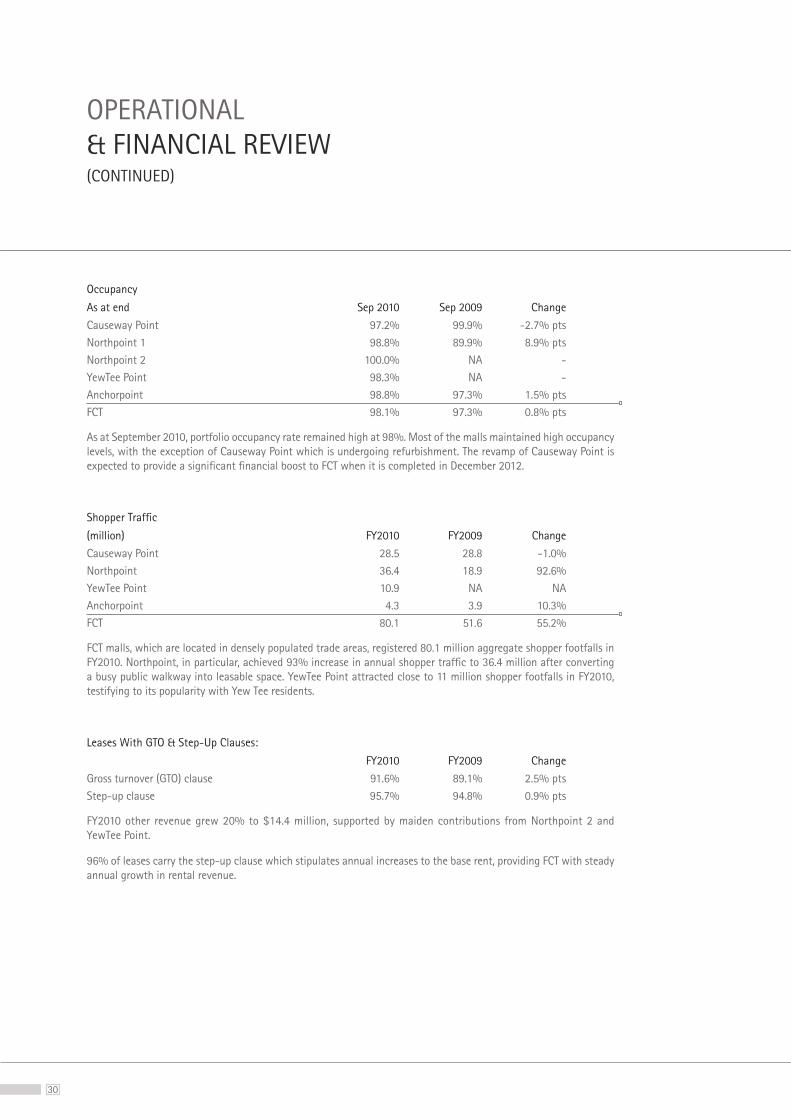
Occupancy
As at end Sep 2010 Sep 2009 Change
Causeway Point 97.2% 99.9% -2.7% ptsNorthpoint 1 98.8% 89.9% 8.9% ptsNorthpoint 2 100.0% NA -YewTee Point 98.3% NA -Anchorpoint 98.8% 97.3% 1.5% ptsFCT 98.1% 97.3% 0.8% pts
As at September 2010, portfolio occupancy rate remained high at 98%. Most of the malls maintained high occupancy levels, with the exception of Causeway Point which is undergoing refurbishment. The revamp of Causeway Point is expected to provide a significant financial boost to FCT when it is completed in December 2012.
Shopper Traffic
(million) FY2010 FY2009 Change
Causeway Point 28.5 28.8 -1.0%Northpoint 36.4 18.9 92.6%YewTee Point 10.9 NA NAAnchorpoint 4.3 3.9 10.3%FCT 80.1 51.6 55.2%
FCT malls, which are located in densely populated trade areas, registered 80.1 million aggregate shopper footfalls in FY2010. Northpoint, in particular, achieved 93% increase in annual shopper traffic to 36.4 million after converting a busy public walkway into leasable space. YewTee Point attracted close to 11 million shopper footfalls in FY2010, testifying to its popularity with Yew Tee residents.
Leases With GTO & Step-Up Clauses:
FY2010 FY2009 Change
Gross turnover (GTO) clause 91.6% 89.1% 2.5% ptsStep-up clause 95.7% 94.8% 0.9% pts
FY2010 other revenue grew 20% to $14.4 million, supported by maiden contributions from Northpoint 2 and YewTee Point.
96% of leases carry the step-up clause which stipulates annual increases to the base rent, providing FCT with steady annual growth in rental revenue.
31 OPERATIONAL & FINANCIAL REVIEW
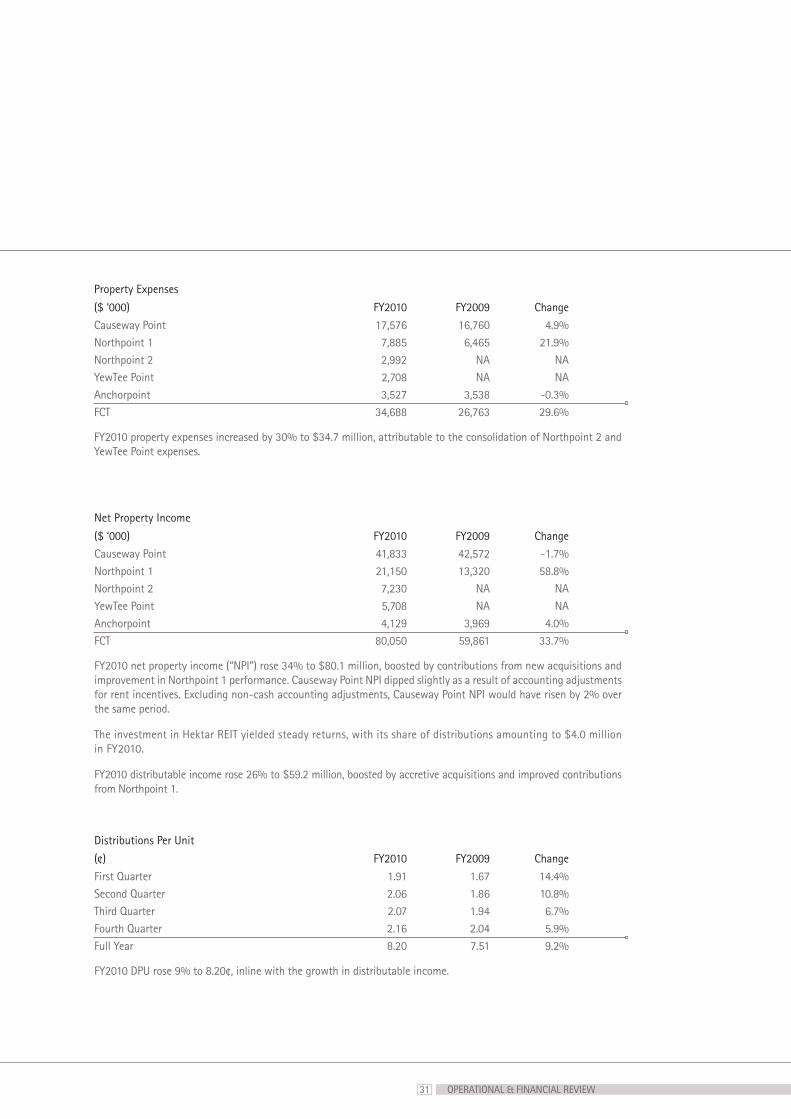
Property Expenses
($ ‘000) FY2010 FY2009 Change
Causeway Point 17,576 16,760 4.9%Northpoint 1 7,885 6,465 21.9%Northpoint 2 2,992 NA NAYewTee Point 2,708 NA NAAnchorpoint 3,527 3,538 -0.3%FCT 34,688 26,763 29.6%
FY2010 property expenses increased by 30% to $34.7 million, attributable to the consolidation of Northpoint 2 and YewTee Point expenses.
Net Property Income
($ ‘000) FY2010 FY2009 Change
Causeway Point 41,833 42,572 -1.7%Northpoint 1 21,150 13,320 58.8%Northpoint 2 7,230 NA NAYewTee Point 5,708 NA NAAnchorpoint 4,129 3,969 4.0%FCT 80,050 59,861 33.7%
FY2010 net property income (“NPI”) rose 34% to $80.1 million, boosted by contributions from new acquisitions and improvement in Northpoint 1 performance. Causeway Point NPI dipped slightly as a result of accounting adjustments for rent incentives. Excluding non-cash accounting adjustments, Causeway Point NPI would have risen by 2% over the same period.
The investment in Hektar REIT yielded steady returns, with its share of distributions amounting to $4.0 million in FY2010.
FY2010 distributable income rose 26% to $59.2 million, boosted by accretive acquisitions and improved contributions from Northpoint 1.
Distributions Per Unit
(¢) FY2010 FY2009 Change
First Quarter 1.91 1.67 14.4%Second Quarter 2.06 1.86 10.8%Third Quarter 2.07 1.94 6.7%Fourth Quarter 2.16 2.04 5.9%Full Year 8.20 7.51 9.2%
FY2010 DPU rose 9% to 8.20¢, inline with the growth in distributable income.
32
OPERATIONAL & FINANCIAL REVIEW
(CONTINUED)
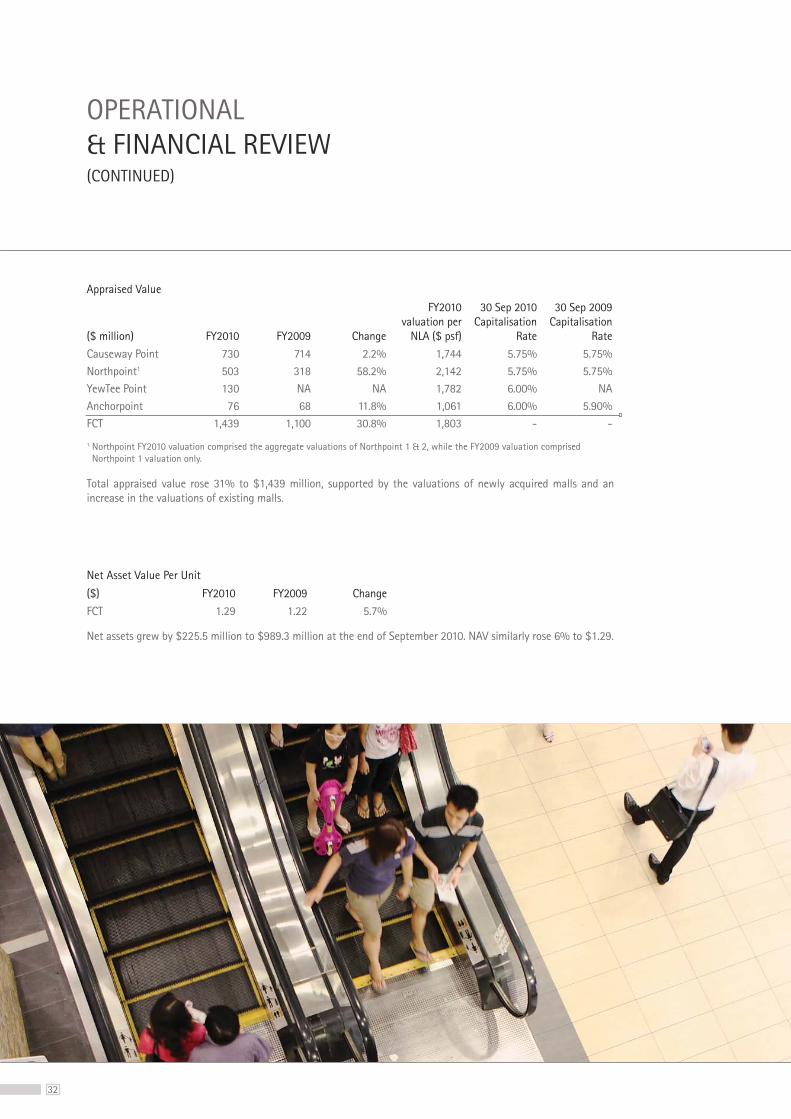
Appraised Value
($ million) FY2010 FY2009 Change
FY2010 valuation per
NLA ($ psf)
30 Sep 2010 Capitalisation
Rate
30 Sep 2009 Capitalisation
Rate
Causeway Point 730 714 2.2% 1,744 5.75% 5.75%Northpoint1 503 318 58.2% 2,142 5.75% 5.75%YewTee Point 130 NA NA 1,782 6.00% NAAnchorpoint 76 68 11.8% 1,061 6.00% 5.90%FCT 1,439 1,100 30.8% 1,803 - -
1 Northpoint FY2010 valuation comprised the aggregate valuations of Northpoint 1 & 2, while the FY2009 valuation comprised Northpoint 1 valuation only.
Total appraised value rose 31% to $1,439 million, supported by the valuations of newly acquired malls and an increase in the valuations of existing malls.
Net Asset Value Per Unit
($) FY2010 FY2009 Change
FCT 1.29 1.22 5.7%
Net assets grew by $225.5 million to $989.3 million at the end of September 2010. NAV similarly rose 6% to $1.29.
33
PORTFOLIO REVIEW
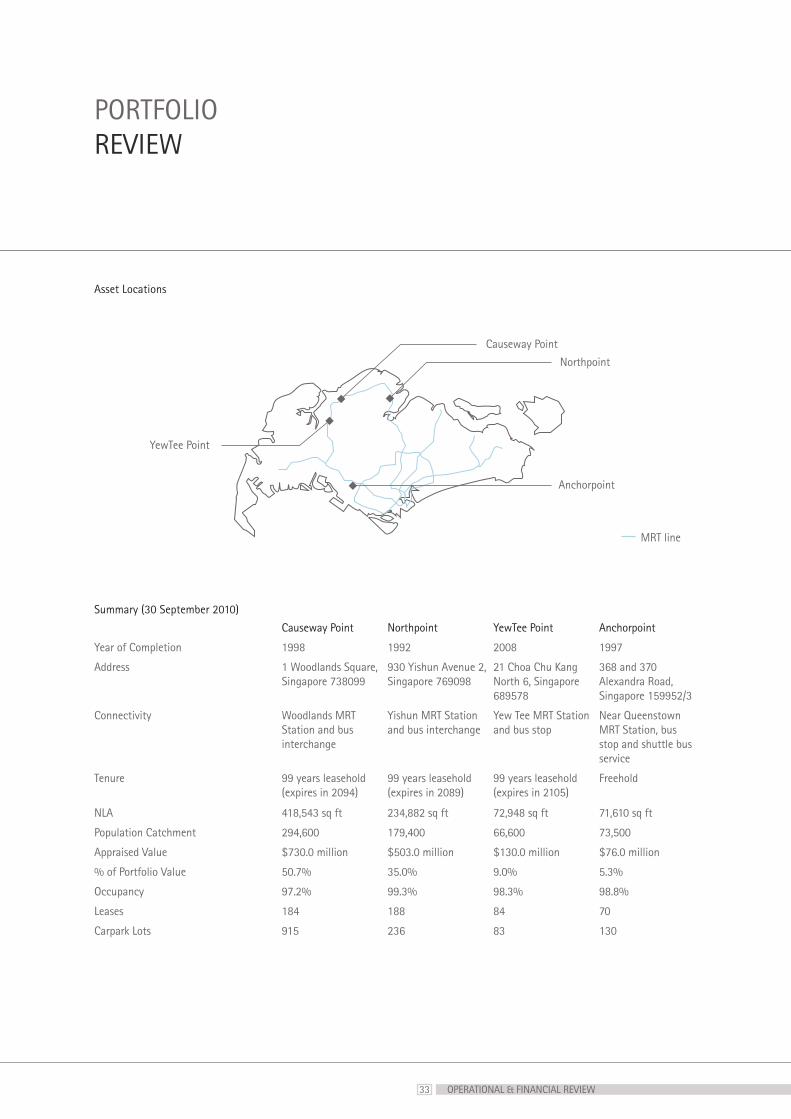
Asset Locations
OPERATIONAL & FINANCIAL REVIEW
Summary (30 September 2010)
Causeway Point Northpoint YewTee Point Anchorpoint
Year of Completion 1998 1992 2008 1997
Address 1 Woodlands Square, Singapore 738099
930 Yishun Avenue 2, Singapore 769098
21 Choa Chu Kang North 6, Singapore 689578
368 and 370 Alexandra Road, Singapore 159952/3
Connectivity Woodlands MRT Station and bus interchange
Yishun MRT Station and bus interchange
Yew Tee MRT Station and bus stop
Near Queenstown MRT Station, bus stop and shuttle bus service
Tenure 99 years leasehold (expires in 2094)
99 years leasehold (expires in 2089)
99 years leasehold (expires in 2105)
Freehold
NLA 418,543 sq ft 234,882 sq ft 72,948 sq ft 71,610 sq ft
Population Catchment 294,600 179,400 66,600 73,500
Appraised Value $730.0 million $503.0 million $130.0 million $76.0 million
% of Portfolio Value 50.7% 35.0% 9.0% 5.3%
Occupancy 97.2% 99.3% 98.3% 98.8%
Leases 184 188 84 70
Carpark Lots 915 236 83 130
Northpoint
Anchorpoint
YewTee Point
Causeway Point
MRT line
34
PORTFOLIO REVIEW
(CONTINUED)
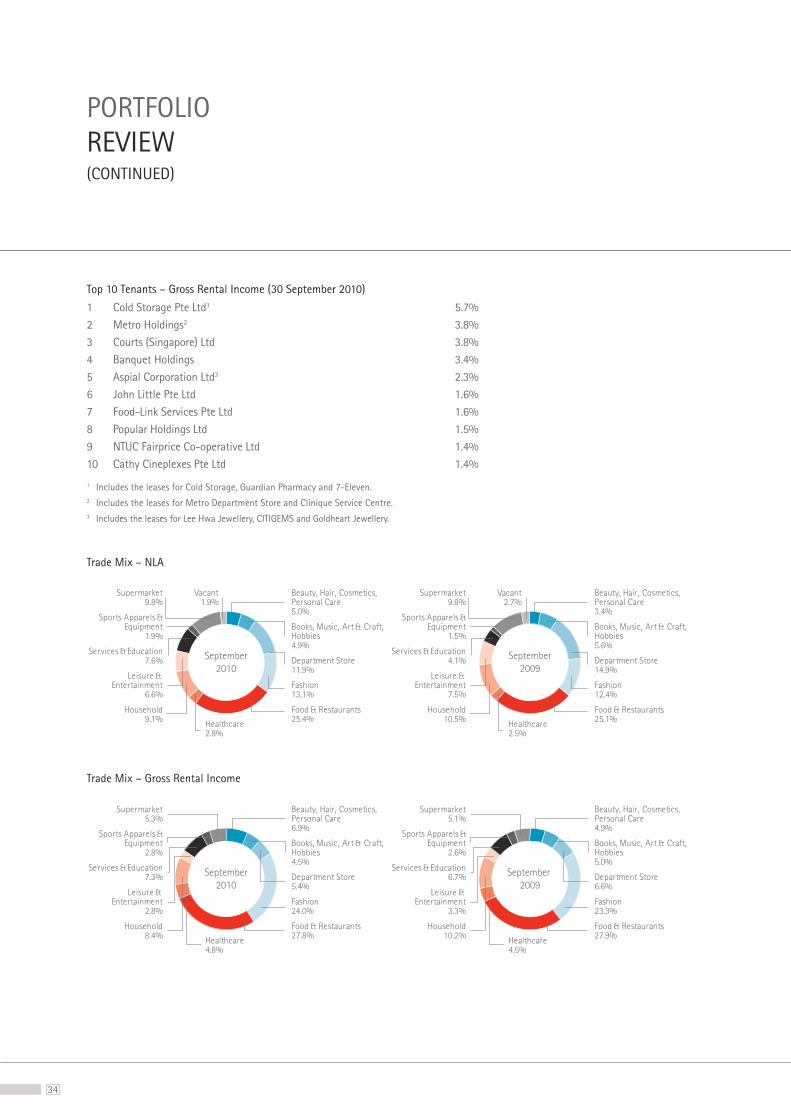
Top 10 Tenants – Gross Rental Income (30 September 2010)
1 Cold Storage Pte Ltd1 5.7%2 Metro Holdings2 3.8%3 Courts (Singapore) Ltd 3.8%4 Banquet Holdings 3.4%5 Aspial Corporation Ltd3 2.3%6 John Little Pte Ltd 1.6%7 Food-Link Services Pte Ltd 1.6%8 Popular Holdings Ltd 1.5%9 NTUC Fairprice Co-operative Ltd 1.4%10 Cathy Cineplexes Pte Ltd 1.4%
1 Includes the leases for Cold Storage, Guardian Pharmacy and 7-Eleven.2 Includes the leases for Metro Department Store and Clinique Service Centre.3 Includes the leases for Lee Hwa Jewellery, CITIGEMS and Goldheart Jewellery.
Trade Mix – NLA
Trade Mix – Gross Rental Income
Beauty, Hair, Cosmetics, Personal Care3.4%
Books, Music, Art & Craft, Hobbies5.6%
Department Store14.9%
Fashion12.4%
Food & Restaurants25.1%
Household10.5%
Leisure & Entertainment
7.5%
Services & Education4.1%
Sports Apparels &Equipment
1.5%
Supermarket9.8%
Vacant2.7%
September
2009
Healthcare2.5%
Beauty, Hair, Cosmetics, Personal Care5.0%
Books, Music, Art & Craft, Hobbies4.9%
Department Store11.9%
Fashion13.1%
Food & Restaurants25.4%
Household9.1%
Leisure & Entertainment
6.6%
Services & Education7.6%
Sports Apparels &Equipment
1.9%
Supermarket9.8%
Vacant1.9%
Healthcare2.8%
September
2010
Beauty, Hair, Cosmetics, Personal Care6.9%
Books, Music, Art & Craft, Hobbies4.5%
Department Store5.4%
Fashion24.0%
Food & Restaurants27.8%
Household8.4%
Leisure & Entertainment
2.8%
Services & Education7.3%
Sports Apparels &Equipment
2.8%
Supermarket5.3%
Healthcare4.8%
September
2010
September
2009
Beauty, Hair, Cosmetics, Personal Care4.9%
Books, Music, Art & Craft, Hobbies5.0%
Department Store6.6%
Fashion23.3%
Food & Restaurants27.9%
Household10.2%
Leisure & Entertainment
3.3%
Services & Education6.7%
Sports Apparels &Equipment
2.6%
Supermarket5.1%
Healthcare4.5%
35 PORTFOLIO REVIEW
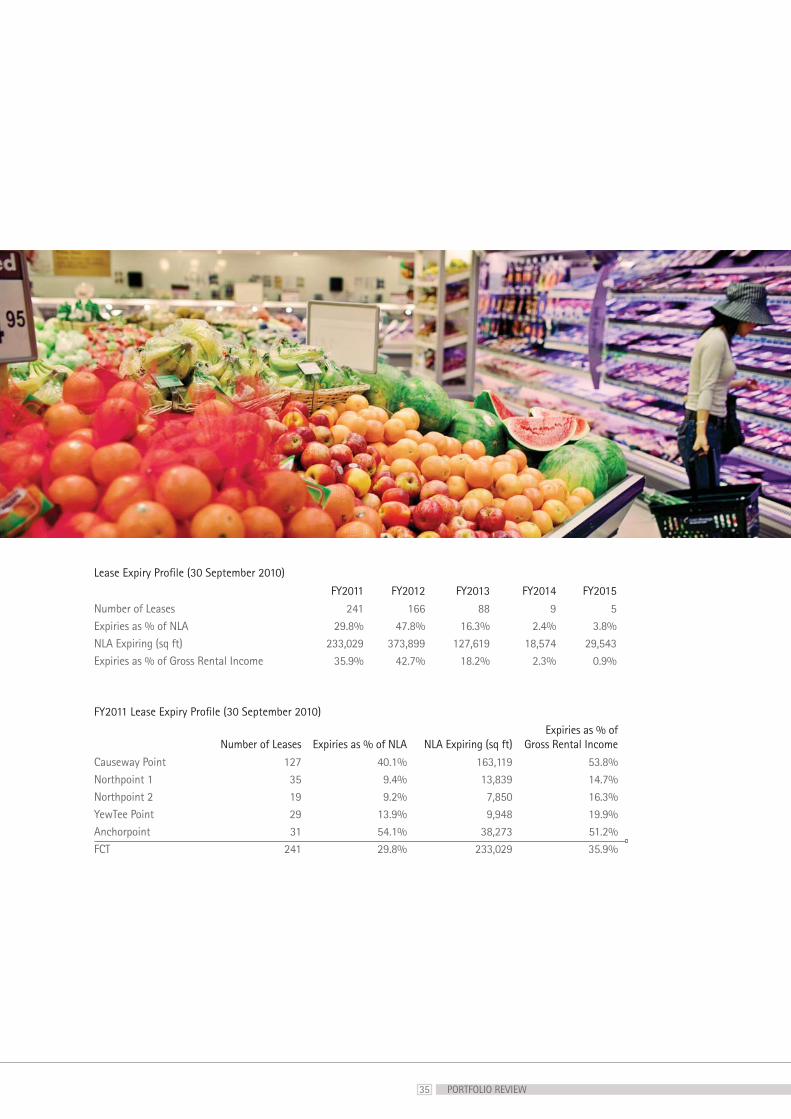
Lease Expiry Profile (30 September 2010)
FY2011 FY2012 FY2013 FY2014 FY2015
Number of Leases 241 166 88 9 5Expiries as % of NLA 29.8% 47.8% 16.3% 2.4% 3.8%NLA Expiring (sq ft) 233,029 373,899 127,619 18,574 29,543Expiries as % of Gross Rental Income 35.9% 42.7% 18.2% 2.3% 0.9%
FY2011 Lease Expiry Profile (30 September 2010)
Number of Leases Expiries as % of NLA NLA Expiring (sq ft) Expiries as % of
Gross Rental Income
Causeway Point 127 40.1% 163,119 53.8%Northpoint 1 35 9.4% 13,839 14.7%Northpoint 2 19 9.2% 7,850 16.3%YewTee Point 29 13.9% 9,948 19.9%Anchorpoint 31 54.1% 38,273 51.2%FCT 241 29.8% 233,029 35.9%
36
CAPITAL RESOURCES
Debt Data
Financial year ended 30 September 2010 2009
Total Borrowings $460m $349mCorporate Rating (Moody’s) Baa1 Baa1Corporate Rating (Standard & Poors) BBB+ BBB+Gearing 30% 30%Interest Cover 4.31 X 4.57 XAverage Cost of Debt 3.76% 3.62%
Funding Sources
Collaterised Mortgage Backed Security (“CMBS”) Programme $1 billionMedium Term Note (“MTN”) Programme $500mRevolving Credit Facility (“RCF”) $150m
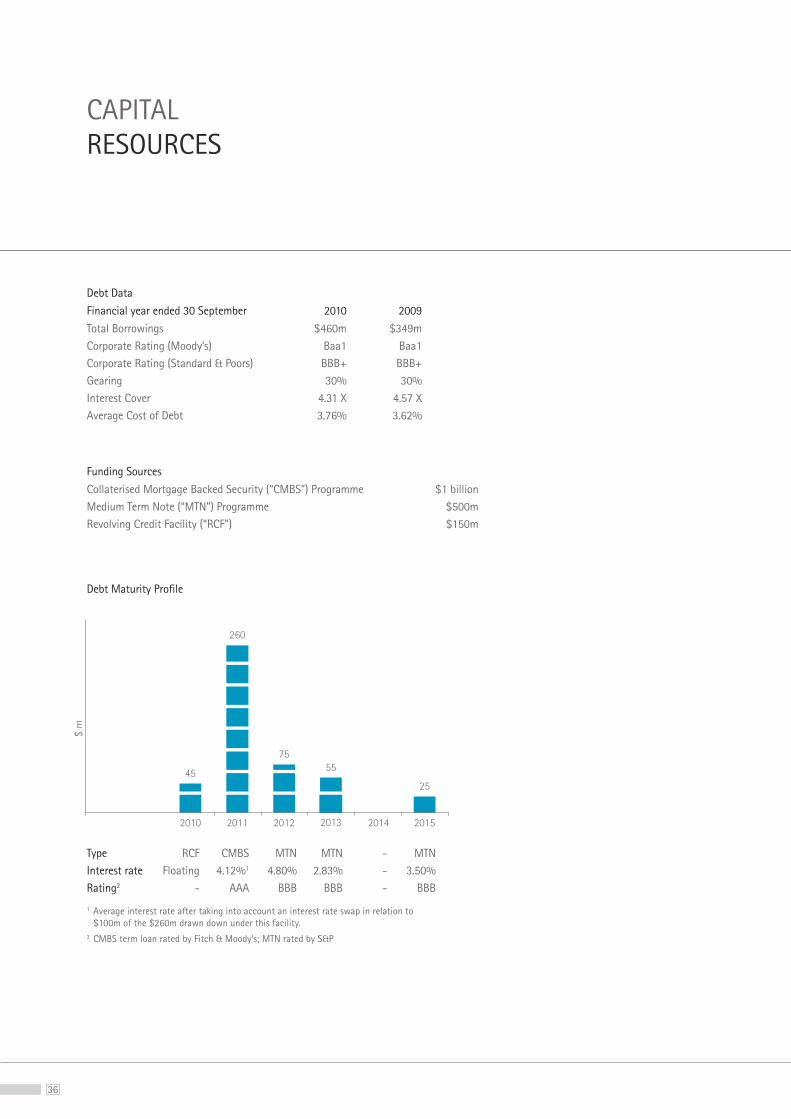
Debt Maturity Profile
$ m
2010 2011 2012 2013 2014 2015
45
260
75
55
25
Type RCF CMBS MTN MTN - MTNInterest rate Floating 4.12%1 4.80% 2.83% - 3.50%Rating2 - AAA BBB BBB - BBB
1 Average interest rate after taking into account an interest rate swap in relation to $100m of the $260m drawn down under this facility.
2 CMBS term loan rated by Fitch & Moody’s; MTN rated by S&P

37
RISK MANAGEMENT
CAPITAL RESOURCES
Effective risk management is a fundamental part of FCT’s business strategy. Key risks, control measures and management actions are continually identified, reviewed and monitored by management as part of FCT’s enterprise-wide risk management framework. Recognising and managing risks are central to the business and to protecting unitholders’ interests and value.
Operational RisksFCT has established and strictly adheres to a set of standard operating procedures designed to monitor, report and manage the operational risks associated with the day-to-day management and maintenance of FCT malls. The procedures and guidelines are regularly reviewed and benchmarked against industry best practices to ensure relevance and effectiveness.
Investment RisksAs FCT grows its investment portfolio via the acquisition of new properties and other forms of permitted investments, all investment opportunities are subjected to a disciplined and rigorous appraisal process. All investment proposals are evaluated based on a comprehensive set of investment criteria including alignment with FCT’s investment mandate, asset quality, expected returns, sustainability of asset performance and future growth potential, and having due regards to market conditions and outlook.
Credit RiskFCT has established credit limits for customers and monitors their balances on an ongoing basis. Credit evaluations are performed before lease agreements are entered into with customers. Credit risk is also mitigated by the rental deposits held for each of the customers. Cash and fixed deposits are placed with a financial institution which is regulated.
Interest Rate RiskInterest rate risk is managed by FCT on an on-going basis with the primary objective of limiting the extent to which net interest expense could be affected by adverse movements in interest rates. FCT adopts a policy of fixing the interest rates for a portion of its outstanding borrowings via financial derivatives or other suitable financial products.
Liquidity RiskFCT monitors and maintains a level of cash and cash equivalents deemed adequate by management to finance its operations. In addition, FCT also adheres to the CIS Code issued by the MAS concerning limits on total borrowings.
38
MARKET OVERVIEW
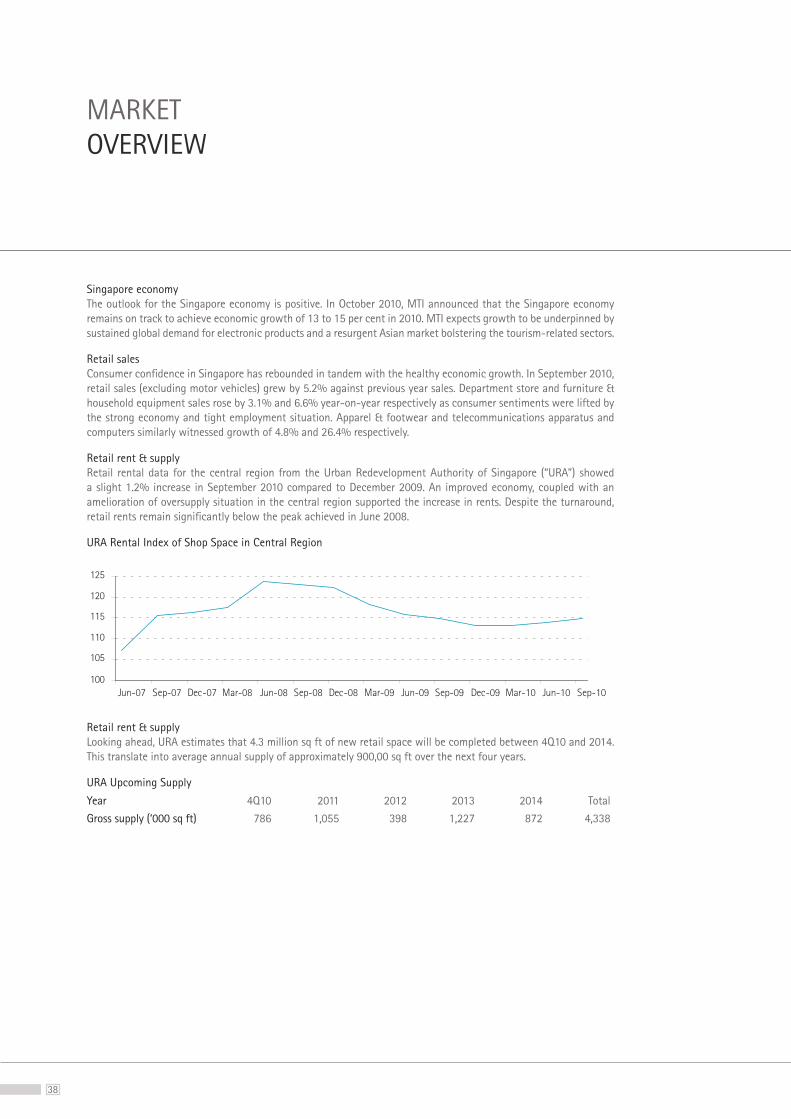
Singapore economyThe outlook for the Singapore economy is positive. In October 2010, MTI announced that the Singapore economy remains on track to achieve economic growth of 13 to 15 per cent in 2010. MTI expects growth to be underpinned by sustained global demand for electronic products and a resurgent Asian market bolstering the tourism-related sectors.
Retail salesConsumer confidence in Singapore has rebounded in tandem with the healthy economic growth. In September 2010, retail sales (excluding motor vehicles) grew by 5.2% against previous year sales. Department store and furniture & household equipment sales rose by 3.1% and 6.6% year-on-year respectively as consumer sentiments were lifted by the strong economy and tight employment situation. Apparel & footwear and telecommunications apparatus and computers similarly witnessed growth of 4.8% and 26.4% respectively.
Retail rent & supplyRetail rental data for the central region from the Urban Redevelopment Authority of Singapore (“URA”) showed a slight 1.2% increase in September 2010 compared to December 2009. An improved economy, coupled with an amelioration of oversupply situation in the central region supported the increase in rents. Despite the turnaround, retail rents remain significantly below the peak achieved in June 2008.
URA Rental Index of Shop Space in Central Region
100
105
110
115
120
125
Jun-07 Sep-07 Dec-07 Mar-08 Jun-08 Sep-08 Dec-08 Mar-09 Jun-09 Sep-09 Dec-09 Mar-10 Jun-10 Sep-10
Retail rent & supplyLooking ahead, URA estimates that 4.3 million sq ft of new retail space will be completed between 4Q10 and 2014. This translate into average annual supply of approximately 900,00 sq ft over the next four years.
URA Upcoming Supply
Year 4Q10 2011 2012 2013 2014 Total
Gross supply (‘000 sq ft) 786 1,055 398 1,227 872 4,338
39 MARKET OVERVIEW
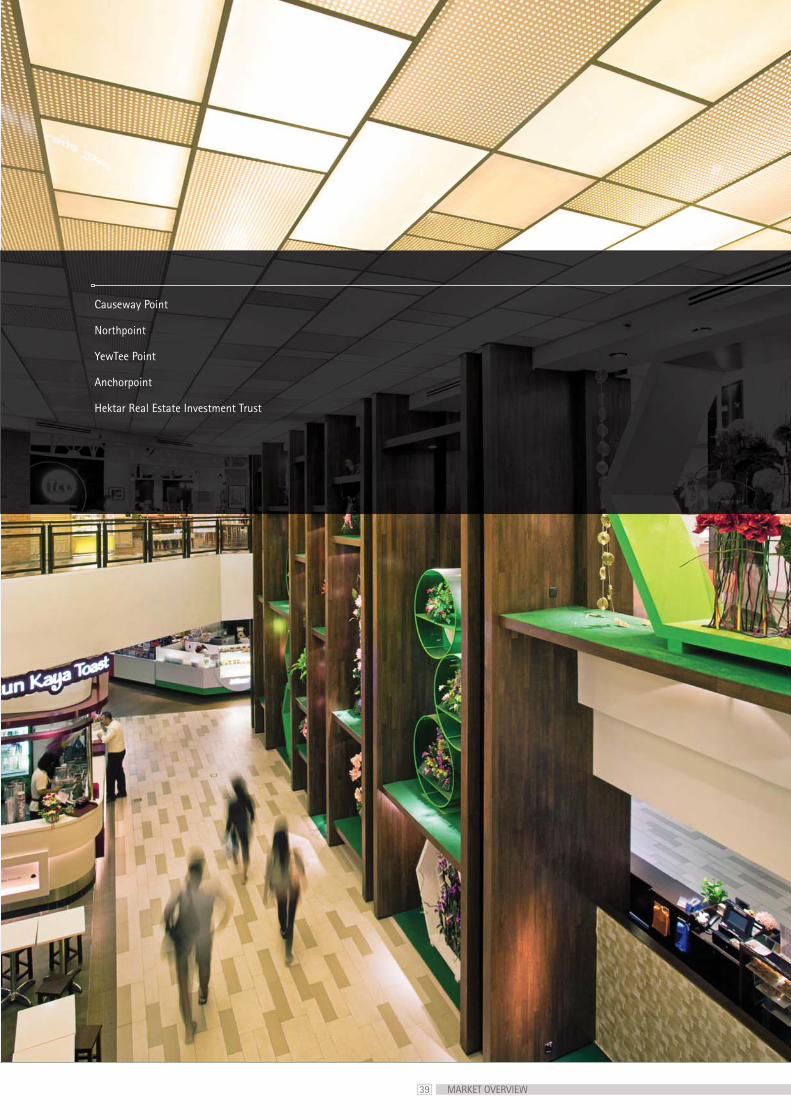
Causeway Point
Northpoint
YewTee Point
Anchorpoint
Hektar Real Estate Investment Trust
40
CAUSEWAY POINT
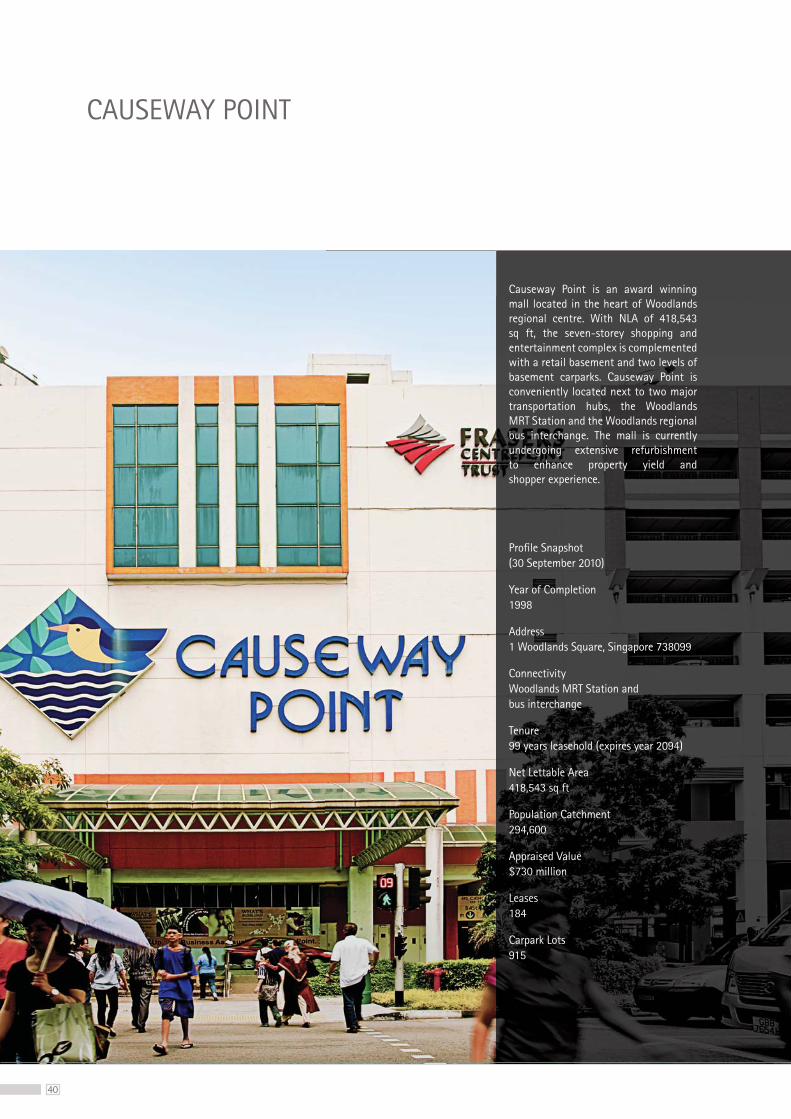
Causeway Point is an award winning mall located in the heart of Woodlands regional centre. With NLA of 418,543 sq ft, the seven-storey shopping and entertainment complex is complemented with a retail basement and two levels of basement carparks. Causeway Point is conveniently located next to two major transportation hubs, the Woodlands MRT Station and the Woodlands regional bus interchange. The mall is currently undergoing extensive refurbishment to enhance property yield and shopper experience.
Profile Snapshot (30 September 2010)
Year of Completion 1998
Address 1 Woodlands Square, Singapore 738099
Connectivity Woodlands MRT Station and bus interchange
Tenure 99 years leasehold (expires year 2094)
Net Lettable Area 418,543 sq ft
Population Catchment 294,600
Appraised Value $730 million
Leases 184
Carpark Lots 915
41
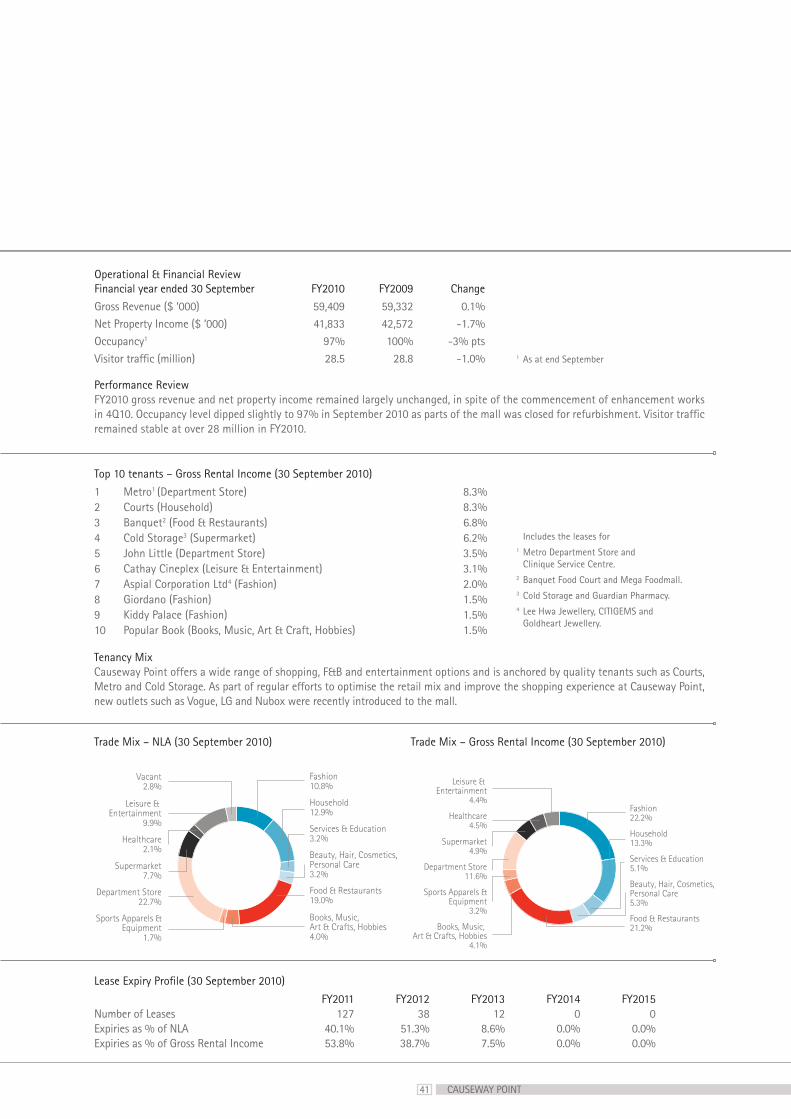
Operational & Financial ReviewFinancial year ended 30 September FY2010 FY2009 Change
Gross Revenue ($ ‘000) 59,409 59,332 0.1%Net Property Income ($ ‘000) 41,833 42,572 -1.7%Occupancy1 97% 100% -3% ptsVisitor traffic (million) 28.5 28.8 -1.0% 1 As at end September
CAUSEWAY POINT
Performance ReviewFY2010 gross revenue and net property income remained largely unchanged, in spite of the commencement of enhancement works in 4Q10. Occupancy level dipped slightly to 97% in September 2010 as parts of the mall was closed for refurbishment. Visitor traffic remained stable at over 28 million in FY2010.
Tenancy MixCauseway Point offers a wide range of shopping, F&B and entertainment options and is anchored by quality tenants such as Courts, Metro and Cold Storage. As part of regular efforts to optimise the retail mix and improve the shopping experience at Causeway Point, new outlets such as Vogue, LG and Nubox were recently introduced to the mall.
Lease Expiry Profile (30 September 2010)
FY2011 FY2012 FY2013 FY2014 FY2015Number of Leases 127 38 12 0 0Expiries as % of NLA 40.1% 51.3% 8.6% 0.0% 0.0%Expiries as % of Gross Rental Income 53.8% 38.7% 7.5% 0.0% 0.0%
Trade Mix – NLA (30 September 2010) Trade Mix – Gross Rental Income (30 September 2010)
Includes the leases for1 Metro Department Store and
Clinique Service Centre.2 Banquet Food Court and Mega Foodmall.3 Cold Storage and Guardian Pharmacy.4 Lee Hwa Jewellery, CITIGEMS and
Goldheart Jewellery.
Top 10 tenants – Gross Rental Income (30 September 2010)
1 Metro1 (Department Store) 8.3%2 Courts (Household) 8.3%3 Banquet2 (Food & Restaurants) 6.8%4 Cold Storage3 (Supermarket) 6.2%5 John Little (Department Store) 3.5%6 Cathay Cineplex (Leisure & Entertainment) 3.1%7 Aspial Corporation Ltd4 (Fashion) 2.0%8 Giordano (Fashion) 1.5%9 Kiddy Palace (Fashion) 1.5%10 Popular Book (Books, Music, Art & Craft, Hobbies) 1.5%
Fashion 10.8%
Household12.9%
Services & Education3.2%
Beauty, Hair, Cosmetics, Personal Care3.2%
Food & Restaurants19.0%
Books, Music, Art & Crafts, Hobbies4.0%
Sports Apparels & Equipment
1.7%
Department Store22.7%
Supermarket7.7%
Healthcare2.1%
Leisure & Entertainment
9.9%
Vacant2.8%
Fashion 22.2%
Household13.3%
Services & Education5.1%
Beauty, Hair, Cosmetics, Personal Care5.3%
Food & Restaurants21.2%
Sports Apparels & Equipment
3.2%
Department Store11.6%
Supermarket4.9%
Healthcare4.5%
Leisure & Entertainment
4.4%
Books, Music, Art & Crafts, Hobbies
4.1%
42
NORTHPOINT
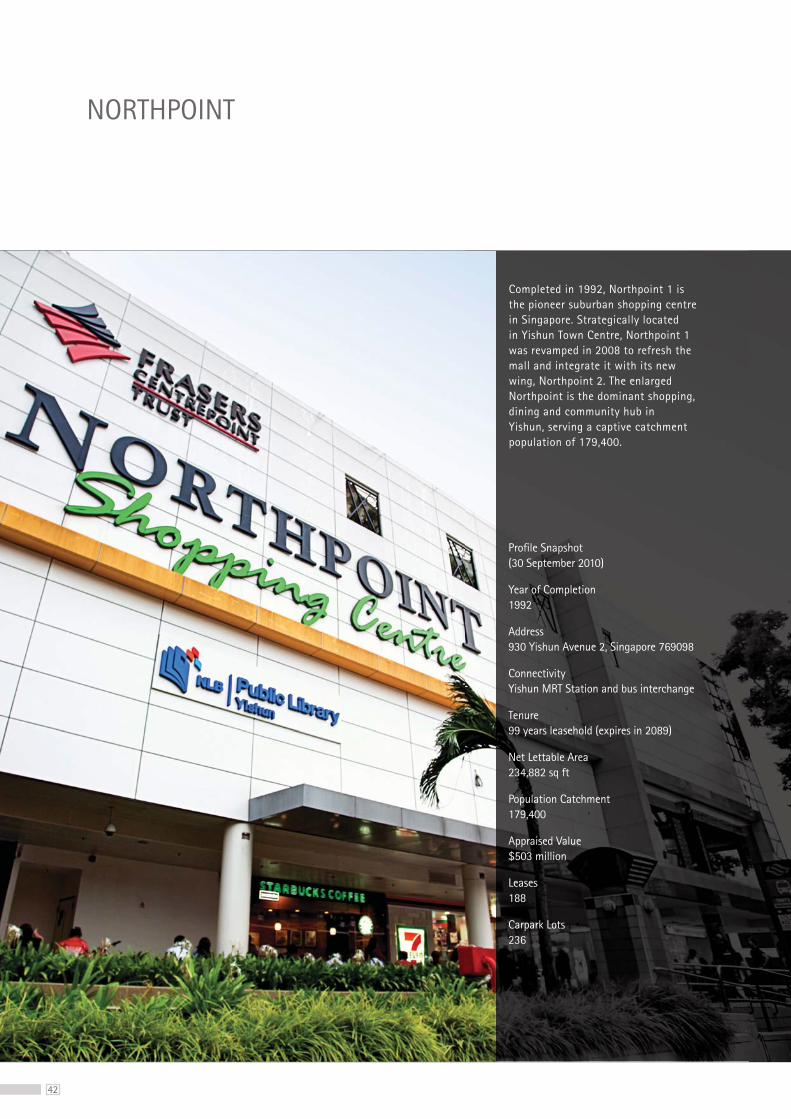
Profile Snapshot (30 September 2010)
Year of Completion 1992
Address 930 Yishun Avenue 2, Singapore 769098
Connectivity Yishun MRT Station and bus interchange
Tenure 99 years leasehold (expires in 2089)
Net Lettable Area 234,882 sq ft
Population Catchment 179,400
Appraised Value $503 million
Leases 188
Carpark Lots 236
Completed in 1992, Northpoint 1 is the pioneer suburban shopping centre in Singapore. Strategically located in Yishun Town Centre, Northpoint 1 was revamped in 2008 to refresh the mall and integrate it with its new wing, Northpoint 2. The enlarged Northpoint is the dominant shopping, dining and community hub in Yishun, serving a captive catchment population of 179,400.
43
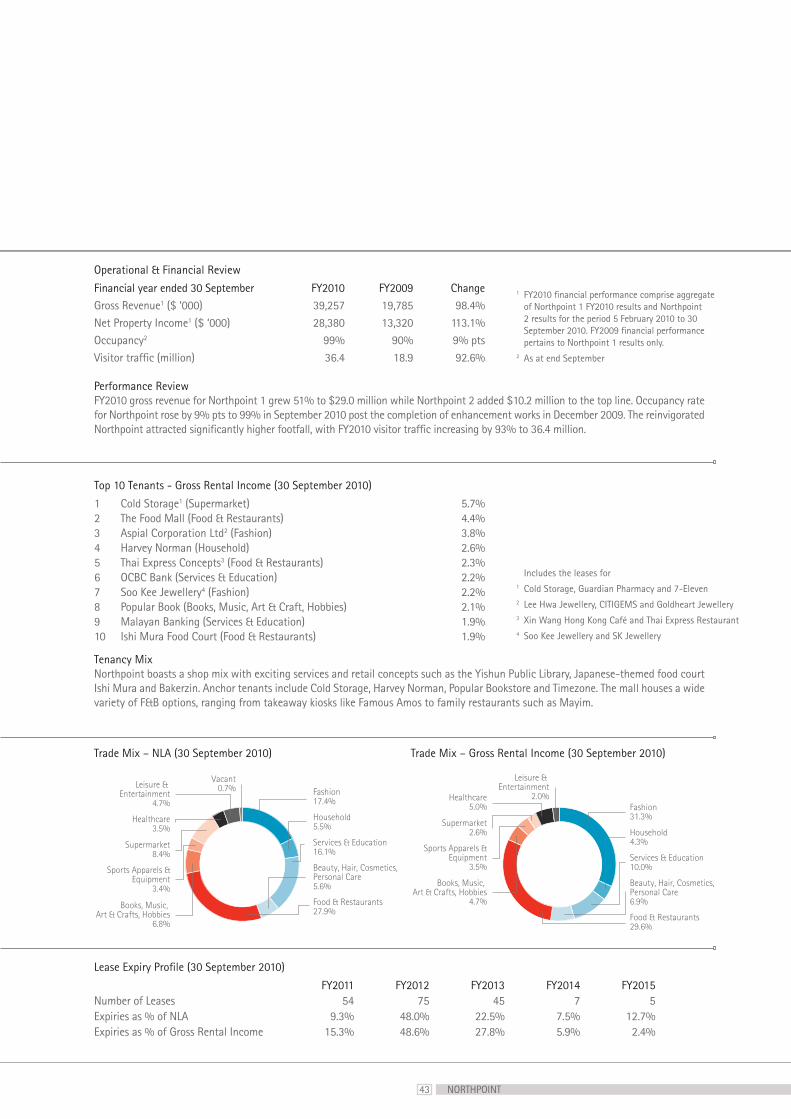
Performance ReviewFY2010 gross revenue for Northpoint 1 grew 51% to $29.0 million while Northpoint 2 added $10.2 million to the top line. Occupancy rate for Northpoint rose by 9% pts to 99% in September 2010 post the completion of enhancement works in December 2009. The reinvigorated Northpoint attracted significantly higher footfall, with FY2010 visitor traffic increasing by 93% to 36.4 million.
Fashion 17.4%
Household5.5%
Services & Education16.1%
Beauty, Hair, Cosmetics, Personal Care5.6%
Food & Restaurants27.9%
Books, Music, Art & Crafts, Hobbies
6.8%
Sports Apparels & Equipment
3.4%
Supermarket8.4%
Healthcare3.5%
Leisure & Entertainment
4.7%
Vacant0.7%
Fashion 31.3%
Household4.3%
Services & Education10.0%
Beauty, Hair, Cosmetics, Personal Care6.9%
Food & Restaurants29.6%
Sports Apparels & Equipment
3.5%
Supermarket2.6%
Healthcare5.0%
Leisure & Entertainment
2.0%
Books, Music, Art & Crafts, Hobbies
4.7%
Operational & Financial Review
Financial year ended 30 September FY2010 FY2009 ChangeGross Revenue1 ($ ‘000) 39,257 19,785 98.4%Net Property Income1 ($ ‘000) 28,380 13,320 113.1%Occupancy2 99% 90% 9% ptsVisitor traffic (million) 36.4 18.9 92.6%
1 FY2010 financial performance comprise aggregate of Northpoint 1 FY2010 results and Northpoint 2 results for the period 5 February 2010 to 30 September 2010. FY2009 financial performance pertains to Northpoint 1 results only.
2 As at end September
Tenancy MixNorthpoint boasts a shop mix with exciting services and retail concepts such as the Yishun Public Library, Japanese-themed food court Ishi Mura and Bakerzin. Anchor tenants include Cold Storage, Harvey Norman, Popular Bookstore and Timezone. The mall houses a wide variety of F&B options, ranging from takeaway kiosks like Famous Amos to family restaurants such as Mayim.
Top 10 Tenants - Gross Rental Income (30 September 2010)
1 Cold Storage1 (Supermarket) 5.7%2 The Food Mall (Food & Restaurants) 4.4%3 Aspial Corporation Ltd2 (Fashion) 3.8%4 Harvey Norman (Household) 2.6%5 Thai Express Concepts3 (Food & Restaurants) 2.3%6 OCBC Bank (Services & Education) 2.2%7 Soo Kee Jewellery4 (Fashion) 2.2%8 Popular Book (Books, Music, Art & Craft, Hobbies) 2.1%9 Malayan Banking (Services & Education) 1.9%10 Ishi Mura Food Court (Food & Restaurants) 1.9%
Includes the leases for1 Cold Storage, Guardian Pharmacy and 7-Eleven2 Lee Hwa Jewellery, CITIGEMS and Goldheart Jewellery3 Xin Wang Hong Kong Café and Thai Express Restaurant4 Soo Kee Jewellery and SK Jewellery
Trade Mix – NLA (30 September 2010) Trade Mix – Gross Rental Income (30 September 2010)
Lease Expiry Profile (30 September 2010)
FY2011 FY2012 FY2013 FY2014 FY2015Number of Leases 54 75 45 7 5Expiries as % of NLA 9.3% 48.0% 22.5% 7.5% 12.7%Expiries as % of Gross Rental Income 15.3% 48.6% 27.8% 5.9% 2.4%
NORTHPOINT
44
YEWTEE POINT
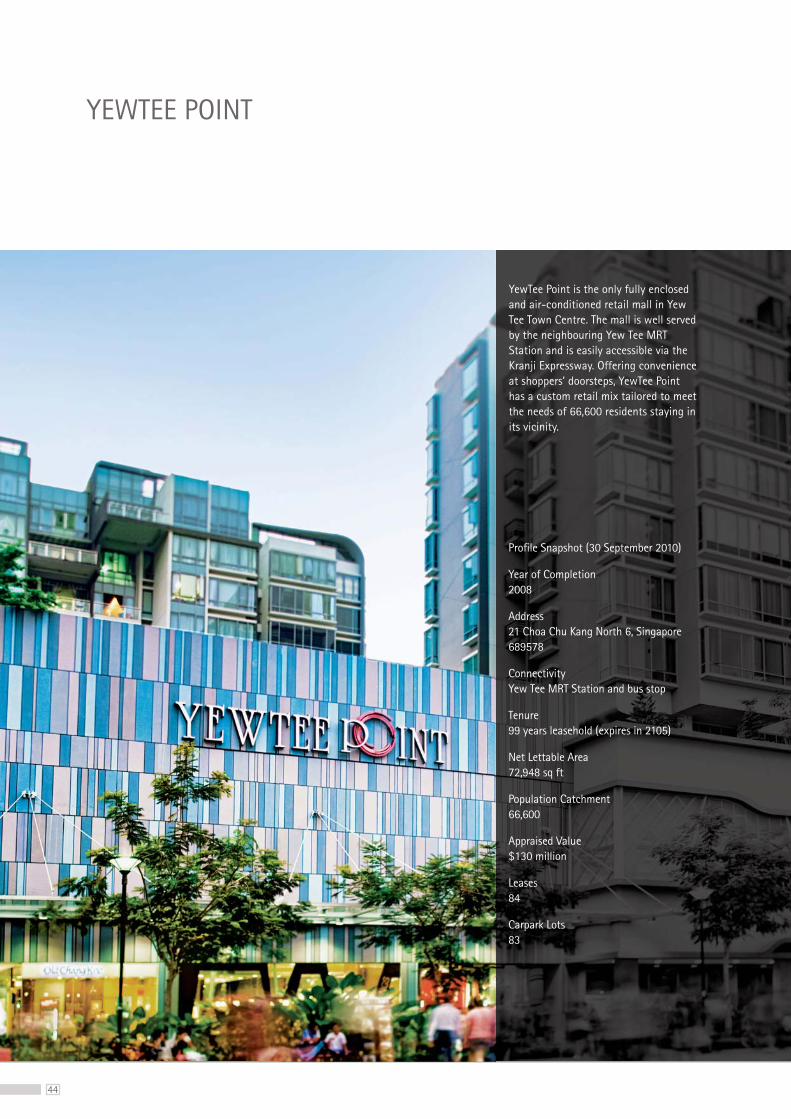
Profile Snapshot (30 September 2010)
Year of Completion 2008
Address 21 Choa Chu Kang North 6, Singapore 689578
Connectivity Yew Tee MRT Station and bus stop
Tenure 99 years leasehold (expires in 2105)
Net Lettable Area 72,948 sq ft
Population Catchment 66,600
Appraised Value $130 million
Leases 84
Carpark Lots 83
YewTee Point is the only fully enclosed and air-conditioned retail mall in Yew Tee Town Centre. The mall is well served by the neighbouring Yew Tee MRT Station and is easily accessible via the Kranji Expressway. Offering convenience at shoppers’ doorsteps, YewTee Point has a custom retail mix tailored to meet the needs of 66,600 residents staying in its vicinity.
45
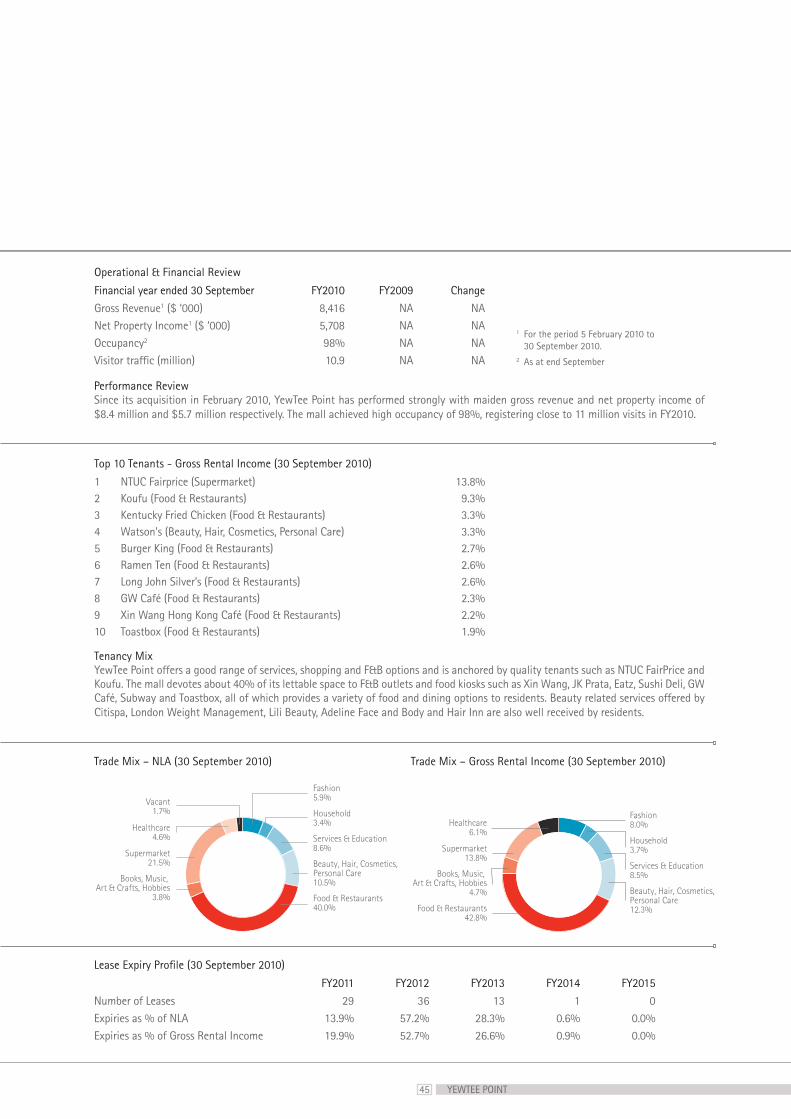
Operational & Financial Review
Financial year ended 30 September FY2010 FY2009 Change
Gross Revenue1 ($ ‘000) 8,416 NA NANet Property Income1 ($ ‘000) 5,708 NA NAOccupancy2 98% NA NAVisitor traffic (million) 10.9 NA NA
Top 10 Tenants - Gross Rental Income (30 September 2010)
1 NTUC Fairprice (Supermarket) 13.8%2 Koufu (Food & Restaurants) 9.3%3 Kentucky Fried Chicken (Food & Restaurants) 3.3%4 Watson's (Beauty, Hair, Cosmetics, Personal Care) 3.3%5 Burger King (Food & Restaurants) 2.7%6 Ramen Ten (Food & Restaurants) 2.6%7 Long John Silver’s (Food & Restaurants) 2.6%8 GW Café (Food & Restaurants) 2.3%9 Xin Wang Hong Kong Café (Food & Restaurants) 2.2%10 Toastbox (Food & Restaurants) 1.9%
Tenancy MixYewTee Point offers a good range of services, shopping and F&B options and is anchored by quality tenants such as NTUC FairPrice and Koufu. The mall devotes about 40% of its lettable space to F&B outlets and food kiosks such as Xin Wang, JK Prata, Eatz, Sushi Deli, GW Café, Subway and Toastbox, all of which provides a variety of food and dining options to residents. Beauty related services offered by Citispa, London Weight Management, Lili Beauty, Adeline Face and Body and Hair Inn are also well received by residents.
Fashion 5.9%
Household3.4%
Services & Education8.6%
Beauty, Hair, Cosmetics, Personal Care10.5%
Food & Restaurants40.0%
Books, Music, Art & Crafts, Hobbies
3.8%
Supermarket21.5%
Healthcare4.6%
Vacant1.7%
Fashion 8.0%
Household3.7%
Services & Education8.5%
Beauty, Hair, Cosmetics, Personal Care12.3%Food & Restaurants
42.8%
Supermarket13.8%
Healthcare6.1%
Books, Music, Art & Crafts, Hobbies
4.7%
Trade Mix – NLA (30 September 2010) Trade Mix – Gross Rental Income (30 September 2010)
Lease Expiry Profile (30 September 2010)
FY2011 FY2012 FY2013 FY2014 FY2015
Number of Leases 29 36 13 1 0Expiries as % of NLA 13.9% 57.2% 28.3% 0.6% 0.0%Expiries as % of Gross Rental Income 19.9% 52.7% 26.6% 0.9% 0.0%
1 For the period 5 February 2010 to 30 September 2010.
2 As at end September
Performance ReviewSince its acquisition in February 2010, YewTee Point has performed strongly with maiden gross revenue and net property income of $8.4 million and $5.7 million respectively. The mall achieved high occupancy of 98%, registering close to 11 million visits in FY2010.
YEWTEE POINT
46
ANCHORPOINT
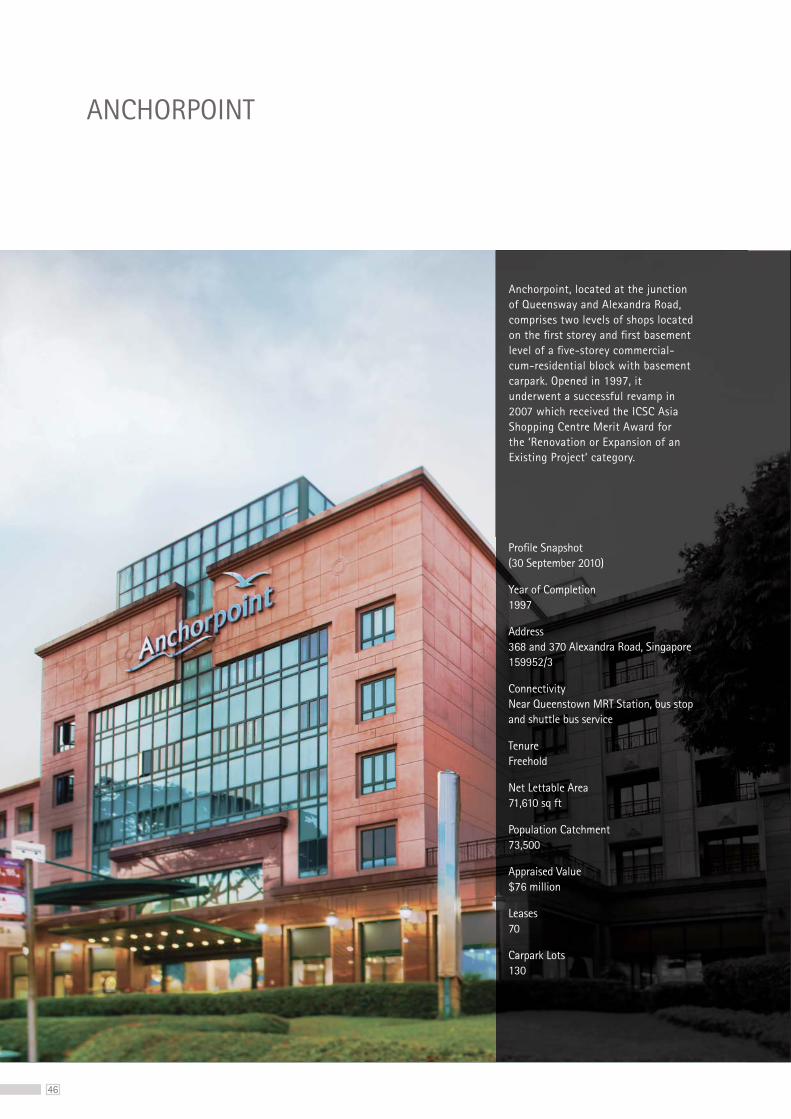
Profile Snapshot (30 September 2010)
Year of Completion 1997
Address 368 and 370 Alexandra Road, Singapore 159952/3
Connectivity Near Queenstown MRT Station, bus stop and shuttle bus service
Tenure Freehold
Net Lettable Area 71,610 sq ft
Population Catchment 73,500
Appraised Value $76 million
Leases 70
Carpark Lots 130
Anchorpoint, located at the junction of Queensway and Alexandra Road, comprises two levels of shops located on the first storey and first basement level of a five-storey commercial-cum-residential block with basement carpark. Opened in 1997, it underwent a successful revamp in 2007 which received the ICSC Asia Shopping Centre Merit Award for the ‘Renovation or Expansion of an Existing Project’ category.
47
Fashion 19.6%
Household3.9%
Services & Education4.5%
Beauty, Hair, Cosmetics, Personal Care8.1%
Food & Restaurants39.0%
Books, Music, Art & Crafts, Hobbies
5.4%
Supermarket15.1%
Healthcare3.2%
Vacant1.2% Fashion
21.1%
Household4.9%
Services & Education4.9%
Beauty, Hair, Cosmetics, Personal Care8.9%
Food & Restaurants40.4%
Supermarket9.4%
Healthcare4.1%
Books, Music, Art & Crafts, Hobbies
6.4%
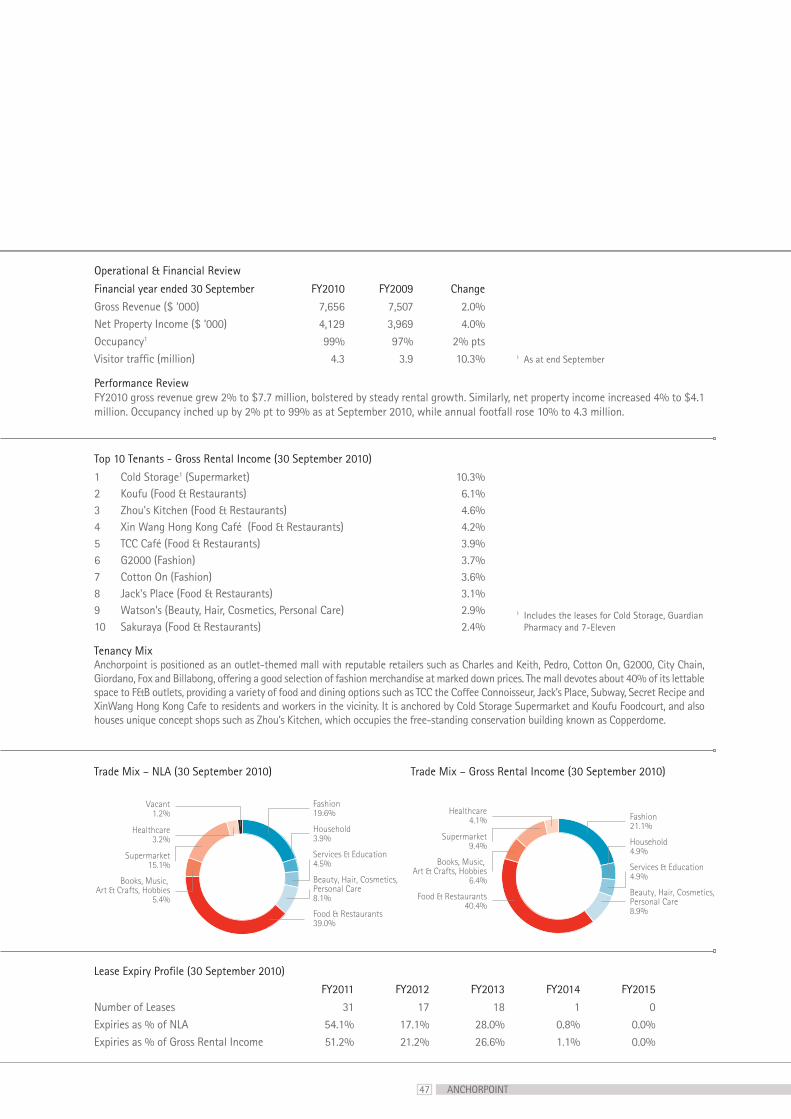
Performance ReviewFY2010 gross revenue grew 2% to $7.7 million, bolstered by steady rental growth. Similarly, net property income increased 4% to $4.1 million. Occupancy inched up by 2% pt to 99% as at September 2010, while annual footfall rose 10% to 4.3 million.
Operational & Financial Review
Financial year ended 30 September FY2010 FY2009 Change
Gross Revenue ($ ‘000) 7,656 7,507 2.0%Net Property Income ($ ‘000) 4,129 3,969 4.0%Occupancy1 99% 97% 2% ptsVisitor traffic (million) 4.3 3.9 10.3%
Tenancy MixAnchorpoint is positioned as an outlet-themed mall with reputable retailers such as Charles and Keith, Pedro, Cotton On, G2000, City Chain, Giordano, Fox and Billabong, offering a good selection of fashion merchandise at marked down prices. The mall devotes about 40% of its lettable space to F&B outlets, providing a variety of food and dining options such as TCC the Coffee Connoisseur, Jack’s Place, Subway, Secret Recipe and XinWang Hong Kong Cafe to residents and workers in the vicinity. It is anchored by Cold Storage Supermarket and Koufu Foodcourt, and also houses unique concept shops such as Zhou’s Kitchen, which occupies the free-standing conservation building known as Copperdome.
Top 10 Tenants - Gross Rental Income (30 September 2010)
1 Cold Storage1 (Supermarket) 10.3%2 Koufu (Food & Restaurants) 6.1%3 Zhou's Kitchen (Food & Restaurants) 4.6%4 Xin Wang Hong Kong Café (Food & Restaurants) 4.2%5 TCC Café (Food & Restaurants) 3.9%6 G2000 (Fashion) 3.7%7 Cotton On (Fashion) 3.6%8 Jack's Place (Food & Restaurants) 3.1%9 Watson’s (Beauty, Hair, Cosmetics, Personal Care) 2.9%10 Sakuraya (Food & Restaurants) 2.4%
Trade Mix – NLA (30 September 2010) Trade Mix – Gross Rental Income (30 September 2010)
Lease Expiry Profile (30 September 2010)
FY2011 FY2012 FY2013 FY2014 FY2015
Number of Leases 31 17 18 1 0Expiries as % of NLA 54.1% 17.1% 28.0% 0.8% 0.0%Expiries as % of Gross Rental Income 51.2% 21.2% 26.6% 1.1% 0.0%
1 Includes the leases for Cold Storage, Guardian Pharmacy and 7-Eleven
1 As at end September
ANCHORPOINT

48
HEKTAR REAL ESTATE INVESTMENT TRUST
Profile Snapshot (30 September 2010)
Subang Parade Mahkota Parade Wetex Parade & Classic HotelLocation Selangor Melaka JohorLand Tenure Freehold 99 yr leasehold (2101) FreeholdGross Floor Area (sq ft) 1,146,456 1,008,669 281,590Net Lettable Area (sq ft) 476,577 461,067 162,016Population Catchment 833,538 (15-min drive) 350,000 (15-min drive) 154,000 (10km radius)Car Park 1,313 1,079 1772009 Valuation1 RM 343 million RM 257 million RM 120 million% of Portfolio Value 47.6% 35.7% 16.7%Tenants 124 109 82Key Tenants Parkson, HSL, Celebrity Fitness,
MPHParkson, Giant, Ampang Superbowl, SenQ
The Store, McDonalds, Watsons
Occupancy 94.8% 96.7% 94.4%2009 Annual Visitor Traffic 7,755,608 7,879,291 5,630,183Year Opened 1988 1994 1996Year Acquired by REIT 2006 2006 2009Year Refurbished 2006-2007 2009-2010 Currently in planningOthers - - CLASSIC HOTEL, 156-room
3-star grade hotel on a 10-year net leaseback.
1 Revised property details as per latest Valuation Report 2009
FCT owns a 31% stake in Hektar REIT, Malaysia’s first retail focused REIT. The strategic investment in Hektar REIT provides FCT with accretive returns from an underlying portfolio of prominent and high quality suburban regional malls in Malaysia. The portfolio has won acclaim at the annual ICSC Asia Shopping Centre Awards: Subang Parade won a Development & Design Award in 2008 while Mahkota Parade and Wetex Parade received Awards for Marketing Excellence in 2009 and 2010 respectively.
49 HEKTAR REAL ESTATE INVESTMENT TRUST
Fashion & Footwear 16.7%
Food & Beverage / Food Court15.8%
Department Store / Supermarket35.2%
Gifts / Books / Toys /Speciality
7.6%
Education/Services4.4%
Leisure & Entertainment,Sports & Fitness
10.1%
Electronics & IT7.2%
Homewares & Furnishing
1.6%
Others1.4% Fashion & Footwear
30.1%
Food & Beverage / Food Court21.3%
Department Store / Supermarket15.3%
Gifts / Books / Toys / Specialty10.1%
Education / Services7.5%
Electronics & IT4.4%
Homewares & Furnishing
1.6%t
Others3.2%
Leisure & Entertainment, Sport & Fitness
6.7%
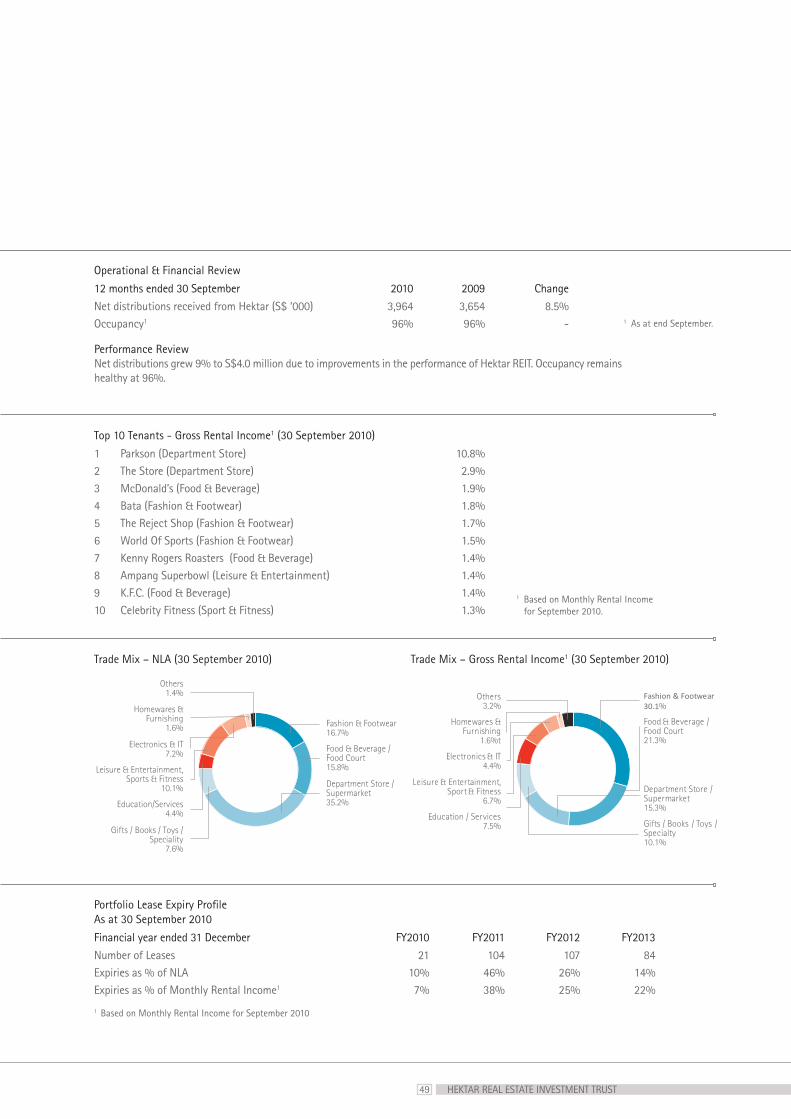
Performance ReviewNet distributions grew 9% to S$4.0 million due to improvements in the performance of Hektar REIT. Occupancy remains healthy at 96%.
Operational & Financial Review
12 months ended 30 September 2010 2009 Change
Net distributions received from Hektar (S$ ‘000) 3,964 3,654 8.5%Occupancy1 96% 96% -
Top 10 Tenants - Gross Rental Income1 (30 September 2010)
1 Parkson (Department Store) 10.8%2 The Store (Department Store) 2.9%3 McDonald’s (Food & Beverage) 1.9%4 Bata (Fashion & Footwear) 1.8%5 The Reject Shop (Fashion & Footwear) 1.7%6 World Of Sports (Fashion & Footwear) 1.5%7 Kenny Rogers Roasters (Food & Beverage) 1.4%8 Ampang Superbowl (Leisure & Entertainment) 1.4%9 K.F.C. (Food & Beverage) 1.4%10 Celebrity Fitness (Sport & Fitness) 1.3%
Trade Mix – NLA (30 September 2010) Trade Mix – Gross Rental Income1 (30 September 2010)
Portfolio Lease Expiry Profile As at 30 September 2010
Financial year ended 31 December FY2010 FY2011 FY2012 FY2013
Number of Leases 21 104 107 84Expiries as % of NLA 10% 46% 26% 14%Expiries as % of Monthly Rental Income1 7% 38% 25% 22%
1 Based on Monthly Rental Income for September 2010
1 As at end September.
1 Based on Monthly Rental Income for September 2010.

50
Corporate Governance
51
IntroductionFrasers Centrepoint Asset Management Ltd., in its capacity as the manager (the “Manager”) of Frasers Centrepoint Trust (“FCT”), is committed to upholding high standards of corporate governance to preserve and enhance asset value so as to maximise the returns from investments, and ultimately the distributions and total return to unitholders (“Unitholders”) of FCT.
FCT is a real estate investment trust (“REIT”) listed on the Main Board of the Singapore Exchange Securities Trading Limited (the “SGX-ST”). FCT is managed by the Manager, which is a wholly-owned subsidiary of Frasers Centrepoint Limited (“FCL”) and part of the the group of companies of Fraser and Neave, Limited (“F&N”).
This Report gives an account of the Manager’s corporate governance framework and practices in compliance with the Code of Corporate Governance 2005 (the “Code”). As FCT is a listed REIT, not all principles of the Code may be applicable to FCT and the Manager. Any deviations from the Code are explained.
The Manager has general powers of management over the assets of FCT. The Manager’s main responsibility is to manage FCT’s assets and liabilities for the benefit of Unitholders. It will ensure that the business of FCT is carried on and conducted in a proper and efficient manner. The Manager also ensures that applicable laws and regulations such as the listing rules of the SGX-ST, the Code of Collective Investment Schemes (“CIS”) (containing the Property Funds Guidelines) and the Securities and Futures Act (“SFA”), are complied with.
The primary role of the Manager is to set the strategic direction for FCT. This includes making recommendations to the Trustee on acquisitions, divestments and enhancement of assets.
On 7 June 2010, the Manager obtained a Capital Markets Services licence (“CMS Licence”) from the Monetary Authority of Singapore (“MAS”) to carry out REIT management activities. This is a requirement under the new licensing regime for REIT managers that was put in place under the SFA on 1 August 2008.
CORPORATE GOVERNANCE REPORT FOR THE YEAR ENDED 30 SEPTEMBER 2010
CORPORATE GOVERNANCE REPORT
52
Board MattersPrinciple 1: Board’s Conduct of its Affairs
Every company should be headed by an effective Board to lead and control the company. The Board is collectively responsible for the success of the company. The Board works with Management to achieve this and the Management remains accountable to the Board.
The composition of the Board of Directors of the Manager (the “Board”) as at 30 September 2010 is as follows:
Mr Philip Eng Heng Nee Chairman, Non-Executive (Independent)
Dr Chew Tuan Chiong (1) Chief Executive Officer (Non-independent)
Mr Anthony Cheong Fook Seng Non-Executive (Non-independent)
Mr Chia Khong Shoong Non-Executive (Non-independent)
Mr Bobby Chin Yoke Choong Non-Executive (Independent)
Mr Lim Ee Seng Non-Executive (Non-independent)
Mr Soh Kim Soon Non-Executive (Independent)
Mr Christopher Tang Kok Kai Non-Executive (Non-independent)
Note: (1) Appointed Chief Executive Officer on 1 March 2010 and Executive Director on 14 July 2010.
CORPORATE GOVERNANCE REPORT FOR THE YEAR ENDED 30 SEPTEMBER 2010(CONTINUED)
The Board works closely with and has overall oversight of Management. It provides entrepreneurial leadership, sets strategic aims and directions of the Manager, and reviews the performance and accountability of Management. The Board also sets the values and standards of corporate governance for the Manager and FCT. None of the Directors has entered into any service contract directly with FCT.
Management provides the Board with complete, timely and adequate information to keep the Directors updated on the operational and financial performance of FCT.
The Board has adopted a Manual of Authority which sets out the levels of authorisation required for specified transactions, including those that require Board approval. Appropriate delegations of authority to Management have been effected to facilitate operational efficiency.
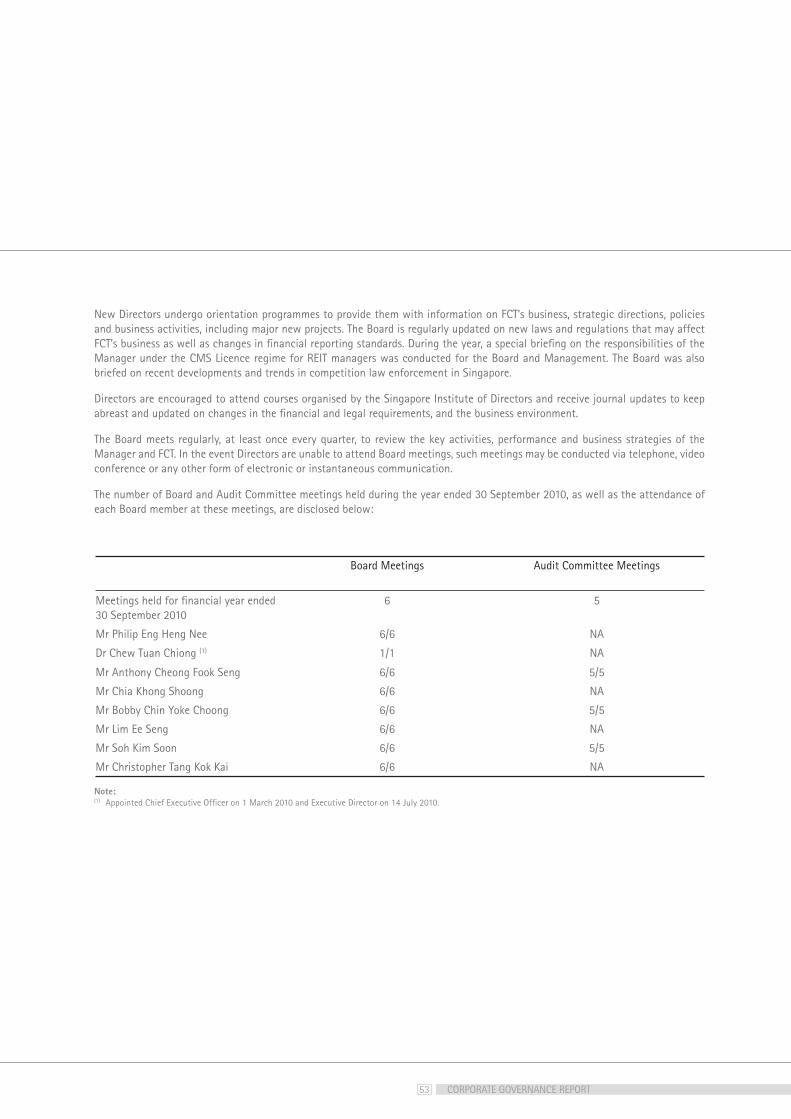
53
New Directors undergo orientation programmes to provide them with information on FCT’s business, strategic directions, policies and business activities, including major new projects. The Board is regularly updated on new laws and regulations that may affect FCT’s business as well as changes in financial reporting standards. During the year, a special briefing on the responsibilities of the Manager under the CMS Licence regime for REIT managers was conducted for the Board and Management. The Board was also briefed on recent developments and trends in competition law enforcement in Singapore.
Directors are encouraged to attend courses organised by the Singapore Institute of Directors and receive journal updates to keep abreast and updated on changes in the financial and legal requirements, and the business environment.
The Board meets regularly, at least once every quarter, to review the key activities, performance and business strategies of the Manager and FCT. In the event Directors are unable to attend Board meetings, such meetings may be conducted via telephone, video conference or any other form of electronic or instantaneous communication.
The number of Board and Audit Committee meetings held during the year ended 30 September 2010, as well as the attendance of each Board member at these meetings, are disclosed below:
Board Meetings Audit Committee Meetings
Meetings held for financial year ended 30 September 2010
6 5
Mr Philip Eng Heng Nee 6/6 NA
Dr Chew Tuan Chiong (1) 1/1 NA
Mr Anthony Cheong Fook Seng 6/6 5/5
Mr Chia Khong Shoong 6/6 NA
Mr Bobby Chin Yoke Choong 6/6 5/5
Mr Lim Ee Seng 6/6 NA
Mr Soh Kim Soon 6/6 5/5
Mr Christopher Tang Kok Kai 6/6 NA
Note: (1) Appointed Chief Executive Officer on 1 March 2010 and Executive Director on 14 July 2010.
CORPORATE GOVERNANCE REPORT
54
Principle 2: Board Composition and GuidanceThere should be a strong and independent element on the Board, which is able to exercise objective judgment on corporate affairs independently, in particular, from Management. No individual or small group of individuals should be allowed to dominate the Board’s decision making.
The Board comprises eight members, of which three are independent Non-executive Directors. The Board has considered the independence of Mr Bobby Chin Yoke Choong who is also an independent director of Oversea-Chinese Banking Corporation (“OCBC”). OCBC is a substantial shareholder1 of F&N, with which the F&N group of companies has a business relationship, under normal commercial terms. The Board is satisfied that Mr Chin can be considered independent.
Note: (1) A substantial shareholder of F&N is one which has 5 percent or more interest in the voting shares of F&N.
The size of the Board and core competencies of its members in various fields of accounting, finance, business management, together with their relevant industry knowledge and strategic planning experience, effectively serve FCT and the Manager. Management is able to benefit from their diverse and objective perspectives on issues that are brought before the Board, with a healthy exchange of ideas and views between the Board and Management, to help shape the strategic process. Directors of the Manager are not subject to periodic retirement by rotation. The Board reviews its composition to ensure the appropriate size and mix of expertise and experience.
Principle 3: Chairman and Chief Executive OfficerThere should be a clear division of responsibilities at the top of the company – the working of the Board and the executive responsibility of the company’s business – which will ensure a balance of power and authority, such that no one individual represents a considerable concentration of power.
Relationship between the Chairman and Chief Executive Officer The positions of the Chairman and the Chief Executive Officer are held by separate persons to ensure an appropriate balance of power and authority. The Chairman and Chief Executive Officer are not related to each other, nor is there any other business relationship between them.
The Chairman who is non-executive and independent, leads and ensures the effectiveness of the Board. He encourages constructive discussions among the Board members, and with Management, and facilitates effective contribution by the Directors. The Chief Executive Officer has full executive responsibilities over the business direction and operations of the Manager. This separation of roles between the Chairman and the Chief Executive Officer promotes robust deliberations by the Board and Management on the business activities of FCT.
CORPORATE GOVERNANCE REPORT FOR THE YEAR ENDED 30 SEPTEMBER 2010(CONTINUED)
55
Principle 4: Board MembershipThere should be a formal and transparent process for the appointment of new directors to the Board.
Nominating Committee The Manager does not consider it necessary for the Board to establish a nominating committee. In respect of the search and nomination process for new directors, the Board identifies the relevant and/or desirable skills and experience, and engages search companies as well as networking contacts to identify and shortlist candidates, to spread its reach for the best person for the role.
Principle 5: Board PerformanceThere should be formal assessment of the effectiveness of the Board as a whole and the contribution by each director to the effectiveness of the Board.
The Board uses objective performance criteria to assess the effectiveness of the Board as a whole and the contribution of each Director to the effectiveness of the Board. The Board has engaged an independent consultant to facilitate and administer the evaluation process to enhance the quality and objectivity of the evaluation.
All Directors are required to complete a questionnaire evaluating the Board and the Board Committee. The questionnaire covers areas such as Board composition, Board processes, managing the Manager’s performance, Board Committee effectiveness and any specific areas where improvements may be made.
The external consultant collates and analyses the feedback from the questionnaires completed by the Directors. The findings of the performance evaluation including the comments from Directors are reviewed by the Board, with a view to continuing improvements.
Principle 6: Access to InformationIn order to fulfill their responsibilities, Board members should be provided with complete, adequate and timely information prior to Board meetings and on an on-going basis.
On an on-going basis, and prior to Board meetings, adequate and timely information is given by Management to Board members, who have separate and independent access to Management. The Company Secretary, who is also a Non-executive Director and a member of the Audit Committee, attends all Board meetings. The Directors, either individually or as a group, may seek and obtain independent professional advice, where necessary, in the furtherance of their duties and at the Manager’s expense.
CORPORATE GOVERNANCE REPORT
56
Remuneration MattersPrinciple 7: Remuneration Matters
There should be a formal and transparent procedure for developing policy on executive remuneration and for fixing the remuneration packages of individual directors. No director should be involved in deciding his own remuneration.
Principle 8: Level and Mix of Remuneration The level of remuneration should be appropriate to attract, retain and motivate the directors needed to run the company successfully but companies should avoid paying more than is necessary for this purpose. A significant proportion of executive directors’ remuneration should be structured so as to link rewards to corporate and individual performance.
Principle 9: Disclosure on RemunerationEach company should provide clear disclosure of its remuneration policy, level and mix of remuneration, and the procedure for setting remuneration in the company’s annual report. It should provide disclosure in relation to its remuneration policies to enable investors to understand the link between remuneration paid to directors and key executives, and performance.
FCT, as a trust, is managed by the Manager which has experienced and well-qualified management personnel to manage the operational matters of the Manager and FCT. The Manager adopts the remuneration policies and practices of F&N, which has a Remuneration & Staff Establishment Committee (the “RSEC”) that oversees the remuneration and development of key executives. It ensures that a formal and transparent procedure is in place for developing policies on remuneration and for determining remuneration packages and service terms of individual Directors and senior Management. Such policy is submitted to the F&N Board for approval. The RSEC also reviews on an annual basis, the level and mix of remuneration and benefits policies and practices including the long-term incentive schemes. It also approves salary reviews, performance bonuses and incentives for senior Management taking into consideration the achievements of FCT and the Manager, and the performance of individual employees. Remuneration of the Directors and officers of the Manager are not paid out of the trust property of FCT, but are directly paid by the Manager from the fees it receives.
Accountability and AuditPrinciple 10: Accountability and Audit
The Board should present a balanced and understandable assessment of the company’s performance, position and prospects.
The Board, with the support of Management, is responsible for providing a balanced and understandable assessment of FCT’s performance, position and prospects, on a quarterly basis. Quarterly and annual financial reports and other material information are disseminated to Unitholders through announcements to the SGX-ST, and where applicable, press releases and analysts’ briefings.
The annual calendar of Board activities is scheduled in advance. Board papers are dispatched to Directors about a week before scheduled meetings so that Directors have sufficient time to review and consider matters being tabled and discussed at the meetings. Senior Executives are requested to attend the Board meetings to provide additional insights into matters being discussed and to respond to any queries from Directors. The Board also has separate and independent access to the Manager’s senior Management and the Company Secretary.
CORPORATE GOVERNANCE REPORT FOR THE YEAR ENDED 30 SEPTEMBER 2010(CONTINUED)
57
Principle 11: Audit CommitteeThe Board should established an Audit Committee with written terms of reference which clearly set out its authority and duties.
The Audit Committee comprises three Non-executive Directors, two of whom including the Chairman, are independent:
Name Role
Mr Bobby Chin Yoke Choong Chairman
Mr Anthony Cheong Fook Seng Member
Mr Soh Kim Soon Member
Members of the Audit Committee are appropriately qualified to discharge their responsibilities, possessing the requisite accounting and financial management expertise and experience.
The Audit Committee is governed by written terms of reference, with explicit authority to investigate any matter within its terms of reference. It has full access to, and the co-operation of Management, and full discretion to invite any Director or executive officer to attend its meetings. It has reasonable resources to enable it to discharge its functions effectively.
The Audit Committee’s responsibilities include:
controls/framework, reviewing the results of audit findings, and directing prompt remedial action by Management;
the SFA;
Board for approval, as well as reviewing the adequacy of external audits in respect of cost, scope and performance;
by the external auditors;
effectiveness of the internal audit procedures; and
laws and regulations;
In performing its functions, the Audit Committee met with the internal and external auditors and reviewed both their audit plans, and the assistance given by the Manager to the auditors.
CORPORATE GOVERNANCE REPORT
58
The Audit Committee is satisfied with the independence and objectivity of the external auditors and has recommended to the Board the nomination of the external auditors for re-appointment. The Audit Committee, has reviewed the nature and extent of non-audit services provided by the external auditors, and is satisfied that they do not affect the independence and objectivity of the external auditors.
Whistle-Blowing PolicyThe Audit Committee has put in place a Whistle-Blowing Policy which provides an avenue through which employees may report in good faith and in confidence any concerns in financial and other matters, and for independent investigation of such matters and appropriate follow-up action.
Principle 12: Internal ControlsThe Board should ensure that the Management maintains a sound system of internal controls to safeguard the Unitholders’ investments and the company’s assets.
The Manager has established a system of internal controls comprising procedures and processes to safeguard FCT’s assets, Unitholders’ interest as well as to manage risks. The Audit Committee reviews and reports to the Board on the adequacy of a sound system of controls, including financial, operational and compliance controls, and risk management policies and systems established by Management.
The Audit Committee reviews the risk profiles of FCT and the Manager, and guides Management to ensure that robust risk management and internal controls are in place. Effective risk management is fundamental to FCT’s business strategy. Key risks, control measures and management actions are continually identified, reviewed and monitored by Management as part of the Manager’s enterprise-wide risk management framework. Financial and operational key risk indicators are in place to track key risk exposures.
In addition, each transaction is comprehensively analysed to understand the risks involved before it is undertaken. In assessing business risks, the Board considers the economic environment and risks pertaining to the relevant industry. It reviews management reports and feasibility studies on major transactions prior to their approval.
The Audit Committee, with the assistance of the internal and external auditors, have reviewed, and the Board is satisfied with, the adequacy of FCT’s and the Manager’s internal controls, including financial, operational and compliance controls, and risk management systems.
Principle 13: Internal AuditThe company should establish an internal audit function that is independent of the activities it audits.
The internal audit function of the Manager is supported by F&N’s Internal Audit Department. It conducts objective and independent assessments of the adequacy and quality of the Manager’s system of internal controls. It is independent of the activities it audits. The internal auditor’s primary line of reporting is to the Chairman of the Audit Committee.
The Head of Internal Audit is a certified public accountant. The F&N Internal Audit has adopted and complied with the Standards for the Professional Practice of Internal Auditing set by The Institute of Internal Auditors.
The Audit Committee is satisfied that the Internal Audit function is adequately resourced, and has appropriate standing within FCT and the Manager.
CORPORATE GOVERNANCE REPORT FOR THE YEAR ENDED 30 SEPTEMBER 2010(CONTINUED)
59
Communication with ShareholdersPrinciple 14: Communication with Shareholders
Companies should engage in regular, effective and fair communication with Unitholders.
Principle 15: Companies should engage greater unitholder participation at AGMs, and allow Unitholders the opportunity to communicate their views on various matters affecting the company.
The Manager upholds a strong culture of continuous disclosure and communication with Unitholders and the investor community with timely and full disclosure of material information relating to FCT. This is effected by way of announcements to the SGX-ST via SGXNET and press releases, where relevant, and posted on FCT’s website at www.fraserscentrepointtrust.com.
A dedicated investor relations team conducts regular briefings for analysts and media representatives. These are generally planned to coincide with the release of FCT’s results. The performance and business outlook for FCT are discussed at such briefings, and to ensure transparency, such briefing materials are released to the SGX-ST via SGXNET and also made available on FCT’s website.
All Unitholders are sent a copy of the Annual Report. In compliance with the Property Funds Guidelines, an Annual General Meeting (“AGM”) was held during the year. The Board supports and encourages active Unitholder participation at AGMs. It believes that AGMs serve as an opportune forum for Unitholders to meet the Board and senior Management, and to interact with them. A Unitholder is allowed to appoint one or two proxies to attend and vote at the general meetings on his/her behalf. Board members and appropriate senior Management are present at each Unitholders’ meeting to respond to any questions from Unitholders. The external auditors are also present to address queries about the conduct of audit and the preparation and content of the auditors’ report.
For greater transparency, the Manager introduced electronic poll voting at its last AGM, during which Unitholders were invited to vote on relevant resolutions by poll, using an electronic voting system. This allowed all Unitholders present or represented at the meeting to vote on a one share, one vote basis. The voting results of all votes cast for, or against, each resolution is then screened at the meeting and announced to the SGX-ST after the meeting. The Manager intends to continue to use the electronic poll voting system at the forthcoming AGM.
Dealings in UnitsThe Manager has adopted a Dealing Policy on securities trading which provides guidance with regard to dealings in the FCT units by its Directors, Officers and Employees. Directors, Officers and Employees are prohibited from dealing in FCT units:
financial statements and one month before the date of announcement of full-year results (“Prohibition Period”); and
Directors, Officers and Employees are also directed to refrain from dealing in FCT units on short-term considerations.
CORPORATE GOVERNANCE REPORT
60
Prior to the commencement of the Prohibition Period, Directors, Officers and Employees will be reminded not to trade during this period or whenever they are in possession of unpublished price sensitive information. Each Director, Officer or Employee is required to complete and submit a declaration form to the Compliance Officer to report any trades he/she made in FCT units in the previous quarter. Such trades will be reported to the Board within 48 hours. A quarterly report will be provided to the Audit Committee on such dealings, if any. Any non-compliance such as trading within the Prohibition Period will be reported to Audit Committee for its review and instructions.
In compliance with the Dealing Policy in relation to the Manager, prior Board approval is required before the Manager deals or trades in any FCT units. The Manager has undertaken that it will not deal in FCT units:
a) during the period commencing one month before the public announcement of FCT’s annual results and (where applicable) property valuations and two weeks before the public announcement of FCT’s quarterly results; or
b) whenever it is in possession of unpublished material price sensitive information.
The Manager has also given an undertaking to the MAS that it will announce to the SGX-ST the particulars of its holdings in FCT units and any changes thereto within two business days after the date on which it acquires or disposes of any FCT units, as the case may be.
Conflicts of InterestThe Manager has put in place procedures to address potential conflicts of interest (including in relation to Directors, Officers and Employees) which may arise in managing FCT. These include the following:
including at least one Independent Director.
from voting. In such matters, the quorum must comprise a majority of independent Directors and must exclude nominee Directors of FCL and/or its subsidiaries.
voting on resolutions approving the transaction.
Additionally, the Trustee has been granted a right of first refusal by FCL over completed income producing properties located in Singapore predominantly used for retail purposes, which satisfy certain criteria.
CORPORATE GOVERNANCE REPORT FOR THE YEAR ENDED 30 SEPTEMBER 2010(CONTINUED)
61
Related Party TransactionsThe Manager has established internal control procedures to ensure that all Related Party Transactions are undertaken on normal commercial terms, and will not be prejudicial to the interests of FCT and the Unitholders. This may entail obtaining (where practicable) quotations from parties unrelated to the Manager, or obtaining one or more valuations from independent professional valuers (in accordance with the Property Funds Guidelines).
All Related Party Transactions are entered in a register maintained by the Manager, including any quotations from unrelated parties and independent valuations supporting the bases on which such transactions are entered into. The Manager incorporates into its internal audit plan a review of the Related Party Transactions recorded in the register to ascertain that internal procedures and requirements of the Listing Manual and Property Funds Guidelines have been complied with. The Audit Committee reviews the internal audit reports at least twice a year to ascertain that the guidelines and procedures established to monitor Related Party Transactions have been complied with. In addition, the Trustee also has the right to review any such relevant internal audit reports to ascertain that the Property Fund Guidelines have been complied with.
In respect of transactions entered into or to be entered into by the Trustee for and on behalf of FCT with a related party of the Manager (which would include relevant Associates (as defined in the Listing Manual) thereof) or FCT, the Trustee is required to satisfy itself that such transactions are conducted on normal commercial terms, are not prejudicial to the interests of FCT and the Unitholders, and in accordance with all applicable requirements of the Property Funds Guidelines and/or the Listing Manual. The Trustee has the ultimate discretion under the Trust Deed entered into between the Trustee and the Manager constituting FCT to decide whether or not to enter into such a transaction involving a related party of the Manager or FCT.
Role of the Audit Committee for Related Party TransactionsThe Audit Committee reviews Related Party Transactions periodically to ensure compliance with the internal control procedures and the relevant provisions of the Listing Manual and Property Funds Guidelines. Any member who has an interest in a transaction shall abstain from participating in the review and approval process in relation to that transaction.
CORPORATE GOVERNANCE REPORT
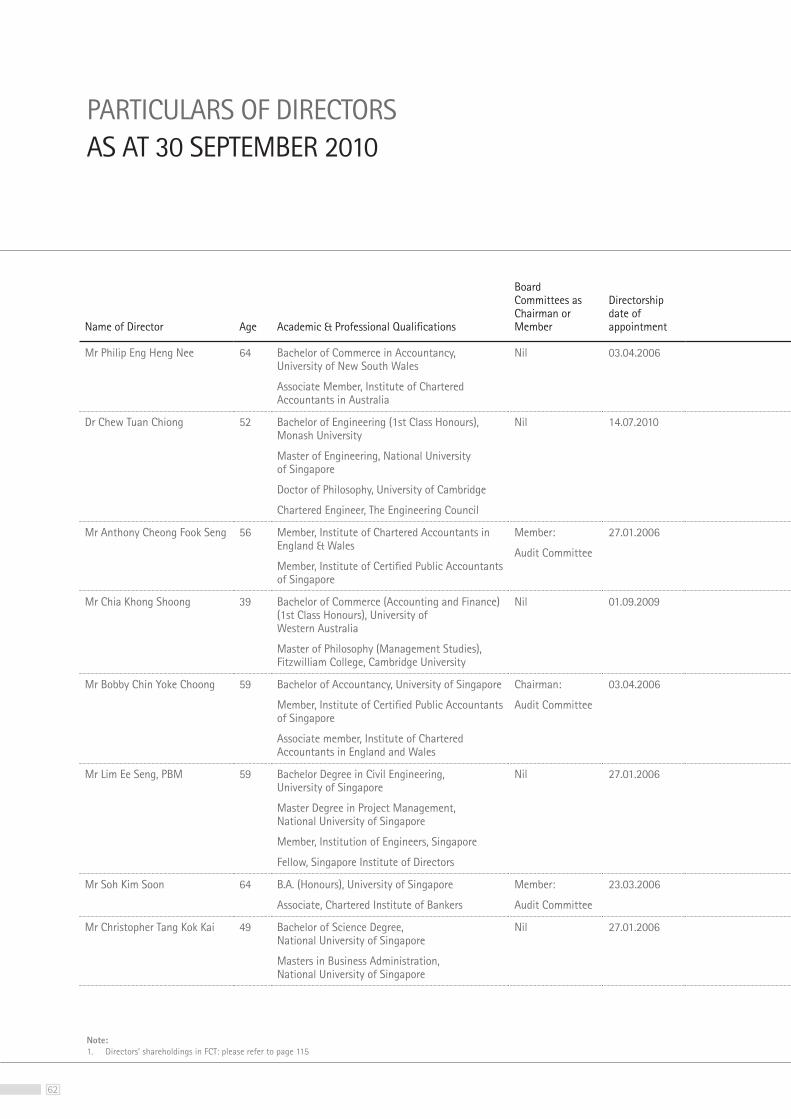
62
Name of Director Age Academic & Professional Qualifications
Board Committees as Chairman or Member
Directorship date of appointment
Mr Philip Eng Heng Nee 64 Bachelor of Commerce in Accountancy, University of New South Wales
Associate Member, Institute of Chartered Accountants in Australia
Nil 03.04.2006
Dr Chew Tuan Chiong 52 Bachelor of Engineering (1st Class Honours), Monash University
Master of Engineering, National University of Singapore
Doctor of Philosophy, University of Cambridge
Chartered Engineer, The Engineering Council
Nil 14.07.2010
Mr Anthony Cheong Fook Seng 56 Member, Institute of Chartered Accountants in England & Wales
Member, Institute of Certified Public Accountants of Singapore
Member:
Audit Committee
27.01.2006
Mr Chia Khong Shoong 39 Bachelor of Commerce (Accounting and Finance) (1st Class Honours), University of Western Australia
Master of Philosophy (Management Studies), Fitzwilliam College, Cambridge University
Nil 01.09.2009
Mr Bobby Chin Yoke Choong 59 Bachelor of Accountancy, University of Singapore
Member, Institute of Certified Public Accountants of Singapore
Associate member, Institute of Chartered Accountants in England and Wales
Chairman:
Audit Committee
03.04.2006
Mr Lim Ee Seng, PBM 59 Bachelor Degree in Civil Engineering, University of Singapore
Master Degree in Project Management, National University of Singapore
Member, Institution of Engineers, Singapore
Fellow, Singapore Institute of Directors
Nil 27.01.2006
Mr Soh Kim Soon 64 B.A. (Honours), University of Singapore
Associate, Chartered Institute of Bankers
Member:
Audit Committee
23.03.2006
Mr Christopher Tang Kok Kai 49 Bachelor of Science Degree, National University of Singapore
Masters in Business Administration, National University of Singapore
Nil 27.01.2006
PARTICULARS OF DIRECTORS AS AT 30 SEPTEMBER 2010
Note:1. Directors’ shareholdings in FCT: please refer to page 115
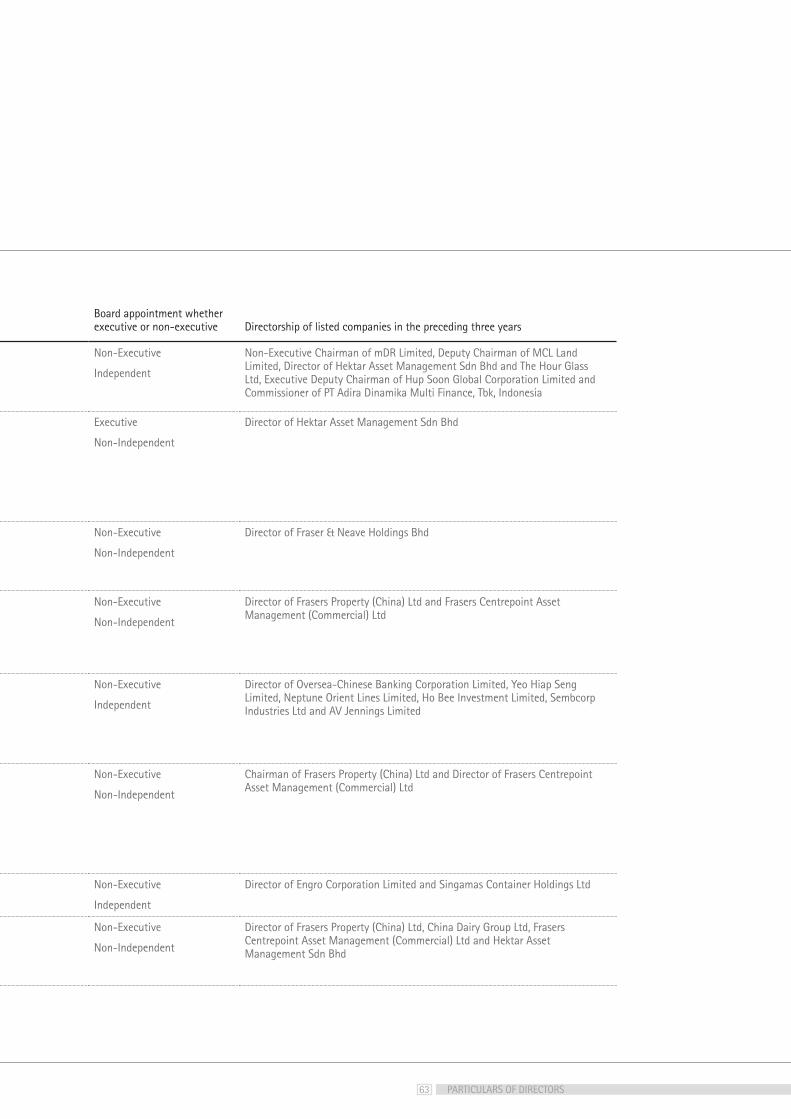
63
Board appointment whether executive or non-executive Directorship of listed companies in the preceding three years
Non-Executive
Independent
Non-Executive Chairman of mDR Limited, Deputy Chairman of MCL Land Limited, Director of Hektar Asset Management Sdn Bhd and The Hour Glass Ltd, Executive Deputy Chairman of Hup Soon Global Corporation Limited and Commissioner of PT Adira Dinamika Multi Finance, Tbk, Indonesia
Executive
Non-Independent
Director of Hektar Asset Management Sdn Bhd
Non-Executive
Non-Independent
Director of Fraser & Neave Holdings Bhd
Non-Executive
Non-Independent
Director of Frasers Property (China) Ltd and Frasers Centrepoint Asset Management (Commercial) Ltd
Non-Executive
Independent
Director of Oversea-Chinese Banking Corporation Limited, Yeo Hiap Seng Limited, Neptune Orient Lines Limited, Ho Bee Investment Limited, Sembcorp Industries Ltd and AV Jennings Limited
Non-Executive
Non-Independent
Chairman of Frasers Property (China) Ltd and Director of Frasers Centrepoint Asset Management (Commercial) Ltd
Non-Executive
Independent
Director of Engro Corporation Limited and Singamas Container Holdings Ltd
Non-Executive
Non-Independent
Director of Frasers Property (China) Ltd, China Dairy Group Ltd, Frasers Centrepoint Asset Management (Commercial) Ltd and Hektar Asset Management Sdn Bhd
PARTICULARS OF DIRECTORS

64
Financials
65
REPORT OF THE TRUSTEE
HSBC Institutional Trust Services (Singapore) Limited (the “Trustee”) is under a duty to take into custody and hold the assets of Frasers Centrepoint Trust (the “Trust”) and its subsidiary (collectively, the “Group”) in trust for the holders (“Unitholders”) of units in the Trust (the “Units”). In accordance with the Securities and Futures Act, Chapter 289, of Singapore, its subsidiary legislation, the Code on Collective Investment Schemes, the Trustee shall monitor the activities of Frasers Centrepoint Asset Management Ltd. (the “Manager”) for compliance with the limitations imposed on the investment and borrowing powers as set out in the trust deed dated 5 June 2006 (as amended and restated) (the “Trust Deed”) between the Manager and the Trustee in each annual accounting period and report thereon to Unitholders in an annual report.
To the best knowledge of the Trustee, the Manager has, in all material respects, managed the Trust during the period covered by these financial statements set out on pages 68 to 112 in accordance with the limitations imposed on the investment and borrowing powers set out in the Trust Deed.
For and on behalf of the Trustee,
HSBC Institutional Trust Services (Singapore) Limited
Tony Lewis Director
Singapore
29 November 2010
REPORT OF THE TRUSTEE
66
STATEMENT BY THE MANAGER
In the opinion of the directors of Frasers Centrepoint Asset Management Ltd., the accompanying financial statements set out on pages 68 to 112, comprising the Balance Sheets and Portfolio Statements as at 30 September 2010, the Statements of Total Return, Distribution Statements, Statements of Movements in Unitholders’ Funds and Cash Flow Statement for the year then ended, and a summary of significant accounting policies and other explanatory notes are drawn up so as to present fairly, in all material respects, the financial positions of the Group and the Trust as at 30 September 2010, the total return, distributable income, movements in Unitholders’ funds of the Group and of the Trust and cash flow of the Group for the year ended on that date in accordance with the recommendations of Statement of Recommended Accounting Practice 7 “Reporting Framework for Unit Trusts” issued by the Institute of Certified Public Accountants of Singapore and the provisions of the Trust Deed. At the date of this statement, there are reasonable grounds to believe that the Group and the Trust will be able to meet their financial obligations as and when they materialise.
For and on behalf of the Manager,
Frasers Centrepoint Asset Management Ltd.
Mr Philip Eng Heng Nee Dr Chew Tuan Chiong Director Director and Chief Executive Officer
Singapore
29 November 2010
67
INDEPENDENT AUDITORS’ REPORT TO THE UNITHOLDERS OF FRASERS CENTREPOINT TRUSTCONSTITUTED IN THE REPUBLIC OF SINGAPORE PURSUANT TO A TRUST DEED DATED 5 JUNE 2006 (AS AMENDED AND RESTATED)
We have audited the accompanying financial statements of Frasers Centrepoint Trust (the “Trust”) and its subsidiary (the “Group”), which comprise the Balance Sheets and Portfolio Statements of the Group and the Trust as at 30 September 2010, the Statements of Total Return, Distribution Statements, Statements of Movements in Unitholders’ Funds of the Group and the Trust and Cash Flow Statement of the Group for the year then ended, and a summary of significant accounting policies and other explanatory notes, as set out on pages 68 to 112.
Manager’s Responsibility for the Financial StatementsThe Manager of the Trust is responsible for the preparation and fair presentation of these financial statements in accordance with the recommendations of Statement of Recommended Accounting Practice 7 “Reporting Framework for Unit Trusts” issued by the Institute of Certified Public Accountants of Singapore. This responsibility includes: designing, implementing and maintaining internal control relevant to the preparation and fair presentation of financial statements that are free from material misstatement, whether due to fraud or error; selecting and applying appropriate accounting policies; and making accounting estimates that are reasonable in the circumstances.
Auditors’ ResponsibilityOur responsibility is to express an opinion on these financial statements based on our audit. We conducted our audit in accordance with Singapore Standards on Auditing. Those standards require that we comply with ethical requirements and plan and perform the audit to obtain reasonable assurance whether the financial statements are free from material misstatement.
An audit involves performing procedures to obtain audit evidence about the amounts and disclosures in the financial statements. The procedures selected depend on the auditor’s judgement, including the assessment of the risk of material misstatement of the financial statements, whether due to fraud or error. In making those risk assessments, the auditor considers internal control relevant to the entity’s preparation and fair presentation of the financial statements in order to design audit procedures that are appropriate in the circumstances, but not for the purpose of expressing an opinion on the effectiveness of the entity’s internal control. An audit also includes evaluating the appropriateness of accounting principles used and the reasonableness of accounting estimates made by the Manager of the Trust, as well as evaluating the overall presentation of the financial statements.
We believe that the audit evidence we have obtained is sufficient and appropriate to provide a basis for our audit opinion.
OpinionIn our opinion, the financial statements present fairly, in all material respects, the financial positions of the Group and of the Trust as at 30 September 2010, the total return, distributable income, movements in Unitholders’ funds of the Group and of the Trust and cash flow of the Group for the year ended on that date in accordance with the recommendations of Statement of Recommended Accounting Practice 7 “Reporting Framework for Unit Trusts” issued by the Institute of Certified Public Accountants of Singapore.
ERNST & YOUNG LLP
Public Accountants and Certified Public Accountants
Singapore
29 November 2010
INDEPENDANT AUDITORS’ REPORT TO THE UNITHOLDERS
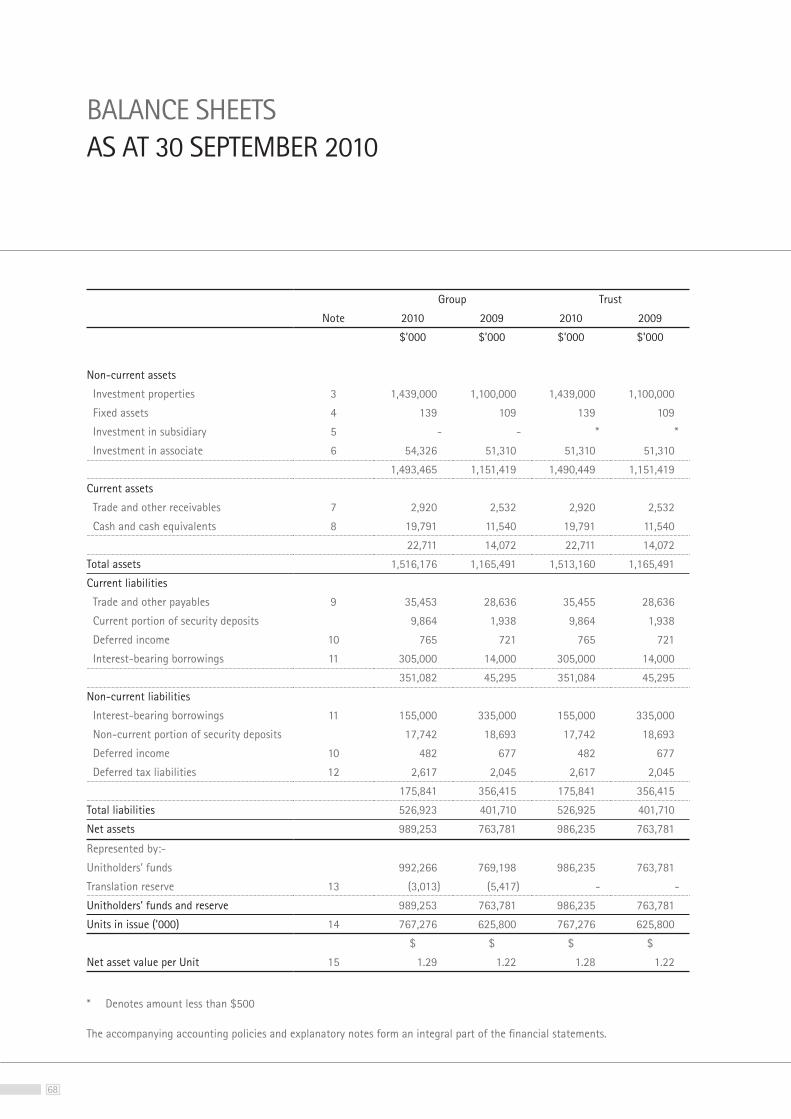
68
Group Trust
Note 2010 2009 2010 2009
$’000 $’000 $’000 $’000
Non-current assets
Investment properties 3 1,439,000 1,100,000 1,439,000 1,100,000
Fixed assets 4 139 109 139 109
Investment in subsidiary 5 - - * *
Investment in associate 6 54,326 51,310 51,310 51,310
1,493,465 1,151,419 1,490,449 1,151,419
Current assets
Trade and other receivables 7 2,920 2,532 2,920 2,532
Cash and cash equivalents 8 19,791 11,540 19,791 11,540
22,711 14,072 22,711 14,072
Total assets 1,516,176 1,165,491 1,513,160 1,165,491
Current liabilities
Trade and other payables 9 35,453 28,636 35,455 28,636
Current portion of security deposits 9,864 1,938 9,864 1,938
Deferred income 10 765 721 765 721
Interest-bearing borrowings 11 305,000 14,000 305,000 14,000
351,082 45,295 351,084 45,295
Non-current liabilities
Interest-bearing borrowings 11 155,000 335,000 155,000 335,000
Non-current portion of security deposits 17,742 18,693 17,742 18,693
Deferred income 10 482 677 482 677
Deferred tax liabilities 12 2,617 2,045 2,617 2,045
175,841 356,415 175,841 356,415
Total liabilities 526,923 401,710 526,925 401,710
Net assets 989,253 763,781 986,235 763,781
Represented by:-
Unitholders’ funds 992,266 769,198 986,235 763,781
Translation reserve 13 (3,013) (5,417) - -
Unitholders’ funds and reserve 989,253 763,781 986,235 763,781
Units in issue (’000) 14 767,276 625,800 767,276 625,800
$ $ $ $
Net asset value per Unit 15 1.29 1.22 1.28 1.22
* Denotes amount less than $500
BALANCE SHEETSAS AT 30 SEPTEMBER 2010
The accompanying accounting policies and explanatory notes form an integral part of the financial statements.
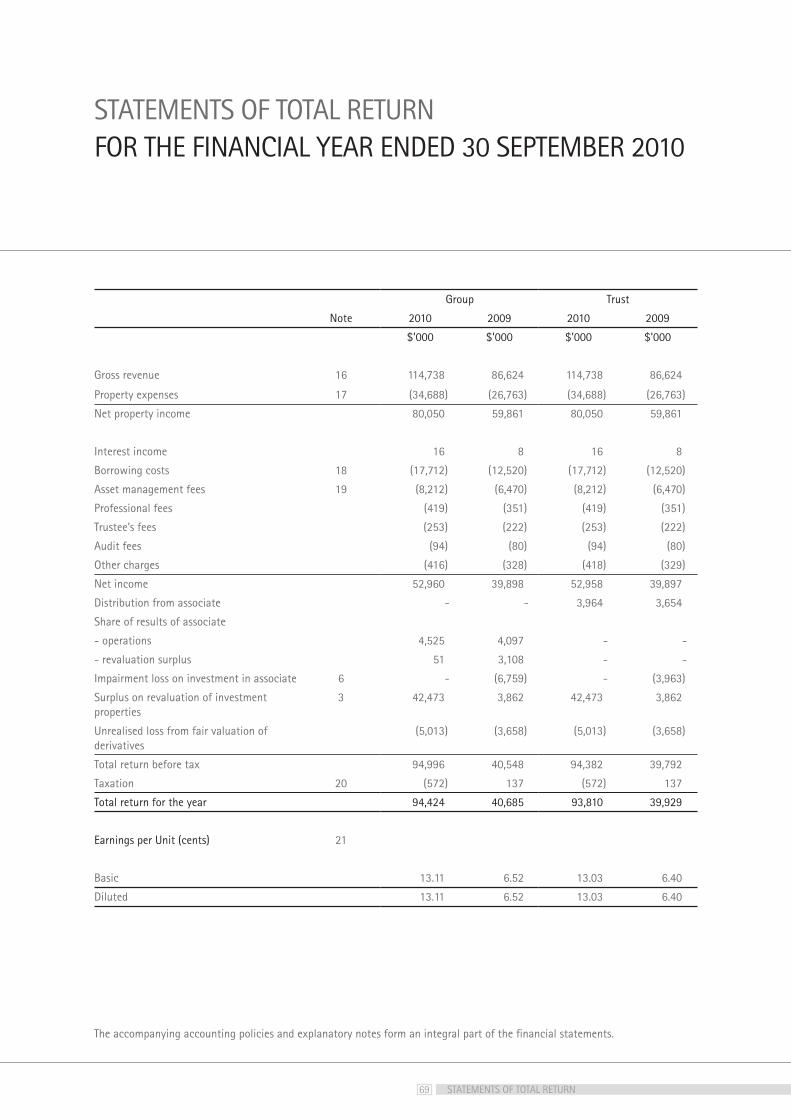
69
Group Trust
Note 2010 2009 2010 2009
$’000 $’000 $’000 $’000
Gross revenue 16 114,738 86,624 114,738 86,624
Property expenses 17 (34,688) (26,763) (34,688) (26,763)
Net property income 80,050 59,861 80,050 59,861
Interest income 16 8 16 8
Borrowing costs 18 (17,712) (12,520) (17,712) (12,520)
Asset management fees 19 (8,212) (6,470) (8,212) (6,470)
Professional fees (419) (351) (419) (351)
Trustee’s fees (253) (222) (253) (222)
Audit fees (94) (80) (94) (80)
Other charges (416) (328) (418) (329)
Net income 52,960 39,898 52,958 39,897
Distribution from associate - - 3,964 3,654
Share of results of associate
- operations 4,525 4,097 - -
- revaluation surplus 51 3,108 - -
Impairment loss on investment in associate 6 - (6,759) - (3,963)
Surplus on revaluation of investment properties
3 42,473 3,862 42,473 3,862
Unrealised loss from fair valuation of derivatives
(5,013) (3,658) (5,013) (3,658)
Total return before tax 94,996 40,548 94,382 39,792
Taxation 20 (572) 137 (572) 137
Total return for the year 94,424 40,685 93,810 39,929
Earnings per Unit (cents) 21
Basic 13.11 6.52 13.03 6.40
Diluted 13.11 6.52 13.03 6.40
STATEMENTS OF TOTAL RETURNFOR THE FINANCIAL YEAR ENDED 30 SEPTEMBER 2010
STATEMENTS OF TOTAL RETURN
The accompanying accounting policies and explanatory notes form an integral part of the financial statements.

70
Group Trust2010 2009 2010 2009$’000 $’000 $’000 $’000
Income available for distribution to Unitholders at beginning of year
12,801 12,759 12,800 12,759
Net income 52,960 39,898 52,958 39,897Net tax adjustments (Note A) 2,253 3,388 2,253 3,388
Distribution from associate 3,964 3,654 3,964 3,65459,177 46,940 59,175 46,939
Income available for distribution to Unitholders 71,978 59,699 71,975 59,698
Distributions to Unitholders:Distribution of 2.05 cents per Unit for period from 1/7/2008 to 30/9/2008
- 12,738 - 12,738
Distribution of 1.67 cents per Unit for period from 1/10/2008 to 31/12/2008
- 10,402 - 10,402
Distribution of 1.86 cents per Unit for period from 1/1/2009 to 31/3/2009
- 11,617 - 11,617
Distribution of 1.94 cents per Unit for period from 1/4/2009 to 30/6/2009
- 12,141 - 12,141
Distribution of 2.04 cents per Unit for period from 1/7/2009 to 30/9/2009
12,782 - 12,782 -
Distribution of 1.91 cents per Unit for period from 1/10/2009 to 31/12/2009
11,979 - 11,979 -
Distribution of 0.73 cents per Unit for period from 1/1/2010 to 3/2/2010
4,579 - 4,579 -
Distribution of 1.33 cents per Unit for period from 4/2/2010 to 31/3/2010
10,200 - 10,200 -
Distribution of 2.07 cents per Unit for period from 1/4/2010 to 30/6/2010
15,883 - 15,883 -
55,423 46,898 55,423 46,898
Income available for distribution to Unitholders at end of year 16,555 12,801 16,552 12,800
Note A – Net tax adjustments relate to the following non-tax deductible items:
- Asset management fees paid/payable in Units 2,483 3,943 2,483 3,943- Trustee’s fees 253 222 253 222- Amortisation of loan arrangement fee 401 307 401 307- Amortisation of lease incentives 72 (2,361) 72 (2,361)- Deferred income (25) (38) (25) (38)- Other items (931) 1,315 (931) 1,315Net tax adjustments 2,253 3,388 2,253 3,388
DISTRIBUTION STATEMENTSFOR THE FINANCIAL YEAR ENDED 30 SEPTEMBER 2010
The accompanying accounting policies and explanatory notes form an integral part of the financial statements.
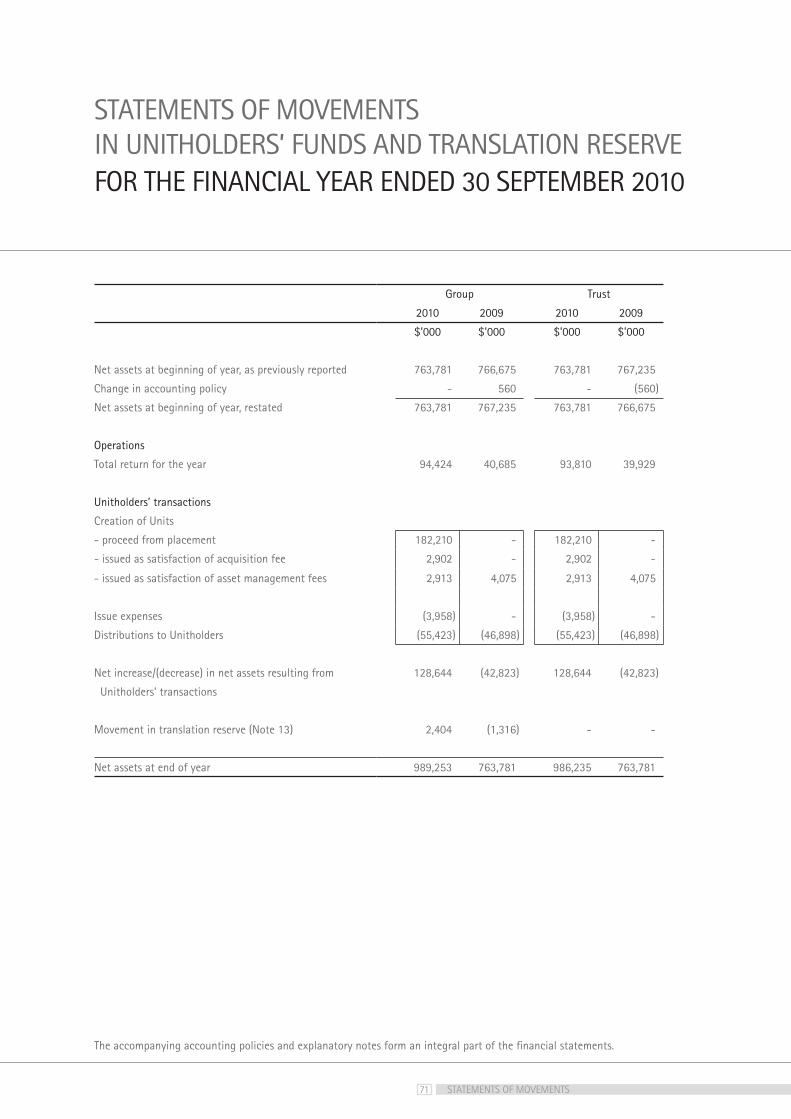
71
STATEMENTS OF MOVEMENTSIN UNITHOLDERS’ FUNDS AND TRANSLATION RESERVEFOR THE FINANCIAL YEAR ENDED 30 SEPTEMBER 2010
Group Trust
2010 2009 2010 2009
$’000 $’000 $’000 $’000
Net assets at beginning of year, as previously reported 763,781 766,675 763,781 767,235
Change in accounting policy - 560 - (560)
Net assets at beginning of year, restated 763,781 767,235 763,781 766,675
Operations
Total return for the year 94,424 40,685 93,810 39,929
Unitholders’ transactions
Creation of Units
- proceed from placement 182,210 - 182,210 -
- issued as satisfaction of acquisition fee 2,902 - 2,902 -
- issued as satisfaction of asset management fees 2,913 4,075 2,913 4,075
Issue expenses (3,958) - (3,958) -
Distributions to Unitholders (55,423) (46,898) (55,423) (46,898)
Net increase/(decrease) in net assets resulting from 128,644 (42,823) 128,644 (42,823)
Unitholders’ transactions
Movement in translation reserve (Note 13) 2,404 (1,316) - -
Net assets at end of year 989,253 763,781 986,235 763,781
The accompanying accounting policies and explanatory notes form an integral part of the financial statements.
STATEMENTS OF MOVEMENTS
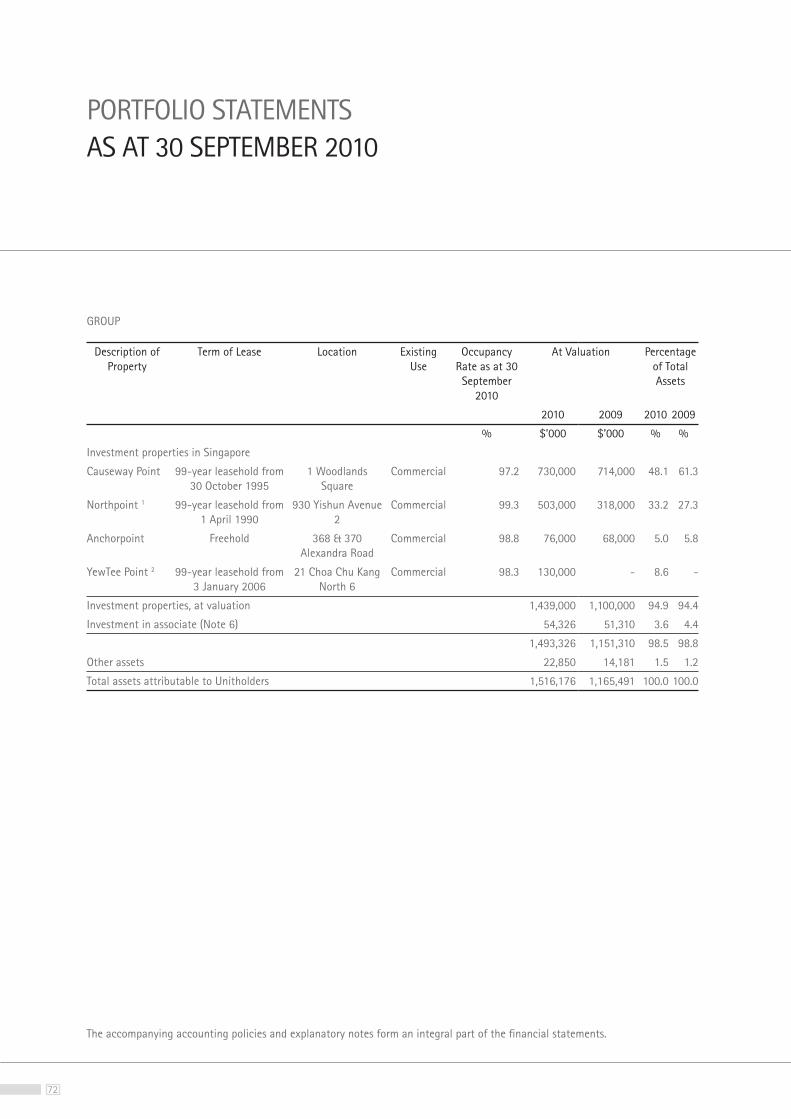
72
PORTFOLIO STATEMENTSAS AT 30 SEPTEMBER 2010
The accompanying accounting policies and explanatory notes form an integral part of the financial statements.
GROUP
Description of Property
Term of Lease Location Existing Use
Occupancy Rate as at 30 September
2010
At Valuation Percentage of Total Assets
2010 2009 2010 2009
% $’000 $’000 % %
Investment properties in Singapore
Causeway Point 99-year leasehold from 30 October 1995
1 Woodlands Square
Commercial 97.2 730,000 714,000 48.1 61.3
Northpoint 1 99-year leasehold from 1 April 1990
930 Yishun Avenue 2
Commercial 99.3 503,000 318,000 33.2 27.3
Anchorpoint Freehold 368 & 370 Alexandra Road
Commercial 98.8 76,000 68,000 5.0 5.8
YewTee Point 2 99-year leasehold from 3 January 2006
21 Choa Chu Kang North 6
Commercial 98.3 130,000 - 8.6 -
Investment properties, at valuation 1,439,000 1,100,000 94.9 94.4
Investment in associate (Note 6) 54,326 51,310 3.6 4.4
1,493,326 1,151,310 98.5 98.8
Other assets 22,850 14,181 1.5 1.2
Total assets attributable to Unitholders 1,516,176 1,165,491 100.0 100.0
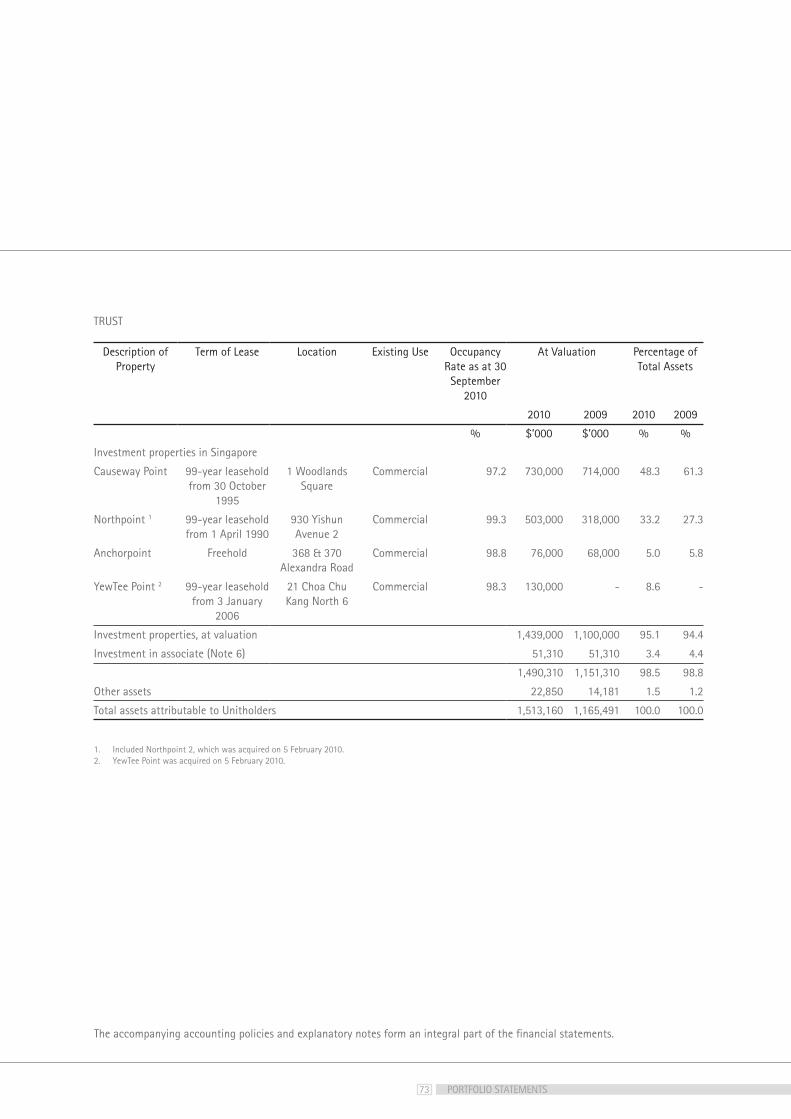
73
The accompanying accounting policies and explanatory notes form an integral part of the financial statements.
TRUST
Description of Property
Term of Lease Location Existing Use Occupancy Rate as at 30 September
2010
At Valuation Percentage of Total Assets
2010 2009 2010 2009
% $’000 $’000 % %
Investment properties in Singapore
Causeway Point 99-year leasehold from 30 October
1995
1 Woodlands Square
Commercial 97.2 730,000 714,000 48.3 61.3
Northpoint 1 99-year leasehold from 1 April 1990
930 Yishun Avenue 2
Commercial 99.3 503,000 318,000 33.2 27.3
Anchorpoint Freehold 368 & 370 Alexandra Road
Commercial 98.8 76,000 68,000 5.0 5.8
YewTee Point 2 99-year leasehold from 3 January
2006
21 Choa Chu Kang North 6
Commercial 98.3 130,000 - 8.6 -
Investment properties, at valuation 1,439,000 1,100,000 95.1 94.4
Investment in associate (Note 6) 51,310 51,310 3.4 4.4
1,490,310 1,151,310 98.5 98.8
Other assets 22,850 14,181 1.5 1.2
Total assets attributable to Unitholders 1,513,160 1,165,491 100.0 100.0
1. Included Northpoint 2, which was acquired on 5 February 2010.2. YewTee Point was acquired on 5 February 2010.
PORTFOLIO STATEMENTS
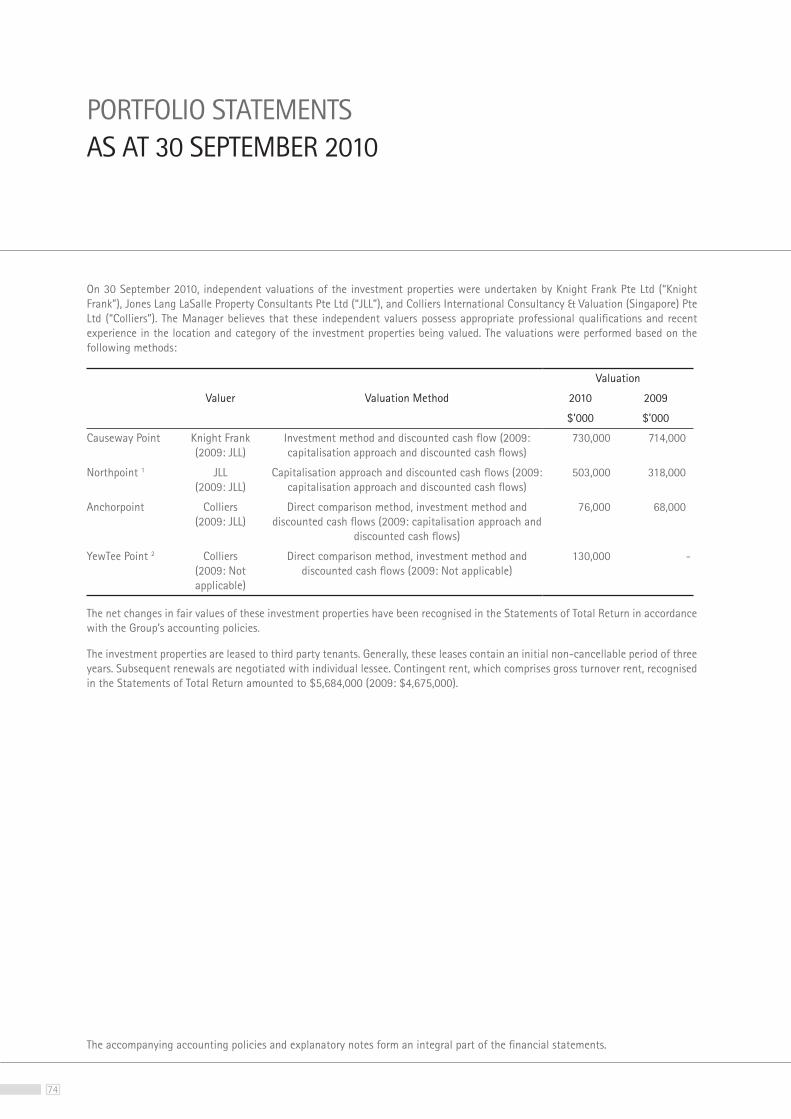
74
On 30 September 2010, independent valuations of the investment properties were undertaken by Knight Frank Pte Ltd (“Knight Frank”), Jones Lang LaSalle Property Consultants Pte Ltd (“JLL”), and Colliers International Consultancy & Valuation (Singapore) Pte Ltd (“Colliers”). The Manager believes that these independent valuers possess appropriate professional qualifications and recent experience in the location and category of the investment properties being valued. The valuations were performed based on the following methods:
Valuation
Valuer Valuation Method 2010 2009
$’000 $’000
Causeway Point Knight Frank (2009: JLL)
Investment method and discounted cash flow (2009: capitalisation approach and discounted cash flows)
730,000 714,000
Northpoint 1 JLL (2009: JLL)
Capitalisation approach and discounted cash flows (2009: capitalisation approach and discounted cash flows)
503,000 318,000
Anchorpoint Colliers (2009: JLL)
Direct comparison method, investment method and discounted cash flows (2009: capitalisation approach and
discounted cash flows)
76,000 68,000
YewTee Point 2 Colliers (2009: Not applicable)
Direct comparison method, investment method and discounted cash flows (2009: Not applicable)
130,000 -
The net changes in fair values of these investment properties have been recognised in the Statements of Total Return in accordance with the Group’s accounting policies.
The investment properties are leased to third party tenants. Generally, these leases contain an initial non-cancellable period of three years. Subsequent renewals are negotiated with individual lessee. Contingent rent, which comprises gross turnover rent, recognised in the Statements of Total Return amounted to $5,684,000 (2009: $4,675,000).
The accompanying accounting policies and explanatory notes form an integral part of the financial statements.
PORTFOLIO STATEMENTSAS AT 30 SEPTEMBER 2010
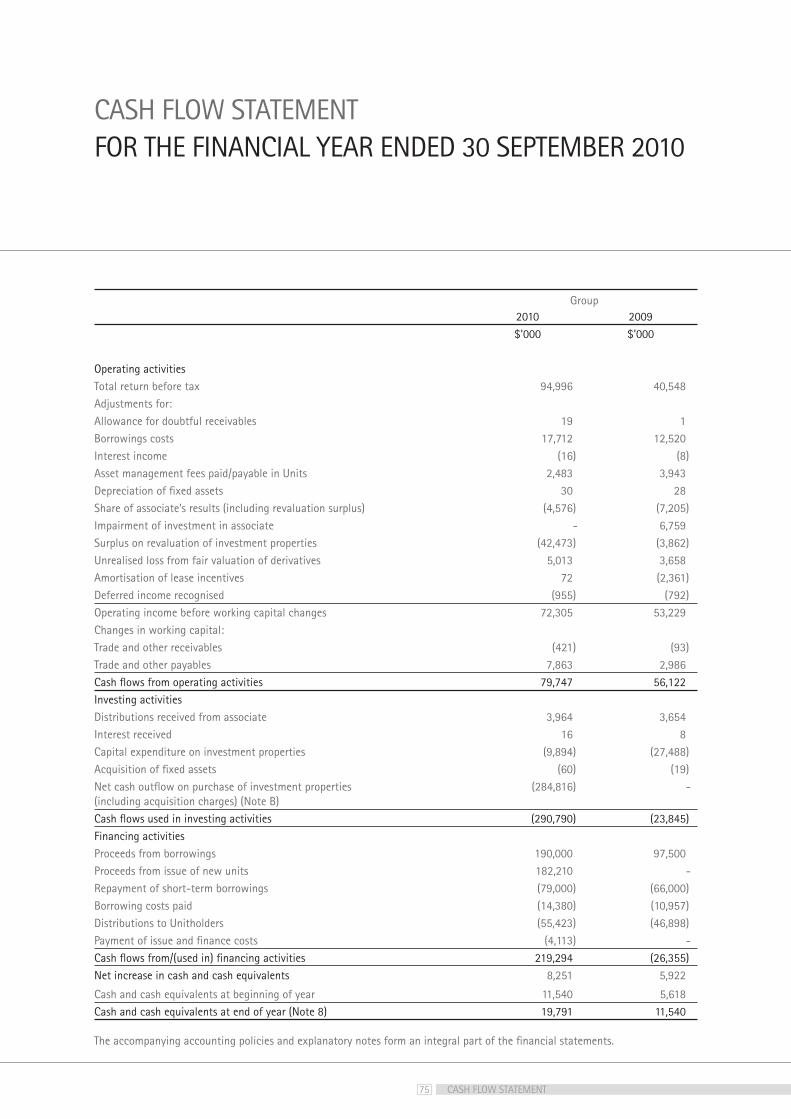
75
2010 2009$’000 $’000
Operating activitiesTotal return before tax 94,996 40,548Adjustments for:Allowance for doubtful receivables 19 1Borrowings costs 17,712 12,520Interest income (16) (8)Asset management fees paid/payable in Units 2,483 3,943Depreciation of fixed assets 30 28Share of associate’s results (including revaluation surplus) (4,576) (7,205)Impairment of investment in associate - 6,759Surplus on revaluation of investment properties (42,473) (3,862)Unrealised loss from fair valuation of derivatives 5,013 3,658Amortisation of lease incentives 72 (2,361)Deferred income recognised (955) (792)Operating income before working capital changes 72,305 53,229Changes in working capital:Trade and other receivables (421) (93)Trade and other payables 7,863 2,986Cash flows from operating activities 79,747 56,122Investing activitiesDistributions received from associate 3,964 3,654Interest received 16 8Capital expenditure on investment properties (9,894) (27,488)Acquisition of fixed assets (60) (19)Net cash outflow on purchase of investment properties (including acquisition charges) (Note B)
(284,816) -
Cash flows used in investing activities (290,790) (23,845)Financing activitiesProceeds from borrowings 190,000 97,500Proceeds from issue of new units 182,210 -Repayment of short-term borrowings (79,000) (66,000)Borrowing costs paid (14,380) (10,957)Distributions to Unitholders (55,423) (46,898)Payment of issue and finance costs (4,113) -Cash flows from/(used in) financing activities 219,294 (26,355)Net increase in cash and cash equivalents 8,251 5,922
Cash and cash equivalents at beginning of year 11,540 5,618Cash and cash equivalents at end of year (Note 8) 19,791 11,540
CASH FLOW STATEMENTFOR THE FINANCIAL YEAR ENDED 30 SEPTEMBER 2010
The accompanying accounting policies and explanatory notes form an integral part of the financial statements.
CASH FLOW STATEMENT
Group
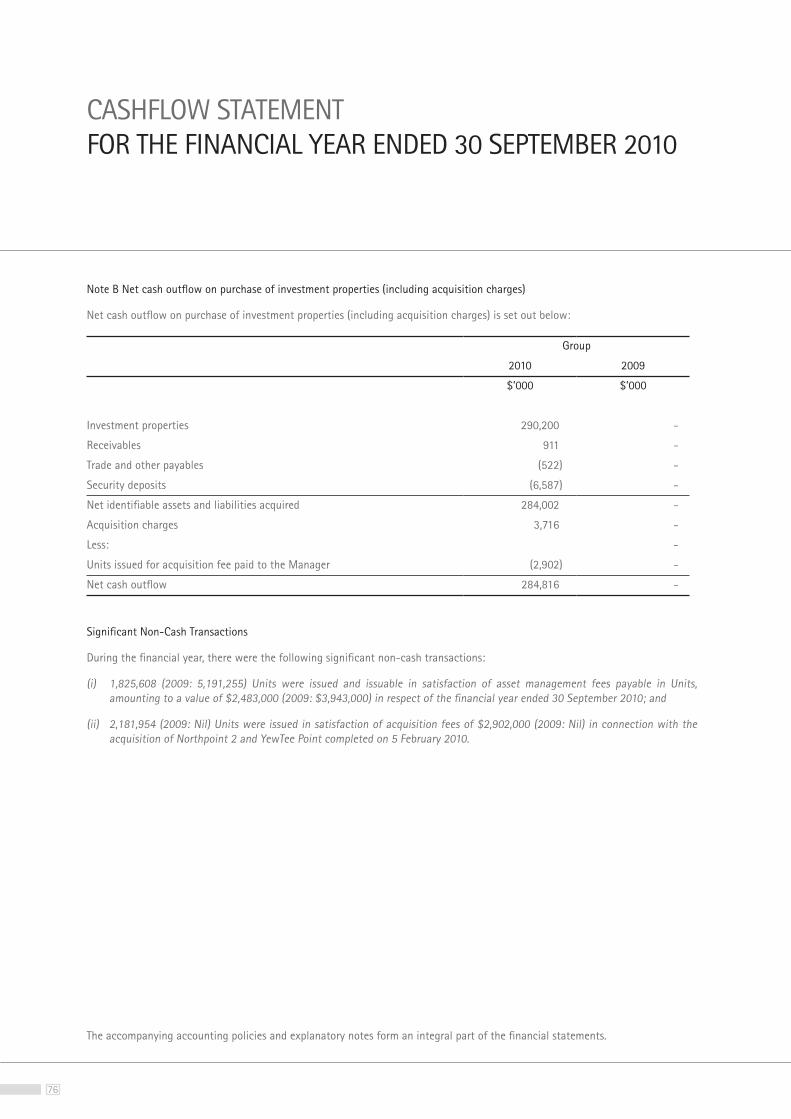
76
Note B Net cash outflow on purchase of investment properties (including acquisition charges)
Net cash outflow on purchase of investment properties (including acquisition charges) is set out below:
Group
2010 2009
$’000 $’000
Investment properties 290,200 -
Receivables 911 -
Trade and other payables (522) -
Security deposits (6,587) -
Net identifiable assets and liabilities acquired 284,002 -
Acquisition charges 3,716 -
Less: -
Units issued for acquisition fee paid to the Manager (2,902) -
Net cash outflow 284,816 -
Significant Non-Cash Transactions
During the financial year, there were the following significant non-cash transactions:
(i) 1,825,608 (2009: 5,191,255) Units were issued and issuable in satisfaction of asset management fees payable in Units, amounting to a value of $2,483,000 (2009: $3,943,000) in respect of the financial year ended 30 September 2010; and
(ii) 2,181,954 (2009: Nil) Units were issued in satisfaction of acquisition fees of $2,902,000 (2009: Nil) in connection with the acquisition of Northpoint 2 and YewTee Point completed on 5 February 2010.
CASHFLOW STATEMENTFOR THE FINANCIAL YEAR ENDED 30 SEPTEMBER 2010
The accompanying accounting policies and explanatory notes form an integral part of the financial statements.
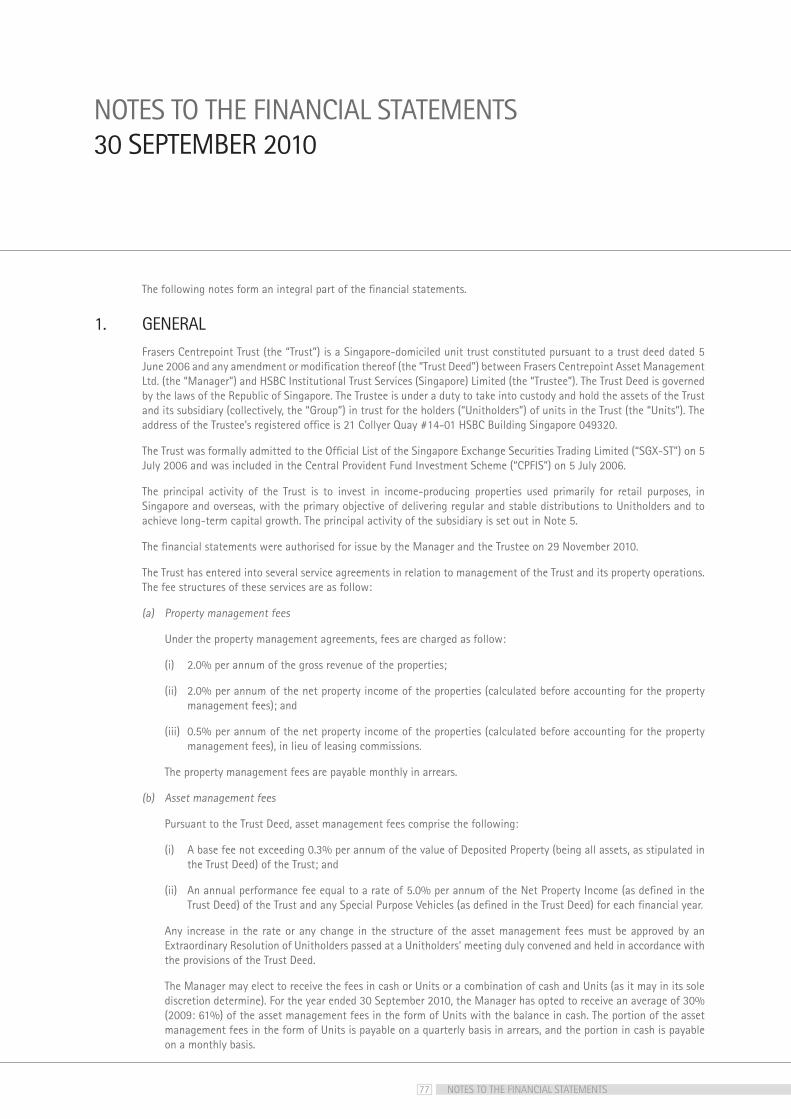
77
NOTES TO THE FINANCIAL STATEMENTS30 SEPTEMBER 2010
1. GENERALFrasers Centrepoint Trust (the “Trust”) is a Singapore-domiciled unit trust constituted pursuant to a trust deed dated 5 June 2006 and any amendment or modification thereof (the “Trust Deed”) between Frasers Centrepoint Asset Management Ltd. (the “Manager”) and HSBC Institutional Trust Services (Singapore) Limited (the “Trustee”). The Trust Deed is governed by the laws of the Republic of Singapore. The Trustee is under a duty to take into custody and hold the assets of the Trust and its subsidiary (collectively, the “Group”) in trust for the holders (“Unitholders”) of units in the Trust (the “Units”). The address of the Trustee’s registered office is 21 Collyer Quay #14-01 HSBC Building Singapore 049320.
The Trust was formally admitted to the Official List of the Singapore Exchange Securities Trading Limited (“SGX-ST”) on 5 July 2006 and was included in the Central Provident Fund Investment Scheme (“CPFIS”) on 5 July 2006.
The principal activity of the Trust is to invest in income-producing properties used primarily for retail purposes, in Singapore and overseas, with the primary objective of delivering regular and stable distributions to Unitholders and to achieve long-term capital growth. The principal activity of the subsidiary is set out in Note 5.
The financial statements were authorised for issue by the Manager and the Trustee on 29 November 2010.
The Trust has entered into several service agreements in relation to management of the Trust and its property operations. The fee structures of these services are as follow:
(a) Property management fees
Under the property management agreements, fees are charged as follow:
(i) 2.0% per annum of the gross revenue of the properties;
(ii) 2.0% per annum of the net property income of the properties (calculated before accounting for the property management fees); and
(iii) 0.5% per annum of the net property income of the properties (calculated before accounting for the property management fees), in lieu of leasing commissions.
The property management fees are payable monthly in arrears.
(b) Asset management fees
Pursuant to the Trust Deed, asset management fees comprise the following:
(i) A base fee not exceeding 0.3% per annum of the value of Deposited Property (being all assets, as stipulated in the Trust Deed) of the Trust; and
(ii) An annual performance fee equal to a rate of 5.0% per annum of the Net Property Income (as defined in the Trust Deed) of the Trust and any Special Purpose Vehicles (as defined in the Trust Deed) for each financial year.
Any increase in the rate or any change in the structure of the asset management fees must be approved by an Extraordinary Resolution of Unitholders passed at a Unitholders’ meeting duly convened and held in accordance with the provisions of the Trust Deed.
The Manager may elect to receive the fees in cash or Units or a combination of cash and Units (as it may in its sole discretion determine). For the year ended 30 September 2010, the Manager has opted to receive an average of 30% (2009: 61%) of the asset management fees in the form of Units with the balance in cash. The portion of the asset management fees in the form of Units is payable on a quarterly basis in arrears, and the portion in cash is payable on a monthly basis.
NOTES TO THE FINANCIAL STATEMENTS
The following notes form an integral part of the financial statements.
78
The Manager is also entitled to receive acquisition fee at the rate of 1% of the acquisition price and a divestment fee of 0.5% of the sale price on all future acquisitions or disposals of properties or investments.
(c) Trustee’s fees
Pursuant to the Trust Deed, the Trustee’s fees shall not exceed 0.1% per annum of the value of Deposited Property of the Trust, subject to a minimum of $9,000 per month, excluding out-of-pocket expenses and GST. Based on the current agreement between the Manager and the Trustee, the Trustee’s fee is charged on a scaled basis of up to 0.03% per annum of the value of the Deposited Property of the Trust.
Any increase in the maximum permitted or any change in the structure of the Trustee’s fee must be approved by an Extraordinary Resolution of Unitholders passed at a Unitholders’ meeting duly convened and held in accordance with the provisions of the Trust Deed.
The Trustee’s fees are payable monthly in arrears.
2. SUMMARY OF SIGNIFICANT ACCOUNTING POLICIES(a) Basis of preparation
The financial statements have been prepared in accordance with the recommendations of Statement of Recommended Accounting Practice (“RAP”) 7 “Reporting Framework for Unit Trusts” issued by the Institute of Certified Public Accountants of Singapore, the applicable requirements of the Code on Collective Investment Schemes (the “CIS Code”) issued by the Monetary Authority of Singapore (“MAS”) and the provisions of the Trust Deed. RAP 7 requires the accounting policies to generally comply with the principles relating to recognition and measurement under the Singapore Financial Reporting Standards (“FRS”).
The financial statements, which are presented in Singapore dollars and rounded to the nearest thousand, unless otherwise stated, have been prepared on the historical cost basis except as disclosed in the accounting policies below.
The preparation of the financial statements in conformity with RAP 7 requires the Manager to make judgements, estimates and assumptions that affect the application of accounting policies and the reported amounts of assets, liabilities, income and expenses. The estimates and associated assumptions are based on historical experience and relevant factors, including expectations of future events that are believed to be reasonable under the circumstances. Actual results may differ from these estimates.
Estimates and underlying assumptions are reviewed on an ongoing basis. Financial impact arising from revisions to accounting estimates are recognised in the period in which the estimates are revised and in any future periods affected.
In particular, information about significant areas of estimation, uncertainty and critical judgements in applying accounting policies that have the most significant effect on the amount recognised in the financial statements is described in the following notes:
(i) Note 3 – Valuation of investment properties
(ii) Note 6 – Accounting for investment in associate
1. GENERAL (continued)
NOTES TO THE FINANCIAL STATEMENTS30 SEPTEMBER 2010
(b) Asset management fees (continued)
79
(b) Changes in accounting policies
The accounting policies adopted are consistent with those of the previous financial year except as follows:
On 1 October 2009, the Group adopted the following standards for annual financial periods beginning on or after 1 October 2009:
Adoption of these standards did not have any effect on the financial performance or position of the Group. They did however give rise to additional disclosures, including, in some cases, revisions to accounting policies.
(i) Amendments to FRS 27 Consolidated and Separate Financial Statements
Changes in significant accounting policies resulting from the adoption of the amendments to FRS 27 include:
an equity transaction. Therefore, such a change will have no impact on goodwill, nor will it give rise to a gain or loss recognised in profit or loss;
controlling interest in the subsidiary’s equity; and
gain or loss recognised in profit or loss.
According to its transitional provisions, the amended FRS 27 has been applied prospectively, and did not impact the Group’s consolidated financial statements in respect of transactions with non-controlling interests, attribution of losses to non-controlling interests and disposal of subsidiaries before 1 October 2009. The changes will affect future transactions with non-controlling interests, if any arises.
(ii) Revised FRS 103 Business Combinations
The revised FRS 103 introduces a number of changes to the accounting for business combinations that will impact the amount of goodwill recognised, the reported results in the period that an acquisition occurs, and future reported results. Changes in significant accounting policies resulting from the adoption of the revised FRS 103 include:
expensed immediately;
in the amount of consideration to be paid will no longer be adjusted against goodwill but recognised in profit or loss;
NOTES TO THE FINANCIAL STATEMENTS
80
non-controlling interest’s proportionate share of the acquiree’s identifiable net assets, and this impacts the amount of goodwill recognised; and
value at the acquisition date with any corresponding gain or loss recognised in profit or loss, and this impacts the amount of goodwill recognised.
According to its transitional provisions, the revised FRS 103 has been applied prospectively and has no impact on the Group’s consolidated financial statements. The changes will however affect the Group’s future business combination transactions.
(iii) Amendments to FRS 107 Financial Instruments: Disclosures
The amendments to FRS 107 require additional disclosure about fair value measurement and liquidity risk. Fair value measurements are to be disclosed by source of inputs using a three-level hierarchy for each class of financial instrument. In addition, reconciliation between the beginning and ending balance for Level 3 fair value measurements is now required, as well as significant transfers between Level 1 and Level 2 fair value measurements. The amendments also clarify the requirements for liquidity risk disclosures. The fair value measurement disclosures and liquidity risk disclosures are presented in Note 23 to the financial statements.
(iv) FRS 108 Operating Segments
FRS 108 requires disclosure of information about the Group’s operating segments and replaces the requirement to determine primary and secondary reporting segments of the Group. The Group determined that the reportable operating segments are the same as the business segments previously identified under FRS 14 Segment Reporting. Disclosures about each of the segments are shown in Note 24.
(v) Improvements to FRSs issued in 2008
In 2008, the Accounting Standards Council issued an omnibus of amendments to FRS. There are separate transitional provisions for each amendment. The adoption of the following amendments resulted in changes to accounting policies but did not have any impact on the financial position or performance of the Group:
with FRS 39 Financial Instruments: Recognition and Measurement are not automatically classified as current in the balance sheet. The Group amended its accounting policy accordingly and analysed whether management’s expectation of the period of realisation of financial assets and liabilities differed from the classification of the instrument. This did not result in any re-classification of financial instruments between current and non-current in the balance sheet.
to sell”. The Group amended its accounting policy accordingly, which did not result in any change in the financial position.
are considered components of “borrowing costs” into one – the interest expense calculated using the effective interest rate method calculated in accordance with FRS 39. The Group has amended its accounting policy accordingly which did not result in any change in its financial position.
2. SUMMARY OF SIGNIFICANT ACCOUNTING POLICIES (continued)
NOTES TO THE FINANCIAL STATEMENTS30 SEPTEMBER 2010
(b) Changes in accounting policies (continued)
81
(c) Standards issued but not yet effective
The Group has not adopted the amendments to the following standards that have been issued and are relevant but not yet effective:
Effective date (Annual period
beginning on or after)
FRS 7 : Statement of Cash Flows 1 January 2010
FRS 17 : Leases 1 January 2010
FRS 36 : Impairment of Assets 1 January 2010
FRS 39 : Financial Instruments: Recognition and Measurement 1 January 2010
FRS 24 : Related Party Disclosures (Revised) 1 January 2011
FRS 103 : Business Combinations 1 January 2011
FRS 107 : Financial Instruments: Disclosures 1 January 2011
The Manager expects that the adoption of the above standards will have no material impact on the financial statements in the period of initial application.
(d) Foreign currency
Transactions in foreign currencies are measured and recorded on initial recognition in Singapore dollars, the functional currency of the Trust and subsidiary at exchange rates approximating those ruling at the transaction dates. Monetary assets and liabilities denominated in foreign currencies are translated at the rate of exchange ruling at the balance sheet date. Non-monetary items that are measured in terms of historical cost in a foreign currency are translated using the exchange rates as at the dates of the initial transactions. Non-monetary items measured at fair value in a foreign currency are translated using the exchange rates at the date when the fair value was determined.
Exchange differences arising on the settlement of monetary items or on translating monetary items at the balance sheet date are recognised in the Statement of Total Return except for exchange differences arising on monetary items that form part of the Group’s net investment in foreign operations, which are recognised initially in equity as translation reserve in the Balance Sheet and recognised in the Statement of Total Return on disposal of the foreign operation.
The assets and liabilities of foreign operations are translated into Singapore dollars at the rate of exchange ruling at the balance sheet date and their income statements are translated at the weighted average exchange rates for the year. The exchange differences arising on the translation are taken directly to a separate component of equity as translation reserve. On disposal of a foreign operation, the cumulative amount recognised in translation reserve relating to that particular foreign operation is recognised in the Statement of Total Return.
NOTES TO THE FINANCIAL STATEMENTS
82
In the case of a partial disposal without loss of control of a subsidiary that includes a foreign operation, the proportionate share of the cumulative amount of the exchange differences are re-attributed to non-controlling interest and are not recognised in the Statement of Total Return. For partial disposals of associates that are foreign operations, the proportionate share of the accumulated exchange differences is reclassified to the Statement of Total Return.
(e) Investment properties
Investment properties are stated at initial cost on acquisition, and at valuation thereafter. The cost of a purchased property comprises its purchase price and any directly attributable expenditure. Transaction costs shall be included in the initial measurement. Valuation is determined in accordance with the Trust Deed, which requires the investment properties to be valued by independent registered valuers in the following events:
Any increase or decrease on revaluation is credited or charged to the Statement of Total Return as a net revaluation surplus or deficit in the value of the investment properties.
Subsequent expenditure relating to investment properties that have already been recognised is added to the carrying amount of the asset when it is probable that future economic benefits, in excess of original assessed standard of performance of the existing asset, will flow to the Group and the Trust. All other subsequent expenditure is recognised as an expense in the period in which it is incurred.
Investment properties are derecognised when either they have been disposed of or when the investment property is permanently withdrawn from use and no future economic benefit is expected from its disposal. Any gains or losses on the retirement or disposal of an investment property are recognised in the Statement of Total Return in the year of retirement or disposal.
Investment properties are not depreciated. Investment properties are subject to continued maintenance and regularly revalued on the basis set out above. For taxation purposes, the Group and the Trust may claim capital allowances on assets that qualify as plant and machinery under the Income Tax Act.
(f) Basis of consolidation and investment in subsidiary
A subsidiary is an entity over which the Group has the power to govern the financial and operating policies so as to obtain benefits from its activities. The Group generally has such power when it directly or indirectly holds more than 50% of the issued share capital, or controls more than half of the voting power, or controls the composition of the board of directors of the subsidiary.
In the Trust’s balance sheet, investment in subsidiary is accounted for at cost less any impairment losses.
The consolidated financial statements of the Group incorporate the financial statements of the Trust and its subsidiary as of the balance sheet date. The financial statements of the subsidiary used in the preparation of the consolidated financial statements are prepared for the same reporting date and using consistent accounting policies as the Trust.
A subsidiary is consolidated from the date of acquisition, being the date on which the Group obtains control, and continues to be consolidated until the date that such control ceases. All intra-group balances, income and expenses and unrealised gains and losses resulting from intra-group transactions are eliminated in full.
2. SUMMARY OF SIGNIFICANT ACCOUNTING POLICIES (continued)
NOTES TO THE FINANCIAL STATEMENTS30 SEPTEMBER 2010
(d) Foreign currency (continued)
83
Business combinations are accounted for by applying the acquisition method. Identifiable assets acquired and liabilities assumed in a business combination are measured initially at their fair values at the acquisition date. Acquisition-related costs are recognised as expenses in the periods in which the costs are incurred and the services are received.
When the Group acquires a business, it assesses the financial assets and liabilities assumed for appropriate classification and designation in accordance with the contractual terms, economic circumstances and pertinent conditions as at the acquisition date. This includes the separation of embedded derivatives in host contracts by the acquiree.
Any contingent consideration to be transferred by the acquirer will be recognised at fair value at the acquisition date. Subsequent changes to the fair value of the contingent consideration, if deemed to be an asset or liability within the scope of FRS 39, will be recognised either in the Statement of Total Return or as change to a separate component of equity. If the contingent consideration is classified as equity, it is not remeasured and its subsequent settlement will be accounted for within equity.
In business combinations achieved in stages, previously held equity interests in the acquiree are remeasured to fair value at the acquisition date and any corresponding gain or loss is recognised in the Statement of Total Return.
The Group elects for each individual business combination, whether non-controlling interest in the acquiree (if any) is recognised on the acquisition date at fair value, or at the non-controlling interest’s proportionate share of the acquiree’s identifiable net assets.
Any excess of the sum of the fair value of the consideration transferred in the business combination, the amount of non-controlling interest in the acquiree (if any), and the fair value of the Group’s previously held equity interest in the acquiree (if any), over the net fair value of the acquiree’s identifiable assets and liabilities is recorded as goodwill. In instances where the latter amount exceeds the former, the excess is recognised as gain on bargain purchase in the Statement of Total Return on the acquisition date.
(g) Investment in associate
An associate is an entity, not being a subsidiary or a joint venture, in which the Group has significant influence over the financial and operating policy decisions. This generally coincides with the Group having 20% or more of the voting power, or has representation on the board of directors of the associate.
The Group’s investment in associate is accounted for using the equity method. Under the equity method, the investment in associate is stated in the Balance Sheet at cost plus post-acquisition changes in the Group’s share of net assets of the associate. The Group’s share of results of the associate is recognised in the Statement of Total Return. Where there has been a change recognised directly in the equity of the associate, the Group recognises its share of such changes.
After application of the equity method, the Group determines whether it is necessary to recognise any impairment loss with respect to the Group’s net investment in the associate. The Group determines at the end of each reporting period whether there is any objective evidence that the investment in the associate is impaired. If this is the case, the Group calculates the amount of impairment as the difference between the recoverable amount of the associate and its carrying value and recognises the amount in the Statement of Total Return.
The associate is equity accounted for from the date the Group obtains significant influence until the date the Group ceases to have significant influence over the associate.
NOTES TO THE FINANCIAL STATEMENTS
84
Goodwill relating to an associate is included in the carrying amount of the investment. Any excess of the Group’s share of the net fair value of the associate’s identifiable assets, liabilities and contingent liabilities over the cost of the investment is excluded from the carrying amount of the investment and is instead included as income in the determination of the Group’s share of the associate’s results in the period in which the investment is acquired.
When the Group’s share of losses in an associate equals or exceeds its interest in the associate, including any other unsecured receivables, the Group does not recognise further losses, unless it has incurred obligations or made payments on behalf of the associate.
The most recently available audited financial statements of the associate are used by the Group in applying the equity method of accounting. Where the dates of the audited financial statements used are not co-terminous with those of the Group, the share of results is arrived at from the last audited financial statements available and un-audited management accounts to the end of the accounting period. Consistent accounting policies are applied for like transactions and events in similar circumstances. Where necessary, adjustments are made to bring the accounting policies in line with those of the Group.
(h) Fixed assets
Fixed assets are stated at cost less accumulated depreciation and any impairment. The cost of an asset comprises its purchase price and any directly attributable costs of bringing the asset to working condition for its intended use. Expenditure for additions, improvements and renewals are capitalised and expenditure for maintenance and repair are charged to Statement of Total Return. When assets are derecognised upon disposal or when no future economic benefits are expected from their use or disposal, their cost and accumulated depreciation are removed from the financial statements and any gain or loss on derecognition of the assets is included in the Statement of Total Return.
Fixed assets are depreciated on the straight line method so as to write off the cost of the fixed assets over their estimated useful lives. The principal annual rates of depreciation for equipment, furniture and fittings range from 10% to 20%.
The carrying values of fixed assets are reviewed for impairment when events or changes in circumstances indicate that the carrying value may not be recoverable.
The residual value, useful life and depreciation method are reviewed at each financial year-end, and adjusted prospectively, if appropriate.
(i) Impairment of non-financial assets
The Group assesses at each reporting date whether there is any indication that an asset may be impaired. If any such indication exists, or when annual impairment testing for an asset is required, the Group makes an estimate of the asset’s recoverable amount.
An impairment loss is recognised in the Statement of Total Return whenever the carrying amount of an asset or its cash-generating unit exceeds its recoverable amount.
The recoverable amount of an asset or cash-generating unit is the greater of its value in use and its fair value less costs to sell and is determined for an individual asset, unless the asset does not generate cash inflows that are largely independent of those from other assets or group of assets. In assessing value in use, the estimated future cash flows are discounted to their present value using a pre-tax discount rate that reflects current market assessments of the time value of money and the risks specific to the asset.
2. SUMMARY OF SIGNIFICANT ACCOUNTING POLICIES (continued)
NOTES TO THE FINANCIAL STATEMENTS30 SEPTEMBER 2010
(g) Investment in associate (continued)
85
Impairment losses recognised in prior periods are assessed at each reporting date for any indications that the loss has decreased or no longer exists. If such indication exists, the recoverable amount is estimated. An impairment loss is reversed only if there has been a change in the estimates used to determine the asset’s recoverable amount since the last impairment loss was recognised. If that is the case, the carrying amount of the asset is increased to its recoverable amount. An impairment loss is reversed only to the extent that the asset’s carrying amount does not exceed the carrying amount that would have been determined, net of depreciation, had no impairment loss been recognised for the asset in prior years. Reversal of an impairment loss is recognised in the Statement of Total Return. After such a reversal, the depreciation charge, if any, is adjusted in future periods to allocate the asset’s revised carrying amount, less any residual value, on a systematic basis over its remaining useful life.
(j) Financial assets
The Group determines the classification of its financial assets at initial recognition. When financial assets are recognised initially, they are measured at fair value, plus, in the case of financial assets not at fair value through profit or loss, directly attributable transaction costs.
Non-derivative financial assets with fixed or determinable payments that are not quoted in an active market are classified as loans and receivables. Subsequent to initial recognition, loans and receivables are carried at amortised cost using the effective interest method, less any impairment losses. Gains or losses are recognised in the Statement of Total Return when the loans and receivables are derecognised or impaired, as well as through the amortisation process.
Financial assets at fair value through profit or loss include financial assets held for trading and financial assets designated upon initial recognition at fair value through profit or loss. Financial assets classified as held for trading include derivative financial instruments entered into by the Group that are not designated as hedging instruments in hedge relationships as defined by FRS 39. Derivatives, including separated embedded derivatives, are also classified as held for trading unless they are designated as effective hedging instruments.
Subsequent to initial recognition, financial assets at fair value through profit or loss are measured at fair value. Any gains or losses arising from changes in fair value of the financial assets are recognised in the Statement of Total Return.
Financial assets are recognised on the Balance Sheet when, and only when, the Group becomes a party to the contractual provisions of the instruments. Financial assets are derecognised when the contractual rights to receive cash flows from the assets have expired. On derecognition, the difference between the carrying amount and the sum of the consideration received is recognised in the Statement of Total Return.
All regular way purchases and sales of financial assets are recognised or derecognised on the trade date i.e., the date that the Group commits to purchase or sell the asset. Regular way purchases or sales are purchases or sales of financial assets that require delivery of assets within the period generally established by regulation or convention in the marketplace concerned.
(k) Cash and cash equivalents
Cash and cash equivalents comprise cash balances and bank deposits.
NOTES TO THE FINANCIAL STATEMENTS
86
(l) Impairment of financial assets
The Group assesses at each reporting date whether there is any objective evidence that a financial asset is impaired.
For financial assets carried at amortised cost, the Group first assesses individually whether objective evidence of impairment exists individually for financial assets that are individually significant, or collectively for financial assets that are not individually significant. If the Group determines that no objective evidence of impairment exists for an individually assessed financial asset, whether significant or not, it includes the asset in a group of financial assets with similar credit risk characteristics and collectively assesses them for impairment. Assets that are individually assessed for impairment and for which an impairment loss is, or continues to be recognised are not included in a collective assessment of impairment.
If there is objective evidence that an impairment loss on loans and receivables carried at amortised cost has been incurred, the amount of impairment loss is calculated as the difference between its carrying amount, and the present value of estimated future cash flows discounted at the financial asset’s original effective interest rate (i.e. the effective interest rate computed at initial recognition). The carrying amount of the asset is reduced through the use of an allowance account. The amount of the loss and any subsequent write-back is recognised in the Statement of Total Return.
When the asset becomes uncollectible, the carrying amount of impaired financial assets is reduced directly or if an amount was charged to the allowance account, the amounts charged to the allowance account are written off against the carrying value of the financial asset.
To determine whether there is objective evidence that an impairment loss on financial assets has incurred, the Group considers factors such as the probability of insolvency or significant financial difficulties of the debtor and default or significant delay in payments.
If, in a subsequent period, the amount of the impairment loss decreases and the decrease can be related objectively to an event occurring after the impairment loss was recognised, the previously recognised impairment loss is reversed. Any subsequent reversal of an impairment loss is recognised in the Statement of Total Return, to the extent that the carrying value of the asset does not exceed its amortised cost at the reversal date.
(m) Financial liabilities
Financial liabilities are recognised on the Balance Sheet when, and only when, the Group becomes a party to the contractual provisions of the financial instrument. The Group determines the classification of its financial liabilities at initial recognition. Financial liabilities are initially recognised at the fair value of consideration received, and in the case of other financial liabilities, less directly attributable transaction costs.
Financial liabilities that are designated at fair value through profit or loss include financial liabilities held for trading and financial liabilities designated upon initial recognition as at fair value. Financial liabilities are classified as held for trading if they are acquired for the purpose of selling in the near term. This category includes derivative financial instruments such as interest rate swaps entered into by the Group to hedge its risks associated with interest rate fluctuations.
Subsequent to initial recognition, financial liabilities at fair value through profit or loss are measured at fair value. In this respect, the fair value of interest rate swap contracts is determined by reference to the market value for similar instruments. Any gains or losses arising from changes in fair value of the financial liabilities are recognised in the Statement of Total Return.
2. SUMMARY OF SIGNIFICANT ACCOUNTING POLICIES (continued)
NOTES TO THE FINANCIAL STATEMENTS30 SEPTEMBER 2010
87
After initial recognition, financial liabilities that have been designated as other than at fair value through profit or loss are subsequently measured at amortised cost using the effective interest rate method. Gains and losses are recognised in the Statement of Total Return when the liabilities are derecognised, and through the amortisation process.
Gains and losses are recognised in the Statement of Total Return when the liabilities are derecognised as well as through the amortisation process. A financial liability is derecognised when the obligation under the liability is discharged or cancelled, or expires.
(n) Provisions
Provisions are recognised when the Group has a present obligation (legal or constructive) as a result of a past event, it is probable that an outflow of economic resources will be required to settle the obligation and the amount of the obligation can be estimated reliably.
Provisions are reviewed at the end of each reporting period and adjusted to reflect the current best estimate. If it is no longer probable that an outflow of economic resources will be required to settle the obligation, the provision is reversed. If the effect of the time value of money is material, provisions are discounted using a current pre tax rate that reflects, where appropriate, the risks specific to the liability. When discounting is used, the increase in the provision due to the passage of time is recognised as a finance cost.
(o) Deferred income
Deferred income relates to the difference between consideration received for security deposits and its fair value at initial recognition, and is credited to the Statement of Total Return on a straight line basis over individual lease term.
(p) Leases
The determination of whether an arrangement is, or contains a lease is based on the substance of the arrangement at inception date: whether fulfilment of the arrangement is dependent on the use of a specific asset or assets or the arrangement conveys a right to use the asset.
Leases where the Group retains substantially all the risks and rewards of ownership of the asset are classified as operating leases. Initial direct costs incurred in negotiating an operating lease are added to the carrying amount of the leased asset and recognised over the lease term on the same bases as rental income. The accounting policy for rental income is set out in Note 2(q).
(q) Revenue recognition
Revenue is recognised to the extent that it is probable that the economic benefits will flow to the Group and the revenue can be reliably measured. Revenue is measured at the fair value of consideration received or receivable, excluding discounts, rebates, and sales taxes or duty. The Group assesses its revenue arrangements to determine if it is acting as principal or agent. The Group has concluded that it is acting as a principal in all of its revenue arrangements. The following specific recognition criteria must also be met before revenue is recognised:
NOTES TO THE FINANCIAL STATEMENTS
88
(i) Rental income
Rental income receivable under operating leases is recognised in the Statement of Total Return on a straight-line basis over the term of the lease, except where an alternative basis is more representative of the pattern of benefits to be derived from the leased assets. Lease incentives granted are recognised as an integral part of the total rental to be received. The aggregate cost of incentives provided to lessees is recognised as a reduction of rental income over the lease term on a straight-line basis. Contingent rent, which comprises gross turnover rental, is recognised as income in the accounting period on a receipt basis. No contingent rent is recognised if there are uncertainties that may result in the possible return of amounts received.
(ii) Interest income
Interest income is recognised in the Statement of Total Return using the effective interest method and on an accrual basis.
(r) Expenses
(i) Property expenses
Property expenses are recognised on an accrual basis. Included in property expenses are property management fees which are based on the applicable formula stipulated in Note 1(a).
(ii) Asset management fees
Asset management fees are recognised on an accrual basis based on the applicable formula stipulated in Note 1(b).
(iii) Trust expenses
Trust expenses are recognised on an accrual basis. Included in trust expenses are Trustee’s fees which are based on the applicable formula stipulated in Note 1(c).
(s) Taxation
Current tax is the expected tax payable on the taxable income for the period, using tax rates enacted or substantively enacted at the balance sheet date.
Deferred income tax is provided using the liability method, on all temporary differences at the balance sheet date between the tax bases of assets and liabilities and their carrying amounts for financial reporting purposes.
Deferred tax liabilities are recognised for all taxable temporary differences, which include the applicable portion of revaluation surplus of investment properties. Deferred tax assets are recognised for all deductible temporary differences to the extent that it is probable that taxable profit will be available against which the deductible temporary differences can be utilised.
The carrying amount of deferred tax assets is reviewed at each balance sheet date and reduced to the extent that it is no longer probable that sufficient taxable profit will be available to allow all or part of the deferred tax asset to be utilised. Unrecognised deferred tax assets are reassessed at each balance sheet date and are recognised to the extent that it has become probable that future taxable profit will allow the deferred tax asset to be recovered.
NOTES TO THE FINANCIAL STATEMENTS30 SEPTEMBER 2010
2. SUMMARY OF SIGNIFICANT ACCOUNTING POLICIES (continued)
(q) Revenue recognition (continued)
89
Deferred tax assets and liabilities are measured at the tax rates that are expected to apply to the period when the assets are realised or the liabilities are settled, based on tax rates and tax laws that have been enacted or substantively enacted at the balance sheet date.
The Inland Revenue Authority of Singapore (“IRAS”) has issued a tax ruling on the income tax treatment of the Trust. Subject to meeting the terms and conditions of the tax ruling which includes a distribution of at least 90% of the taxable income of the Trust, the Trustee will not be assessed to tax on the taxable income of the Trust. Instead, the distributions made by the Trust out of such taxable income are subject to tax in the hands of Unitholders, unless they are exempt from tax on the Trust’s distributions (the “tax transparency ruling”). Accordingly, the Trustee and the Manager will deduct income tax at the prevailing corporate tax rate from the distributions made to Unitholders that are made out of the taxable income of the Trust, except:
(i) where the beneficial owners are individuals or Qualifying Unitholders, the Trustee and the Manager will make the distributions to such Unitholders without deducting any income tax; and
(ii) where the beneficial owners are foreign non-individual investors or where the Units are held by nominee Unitholders who can demonstrate that the Units are held for beneficial owners who are foreign non-individual investors, the Trustee and the Manager will deduct/withhold tax at the reduced rate of 10% from the distributions.
A Qualifying Unitholder is a Unitholder who is:
(i) A tax resident Singapore-incorporated company;
(ii) A non-corporate Singapore constituted or registered entity (e.g. town council, statutory board, charitable organisation, management corporation, club and trade and industry association constituted, incorporated, registered or organised in Singapore);
(iii) A Singapore branch of a foreign company which has been presented a letter of approval from the Comptroller of Income Tax granting waiver from tax deducted at source in respect of distributions from the Trust;
(iv) An agent bank or a Supplementary Retirement Scheme (“SRS”) operator acting as nominee for individuals who have purchased Units in the Trust within the CPFIS or the SRS respectively; or
(v) A nominee who can demonstrate that the Units are held for beneficial owners who are individuals or who fall within the classes of Unitholders listed in (i) to (iii) above.
The above tax transparency ruling does not apply to gains from the sale of real properties. Such gains which are considered as trading gains are assessable to tax on the Trustee. Where the gains are capital gains, the Trustee will not be assessed to tax and may distribute the capital gains without tax being deducted at source.
(t) Borrowing costs
Borrowing costs are expensed in the period they occur, and consist of interest and other costs that the Group incurs in connection with the borrowing of funds.
(u) Segment reporting
For management purposes, the Group is organised into operating segments based on individual investment properties within the Group’s portfolio. The Manager regularly reviews the segment results in order to allocate resources to the segments and to assess the segment performance. Additional disclosures on each of these segments are shown in Note 24, including the factors used to identify the reportable segments and the measurement basis of segment information.
NOTES TO THE FINANCIAL STATEMENTS
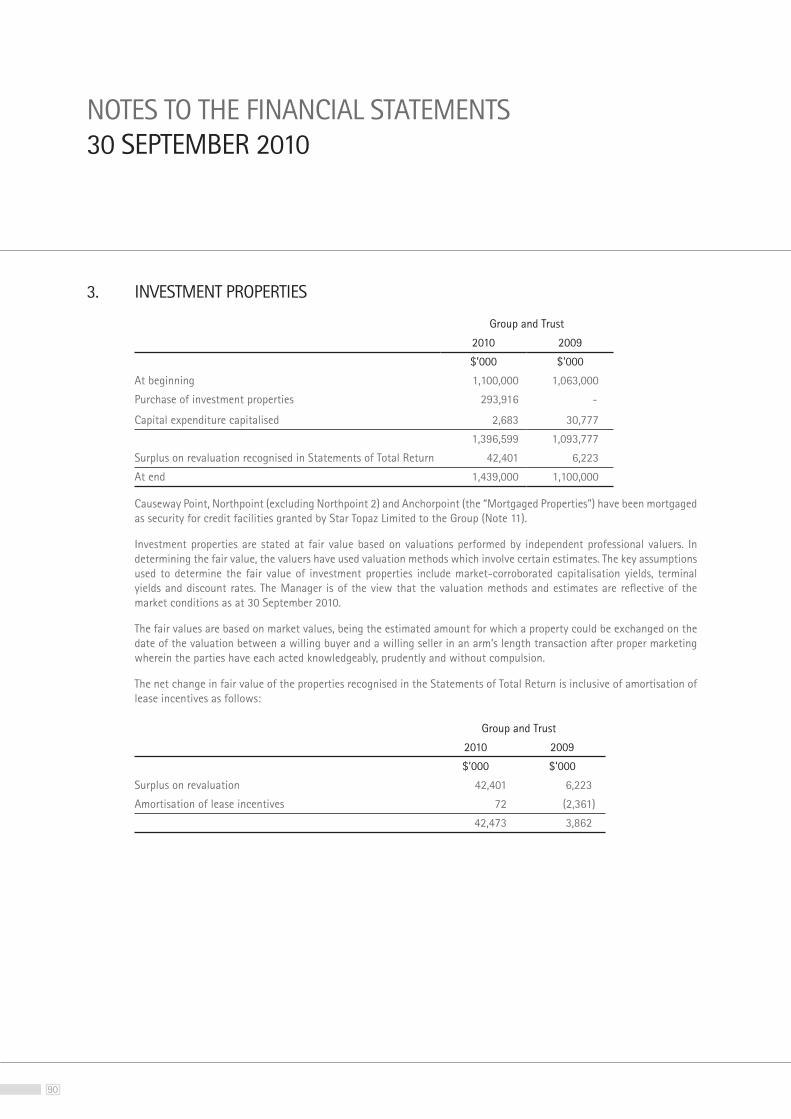
90
3. INVESTMENT PROPERTIES
Group and Trust
2010 2009
$’000 $’000
At beginning 1,100,000 1,063,000
Purchase of investment properties 293,916 -
Capital expenditure capitalised 2,683 30,777
1,396,599 1,093,777
Surplus on revaluation recognised in Statements of Total Return 42,401 6,223
At end 1,439,000 1,100,000
Causeway Point, Northpoint (excluding Northpoint 2) and Anchorpoint (the “Mortgaged Properties”) have been mortgaged as security for credit facilities granted by Star Topaz Limited to the Group (Note 11).
Investment properties are stated at fair value based on valuations performed by independent professional valuers. In determining the fair value, the valuers have used valuation methods which involve certain estimates. The key assumptions used to determine the fair value of investment properties include market-corroborated capitalisation yields, terminal yields and discount rates. The Manager is of the view that the valuation methods and estimates are reflective of the market conditions as at 30 September 2010.
The fair values are based on market values, being the estimated amount for which a property could be exchanged on the date of the valuation between a willing buyer and a willing seller in an arm’s length transaction after proper marketing wherein the parties have each acted knowledgeably, prudently and without compulsion.
The net change in fair value of the properties recognised in the Statements of Total Return is inclusive of amortisation of lease incentives as follows:
Group and Trust
2010 2009
$’000 $’000
Surplus on revaluation 42,401 6,223
Amortisation of lease incentives 72 (2,361)
42,473 3,862
NOTES TO THE FINANCIAL STATEMENTS30 SEPTEMBER 2010
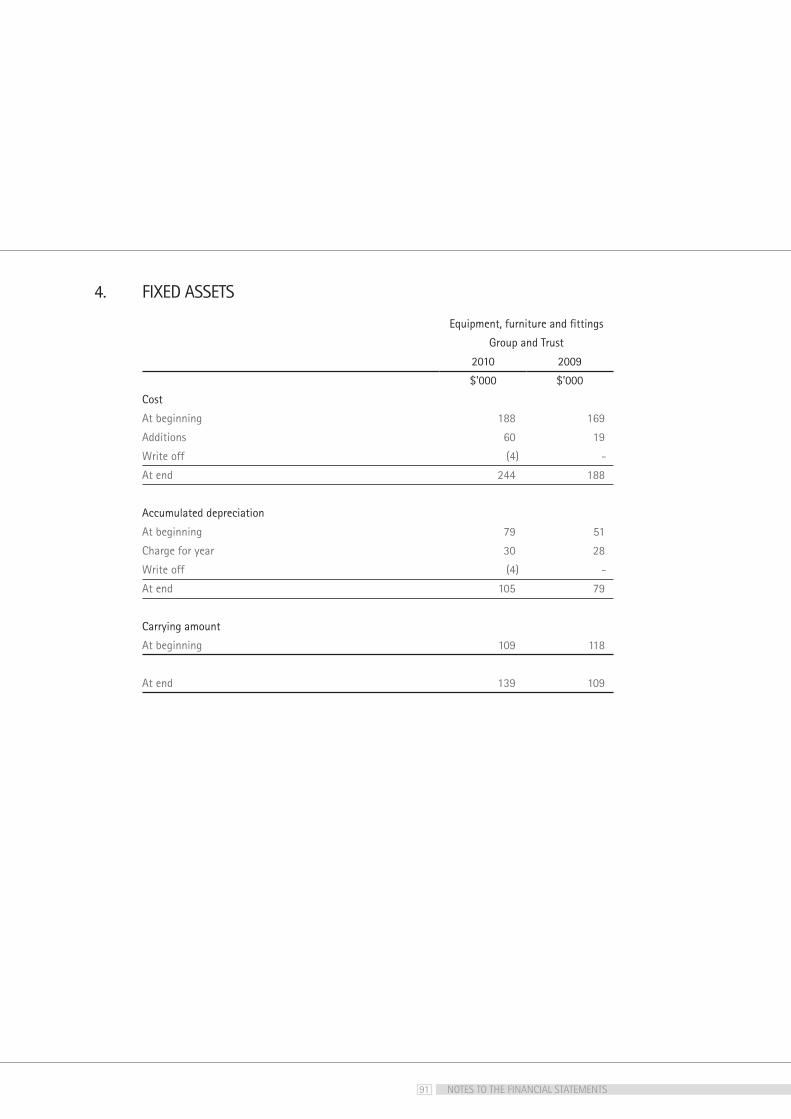
91
4. FIXED ASSETS
Equipment, furniture and fittings
Group and Trust
2010 2009
$’000 $’000
Cost
At beginning 188 169
Additions 60 19
Write off (4) -
At end 244 188
Accumulated depreciation
At beginning 79 51
Charge for year 30 28
Write off (4) -
At end 105 79
Carrying amount
At beginning 109 118
At end 139 109
NOTES TO THE FINANCIAL STATEMENTS
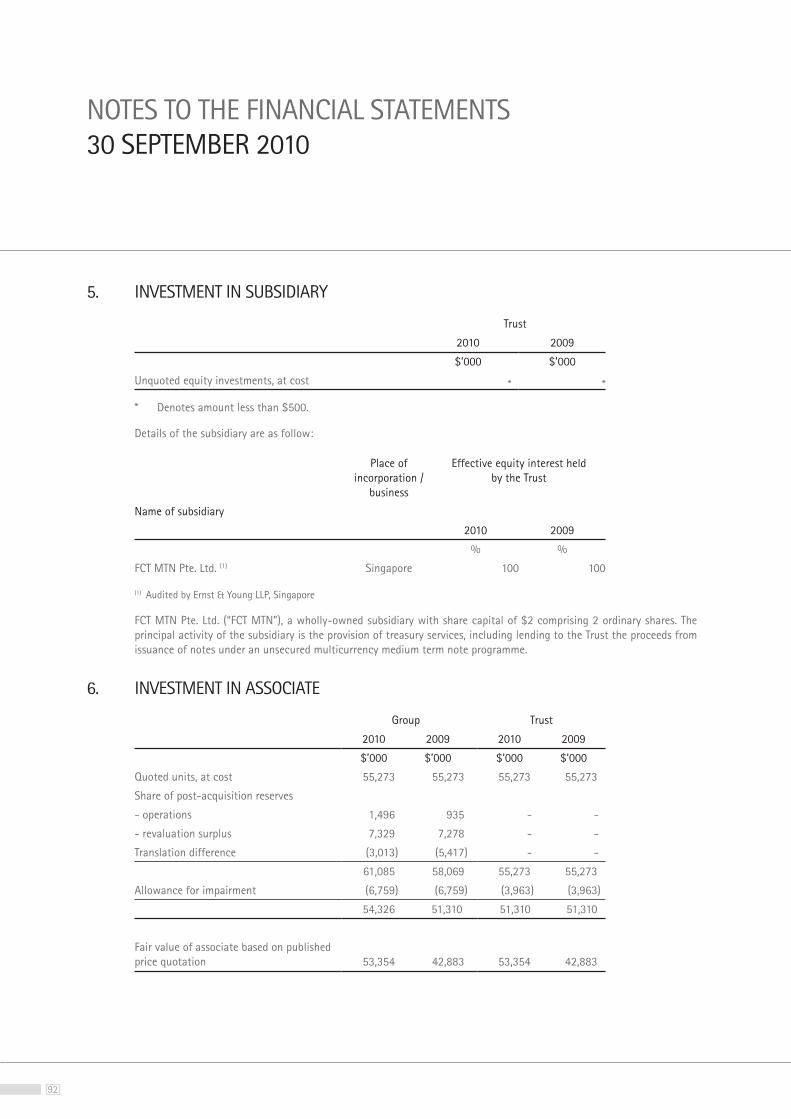
92
5. INVESTMENT IN SUBSIDIARY
Trust
2010 2009
$’000 $’000
Unquoted equity investments, at cost * *
* Denotes amount less than $500.
Details of the subsidiary are as follow:
Place of incorporation /
business
Effective equity interest held by the Trust
Name of subsidiary
2010 2009
% %
FCT MTN Pte. Ltd. (1) Singapore 100 100
(1) Audited by Ernst & Young LLP, Singapore
FCT MTN Pte. Ltd. (“FCT MTN”), a wholly-owned subsidiary with share capital of $2 comprising 2 ordinary shares. The principal activity of the subsidiary is the provision of treasury services, including lending to the Trust the proceeds from issuance of notes under an unsecured multicurrency medium term note programme.
6. INVESTMENT IN ASSOCIATE
Group Trust
2010 2009 2010 2009
$’000 $’000 $’000 $’000
Quoted units, at cost 55,273 55,273 55,273 55,273
Share of post-acquisition reserves
- operations 1,496 935 - -
- revaluation surplus 7,329 7,278 - -
Translation difference (3,013) (5,417) - -
61,085 58,069 55,273 55,273
Allowance for impairment (6,759) (6,759) (3,963) (3,963)
54,326 51,310 51,310 51,310
Fair value of associate based on published price quotation 53,354 42,883 53,354 42,883
NOTES TO THE FINANCIAL STATEMENTS30 SEPTEMBER 2010
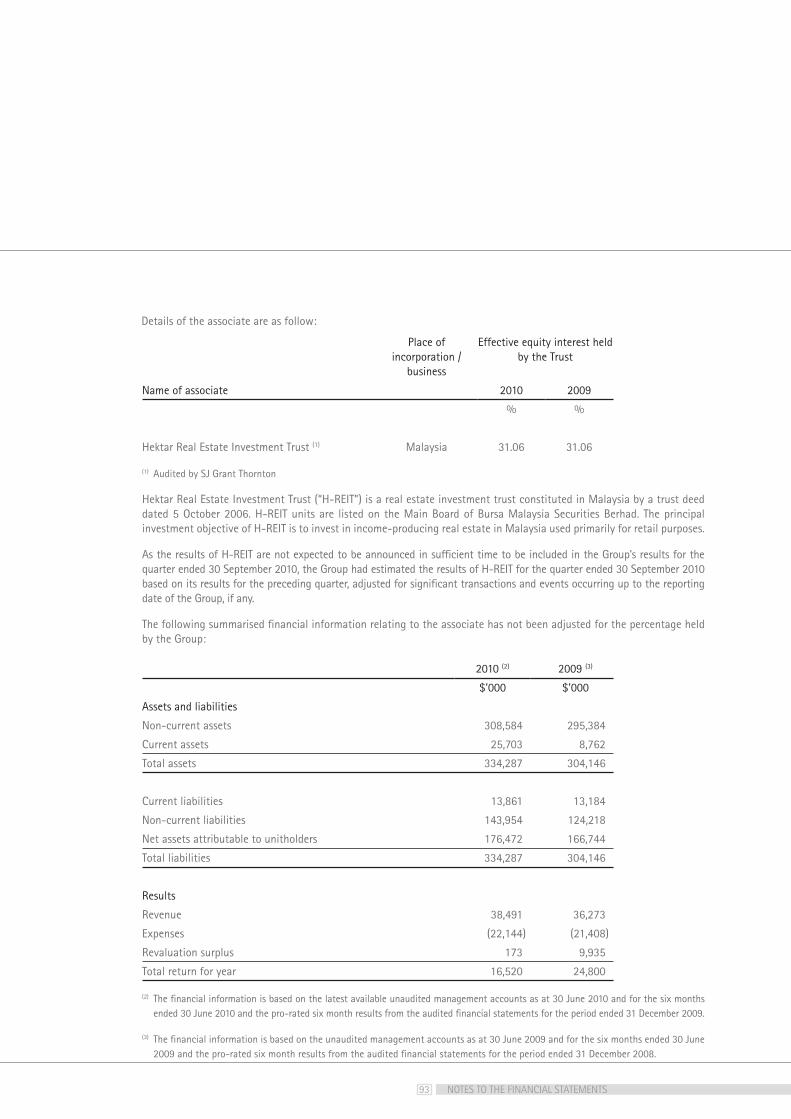
93
Place of incorporation /
business
Effective equity interest held by the Trust
Name of associate 2010 2009
% %
Hektar Real Estate Investment Trust (1) Malaysia 31.06 31.06
(1) Audited by SJ Grant Thornton
Hektar Real Estate Investment Trust (“H-REIT”) is a real estate investment trust constituted in Malaysia by a trust deed dated 5 October 2006. H-REIT units are listed on the Main Board of Bursa Malaysia Securities Berhad. The principal investment objective of H-REIT is to invest in income-producing real estate in Malaysia used primarily for retail purposes.
As the results of H-REIT are not expected to be announced in sufficient time to be included in the Group’s results for the quarter ended 30 September 2010, the Group had estimated the results of H-REIT for the quarter ended 30 September 2010 based on its results for the preceding quarter, adjusted for significant transactions and events occurring up to the reporting date of the Group, if any.
The following summarised financial information relating to the associate has not been adjusted for the percentage held by the Group:
2010 (2) 2009 (3)
$’000 $’000
Assets and liabilities
Non-current assets 308,584 295,384
Current assets 25,703 8,762
Total assets 334,287 304,146
Current liabilities 13,861 13,184
Non-current liabilities 143,954 124,218
Net assets attributable to unitholders 176,472 166,744
Total liabilities 334,287 304,146
Results
Revenue 38,491 36,273
Expenses (22,144) (21,408)
Revaluation surplus 173 9,935
Total return for year 16,520 24,800
(2) The financial information is based on the latest available unaudited management accounts as at 30 June 2010 and for the six months ended 30 June 2010 and the pro-rated six month results from the audited financial statements for the period ended 31 December 2009.
(3) The financial information is based on the unaudited management accounts as at 30 June 2009 and for the six months ended 30 June 2009 and the pro-rated six month results from the audited financial statements for the period ended 31 December 2008.
NOTES TO THE FINANCIAL STATEMENTS
Details of the associate are as follow:
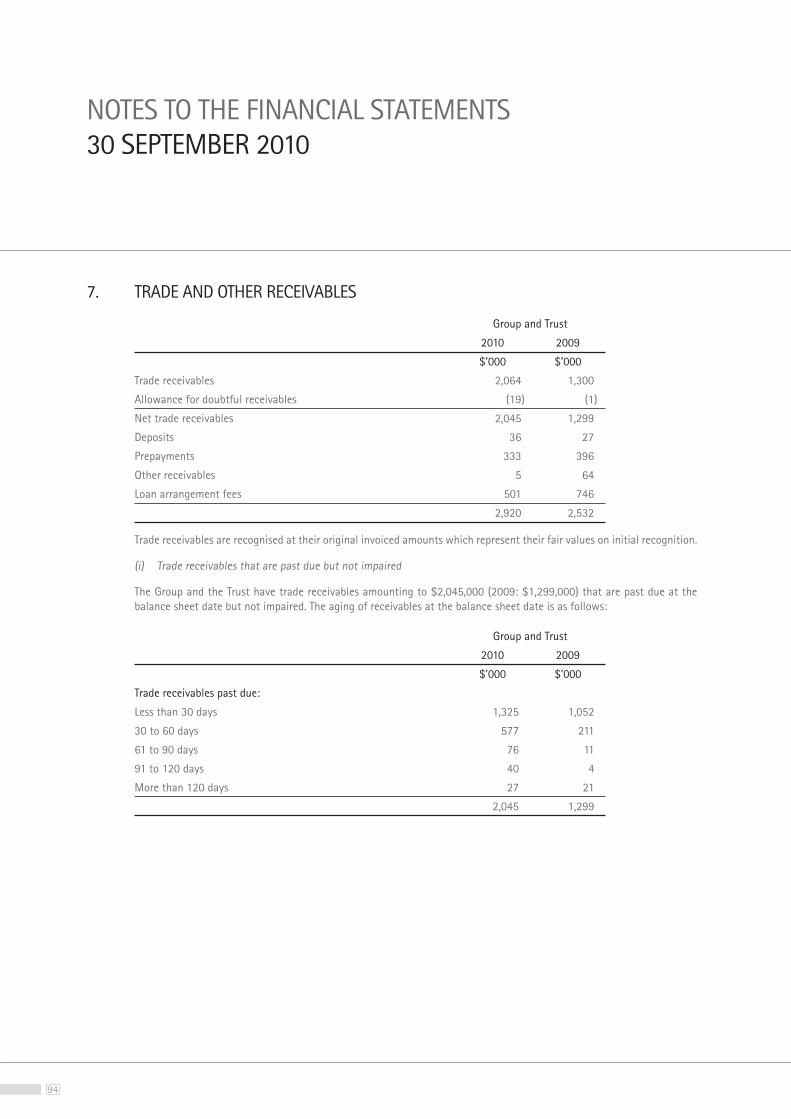
94
7. TRADE AND OTHER RECEIVABLES
Group and Trust
2010 2009
$’000 $’000
Trade receivables 2,064 1,300
Allowance for doubtful receivables (19) (1)
Net trade receivables 2,045 1,299
Deposits 36 27
Prepayments 333 396
Other receivables 5 64
Loan arrangement fees 501 746
2,920 2,532
Trade receivables are recognised at their original invoiced amounts which represent their fair values on initial recognition.
(i) Trade receivables that are past due but not impaired
The Group and the Trust have trade receivables amounting to $2,045,000 (2009: $1,299,000) that are past due at the balance sheet date but not impaired. The aging of receivables at the balance sheet date is as follows:
Group and Trust
2010 2009
$’000 $’000
Trade receivables past due:
Less than 30 days 1,325 1,052
30 to 60 days 577 211
61 to 90 days 76 11
91 to 120 days 40 4
More than 120 days 27 21
2,045 1,299
NOTES TO THE FINANCIAL STATEMENTS30 SEPTEMBER 2010
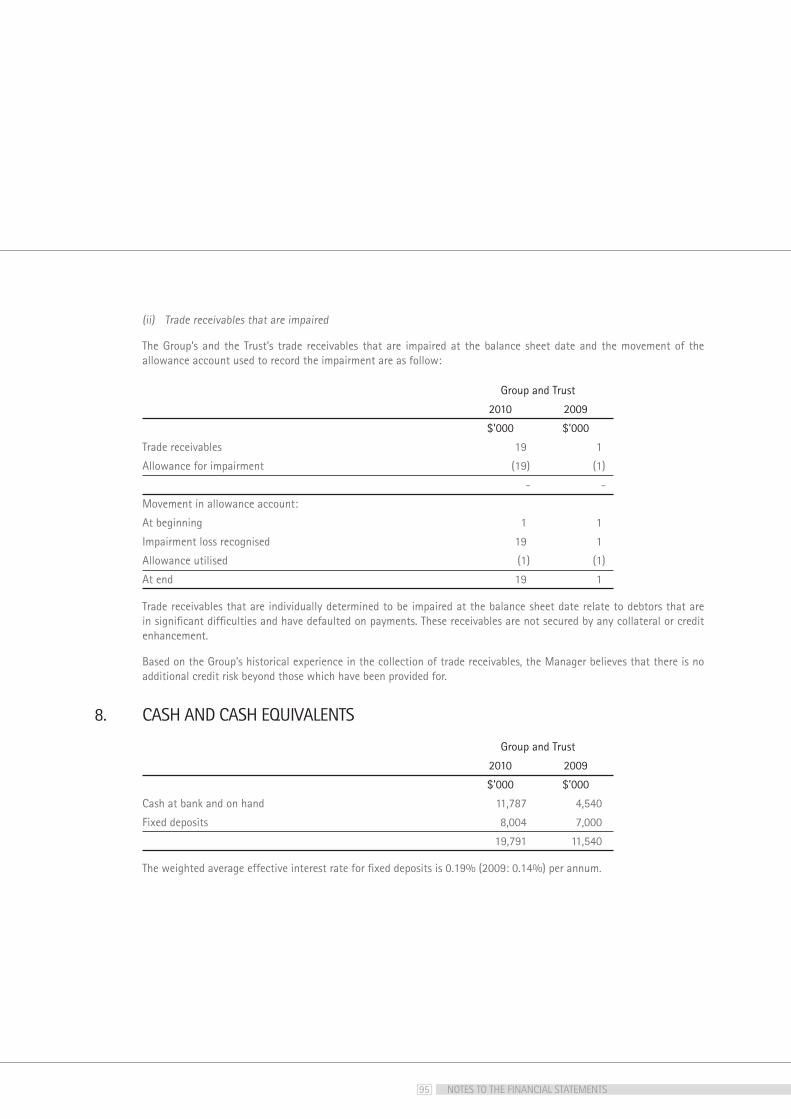
95 NOTES TO THE FINANCIAL STATEMENTS
(ii) Trade receivables that are impaired
The Group’s and the Trust’s trade receivables that are impaired at the balance sheet date and the movement of the allowance account used to record the impairment are as follow:
Group and Trust
2010 2009
$’000 $’000
Trade receivables 19 1
Allowance for impairment (19) (1)
- -
Movement in allowance account:
At beginning 1 1
Impairment loss recognised 19 1
Allowance utilised (1) (1)
At end 19 1
Trade receivables that are individually determined to be impaired at the balance sheet date relate to debtors that are in significant difficulties and have defaulted on payments. These receivables are not secured by any collateral or credit enhancement.
Based on the Group’s historical experience in the collection of trade receivables, the Manager believes that there is no additional credit risk beyond those which have been provided for.
8. CASH AND CASH EQUIVALENTS
Group and Trust
2010 2009
$’000 $’000
Cash at bank and on hand 11,787 4,540
Fixed deposits 8,004 7,000
19,791 11,540
The weighted average effective interest rate for fixed deposits is 0.19% (2009: 0.14%) per annum.
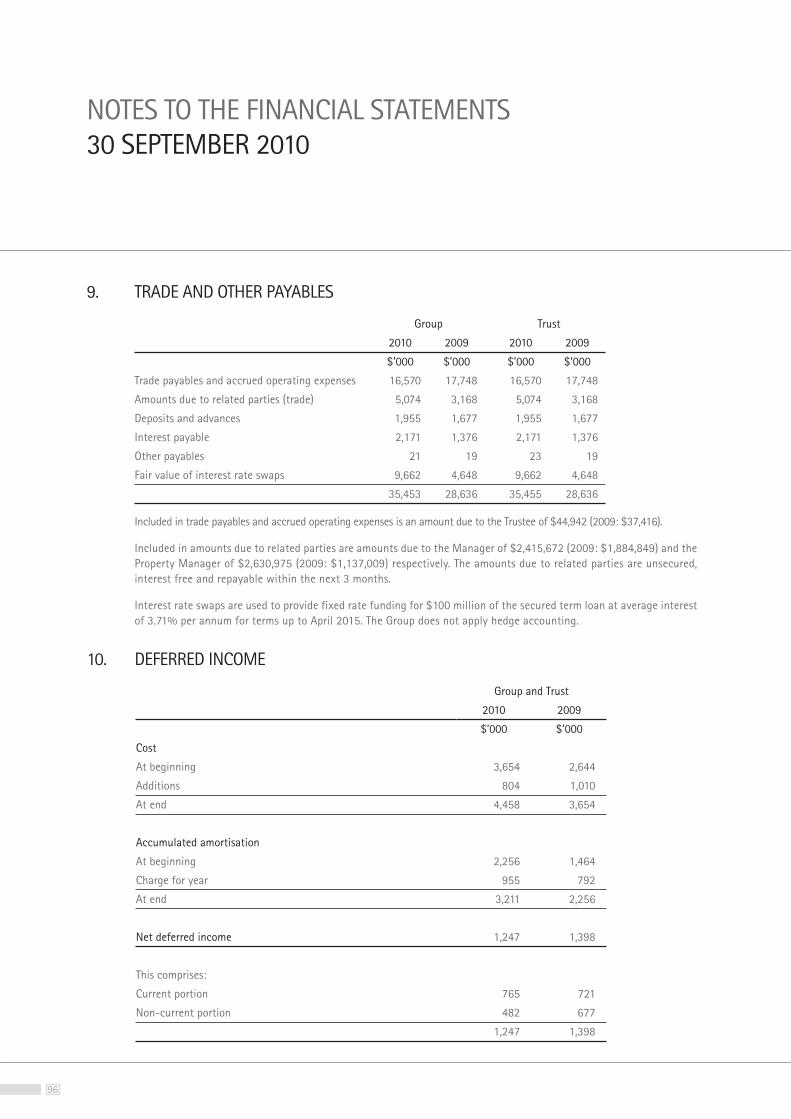
96
9. TRADE AND OTHER PAYABLES
Group Trust
2010 2009 2010 2009
$’000 $’000 $’000 $’000
Trade payables and accrued operating expenses 16,570 17,748 16,570 17,748
Amounts due to related parties (trade) 5,074 3,168 5,074 3,168
Deposits and advances 1,955 1,677 1,955 1,677
Interest payable 2,171 1,376 2,171 1,376
Other payables 21 19 23 19
Fair value of interest rate swaps 9,662 4,648 9,662 4,648
35,453 28,636 35,455 28,636
Included in trade payables and accrued operating expenses is an amount due to the Trustee of $44,942 (2009: $37,416).
Included in amounts due to related parties are amounts due to the Manager of $2,415,672 (2009: $1,884,849) and the Property Manager of $2,630,975 (2009: $1,137,009) respectively. The amounts due to related parties are unsecured, interest free and repayable within the next 3 months.
Interest rate swaps are used to provide fixed rate funding for $100 million of the secured term loan at average interest of 3.71% per annum for terms up to April 2015. The Group does not apply hedge accounting.
10. DEFERRED INCOME
Group and Trust
2010 2009
$’000 $’000
Cost
At beginning 3,654 2,644
Additions 804 1,010
At end 4,458 3,654
Accumulated amortisation
At beginning 2,256 1,464
Charge for year 955 792
At end 3,211 2,256
Net deferred income 1,247 1,398
This comprises:
Current portion 765 721
Non-current portion 482 677
1,247 1,398
NOTES TO THE FINANCIAL STATEMENTS30 SEPTEMBER 2010
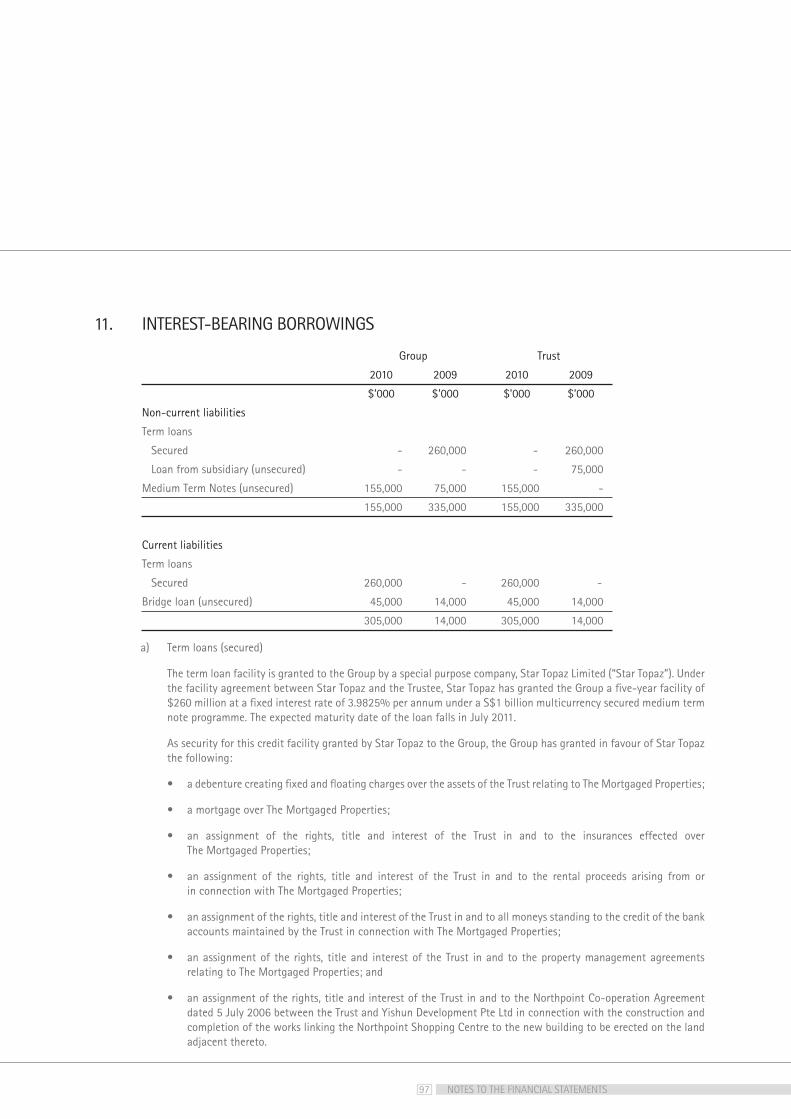
97
11. INTEREST-BEARING BORROWINGS
Group Trust
2010 2009 2010 2009
$’000 $’000 $’000 $’000
Non-current liabilities
Term loans
Secured - 260,000 - 260,000
Loan from subsidiary (unsecured) - - - 75,000
Medium Term Notes (unsecured) 155,000 75,000 155,000 -
155,000 335,000 155,000 335,000
Current liabilities
Term loans
Secured 260,000 - 260,000 -
Bridge loan (unsecured) 45,000 14,000 45,000 14,000
305,000 14,000 305,000 14,000
a) Term loans (secured)
The term loan facility is granted to the Group by a special purpose company, Star Topaz Limited (“Star Topaz”). Under the facility agreement between Star Topaz and the Trustee, Star Topaz has granted the Group a five-year facility of $260 million at a fixed interest rate of 3.9825% per annum under a S$1 billion multicurrency secured medium term note programme. The expected maturity date of the loan falls in July 2011.
As security for this credit facility granted by Star Topaz to the Group, the Group has granted in favour of Star Topaz the following:
The Mortgaged Properties;
in connection with The Mortgaged Properties;
accounts maintained by the Trust in connection with The Mortgaged Properties;
relating to The Mortgaged Properties; and
dated 5 July 2006 between the Trust and Yishun Development Pte Ltd in connection with the construction and completion of the works linking the Northpoint Shopping Centre to the new building to be erected on the land adjacent thereto.
NOTES TO THE FINANCIAL STATEMENTS
98
b) Medium Term Notes (unsecured) and loan from subsidiary (unsecured)
On 7 May 2009, the Group through its subsidiary, FCT MTN, established a $500,000,000 Multicurrency Medium Term Note Programme (“FCT MTN Programme”). Under the FCT MTN Programme, FCT MTN may, subject to compliance with all relevant laws, regulations and directives, from time to time issue notes (the “Notes”) in Singapore dollars or any other currency.
The Notes may be issued in various amounts and tenors, and may bear interest at fixed, floating, hybrid or variable rates of interest. Hybrid notes or zero coupon notes may also be issued under the FCT MTN Programme.
The Notes shall constitute direct, unconditional, unsubordinated and unsecured obligations of FCT MTN ranking pari passu, without any preference or priority among themselves, and pari passu with all other present and future unsecured obligations (other than subordinated obligations and priorities created by law) of FCT MTN. All sums payable in respect of the Notes are unconditionally and irrevocably guaranteed by the Trustee.
As at 30 September 2010, the aggregate balance of the Notes issued by the Group under the FCT MTN Programme amounted to $155 million (2009: $75 million), consisting of:
(i) $75 million (2009: $75 million) Fixed Rate Notes which matures on 18 June 2012 and bears a fixed interest rate of 4.80% per annum payable semi-annually in arrear;
(ii) $55 million (2009: Nil) Fixed Rate Notes which matures on 12 February 2013 and bears a fixed interest rate of 2.83% per annum payable semi-annually in arrear; and
(iii) $25 million (2009: Nil) Fixed Rate Notes which matures on 12 February 2015 and bears a fixed interest rate of 3.50% per annum payable semi-annually in arrear.
c) Unsecured revolving credit and bridge loan facilities
The Trust has obtained unsecured revolving credit and bridge loan facilities amounting to $150 million (2009: $160 million). As at 30 September 2010, total borrowings drawn down by the Trust on these facilities amounted to $45 million (2009: $14 million).
12. DEFERRED TAX LIABILITIESDeferred tax liabilities relate to deferred tax imputed on applicable portion of revaluation surplus of investment properties.
NOTES TO THE FINANCIAL STATEMENTS30 SEPTEMBER 2010
11. INTEREST-BEARING BORROWINGS (continued)
99
13. TRANSLATION RESERVEThe translation reserve represents exchange differences arising from the translation of the financial statements of foreign operations whose functional currency is different from that of the Group’s presentation currency.
Group Trust
2010 2009 2010 2009
$’000 $’000 $’000 $’000
At beginning as previously reported 5,417 - - 4,101
Change in accounting policy - 4,101 - (4,101)
At beginning, restated 5,417 4,101 - -
Net effect of exchange differences arising from translation of financial statements of foreign operations
(2,404) 1,316 - -
At end 3,013 5,417 - -
14. UNITS IN ISSUE
Group and Trust
2010 2009
No. of Units ’000
No. of Units ’000
Units in issue
At beginning 625,800 620,204
Issue of Units
- private placement 137,000 -
- issued as satisfaction of acquisition fee 2,182 -
- issued as satisfaction of asset management fees 2,294 5,596
At end 767,276 625,800
Units to be issued
- as asset management fees payable in Units 297 765
Total issued and issuable Units at 30 September 767,573 626,565
Each Unit in the Trust represents an undivided interest in the Trust. The rights and interests of Unitholders are contained in the Trust Deed and include the rights to:
of the assets of the Trust less any liabilities, in accordance with their proportionate interests in the Trust. However, a Unitholder has no equitable or proprietary interest in the underlying assets of the Trust and is not entitled to the transfer to it of any assets (or part thereof) or of any estate or interest in any assets (or part thereof) of the Trust;
NOTES TO THE FINANCIAL STATEMENTS
100
of not less than 50 Unitholders or one-tenth in number of the Unitholders, whichever is lesser) at any time convene a meeting of Unitholders in accordance with the provisions of the Trust Deed; and
The restrictions of a Unitholder include the following:
of the Trust Deed; and
A Unitholder’s liability is limited to the amount paid or payable for any Units in the Trust. The provisions of the Trust Deed provide that no Unitholders will be personally liable to indemnify the Trustee or any creditor of the Trustee in the event that liabilities of the Trust exceed its assets.
15. NET ASSET VALUE PER UNIT
Group Trust
2010 2009 2010 2009
$’000 $’000 $’000 $’000
Net asset value per Unit is based on:
Net assets 989,253 763,781 986,235 763,781
’000 ’000 ’000 ’000
Total issued and issuable Units at 30 September (Note 14) 767,573 626,565 767,573 626,565
16. GROSS REVENUE
Group and Trust
2010 2009
$’000 $’000
Gross rental income 100,349 74,608
Others 14,389 12,016
114,738 86,624
NOTES TO THE FINANCIAL STATEMENTS30 SEPTEMBER 2010
14. UNITS IN ISSUE (continued)
101
17. PROPERTY EXPENSES
Group and Trust
2010 2009
$’000 $’000
Property tax 10,187 7,234
Utilities 5,261 3,489
Maintenance 8,144 6,568
Property management fees 4,406 3,312
Marketing expenses 3,531 3,016
Allowance for doubtful receivables 19 1
Depreciation 30 28
Others 3,110 3,115
34,688 26,763
The Group does not have any employees.
18. BORROWING COSTS
Group and Trust
2010 2009
$’000 $’000
Interest expense 17,311 12,213
Amortisation of loan arrangement fees 401 307
17,712 12,520
19. ASSET MANAGEMENT FEESIncluded in asset management fees of the Group and the Trust is an aggregate of 1,825,608 (2009: 5,191,255) Units issued and issuable to the Manager as satisfaction of the asset management fees payable in Units.
NOTES TO THE FINANCIAL STATEMENTS
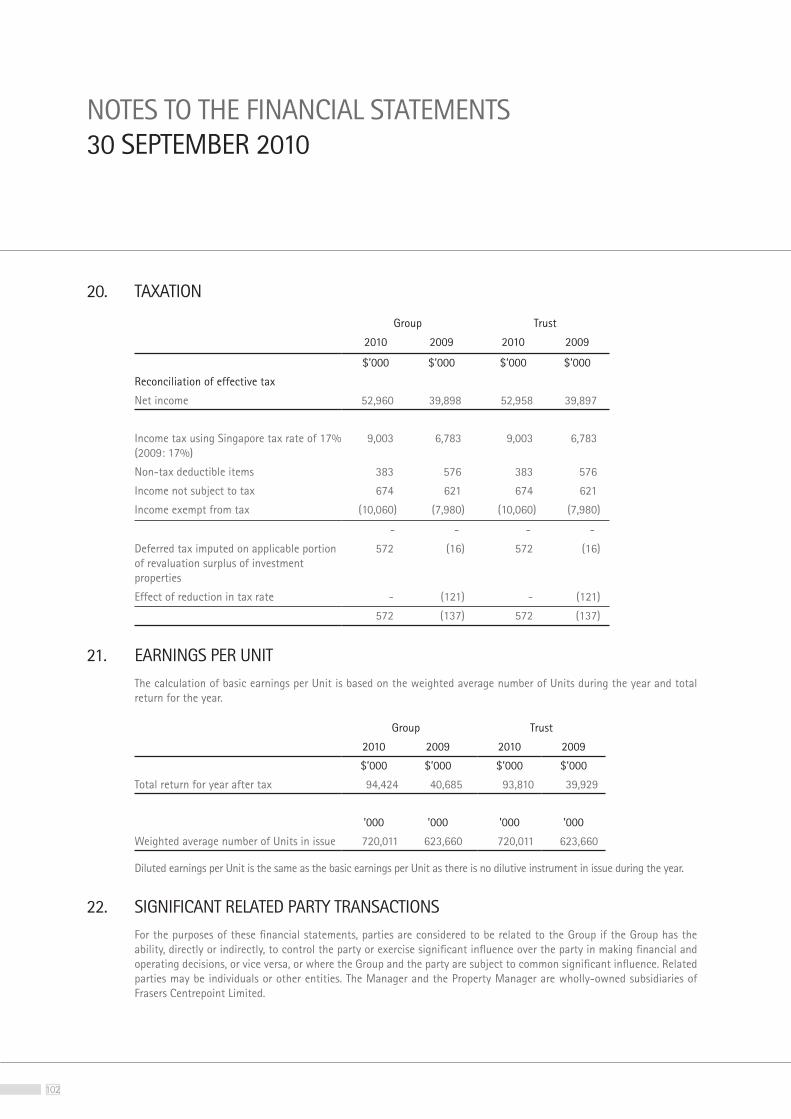
102
20. TAXATION
Group Trust
2010 2009 2010 2009
$’000 $’000 $’000 $’000
Reconciliation of effective tax
Net income 52,960 39,898 52,958 39,897
Income tax using Singapore tax rate of 17% (2009: 17%)
9,003 6,783 9,003 6,783
Non-tax deductible items 383 576 383 576
Income not subject to tax 674 621 674 621
Income exempt from tax (10,060) (7,980) (10,060) (7,980)
- - - -
Deferred tax imputed on applicable portion of revaluation surplus of investment properties
572 (16) 572 (16)
Effect of reduction in tax rate - (121) - (121)
572 (137) 572 (137)
21. EARNINGS PER UNITThe calculation of basic earnings per Unit is based on the weighted average number of Units during the year and total return for the year.
Group Trust
2010 2009 2010 2009
$’000 $’000 $’000 $’000
Total return for year after tax 94,424 40,685 93,810 39,929
’000 ’000 ’000 ’000
Weighted average number of Units in issue 720,011 623,660 720,011 623,660
Diluted earnings per Unit is the same as the basic earnings per Unit as there is no dilutive instrument in issue during the year.
22. SIGNIFICANT RELATED PARTY TRANSACTIONSFor the purposes of these financial statements, parties are considered to be related to the Group if the Group has the ability, directly or indirectly, to control the party or exercise significant influence over the party in making financial and operating decisions, or vice versa, or where the Group and the party are subject to common significant influence. Related parties may be individuals or other entities. The Manager and the Property Manager are wholly-owned subsidiaries of Frasers Centrepoint Limited.
NOTES TO THE FINANCIAL STATEMENTS30 SEPTEMBER 2010
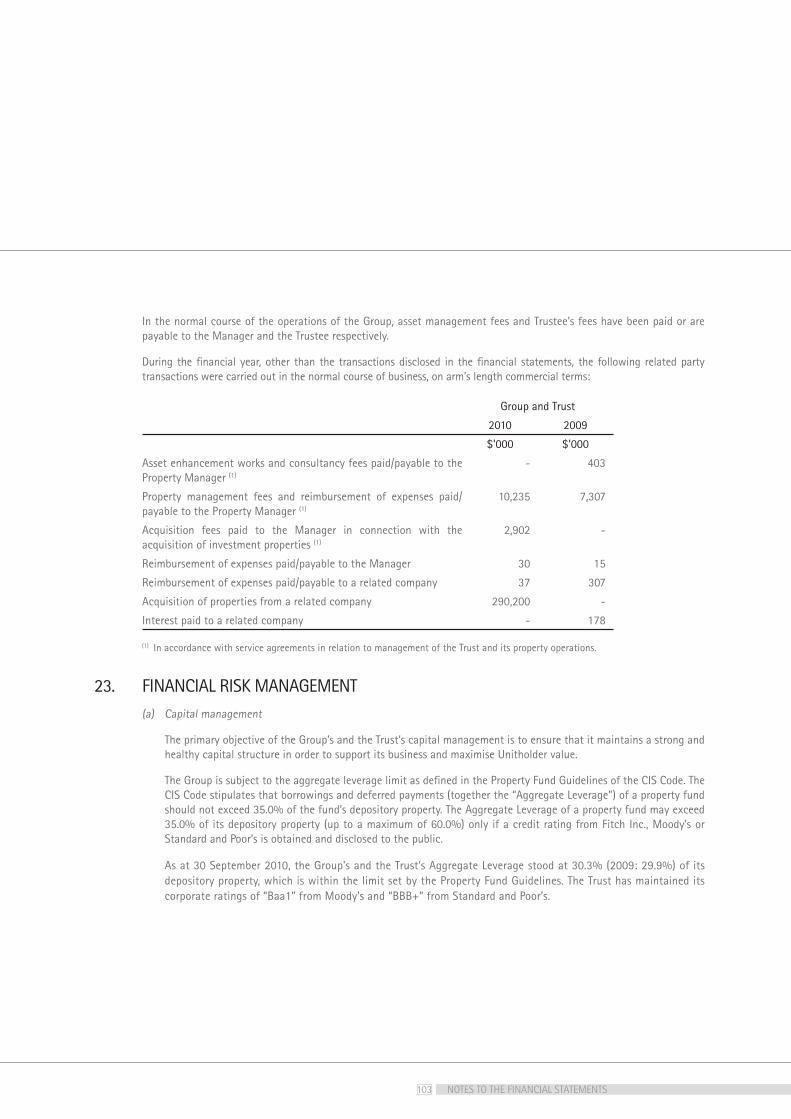
103
In the normal course of the operations of the Group, asset management fees and Trustee’s fees have been paid or are payable to the Manager and the Trustee respectively.
During the financial year, other than the transactions disclosed in the financial statements, the following related party transactions were carried out in the normal course of business, on arm’s length commercial terms:
Group and Trust
2010 2009
$’000 $’000
Asset enhancement works and consultancy fees paid/payable to the Property Manager (1)
- 403
Property management fees and reimbursement of expenses paid/payable to the Property Manager (1)
10,235 7,307
Acquisition fees paid to the Manager in connection with the acquisition of investment properties (1)
2,902 -
Reimbursement of expenses paid/payable to the Manager 30 15
Reimbursement of expenses paid/payable to a related company 37 307
Acquisition of properties from a related company 290,200 -
Interest paid to a related company - 178
(1) In accordance with service agreements in relation to management of the Trust and its property operations.
23. FINANCIAL RISK MANAGEMENT(a) Capital management
The primary objective of the Group’s and the Trust’s capital management is to ensure that it maintains a strong and healthy capital structure in order to support its business and maximise Unitholder value.
The Group is subject to the aggregate leverage limit as defined in the Property Fund Guidelines of the CIS Code. The CIS Code stipulates that borrowings and deferred payments (together the “Aggregate Leverage”) of a property fund should not exceed 35.0% of the fund’s depository property. The Aggregate Leverage of a property fund may exceed 35.0% of its depository property (up to a maximum of 60.0%) only if a credit rating from Fitch Inc., Moody’s or Standard and Poor’s is obtained and disclosed to the public.
As at 30 September 2010, the Group’s and the Trust’s Aggregate Leverage stood at 30.3% (2009: 29.9%) of its depository property, which is within the limit set by the Property Fund Guidelines. The Trust has maintained its corporate ratings of “Baa1” from Moody’s and “BBB+” from Standard and Poor’s.
NOTES TO THE FINANCIAL STATEMENTS
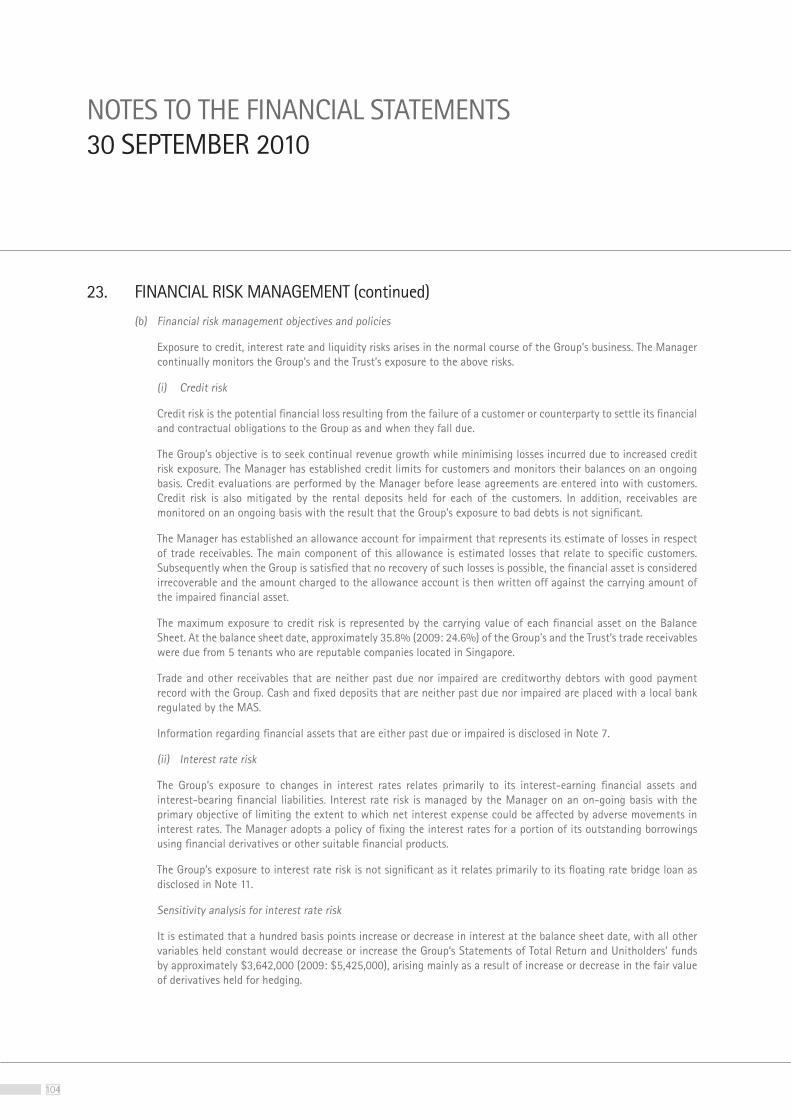
104
(b) Financial risk management objectives and policies
Exposure to credit, interest rate and liquidity risks arises in the normal course of the Group’s business. The Manager continually monitors the Group’s and the Trust’s exposure to the above risks.
(i) Credit risk
Credit risk is the potential financial loss resulting from the failure of a customer or counterparty to settle its financial and contractual obligations to the Group as and when they fall due.
The Group’s objective is to seek continual revenue growth while minimising losses incurred due to increased credit risk exposure. The Manager has established credit limits for customers and monitors their balances on an ongoing basis. Credit evaluations are performed by the Manager before lease agreements are entered into with customers. Credit risk is also mitigated by the rental deposits held for each of the customers. In addition, receivables are monitored on an ongoing basis with the result that the Group’s exposure to bad debts is not significant.
The Manager has established an allowance account for impairment that represents its estimate of losses in respect of trade receivables. The main component of this allowance is estimated losses that relate to specific customers. Subsequently when the Group is satisfied that no recovery of such losses is possible, the financial asset is considered irrecoverable and the amount charged to the allowance account is then written off against the carrying amount of the impaired financial asset.
The maximum exposure to credit risk is represented by the carrying value of each financial asset on the Balance Sheet. At the balance sheet date, approximately 35.8% (2009: 24.6%) of the Group’s and the Trust’s trade receivables were due from 5 tenants who are reputable companies located in Singapore.
Trade and other receivables that are neither past due nor impaired are creditworthy debtors with good payment record with the Group. Cash and fixed deposits that are neither past due nor impaired are placed with a local bank regulated by the MAS.
Information regarding financial assets that are either past due or impaired is disclosed in Note 7.
(ii) Interest rate risk
The Group’s exposure to changes in interest rates relates primarily to its interest-earning financial assets and interest-bearing financial liabilities. Interest rate risk is managed by the Manager on an on-going basis with the primary objective of limiting the extent to which net interest expense could be affected by adverse movements in interest rates. The Manager adopts a policy of fixing the interest rates for a portion of its outstanding borrowings using financial derivatives or other suitable financial products.
The Group’s exposure to interest rate risk is not significant as it relates primarily to its floating rate bridge loan as disclosed in Note 11.
Sensitivity analysis for interest rate risk
It is estimated that a hundred basis points increase or decrease in interest at the balance sheet date, with all other variables held constant would decrease or increase the Group’s Statements of Total Return and Unitholders’ funds by approximately $3,642,000 (2009: $5,425,000), arising mainly as a result of increase or decrease in the fair value of derivatives held for hedging.
NOTES TO THE FINANCIAL STATEMENTS30 SEPTEMBER 2010
23. FINANCIAL RISK MANAGEMENT (continued)
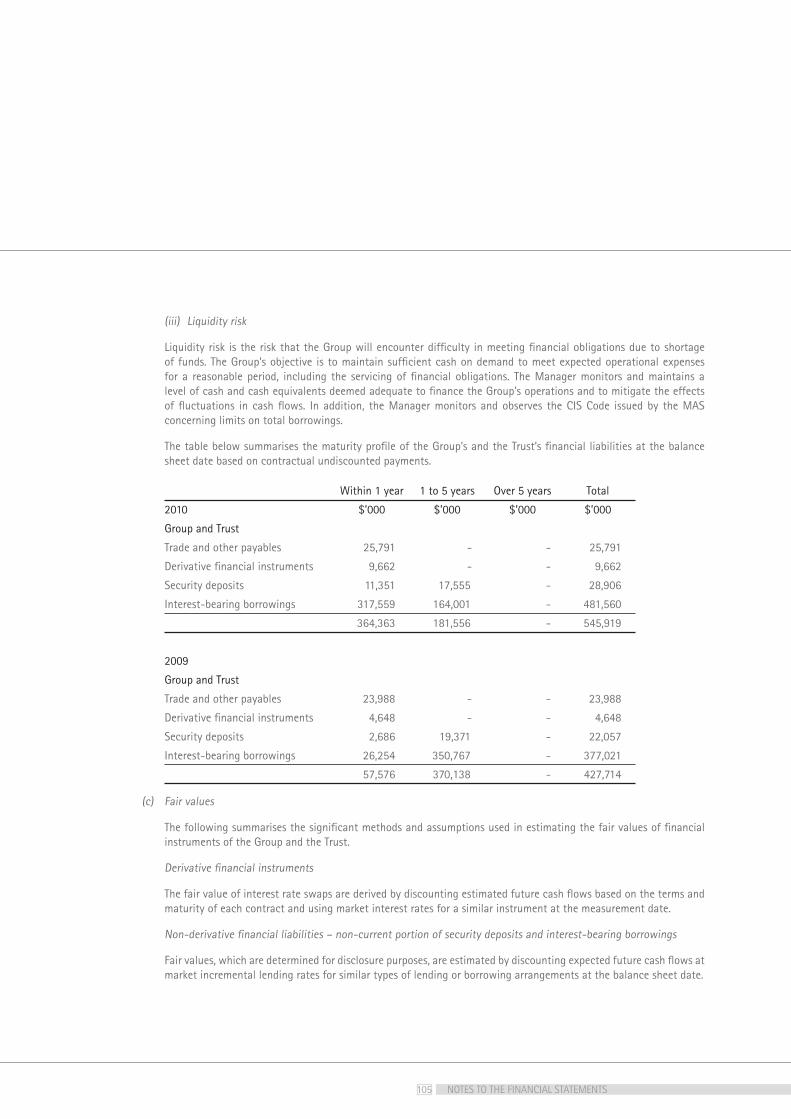
105
(iii) Liquidity risk
Liquidity risk is the risk that the Group will encounter difficulty in meeting financial obligations due to shortage of funds. The Group’s objective is to maintain sufficient cash on demand to meet expected operational expenses for a reasonable period, including the servicing of financial obligations. The Manager monitors and maintains a level of cash and cash equivalents deemed adequate to finance the Group’s operations and to mitigate the effects of fluctuations in cash flows. In addition, the Manager monitors and observes the CIS Code issued by the MAS concerning limits on total borrowings.
The table below summarises the maturity profile of the Group’s and the Trust’s financial liabilities at the balance sheet date based on contractual undiscounted payments.
Within 1 year 1 to 5 years Over 5 years Total
2010 $’000 $’000 $’000 $’000
Group and Trust
Trade and other payables 25,791 - - 25,791
Derivative financial instruments 9,662 - - 9,662
Security deposits 11,351 17,555 - 28,906
Interest-bearing borrowings 317,559 164,001 - 481,560
364,363 181,556 - 545,919
2009
Group and Trust
Trade and other payables 23,988 - - 23,988
Derivative financial instruments 4,648 - - 4,648
Security deposits 2,686 19,371 - 22,057
Interest-bearing borrowings 26,254 350,767 - 377,021
57,576 370,138 - 427,714
(c) Fair values
The following summarises the significant methods and assumptions used in estimating the fair values of financial instruments of the Group and the Trust.
Derivative financial instruments
The fair value of interest rate swaps are derived by discounting estimated future cash flows based on the terms and maturity of each contract and using market interest rates for a similar instrument at the measurement date.
Non-derivative financial liabilities – non-current portion of security deposits and interest-bearing borrowings
Fair values, which are determined for disclosure purposes, are estimated by discounting expected future cash flows at market incremental lending rates for similar types of lending or borrowing arrangements at the balance sheet date.
NOTES TO THE FINANCIAL STATEMENTS
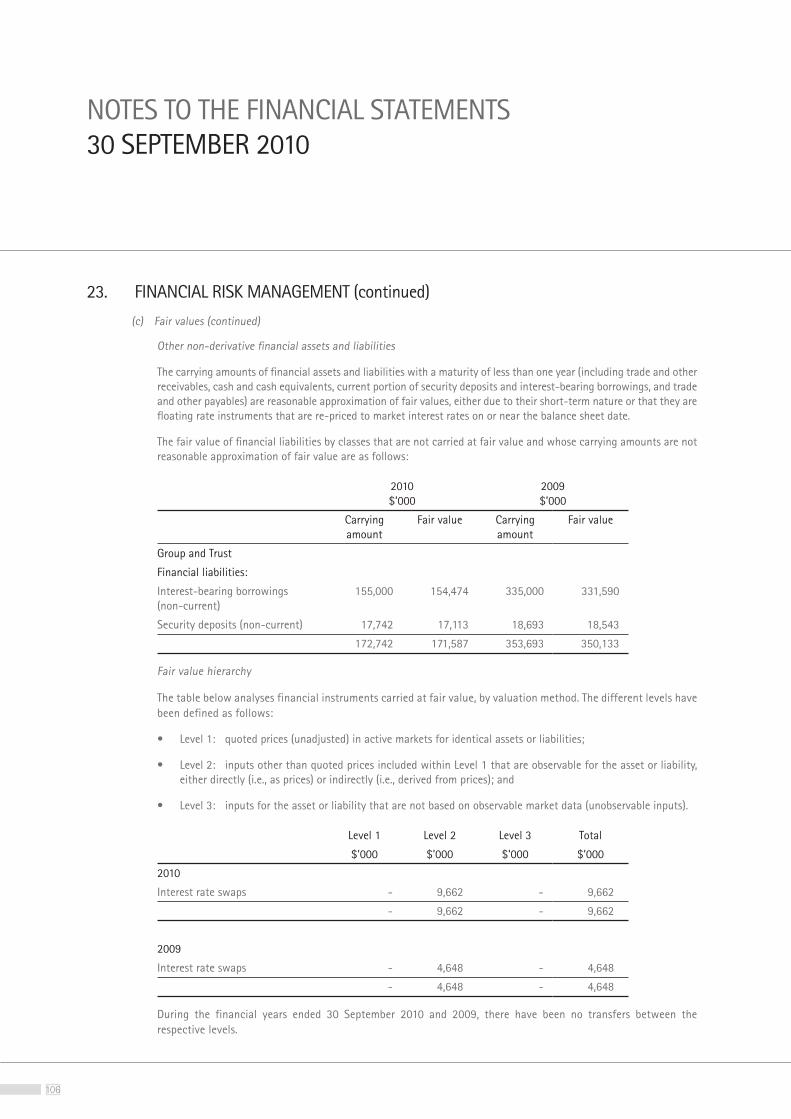
106
Other non-derivative financial assets and liabilities
The carrying amounts of financial assets and liabilities with a maturity of less than one year (including trade and other receivables, cash and cash equivalents, current portion of security deposits and interest-bearing borrowings, and trade and other payables) are reasonable approximation of fair values, either due to their short-term nature or that they are floating rate instruments that are re-priced to market interest rates on or near the balance sheet date.
The fair value of financial liabilities by classes that are not carried at fair value and whose carrying amounts are not reasonable approximation of fair value are as follows:
2010 $’000
2009 $’000
Carrying amount
Fair value Carrying amount
Fair value
Group and Trust
Financial liabilities:
Interest-bearing borrowings (non-current)
155,000 154,474 335,000 331,590
Security deposits (non-current) 17,742 17,113 18,693 18,543
172,742 171,587 353,693 350,133
Fair value hierarchy
The table below analyses financial instruments carried at fair value, by valuation method. The different levels have been defined as follows:
either directly (i.e., as prices) or indirectly (i.e., derived from prices); and
Level 1 Level 2 Level 3 Total
$’000 $’000 $’000 $’000
2010
Interest rate swaps - 9,662 - 9,662
- 9,662 - 9,662
2009
Interest rate swaps - 4,648 - 4,648
- 4,648 - 4,648
During the financial years ended 30 September 2010 and 2009, there have been no transfers between the respective levels.
NOTES TO THE FINANCIAL STATEMENTS30 SEPTEMBER 2010
23. FINANCIAL RISK MANAGEMENT (continued)
(c) Fair values (continued)
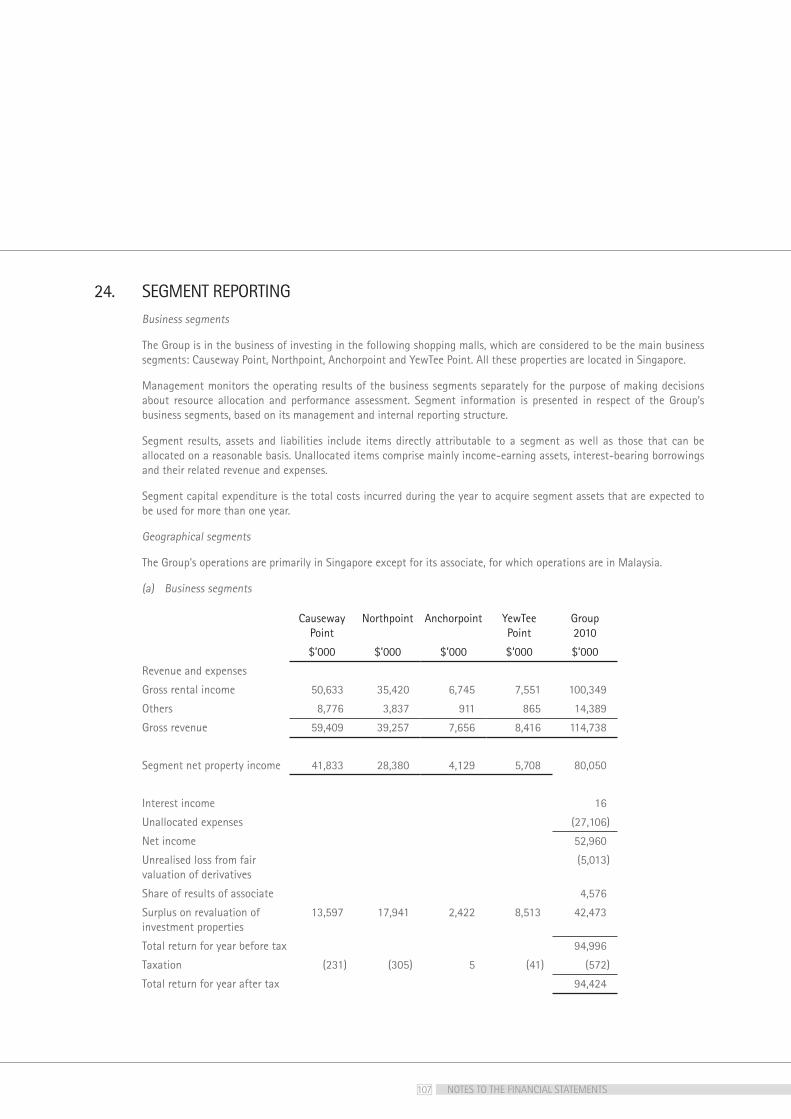
107
24. SEGMENT REPORTINGBusiness segments
The Group is in the business of investing in the following shopping malls, which are considered to be the main business segments: Causeway Point, Northpoint, Anchorpoint and YewTee Point. All these properties are located in Singapore.
Management monitors the operating results of the business segments separately for the purpose of making decisions about resource allocation and performance assessment. Segment information is presented in respect of the Group’s business segments, based on its management and internal reporting structure.
Segment results, assets and liabilities include items directly attributable to a segment as well as those that can be allocated on a reasonable basis. Unallocated items comprise mainly income-earning assets, interest-bearing borrowings and their related revenue and expenses.
Segment capital expenditure is the total costs incurred during the year to acquire segment assets that are expected to be used for more than one year.
Geographical segments
The Group’s operations are primarily in Singapore except for its associate, for which operations are in Malaysia.
(a) Business segments
Causeway Point
Northpoint Anchorpoint YewTee Point
Group 2010
$’000 $’000 $’000 $’000 $’000
Revenue and expenses
Gross rental income 50,633 35,420 6,745 7,551 100,349
Others 8,776 3,837 911 865 14,389
Gross revenue 59,409 39,257 7,656 8,416 114,738
Segment net property income 41,833 28,380 4,129 5,708 80,050
Interest income 16
Unallocated expenses (27,106)
Net income 52,960
Unrealised loss from fair valuation of derivatives
(5,013)
Share of results of associate 4,576
Surplus on revaluation of investment properties
13,597 17,941 2,422 8,513 42,473
Total return for year before tax 94,996
Taxation (231) (305) 5 (41) (572)
Total return for year after tax 94,424
NOTES TO THE FINANCIAL STATEMENTS
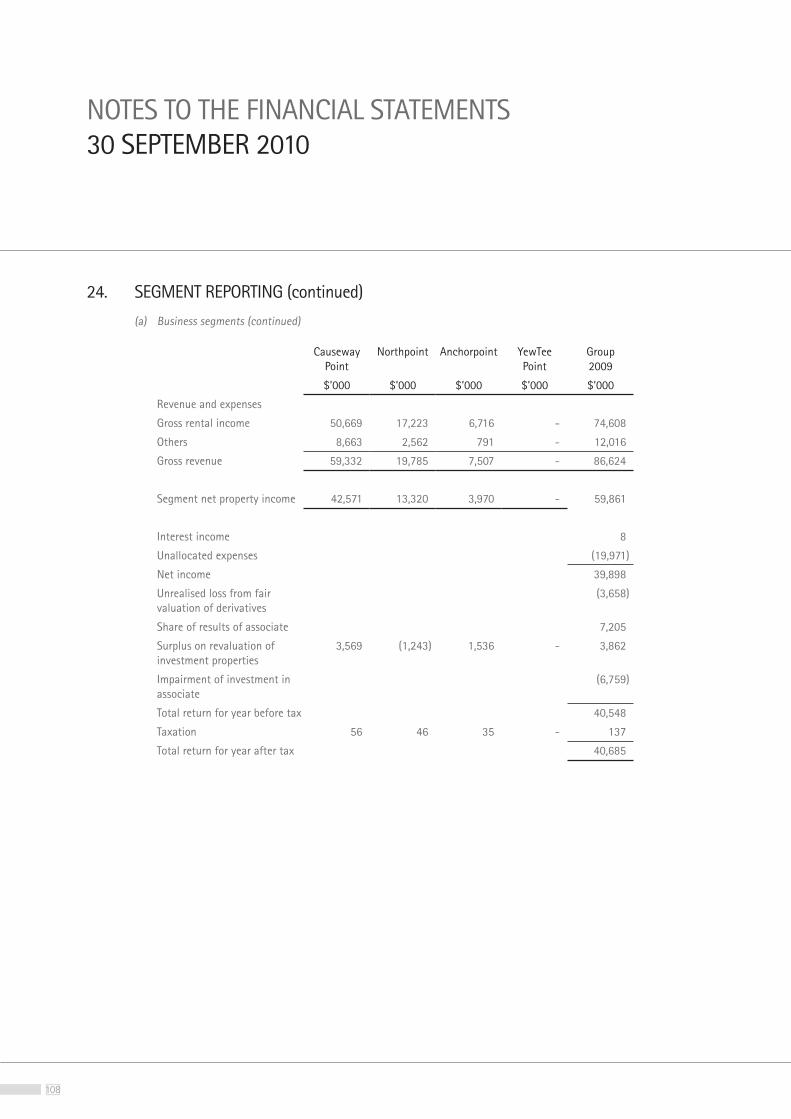
108
Causeway Point
Northpoint Anchorpoint YewTee Point
Group 2009
$’000 $’000 $’000 $’000 $’000
Revenue and expenses
Gross rental income 50,669 17,223 6,716 - 74,608
Others 8,663 2,562 791 - 12,016
Gross revenue 59,332 19,785 7,507 - 86,624
Segment net property income 42,571 13,320 3,970 - 59,861
Interest income 8
Unallocated expenses (19,971)
Net income 39,898
Unrealised loss from fair valuation of derivatives
(3,658)
Share of results of associate 7,205
Surplus on revaluation of investment properties
3,569 (1,243) 1,536 - 3,862
Impairment of investment in associate
(6,759)
Total return for year before tax 40,548
Taxation 56 46 35 - 137
Total return for year after tax 40,685
NOTES TO THE FINANCIAL STATEMENTS30 SEPTEMBER 2010
24. SEGMENT REPORTING (continued)
(a) Business segments (continued)
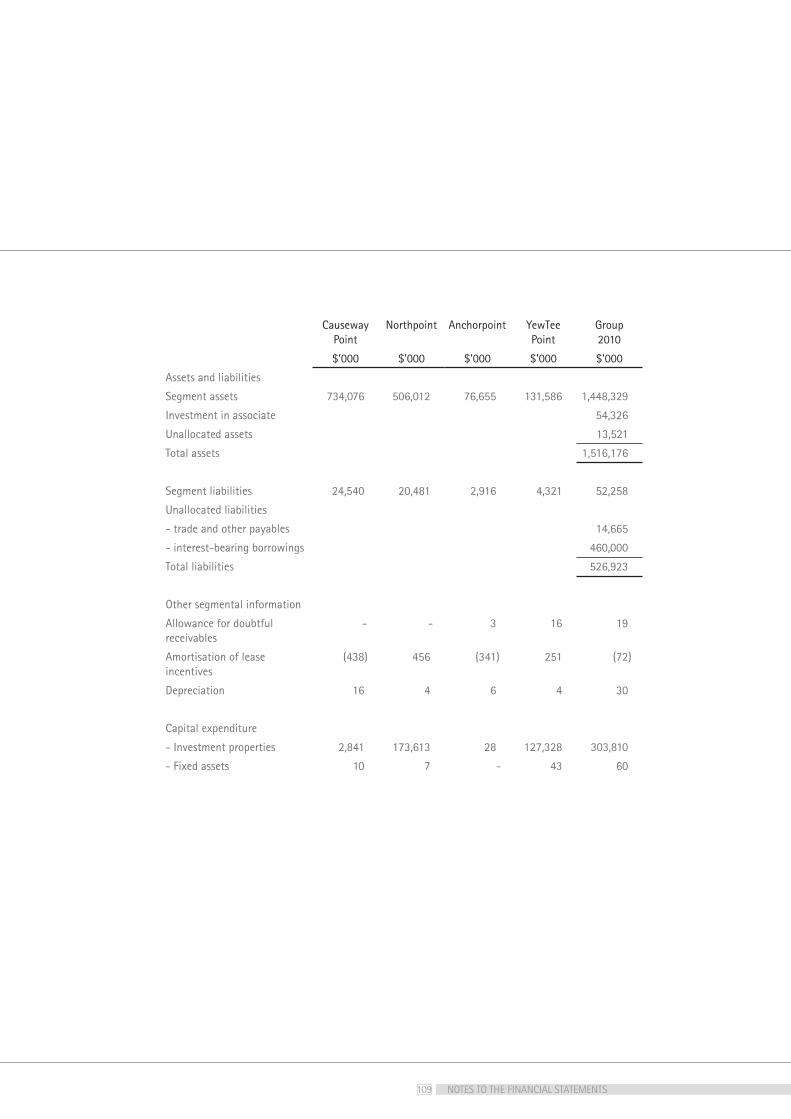
109
Causeway Point
Northpoint Anchorpoint YewTee Point
Group 2010
$’000 $’000 $’000 $’000 $’000
Assets and liabilities
Segment assets 734,076 506,012 76,655 131,586 1,448,329
Investment in associate 54,326
Unallocated assets 13,521
Total assets 1,516,176
Segment liabilities 24,540 20,481 2,916 4,321 52,258
Unallocated liabilities
- trade and other payables 14,665
- interest-bearing borrowings 460,000
Total liabilities 526,923
Other segmental information
Allowance for doubtful receivables
- - 3 16 19
Amortisation of lease incentives
(438) 456 (341) 251 (72)
Depreciation 16 4 6 4 30
Capital expenditure
- Investment properties 2,841 173,613 28 127,328 303,810
- Fixed assets 10 7 - 43 60
NOTES TO THE FINANCIAL STATEMENTS
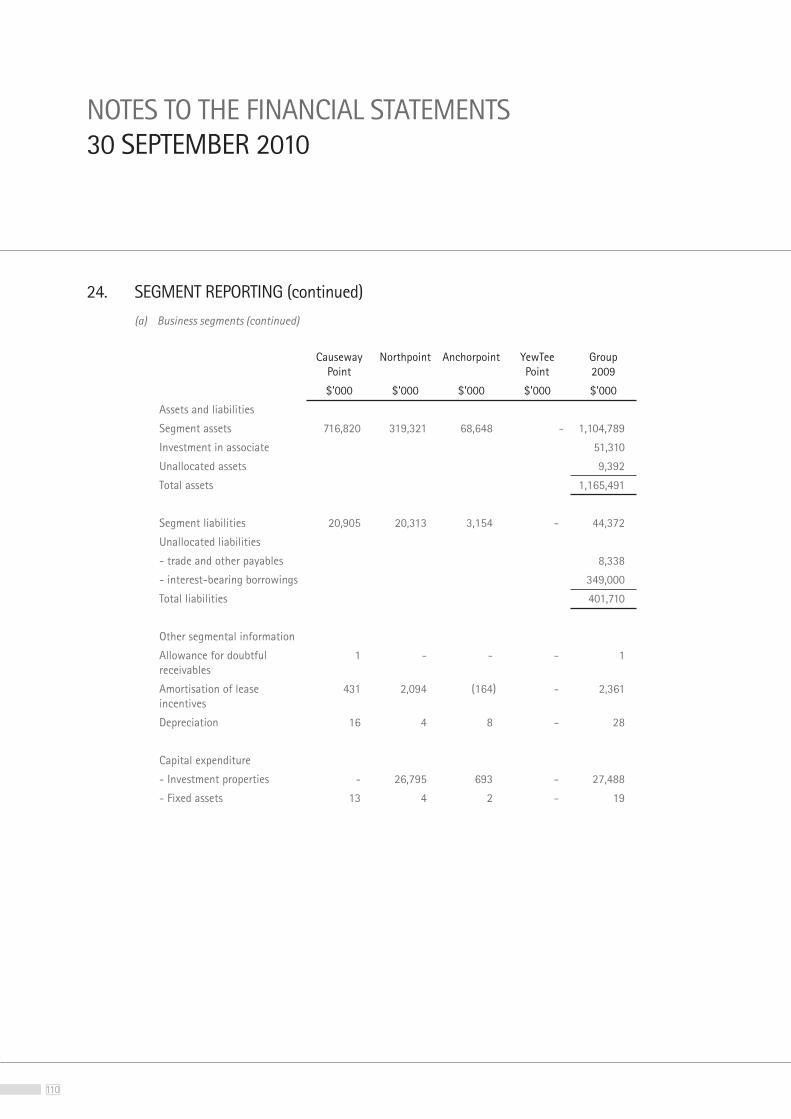
110
Causeway Point
Northpoint Anchorpoint YewTee Point
Group 2009
$’000 $’000 $’000 $’000 $’000
Assets and liabilities
Segment assets 716,820 319,321 68,648 - 1,104,789
Investment in associate 51,310
Unallocated assets 9,392
Total assets 1,165,491
Segment liabilities 20,905 20,313 3,154 - 44,372
Unallocated liabilities
- trade and other payables 8,338
- interest-bearing borrowings 349,000
Total liabilities 401,710
Other segmental information
Allowance for doubtful receivables
1 - - - 1
Amortisation of lease incentives
431 2,094 (164) - 2,361
Depreciation 16 4 8 - 28
Capital expenditure
- Investment properties - 26,795 693 - 27,488
- Fixed assets 13 4 2 - 19
NOTES TO THE FINANCIAL STATEMENTS30 SEPTEMBER 2010
24. SEGMENT REPORTING (continued)
(a) Business segments (continued)
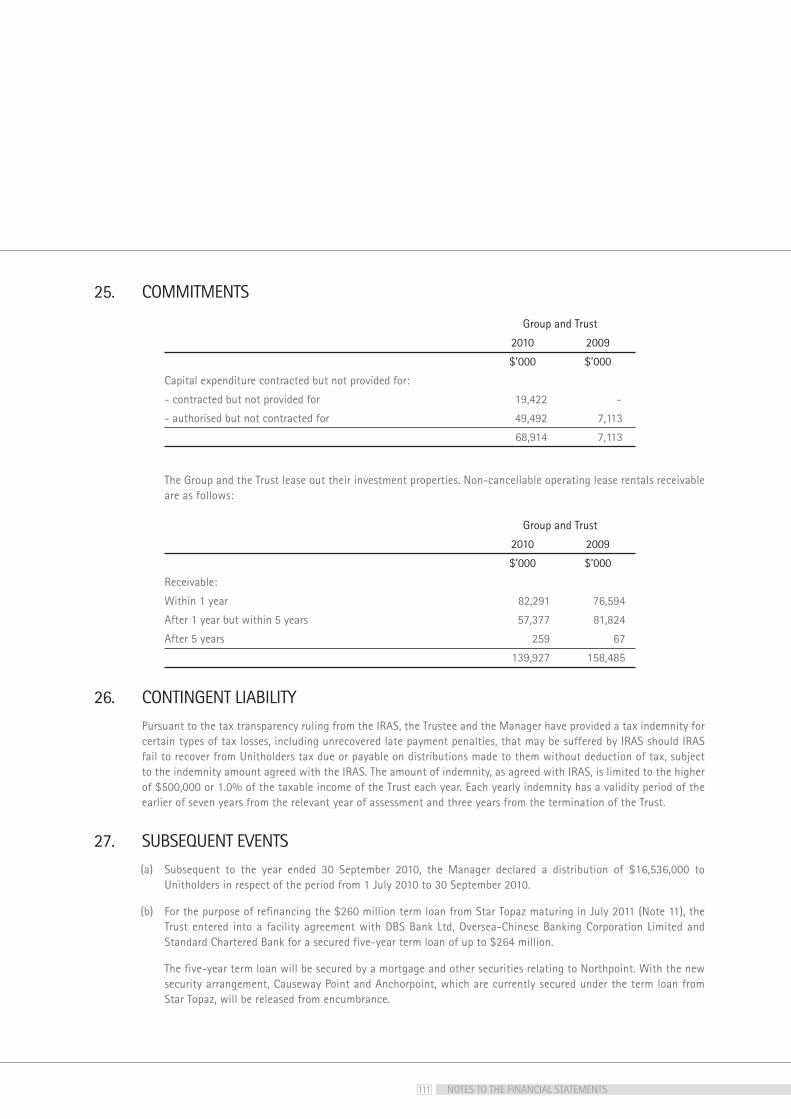
111
25. COMMITMENTS
Group and Trust
2010 2009
$’000 $’000
Capital expenditure contracted but not provided for:
- contracted but not provided for 19,422 -
- authorised but not contracted for 49,492 7,113
68,914 7,113
The Group and the Trust lease out their investment properties. Non-cancellable operating lease rentals receivable are as follows:
Group and Trust
2010 2009
$’000 $’000
Receivable:
Within 1 year 82,291 76,594
After 1 year but within 5 years 57,377 81,824
After 5 years 259 67
139,927 158,485
26. CONTINGENT LIABILITY
Pursuant to the tax transparency ruling from the IRAS, the Trustee and the Manager have provided a tax indemnity for certain types of tax losses, including unrecovered late payment penalties, that may be suffered by IRAS should IRAS fail to recover from Unitholders tax due or payable on distributions made to them without deduction of tax, subject to the indemnity amount agreed with the IRAS. The amount of indemnity, as agreed with IRAS, is limited to the higher of $500,000 or 1.0% of the taxable income of the Trust each year. Each yearly indemnity has a validity period of the earlier of seven years from the relevant year of assessment and three years from the termination of the Trust.
27. SUBSEQUENT EVENTS
(a) Subsequent to the year ended 30 September 2010, the Manager declared a distribution of $16,536,000 to Unitholders in respect of the period from 1 July 2010 to 30 September 2010.
(b) For the purpose of refinancing the $260 million term loan from Star Topaz maturing in July 2011 (Note 11), the Trust entered into a facility agreement with DBS Bank Ltd, Oversea-Chinese Banking Corporation Limited and Standard Chartered Bank for a secured five-year term loan of up to $264 million.
The five-year term loan will be secured by a mortgage and other securities relating to Northpoint. With the new security arrangement, Causeway Point and Anchorpoint, which are currently secured under the term loan from Star Topaz, will be released from encumbrance.
NOTES TO THE FINANCIAL STATEMENTS
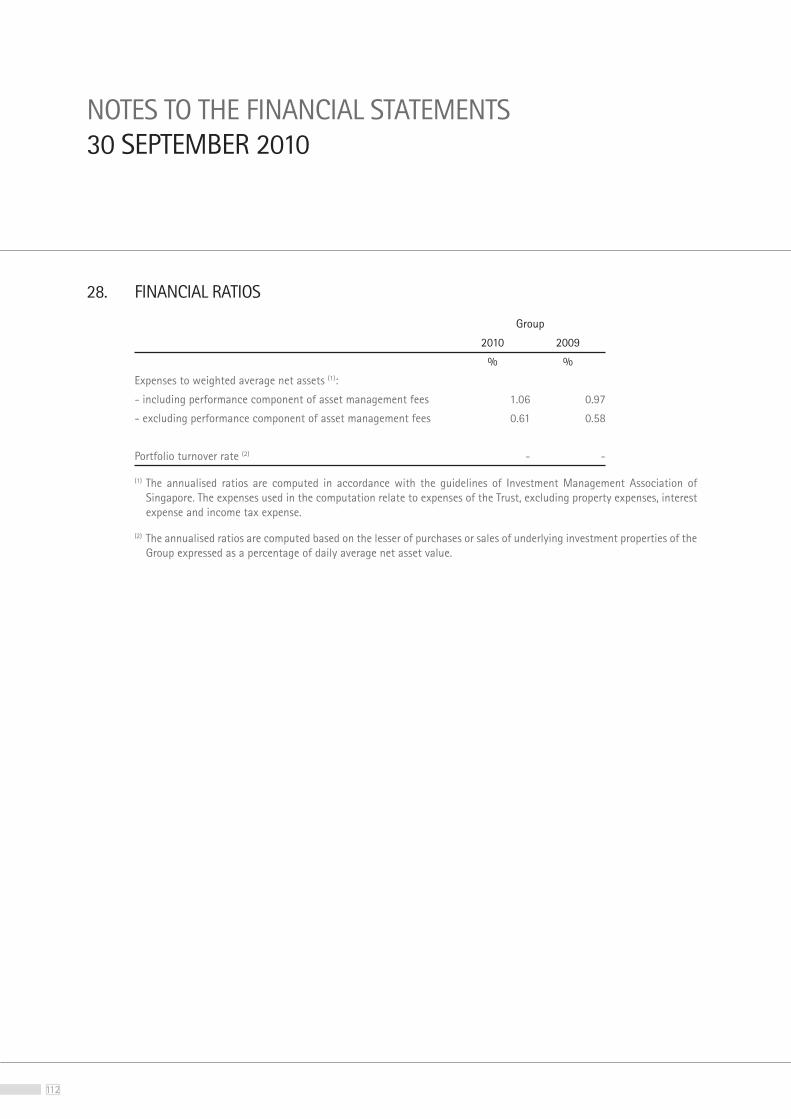
112
NOTES TO THE FINANCIAL STATEMENTS30 SEPTEMBER 2010
28. FINANCIAL RATIOS
Group
2010 2009
% %
Expenses to weighted average net assets (1):
- including performance component of asset management fees 1.06 0.97
- excluding performance component of asset management fees 0.61 0.58
Portfolio turnover rate (2) - -
(1) The annualised ratios are computed in accordance with the guidelines of Investment Management Association of Singapore. The expenses used in the computation relate to expenses of the Trust, excluding property expenses, interest expense and income tax expense.
(2) The annualised ratios are computed based on the lesser of purchases or sales of underlying investment properties of the Group expressed as a percentage of daily average net asset value.
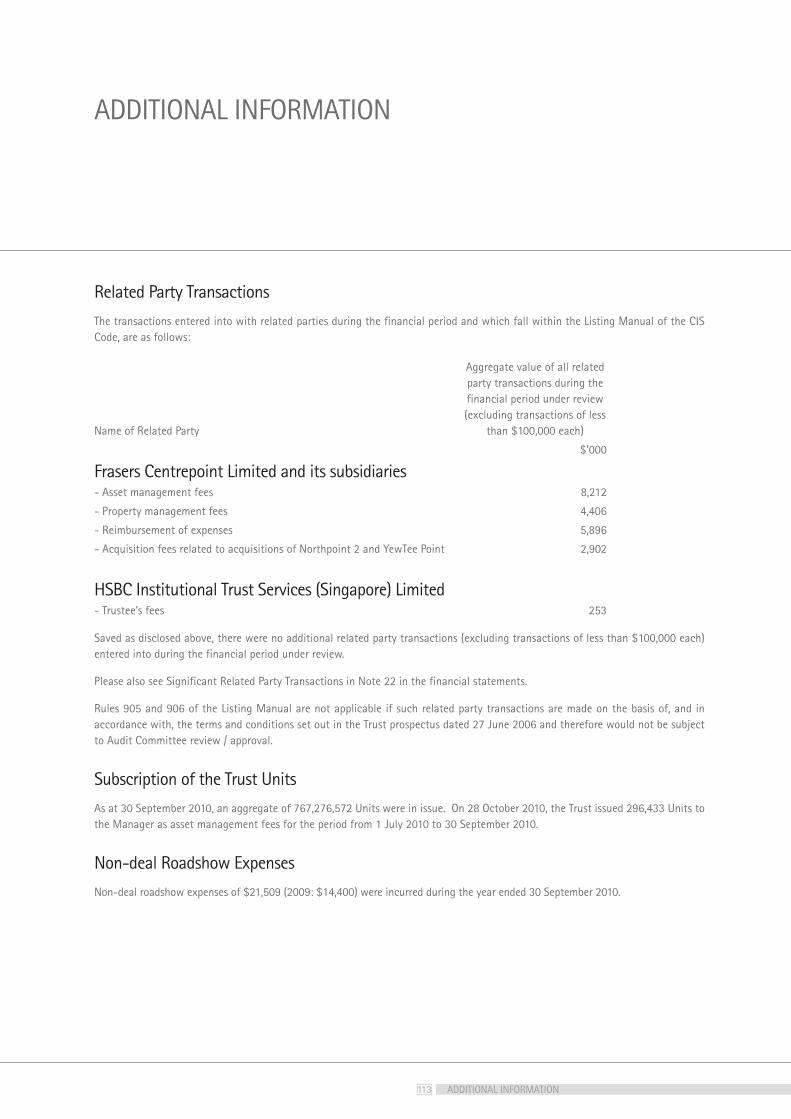
113
Related Party Transactions
The transactions entered into with related parties during the financial period and which fall within the Listing Manual of the CIS Code, are as follows:
Name of Related Party
Aggregate value of all related party transactions during the financial period under review (excluding transactions of less
than $100,000 each)
$’000
Frasers Centrepoint Limited and its subsidiaries- Asset management fees 8,212
- Property management fees 4,406
- Reimbursement of expenses 5,896
- Acquisition fees related to acquisitions of Northpoint 2 and YewTee Point 2,902
HSBC Institutional Trust Services (Singapore) Limited- Trustee’s fees 253
Saved as disclosed above, there were no additional related party transactions (excluding transactions of less than $100,000 each) entered into during the financial period under review.
Please also see Significant Related Party Transactions in Note 22 in the financial statements.
Rules 905 and 906 of the Listing Manual are not applicable if such related party transactions are made on the basis of, and in accordance with, the terms and conditions set out in the Trust prospectus dated 27 June 2006 and therefore would not be subject to Audit Committee review / approval.
Subscription of the Trust Units
As at 30 September 2010, an aggregate of 767,276,572 Units were in issue. On 28 October 2010, the Trust issued 296,433 Units to the Manager as asset management fees for the period from 1 July 2010 to 30 September 2010.
Non-deal Roadshow Expenses
Non-deal roadshow expenses of $21,509 (2009: $14,400) were incurred during the year ended 30 September 2010.
ADDITIONAL INFORMATION
ADDITIONAL INFORMATION
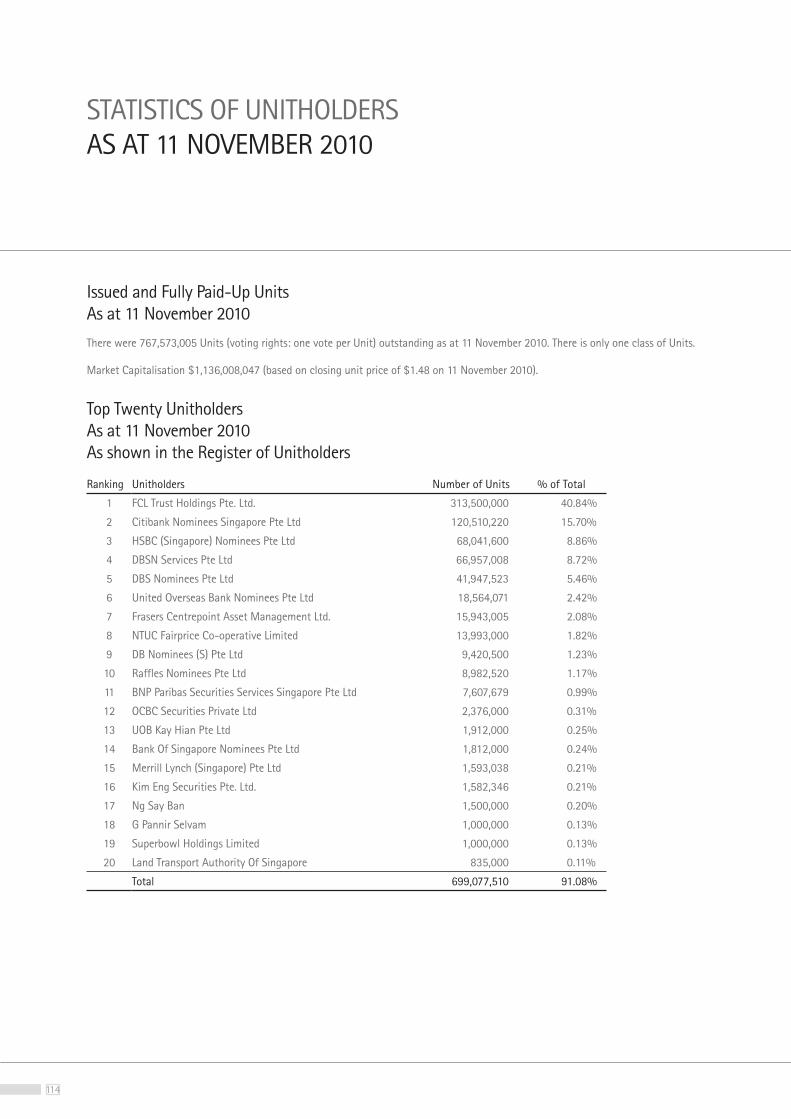
114
Issued and Fully Paid-Up Units As at 11 November 2010
There were 767,573,005 Units (voting rights: one vote per Unit) outstanding as at 11 November 2010. There is only one class of Units.
Market Capitalisation $1,136,008,047 (based on closing unit price of $1.48 on 11 November 2010).
Top Twenty Unitholders As at 11 November 2010 As shown in the Register of Unitholders
Ranking Unitholders Number of Units % of Total
1 FCL Trust Holdings Pte. Ltd. 313,500,000 40.84%
2 Citibank Nominees Singapore Pte Ltd 120,510,220 15.70%
3 HSBC (Singapore) Nominees Pte Ltd 68,041,600 8.86%
4 DBSN Services Pte Ltd 66,957,008 8.72%
5 DBS Nominees Pte Ltd 41,947,523 5.46%
6 United Overseas Bank Nominees Pte Ltd 18,564,071 2.42%
7 Frasers Centrepoint Asset Management Ltd. 15,943,005 2.08%
8 NTUC Fairprice Co-operative Limited 13,993,000 1.82%
9 DB Nominees (S) Pte Ltd 9,420,500 1.23%
10 Raffles Nominees Pte Ltd 8,982,520 1.17%
11 BNP Paribas Securities Services Singapore Pte Ltd 7,607,679 0.99%
12 OCBC Securities Private Ltd 2,376,000 0.31%
13 UOB Kay Hian Pte Ltd 1,912,000 0.25%
14 Bank Of Singapore Nominees Pte Ltd 1,812,000 0.24%
15 Merrill Lynch (Singapore) Pte Ltd 1,593,038 0.21%
16 Kim Eng Securities Pte. Ltd. 1,582,346 0.21%
17 Ng Say Ban 1,500,000 0.20%
18 G Pannir Selvam 1,000,000 0.13%
19 Superbowl Holdings Limited 1,000,000 0.13%
20 Land Transport Authority Of Singapore 835,000 0.11%
Total 699,077,510 91.08%
STATISTICS OF UNITHOLDERSAS AT 11 NOVEMBER 2010
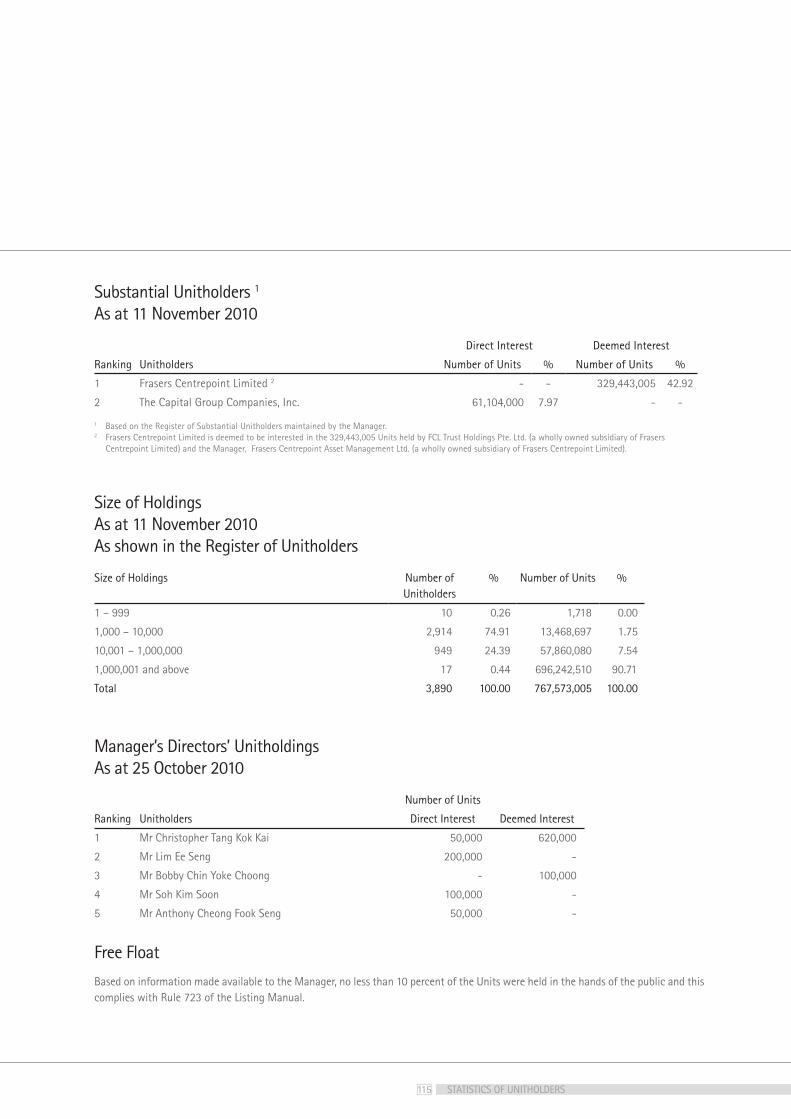
115
Substantial Unitholders 1 As at 11 November 2010
Direct Interest Deemed Interest
Ranking Unitholders Number of Units % Number of Units %
1 Frasers Centrepoint Limited 2 - - 329,443,005 42.92
2 The Capital Group Companies, Inc. 61,104,000 7.97 - -
1 Based on the Register of Substantial Unitholders maintained by the Manager.2 Frasers Centrepoint Limited is deemed to be interested in the 329,443,005 Units held by FCL Trust Holdings Pte. Ltd. (a wholly owned subsidiary of Frasers Centrepoint Limited) and the Manager, Frasers Centrepoint Asset Management Ltd. (a wholly owned subsidiary of Frasers Centrepoint Limited).
Size of Holdings As at 11 November 2010 As shown in the Register of Unitholders
Size of Holdings Number of Unitholders
% Number of Units %
1 – 999 10 0.26 1,718 0.00
1,000 – 10,000 2,914 74.91 13,468,697 1.75
10,001 – 1,000,000 949 24.39 57,860,080 7.54
1,000,001 and above 17 0.44 696,242,510 90.71
Total 3,890 100.00 767,573,005 100.00
Manager’s Directors’ UnitholdingsAs at 25 October 2010
Number of Units
Ranking Unitholders Direct Interest Deemed Interest
1 Mr Christopher Tang Kok Kai 50,000 620,000
2 Mr Lim Ee Seng 200,000 -
3 Mr Bobby Chin Yoke Choong - 100,000
4 Mr Soh Kim Soon 100,000 -
5 Mr Anthony Cheong Fook Seng 50,000 -
Free Float
Based on information made available to the Manager, no less than 10 percent of the Units were held in the hands of the public and this complies with Rule 723 of the Listing Manual.
STATISTICS OF UNITHOLDERS
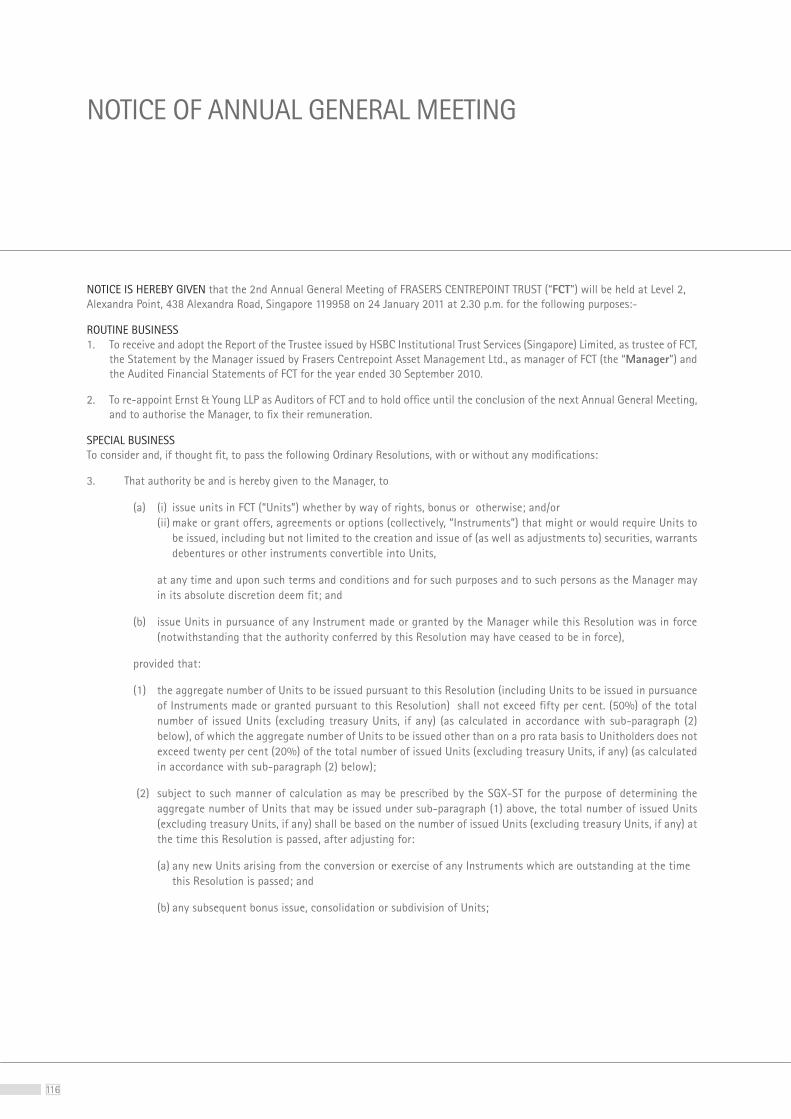
116116
NOTICE OF ANNUAL GENERAL MEETING
NOTICE IS HEREBY GIVEN that the 2nd Annual General Meeting of FRASERS CENTREPOINT TRUST (“FCT”) will be held at Level 2, Alexandra Point, 438 Alexandra Road, Singapore 119958 on 24 January 2011 at 2.30 p.m. for the following purposes:-
ROUTINE BUSINESS 1. To receive and adopt the Report of the Trustee issued by HSBC Institutional Trust Services (Singapore) Limited, as trustee of FCT,
the Statement by the Manager issued by Frasers Centrepoint Asset Management Ltd., as manager of FCT (the “Manager”) and the Audited Financial Statements of FCT for the year ended 30 September 2010.
2. To re-appoint Ernst & Young LLP as Auditors of FCT and to hold office until the conclusion of the next Annual General Meeting, and to authorise the Manager, to fix their remuneration.
SPECIAL BUSINESSTo consider and, if thought fit, to pass the following Ordinary Resolutions, with or without any modifications:
3. That authority be and is hereby given to the Manager, to
(a) (i) issue units in FCT (“Units”) whether by way of rights, bonus or otherwise; and/or (ii) make or grant offers, agreements or options (collectively, “Instruments”) that might or would require Units to be issued, including but not limited to the creation and issue of (as well as adjustments to) securities, warrants debentures or other instruments convertible into Units,
at any time and upon such terms and conditions and for such purposes and to such persons as the Manager may in its absolute discretion deem fit; and
(b) issue Units in pursuance of any Instrument made or granted by the Manager while this Resolution was in force (notwithstanding that the authority conferred by this Resolution may have ceased to be in force),
provided that:
(1) the aggregate number of Units to be issued pursuant to this Resolution (including Units to be issued in pursuance of Instruments made or granted pursuant to this Resolution) shall not exceed fifty per cent. (50%) of the total number of issued Units (excluding treasury Units, if any) (as calculated in accordance with sub-paragraph (2) below), of which the aggregate number of Units to be issued other than on a pro rata basis to Unitholders does not exceed twenty per cent (20%) of the total number of issued Units (excluding treasury Units, if any) (as calculated in accordance with sub-paragraph (2) below);
(2) subject to such manner of calculation as may be prescribed by the SGX-ST for the purpose of determining the aggregate number of Units that may be issued under sub-paragraph (1) above, the total number of issued Units (excluding treasury Units, if any) shall be based on the number of issued Units (excluding treasury Units, if any) at the time this Resolution is passed, after adjusting for:
(a) any new Units arising from the conversion or exercise of any Instruments which are outstanding at the time this Resolution is passed; and
(b) any subsequent bonus issue, consolidation or subdivision of Units;
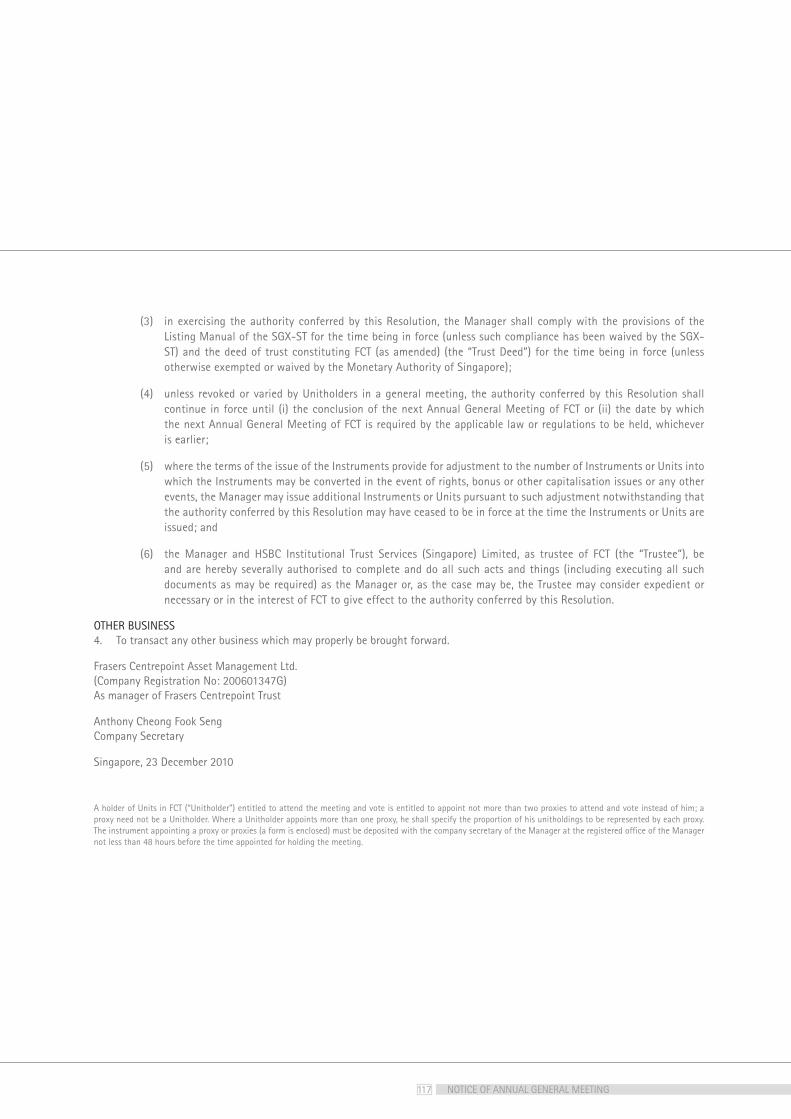
117
(3) in exercising the authority conferred by this Resolution, the Manager shall comply with the provisions of the Listing Manual of the SGX-ST for the time being in force (unless such compliance has been waived by the SGX-ST) and the deed of trust constituting FCT (as amended) (the “Trust Deed”) for the time being in force (unless otherwise exempted or waived by the Monetary Authority of Singapore);
(4) unless revoked or varied by Unitholders in a general meeting, the authority conferred by this Resolution shall continue in force until (i) the conclusion of the next Annual General Meeting of FCT or (ii) the date by which the next Annual General Meeting of FCT is required by the applicable law or regulations to be held, whichever is earlier;
(5) where the terms of the issue of the Instruments provide for adjustment to the number of Instruments or Units into which the Instruments may be converted in the event of rights, bonus or other capitalisation issues or any other events, the Manager may issue additional Instruments or Units pursuant to such adjustment notwithstanding that the authority conferred by this Resolution may have ceased to be in force at the time the Instruments or Units are issued; and
(6) the Manager and HSBC Institutional Trust Services (Singapore) Limited, as trustee of FCT (the “Trustee”), be and are hereby severally authorised to complete and do all such acts and things (including executing all such documents as may be required) as the Manager or, as the case may be, the Trustee may consider expedient or necessary or in the interest of FCT to give effect to the authority conferred by this Resolution.
OTHER BUSINESS4. To transact any other business which may properly be brought forward.
Frasers Centrepoint Asset Management Ltd. (Company Registration No: 200601347G) As manager of Frasers Centrepoint Trust
Anthony Cheong Fook Seng Company Secretary
Singapore, 23 December 2010
A holder of Units in FCT (“Unitholder”) entitled to attend the meeting and vote is entitled to appoint not more than two proxies to attend and vote instead of him; a proxy need not be a Unitholder. Where a Unitholder appoints more than one proxy, he shall specify the proportion of his unitholdings to be represented by each proxy. The instrument appointing a proxy or proxies (a form is enclosed) must be deposited with the company secretary of the Manager at the registered office of the Manager not less than 48 hours before the time appointed for holding the meeting.
NOTICE OF ANNUAL GENERAL MEETING
Explanatory Notes:
Resolution 3
The Ordinary Resolution 3 above, if passed, will empower the Manager from the date of this Annual General Meeting until the date of the next Annual General Meeting, to issue Units and to make or grant instruments (such as securities, warrants or debentures) convertible into Units and issue Units pursuant to such instruments, up to a number not exceeding 50% of the total number of issued Units (excluding treasury Units, if any), of which up to 20% may be issued other than on a pro rata basis to Unitholders.
For determining the aggregate number of Units that may be issued, the percentage of issued Units will be calculated based on the issued Units at the time the Ordinary Resolution 3 above is passed, after adjusting for new Units arising from the conversion or exercise of any Instruments which are outstanding at the time this Resolution is passed and any subsequent bonus issue, consolidation or subdivision of Units.
Fund raising by issuance of new units may be required in instances of property acquisitions or debt repayments. In any event, if the approval of Unitholders is required under the Listing Manual of the SGX-ST and the Trust Deed or any applicable laws and regulations in such instances, the Manager will then obtain the approval of Unitholders accordingly.
Important Notice
The value of Units and the income derived from them, if any, may fall or rise. Units are not obligations of, deposits in, or guaranteed by, the Manager or any of its affiliates. An investment in Units is subject to investment risks, including the possible loss of the principal amount invested.
Investors should note that they will have no right to request the Manager to redeem or purchase their Units for so long as the Units are listed on the SGX-ST. It is intended that Unitholders may only deal in their Units through trading on the SGX-ST. The listing of the Units on the SGX-ST does not guarantee a liquid market for the Units.
The past performance of FCT is not necessarily indicative of the future performance of FCT.
NOTICE OF ANNUAL GENERAL MEETING
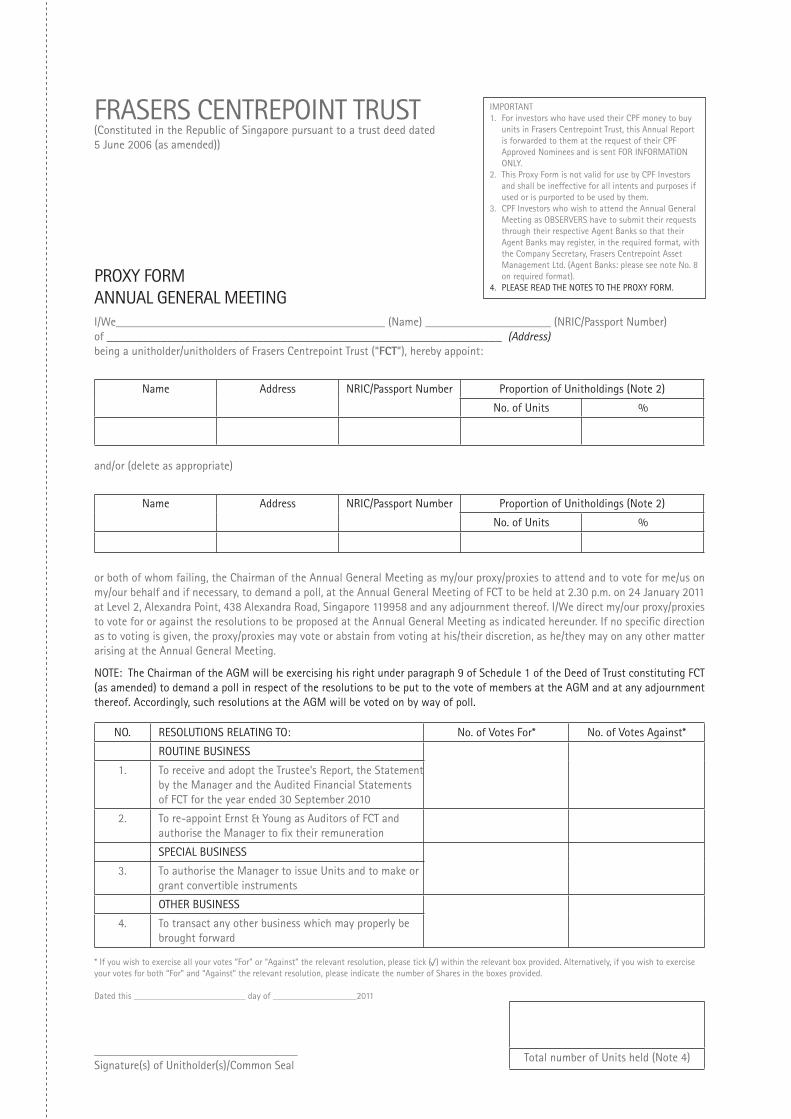
PROXY FORM ANNUAL GENERAL MEETING I/We_____________________________________________ (Name) _____________________ (NRIC/Passport Number) of __________________________________________________________________ (Address)being a unitholder/unitholders of Frasers Centrepoint Trust (“FCT”), hereby appoint:
Name Address NRIC/Passport Number Proportion of Unitholdings (Note 2)
No. of Units %
and/or (delete as appropriate)
Name Address NRIC/Passport Number Proportion of Unitholdings (Note 2)
No. of Units %
or both of whom failing, the Chairman of the Annual General Meeting as my/our proxy/proxies to attend and to vote for me/us on my/our behalf and if necessary, to demand a poll, at the Annual General Meeting of FCT to be held at 2.30 p.m. on 24 January 2011 at Level 2, Alexandra Point, 438 Alexandra Road, Singapore 119958 and any adjournment thereof. I/We direct my/our proxy/proxies to vote for or against the resolutions to be proposed at the Annual General Meeting as indicated hereunder. If no specific direction as to voting is given, the proxy/proxies may vote or abstain from voting at his/their discretion, as he/they may on any other matter arising at the Annual General Meeting.
NOTE: The Chairman of the AGM will be exercising his right under paragraph 9 of Schedule 1 of the Deed of Trust constituting FCT (as amended) to demand a poll in respect of the resolutions to be put to the vote of members at the AGM and at any adjournment thereof. Accordingly, such resolutions at the AGM will be voted on by way of poll.
NO. RESOLUTIONS RELATING TO: No. of Votes For* No. of Votes Against*
ROUTINE BUSINESS
1. To receive and adopt the Trustee’s Report, the Statement by the Manager and the Audited Financial Statements of FCT for the year ended 30 September 2010
2. To re-appoint Ernst & Young as Auditors of FCT and authorise the Manager to fix their remuneration
SPECIAL BUSINESS
3. To authorise the Manager to issue Units and to make or grant convertible instruments
OTHER BUSINESS
4. To transact any other business which may properly be brought forward
* If you wish to exercise all your votes “For” or “Against” the relevant resolution, please tick ( ) within the relevant box provided. Alternatively, if you wish to exercise your votes for both “For” and “Against” the relevant resolution, please indicate the number of Shares in the boxes provided.
Dated this ________________________ day of __________________2011
__________________________________ Signature(s) of Unitholder(s)/Common Seal
FRASERS CENTREPOINT TRUST (Constituted in the Republic of Singapore pursuant to a trust deed dated 5 June 2006 (as amended))
IMPORTANT1. For investors who have used their CPF money to buy
units in Frasers Centrepoint Trust, this Annual Report is forwarded to them at the request of their CPF Approved Nominees and is sent FOR INFORMATION ONLY.
2. This Proxy Form is not valid for use by CPF Investors and shall be ineffective for all intents and purposes if used or is purported to be used by them.
3. CPF Investors who wish to attend the Annual General Meeting as OBSERVERS have to submit their requests through their respective Agent Banks so that their Agent Banks may register, in the required format, with the Company Secretary, Frasers Centrepoint Asset Management Ltd. (Agent Banks: please see note No. 8 on required format).
4. PLEASE READ THE NOTES TO THE PROXY FORM.
Total number of Units held (Note 4)
fold and seal here
fold here
IMPORTANT: PLEASE READ THE NOTES TO PROXY FORM BELOWNotes To Proxy Form 1. A unitholder of FCT (“Unitholder”) entitled to attend and vote at the meeting is entitled to appoint one or two proxies to attend and vote in his stead. A proxy need not
be a Unitholder. The instrument appointing a proxy or proxies must be deposited with the Company Secretary of the Manager at its registered office at 438 Alexandra Road, #21-00 Alexandra Point, Singapore 119958, not less than 48 hours before the time appointed for holding the meeting.
2. Where a Unitholder appoints more than one proxy, the appointments shall be invalid unless he specifies the proportion of his holding (expressed as a percentage of the whole) to be represented by each proxy.
3. Completion and return of this instrument appointing a proxy or proxies shall not preclude a member from attending and voting at the meeting. Any appointment of a proxy or proxies shall be deemed to be revoked if a member attends the meeting in person, and in such event, the Manager reserves the right to refuse to admit any person or persons appointed under this instrument of proxy, to the meeting.
4. A Unitholder should insert the total number of Units held. If the Unitholder has Units entered against his name in the Depository Register maintained by the Central Depository (Pte) Limited (“CDP”), he should insert that number of Units. If the Unitholder has Units registered in his name in the Register of Unitholders of FCT, he should insert that number of Units. If the Unitholder has Units entered against his name in the said Depository Register and registered in his name in the Register of Unitholders, he should insert the aggregate number of Units. If no number is inserted, this form of proxy will be deemed to relate to all the Units held by the Unitholder.
5. The instrument appointing a proxy or proxies must be under the hand of the appointor or of his attorney duly authorised in writing. Where the instrument appointing a proxy or proxies is executed by a corporation, it must be executed either under its common seal or under the hand of its attorney or a duly authorised officer.
6. Where an instrument appointing a proxy or proxies is signed on behalf of the appointor by an attorney, the power of attorney or a duly certified copy thereof must (failing previous registration with the Manager) be lodged with the instrument of proxy, failing which the instrument may be treated as invalid.
7. The Manager shall be entitled to reject a Proxy Form which is incomplete, improperly completed or illegible or where the true intentions of the appointor are not ascertainable from the instructions of the appointor specified on and/or attached to the Proxy Form. In addition, in the case of Units entered in the Depository Register, the Manager may reject a Proxy Form if the Unitholder, being the appointor, is not shown to have Units entered against his name in the Depository Register as at 48 hours before the time appointed for holding the meeting, as certified by CDP to the Manager.
8. Agent Banks acting on the request of CPF investors who wish to attend the meeting as Observers are required to submit in writing, a list with details of the investors’ name, NRIC/Passport numbers, addresses and numbers of Units held. The list, signed by an authorised signatory of the Agent Bank, should reach the Company Secretary, at the registered office of the Manager not later than 48 hours before the time appointed for holding the meeting.
fold here
The Company SecretaryFrasers Centrepoint Asset Management Ltd.(as manager of Frasers Centrepoint Trust)
438 Alexandra Road #21-00 Alexandra Point
Singapore 119958
Affix Postage Stamp
CORPORATE INFORMATION
FRASERS CENTREPOINT TRUST REGISTERED ADDRESS
HSBC Institutional Trust Services (Singapore) Limited 21 Collyer Quay #14-01 HSBC Building Singapore 049320 Phone: (65) 6534-1900 Fax: (65) 6533-1077
WEBSITE ADDRESS
www.fraserscentrepointtrust.com
TRUSTEE
HSBC Institutional Trust Services(Singapore) Limited21 Collyer Quay #14-01HSBC BuildingSingapore 049320Phone: (65) 6534-1900Fax: (65) 6533-1077
AUDITOR
Ernst & Young LLPPartner-in-charge: Mr Liew Choon Wai(since financial year 2007)One Raffles QuayLevel 18 North TowerSingapore 048583Phone: (65) 6535-7777Fax: (65) 6532-7662
BANKERS
DBS Bank LtdOversea-Chinese Banking Corporation LtdCitibank, N.A., Singapore BranchStandard Chartered Bank
UNIT REGISTRAR
Boardroom Corporate & Advisory Services Pte Ltd50 Raffles Place#32-01 Singapore Land TowerSingapore 048623Phone: (65) 6536-5355Fax: (65) 6536-1360
THE MANAGER REGISTERED ADDRESS
Frasers Centrepoint AssetManagement Ltd438 Alexandra Road#21-00 Alexandra PointSingapore 119958Phone: (65) 6276-4882Fax: (65) 6272-8776
DIRECTORS OF THE MANAGER
Mr Philip Eng Heng Nee Independent Non-Executive Chairman
Dr Chew Tuan Chiong CEO and Executive Director
Mr Anthony Cheong Fook Seng Non-Executive Director
Mr Chia Khong Shoong Non-Executive Director
Mr Bobby Chin Yoke Choong Independent Non-Executive Director
Mr Lim Ee Seng Non-Executive Director
Mr Soh Kim Soon Independent Non-Executive Director
Mr Christopher Tang Kok Kai Non-Executive Director
AUDIT COMMITTEE
Mr Bobby Chin Yoke Choong (Chairman)Mr Anthony Cheong Fook SengMr Soh Kim Soon
COMPANY SECRETARY
Mr Anthony Cheong Fook Seng
The Frasers Centrepoint Trust 2010 Annual Report is printed on 9lives™ recycled paper, which is a Forest Stewardship Council (FSC) certified paper.
This print production saved 49 matured trees, 75,000 litres of water and 11,800 kilowatt-hour of electricity.
FCT is committed to environmental conservation and supports environmentally-friendly production processes.
Frasers Centrepoint Asset Management Ltd
Company Registration Number: 200601347G438 Alexandra Road, #21-00 Alexandra Point, Singapore 119958Phone: (65) 6276-4882Fax: (65) 6272-8776www.fraserscentrepointtrust.com