Embed Size (px)
Citation preview
1F.C. Lemus
COMMUNITY CORRELATES OF BACTERIAL PNEUMONIA
HOSPITALIZATIONS, 65+, TEXAS BORDER COUNTIES
Frank C. Lemus, M.A., Predoctoral Student, Alai Tan, M.D., Ph.D., Carlos Reyes-Ortiz, M.D., Ph.D., Daniel
H. Freeman Jr., Ph.D., Jean L. Freeman, Ph.D.
APHA 134th Annual Meeting and ExpositionNovember 4-8, 2006
Boston, MA

2F.C. Lemus
ABSTRACT
We estimated baseline hospitalization rates in the 32 Texas Border Counties toward achieving Healthy Border 2010 Focus Area 1: Improve access to primary care and Focus Area 6: Improve rates of immunization and reduce rates of infectious diseases by tracking Healthy People 2010 Objective 1.9c: Reduce hospitalization rates for the following ambulatory care sensitive condition (ACSC) & Agency on Healthcare Research & Quality (AHRQ) prevention quality indicator (PQI): immunization-preventable bacterial pneumonia-persons aged 65+. Hospitalization rates based on data from Texas Health Care Information Council (THCIC) hospital discharge data system for 3 years 1999, 2000, 2001, & population counts from 2000 U.S. Census.
3F.C. Lemus
PURPOSE
Estimate baseline hospitalization rates for bacterial pneumonia, 65+, Texas Border Counties
Learn if contextual (county) characteristics associated with ACSC & PQI bacterial pneumonia
Methodology to assess progress of Texas Border Counties toward achieving Healthy Border 2010 Focus Areas 1: and 6: and Healthy People 2010 Objective 1.9c.
4F.C. Lemus
AIMS Estimate hospitalization rates for ACSC & PQI
-Immunization preventable bacterial pneumonia (persons 65+)
Identify association of contextual (county) characteristics with bacterial pneumonia hospitalizations
-race/ethnic concentration, income
Study 3 major racial/ethnic groups (non-Hispanic White, Black, Latino)
Target 32 Texas Border Counties defined by La Paz Agreement (1983) and Public Law 103-400 (1994)
5F.C. Lemus
Healthy Border & Healthy People 2010 Overarching Goals
Increase Quality & Years of Healthy Life
– Help individuals of all ages increase life
expectancy and improve their quality of life
Eliminate Health Disparities
– Eliminate health disparities among different
segments of the population
6F.C. Lemus
United States–Mexico Border Region
Legally defined by La Paz Agreement (1983) and Public Law 103-400
2000 mile long (California/Baja California to Texas/Tamaulipas)
62 miles (100 kilometers) within either side of United States and Mexico
1,248 mile Texas/Mexico border
Rio Grande River one of most polluted rivers in North America, and primary source of drinking water for many border communities.
7F.C. Lemus
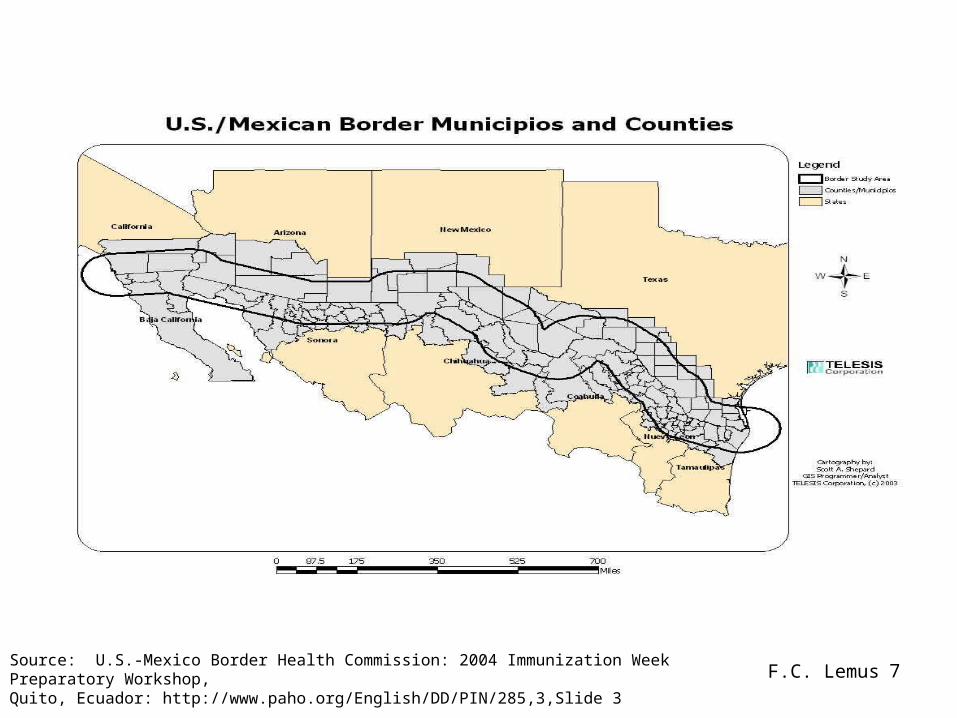
Source: U.S.-Mexico Border Health Commission: 2004 Immunization Week Preparatory Workshop, Quito, Ecuador: http://www.paho.org/English/DD/PIN/285,3,Slide 3
8F.C. Lemus
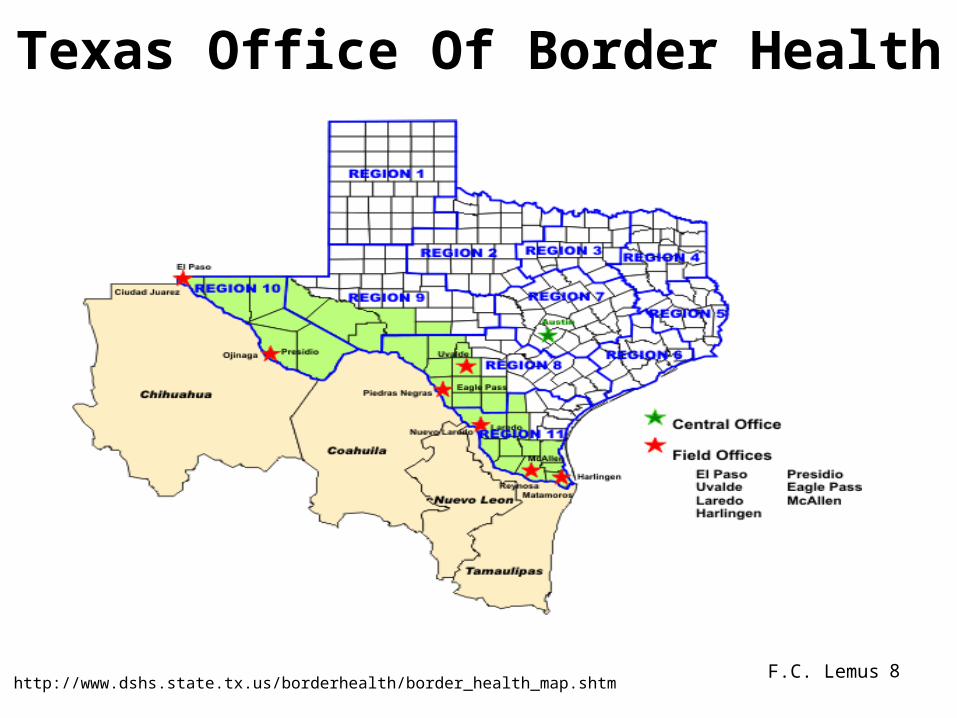
Texas Office Of Border Health
http://www.dshs.state.tx.us/borderhealth/border_health_map.shtm
9F.C. Lemus
Border FactsLatinos 41% of border population, without San Diego County 71%, (historically permanent home or “in-transition” home)Over 90% border population concentrated in or near 14 sister or twin cities on both sides of borderDouble-digit population growth rate between 1970 and 2000, over 2.7 million to over 6 million36% of Latino border population <18 years compared to 19% of non-Latinos, yet 65+ in US = 12.4%; TX = 9.9%, 32 Border Counties = 13.3%Maquiladoras (assembly plants), NAFTA, Colonias are major influences on border health

10F.C. Lemus
WHY ACSCs/PQIs?
Provide baseline information about a community
Mechanism to evaluate the progress of a community in achieving the goals of Healthy Border 2010 & Healthy People 2010
ACSCs/PQIs based on hospital inpatient data, but provide insight into the quality of the health
care system outside the hospital setting
11F.C. Lemus
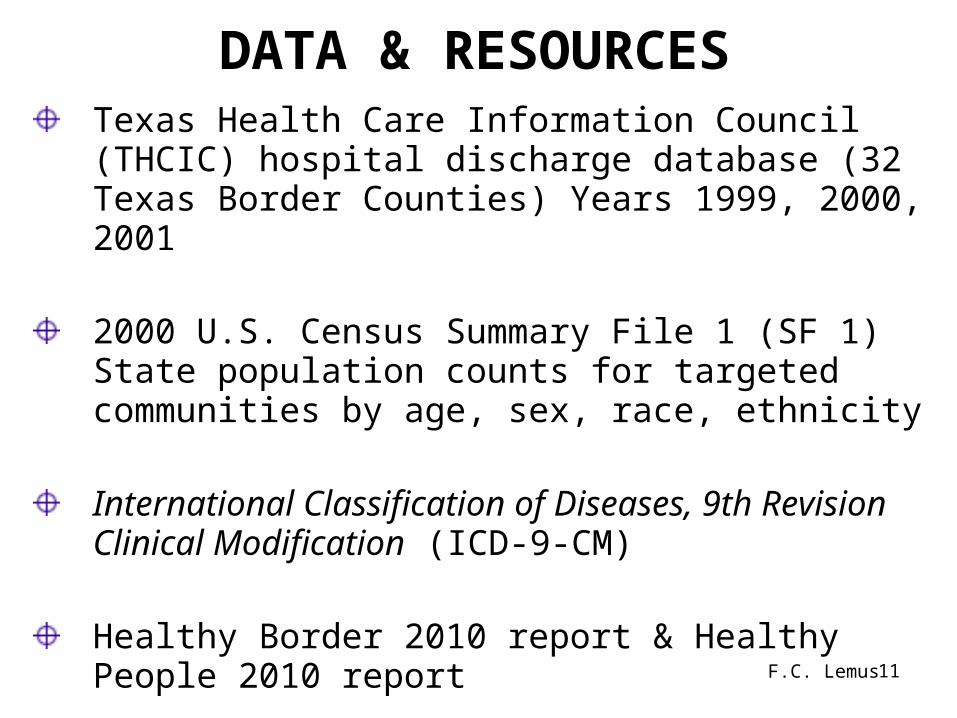
DATA & RESOURCESTexas Health Care Information Council (THCIC) hospital discharge database (32 Texas Border Counties) Years 1999, 2000, 2001
2000 U.S. Census Summary File 1 (SF 1) State population counts for targeted communities by age, sex, race, ethnicity
International Classification of Diseases, 9th Revision Clinical Modification (ICD-9-CM)
Healthy Border 2010 report & Healthy People 2010 report
12F.C. Lemus
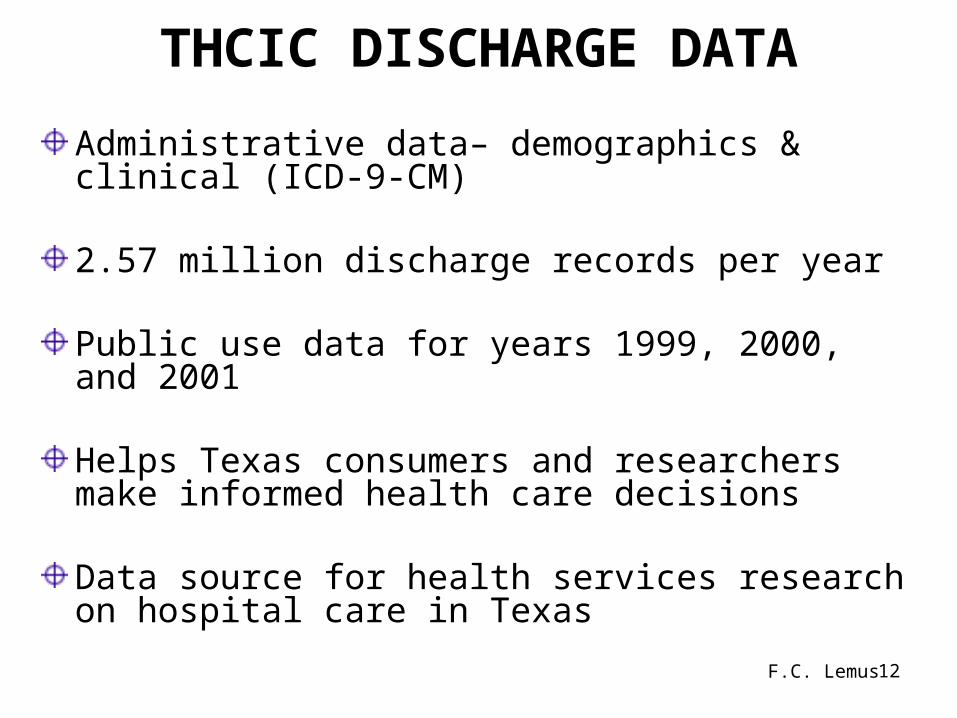
THCIC DISCHARGE DATA
Administrative data– demographics & clinical (ICD-9-CM)
2.57 million discharge records per year
Public use data for years 1999, 2000, and 2001
Helps Texas consumers and researchers make informed health care decisions
Data source for health services research on hospital care in Texas
13F.C. Lemus
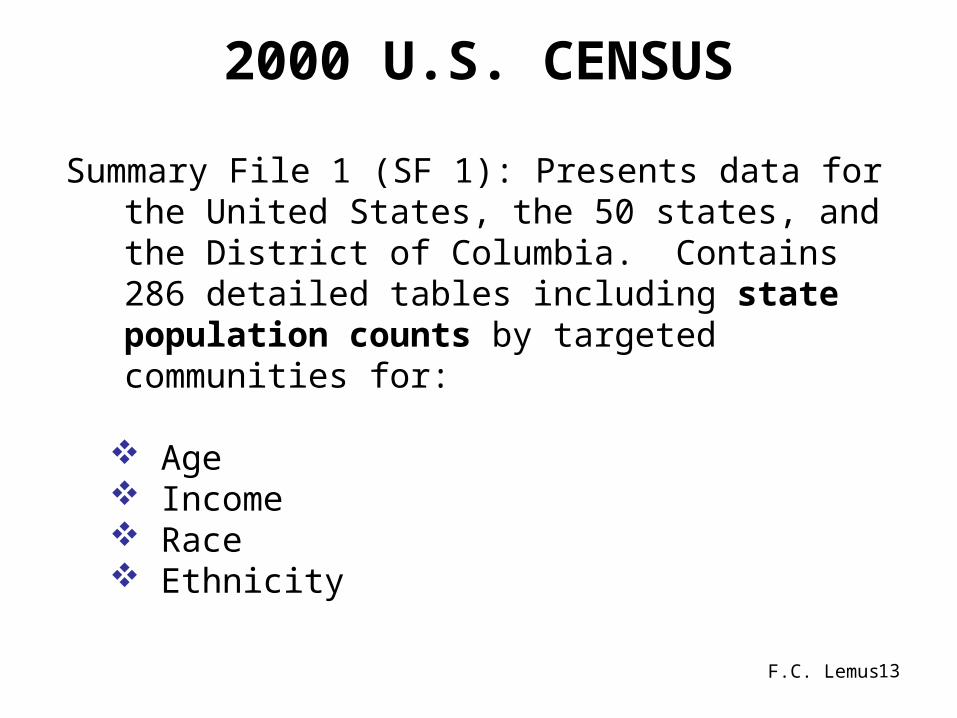
2000 U.S. CENSUS
Summary File 1 (SF 1): Presents data for the United States, the 50 states, and the District of Columbia. Contains 286 detailed tables including state population counts by targeted communities for:
Age Income Race Ethnicity
14F.C. Lemus
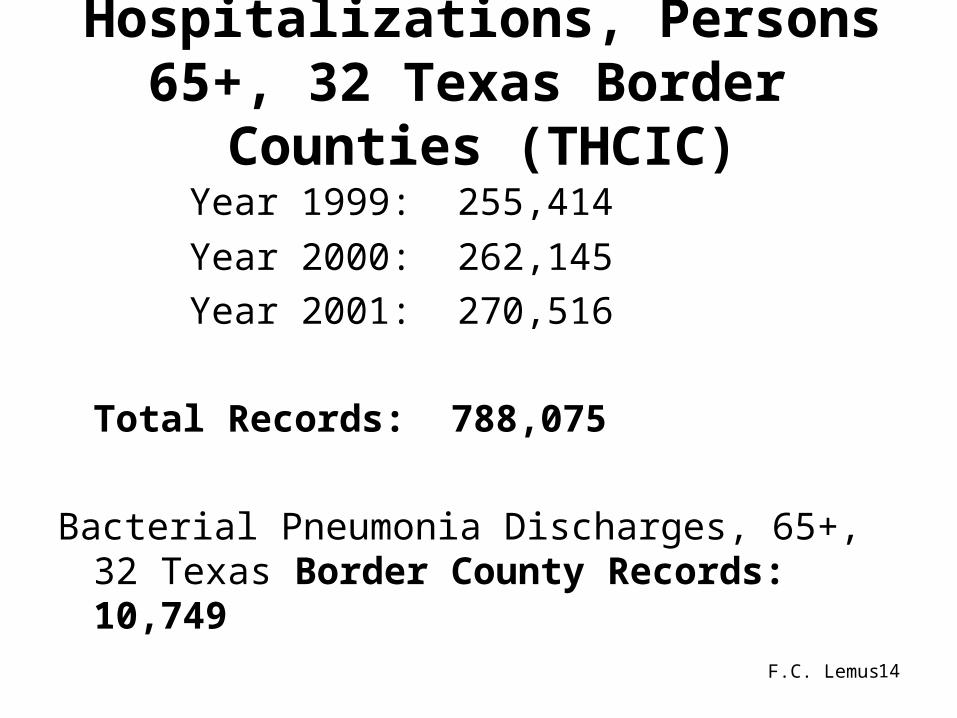
Hospitalizations, Persons 65+, 32 Texas Border Counties (THCIC)
Year 1999: 255,414
Year 2000: 262,145
Year 2001: 270,516
Total Records: 788,075
Bacterial Pneumonia Discharges, 65+, 32 Texas Border County Records: 10,749
15F.C. Lemus
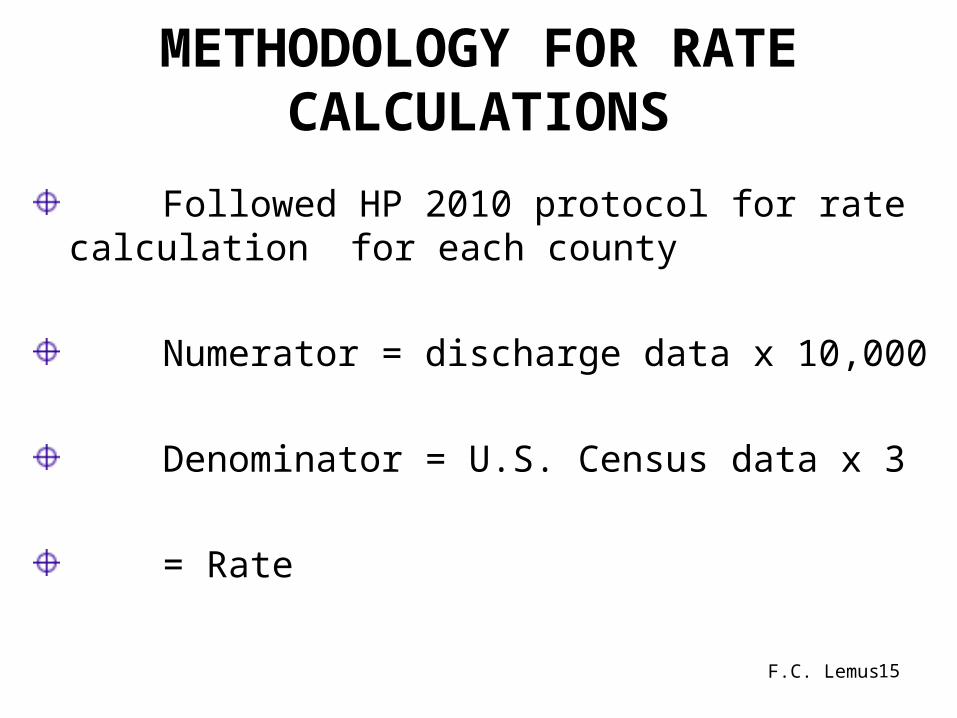
METHODOLOGY FOR RATE CALCULATIONS
Followed HP 2010 protocol for rate calculation for each county
Numerator = discharge data x 10,000
Denominator = U.S. Census data x 3
= Rate
16F.C. Lemus
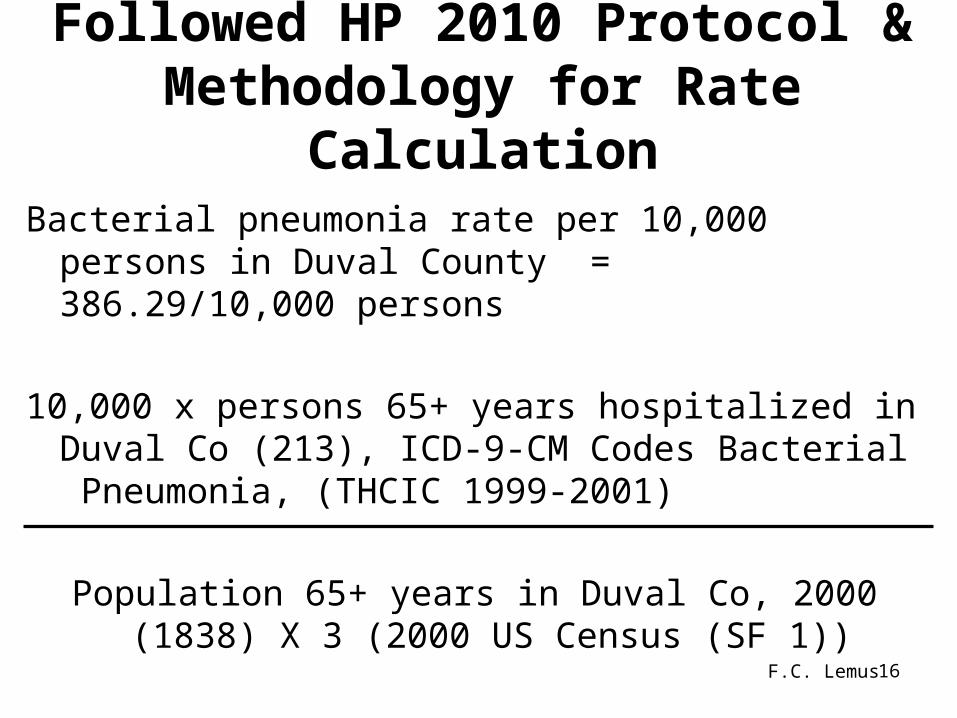
Followed HP 2010 Protocol & Methodology for Rate Calculation
Bacterial pneumonia rate per 10,000 persons in Duval County = 386.29/10,000 persons
10,000 x persons 65+ years hospitalized in Duval Co (213), ICD-9-CM Codes Bacterial Pneumonia, (THCIC 1999-2001)
Population 65+ years in Duval Co, 2000 (1838) X 3 (2000 US Census (SF 1))
17F.C. Lemus
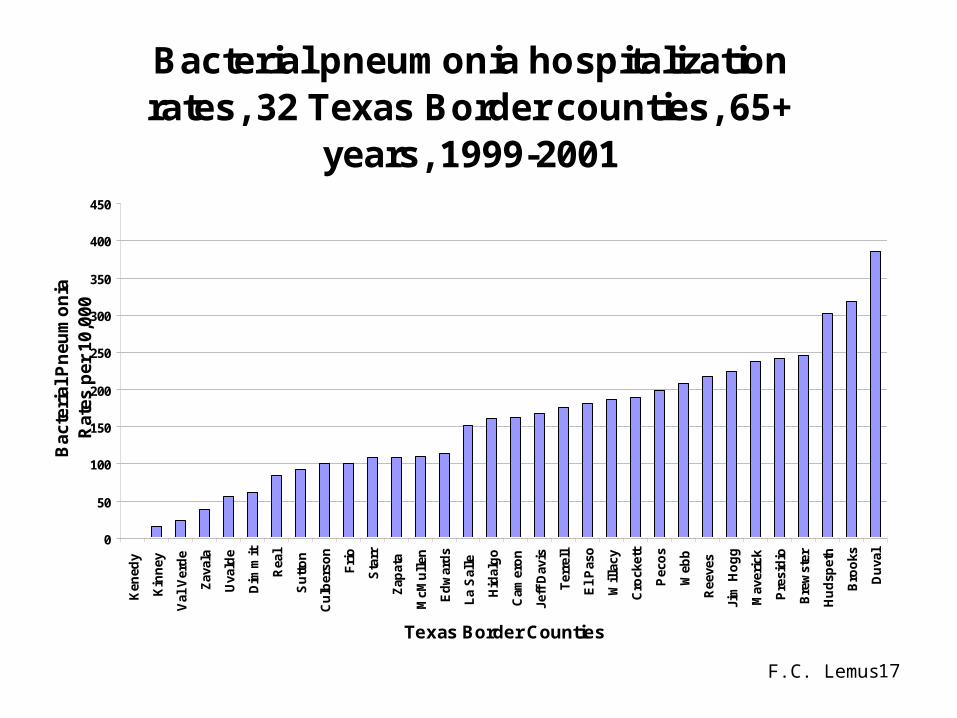
Bacterial pneumonia hospitalization rates, 32 Texas Border counties, 65+
years, 1999-2001
0
50
100
150
200
250
300
350
400
450
Ken
edy
Kin
ney
Val
Ver
de
Zav
ala
Uva
lde
Dim
mit
Rea
l
Su
tto
n
Cu
lber
son
Fri
o
Sta
rr
Zap
ata
McM
ull
en
Ed
war
ds
La
Sal
le
Hid
alg
o
Cam
ero
n
Jeff
Dav
is
Ter
rell
El
Pas
o
Wil
lacy
Cro
cket
t
Pec
os
Web
b
Ree
ves
Jim
Ho
gg
Mav
eric
k
Pre
sid
io
Bre
wst
er
Hu
dsp
eth
Bro
oks
Du
val
Texas Border Counties
Bac
teri
al P
neu
mo
nia
R
ates
per
10,
000
18F.C. Lemus
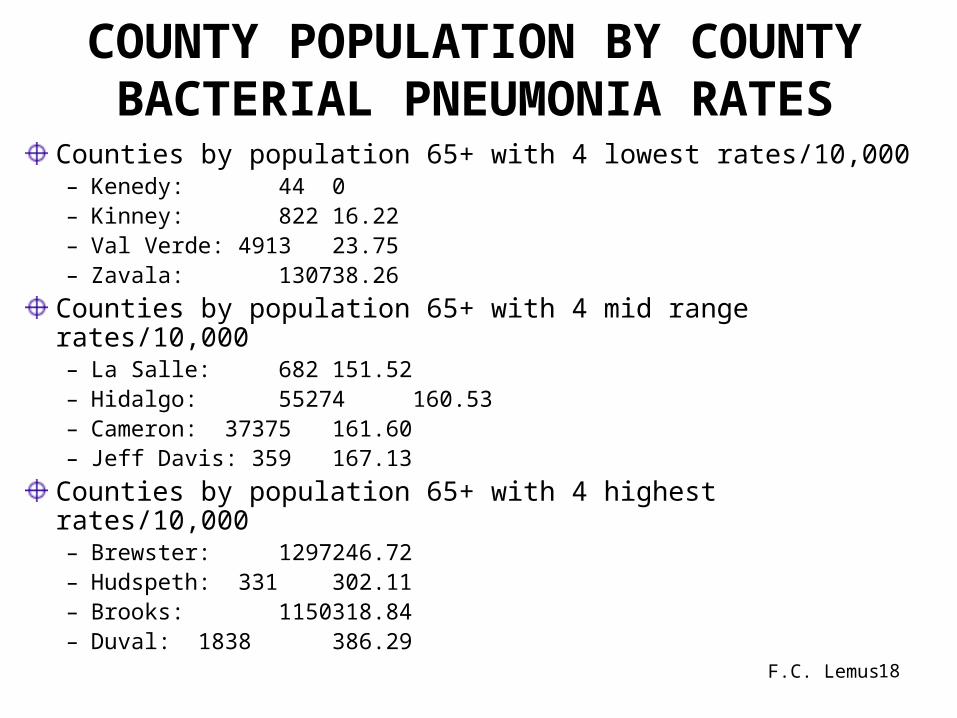
COUNTY POPULATION BY COUNTY BACTERIAL PNEUMONIA RATES
Counties by population 65+ with 4 lowest rates/10,000– Kenedy: 44 0– Kinney: 822 16.22 – Val Verde: 4913 23.75– Zavala: 1307 38.26
Counties by population 65+ with 4 mid range rates/10,000– La Salle: 682 151.52– Hidalgo: 55274 160.53– Cameron: 37375 161.60– Jeff Davis: 359 167.13
Counties by population 65+ with 4 highest rates/10,000– Brewster: 1297 246.72– Hudspeth: 331 302.11– Brooks: 1150 318.84– Duval: 1838 386.29
19F.C. Lemus
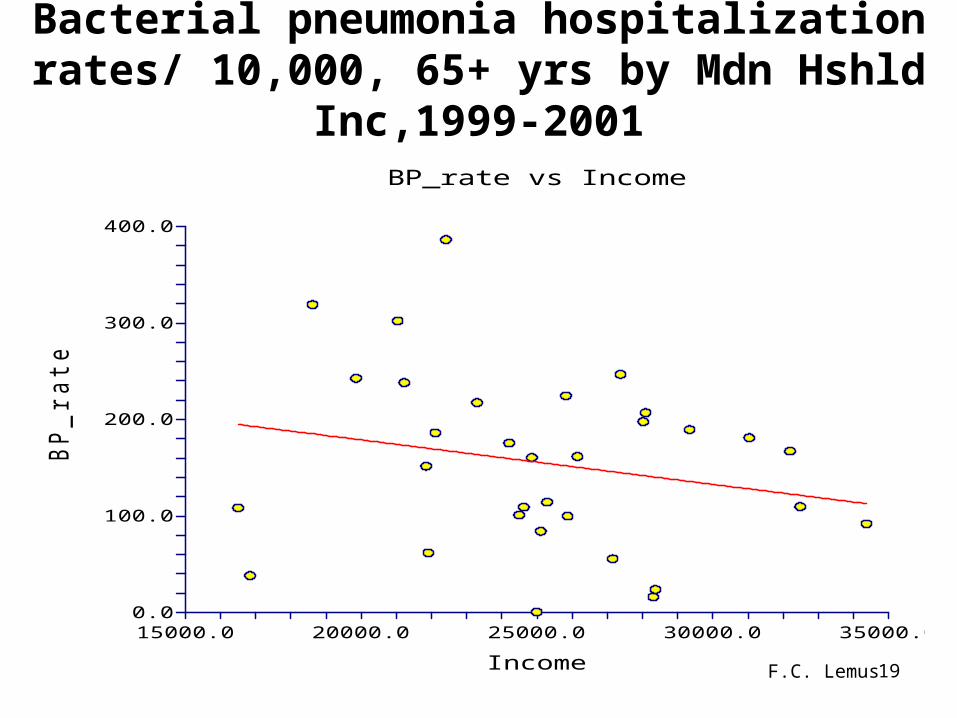
Bacterial pneumonia hospitalization rates/ 10,000, 65+ yrs by Mdn Hshld Inc,1999-2001
0.0
100.0
200.0
300.0
400.0
15000.0 20000.0 25000.0 30000.0 35000.0
BP_rate vs Income
Income
BP
_ra
te
20F.C. Lemus
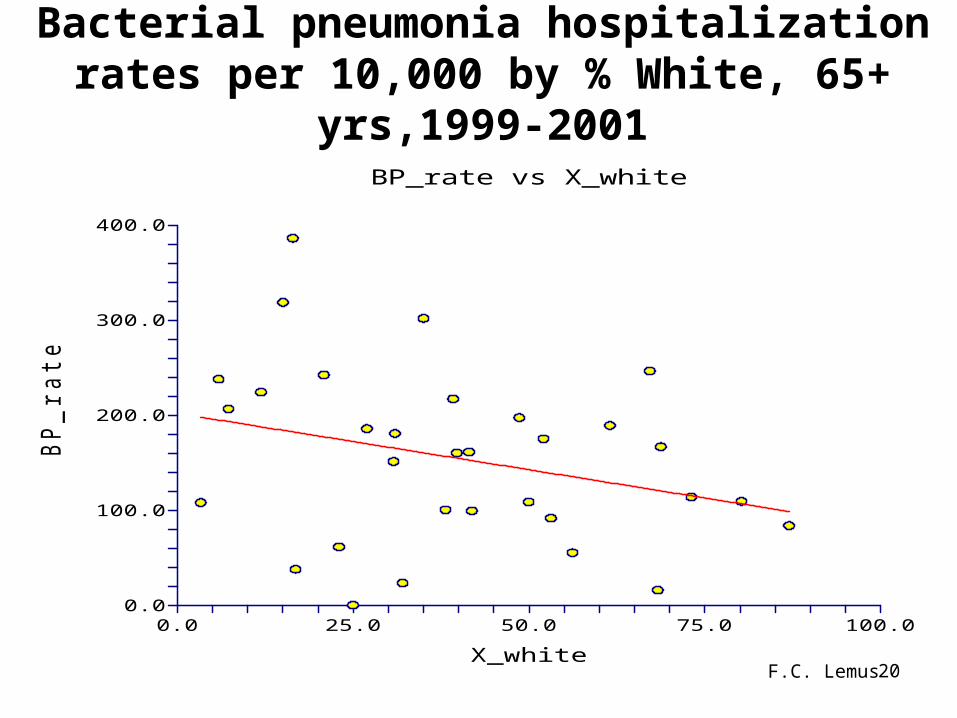
Bacterial pneumonia hospitalization rates per 10,000 by % White, 65+ yrs,1999-2001
0.0
100.0
200.0
300.0
400.0
0.0 25.0 50.0 75.0 100.0
BP_rate vs X_white
X_white
BP
_ra
te

21F.C. Lemus
Bacterial pneumonia hospitalization rates per 10,000 by % Hispanic, 65+ yrs,1999-2001
0.0
100.0
200.0
300.0
400.0
0.0 25.0 50.0 75.0 100.0
BP_rate vs X__hispanic
X__hispanic
BP
_ra
te
22F.C. Lemus
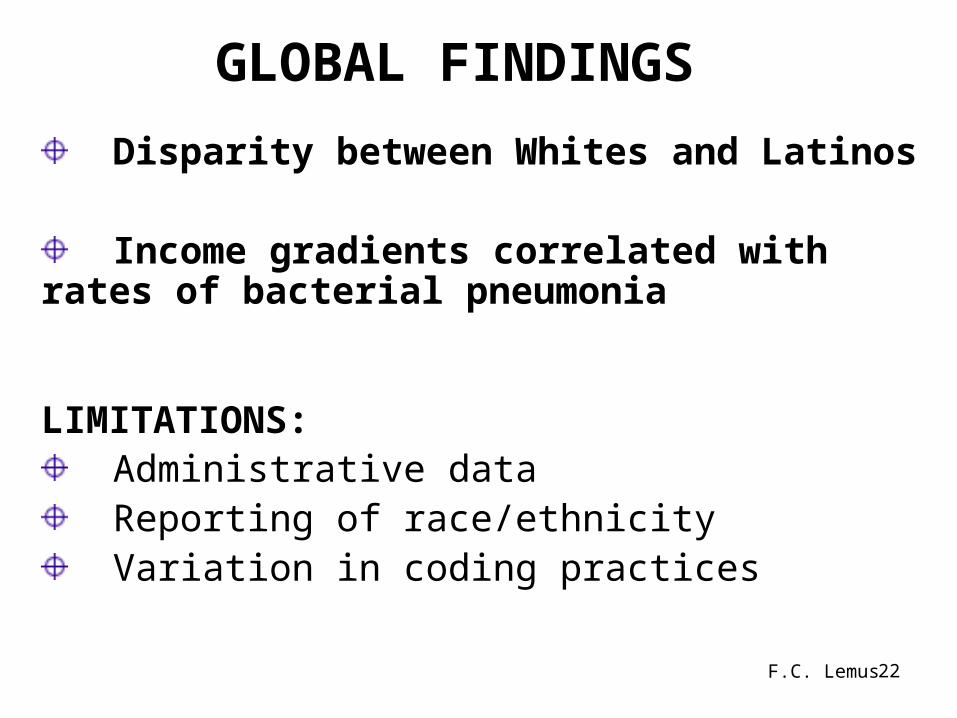
GLOBAL FINDINGS
Disparity between Whites and Latinos
Income gradients correlated with rates of bacterial pneumonia
LIMITATIONS: Administrative data Reporting of race/ethnicity Variation in coding practices
23F.C. Lemus
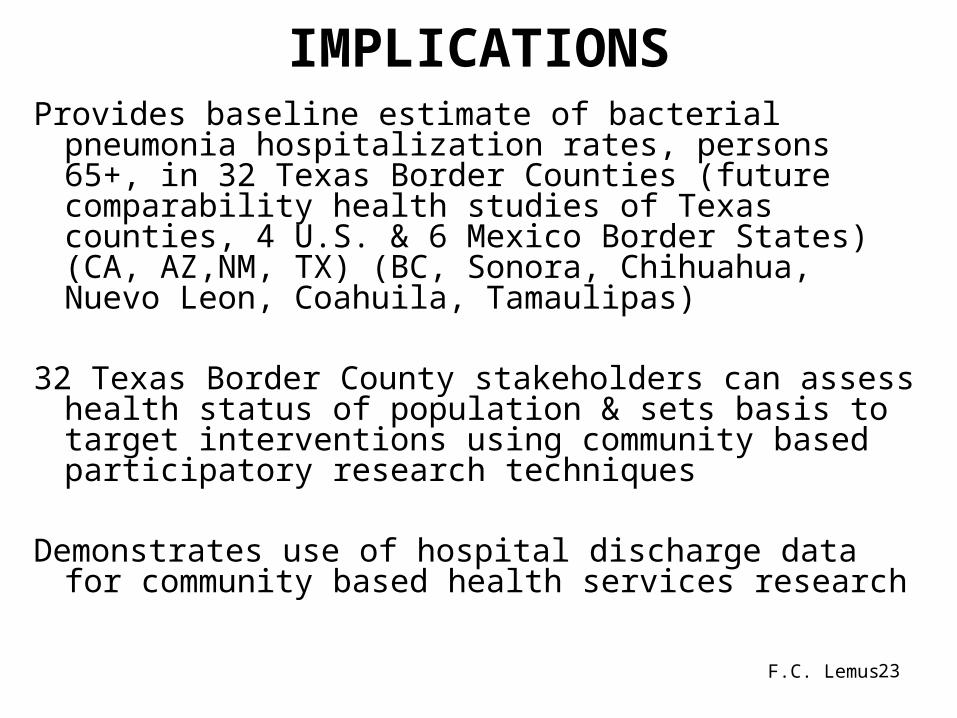
IMPLICATIONSProvides baseline estimate of bacterial pneumonia
hospitalization rates, persons 65+, in 32 Texas Border Counties (future comparability health studies of Texas counties, 4 U.S. & 6 Mexico Border States) (CA, AZ,NM, TX) (BC, Sonora, Chihuahua, Nuevo Leon, Coahuila, Tamaulipas)
32 Texas Border County stakeholders can assess health status of population & sets basis to target interventions using community based participatory research techniques
Demonstrates use of hospital discharge data for community based health services research
24F.C. Lemus
DIRECTIONSExtend baseline estimates & analysis of AHRQquality of care indicators - QIs (population health)
bacterial pneumonia hospitalizations (PQI)
pneumonia inpatient mortality (IQI)
all Texas counties
65+, all Texas counties [email protected] 409-762- 5140
Primary Funding Source: University of Texas Medical Branch, Division of Epidemiology and Biostatistics Educational Enhancement Fund.