Embed Size (px)
Citation preview

User manual
Configuration and setup of FB-DP… and FB-HS... with ProfiTrace

2015-07-13
PHOENIX CONTACT 3389_en_A
Configuration and setup of FB-DP… and FB-HS... with ProfiTrace
A
Designation Version Order No.
FB-HS... 2316370
FB-HSB 2316379
FB-HSC 2316371
FB-DP-RPTR 2316373
FB-DP-RPTR/SC 2316374
FB-PA/SC 2316375
User manual
Revision:
This user manual is valid for:

PHOENIX CONTACT
Please observe the following notes
User group of this manual
The use of products described in this manual is oriented exclusively to:
– Qualified electricians or persons instructed by them, who are familiar with applicable
standards and other regulations regarding electrical engineering and, in particular, the
relevant safety concepts.
– Qualified application programmers and software engineers, who are familiar with the
safety concepts of automation technology and applicable standards.
Explanation of symbols used and signal words
How to contact us
Internet Up-to-date information on Phoenix Contact products and our Terms and Conditions can be
found on the Internet at:
phoenixcontact.com
Make sure you always use the latest documentation.
It can be downloaded at:
phoenixcontact.net/products
Subsidiaries If there are any problems that cannot be solved using the documentation, please contact
your Phoenix Contact subsidiary.
Subsidiary contact information is available at phoenixcontact.com.
Published by PHOENIX CONTACT GmbH & Co. KG
Flachsmarktstraße 8
32825 Blomberg
GERMANY
Should you have any suggestions or recommendations for improvement of the contents and
layout of our manuals, please send your comments to:
This is the safety alert symbol. It is used to alert you to potential personal injury
hazards. Obey all safety measures that follow this symbol to avoid possible in-
jury or death.
There are three different categories of personal injury that are indicated with a
signal word.
DANGER This indicates a hazardous situation which, if not avoided, will re-
sult in death or serious injury.
WARNING This indicates a hazardous situation which, if not avoided, could
result in death or serious injury.
CAUTION This indicates a hazardous situation which, if not avoided, could
result in minor or moderate injury.
This symbol together with the signal word NOTE and the accompanying text
alert the reader to a situation which may cause damage or malfunction to the
device, hardware/software, or surrounding property.
This symbol and the accompanying text provide the reader with additional in-
formation or refer to detailed sources of information.
Please observe the following notes
PHOENIX CONTACT
General terms and conditions of use for technical documentation
Phoenix Contact reserves the right to alter, correct, and/or improve the technical documen-
tation and the products described in the technical documentation at its own discretion and
without giving prior notice, insofar as this is reasonable for the user. The same applies to any
technical changes that serve the purpose of technical progress.
The receipt of technical documentation (in particular user documentation) does not consti-
tute any further duty on the part of Phoenix Contact to furnish information on modifications
to products and/or technical documentation. You are responsible to verify the suitability and
intended use of the products in your specific application, in particular with regard to observ-
ing the applicable standards and regulations. All information made available in the technical
data is supplied without any accompanying guarantee, whether expressly mentioned, im-
plied or tacitly assumed.
In general, the provisions of the current standard Terms and Conditions of Phoenix Contact
apply exclusively, in particular as concerns any warranty liability.
This manual, including all illustrations contained herein, is copyright protected. Any
changes to the contents or the publication of extracts of this document is prohibited.
Phoenix Contact reserves the right to register its own intellectual property rights for the
product identifications of Phoenix Contact products that are used here. Registration of such
intellectual property rights by third parties is prohibited.
Other product identifications may be afforded legal protection, even where they may not be
indicated as such.

3389_en_A PHOENIX CONTACT 1
Table of contents
1 FB-HS... system..........................................................................................................................3
1.1 Introduction............................................................................................................ 3
1.2 Connecting a PROFIBUS/PA segment.................................................................. 3
1.2.1 Cable specifications ............................................................................... 4
1.3 Connecting a PROFIBUS/DP segment.................................................................. 5
1.3.1 Screw terminals ..................................................................................... 6
1.3.2 D-SUB 9 connector ................................................................................ 6
1.3.3 Termination switch ................................................................................. 7
1.4 Modes ................................................................................................................... 8
1.4.1 Link mode .............................................................................................. 8
1.4.2 Coupler mode ........................................................................................ 9
1.5 Configuring repeater modules ............................................................................... 9
1.5.1 Customizing the PROFIBUS network (NW0/NW1) ................................ 9
1.5.2 Redundancy (RED) ................................................................................ 9
1.5.3 Hardware or software settings (H/S) .................................................... 10
1.5.4 Testing and commissioning ................................................................. 10
2 Web server ...............................................................................................................................11
2.1 Login ................................................................................................................... 11
2.2 Status .................................................................................................................. 12
2.2.1 System status ...................................................................................... 12
2.2.2 Module status ...................................................................................... 13
2.3 System log........................................................................................................... 14
3 Configuration ............................................................................................................................15
3.1 General configuration .......................................................................................... 15
3.2 Network ............................................................................................................... 16
3.3 IP address ........................................................................................................... 17
3.4 Password ............................................................................................................ 17
3.5 E-mail account..................................................................................................... 19
3.6 Device management............................................................................................ 21
3.7 Output control...................................................................................................... 22
3.8 User message ..................................................................................................... 23

FB-HS...
2 PHOENIX CONTACT 3389_en_A
4 ProfiTrace OE ...........................................................................................................................25
4.1 Live list ................................................................................................................ 25
4.1.1 GSD library .......................................................................................... 26
4.2 Statistics .............................................................................................................. 26
4.3 Channel list.......................................................................................................... 27
4.4 Message recording.............................................................................................. 27
4.5 Network events.................................................................................................... 29
4.6 Events ................................................................................................................. 30
4.7 Tagging devices .................................................................................................. 31
5 PROFIBUS modules.................................................................................................................33
5.1 Oscilloscope images ........................................................................................... 33
5.2 Oscilloscope errors.............................................................................................. 35
5.3 Bar graphs........................................................................................................... 36
5.4 PA measurements ............................................................................................... 37
5.5 Oscilloscope configuration .................................................................................. 38
5.6 ProfiTrace statistics summary.............................................................................. 39
6 CommDTM ...............................................................................................................................41
6.1 Setting up the PCD server ................................................................................... 41
6.2 Creating a project using FdtCONTAINER............................................................ 42
A Technical appendix...................................................................................................................47
A 1 Bus parameters .................................................................................................. 47
A 2 Current consumption calculations ...................................................................... 47
A 3 Voltage at the end of the segment ...................................................................... 48
A 4 Directories and files ............................................................................................ 48
B Appendixes...............................................................................................................................49
B 1 List of figures ...................................................................................................... 49
B 2 List of tables ....................................................................................................... 51

FB-HS... system
3389_en_A PHOENIX CONTACT 3
1 FB-HS... system
1.1 Introduction
PROFIBUS coupler/link products transparently convert PROFIBUS DP to PROFIBUS PA
while providing detailed network diagnostics. Advanced configuration and diagnostics of
these products is accomplished through an onboard web server.
Different levels of monitoring capability are provided through the different head stations.
– The FB-HSA does not provide any monitoring capability.
– The FB-HSB provides diagnostic monitoring of one network.
– The FB-HSC provides diagnostic monitoring of up to four networks simultaneously.
Configuration of modules other than the FB-HS... can be accomplished through the
FB-HS..., including other devices on the PROFIBUS network that use compatible FDT/DTM
protocols.
1.2 Connecting a PROFIBUS/PA segment
The bottom of the FB-PA/SC module has two identical connections for the PROFIBUS/PA
trunk. These are connected one-to-one. The integrated termination is activated when power
is connected to the PA module, which means that the FB-PA/SC is always the start of a
segment. The automatic termination cannot be disabled. Most installations will use only one
connector. In that case it does not matter which connector is chosen.
Basic configuration can be accomplished using DIP switches without the need to connect
to the web server.

FB-HS...
4 PHOENIX CONTACT 3389_en_A
1.2.1 Cable specifications
Use the correct cable for your project. The table below shows the cable specifications for
PROFIBUS PA. If a cable is not compliant with these specifications, the reliability of the
installation may become unstable.
Spur lines
The trunk line on the PA module can have up to 32 spur lines with the following lengths:
Table 1-1 PROFIBUS cable specifications
Characteristic Specification
Cable design Twisted pair, shielded
Maximum conductor cross section (nominal) 0.8 mm² (AWG 18)
Loop resistance (direct current) 44 Ω/km
Impedance (31,25 kHz) 100 Ω ±20%
Attenuation (39 kHz) 3 dB/km
Capacitive asymmetry 2 nF/km
Max. propagation delay change (7.9 to 39 kHz) 1.7 µs/km
Max. shield coverage 90%
Cable length 1900 m
Table 1-2 Spur lines
Number of spur lines Length of the spur (Non-Ex)
25 to 32 Max 1 meter
19 to 24 30 meter
15 to 18 60 meter
13 to 14 90 meter
1 to 12 120 meter

FB-HS... system
3389_en_A PHOENIX CONTACT 5
1.3 Connecting a PROFIBUS/DP segment
The PROFIBUS cable should be wired to the repeaters according to the PROFIBUS
guidelines with suitable cable for the application.
Regular and SCOPE repeater modules are equipped with both a screw terminal connector
and a D-SUB 9 connector for the bus connection. The connectors are linked with each
other, but it is not recommended to use them both.
Figure 1-1 Repeater connection topologies
NW0NW1REDH/S
FB-DP-RPTR
RDY
RX
SW
ER
NW0NW1REDH/S
FB-DP-RPTR/SC
RDY
RX
SW
TERM
ER
HWE
MINSCOPE
FB-HSB
RDY
SF
USB
ETH
IOF
SD
MENU NAV.
SD CARD
RDY
RX
POW
AMP
ER
HWE
NWER
FB-PA/SC
NW0NW1LINKH/S
SCOPE
PA

FB-HS...
6 PHOENIX CONTACT 3389_en_A
1.3.1 Screw terminals
Pin layout of the screw terminals:
1.3.2 D-SUB 9 connector
The D-SUB 9 connector offers an alternative connector for standard 9-pin PROFIBUS plugs
(one-to-one with the screw terminals).
When the D-SUB 9 connector is utilized and located at the end of the segment, it is
recommended to use the termination on the D-SUB 9 connector rather than on the repeater
module.
A Green wire
B Red wire
SH Cable shielding (direct)1
1Direct shielding is recommended when connecting all shields
I Cable shielding (capacitive)2
2Capacitive shielding connects the shields through a capacitor in cases where not
all shields are connected to separate the different potential levels
Use a 2.5 mm (0.4 mm maximum) screwdriver to connect the PROFIBUS cable to the
repeater modules.

FB-HS... system
3389_en_A PHOENIX CONTACT 7
1.3.3 Termination switch
A two-position switch, located on the bottom of the FB-DP-RPTR(/SC) modules, activates
the built-in termination capability. Termination should be activated for modules located at
the end of network segment.
Figure 1-2 Termination switch
The built-in termination provides resistances of 390/220/390 Ω between the conductors.
NW0
NW1
RED
H/S
FB-DP-
RPTR/S
C
RDY
RX
SW
TERM
ER
HWE
MIN
SCOPE
TERM
ONOFF
FB-HS...
8 PHOENIX CONTACT 3389_en_A
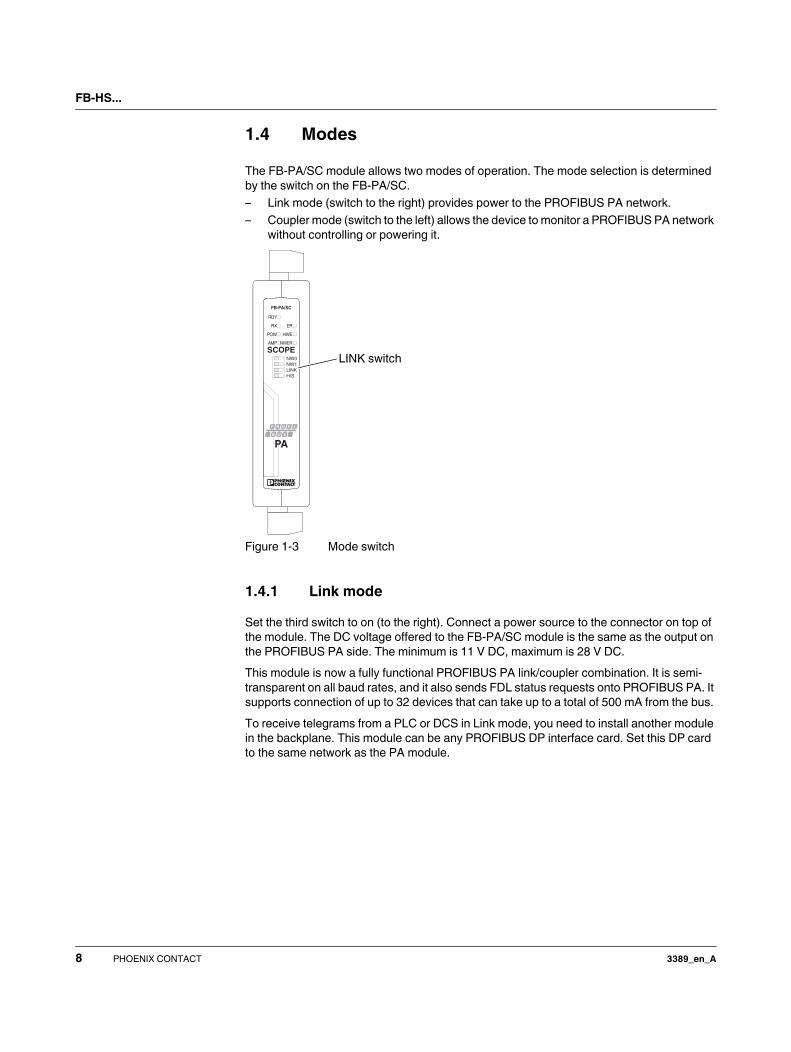
1.4 Modes
The FB-PA/SC module allows two modes of operation. The mode selection is determined
by the switch on the FB-PA/SC.
– Link mode (switch to the right) provides power to the PROFIBUS PA network.
– Coupler mode (switch to the left) allows the device to monitor a PROFIBUS PA network
without controlling or powering it.
Figure 1-3 Mode switch
1.4.1 Link mode
Set the third switch to on (to the right). Connect a power source to the connector on top of
the module. The DC voltage offered to the FB-PA/SC module is the same as the output on
the PROFIBUS PA side. The minimum is 11 V DC, maximum is 28 V DC.
This module is now a fully functional PROFIBUS PA link/coupler combination. It is semi-
transparent on all baud rates, and it also sends FDL status requests onto PROFIBUS PA. It
supports connection of up to 32 devices that can take up to a total of 500 mA from the bus.
To receive telegrams from a PLC or DCS in Link mode, you need to install another module
in the backplane. This module can be any PROFIBUS DP interface card. Set this DP card
to the same network as the PA module.
RDY
RX
POW
AMP
ER
HWE
NWER
FB-PA/SC
NW0NW1LINKH/S
SCOPE
PA
LINK switch

FB-HS... system
3389_en_A PHOENIX CONTACT 9
1.4.2 Coupler mode
Set the LINK switch to off (to the left). Connect a power source to the connector on top of
the module. The DC voltage offered to the FB-PA/SC module is the same as the output on
the PROFIBUS PA side. The minimum is 11 V DC, maximum is 28 V DC.
The module is now a fully functional PROFIBUS PA coupler. It is totally transparent up to
1.5 Mbps, and it sends FDL status requests onto PROFIBUS PA networks. It supports
connection of up to 32 devices that can take up a total of 500 mA from the bus.
1.5 Configuring repeater modules
The repeaters can be configured using the DIP switches located at the front of the module
or by using the web server.
1.5.1 Customizing the PROFIBUS network (NW0/NW1)
Set these DIP switches to the following positions to customize a network number for a
specific PROFIBUS network.
1.5.2 Redundancy (RED)
Set this DIP switch to enable the redundancy group for the channel.
NOTE:
When using an external PROFIBUS PA power supply, do not apply power to the top power
connector. The FB-PA/SC module must be set to operate in Coupler mode.
NW0 NW1 Network
LEFT LEFT 1
RIGHT LEFT 2
LEFT RIGHT 3
RIGHT RIGHT 4
When using software for configuration, the DIP switches do not have to be set.
RED Redundancy
LEFT OFF
RIGHT ON
When using software for configuration, the DIP switches do not have to be set.

FB-HS...
10 PHOENIX CONTACT 3389_en_A
1.5.3 Hardware or software settings (H/S)
Set this switch to enable hardware (DIP switches) or software settings.
1.5.4 Testing and commissioning
If the channel recognizes valid PROFIBUS messages from one or more connected devices,
the RX LED of this channel should flash and the ER LED should be off.
When the termination of a specific channel is set to on, the SWx LED should be on.
H/S Settings
LEFT Hardware
RIGHT Software
When software is enabled, all switch settings are overruled. The settings are saved in the
internal memory of the FB-HS... module.
Web server
3389_en_A PHOENIX CONTACT 11
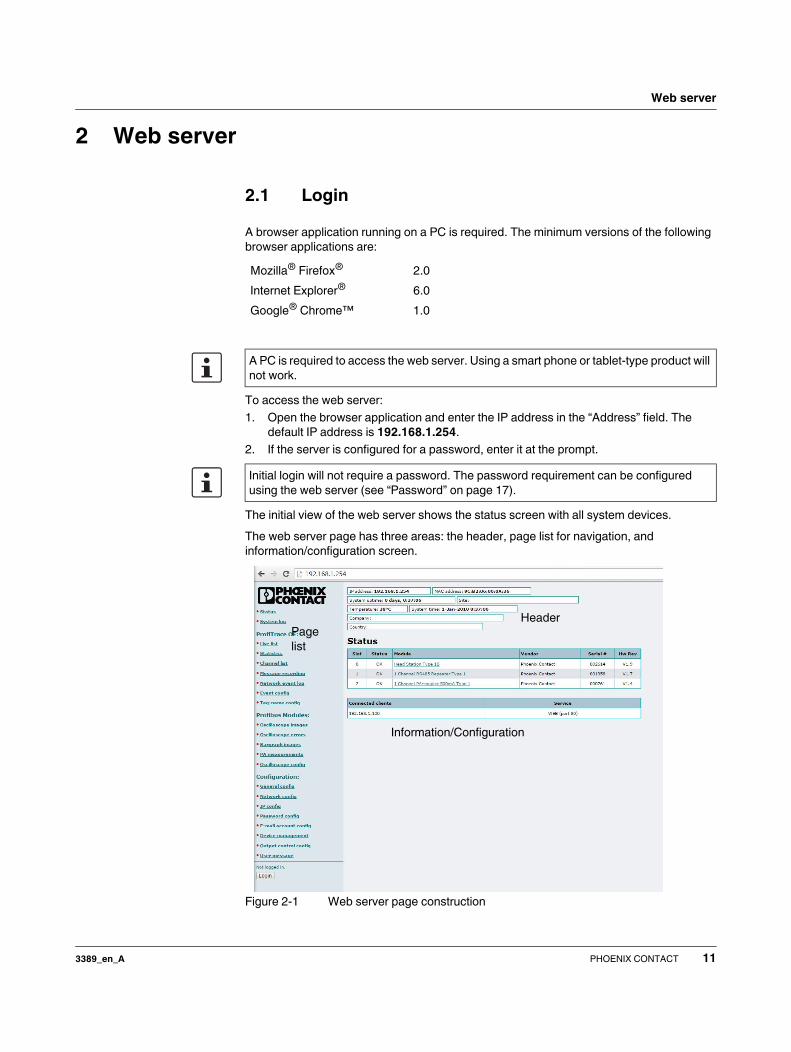
2 Web server
2.1 Login
A browser application running on a PC is required. The minimum versions of the following
browser applications are:
To access the web server:
1. Open the browser application and enter the IP address in the “Address” field. The
default IP address is 192.168.1.254.
2. If the server is configured for a password, enter it at the prompt.
The initial view of the web server shows the status screen with all system devices.
The web server page has three areas: the header, page list for navigation, and
information/configuration screen.
Figure 2-1 Web server page construction
Mozilla®
Firefox®
2.0
Internet Explorer®
6.0
Google®
Chrome™ 1.0
A PC is required to access the web server. Using a smart phone or tablet-type product will
not work.
Initial login will not require a password. The password requirement can be configured
using the web server (see “Password” on page 17).
Page
list
Header
Information/Configuration

FB-HS...
12 PHOENIX CONTACT 3389_en_A
– Header: This provides general information about the device to which the web server is
connected.
– Information/configuration: This section shows detailed information based on the page
selected. Some fields are editable, and some are for informational purposes only.
Editable fields can be boxes for text or numbers, check boxes to select or turn on an
item, or drop-down menus to select from a predetermined list of options. Links to other
sections of the web server are also available. These are typically indicated by
underlined blue text. Clicking on an image of another device may also take you to that
device.
– Page list: The list of available pages is determined by the capability of the connected
device. Not all pages are available for all devices.
2.2 Status
2.2.1 System status
The “Status” page appears upon login. The page gives an overview of the attached
modules, with descriptions, serial numbers, and version numbers. Modules can be installed
and removed during operation. Any changes in the modules will be immediately visible on
the “Status” page.
Figure 2-2 “Status” page
The top of the “Status” page displays network and site information in the header. A custom
user message can be displayed (see “General configuration” on page 15).

Web server
3389_en_A PHOENIX CONTACT 13
2.2.2 Module status
Each name in the list of connected modules is a link that opens the status page for that
particular module.
Figure 2-3 Module status showing “Head station status” page

FB-HS...
14 PHOENIX CONTACT 3389_en_A
2.3 System log
The “System log” page displays system-level events with a date and time stamp.
Figure 2-4 “System log” page
The “System log” page will update when the page is being viewed. If power is removed from
the FB-HS..., the system log is saved. The system log is not editable.
Click the “Download” button to save the system log as a .txt file on the SecureDigital®
(SD)
card.
The system log will continue to save events until it runs out of memory, which is
approximately 1000 events. At that point, the oldest events are overwritten. The system log
can also be cleared. Click the “Clear” button to delete all currently saved events.
A SecureDigital®
(SD) card must be installed in the SD card slot for the system log to
function.

Configuration
3389_en_A PHOENIX CONTACT 15
3 Configuration
3.1 General configuration
The basic settings are customized on the “General configuration” page. For optimal use of
ProfiTrace OE, it is important that the time is synchronized and the site info is sufficiently
filled in. If the system is connected to the Internet or a local NTP server, use the NTP server
synchronization for automatic date and time update. If the system clock differs more than
ten seconds from the NTP clock, a line is added to the system log.
The automatic time update occurs when the set interval has passed. The maximum interval
that can be set is 1440 minutes, which corresponds to 24 hours.
Figure 3-1 “General configuration” page
Set the “Update interval (seconds)” field to match the bandwidth of the network. The default
is 1 second. If the bandwidth is limited, it is recommended to increase this time or uncheck
the “Automatic refresh” box.
Click the “Website start page” drop-down menu to select the initial page displayed when
browsing to the Head Station IP address. The options are:
– Main Status
Note that there is no option for Daylight Saving Time (DST) as this is typically not used in
factory automation. When an NTP server is used, the time is always assumed to be
standard time.

FB-HS...
16 PHOENIX CONTACT 3389_en_A
– System Log
– Live List
– Statistics
– Channel list
– Message Recording
– Network Event log
Click the “Website preferred network” drop-down menu to select the initial network viewed
when first opening the web browser.
The interface language can be changed in the “Preferred language” drop-down menu.
3.2 Network
The “Network configuration” page configures the network names and the assignment of the
repeater. For optimal use of ProfiTrace OE, it is important that correct and understandable
network names are defined. The network names are used in multiple components:
ProfiTrace Live List, event e-mails, message recording, etc.
Each of the four available Live Lists (using the FB-HSC module) can be individually set up
to a different time-out. The default is five seconds. The time indicates how long a slave is
displayed as green when communication to the master is lost. After the time expires it the
device LED will turn yellow if it has no communication anymore.
The network assignment of the repeater modules is also displayed and can be adjusted if
software settings are enabled. It is possible to assign a module to Network 1 to 4, or to
disconnect it from the backplanes. This makes it possible to create a multiplexed system, or
temporarily remove certain slaves from the PROFIBUS network.
DIP switch settings are always primary to software settings.
Figure 3-2 “Network configuration” page

Configuration
3389_en_A PHOENIX CONTACT 17
3.3 IP address
The “IP configuration” page configures the IP address and network configuration for the
Ethernet network.
Figure 3-3 “IP configuration” page
In addition to the IP address, the netmask, default gateway, and DNS server may be
manually entered.
A hyperlink may be entered to allow easy access to the device from any other device on the
network.
3.4 Password
The FB-HS... supports two password levels:
– Admin password: Provides full access to the web server. This must be set before the
user password can be set.
– User password: Limited to read-only information.
Passwords are not activated by default or when reset, ensuring that all menu options are
accessible and configurable.

FB-HS...
18 PHOENIX CONTACT 3389_en_A
Passwords must be between one and 16 characters.
Figure 3-4 “Change password” page
Enter the desired password in the “New password” field and then again in the “Re-enter new
password” field. Click the “Save” button. If they do not match, you will be prompted to enter
them again.
If more than one person has access to the network, configure the Admin password. Follow
recommended password best practices:
• Activate the passwords immediately after installation.
• Use different passwords at the administrator and user levels.
Table 3-1 Password-based access rights
Access to Factory default
administrative
password only
User-configured
administrative
password
User-configured
user password
Login required for
web server access
No No Yes
Visit web pages Yes Yes Yes
Clear system log Yes Yes Yes
Restart the device
using web server
Yes Yes Yes
Output control Yes Yes Yes
Change password Yes Yes No
Adjust any other
configuration set-
tings
Yes Yes No

Configuration
3389_en_A PHOENIX CONTACT 19
• Never share passwords with anyone.
• Always use strong passwords.
• Change passwords immediately if they may have been compromised.
• If a password must be written down, store it in a secure location and destroy it when it
is no longer needed.
• Be careful when entering passwords. Some dialog boxes and browsers may offer to
remember passwords. This is not recommended as it poses a potential security risk.
External protocols
For some external protocols, login information may be required. If prompted, you must enter
a login name (User or Admin) and password. If no password has been configured, the
FB-HS... will accept any password.
Clearing passwords
There are three ways to restore the system to the default passwords (none):
– On the “Password config” page, delete all characters from both password fields and
then click the “Save” button. The Admin login is required.
– Click the “Restore factory defaults” button on the “Device management” page. The
Admin login is required.
– Press the factory reset button on the FB-HS... module.
3.5 E-mail account
E-mail account information must be entered to receive notice of signal events by e-mail.
The “Event config” page (see “Events” on page 30) must also be configured to send event
notifications by e-mail. Simply entering an e-mail address will not result in e-mail
notifications.
The SMTP server must support unencrypted connections as the FB-HS... does not
support encrypted connections, such as SSL/TLS. The DNS address must be modified
according to the DNS addresses of your Internet provider.

FB-HS...
20 PHOENIX CONTACT 3389_en_A
Figure 3-5 “E-mail account configuration” page
Enter the information in the appropriate fields. When finished, click the “Save” button. To
verify correct setup, click the “Send test E-mail with saved settings” button.
Alive e-mail
The FB-HS... can send a periodic e-mail to the configured e-mail address to verify that the
system is still functioning when no events have been triggered.
The Alive e-mail can be configured to send an e-mail at any interval from one hour to one
day.
E-mail troubleshooting
– Verify that the FB-HS... has access to the Internet.
– Compare the DNS settings with the requirements of the e-mail server being used.
– Make sure the e-mail server supports unsecured connections.
– Check the e-mail settings and generate a test e-mail. Enter only one e-mail address in
the “To” field when troubleshooting.
– If the test e-mail works, verify that the “Event configuration” page is correctly enabled
and an event has been triggered.
Always click the “Save” button before sending a test e-mail.
E-mail is not instantaneous. It may take a few minutes before you receive the e-mail. If you
do not receive the e-mail, check to ensure that it was not blocked by a spam filter.

Configuration
3389_en_A PHOENIX CONTACT 21
3.6 Device management
The “Device management” page allows a user to manage the location and transfer of the
configuration.
Figure 3-6 “Device management” page
The configuration can be transferred from the internal memory of the FB-HS... to a
SecureDigital®
(SD) card or transferred from the SD card to internal memory. Note that any
existing configuration will be overwritten.
Click the “Restore settings to factory defaults” button to reset the FB-HS... to the factory
defaults.
Click the “Restart the device” button to perform a soft restart, which does not require the
need to physically reapply power.

FB-HS...
22 PHOENIX CONTACT 3389_en_A
3.7 Output control
The “Output control” page configures the alarm contacts.
Figure 3-7 “Output control” page
The ten outputs are displayed in a table format, with each output having its own settings.
Each column/field uses a drop-down menu for configuration of the specified output.
In the output number row, click the “Slot/module” drop-down arrow to select the desired
head station module. The next column allows selection of the I/O point. The status of the
specific I/O point is displayed as either On or Off.
In the “Action” column, select “Profibus event”, and then select the criteria required to trigger
the event.
Configuration
3389_en_A PHOENIX CONTACT 23
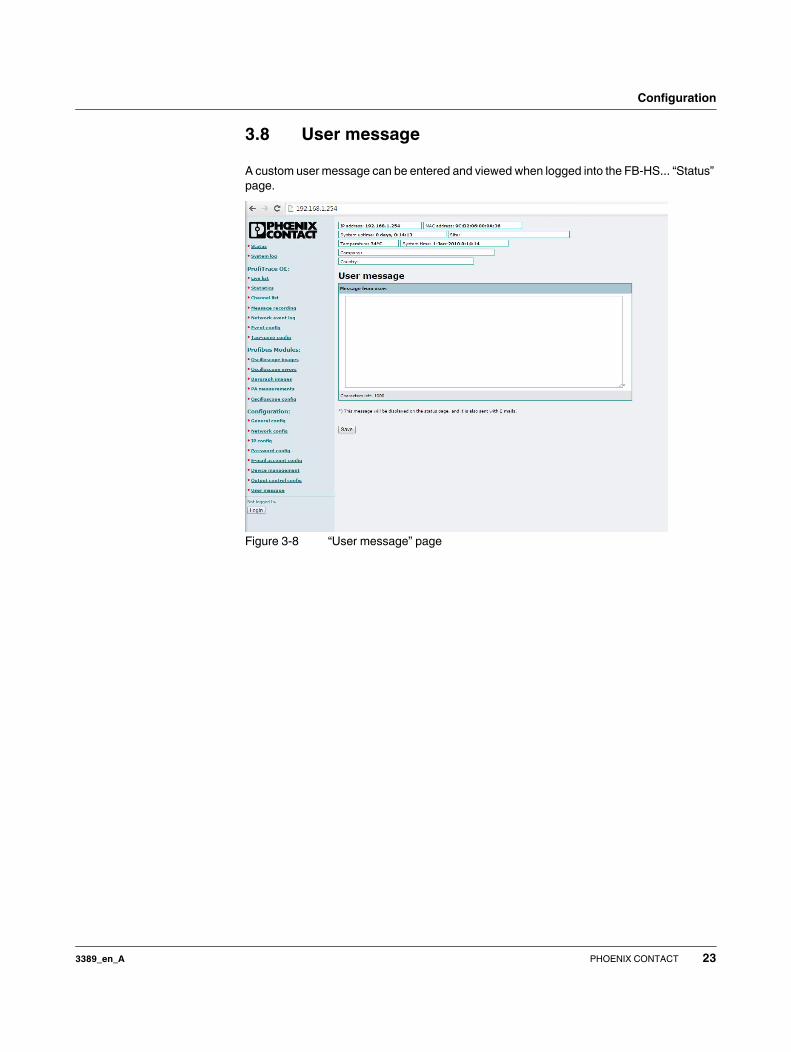
3.8 User message
A custom user message can be entered and viewed when logged into the FB-HS... “Status”
page.
Figure 3-8 “User message” page

FB-HS...
24 PHOENIX CONTACT 3389_en_A

ProfiTrace OE
3389_en_A PHOENIX CONTACT 25
4 ProfiTrace OE
ProfiTrace OE is a web-based version of ProfiTrace 2 embedded within the FB-HS.... It
offers the basic functionality of regular ProfiTrace 2, including; Live list, statistics, and
message recording.
4.1 Live list
The “Live list” page displays a matrix that continuously lists all the available devices. A color
code provides a quick, visible status of each device’s condition. The color codes are:
– Green: Device is in data exchange
– Yellow: Device is lost
– Red: Parameter fault
– Purple: Configuration fault
– No color: On the bus but not in data exchange
The “Live list” page can generate the product name of a device when a diagnostic message
is captured (synchronized with the GSD library).
The “Display Legend” dialog box appears explaining the meaning of the colors in more
detail.
Figure 4-1 “Live list” page
GSD files describes the capabilities of a device, and is shipped with each device. They can
also be downloaded from the www.profibus.com website or from the device
manufacturer’s website.

FB-HS...
26 PHOENIX CONTACT 3389_en_A
4.1.1 GSD library
The GSD library provides information about each device. It is provided by a device
manufacturer and is available from the vendor’s website.
Updating the GSD file library
As devices are developed and updated, the GSD file library may require updates for new
devices. To update the GSD file library in the FB-HS... :
Transfer any new GSD files by copying them onto an SD card and inserting the SD card into
the FB-HS... head station. When the head station is rebooted, the new GSD files will be
recognized and replace any existing files.
4.2 Statistics
The “Statistics” page displays various data from the device that can be used to analyze the
condition of a device. This page is typically used by a maintenance technician to look at
things such as the number of retries, communication drops, diagnostic messages, etc.
Figure 4-2 “Statistics” page
The “Statistics” page provides a quick view into the data without the need for a detailed
examination of messages or difficult operations to ensure the quality of the installation.
The transfer of GSD files to the FB-HS... is accomplished through the use of the SD card
slot. Any PC used to download a GSD file must have the ability to read/write an SD card.

ProfiTrace OE
3389_en_A PHOENIX CONTACT 27
4.3 Channel list
The “Device channel list” page provides a graphical view of all stations in the network.
Similar to a logical topology scan, the page also shows the network connected to each
station.
Figure 4-3 “Device channel list” page
4.4 Message recording
Messages can be triggered based on status changes and any diagnostic data that exceeds
the user-set limits.
Because the FB-HS... is intended for permanent monitoring applications, it automatically
starts recording a message when an event is detected. The following event automatically
starts a message recording again.
When the unit is first purchased or reset to the defaults, it automatically triggers the “Lost”
statistic. The user can change the settings during operation.

FB-HS...
28 PHOENIX CONTACT 3389_en_A
The recorded files can be opened with an offline ProfiTrace 2 (no license required).
Figure 4-4 “Message recording” page
The file name is created using the MAC address of the FB-HS..., the network number, and
a sequential number between 1 and 999.
The automatic triggering can generate 1000 Profitrace (.ptc) files per network. After 1000
files are generated, the next event deletes the oldest file, replacing it with the most recent
event. The .ptc files are stored on the SD card.
The .ptc files can be opened with ProfiTrace 2.5.3 and higher.

ProfiTrace OE
3389_en_A PHOENIX CONTACT 29
4.5 Network events
The network event log shows all the processor activity of the head station and network and
records any status changes. The event log can be viewed using a web browser.
Figure 4-5 “Network event log” page

FB-HS...
30 PHOENIX CONTACT 3389_en_A
4.6 Events
The “Event configuration” page sets the events which are monitored and determines how
the event information is distributed, for example, e-mail or log tracking.
Figure 4-6 “Event configuration” page
To control the number of events monitored, each event can be individually set to Off, Once,
or Interval. When set to Interval, the event is recorded once during the specified time.
When the time is expired, the next occurrence of that event is recorded.
A check box allows each event to be independently configured to be either sent to an e-mail
account or listed in the log file.
The Interval time can be set from one minute to 365 days.
Check boxes allow all events to be selected or deselected.

ProfiTrace OE
3389_en_A PHOENIX CONTACT 31
4.7 Tagging devices
To organize the devices in a network, every module and every station in every network can
be tagged with a name on the “Tag-name configuration” page.
Figure 4-7 “Tag-name configuration” page
The first block of tag names is used to assign tags to the FB-HS... modules. Each tag must
have the format slot:name, where slot is the slot number. The tag names are limited to 16
characters. The colon (:) and quote (' or ") characters cannot be used.
The second to the fifth block of tag names are used to assign tags to individual stations in
each network. The tag names are visible in the “Channel list” page, if hovering over a
module or station address. It is also possible to display the tag names on the “Live list” page.
Module tag names are also displayed in drop-down menus to modules and in tables on the
following pages:
– Oscilloscope images
– Oscilloscope error images
– Oscilloscope configuration
– Bar graphs
– PA measurements
– Network configuration
– Output control configuration

FB-HS...
32 PHOENIX CONTACT 3389_en_A

PROFIBUS modules
3389_en_A PHOENIX CONTACT 33
5 PROFIBUS modules
The transparent FB-PA/SC coupler enables seamless high-speed integration to
PROFIBUS PA. It powers the attached PROFIBUS PA devices and fully emulates them as
PROFIBUS DP devices on the backplane. Adjusted bus parameters are not required and,
therefore, suitable for all DCS and PLC systems, even when running on 12 Mbps networks.
The combined internal ProfiTrace and oscilloscope make this product extremely useful for
remote maintenance over Ethernet. Jitter, noise, DC current, DC voltage, bar graph, and
oscilloscope, it is all there and easy to access. The free CommDTM (available at
phoenixcontact.com) allows access for asset management tools over Ethernet.
The FB-DP-RPTR coupler is able to carry nine PROFIBUS PA links and an RS-485 module.
It can also be a customized mix of PROFIBUS PA modules with other communication
modules. The FB-PA/SC coupler provides 500 mA current on a customizable bus voltage.
The integrated PROFIBUS PA termination is automatically activated when the module
works as a link or coupler. It is switched off in the monitoring mode.
It does not require configuration and operates the same way as regular PROFIBUS
repeaters. In the web server, the behavior of the PROFIBUS PA side can be set, like retries
(default 5) and the watchdog (default three seconds). This product can directly replace
third-party non-Ex PA coupler/links and can be used as a monitor behind existing third-party
non-Ex PA couplers.
5.1 Oscilloscope images
The FB-HSB and FB-HSC head stations and FB.../SC modules have an integrated
oscilloscope to measure the signal quality of the telegrams. The oscilloscope has an
interface with the web server to display the signals from the devices connected to its
channel. After opening the web page, all oscilloscope signals are displayed and updated
live.
The benefits of the Phoenix Contact devices with a built-in oscilloscope are:
– You do not have to touch the installation.
– Works automatically.
– Oscilloscope data is never mistaken with the wrong segment.
– No probe wiring.
– No spur lines.
The FB-HS..., FB-DP-RPTR, FB-DP-RPTR/SC, and FB-PA/SC modules are not suitable
for use in Ex environments unless a barrier is used between the PA module and the Ex
zone. An approved external fieldbus power supply must also be used to power a
PROFIBUS PA segment in an Ex zone.

FB-HS...
34 PHOENIX CONTACT 3389_en_A
Figure 5-1 “Oscilloscope images” page
Click on the oscilloscope waveform image of a device to display the device’s signals in a
new page. This opens/creates a new web page.
The FB-HSB and FB-HSC head stations and FB.../SC modules are limited to differential
measurements.

PROFIBUS modules
3389_en_A PHOENIX CONTACT 35
5.2 Oscilloscope errors
Whenever an illegal message is seen on the PROFIBUS network, and if the message
occurred on a module with an integrated scope, an image of the signal error will be
displayed. It captures the exact moment of a communication failure when troubleshooting
is necessary. This makes it easy to prove out EMC issues and also issues with cabling.
Figure 5-2 “Oscilloscope error images” page
Up to 16 error messages can be stored in the head station memory. If there are more than
16 error images, click the “Refresh error images” button to update the view.

FB-HS...
36 PHOENIX CONTACT 3389_en_A
5.3 Bar graphs
The “Bargraph images” page illustrates the average signal strength from all available
connected devices behind a specific SCOPE repeater. It is a helpful utility to get an
impression of the overall signal quality of the network.
The average amplitude should be around 5 V for PROFIBUS DP networks and between
0.25 and 1 V for PROFIBUS PA networks. When there are bus problems, the graph displays
different voltage levels and the colors of the bars change. The bar graph feature is also
helpful for detecting issues with segment termination.
Figure 5-3 “Bargraph image” page

PROFIBUS modules
3389_en_A PHOENIX CONTACT 37
5.4 PA measurements
The PA measurements page shows a static scope image; it is not an actual scope
measurement. The blue arrow illustrates the measured value of the amplitude and the jitter.
The values are displayed in the corresponding boxes.
Figure 5-4 “Bargraph image” page
Amplitude
The amplitude is the difference between the highest and the lowest measured value of the
AC signal (the actual data). The displayed result is measured by taking samples from all the
bits in a telegram. Not the entire bit is measured, but only a small part to filter out
irregularities such as overshoots.
Jitter
Jitter is described as “zero-crossing point deviation,” which means that the changing of a bit
does not occur at the intended time. This is acceptable within the limit of 3200 ns, positive
or negative. Causes for high jitter times can be wiring mistakes, EMI, cable cross talk, or
device problems.
Polarity
This is not the polarity of the bus wiring, but the internal communication signal. In some
products it is possible that the polarity is switched. This does not affect the communication.
DC noise
The DC noise indicates how much the voltage of the signal varies. If the noise is too high, it
can influence the communication; it should not exceed 100 mV.

FB-HS...
38 PHOENIX CONTACT 3389_en_A
5.5 Oscilloscope configuration
The “Oscilloscope” page allows customizing of the oscilloscope functions.
Figure 5-5 “Oscilloscope configuration” page
The termination voltage limits can be adjusted, as well as the limits for PA segment
alarming.

PROFIBUS modules
3389_en_A PHOENIX CONTACT 39
5.6 ProfiTrace statistics summary
Table 5-1 contains a description of the items listed in the statistics and events.
Table 5-1 Summary of statistics and events monitored by ProfiTrace OE
Statistics Description Critical
Lost How many times a device in data exchange fails to respond after
the maximum retries have been reached. Lost is retriggered
when the device recovers back to data exchange and fails to re-
spond again.
– The “Live list” page could indicate a yellow-colored address
(after time-out).
Yes
Syncs Attempts of the master to contact a device for the first time or es-
tablish a communication relationship. This occurs in most cases
after station lost, device unavailability or startup of the master. In
the statistics view, these values add up relatively quick.
– Some DCS systems read diagnostics all the time with Syncs
ON.
– The “Live list” page could indicate a yellow colored address.
Yes, in most cases
Repeats Total Attempt of the master to get a response from an unanswered
telegram. The response did not come or has content errors. The
maximum amount of repeats a master attempts can be custom-
ized in the master.
– When the retries have reached the limit, the master goes to
the Syncs state.
Yes
Repeats Max (worst se-
quence)
This value represents the highest amount of retries that were at-
tempted on this specific device in one cycle.
– This value will never get higher than the retry value that has
been set up in the master.
Yes
Illegal Responses The response to a master request telegram contains framing er-
rors (parity error, wrong FCS, SD error, etc.). This mostly hap-
pens with EMC and cabling problems.
– When this statistic adds up relatively quick, it could also be
a double device address.
Yes
Internal Diag Negative responses at the lowest telegram level (Layer 2: FDL)
are rare. In the telegram recording you will see SD1 telegrams
with, for example, an RS (Reject Service) or RR (Reject Re-
sources).
Examples of situations where this occurs:
– DP-V1 connections to DP-V0 devices.
– Watchdog has run out on a DP device and the master sends
a Data Exchange output telegram.
– Non-certified DP devices that do not support a specific
service/command or cannot handle a command in time.
No
External Diag All responses from Get Diagnostics requests from all masters. No

FB-HS...
40 PHOENIX CONTACT 3389_en_A
Diag while in DX Only responses to Get Diagnostics requests from the master that
controls this slave (primary class 1 master).
– When the first two bytes of the diagnostic content contain
08 0C or 08 04, a red indicator blinks in the left corner of the
device on the “Live list” page (critical content).
Yes, in most cases
Master lost One of the masters is not active after getting the token; it is not
responding anymore. Note that this also happens when a Class
2 DP-V1 master is disabled.
Yes, in most cases
Baud rate change The detected baud rate of the PROFIBUS network has been
changed.
Yes (in most cases)
Low/High signal (Bar
graph)
The amplitude of at least one station is too low (in PROFIBUS DP
and PA networks) or too high (in PROFIBUS PA networks only).
Yes
Redundancy Failure One of the redundant cables has failed. No
PA signal and levels PROFIBUS PA values, such as jitter, DC voltage, or DC noise
out of range.
Yes
Table 5-1 Summary of statistics and events monitored by ProfiTrace OE
Statistics Description Critical

CommDTM
3389_en_A PHOENIX CONTACT 41
6 CommDTM
The FB-HS... head station provides a fully functional gateway between any Windows
platform and field devices via a CommDTM. This enables the FB-HS... head station and
attached modules to function as a real asset management tool. Currently, FDT 1.2 frame
applications are supported, such as PACTware and E+H FieldCare. During interaction with
the CommDTM, all FB-HS... head station functions can be used simultaneously (web-
based monitoring, oscilloscope, OPC, and alarms via e-mail).
6.1 Setting up the PCD server
1. Download the PCD server application (available at PhoenixContact.com). Unzip the file
or navigate to and double-click the file to start the executable.
2. Right-click the “PCD” icon in the notification area and click the “Show” option.
Figure 6-1 “PCD/Interfaces” page
3. Click the “Modify” button to open the “Interface Settings” dialog box.
– Type a name for the device in the “Interface Name” field.
– Click the “Driver” drop-down menu and select a driver.
– The “Serial Nr.” field can remain empty.
Click the “OK” button to close the dialog box.
It is recommended that the most recent driver be selected.

FB-HS...
42 PHOENIX CONTACT 3389_en_A
Figure 6-2 “Ethernet Connection Configurator” dialog box
4. Click the “Setup” button to open the “Ethernet Connection Configurator” dialog box.
– Enter the IP address of the FB-HS... module in the “IP Nr./DNS name” field.
– Enter the port number in the “Port” field.
– Click the “Network Nr.” drop-down menu and click the name of the desired network.
– Populate the “Username” and “Password” fields, if your network requires it.
Click the “OK” button to close the dialog box
6.2 Creating a project using FdtCONTAINER
Adding devices
Start the FDT manager and create or load a project. The vendor-independent application
FdtCONTAINER (available at http://mm-software.com/en/oem-fdtcontainer-application) is
used in the example below. Refer to the manual of your FDT manager for details.
Figure 6-3 “CommDTM/Device” dialog box
1. Click the “Device” tab.
2. Click the “Add...” button. Select Phoenix Contact DP-V1 Master in the device list.

CommDTM
3389_en_A PHOENIX CONTACT 43
3. Click the “OK” button, and then double-click Phoenix Contact DP-V1 Master to open
the “Bus Parameter” page.
Figure 6-4 FdtCONTAINER “Parameters” dialog box
4. In the “Device Summary” list, right-click the Phoenix Contact DP-V1 master and click
“Parameters” from the context menu.
5. Enter the correct parameters or select the “Start” button to initiate the “Autodetect Bus
Parameters” process.
6. Click the “OK” button.

FB-HS...
44 PHOENIX CONTACT 3389_en_A
The FB-HS... is now set up as a DP-V1 master. To activate the connection to field devices,
right-click the Phoenix Contact DP-V1 master, and click the “Connect” option.
Figure 6-5 Connecting to devices
A communication session is now active between the software to the device connected on
the network.

CommDTM
3389_en_A PHOENIX CONTACT 45
Network scan
Once communication is established with the FB-HS... head station, the network will now be
able to scan for all the connected field devices on the network. To initiate the scan, right-
click the Phoenix Contact DP-V1 master and click the “Scan/Create” option. The head
station will scan the entire PROFIBUS network for active PROFIBUS DP and PROFIBUS PA
devices.
Figure 6-6 Network scan

FB-HS...
46 PHOENIX CONTACT 3389_en_A

3389_en_A PHOENIX CONTACT 47
A Technical appendix
A 1 Bus parameters
Some adjustments to the bus parameters in the PLC or DCS need to be made. Follow the
table below for your master project:
These are worst-case values. It is recommended to examine the timing of your installation
and decrease the bus parameters to a suitable value for your network.
In small applications it is required to set a value for the Tset parameter. Usually a value of
95 is sufficient.
Because of the longer Slot Time and MaxTSDR, it is also recommended to set the
Watchdog to at least 2 seconds. This is normal in PA networks.
In coupler mode, the module has no bus address on either side. When configuring the PA
network there is no restriction in the use of addresses for field devices, although most
configuration tools do not allow addresses 0, 1, and 2.
A 2 Current consumption calculations
The FB-PA/SC module provides a maximum of 500 mA to the PROFIBUS/PA trunk. The
total current consumption of all slaves on this trunk cannot exceed 500 mA. The
PROFIBUS/PA module consumes 10 mA. At least one FDE (Fault Disconnection
Electronics, stated in the manual of the PA device) should also be calculated. The
calculation for the current consumption is as follows:
where
ISEG = Total current in a segment
IBN = Basic current of devices
IFDE = Current of the Fault Disconnection Electronics
Table A-1 Bus parameters for PROFIBUS/PA (in bit times)
Baud rate Tslot
(only DX)
Max TSDR
(only DX)
Tslot
(with DP-V1)
Max TSDR
(with DP-V1)
9.6 - 19.2 kbps 330 145 1500 150
45.45 kbps 640 480 640 480
93.75 kbps 2500 1000 2500 1000
187.5 kbps 3200 1500 14000 1400
500 kbps 8500 4000 38000 3700
1.5 Mbps 25500 11500 110000 11000
ISEG = IB0 + IB1 + ... + IBN + IFDE

FB-HS...
48 PHOENIX CONTACT 3389_en_A
A 3 Voltage at the end of the segment
The resistance of the cable causes a lower voltage at the end of the cable. At least 9 V
should be available for the last device at the end of the cable. The following calculation is a
worst-case scenario where all devices are connected at the end of the cable:
where
UB = Bus voltage at the last device (V)
US = Voltage of the segment coupler (V)
ISEG = Total current in a segment (A)
RCABLE = Resistance per unit length of the cable (Ω/km)
LSEG = Length of all cables in the segment, including stubs (km)
UB > minimal specified operating voltage of the last device
A 4 Directories and files
The following directories are standardized for the FB-HS... modules and are, in most cases,
located on the SD card:
Table A-2 SD card directory
Directories Description
/Busmon ProfiTrace message-recoding files
/Log Log files
/Doc Contains the web server download page
Table A-3 File extensions
Files and extensions Description
Journal.dat System file (Do not delete or remove)
gsd.bin File with GSD information for the Live list
settings.ini Head station settings (IP address, name, location,
etc.)
.ptc ProfiTrace OE message-recoding files located in
the “Busmon” directory
.pkg Firmware files
.csv Log files located in the “Log” directory
UB = US − (ISEG × RCABLE × LSEG)

3389_en_A PHOENIX CONTACT 49
B Appendixes
B 1 List of figures
Section 1
Figure 1-1: Repeater connection topologies ........................................................... 5
Figure 1-2: Termination switch ................................................................................ 7
Figure 1-3: Mode switch .......................................................................................... 8
Section 2
Figure 2-1: Web server page construction ............................................................ 11
Figure 2-2: “Status” page ...................................................................................... 12
Figure 2-3: Module status showing “Head station status” page ............................. 13
Figure 2-4: “System log” page ............................................................................... 14
Section 3
Figure 3-1: “General configuration” page .............................................................. 15
Figure 3-2: “Network configuration” page .............................................................. 16
Figure 3-3: “IP configuration” page ........................................................................ 17
Figure 3-4: “Change password” page ................................................................... 18
Figure 3-5: “E-mail account configuration” page ................................................... 20
Figure 3-6: “Device management” page ............................................................... 21
Figure 3-7: “Output control” page .......................................................................... 22
Figure 3-8: “User message” page ......................................................................... 23
Section 4
Figure 4-1: “Live list” page .................................................................................... 25
Figure 4-2: “Statistics” page .................................................................................. 26
Figure 4-3: “Device channel list” page ................................................................... 27
Figure 4-4: “Message recording” page .................................................................. 28
Figure 4-5: “Network event log” page .................................................................... 29
Figure 4-6: “Event configuration” page .................................................................. 30
Figure 4-7: “Tag-name configuration” page ........................................................... 31

FB-HS...
50 PHOENIX CONTACT 3389_en_A
Section 5
Figure 5-1: “Oscilloscope images” page ............................................................... 34
Figure 5-2: “Oscilloscope error images” page ....................................................... 35
Figure 5-3: “Bargraph image” page ....................................................................... 36
Figure 5-4: “Bargraph image” page ....................................................................... 37
Figure 5-5: “Oscilloscope configuration” page ...................................................... 38
Section 6
Figure 6-1: “PCD/Interfaces” page ........................................................................ 41
Figure 6-2: “Ethernet Connection Configurator” dialog box ................................... 42
Figure 6-3: “CommDTM/Device” dialog box ......................................................... 42
Figure 6-4: FdtCONTAINER “Parameters” dialog box .......................................... 43
Figure 6-5: Connecting to devices ........................................................................ 44
Figure 6-6: Network scan ...................................................................................... 45

3389_en_A PHOENIX CONTACT 51
B 2 List of tables
Section 1
Table 1-1: PROFIBUS cable specifications ............................................................ 4
Table 1-2: Spur lines............................................................................................... 4
Section 3
Table 3-1: Password-based access rights............................................................ 18
Section 5
Table 5-1: Summary of statistics and events monitored by ProfiTrace OE ........... 39
Appendix A
Table A-1: Bus parameters for PROFIBUS/PA (in bit times) ................................. 47
Table A-2: SD card directory................................................................................. 48
Table A-3: File extensions..................................................................................... 48

FB-HS...
52 PHOENIX CONTACT 3389_en_A