Embed Size (px)
DESCRIPTION
This presentation is an executive summary of the Fayetteville, NC real estate market
Citation preview

Fayetteville NC Real Estate
© 2011 Altagracia, LLC
Market Report 1st Quarter 2011
For the period ending March 31, 2011

Executive Summary
© 2011Altagracia, LLC
The Fayetteville, NC real estate market continues to produce mixed results. Overall, sales are almost 40% off of the highs of 2006. They are about 10% higher than last year, but are still below the average of the last 12 years. Existing homes are selling at a much slower rate, but new construction is selling markedly better.
In the 1st Quarter of 2011, a total of 718 existing homes were sold. That represents a drop of about 45% from the high sold in the 1st Quarter of 2006. However, it is an increase of about 5% from the 1st Quarter of last year, 2010. That might appear to be positive news for sellers, but the strength in the market is in new construction sales.
For the same period, 1st Quarter 2011, a total of 464 newly constructed homes were sold. That’s a drop of 28% from the market high in 2006 but an increase of over 17% from last year.
The best indicator of the strength of the market is the absorption rate. Both existing and new construction rates slowed over the last 3 months, mostly attributable to the seasonal nature of home sales. Existing home sales continue to lag well behind indicating it is a strong buyers market. New construction is relatively balanced in price ranges below $250,000.
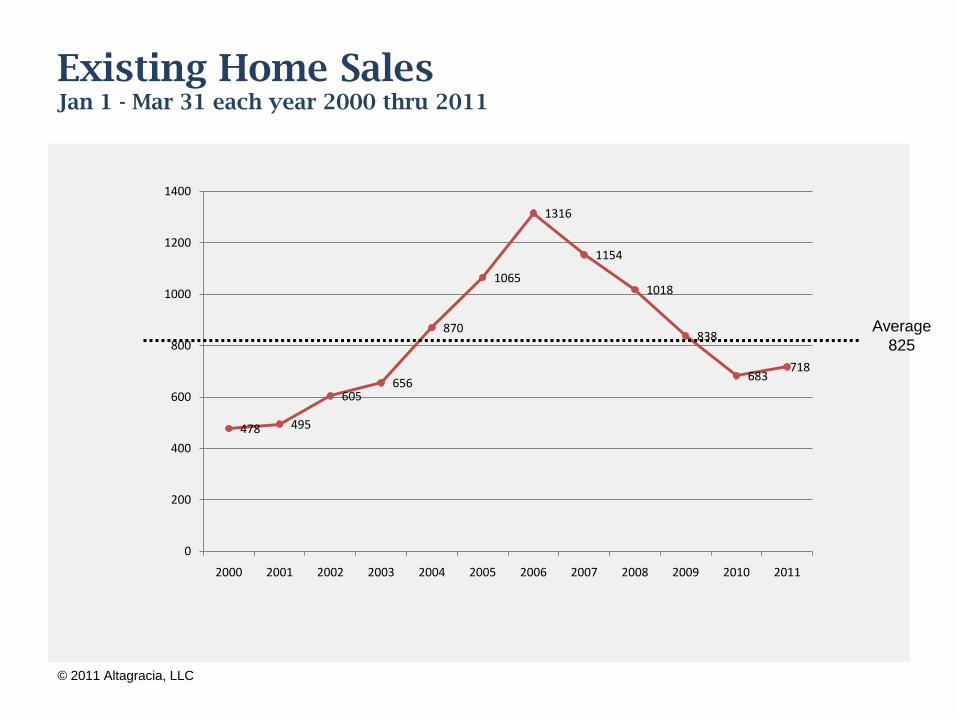
Existing Home Sales Jan 1 - Mar 31 each year 2000 thru 2011
© 2011 Altagracia, LLC
478 495
605656
870
1065
1316
1154
1018
838
683718
0
200
400
600
800
1000
1200
1400
2000 2001 2002 2003 2004 2005 2006 2007 2008 2009 2010 2011
Average
825

© 2011 Altagracia, LLC
New Construction Home Sales Jan 1 - Mar 31 each year 2000 thru 2011
200224 237
303 301
486
646
557526
480
395
464
0
100
200
300
400
500
600
700
2000 2001 2002 2003 2004 2005 2006 2007 2008 2009 2010 2011
Average
419

© 2011 Altagracia, LLC
Existing vs. New Construction Home Sales as a percentage of total sales in the market
The story of the Fayetteville real estate market over the last 3 or 4 years has been the increase of new construction home sales over existing home sales. As a percentage of total sales, new construction is increasing its market share. This is because buyers are showing they prefer new construction, not because there is a shortage of existing homes for sale.
25
35
45
55
65
75
2000 2001 2002 2003 2004 2005 2006 2007 2008 2009 2010 2011
Existing Homes
New Construction
Percent
of
Sales

Market Absorption RatesSupply and Demand
© 2011 Altagracia, LLC
It is difficult to judge how strong sales are in a market based solely on the number of homes sold. A better technique is to examine the absorption rate for a particular neighborhood.
Absorption rate is a measure of the inventory of homes for sale in the market. It is expressed by how many months it will take to sell, or “absorb” the homes currently for sale. Here’s a short example (courtesy of Zan Monroe, Senior Instructor, Council of Residential Specialists):
“If 12 homes sold in the last 12 months, that means the market will absorb 1 house per month, on average. If there are 10 homes currently on the market, there is a 10 month supply.”

Market Absorption RatesSupply and Demand
© 2011 Altagracia, LLC
The National Association of Realtors® considers that a 6 month supply of homes is a “balanced” market. If there is more than a 6 months supply of homes for sale, it is a buyers market because there are more homes available then there are buyers for them. If there is less than 6 months supply of homes, it is a sellers market.

© 2011 Altagracia, LLC
Absorption Rates Over TimeExisting Homes – All of the Fayetteville NC Market
Existing Homes
Fayetteville
Region
Period Ending March 31, 2011
Past 3 Months Past 6 Months Past 12 Months
Price Range
Homes
Sold
Avg
Sales per
Month
# Active
Listings
Monthly
Supply
Homes
Sold
Avg
Sales per
Month
# Active
Listings
Monthly
Supply
Homes
Sold
Avg
Sales per
Month
# Active
Listings
Monthly
Supply
< $100,000 324 108.00 821 7.60 596 99.33 821 8.27 1269 105.75 821 7.76
$100,000 - $149,999 207 69.00 923 13.38 464 77.33 923 11.94 1110 92.50 923 9.98
$150,000 - $199,999 127 42.33 801 18.92 276 46.00 801 17.41 705 58.75 801 13.63
$200,000 - $249,999 37 12.33 375 30.41 98 16.33 375 22.96 241 20.08 375 18.67
$250,000 -$299,999 25 8.33 267 32.04 51 8.50 267 31.41 155 12.92 267 20.67
$300,000 - 499,999 21 7.00 303 43.29 46 7.67 303 39.52 135 11.25 303 26.93
$500,000 - and up 3 1.00 119 119.00 8 1.33 119 89.25 18 1.50 119 79.33
Data provided by Fayetteville Regional Association of Realtors©. Information is deemed reliable but not guaranteed.

© 2011 Altagracia, LLC
Absorption Rates Over TimeExisting Homes – All of the Fayetteville NC Market
Absorption rates for the past 3 and 6 months are higher than those for the past 12 months, meaning that homes are selling slower. That is not unusual, as the spring and summer months are stronger for sales in this area. In every price range, however, it is still a buyers market, as there is much more inventory available than the market requires.
Balanced Market
6 months0
20
40
60
80
100
120
< $100,000 $100,000 -$149,999
$150,000 -$199,999
$200,000 -$249,999
$250,000 -$299,999
$300,000 -$499,999
$500,000 - and up
Past 3 Months
Past 6 Months
Past12 Months
Months
Supply
© 2011 Altagracia, LLC
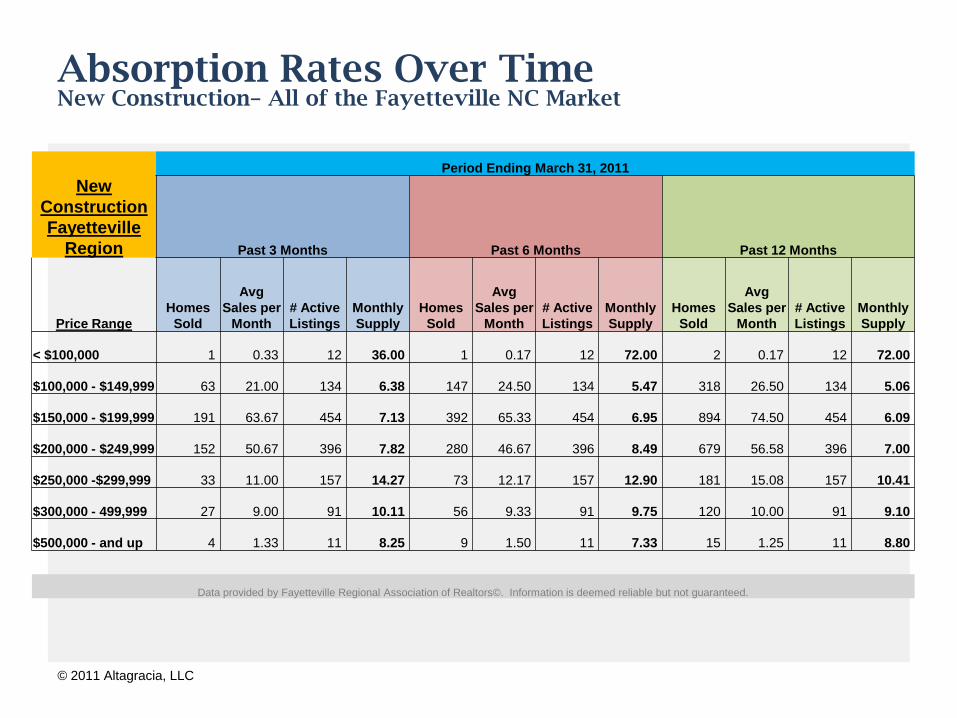
Absorption Rates Over TimeNew Construction– All of the Fayetteville NC Market
New
Construction
Fayetteville
Region
Period Ending March 31, 2011
Past 3 Months Past 6 Months Past 12 Months
Price Range
Homes
Sold
Avg
Sales per
Month
# Active
Listings
Monthly
Supply
Homes
Sold
Avg
Sales per
Month
# Active
Listings
Monthly
Supply
Homes
Sold
Avg
Sales per
Month
# Active
Listings
Monthly
Supply
< $100,000 1 0.33 12 36.00 1 0.17 12 72.00 2 0.17 12 72.00
$100,000 - $149,999 63 21.00 134 6.38 147 24.50 134 5.47 318 26.50 134 5.06
$150,000 - $199,999 191 63.67 454 7.13 392 65.33 454 6.95 894 74.50 454 6.09
$200,000 - $249,999 152 50.67 396 7.82 280 46.67 396 8.49 679 56.58 396 7.00
$250,000 -$299,999 33 11.00 157 14.27 73 12.17 157 12.90 181 15.08 157 10.41
$300,000 - 499,999 27 9.00 91 10.11 56 9.33 91 9.75 120 10.00 91 9.10
$500,000 - and up 4 1.33 11 8.25 9 1.50 11 7.33 15 1.25 11 8.80
Data provided by Fayetteville Regional Association of Realtors©. Information is deemed reliable but not guaranteed.

© 2011 Altagracia, LLC
Absorption rates for new construction for the past 3 and 6 months are generally higher than those for the past 12 months, meaning that homes are selling slower (probably seasonal.) The new construction market is balanced in the most popular price ranges, under $250,000. Builders are careful to not over-build, and have offered many incentives to buyers.
Absorption Rates Over TimeNew Construction– All of the Fayetteville NC Market
Months
Supply
0
2
4
6
8
10
12
14
16
18
< $100,000 $100,000 -$149,999
$150,000 -$199,999
$200,000 -$249,999
$250,000 -$299,999
$300,000 -$499,999
$500,000 - and up
Past 3 Months
Past 6 Months
Past 12 Months
Balanced
Market
6 Months

© 2011 Altagracia, LLC
In several of the more popular price ranges, newly constructed homes are selling more, and faster, than existing homes. Buyers are demonstrating that they favor the “new” factor and the amenities offered in many newly constructed homes. This puts additional pressure on home sellers to price their home competitively and to ensure their home is in top condition for sale, as it will have to compete with new construction for buyers’ attention.
ComparisonExisting Home Sales and New Construction Sales
Existing Homes Fayetteville Region
Period Ending March 31, 2011
Past 12 Months
Price Range Homes SoldAvg Sales per
Month# Active Listings
Monthly Supply
$150,000 - $199,999 705 58.75 801 13.63
$200,000 - $249,999 241 20.08 375 18.67
$250,000 -$299,999 155 12.92 267 20.67
New Construction Fayetteville Region
Period Ending March31, 2011
Past 12 Months
Price Range Homes SoldAvg Sales per
Month# Active Listings
Monthly Supply
$150,000 - $199,999 894 74.50 454 6.09
$200,000 - $249,999 679 56.58 396 7.00
$250,000 -$299,999 181 15.08 157 10.41

© 2011 Altagracia, LLC
The mid-range segment of the housing market, $150,000 to $299,999 is dominated by new construction sales. The current inventory of homes for sale is quite large, with over 2,900 homes for sale in these price ranges. As these charts clearly show, a larger number of new homes in these price ranges are being sold. Buyers are obviously choosing new homes over existing ones. These charts also show that there is no shortage of existing homes for sale.
ComparisonExisting Home vs. New Construction - $150,000 to $299,000
1443, 89%
184,11%
Existing Homes
Active
Pending
1023, 79%
267, 21%
New Construction
Active
Pending

© 2011 Altagracia, LLC
Absorption rates can be calculated for any neighborhood, and are the most accurate indicator of how to price a home for sale or purchase. For a home to be sold within a certain time period, it must be priced at the front of the market, given its location and condition.
The following 3 pages show absorption rates for 3 sample areas or neighborhoods: the Terry Sanford School District, zip code 28303, and Haymount.
If you want to know the absorption rates for any particular neighborhood, send an email to me at [email protected] or call Julissa Jumper at (910) 644-0303.
Absorption RatesSample Neighborhoods

© 2011 Altagracia, LLC
Absorption RatesExisting Homes - Terry Sanford School District
Terry Sanford
School District
Period Ending March 31, 2011
Past 3 Months Past 6 Months Past 12 Months
Price Range
Homes
Sold
Avg
Sales
per
Month
# Active
Listings
Monthly
Supply
Homes
Sold
Avg
Sales
per
Month
# Active
Listings
Monthly
Supply
Homes
Sold
Avg
Sales
per
Month
# Active
Listings
Monthly
Supply
< $100,000 19 6.33 43 6.79 36 6.00 43 7.17 69 5.75 43 7.48
$100,000 - $149,999 12 4.00 43 10.75 20 3.33 43 12.90 44 3.67 43 11.73
$150,000 - $199,999 10 3.33 58 17.40 26 4.33 58 13.38 66 5.50 58 10.55
$200,000 - $249,999 7 2.33 53 22.71 16 2.67 53 19.88 41 3.42 53 15.51
$250,000 -$299,999 2 0.67 37 55.50 7 1.17 37 31.71 26 2.17 37 17.08
$300,000 - 499,999 9 3.00 50 16.67 23 3.83 50 13.04 38 3.17 50 15.79
$500,000 - and up 3 1.00 46 46.00 11 1.83 46 25.09 15 1.25 46 36.80

© 2011 Altagracia, LLC
Absorption RatesExisting Homes - Zip Code 28303
Zip Code 28303
Period Ending March 31, 2011
Past 3 Months Past 6 Months Past 12 Months
Price Range
Homes
Sold
Avg
Sales
per
Month
# Active
Listings
Monthly
Supply
Homes
Sold
Avg
Sales
per
Month
# Active
Listings
Monthly
Supply
Homes
Sold
Avg
Sales
per
Month
# Active
Listings
Monthly
Supply
< $100,000 25 8.33 72 8.64 47 7.83 72 9.19 100 8.33 72 8.64
$100,000 - $149,999 14 4.67 69 14.79 39 6.50 69 10.62 84 7.00 69 9.86
$150,000 - $199,999 4 1.33 37 27.75 21 3.50 37 10.57 39 3.25 37 11.38
$200,000 - $249,999 1 0.33 33 99.00 3 0.50 33 66.00 15 1.25 33 26.40
$250,000 -$299,999 1 0.33 24 72.00 3 0.50 24 48.00 12 1.00 24 24.00
$300,000 - 499,999 5 1.67 20 12.00 15 2.50 20 8.00 23 1.92 20 10.43
$500,000 - and up 1 0.33 19 57.00 5 0.83 19 22.80 6 0.50 19 38.00

© 2011 Altagracia, LLC
Absorption RatesExisting Homes – Haymount
Neighborhood -
Haymount
Period Ending March 31, 2011
Past 3 Months Past 6 Months Past 12 Months
Price Range
Homes
Sold
Avg
Sales
per
Month
# Active
Listings
Monthly
Supply
Homes
Sold
Avg
Sales
per
Month
# Active
Listings
Monthly
Supply
Homes
Sold
Avg
Sales
per
Month
# Active
Listings
Monthly
Supply
< $100,000 5 1.67 3 1.80 5 0.83 3 3.60 12 1.00 3 3.00
$100,000 - $149,999 8 2.67 24 9.00 9 1.50 24 16.00 16 1.33 24 18.00
$150,000 - $199,999 6 2.00 21 10.50 12 2.00 21 10.50 20 1.67 21 12.60
$200,000 - $249,999 3 1.00 11 11.00 7 1.17 11 9.43 14 1.17 11 9.43
$250,000 -$299,999 1 0.33 12 36.00 4 0.67 12 18.00 9 0.75 12 16.00
$300,000 - 499,999 0 0.00 12 n/a 3 0.50 12 24.00 5 0.42 12 28.80
$500,000 - and up 1 0.33 8 24.00 2 0.33 8 24.00 4 0.33 8 24.00

Summary
© 2011 Altagracia, LLC
There are far more houses for sale in the Fayetteville, NC real estate market than will be able to sell in the next 6 months. The implications of that for sellers is that they must maintain, price, and market their home at the very front of the market if they have a realistic chance of selling it within their time frame. The task is made more difficult because of the competition from new construction homes, many offered with builder incentives.
That reality is tempered by the fact that real estate sales are very local—some homes in popular neighborhoods continue to sell at a favorable pace. Sellers should check with their real estate agent to determine how their home compares to others, and what the absorption rates are for homes similar to theirs.
For buyers, the opposite is true. There is an incredible selection of homes available right now, mortgage rates are very low, and it is an ideal time to purchase a home. A note of caution, however—homes are generally not losing value and a buyer should not expect to purchase a home for much less than it is worth. Many sellers will opt to put their homes on the rental market instead of selling if their home does not sell in a reasonable amount of time.

Fayetteville NC Real Estate
© 2011 Altagracia, LLC
If you have questions about this report, or want to know more information, please call Julissa Jumper at (910) 644-0303.
The Julissa Jumper Real Estate Team
Keller Williams Realty
639 Executive Place
Suite 100
Fayetteville, NC 28305