Embed Size (px)
Citation preview

Send Orders for Reprints to [email protected]
966 The Open Mechanical Engineering Journal, 2015, 9, 966-972
1874-155X/15 2015 Bentham Open
Open Access
Fault Detection Approach Based on Weighted Principal Component Analysis Applied to Continuous Stirred Tank Reactor Shanmao Gu*, Yunlong Liu, Ni Zhang, De Du
College of Information and Control Engineering, Weifang University, Weifang 261061, P.R. China
Abstract: Fault detection approach based on principal component analysis (PCA) may perform not well when the process is time-varying, because it can cause unfavorable influence on feature extraction. To solve this problem, a modified PCA which considering variance maximization is proposed, referred to as weighted PCA (WPCA). WPCA can obtain the slow features information of observed data in time-varying system. The monitoring statistical indices are based on WPCA model and their confidence limits are computed by kernel density estimation (KDE). A simulation example on continuous stirred tank reactor (CSTR) show that the proposed method achieves better performance from the perspective of both fault detection rate and fault detection time than conventional PCA model.
Keywords: Chemical process, continuous stirred tank reactor, fault detection, time-varying, weighted principal component analysis.
1. INTRODUCTION
With the development of modern process control techniques in production, fault detection has been playing an important role in ensuring long-term and efficient operation in chemical process. It is difficult to build mathematical models in the domain of model-based monitoring techniques. Data-based methods are often employed to build statistical models, in which only historical operating data is considered without any mathematical models. Multivariate statistical process monitoring (MSPM) methods are also data-based fault detection methods used widely. There have been some standard successfully designed models during the past several decades. High-dimensional data often include some redundant information, such as noises, thus the key point of MSPM is to monitor main extracted features of observed data [1-3]. Among MSPM methods, principal component analysis (PCA), canonical variate analysis (CVA), and independent component analysis (ICA) have been widely used for fault detection in chemical process in [4-6]. For example, PCA can deal with high-dimensional data that are highly linear correlated. Process monitoring is then performed in the principal component (PC) subspace and residual subspace separately to detect the data changes inside and outside the PC subspace. Extended methods have been reported for better monitoring performance [7-9]. Ku [10] proposed dynamic PCA (DPCA) in which serial correlation of data is considered. A multi-fault diagnosis method for sensor systems based on PCA was presented in [11]. An image reconstruction method for electrical capacitance tomography based on robust PCA was given in [12]. To address the
*Address correspondence to this author at the College of Information and Control Engineering, Weifang University, Weifang 261061, PR China; Tel: 086+186-5471-0898; E-mail: [email protected]
nonlinear behavior of a process, some nonlinear extensions of traditional PCA method have already been proposed such as auto associative neural network, principle curves and the other methods [13-14]. A nonlinear process monitoring method based on kernel function was proposed in [15]. Luna [16] proposed generalized principal component analysis (GPCA) method applied to the time-of-flight values. Kernel PCA (KPCA) can map the input space into a linear feature space via a nonlinear mapping, and an improved multi-scale KPCA was presented in [17]. Lee [18] proposed multiway principal component analysis (MPCA) to extract the information in the multivariable data to monitor batch process. Aiming to tackle the problem of multiscale and nonlinear, multiscale KPCA [19] was applied to capture correlations of process variables at every possible scale. For large-scale chemical process, a fault detection approach was proposed based on multiblock KPCA, and the proposed decentralized nonlinear approach effectively captured the nonlinear relationship in the block process variables and showed superior fault diagnosis ability compared with other methods in [20]. However, in these methods the local manifold structure of high-dimensional data was considered. Deng [21] proposed sparse kernel locality preserving projection method in nonlinear process fault detection. The findings suggest that PCA may extract useful information for feature extraction, and it is a promising method for data-based fault detection in chemical process. However, the conventional PCA method fails to handle the time-varying process. To some extent, it may not extract much useful information, which limits its application. Slow feature analysis (SFA), which emerged as a new dimension reduction method in recent years, was proposed in [22]. SFA aims for extracting invariant features from high-dimensional measurements. It can extract the slowly varying features from input signals, which is useful for classification and identification. SFA had been applied in many kinds of fields [23-25]. For example, Ma proposed kernel-based
Fault Detection Approach Based on Weighted Principal Component Analysis The Open Mechanical Engineering Journal, 2015, Volume 9 967
method to solve the nonlinear expansion problem of SFA using an algorithm evaluation criterion [26]. However, all the above mentioned method may perform not well when the process is time-varying, because it can cause unfavorable influence on feature extraction for conventional PCA. To solve this problem, a modified PCA is proposed considering slow features extraction of time-varying signals, referred to as weighted PCA (WPCA) in this paper.
2. WEIGHTED PRINCIPAL COMPONENT ANALYSIS
2.1. Principal Component Analysis
PCA is a kind of linear dimension reduction technique which can preserve meaningful information hidden between the original variables. In PCA method, the high-dimensional data can be projected onto a low-dimensional space by orthogonal transformation, so that low-dimensional and uncorrelated principal components can be obtained. By extracting the main features of observed data, it removes linear correlations between the variables in the high-dimensional space.
Let X = (x1, x2,...xn ) be the high-dimensional data matrix with n samples of process vector xi ∈Rm . Let
Y = ( y1, y2,...yn ) be the low dimensional outputs with n samples of vector yi ∈Rd . W = (w1,w2,...wd ) is defined as transformation matrix, and the vector yi can be obtained by PCA transformation as follows:
T , 1,2,...i i i n= =y W x (1)
which is also called PC vectors or score vectors. Here
wi ∈Rm are the projection vectors and it projects original data into score space. Usually, the first d eigenvectors are selected to build PCA fault detection model.
X = WY + E = WW T X + E (2) The matrix E is residual matrix. In the dimension reduction process of PCA, sum of squared reconstruction errors between high-dimensional and low-dimensional space is to be minimized, as follows [24]:
minE = min xi − (xi ⋅w j )w j
j=1
d
∑2
i=1
n
∑ (3)
Solving the problem of the objective function we can derive transformation vectors. Besides, the formula (4) should satisfy the condition of T 1j j =w w .
max (xi ⋅w j )w j
j=1
d
∑2
i=1
n
∑ (4)
Equation (4) can be further written as:
max wT XX Tws.t wTw = 1
(5)
Therefore, the vectors w can be obtained by solving the eigenvalue equation described as follows:
XX Tw = λw (6)
For a new sample xnew , the corresponding score vector
ynew and residual vector enew can be calculated as:
ynew =W T xnew (7)
enew = xnew −Wynew (8)
Finally, the Hotelling’s T 2 index and the SPE (or Q statistic) index are used to monitor the difference both the normal variation information and residual space information.
2.2. Slow Feature Analysis
2.2.1. Problem Statement
SFA is a new emerged method for extracting temporally coherent features out of high-dimensional data. SFA focuses on finding common slower variation components of the input signals, i.e. the higher-order statistics of input data. Besides, the obtained feature components are mutually unrelated and independent.
Let x(t) = [x1(t), x2 (t),..., xm (t)]T be an m-dimensional
input signals. Let y(t) = [ y1(t), y2 (t),...yd (t)]T be d
dimensional output signals. SFA can find out a set of real-valued functions f (x) = ( f1(x),..., fd (x))
T in a function space F, so that y(t) can be generated with yi (t) = fi (x(t)) which varies as slowly as possible. The objective is to minimize the squared mean of this derivative under the strong limitation as follows:
minΔyj (t) =< yj2 >t (9)
Under the constraints of
< yj >t= 0 (10)
< yj2 >t= 1 (11)
and
∀i < j,< yiyj >t= 0 (12)
where y is the first order derivative of y, and < .>t is the sample mean over all the available time. In the paper, the first order derivative of y is obtained from the discrete
temporal derivative as yj (t) = f j (x(t))− f j (x(t −1)) . Equation (9) introduces the temporal variation measures of the output signals, which is equal to the means of the squared first order derivative of the signals. The value is larger for signals quickly varying and close to zero for lower varying signals. The zero mean constraint (10) is introduced only for convenience. Constraint (11) means for transformed output signals should carry some information and ensure constant signals yj (t) = const of emerging. Constraint (12) forces that different output components carry different information,
968 The Open Mechanical Engineering Journal, 2015, Volume 9 Gu et al.
which are uncorrelated and reflect different characteristics of input data.
2.2.2. The Calculation of Slow Feature
Let us consider the linear case first for the input vector x and weight vector w j .
fi (x) = w jT x (13)
In the following, we assume x to have zero mean without loss of generality. Equations (9), (11) and (12) can be rewritten as
!
Δyj (t) =< yj2 >t = < (w j
T x)2 >t =
w jT < x xT >t w j = w j
T Aw j
(14)
where A =< x xT >t is the expectation of the covariance matrix of the temporal first order derivative of the input vectors. With SFA algorithm, Δy1 ≤ Δy2...≤ Δyd , the most slowly varying outputs can be introduced. So it induces an order, the first output signal being the slowest one, the second being the second slowest, and so on.
2.3. Fault Detection Based on WPCA
2.3.1. WPCA Algorithm
The essence of those dimensional-reduction methods such as PCA, is to project the observed data from a high-dimensional space into a low-dimensional space by certain transformations. Fewer latent variables can be acquired by some criteria which represent the main information of original data. We believe that using a weighted criterion in dimension reduction methods would extract more thorough feature information. The time-varying information always exists in the variables along with the progression of time. In PCA algorithm, it cannot consider the time-varying characteristics of the observed data. As mentioned earlier, SFA succeeds in finding optimal slowly varying features hidden in the input signals. This conclusion motivates us to integrate SFA with PCA into a new multivariable statistical monitoring method. We take into account the slow features extraction from the input information. The optimization function of PCA is fused with SFA. It is converted to a maximization problem under the constraints by solving the joint objective function. For PCA, the optimization function refers as follows:
J1 = max wT XX Tw (15)
Let Δx(t) = x(t)− x(t −1) , and ΔX = [Δx1,Δx2...Δxn ] be the incremental matrices. Be similar as SFA, the corresponding objective function can be as follows:
! J2 =min wTΔXΔX Tw (16)
As analyzed previously, there are some similarities between the two objective functions, J2 and J1, so we can introduce J2 to J1 to achieve integration. Therefore, WPCA proposed in the paper can solve the problem brought by
time-varying input signals. The objective function can be reformulated further as J.
J = max αwT XX Tw − (1−α )wTΔXΔX Tw (17)
where α is a balancing factor ranging [0,1]. Equation (17) can be rewritten as follows.
J = max wT(αXX T − (1−α )(ΔXΔX T ))w = max wT X 'ws.t wTw = 1
(18)
where ! X'=!αXX T − (1−α )(ΔXΔX T ) . We can solve the
problem to obtain the optimal projection vectors and corresponding eigenvalues.
X'w = λw (19)
The majority information can be retained in the projected data when the high-dimensional data space is reduced into a low-dimensional space. The cumulative contribution rate can be used to calculate dimensionality d.
Therefore, the low-dimensional linear features are extracted by transformation projection vectors once we obtain projection vectors w1,w2,wd .
yi =W T xi , i = 1, 2…n (20)
The output principal vectors Y is an orthonormal set of vectors representing the eigenvectors of the sample covariance matrix associated with d < m of the PCs.
For a new sample xnew , the corresponding output vector
ynew and residual vector enew can be obtained as follows:
ynew =W T xnew (21)
enew = xnew −Wynew (22)
WPCA takes into account the time-varying data features information and data variability simultaneously. It considers incremental covariance matrix when executing covariance matrix decomposition in PCA, so that the data collected can be considered more thoroughly from different perspectives. Besides, we can infer correlations between WPCA and DPCA from the view of dynamic data.
2.3.2. Monitoring Statistics Based on WPCA
Based on WPCA model, the monitoring statistics T 2 and Q are built in the PC subspace and residual space for fault detection. T 2 monitoring index is used to measure the feature data variation in the PC subspace, which is defined as
T2 = yTΛ y = yT[(YY T + β I ) / (n −1)]−1 y (23)
where β>0 is regularization parameters, and Y is output matrix of the normal condition in the training procedure. Q statistic is a measure of error between deviation trend and statistical model for every sample. It can also be used to estimate the external data variation in the residual space.
Q SPE = eTe = (x −Wy)T(x −Wy) (24)
Fault Detection Approach Based on Weighted Principal Component Analysis The Open Mechanical Engineering Journal, 2015, Volume 9 969
After the monitoring statistic is obtained, the upper control limits should be calculated to determine whether the monitored process is in control. Given that the output signals are not strictly Gaussian distribution, the upper control limits of T 2 and Q can be calculated by kernel density estimate (KDE) method.
2.3.3. Fault Detection Based on WPCA
The monitoring method based on WPCA algorithm includes two stages: offline modeling stage and online fault detection stage. The detailed procedure is demonstrated in the following text. The normal operating model is set up by WPCA in the offline modeling procedure, and the confidence limits of T 2 and Q monitoring indexes are obtained by KDE. The offline modeling procedure is summarized as follows: 1) Acquire data sets X under normal condition, calculate
mean and variance of normal operating data, and acquire its corresponding incremental matrices.
2) Apply WPCA model by solving generalized eigenvalues problem in (17) to get the projection vectors w.
3) Project the data matrix X into the WPCA subspace to obtain the transformation feature components, and reconstruct the corresponding residual matrix E.
4) Calculate the two monitoring statistics T 2 , Q respectively.
5) Determine the control limits of T 2 and Q statistics by KDE.
At the end of office, T 2 and Q have been obtained from the model built above. In the online stage, statistics T 2 and Q of new data collected are to be calculated, hence to determine whether process at present is under normal operation state. 1) Standardize new data to normal distribution with
mean and variance from the offline modeling stage.
2) Calculate statisticsT 2 andQ for the standardized data based on WPCA model with Eq. (21-24).
3) Determine whether T 2 and Q respectively exceed their control limits obtained in off line stage, and give an alarm if either statistic exceeds its corresponding limit.
3. ANALYSIS OF CSTR PROCESS
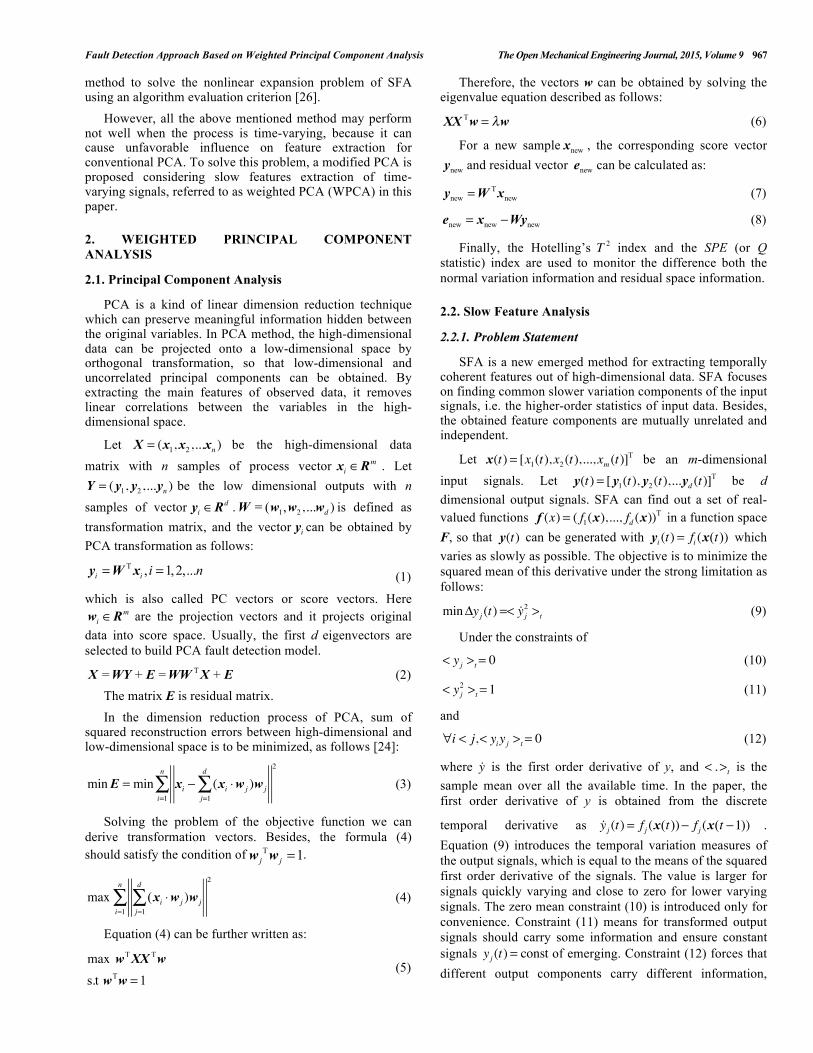
In this section, the process monitoring method based on WPCA is evaluated for comparison with PCA-based fault detection in the continuous stirred tank reactor (CSTR) benchmark process. The proposed fault detection method based on WPCA is tested in a simulated chemical process, CSTR system (Fig. 1). CSTR system is commonly used as a basic unit in chemical process, and it is also the core of many large and complex processes. Research on CSTR system for fault detection provides universal interest. In the simulation,
there are ten process variables collected under normal condition and common faults condition. The sampled data are collected every 12 seconds and 2000 samples are obtained. A fault is introduced after every 300 samples.
AFC FQ FT
CQ CFT
AC Q
CQ CT
LT LC
FC FT
FC FT
TTTC
T
h
Fig. (1). CSTR system.
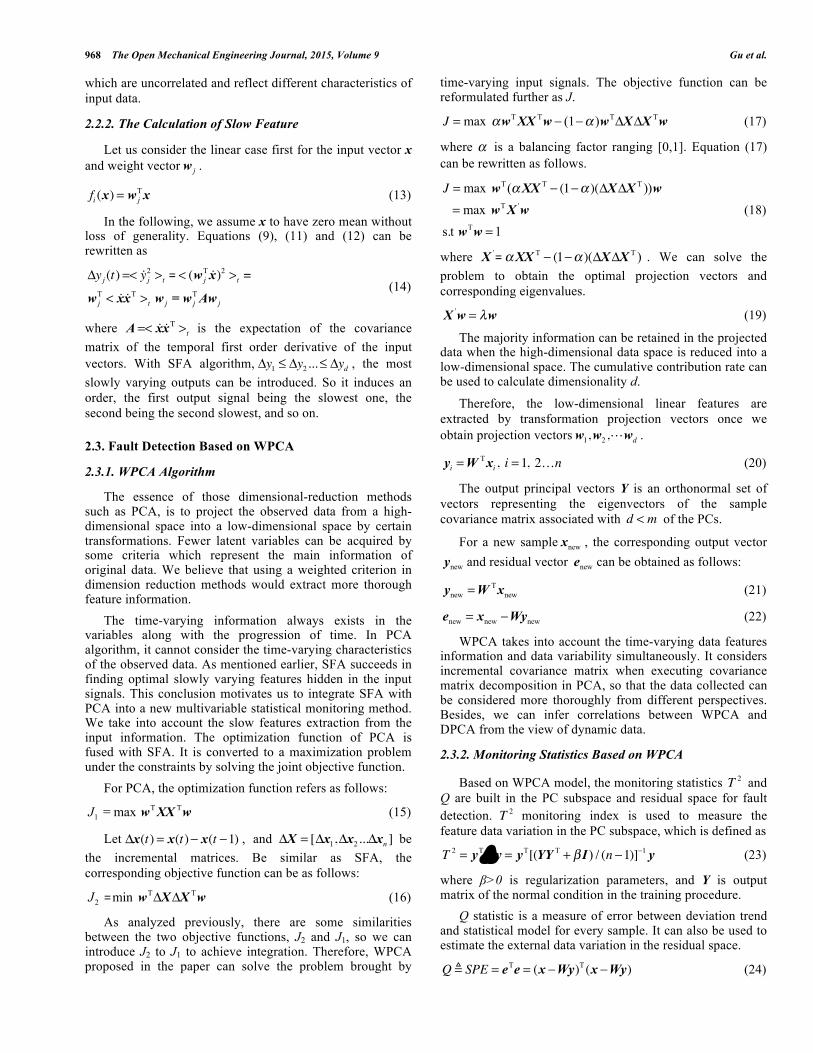
Both methods PCA and WPCA are applied to fault detection for performance comparison. Two monitoring statistics T 2 and Q are plotted as solid line and the corresponding confidence limits are plotted as dashed line (Fig. 2). The confidence limit for fault detection is set to 95% for convenience of methods comparison. There are 1000 samples under normal condition used for model establishing, and another 2000 normal samples are used to calculate confidence limits for the monitoring statistics. Weighted parameter α determines the difference for features extraction, and its value influences fault detection performance directly. Catalyst deactivation is a kind of common fault, which is applied to analyze the fault detection results with different α . Reference for experience and simulation results of different parameters, 0.85 is favorable to have a better fault detection result. And, 6 PCs are selected to explain about 91.39% of the all the variance information using WPCA fault detection method, which can be seen from Fig. (2).
Fig. (2). Cumulative variance contribution rate of variable (CCR).
After the WPCA fault detection model is established, the monitoring performance is evaluated using samples under normal condition. The fault detection result is shown in Fig. (3). We can see that the proposed method has the better process monitoring performance. It illustrated further that
0 2 4 6 8 100.4
0.6
0.8
1
X: 6Y: 0.9139
Variable
CCR

970 The Open Mechanical Engineering Journal, 2015, Volume 9 Gu et al.
WPCA can acquire more information from the high-dimensional data which is helpful for fault detection.
(a)
(b)
Fig. (3). Monitoring charts under normal condition based on (a) WPCA (T2), (b) WPCA (Q).
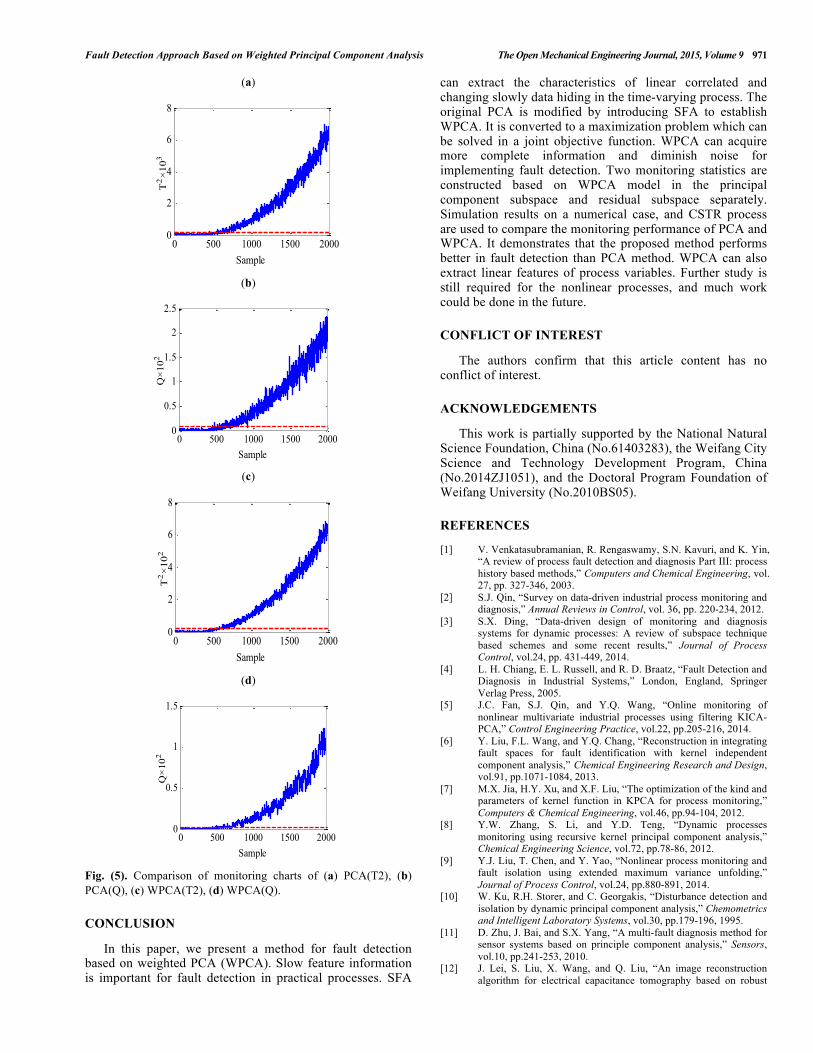
Two typical faults are illustrated to show the effectiveness of WPCA method. The first fault is associated with a small step change of inlet stream. As shown in Fig. (4), the T2 and Q monitoring charts of PCA method are plotted for this fault and the fault detection rates by the T2 and Q chart are 57.82% and 47.24%. When the proposed WPCA is applied, fault detection rates of T2 and Q chart are 83.29% and 73.21%, respectively. The result indicates the proposed method has a superior capability in detecting faults. It can reduce the information loss problem and improve detection rates of the statistics. Another fault is that coolant feed temperature ramps down. The monitoring results are also illustrated (Fig. 5) to show the effectiveness of WPCA. T2 and Q monitoring charts of PCA can detect the fault at samples 561 and 580 respectively. However, T2 monitoring chart of WPCA fault detection method can find the process abnormality at the 544th sample while Q monitoring chart of WPCA discovers the fault at the 498th sample. With 17 and 82 sampling time earlier the proposed method demonstrates that improved the monitoring performance. In addition, the two methods have different fault alarming rates. Fault missing rates of PCA are 17.53% and 19.24% for T2 and Q statistics, and WPCA performs better whose fault missing rates are 15.16% and 12.18%. WPCA can detect the fault more effectively than PCA.
(a)
(b)
(c)
(d)
Fig. (4). Comparison of monitoring charts of (a) PCA(T2), (b) PCA(Q), (c) WPCA(T2), (d) WPCA(Q).
0 500 1000 1500 20000
1
2
3
4
5
Sample
T2 ×102
0 500 1000 1500 20000
0.5
1
1.5
2
Sample
Q×101
0 500 1000 1500 20000
2
4
6
8
Sample
T2 ×102
0 500 1000 1500 20000
2
4
6
8
Sample
Q×100
0 500 1000 1500 20000
2
4
6
8
Sample
T2×101
0 500 1000 1500 20000
1
2
3
4
5
Sample
Q×101
Fault Detection Approach Based on Weighted Principal Component Analysis The Open Mechanical Engineering Journal, 2015, Volume 9 971
(a)
(b)
(c)
(d)
Fig. (5). Comparison of monitoring charts of (a) PCA(T2), (b) PCA(Q), (c) WPCA(T2), (d) WPCA(Q).
CONCLUSION
In this paper, we present a method for fault detection based on weighted PCA (WPCA). Slow feature information is important for fault detection in practical processes. SFA
can extract the characteristics of linear correlated and changing slowly data hiding in the time-varying process. The original PCA is modified by introducing SFA to establish WPCA. It is converted to a maximization problem which can be solved in a joint objective function. WPCA can acquire more complete information and diminish noise for implementing fault detection. Two monitoring statistics are constructed based on WPCA model in the principal component subspace and residual subspace separately. Simulation results on a numerical case, and CSTR process are used to compare the monitoring performance of PCA and WPCA. It demonstrates that the proposed method performs better in fault detection than PCA method. WPCA can also extract linear features of process variables. Further study is still required for the nonlinear processes, and much work could be done in the future.
CONFLICT OF INTEREST
The authors confirm that this article content has no conflict of interest.
ACKNOWLEDGEMENTS
This work is partially supported by the National Natural Science Foundation, China (No.61403283), the Weifang City Science and Technology Development Program, China (No.2014ZJ1051), and the Doctoral Program Foundation of Weifang University (No.2010BS05).
REFERENCES
[1] V. Venkatasubramanian, R. Rengaswamy, S.N. Kavuri, and K. Yin, “A review of process fault detection and diagnosis Part III: process history based methods,” Computers and Chemical Engineering, vol. 27, pp. 327-346, 2003.
[2] S.J. Qin, “Survey on data-driven industrial process monitoring and diagnosis,” Annual Reviews in Control, vol. 36, pp. 220-234, 2012.
[3] S.X. Ding, “Data-driven design of monitoring and diagnosis systems for dynamic processes: A review of subspace technique based schemes and some recent results,” Journal of Process Control, vol.24, pp. 431-449, 2014.
[4] L. H. Chiang, E. L. Russell, and R. D. Braatz, “Fault Detection and Diagnosis in Industrial Systems,” London, England, Springer Verlag Press, 2005.
[5] J.C. Fan, S.J. Qin, and Y.Q. Wang, “Online monitoring of nonlinear multivariate industrial processes using filtering KICA-PCA,” Control Engineering Practice, vol.22, pp.205-216, 2014.
[6] Y. Liu, F.L. Wang, and Y.Q. Chang, “Reconstruction in integrating fault spaces for fault identification with kernel independent component analysis,” Chemical Engineering Research and Design, vol.91, pp.1071-1084, 2013.
[7] M.X. Jia, H.Y. Xu, and X.F. Liu, “The optimization of the kind and parameters of kernel function in KPCA for process monitoring,” Computers & Chemical Engineering, vol.46, pp.94-104, 2012.
[8] Y.W. Zhang, S. Li, and Y.D. Teng, “Dynamic processes monitoring using recursive kernel principal component analysis,” Chemical Engineering Science, vol.72, pp.78-86, 2012.
[9] Y.J. Liu, T. Chen, and Y. Yao, “Nonlinear process monitoring and fault isolation using extended maximum variance unfolding,” Journal of Process Control, vol.24, pp.880-891, 2014.
[10] W. Ku, R.H. Storer, and C. Georgakis, “Disturbance detection and isolation by dynamic principal component analysis,” Chemometrics and Intelligent Laboratory Systems, vol.30, pp.179-196, 1995.
[11] D. Zhu, J. Bai, and S.X. Yang, “A multi-fault diagnosis method for sensor systems based on principle component analysis,” Sensors, vol.10, pp.241-253, 2010.
[12] J. Lei, S. Liu, X. Wang, and Q. Liu, “An image reconstruction algorithm for electrical capacitance tomography based on robust
0 500 1000 1500 20000
2
4
6
8
Sample
T2 ×103
0 500 1000 1500 20000
0.5
1
1.5
2
2.5
Sample
Q×102
0 500 1000 1500 20000
2
4
6
8
Sample
T2 ×102
0 500 1000 1500 20000
0.5
1
1.5
Sample
Q×102

972 The Open Mechanical Engineering Journal, 2015, Volume 9 Gu et al.
principle component analysis,” Sensors, vol.13, pp.2076-2092, 2013.
[13] D. Dong, and T.J. McAvoy, “Nonlinear principal component analysis based on principal curve and neural network,” Computers and Chemical Engineering, vol.20, pp.65-78, 1996.
[14] W.M. Zheng, C.R. Zou, and L. Zhao, “An improved algorithm for kernel principal component analysis,” Neural Processing Letters, vol.22, pp.49-56, 2005.
[15] Y.W. Zhang, “Enhanced statistical analysis of nonlinear processes using KPCA, KICA and SVM,” Chemical Engineering Science, vol.64, pp.801-811, 2009.
[16] C. A. Luna, J. A. Jimnéez and C. Losada, et al, “GPCA vs. PCA in recognition and 3-D localization of ultrasound reflectors,” Sensors, Vol.10, pp.4825-4837, 2010.
[17] Y.W. Zhang, S. Li and Z.Y. Hu, “Improved multi-scale kernel principal component analysis and its application for fault detection,” Chemical Engineering Research and Design, Vol.90, pp.1271-1280, 2012.
[18] J.M. Lee, C.K. Yoo and I.B. Lee, “Fault detection of processes using multiway kernel principal component analysis,” Computers and Chemical Engineering, Vol.28, pp.1837-1847, 2004.
[19] S.W. Choi, J.L. Morris and I.B. Lee, “Nonlinear multiscale modeling for fault detection and identification,” Chemical Engineering Science, Vol.63, pp.2252-2266, 2008.
[20] Y.W. Zhang, H. Zhou and S.J. Qin, “Decentralized fault diagnosis of large-scale processes using multiblock kernel principal component analysis,” Acta Automatica Sinica, Vol.36, pp.593-597, 2010.
[21] X.G. Deng, X.M. Tian, “Sparse kernel locality preserving projection and its application in nonlinear process fault detection,” Chinese Journal of Chemical Engineering, Vol.21, pp. 163-170, 2013.
[22] L. Wiskott, T. Sejnowski, “Slow feature analysis: unsupervised learning of invariance,” Neural Computation, Vol.14, pp.715-770, 2002.
[23] L. Wiskott, P. Berkes, “Is slowness a learning principle of the visual cortex,” Special Issue of Zoology, Vol.106, pp.373-382, 2003.
[24] T. Blaschke, L. Wiskott, “Independent slow feature analysis and nonlinear blind source separation,” Neural Computation, Vol.19, pp.994-1021, 2007.
[25] C. Wu, “Slow feature analysis for change detection in multispectral imagery,” IEEE Transactions on Geosciences and Remote Sensing, Vol.52, pp.2858-2874, 2013.
[26] K.J. Ma, Y.J. Han, Q. Tao and J. Wang, “Kernel-based slow feature analysis,” Pattern Recognition and Artificial Intelligence, Vol.24, pp.153-159, 2011.
Received: February 17, 2015 Revised: March 21, 2015 Accepted: June 9, 2015 © Gu et al.; Licensee Bentham Open.
This is an open access article licensed under the terms of the (https://creativecommons.org/licenses/by/4.0/legalcode ), which permits unrestricted, non-commercial use, distribution and reproduction in any medium, provided the work is properly cited.