Embed Size (px)
Citation preview
Louisiana State UniversityLSU Digital Commons
LSU Historical Dissertations and Theses Graduate School
1970
Fatty Acid Composition of Batter Coated ChickenParts.James Lee Heath IIILouisiana State University and Agricultural & Mechanical College
Follow this and additional works at: https://digitalcommons.lsu.edu/gradschool_disstheses
This Dissertation is brought to you for free and open access by the Graduate School at LSU Digital Commons. It has been accepted for inclusion inLSU Historical Dissertations and Theses by an authorized administrator of LSU Digital Commons. For more information, please [email protected].
Recommended CitationHeath, James Lee III, "Fatty Acid Composition of Batter Coated Chicken Parts." (1970). LSU Historical Dissertations and Theses. 1782.https://digitalcommons.lsu.edu/gradschool_disstheses/1782
/I
71-3414HEATH III, James Lee, 1939-
FATTY ACID COMPOSITION OF BATTER COATED CHICKEN PARTS.
The Louisiana State University and Agricultural \
and Mechanical College, Ph.D., 1970 \
Agriculture, general [
ii>
ij
University Microfilms, Inc., Ann Arbor, Michigan i;
THIS DISSERTATION HAS BEEN MICROFILMED EXACTLY AS RECEIVED
PATTY ACID COMPOSITION OP BATTER COATED CHICKEN PARTS
A Dissertation.
Submitted, to the Graduate Paculty of the Louisiana State University and
Agricultural and Mechanical College in partial fulfillment of the
requirements for the degree of Doctor of philosophy
inTbe Department of Poultry Science
byJames Lee Heath III
B.S., Louisiana State University, 1963 M.S., Louisiana State University, 1968
May, 1970
ACKNOWLEDGMENTS
This study would not have been possible without the assistance of many persons. I would like to take
this opportunity to express my gratitude for their help and support.
Special appreciation is extended to Dr. R. A. Teekell for his guidance, advice, and encouragement throughout the study.
A special expression of gratitude is extended to Dr. A. B. Watts, Head, Poultry Science Department, for his encouragement, advice, and for making graduate study a possibility.
Sincere appreciation is extended to Dr. W. A. Johnson for his assistance in the analysis of the data from this experiment.
Special thanks are expressed to all members of the faculty, staff and graduate students for the help they gave.
To my wife, Mary, I wish to express heartfelt
thanks for her patience, understanding, encouragement, and all the things which words cannot express without which this work could not have been accomplished.
ii
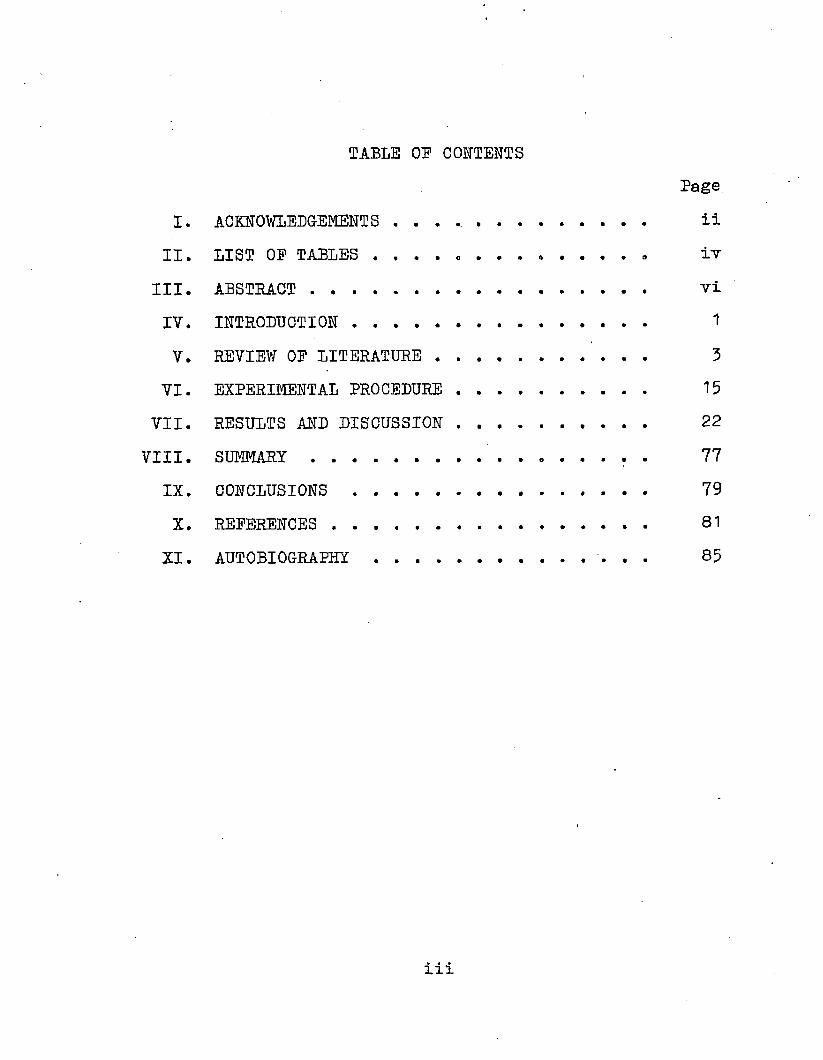
TABLE OB CONTENTSPage
I. ACKNOWLEDGEMENTS .................. iiII. LIST OB TABLES . . . . . . . . . . . . . . ±v
III. ABSTRACT................................... viIV. INTRODUCTION ............................... 1V. REVIEW OB LITERATURE...................... 3
VI. EXPERIMENTAL PROCEDURE .................... 15VII. RESULTS AND DISCUSSION.................... 22
VIII. S U M M A R Y ........................ 77IX. C O NCLUSIONS.......................... 79X. REBERENCES................................. 81
XI. AUTOBIOGRAPHY........................ 85
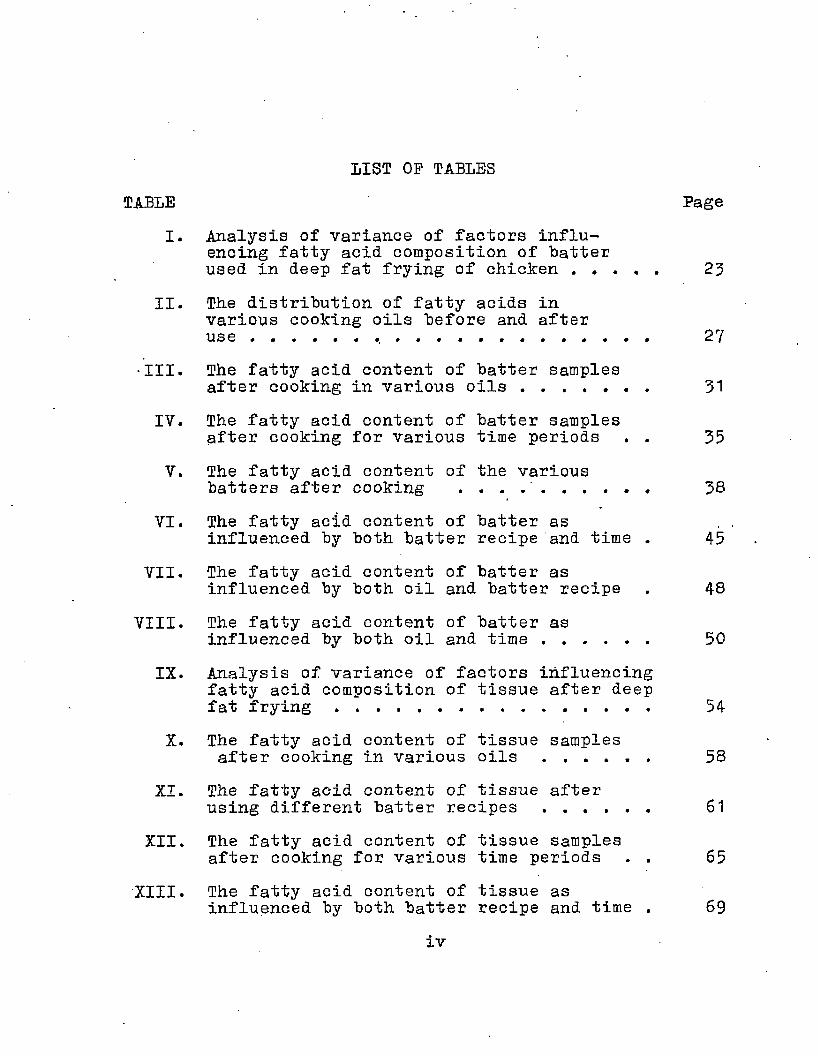
LIST OF TABLESTABLE Page
I. Analysis of variance of factors influencing fatty acid composition of Latter used in deep fat frying of chicken........... 23
II. The distribution of fatty acids invarious cooking oils before and afteru s e ............. ............................. 27
■III. The fatty acid content of batter samplesafter cooking in various o i l s .............. 31
IV. The fatty acid content of batter samplesafter cooking for various time periods . . 35
V. The fatty acid content of the variousbatters after cooking . . . . . . . . . . 38
VI. The fatty acid content of batter asinfluenced by both batter recipe and time . 45
VII. The fatty acid content of batter asinfluenced by both oil and batter recipe . 48
VIII. The fatty acid content of batter asinfluenced by both oil and t i m e .......... 50
IX. Analysis of variance of factors influencing fatty acid composition of tissue after deep fat f r y i n g .......................... 54
X. The fatty acid content of tissue samplesafter cooking in various o i l s .... 58
XI. The fatty acid content of tissue afterusing different batter recipes ........... 61
XII. The fatty acid content of tissue samplesafter cooking for various time periods . . 65
XIII. The fatty acid content of tissue asinfluenced by both batter recipe and time . 69
iv
1,1 ST OF TABLES(Continued)
TABLE PageXIV. The fatty acid content of tissue as
influenced by both oil and t i m e ............. 72XV. The fatty acid content of tissue as
influenced by both oil and batter recipe . . 74
v
ABSTRACT
' This experiment was conducted to study the fatty acid composition of batter coated chicken parts as affected by cooking oil, batter recipes, and time of cooking.
The fatty acid composition of the batter and tissue portions of a batter coated drumstick was used as a criterion.
The oils penetrated into and through the batter into the tissue sample. The fatty acids in the batter and two fatty acids in the tissue, linoleic and linolenic, were found .to be influenced by the cooking oil. The five oils used, cottonseed, corn, peanut, lard, and a commercially mixed oil, varied in their contribution of the various fatty acids.
The factor having the greatest influence on the tissue samples was time of cooking. The only fatty acids studied which did not show an increase in concentration as time increased from two to eight and finally 14 minutes were palmitoleic, stearic, and linolenic acids, with the latter approaching significance. A significant time effect was found in the batter samples when oleic and linoleic acids were
vi
considered.Changing the ingredients of the hatter only
influenced two fatty acids, linoleic and linolenic, to any extent and these were "both found in the tissue samples. The changing of the hatter recipe was thought to have an effect upon the cooking oil depending upon what was excluded. The ingredients which were excluded from the complete fritter type hatter were; egg, non-fat milk solids, and baking powder. These ingredients were excluded singularly because of the possibility of complicating the experiment.•
INTRODUCTION
The possible changed nutritional value of fats and oils heated to high temperatures has been a concern for several years. With deep fat fried foods assuming a place of importance in the diets of many individuals, the changes which occur in the fried product as a result of frying in various fats and oils should be investigated. The various batter ingredients as they influence the absorption and/or adsorption of the oil during cooking is a factor which should be included in this study. The absorption or adsorption of fat from the cooking oils could change the fatty acid content of the product to a significant degree. This information could be used to determine the combination of cooking oils and batter recipes to be used to obtain an end product with a specific fatty acid profile. This concept
will gain importance as human nutritionists determine the correct balances of fatty acids required for optimum health and growth.
The objective of this study was to determine the
effects of various cooking oils, batter recipes, and times of cooking on the fatty acid content of the

2batter and meat product during frying. In addition, it was desirable to determine whether the composition of the oil was changed.
REVIEW OP LITERATURE The changes which occur in the cooking oil
during deep fat frying have been of increasing interest as this method of cooking becomes more
popular in the home and especially in commercial establishments. The latter is of greatest concern because of the large‘quantities which are fried each day and the longer periods of time the oil is used before it is discarded. Bailey (1951) noted that heating of oil under deep fat frying conditions resulted in considerable polymerization and a conse
quent decrease in unsaturation. Keane et al. (1959) used cottonseed oil in his research which indicated more unsaturates appear and caloric value increased as the oil was heated in a deep fat fryer, this was in opposition to the findings of Bailey (1951).Lowe ejb al. (1940) agrees with the conclusion of Keane ert al. (1959) in their finding of increased iodine numbers under laboratory deep frying conditions which indicated an increase in unsaturation.The confusing picture was not cleared by the research of Melnick (1957) on the absence of thermal polymers and Melnick et al. (1958); in the former he found a significant 1?6 increase in iodine value of oils
used in commercial potato chip frying, in the latter they indicated a decrease of 3fo in iodine number after frying potato chips commercially. At high altitudes using various fats and dough mixtures, Thiessen (1939) found a decrease in iodine number and smoke point when frying doughnuts. Wishner and Keeney (1956) found no change in the fatty acid composition after frying 3400 g. potatoes for one hundred minutes.
Thermally induced changes in fats used for deep fat frying include hydrolysis, polymerization, and
oxidation as was reported by Carlin et al. (1954). Robinson et al. (1940) while studying the foaming
tendencies in edible oils and fats noted thermal decomposition evidenced by increased refractive indices, lowered active oxygen values, and increased viscosity after preheating periods at 191°0. A number of objectionable developments including loss of rancidity resistance, color and flavor changes, a drop in oxidative stability, reduction in keeping quality of potato chips, foaming tendencies, increase of saponification number and refractive index were found by Carlin and Lannerud
(1941). Thermal oxidation of corn oil at 200°C. caused the formation of polymeric material with molecular weights ranging from 692 to 1,600. These polymers
were of high oxygen content and contained unsaturation difficult to remove by hydrogenation, the oxygen was found to be in the form of hydroxyl and carbonyl groups,
as reported by Perkins and Kummerow (1959). The attack of oxygen was found to take place at the methylene group adjacent to the double bond with the formation of conjugated hydroperoxides, evidence indicated the
attack to occur at carbon nine and 13. Decomposition of these hydroperoxides could result in polymerization or oxidation. Perkins and Van Akkeren (1965) found that polymeric material increased regularly as time increased when cottonseed oil was intermittently heated
and cooled as would be the case under commercial conditions. While studying the chemical and physical properties of fats and oils commercially used for deep fat frying, Thompson et al. (1957) could account for only 84i* of the fatty acids by gas chromatography due to presence of polar and polymeric fatty acids. In addi
tion to thermal polymerization Perkins (1960) found autoxidation and thermal oxidation. Brown (1959), while studying changes in nutritive value of food fat during processing and cooking, noted no important chem
ical changes take place while heating fats below 200°C. in the absence of oxygen for a reasonable length of
time. At ordinary temperature in the presence of air, oxidation occurs with the formation of hydroperoxide which may be toxic. The hydroperoxide can either decompose with rupture of the chain or can rearrange
to give hydroxylated compounds and eventually polymers. The opposite view was presented by Melnick (1957), in his work on absence of thermal polymers in potato chip frying oils and Melnick £t al. (1958) in whose experiments no thermal polymers were found to occur in potato chip frying oils. Frazer (1964) found three main groups of products of oxidation at cooking temperature; first
hydroperoxides, second the secondary oxidation products such as carbonyl compounds, epoxy and hydroxy fatty acids, and third the cyclic fatty acids and polymers. Rapid hydrolysis of fats when held at a temperature of 193°C. in the presence of a constant flow of steam was reported by Lantz and Carlin (1938). Hydrolysis was reported as being slow during the first twenty hours of heating but rapidly accelerated after free fatty acid levels of 0.5 to 1.0?S were reached. This observation coincides with actual production experiences of manufacturers of fried foods from which large amounts of water must be evaporated. Perkins and Van Akkeren
(1965) noted a strong deteriorative effect on heated
7cottonseed oil with the simple addition of water which apparently led to hydrolysis.
The amount of decomposition was demonstrated to he indicated hy an increase in the free fatty acid content and a decrease in the smoke point hy Bennion and Hanning (1956a). The free fatty acid content as oleic acid was increased, the smoke point lowered,
and the color darkened as a result of using oil to cook doughnuts, as reported' hy Lowe et al. (195B).
The cause of these changes were not determined specifically hut a conclusion of individual effects as v/ell
as interactions between the various factors were determined to he the causes, Bants and Carlin in 1938 reported that highly hydrogenated fats develop free fatty acids at more rapid rates than do the less saturated fats at temperatures of 193°C. Cooking with oil resulted in a decrease in the polyenoic fatty acid concentration of the oil as reported hy Bleischman ejfc al.
(1963). Heating alone was found to he at least partial cause of this decrease although not necessarily the entire cause. Kritchevsky et al. (1961), studying the effects of absence or presence of fatty vehicle on
atherosclerosis, found an increase of titratable fatty acid in corn oil if heated for ten minutes at 160 -200°C.
A different conclusion was presented by Melnick et_ al. (1958) as a result of studying the composition and control of potato chip frying oils in continuing commercial use, they found no greater than 0.6$> free fatty acids.
The product fried in the various oils appears to have an effect on the changes found -after frying.Bennion and Hanning (1956a) studying the decomposition of lard in the frying of French fried potatoes and of fritter type batters found the frying of the fritter batter caused a greater degree of decomposition than did the potatoes. This was indicated by a more pronounced increase in free fatty acid content, a decrease in the smoke point, darkening of the fat, and a generally undesirable appearance. Peroxide values remained at lower levels when the batter was fried instead of potatoes, the iodine number and saponification number were little affected in either case. Baking powder, milk, and eggs appeared to be the ingredients in batter exerting the greatest influence on the decomposition of lard. Fat absorption was noted to decrease in absence of the leavening agents. Bennion and Hanning (1956b) studied the addition of monoglycerides to continuous process lard to be used in frying French fried potatoes.
The smoke point was lowered and fat absorption was not increased by the addition of the monoglycerides.Thiessen (1939) studying various fats used in deep fat frying of dough mixtures at high altitudes found no difference in absorption using four different fats. -A decrease was reported by Kilgore and Luker (1964) in linoleic acid from 57 to 49^ in cottonseed oil used ten hours for frying chicken or potatoes. Their work indicated no change in linoleic acid content when chicken was fried in lard but a decrease of 11.3 to 5.8^ was noted after frying potatoes for ten hours.
The nutritional quality of the fats and oils has been gaining much attention as the cause of various diseases concerned with lipid metabolism of the human are discovered. Thompson £t al. (1967) in a limited survey of fats and oils commercially used for deep fat frying analysed their physical and chemical properties.
i
This study indicated the degree of deterioration depends on how they are used by the processors. The method of care has much to do with the frying life of the fat according to Rust and Harrison (1960), the viscosity, percent weight loss of the fat as well as the potatoes were also affected by method of care. Poling et al. (1962) in a study using cottonseed oil to examine the
10influence of temperature, heating time, and aeration upon the nutritive value of fats, found changes are proportional to the severity of the conditions.
Keane et al. (1959) did biological and chemical studies on commercial frying oils and found no deleterious effects on rats fed cottonseed oil heated for 24 days in a commercial deep fat fryer at dietary levels as high as 20 percent. The heated oils were found to have an increased caloric value when compared to the unheated oil, this was attributed to an increase of unsaturation in the fats. The fats heated under laboratory conditions yielded a lower growth rate in rats than unheated but no toxicity appeared. Melnick (1957) in a study on the absence of thermal polymers in potato chip frying oils used commercially heated fats from potato chip frying operations and could show no detri
mental effects attributable to heated fat. Also in 1 957»..fn-a—study-orrxiutritional quality of frying fatsin commercial use, the above mentioned researcher in'a
/■nation wide survey could find no nutritional damage to the fat under normal processing or cooking conditions.This conclusion by Melnick was supported by a nutritive study by Rice et al. (1957a) which showed no detrimental
effects on commercially heated fat. Melnick et al. (1958)
again showed no nutritional value change in fats used in continuing commercial operation.
The various changes the fats and oils undergo during cooking is of importance not only to the consumer hut the producer of oil and food products which must have consumer acceptance and appeal before they can he marketed successfully. The absorption and/or adsorption of various substances from the cooking medium by the product certainly is an important aspect of the problem.
The fatty acid content of meat and poultry before and after cooking was determined by Ohang and Watts (1952). The method of cooking was one which did not include cooking oil and any* liquid cooking from the meat was efficiently drained away. The fatty acid content as analyzed by spectrophotometric techniques indicated only a small amount of the polyunsaturated fatty acids were lost due to method of cooking.Weir et al. (1962) disagreed with this finding and concluded a change occurred in the cooked meats as result of method of cooking. A comparison of broiler fryers fried by three methods was made by Smith and Vail (1961) in which the three methods studied were skillet, deep fat, and oven frying. The deep fat
12fried product had a higher percent of fat than the other methods tested. A study conducted "by Woodruff
and Blunt (1919) indicated that "both temperature and length of frying time determined the amount of fat taken up By dough samples. The longer time and lower temperatures gave the most absorption. Pat absorbed
by the product underwent greater chemical changes than fat in which the product was fried. Lard showed more decomposition than did Wesson oil.
The importance of the dough recipe on fat absorption in frying doughnuts was illustrated by McKee (1918). By varying the recipe a marked difference in fat taken up was noted. Egg increased fourfold the ether soluble content of the dough and a decrease in tfre total fat of the doughnut after frying. This may have been due to the addition of 200 grams of flour to stiffen the dough. Doubling and the increasing fourfold of the fat in the recipe increased the absorption of fat greatly in excess of added fat. Doubling the sugar content of the recipe also gave an increase in the fat content. The relative values of various lards and other fats used in deep fat frying of potato chips were studied by King et al. (1936). These workers found an.increased free fatty acid content present in fat extracted from the potato
chips than was present in the frying oil. Fisher (1949) found a correlation "between the thermally developed free fatty acids of frying fats and the physical characteristics and fat absorption properties of doughnuts. Although the fats reported by Fisher did not develop
free fatty acids above the level of 0.40$, he recognized as a possibility the influence of other thermally formed constituents in the frying fat. Goodman and Block (1952) studying problems encountered in commercial utilization of frying fats noticed drastic changes in the shape, crust character, and fat absorption properties of doughnuts. Those doughnuts showing the changes were
fried in fats subjected to prolonged heating at 191°C. Thermally formed substances in the fat were evidenced by increased free fatty acid content and greatly reduced iodine numbers. Chung et al. (1966) studied changes in fatty acids in beef, pork, and fish after deep fat frying in different oils. The oils used were corn, peanut, and lard. Beef, pork and fish all lost more weight when broiled than when deep fat fried but more fat was lost in the broiled meat. The difference was discovered to be the uptake of oil from the cooking ■medium when deep fat fried. The water content was greater when broiled but the fat content was less.The cooking oils changed very little under deep fat
14frying conditions. The fish fried in peanut oil and
lard caused an increase in 20:0, 20:1 and 20:4 fatty acids in the frying medium, apparently due to infiltration from the fish. The beef, pork, and fish showed ah increase in 18:2 fatty acid when cooked in corn oil, peanut oil and lard. The greatest increase was found to be with corn oil, peanut oil was second.
A decrease in 14:0 and 16:0 fatty acids with all three oils, a decrease in .18:0 fatty acid with corn oil and
peanut oil was noted in fish and beef. The pork sample was unchanged in respect to the 14:0 and 16:0 fatty acid content.
EXPERIMENTAL PROCEDURE
Prying Operation
One hundred and twenty chicken drumstick parts were obtained from a commercial retail establishment and randomly divided into five groups.. Six of these parts were immersed in one of four batters, removed
and allowed to drip for thirty seconds prior to placing in the hot oil. This was done to ensure a uniform
distribution of the batter on the chicken part. These batter coated parts were then immersed in cooking oil
maintained at 188° ± 3°C., two being removed after each of three time periods. The frying times of two, eight
and 14 minutes were decided from preliminary experiments and guidelines established in the Department of Poultry Science, Louisiana State University. A Sunbeam automatic cooker and deep fryer containing 1800 ml. of cooking oil was used to fry the parts. The temperature regulation
mechanism was determined not to be adequate for this operation and a thermometer calibrated in 0.5°C. was placed in the oil to aid in maintaining a correct and constant temperature. After cooking, the chicken parts were removed using a forcep and placed in a wire basket to drain at room temperature for a period of three
15
minutes. The hatter and meat were separated from the hone and each other, placed in separate containers and immediately placed in a deep freeze to solidify the oil and reduce oxidation to a minimum. A sample of the cooking oil was taken before and after frying to determine if any fatty acid changes had taken place. The deep fat fryer was then emptied of oil, washed, dried and filled with 1800 ml. of new oil. It was desirable to use fresh oil for each of the different batters to prevent generating artifacts due to possible changes in the oil after the dipping operation.
Batters
The batter used was a basic fritter type which can be found in most good cook books and has been used by many experimenters in deep fat frying. The ingredients were 168.0 g. all purpose flour, 4-5.0 g. sugar, 5.0 g. salt, 3.8 g. tartrate baking powder, and
6.5 g. commercially prepared instant non-fat milk solids sifted together and blended with a mixture of90.0 g. whole egg and 79.0 g. distilled water. Each batch was mixed fresh for each oil because of the changes which could occur due to the dipping of the
chicken part.In order to study the influence of the different
ingredients on changes in the fatty acid penetration of the batter and chicken part, and changes which could, occur in the oil, the following alterations were made
in the basic batter mentioned above.1. Complete (as described above)2. Complete minus whole egg3. Complete minus non-fat milk solids4. Complete minus baking powder
Additional comparisons could be made by removing combinations of the above but it was decided that this would lead to complication of the experiment to such a degree that much of its value might be lost.
Oils»
The oils used were: Mazola Pure Corn Oil, Corn Products Company, New York, N.Y.; Perfecto Peanut Oil, Opelousas Oil Refinery, Opelousas, La.; Autocrat Unique Salad Oil, from selected vegetable oils (mixed oil),
Associated Distributing Co., Inc., New Orleans, La.; Mar-Gold Salad Oil, pure cottonseed oil, Atlanta, Ga., and Swifts Silverleaf Brand Pure Lard, Chicago, 111.
18A preliminary analysis determined the selection of the oils for the following reasons. Lard was high in the saturated fatty acids, especially myristic, palmitic, and stearic, it also had large amounts of oleic and to a lesser degree, linoleic. Corn oil was found to he high in linoleic with much lower amounts of palmitic acid. Cottonseed oil had less palmitic and oleic hut comparatively large amounts of linoleic acid. Peanut oil was low in the saturates when compared to lard and high in oleic and linoleic
acids. A commercially mixed oil was also used because It appeared to have a medium level of each of the fatty acids. By using these five oils, meaningful conclusions might he drawn when comparing the absorption and/or adsorption of fatty acids.
Before and after frying samples of oil were taken to determine if any changes occured in the
oil due to the possibility of acids, water, or other constituents entering or leaving the meat and hatter during the frying operation. These samples were placed immediately in a deep freeze to reduce oxidation to a minimum.
19
Chemical Analysis
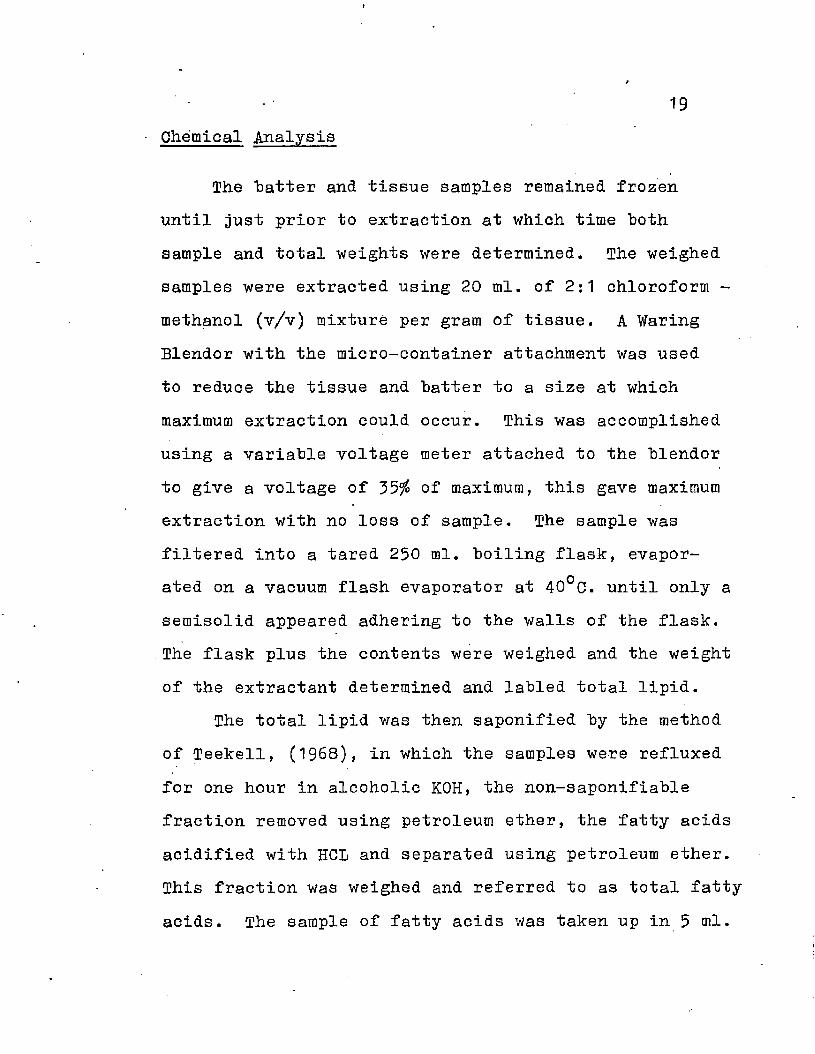
The hatter and tissue samples remained frozen until just prior to extraction at which time both sample and total weights were determined. The weighed samples were extracted using 20 ml. of 2:1 chloroform - methanol (v/v) mixture per gram of tissue. A Waring Blendor with the micro-container attachment was used to reduce the tissue and batter to a size at which maximum extraction could occur. This was accomplished using a variable voltage meter attached to the blendor to give a voltage of 35fo of maximum, this gave maximum extraction with no loss of sample. The sample was filtered into a tared 250 ml. boiling flask, evaporated on a vacuum flash evaporator at 40°C. until only a semisolid appeared adhering to the walls of the flask. The flask plus the contents were weighed and the weight of the extractant determined and labled total lipid.
The total lipid was then saponified by the method of Teekell, (1968), in which the samples were refluxed
for one hour in alcoholic KOH, the non-saponifiable fraction removed using petroleum ether, the fatty acids acidified with HCL and separated using petroleum ether. This fraction was weighed and referred to as total fatty acids. The sample of fatty acids was taken up in 5 ml.
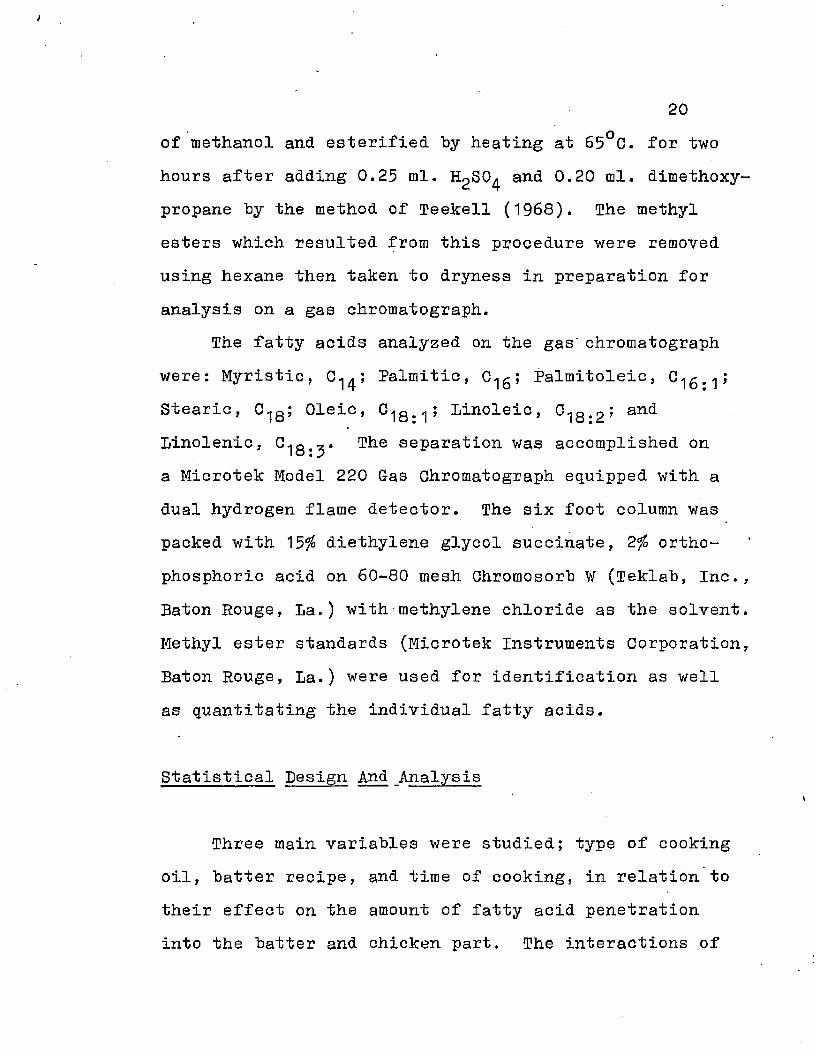
20of methanol and esterified by heating at 65°C. for two hours after adding 0.25 ml. HgSO^ and 0.20 ml. dimethoxy- propane by the method of Teelcell (1968). The methyl esters which resulted from this procedure were removed using hexane then taken to dryness in preparation for analysis on a gas chromatograph.
The fatty acids analyzed on the gas' chromatograph were: Myristic, Palmitic, C^g; Palmitoleic,Stearic, C18; Oleic, C18..j; Linoleic, andLinolenic, C-|q .j * The separation was accomplished on a Microtek Model 220 Gas Chromatograph equipped with a dual hydrogen flame detector. The six foot column was packed with 15$ diethylene glycol succinate, 2$ ortho- phosphoric acid on 60-80 mesh Chromosorb W (Teklab, Inc., Baton Rouge, La.) with■methylene chloride as the solvent. Methyl ester standards (Microtek Instruments Corporation, Baton Rouge, La.) were used for identification as well as quantitating the individual fatty acids.
Statistical Design And Analysis
Three main variables were studied; type of cooking oil, batter recipe, and time of cooking, in relation to their effect on the amount of fatty acid penetration into the batter and chicken part. The interactions of
21the main effects -were also important and -were analyzed statistically. To detect differences between the main effects and their interactions, a split plot arrangement of treatments on a randomized block design was used. Orthogonal comparisons were used to separate the degrees of freedom. The data were analyed using the analysis of-variance technique as outlined in Steel and Torrie ( 1960).
RESULTS AND DISCUSSION
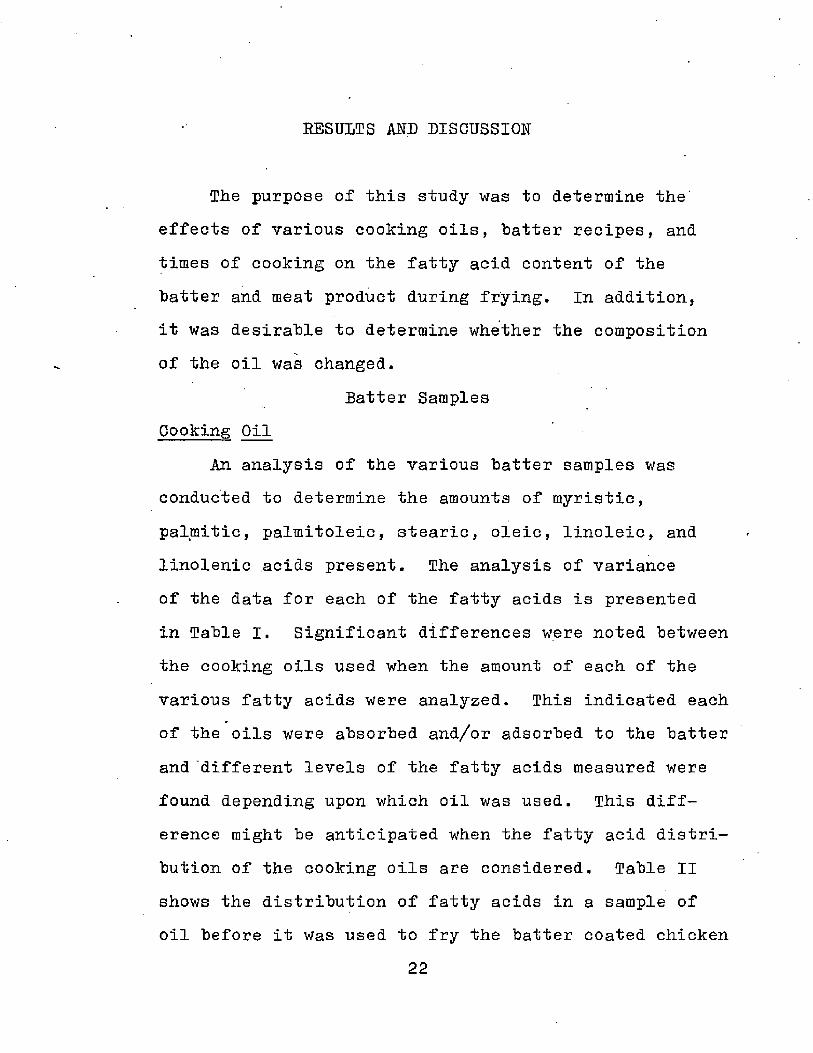
The purpose of this study was to determine the effects of various cooking oils, batter recipes, and times of cooking on the fatty acid content of the batter and meat product during frying. In addition, it was desirable to determine whether the composition of the oil was changed.
Batter SamplesCooking Oil
An analysis of the various batter samples was conducted to determine the amounts of myristic, palmitic, palmitoleic, stearic, oleic, linoleic, and linolenic acids present. The analysis of variance of the data for each of the fatty acids is presented in Table I. Significant differences were noted between the cooking oils used when the amount of each of the various fatty acids were analyzed. This indicated each of the oils were absorbed and/or adsorbed to the batter and different levels of the fatty acids measured were found depending upon which oil was used. This difference might be anticipated when the fatty acid distribution of the cooking oils are considered. Table II shows the distribution of fatty acids in a sample of oil before it was used to fry the batter coated chicken
22
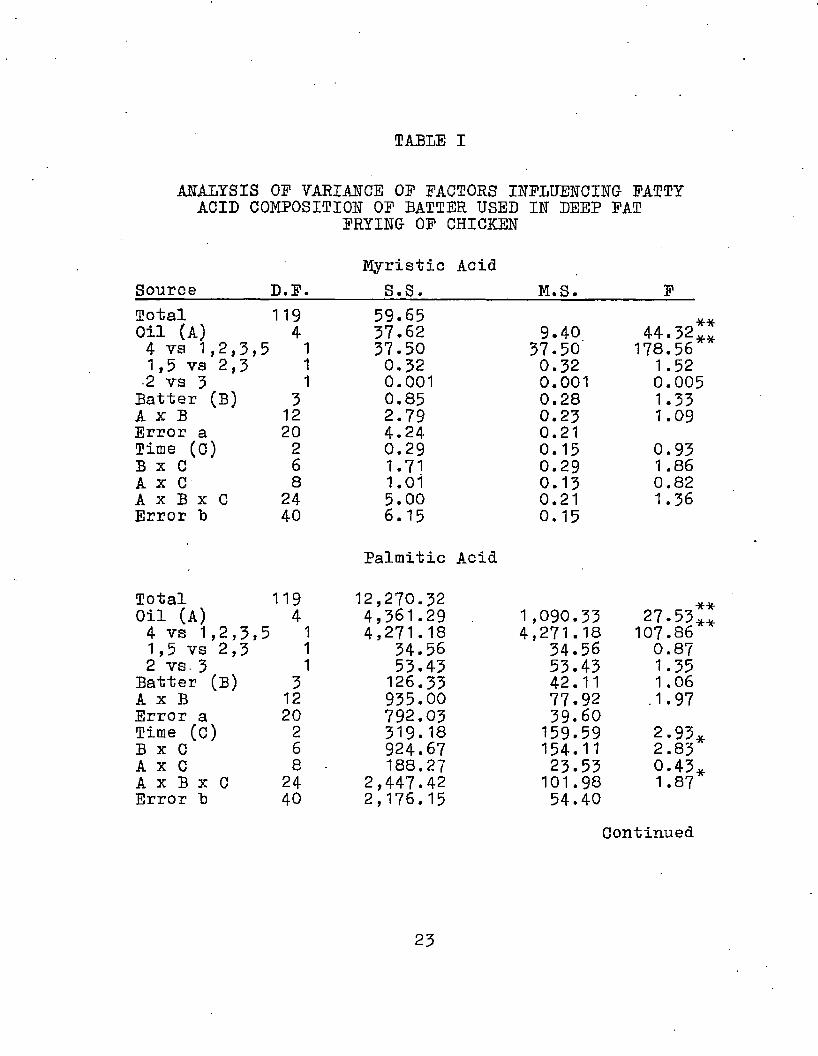
TABLE I
ANALYSIS OP VARIANCE OP FACTORS INFLUENCING- PATTY ACID COMPOSITION OP BATTER USED IN DEEP PAT
PRYING OP CHICKEN
Myristic AcidSource D.P. S.S. M.S. FTotal 119 59.65 •X-44.32*.Oil (A) 4 37.62 9.404 vs 1,2,3,5 1 37.50 37.50' 178.561,5 vs 2,3 1 0.32 0.32 1.522 vs 3 1 0.001 0.001 0.005
Batter (B) 3 0.85 0.28 1.33A x B 12 2.79 0.23 1.09Error a 20 4.24 0.21Time (C) 2 0.29 0.15 0.93B x C 6 1.71 0.29 1.86A x C 8 1.01 0.13 0.82A x B x C 24 5.00 0.21 1.36Error b 40 6.15 0.15
Palmitic Acid
Total 119 12,270.32Oil (A) 4 4,361.29 1,090.334 vs 1,2,3, 5 1 4,271.18 4,271.181,5 vs 2,3 1 34.56 34.562 vs. 3 1 53.43 53.43
Batter (B) 3 126.33 42.11A x B 12 935.00 77.92Error a 20 792.03 39.60Time (c) 2 319.18 159.59B x C 6 924.67 154.11A x C 8 188.27 23.53A x B x C 24 2,447.42 101.98Error b 40 2,176.15 54.40
27.53** 107.86 0.87 1.35 1.06 .1.972.93*2.830.43*1.87
Continued
23
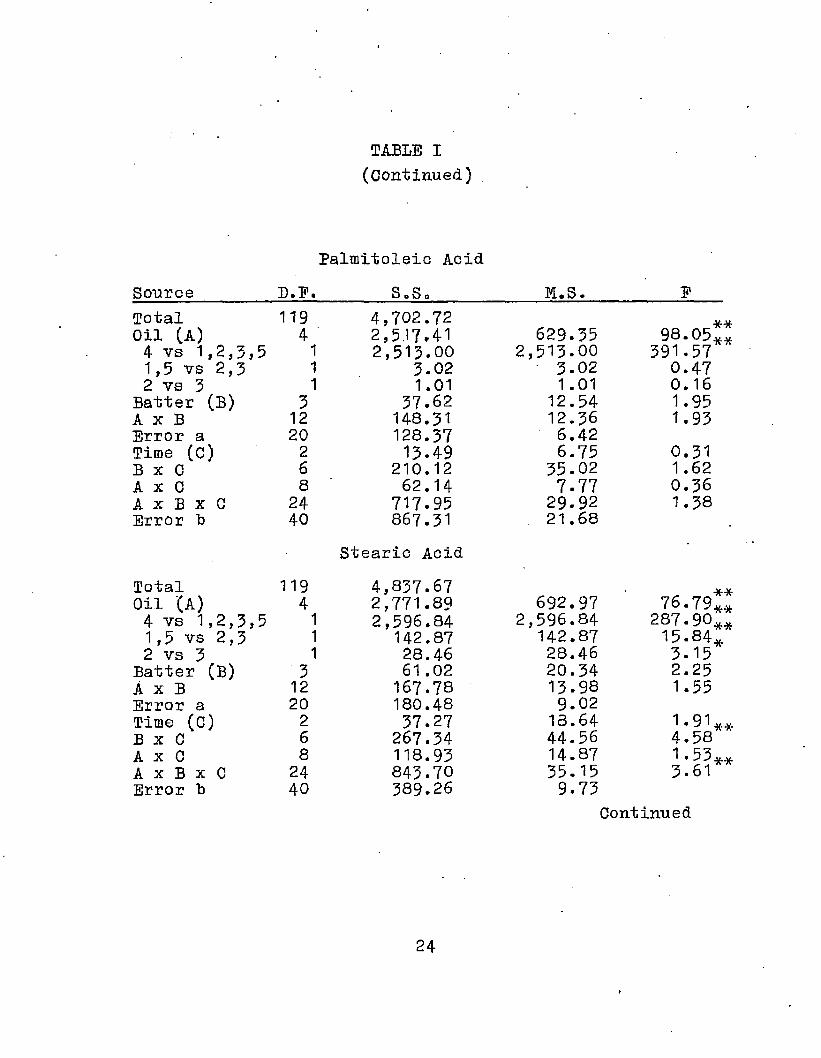
TABLE I(Continued)
Palmitoleic AcidSource D.E. S o S o M.S. ETotal 119 4 ,7 0 2 .7 2Oil (A) 4 2,517*41 629.35 9 8 . 05i
4 vs 1 , 2 , 3 , 5 1 2 ,5 1 3 .0 0 2 , 5 1 3 .0 0 391.571,5 vs 2 ,3 1 3.02 ■ 3 .0 2 0 .4 72 vs 3 1 1.01 1.01 0 .16
Batter (B) 5 37.62 12 .54 1.95A x B 12 148.31 12.36 1.93Error a 20 128.37 6 .4 2Time (C) 2 13.49 6 .7 5 0.31B x C 6 210.12 35 .02 1.62A x C 8 62.14 7-77 0 .3 6A x B x C 24 717.95 29 .92 1 .3 8Error "b 40 867.31 2 1 .68
Stearic Acid
Total 119 4 ,8 37 .6 7Oil (A) 4 2 ,7 7 1 .8 9 692 .97 76 .794 vs 1 , 2 , 3 , 5 1 2 ,5 9 6 .8 4 2 , 5 9 6 .8 4 287 .901,5 vs 2 ,3 1 142.87 142.87 15.842 vs 3 1 28.46 28 .46 3 .1 5
Batter (B) 3 61.02 20 .34 2 .25A x B 12 167.78 13 .98 1.55Error a 20 180.48 9 .02Time (C) 2 37.27 13.64 1.91B x C 6 267.34 44 .56 4 . 5 8A x C 8 118.93 14.87 1.53A x B x C 24 843.70 35 .15 3.61Error b 40 389.26 9 .73
Continued
24
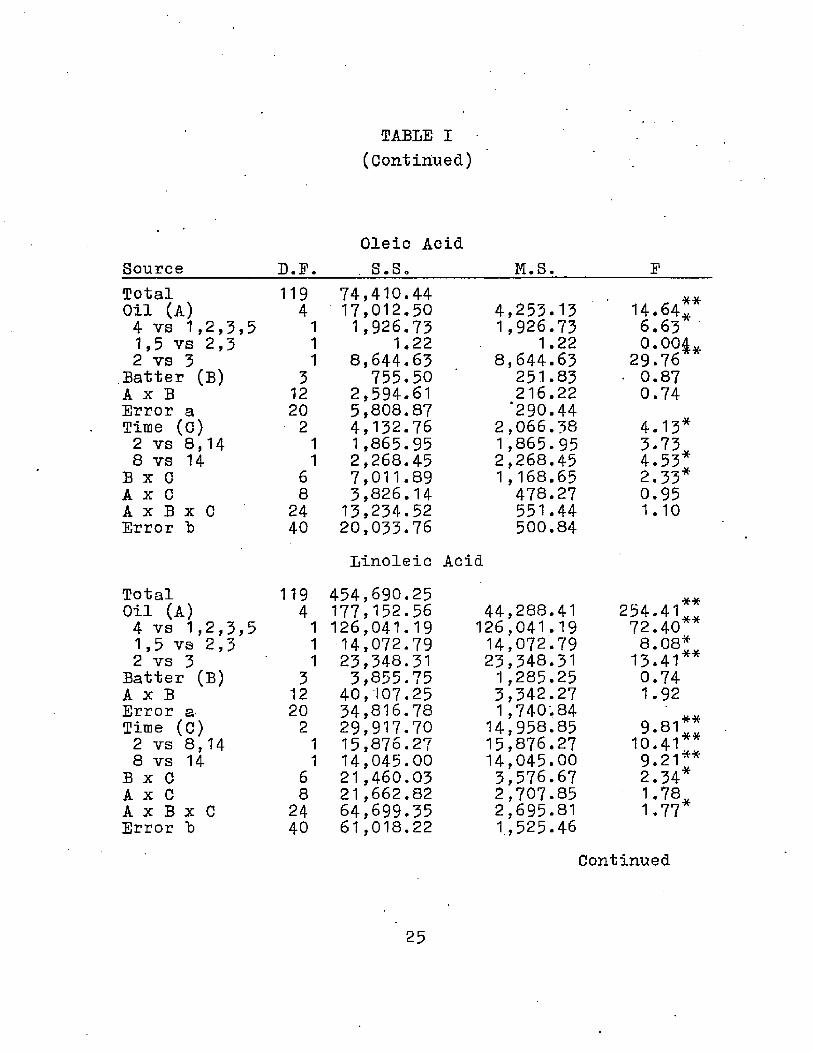
TABLE I(Continued)
Oleic AcidSource D.E. . S.S. M.S. ETotal 119 74,410.44Oil (A) 4 17,012.50 4,253.13 14.64*4 vs 1,2,3,5 1 1 ,926.73 1,926.73 6.631,5 vs 2,3 1 1.22 1.22 0.004*2 vs 3 1 8,644.63 8,644.63 29.76
Batter (B) 3 755.50 251.83 ■ 0.87A x B 12 2,594.61 216.22 0.74Error a 20 5,808.87 *290.44
4.13*Time (c) 2 4,132.76 2,066.382 vs 8,14 1 1,865.95 1,865-95 3.738 vs 14 1 2,268.45 2,268.45 4.53*
B x 0 6 7,011.89 1,168.65 2.33*A x C 8 3,826.14 478.27 0.95A x B x C 24 13,234.52 551.44 1.10Error b 40 20,033.76 500.84
Linoleic Acid
Total 119Oil (A) 44 vs 1,2,3,51,5 vs 2,3 2 vs 3
Batter (B) 3A x B 12Error a 20Time (C) 22 vs 8,14 18 vs 14 1
B x C 6A x C 8A x B x C 24Error b 40
45417712614 23540542915 14 21 21 64 61
,690.25,152.56,041.19,072.79,548.31,855.75,107.25,816.78,917.70,876.27,045.00,460.03,662.82,699.35,018.22
44,288.41 126,041.19 14,072.79 23,348.31 1,285.25 3,342.271.740.84
14,958.85 15,876.2714,045.003,576.672.707.852,695.81 1,525.46
254.4172.40 8.08*13.41 0.74 1.92
* **** *
**9.8110.41 9 . 21* * 2.34*1.77
Continued
25
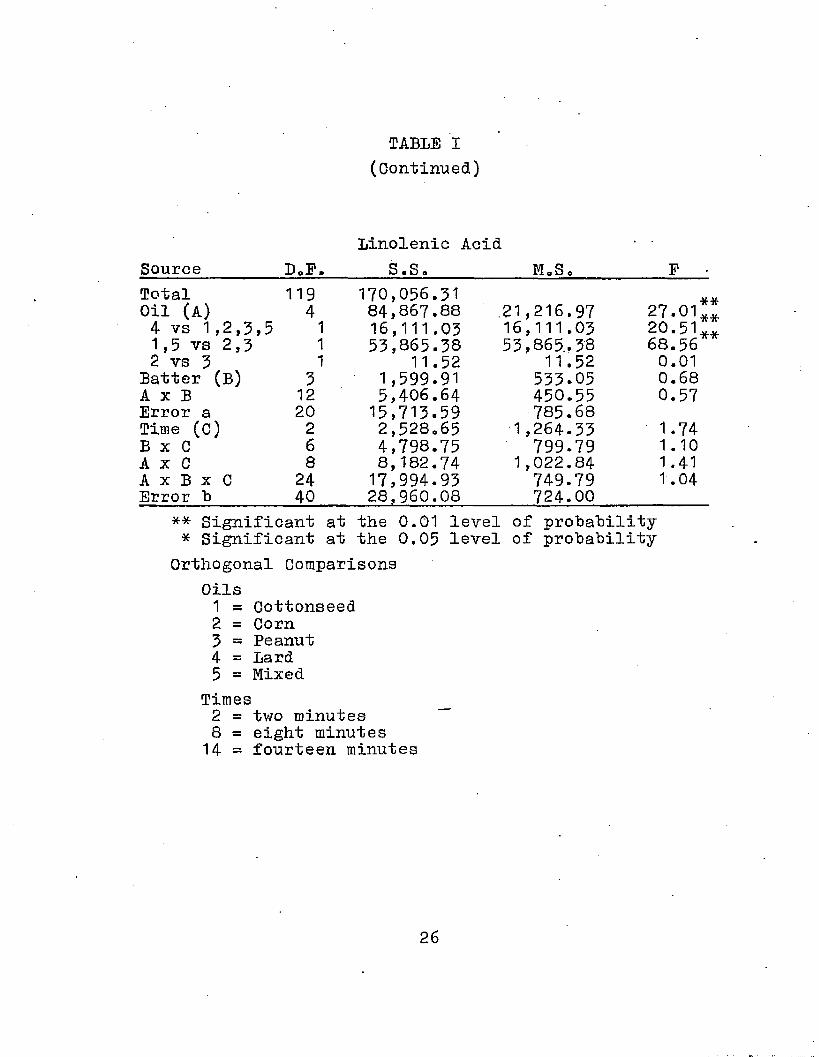
TABLE I(Continued)
Linolenic AcidSource________ B,E. S.S.__________M 0S0 _FTotal 119 170,056.31Oil (A) 4 84,867.88 .21,216.97 27.014 vs 1,2,3,5 1 16,111.03
53,865.3816,111.03 20.51
1,5 vs 2,3 1 53,865.. 38 68.562 vs 3 1 11.52 11.52 0.01
Batter (B) 5 1,599.91 535.05 0.68A x B 12 5,406.64 450.55 0.57Error a 20 15,713.59 785.68Time (C) 2 2,528.65 1,264.33 1.74B x C 6 4,798.75 799.79 1.10A x C 8 8,182.74 1,022.84 1.41A x B x C 24 17,994.93 749.79 1.04Error b 40 28,960.08 724.00
** Significant at the 0.01 level of probability * Significant at the 0.05 level of probability
Orthogonal ComparisonsOils1 = Cottonseed2 = Corn3 = Peanut4 = Lard5 = Mixed
Times 2 = two minutes 8 = eight minutes 14 = fourteen minutes
26
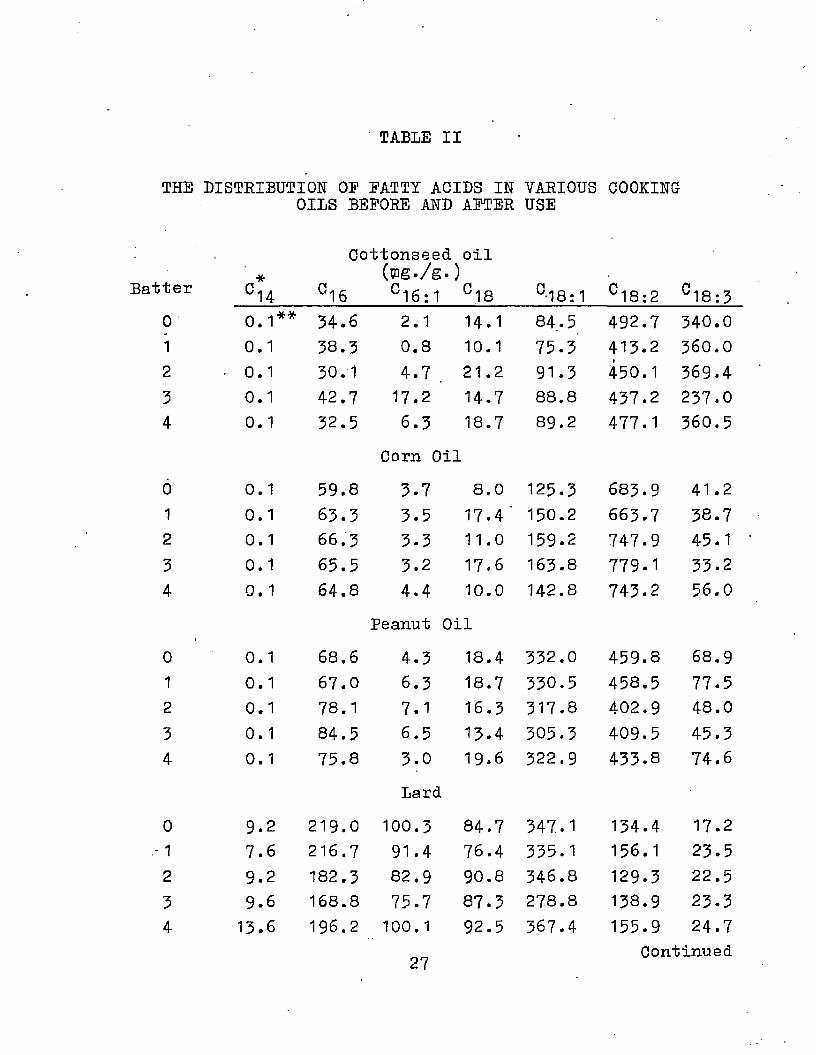
TABLE II
THE DISTRIBUTION OF FATTY ACIDS IN VARIOUS COOKING OILS BEFORE AND AFTER USE
Cottonseed oil;ter *
°14 C16(tng./g °16:1
.)°18 °-18:1 o a> ■
1 ro
« ■
00
o
0 0.1** 34.6 2.1 14.1 84.5 492.7 340.01 0.1 38.5 0.8 10.1 75.3 413.2 360.02 • 0.1 30.1 4*7 . 21.2 91.3 450.1 369.43 0.1 42.7 17.2 14.7 88.8 437.2 237.04 0,1 32.5 6.3 18.7
Corn Oil
89.2 477.1 360.5
0 0.1 59.8 3.7 8.0 125.3 683.9 41.21 0.1 63.3 3.5 17.4 ' 150.2 663.7 38.72 0.1 66.3 3.3 11.0 159.2 747.9 45.13 0.1 65.5 3.2 17.6 163.8 779.1 33.24 0.1 64.8 4.4
Peanut i10.0
Oil
142.8 743.2 56.0
0 0.1 68.6 4.3 18.4 332.0 459.8 68.91 0.1 67.0 6.3 18.7 330.5 458.5 77.52 0.1 78.1 7.1 16.3 317.8 402.9 48.03 0.1 84.5 6.5 13.4 305.3 409.5 45.34 0.1 75.8 3.0
Lard19.6 322.9 433.8 74.6
0 9.2 219.0 100.3 84.7 347.1 134.4 17.21 7.6 216.7 91.4 76.4 335.1 156.1 23.52 9.2 182.3 82.9 90.8 346.8 129.3 22.53 9.6 168.8 75.7 87.3 278.8 138.9 23.34 13.6 196.2 100.1
27
92.5 367.4 155.9 24.7 Continued
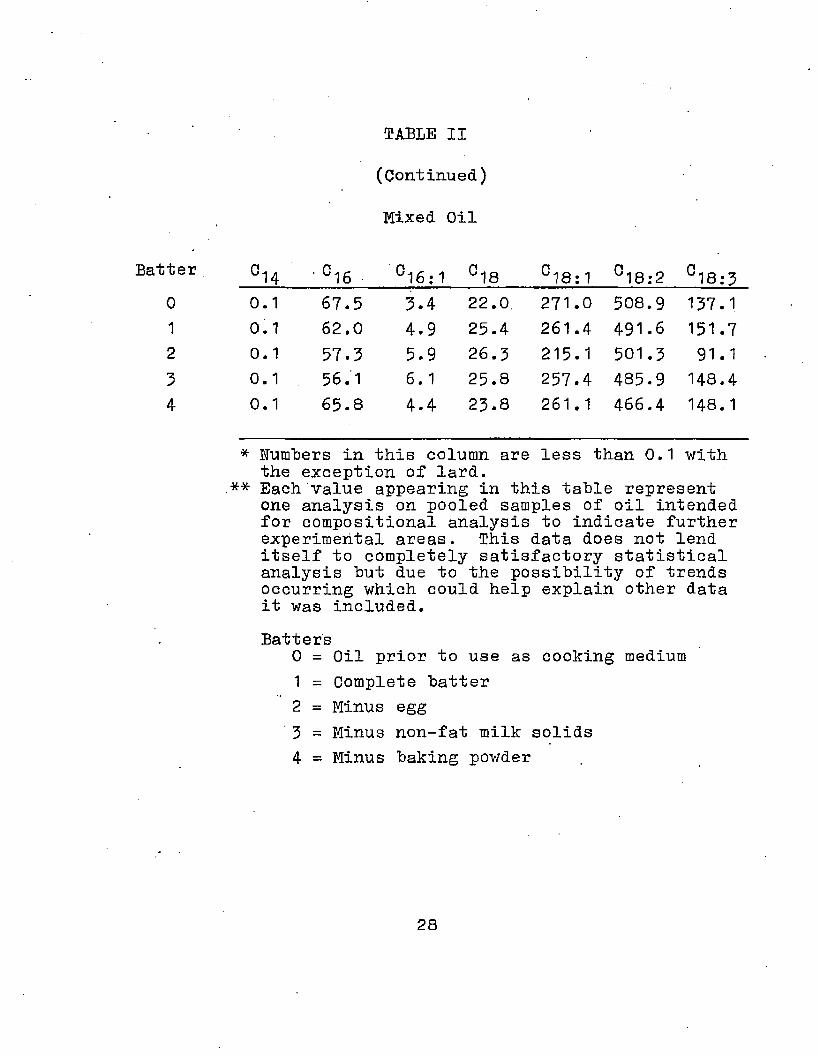
TABLE II
(Continued)
Mixed Oil
;ter °14 ■ C16 °16:1 C18 C18:1 °18:2 0 18:30 0.1 67.5 3.4 22.0 271.0 508.9 137.11 0.1 62.0 4.9 25.4 261.4 491.6 151.72 0.1 57.3 5.9 26.3 215.1 501.3 91.13 0.1 56.1 6.1 25.8 257.4 485.9 148.44 0.1 65.8 4.4 23.8 261.1 466.4 148.1
* Numbers in this column are less than 0.1 with the exception of lard.
.** Each value appearing in this table represent one analysis on pooled samples of oil intended for compositional analysis to indicate further experimental areas. This data does not lend itself to completely satisfactory statistical analysis but due to the possibility of trends occurring which could help explain other data it was included.Batters
0 = Oil prior to use as cooking medium1 = Complete batter2 = Minus egg'3 = Minus non-fat milk solids4 = Minus baking powder
28
29parts. Myristic acid was present only in the unused lard sample to any extent, the. other oils having less than 0.1 mg. per g. of oil. The same trend was noted in the case of palmitic acid as it was found in substantially higher quantities from the lard than was noted from the other oils. Palmitoleic acid and stearicacid were also found to follow the trend exhibited by
*
palmitic acid. The levels in lard might be expected because all four of these fatty acids occur in comparatively large quantities in mammalian tissues, especially the adipose tissue. Oleic acid appeared to be present in lard, peanut, mixed, and corn oils in decreasing amounts with lard being the most prominent. Cottonseed. • oil seemed to be comparatively lower than the ones mentioned above. Linoleic acid content was less in the lard sample than the other oils according to the figures in Table II. Linolenic acid appears to be higher in
cottonseed oil with less present in the mixed oil, the remaining oils were found to be less when compared to either the cottonseed or mixed oils. The distribution shown in Table II may indicate that differences in the amounts of fatty acids in the sample could depend upon the levels of the respective fatty acids in the cooking oil. This could be the case only if the various batters
30have no effect and the fats are absorbed at the same rate from the cooking medium. Because the data cannot be satisfactorily statistically analyzed, as seen at the bottom of Table II, definite statements cannot be made concerning this table. The fatty acid ‘content of the batter samples after cooking in various oils are listed in Table III. No attempt was made to differentiate the amount of free fatty acids which may have been absorbed and/or adsorbed. These fatty acids could make a difference and should be taken into account in the future. The myristic acid level was highest by a large amount when lard was used as the cooking medium, this could be expected because of the larger amounts of this fatty acid occuring in lard. The use of lard has also resulted in a large difference in palmitic, palmit-
oleic, and stearic acid levels as could be predictedfrom levels of these fatty acids in the cooking oil.
* »•
The stearic acid levels in the batter also show marked differences when the use of corn oil was compared to peanut oil and both of these when compared to cottonseed and mixed oils. The oleic acid content of the batter was expected when cottonseed oil and corn oil were compared to peanut, lard, and mixed oils in which the oleic acid content was at a much higher level of content
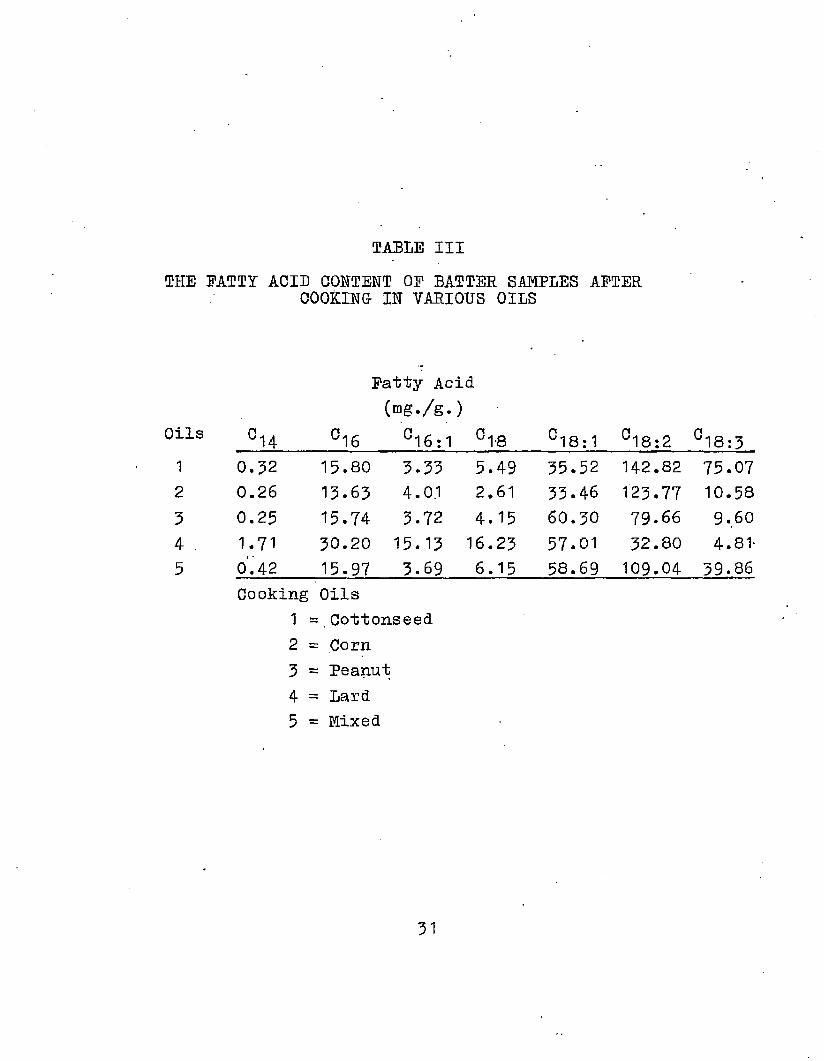
TABLE IIITHE FATTY ACID COUTENT OF BATTER SAMPLES AFTER
COOKING IN VARIOUS OILS
Fatty Acid (mg./g.)
Oils °14 °16 °16:1 °1-8 °18:1 °18:2 °18:31 0.32 15.80 3.33 5.49 35.52 142.82 75.072 0.26 13.63 4.01 2.61 33.46 123.77 10.583 0.25 15.74 3.72 4.15 60.30 79.66 9.604 1.71 30.20 15.13 16.23 57.01 32.80 4.SI-5 O'. 42 15.97 3.69 6.15 58.69 109.04 59.86
Cooking Oils1 = Cottonseed2 = Corn3 = Peanut4 = Lard5 = Mixed
31
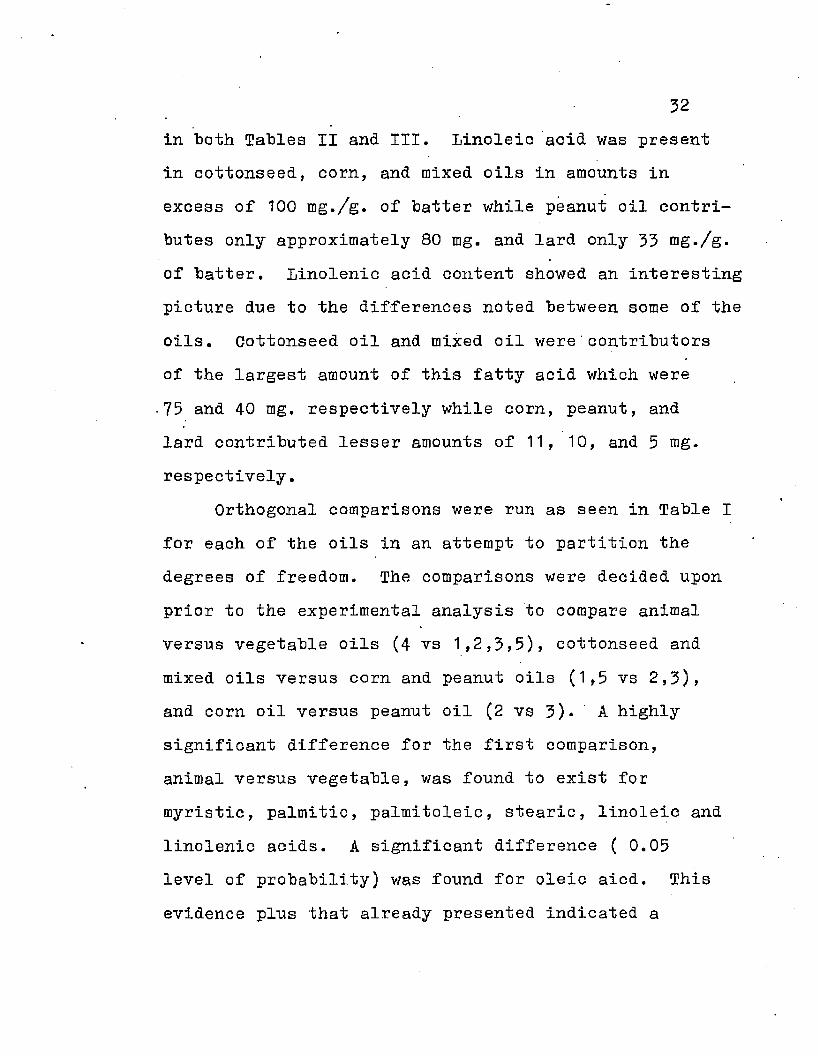
in "both Tables II and III. Linoleic acid was present in cottonseed, corn, and mixed oils in amounts in excess of 100 mg./g. of batter while peanut oil contributes only approximately 80 mg. and lard only 33 tng./g. of batter. Linolenic acid content showed an interesting picture due to the differences noted between some of the oils. Cottonseed oil and mixed oil were contributors of the largest amount of this fatty acid which were
75 and 40 mg. respectively while corn, peanut, and lard contributed lesser amounts of 11, 10, and 5 mg.
respectively.Orthogonal comparisons were run as seen in Table I
for each of the oils in an attempt to partition the degrees of freedom. The comparisons were decided upon
prior to the experimental analysis to compare animal versus vegetable oils (4 vs 1,2,3,5), cottonseed and
mixed oils versus corn and peanut oils (1,5 vs 2,3), and corn oil versus peanut oil (2 vs 3)* A highly significant difference for the first comparison, animal versus vegetable, was found to exist for myristic, palmitic, palmitoleic, stearic, linoleic and linolenic acids. A significant difference (0.05 level of probability) was found for oleic aicd. This evidence plus that already presented indicated a
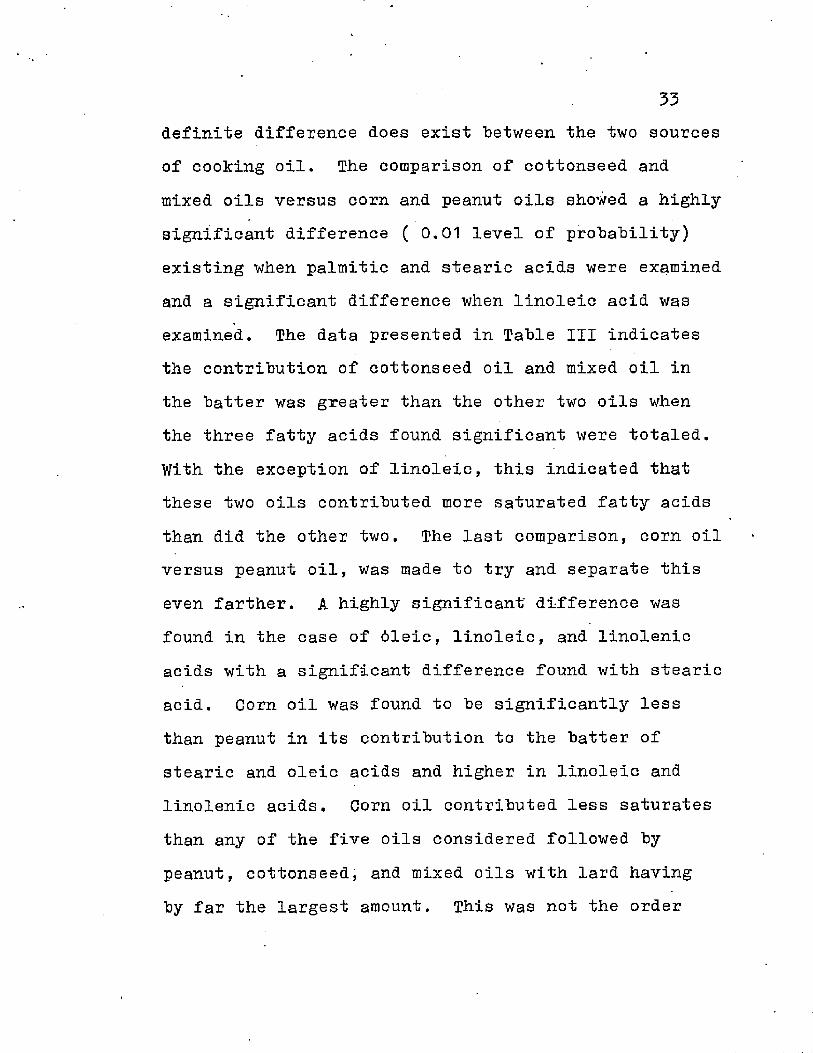
definite difference does exist between the two sources of cooking oil. The comparison of cottonseed and
mixed oils versus corn and peanut oils showed a highly significant difference ( 0.01 level of probability)
existing when palmitic and stearic acids were examined and a significant difference when linoleic acid was
examined. The data presented in Table III indicates the contribution of cottonseed oil and mixed oil in the batter was greater than the other two oils when the three fatty acids found significant were totaled. With the exception of linoleic, this indicated that these two oils contributed more saturated fatty acids than did the other two. The last comparison, corn oil versus peanut oil, was made to try and separate this even farther. A highly significant difference was found in the case of dleic, linoleic, and linolenic acids with a significant difference found with stearic acid. Corn oil was found to be significantly less
than peanut in its contribution to the batter of stearic and oleic acids and higher in linoleic and linolenic acids. Corn oil contributed less saturates than any of the five oils considered followed by peanut, cottonseed, and mixed oils with lard having by far the largest amount. This was not the order
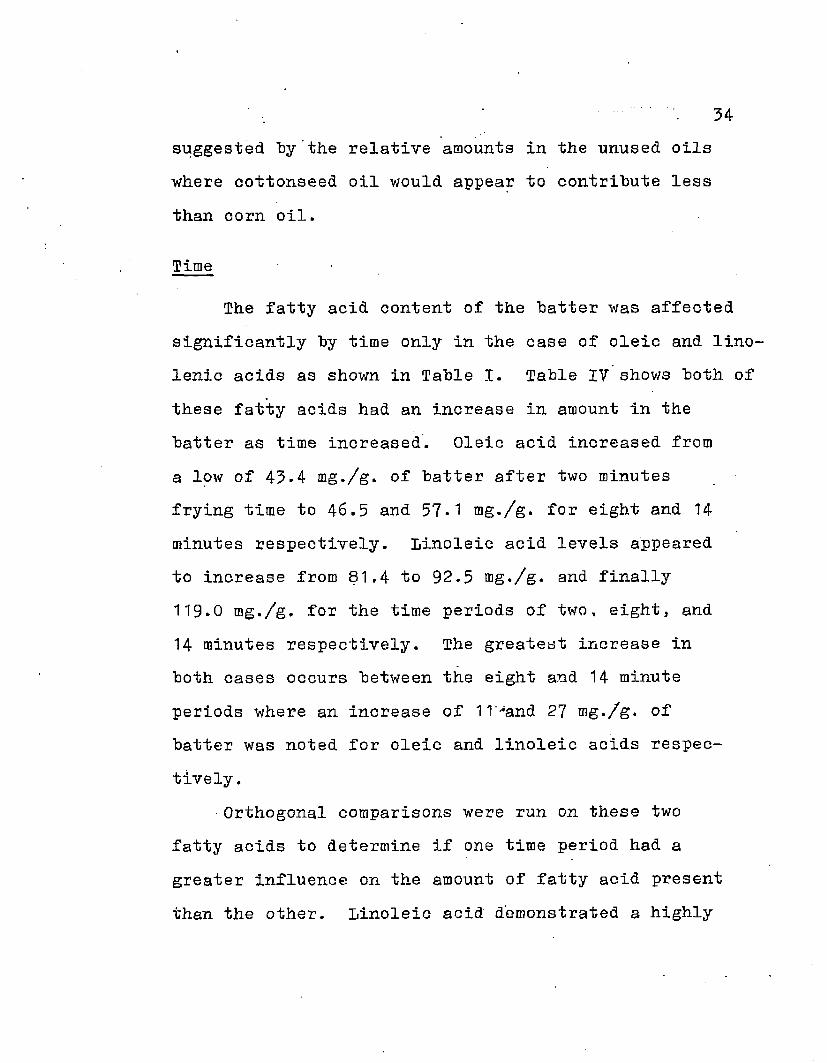
34suggested by the relative amounts in the unused oils where cottonseed oil would appear to contribute less
than corn oil.
Time
The fatty acid content of the batter was affected significantly by time only in the case of oleic and linolenic acids as shown in Table I. Table IV shows both of these fatty acids had an increase in amount in the batter as time increased. Oleic acid increased from a low of 43.4 mg./g. of batter after two minutes frying time to 46.5 and 57.1 mg./g. for eight and 14 minutes respectively. Linoleic acid levels appeared to increase from 81.4 to 92.5 mg./g. and finally 119*0 mg./g. for the time periods of two, eight, and 14 minutes respectively. The greatest increase in both cases occurs between the eight and 14 minute periods where an increase of 11->and 27 mg./g. of batter was noted for oleic and linoleic acids respec
tively.Orthogonal comparisons were run on these two
fatty acids to determine if one time period had a greater influence on the amount of fatty acid present
than the other. Linoleic acid demonstrated a highly
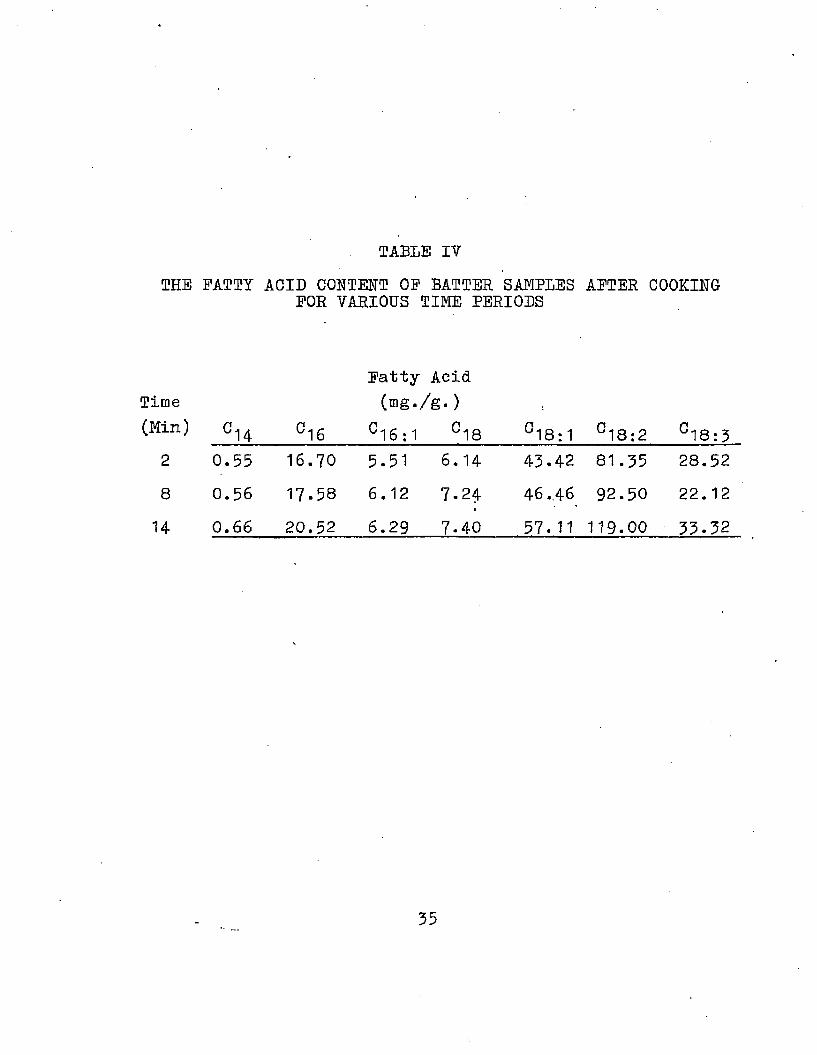
TABLE I?THE EATTY ACID CONTENT OF BATTER SAMPLES
FOR VARIOUS TIME PERIODSAFTER iCOOKING
Time(Min) C14 C16
Patty Acid (mg./g.)
C16:1 °18 °18:1 °18:2 C18:32 0.55 16.70 5.51 6.14 43.42 81.55 28.528 0.56 17.58 6.12 7.24 46 .,46 92.50 22.12
14 0.66 20.52 6.29 7-40 57. 11 119.00 33.32
35
significant difference when two minutes was compared to eight and 14 minute time periods and "between the eight and 14 minute periods. Oleic acid had a significant difference "between eight and 14 minute periods with none when two was compared to eight and 14 minute periods. This leads to the conclusion that only in these two cases was fatty acid content increased over the time periods studied. The others have reached their maximum absorption at the end of two minutes and 12 additional minutes makes little difference. Both of these acids are unsaturated, oleic at the 9 position and linoleic at the 9 and .12 positions, and both are 18 carbons in length. From this evidence it was possible to theorize that perhaps the batter composition of these fatty acids was affected by time because of an effect of chain length or unsaturation. One observation which may make this hypothesis less valid was that palmitic acid, a 16 carbon saturated acid, approached significance very closely when examined for the three time periods. The cooling times could possibly be a factor to be included in this discussion because the part heated for the longer period would take longer to cool and give the oil more time to penetrate the sample. The possibility of
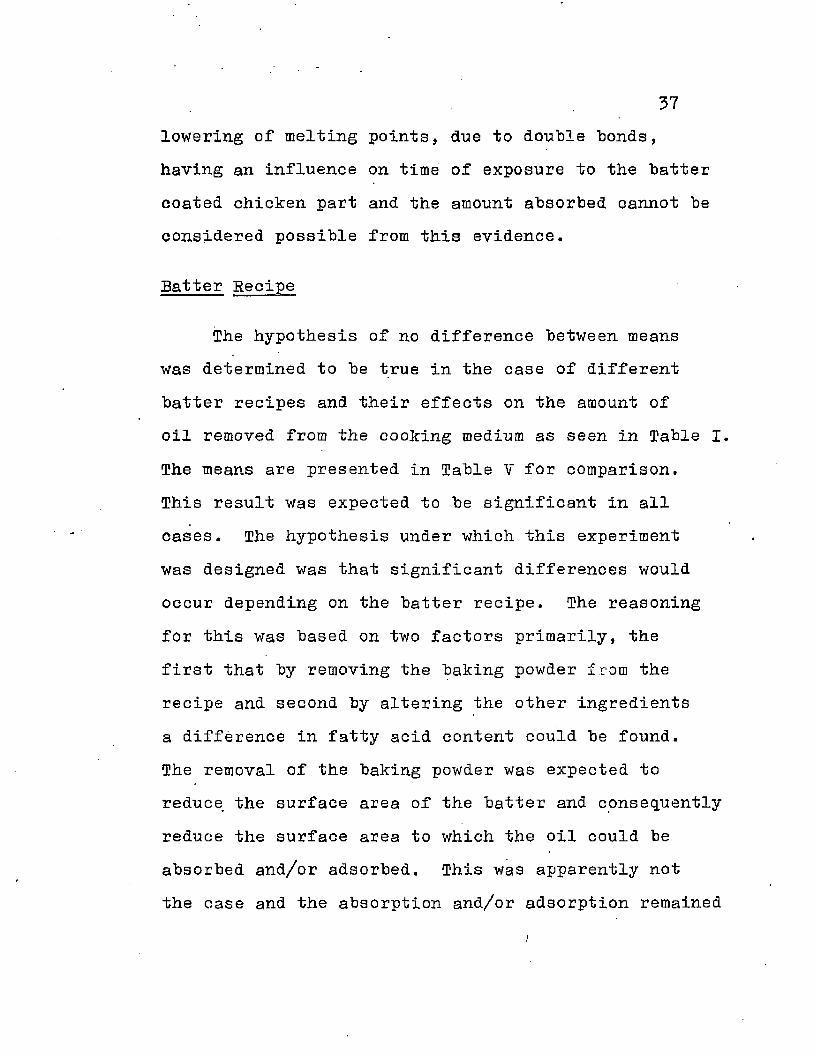
37lowering of melting points, due to double bonds, having an influence on time of exposure to the batter coated chicken part and the amount absorbed oannot be considered possible from this evidence.
Batter Recipe
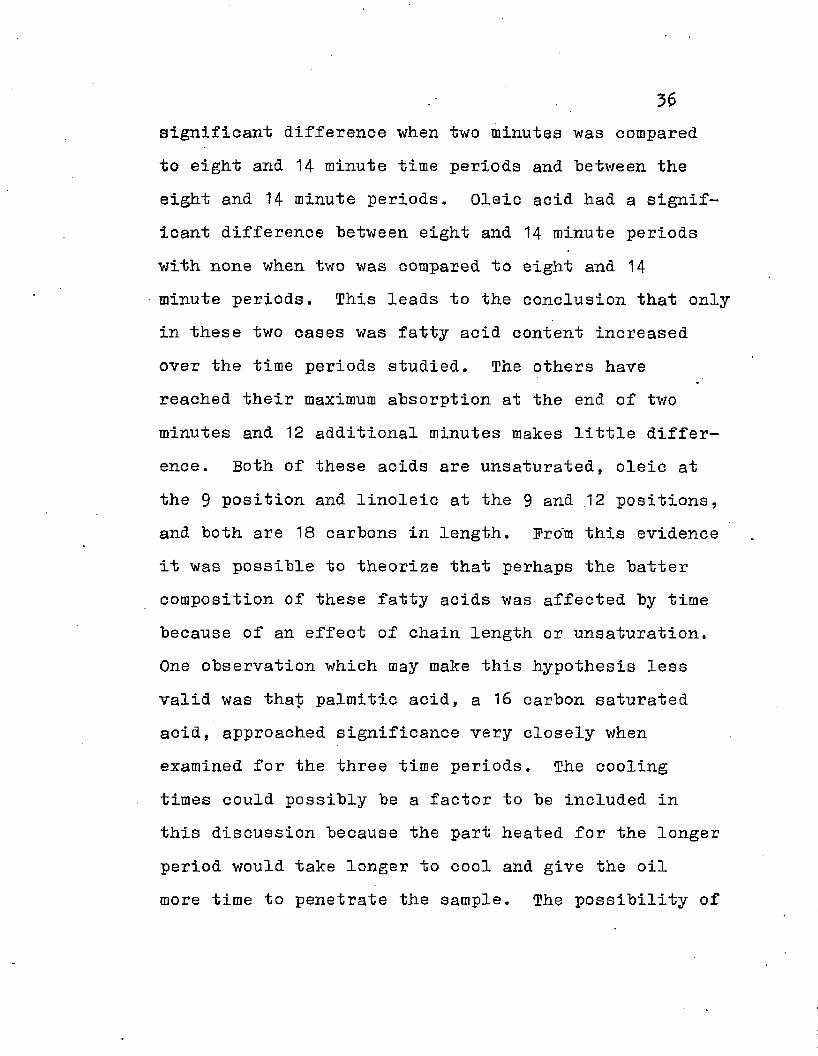
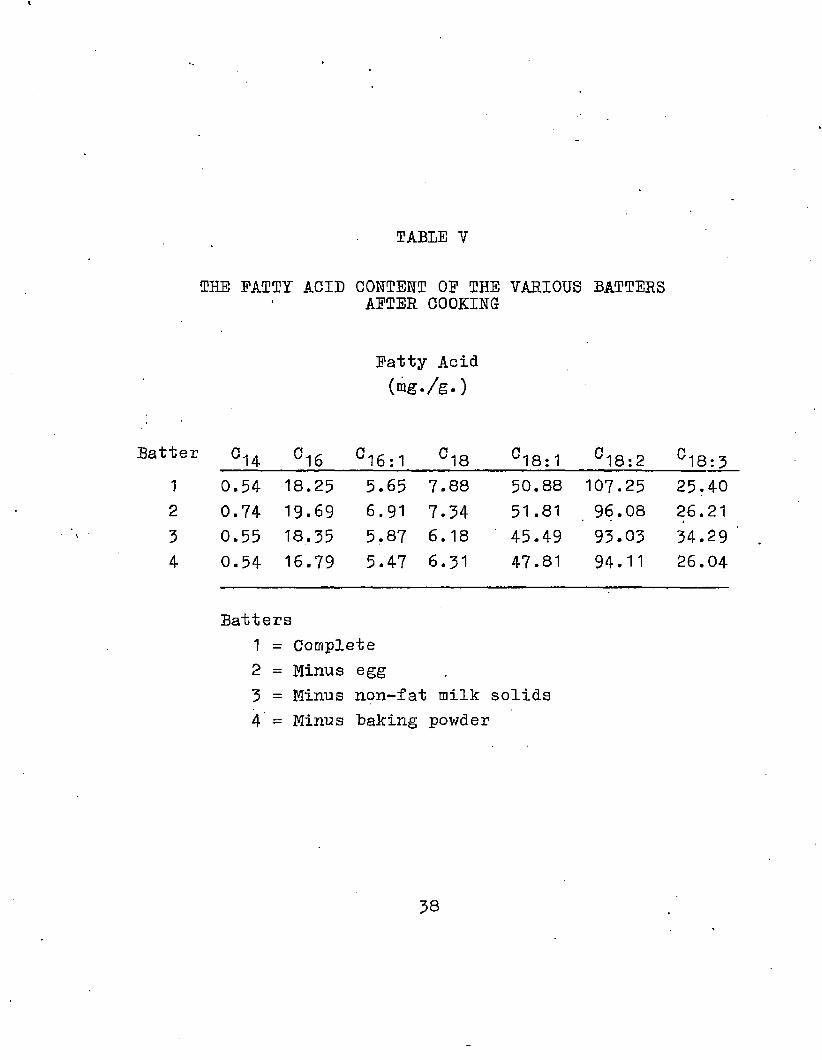
The hypothesis of no difference between means was determined to be true in the case of different batter recipes and their effects on the amount of oil removed from the cooking medium as seen in Table I. The means are presented in Table V for comparison.This result was expected to be significant in all cases. The hypothesis under which this experiment was designed was that significant differences would occur depending on the batter recipe. The reasoning for this was based on two factors primarily, the first that by removing the baking powder f rom the recipe and second by altering the other ingredients a difference in fatty acid content could be found.The removal of the baking powder was expected to reduce the surface area of the batter and consequently reduce the surface area to which the oil could be absorbed and/or adsorbed. This was apparently not the case and the absorption and/or adsorption remained
\
TABLE V
THE FATTY ACID CONTENT OF THE VARIOUS BATTERSAFTER COOKING
Fatty Acid (mg./g.)
;ter °14 °16 C16:1 °18 °18:1 °18:2 °18:31 0.54 18.25 5.65 7.88 50.88 107.25 25.402 0.74 19.69 6.91 7.34 51.81 96.08 26.213 0.55 18.35 5.87 6.18 45.49 93.03 34.29 '4 0.54 16.79 5.47 6.31 47.81 94.11 26.04
Batters1 = Complete2 = Minus egg3 = Minus non-fat milk solids4 = Minus "baking powder
38
39the same. The removal of whole egg and non-fat milk solids were selected because of their high fat content and lack of fat respectively, the removal of these ingredients was expected to have an influence on the fatty acid profile in the batter. This again proved to be a false assumption. A possible explanation for these results could be based on the fact that the amount of batter on the chicken part was a smail part of the whole, when the amount of cooking oil (1800 ml.) was considered. The increased amount of fatty acids contributed by the oil would completely hide any effect of the batter recipe.
The effect of batter recipe on cooking oil may be determined by comparing the samples removed after cooking the various batter coated chicken parts to the unused oil. These results are presented in Table II.
Cottonseed Oil
The oil used to cook the complete batter compared to the unused oil was associated with small if any differences being discovered in cottonseed oil after use, with the possible exception of palmitoleic acid where a decrease of more than 50% was noted. The removal of egg from the batter was associated with
several apparent increases of fatty acids in the oils. An additional factor of concern here was the additional amounts of water added to the hatter when egg was removed to maintain a uniform consistency of the hatter. The removal of non-fat milk solids caused an increase in palmitoleic acid and a possible decrease in linoleic acid of 55 mg., a larger decrease was found when linolenic acid was considered of approximately 100 mg. The removal of the baking powder had little influence on the fatty acid composition of the oil with the possible exception of palmitoleic acid.
Corn Oil
The various changes in the hatter recipes had in most cases very little influence on the fatty acid content of the hatter after cooking. The complete hatter showed what was considered a definite increase only in stearic acid and oleic acid where 9.4 and 24.8 mg./g. increases, respectively, were noticed (Table II). With the exception of palmitoleic and myristic acids, all the remaining fatty acids appear to increase upon the removal of egg from the hatter. With the added exception of linolenic acid the same conclusion was observed when non-fat milk solids were
41
removed. When baking powder was removed an across the board increase was noticed to occur with the exception of myristic acid, the true significance of these changes connot be determined without a statistical analysis.
Peanut Oil
The complete batter resulted in a possible increase
in palmitoleic acid only, the remaining fatty .acids maintained approximately the same proportions. With egg removed a different result was observed with a trend of increases in palmitic and palmitoleic acids and decreases in stearic, oleic, linoleic, and linolenic * acids being possible. The same was true when non-fat milk solids were removed. Upon removal of baking powder palmitic, linolenic, and to a lesser degree stearic acids were increased with decreases found in the comparative amounts of palmitoleic, oleic, and linoleic, again the significance of these changes are in doubt because a statistical analysis was not run on this data.
Lard
The fatty acids in the oil were influenced by
changes in the "batter fried in them only to a small degree if at all. Possible decreases from the'fatty acid composition of the unused oil were found when
egg was removed from the batter in the case of palmitic and palmitoleic acids, the same trend was noticed when the non-fat milk solids were removed. Possible increases were found in the case of linoleic acid when the complete batter and batter with baking powder removed were used to coat the chicken part.An increase was also possible when baking powder was removed and myristic acid levels considered.
Mixed Oil
Possible decreases were noted for palmitic acid when egg and non-fat milk solids were removed, oleic acid and linolenic acid when egg was removed and linoleic acid when baking powder was removed. A trend of increases was discovered when linolenic acid levels are considered with the exception of the levels
when egg was removed.hue to visual observation of the used oil when
compared to the unused oil it was apparent that some of the batter was becoming detached from the sample and contaminating the oil giving it a darkened
granular appearance. Tills darkened color was most apparent in the oil in which hatter including nonfat milk solids were present. This could cause a dilution or enhancement of the oil depending on the fatty acid content of the various ingredients of the hatter and fatty acid content of the oils. The removal of the commercially prepared non-fat milk solids from the hatter in most cases had little effect, with some exceptions noted. The fact that these solids are low in fat would indicate that the amount of fatty acids they would contribute would he near aero and any
removal' of hatter from the sample would only he influenced hy non-fat milk solids in their ability to dilute the oil. Ho attempt was made to adjust the hatter sample when this ingredient was omitted and because of this a more concentrated fat content could he expected to he the case. Also the same amount of water was used with no apparent change in the consistency of the resulting hatter, hut undouhtly the hatter was to some degree less viscous. Therefore, less hatter would he exposed to the cooking oil hut at the same time an increase in the amount of detached hatter may occur due to the loss of adhesiveness. The amount of hatter exposed was increased when it is realized
that the 180G ml. of oil was exposed to batter coated parts for the three time periods and for this reason the batter was in contact with the oil for longer periods. The cooking of the three time periods at the same time interval was also the reason a split plot analysis was necessary. This increases the likelihood of batter fat moving into the cooking oil but not being found when fat movement into the batter is examined.The removal of the more volatile fatty acids could have a concentrating action on the other fatty acids.
Interactions
Table I shows a significant batter x time interaction for palmitic acid, stearic acid, oleic acid, and linoleic acid, these means can be seen in Table VI.This indicated that for all time periods the effects of the various batters were not the same. The interaction for palmitic acid can probably be explained by the complete batter increasing from two to eight minutes and then decreasing at the end of 14 minutes, the batter minus egg and non-fat milk solids decreasing from two
to eight minutes and increasing from eight to 14 minutes. Batter minus baking powder increased from two through 14 minutes. A similar explanation can be used for the
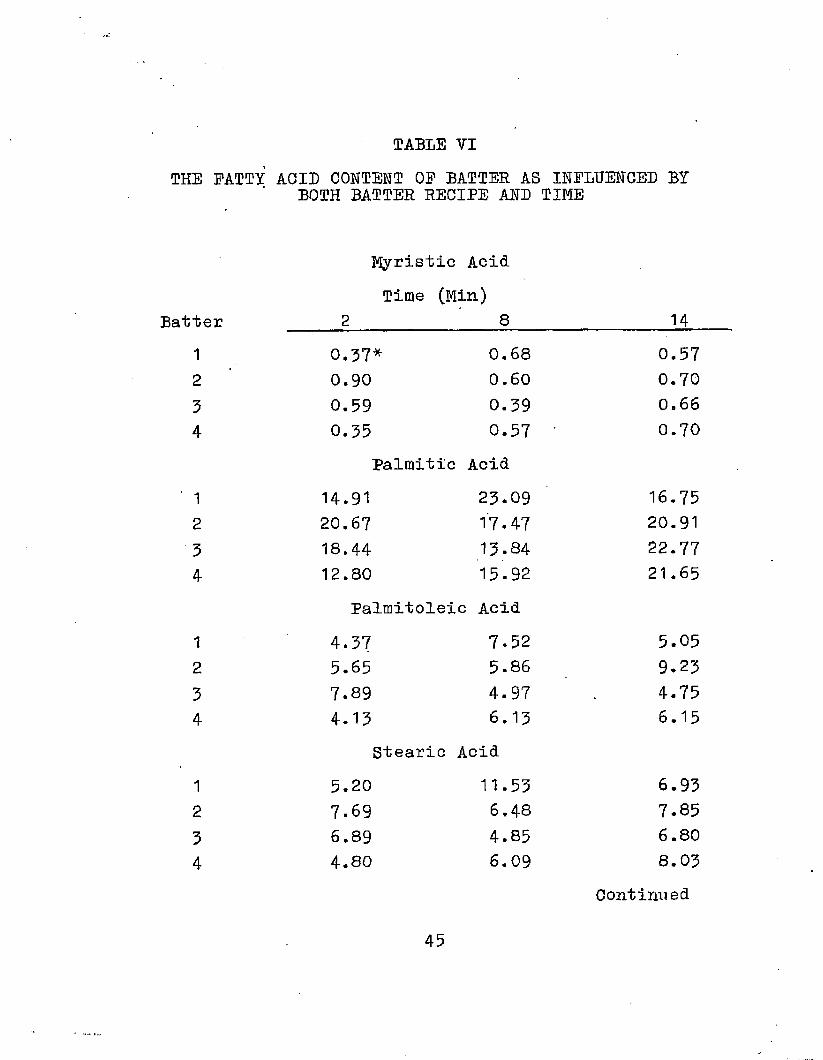
TABLE VITHE FATTY ACID CONTENT OF BATTER AS INFLUENCED BY
BOTH BATTER RECIPE AND TIME
Myristic Acid
Time (Min)Batter 2____________ 8________________ 14
1 0.57* 0.68 0.572 0.90 0.60 0.705 0.59 0.59 0.664 0.55 0.57 ' 0.70
Palmitic Acid
' 1 14.91 25.09 16.752 20.67 17.47 20.915 18.44 15.84 22.774 12.80 15.92 21.65
Palmitoleic Acid
1 4.57 7.52 5.052 5.65 5.86 9.255 7.89 4.97 . 4-754 4.15 6.15 6.15
Stearic Acid
1 5.20 11.53 6.932 7.69 6.48 7.855 6.89 4.85 6.804 4.80 6.09 8.05
Contimied
45
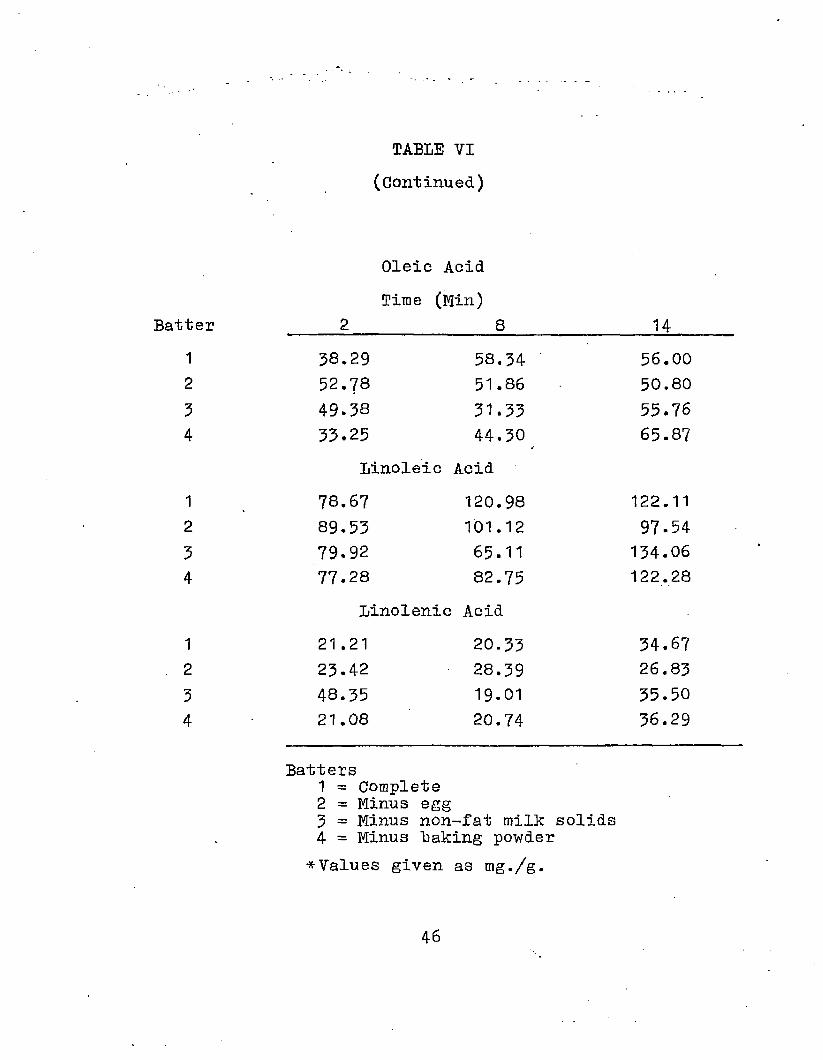
TABLE VI(Continued)
Oleic Acid Time (Min)
Batter 2 _________ 8 _______________ 141 38.29 58.34 56.002 52.78 51.86 50.803 49.38 31.33 55.764 33.25 44.30 65.87
Linoleic Acid1 78.67 120.98 122.112 89.53 101.12 97.543 79.92 65.11 134.064 77.28 82.75 122.28
Linolenic Acid1 21.21 20.33 34.672 23.42 28.39 26.833 48.35 19.01 35.504 21.08 20.74 36.29
Batters1 = Complete2 = Minus egg3 = Minus non-fat milk solids4 = Minus "baking powder
* Values given as mg./g.
46
stearic acid interaction in which the same trends of increase and decrease can be observed. The oleic acid
interaction was different because it showed a different trend for the batter minus egg than was encountered in the first two to be discussed. In this interaction batter minus egg decreased slighty from
two to 14 minutes instead of the increase at 14 minutes observed in the previous discussion. The linoleic interaction was even more different from the above.The batter minus non-fat milk solids and batter minus baking powder showed a slight if any decrease from two to eight minutes and an increase which was quite apparent from eight to 14 minutes. The complete batter and batter minus egg were the odd ones of this group with an increase from two to eight minutes and then a very small change from eight to 14 minutes.
The oil x batter means in Table VII and the oil x time means in table VIII were found to have no significant interactions.
The cooking oil had the greatest influence on fatty acid content of the batter samples of any variable studied. When the composition of the cooking oils was considered along with the large quantities of oil used it was easy to understand why they play such an important role in the fatty acid composition of the
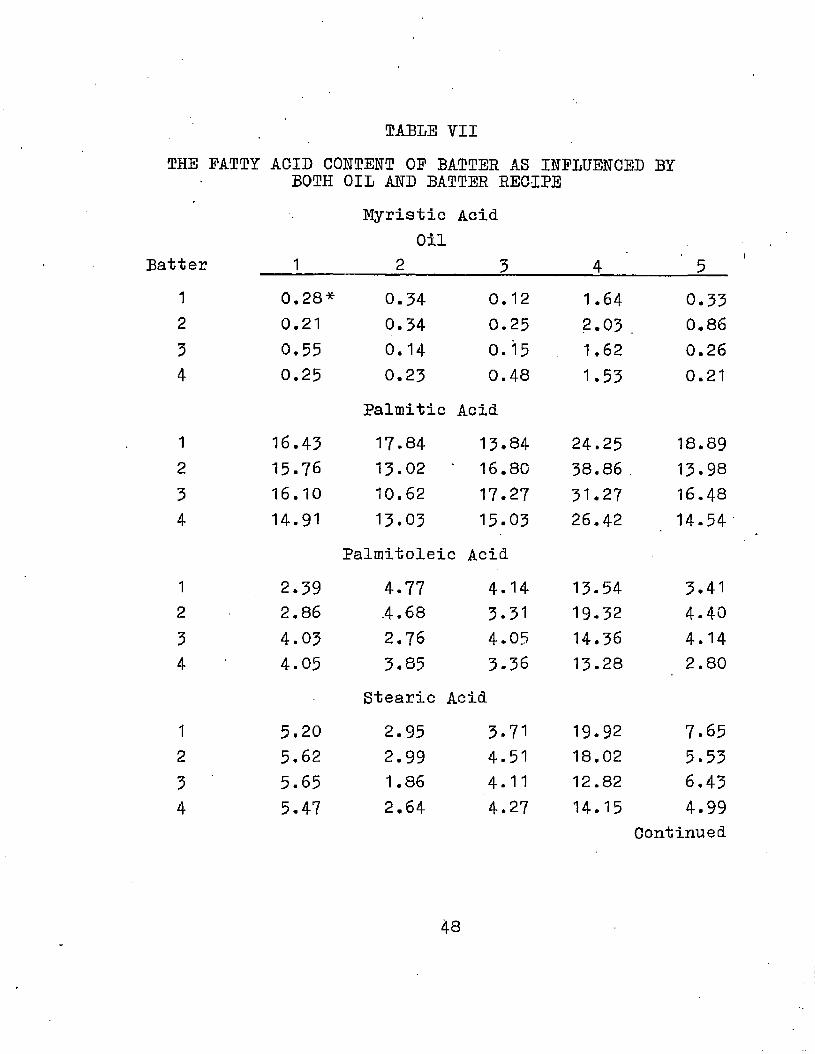
TABLE VIITHE FATTY ACID CONTENT OF BATTER AS INFLUENCED BY
BOTH OIL AND BATTER RECIPEMyristic Acid
OilBatter 1__________2 3________ 4 5
1 0.28* 0.34 0.12 1.64 0.332 0.21 0.34 0.25 2.03 0.863 0.55 0.14 0.15 1.62 0.264 0.25 0.23 0.48
Palmitic Acid1.53 0.21
1 16.43 17.84 13.84 24.25 18.892 15.76 13.02 16.80 38.86 13.983 16.10 10.62 17.27 31.27 16.484 14.91 13.03 15.03
Palmitoleic Acid
26.42 14.54
1 2.39 4.77 4.14 13.54 3.412 2.86 .4.68 3.31 19.32 4.403 4.03 2.76 4.05 14.36 4.144 4.05 3.85
Stearic3.36
Acid13.28 2.80
1 5.20 2.95 3.71 19.92 7.652 5.62 2.99 4.51 18.02 5.533 ' 5.65 1.86 4.11 12.82 6.434 5.47 2.64 4.27 14.15 4.99
Continued
48
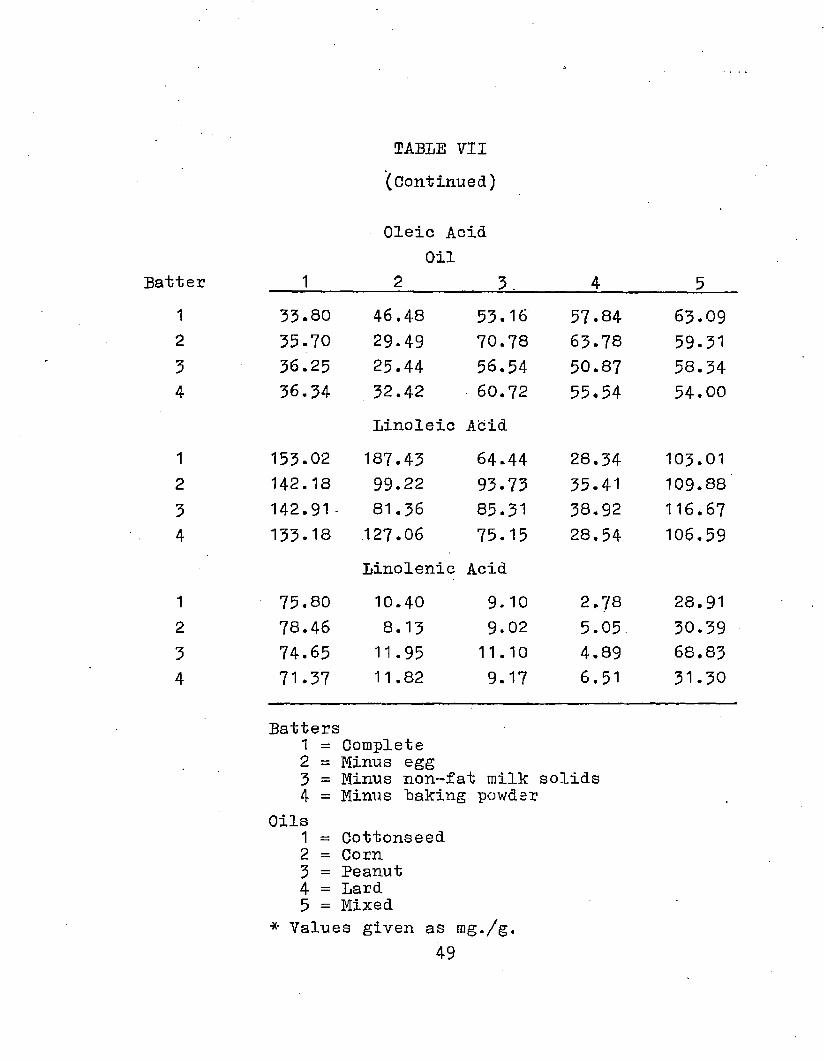
TABLE 711(Continued)
Oleic Acid Oil
;ter 1 2 3. 4 51 33.80 46.48 53.16 57.84 63.092 35.70 29.49 70.78 63.78 59.313 36.25 25.44 56.54 50.87 58.344 36.34 32.42 60.72 55.54 54.00
Linoleic Acid1 153*02 187.43 64.44 28.34 103.012 142.18 99.22 93.73 35.41 109.883 142.91- 81.36 85.31 38,92 116.674 133.18 127.06 75.15 28.54 106.59
Linolenic Acid1 75.80 10.40 9.10 2.78 28.912 78.46 8.13 9.02 5.05 30.393 74.65 11.95 11.10 4.89 68.834 71.37 11.82 9.17 6.51 31.30
Batters1 = Complete2 = Minus egg3 = Minus non-fat milk solids4 = Minus "baking powder
Oils1 = Cottonseed2 = Corn3 = Peanut4 = Lard5 = Mixed
* Values given as mg./g.49
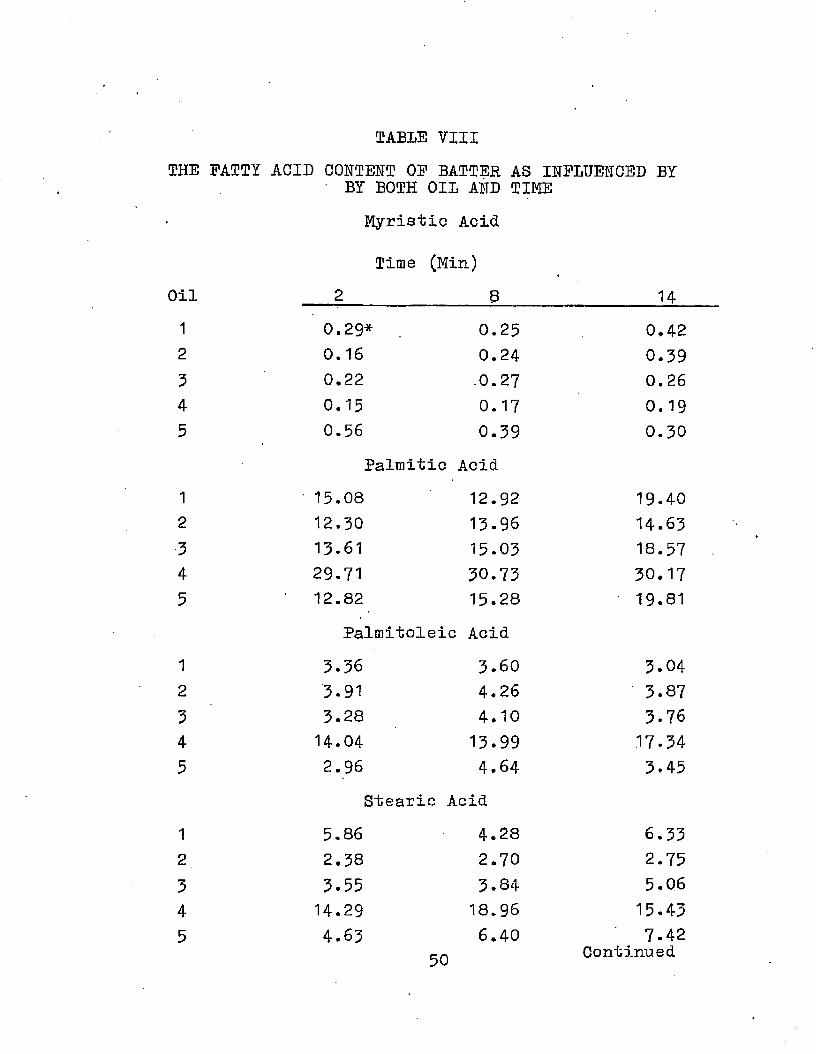
TABLE VIIITHE PATTY ACID CONTENT OP BATTER AS INFLUENCED BY
' BY BOTH OIL AND TIMEMyristic Acid
Time (Min))il 2 8 141 0.29* 0.25 0.422 0.16 0.24 0.393 0.22 .0.27 0.264 0.15 0.17 0.195 0.56 0.39 0.30
Palmitic Acid1 15.08 12.92 19.402 12.50 13.96 14.63■3 13.61 15.03 18.574 29.71 30.73 30.175 12.82 15.28 19.81
Palmitoleic Acid1 3.36 3.60 3.042 3.91 4.26 3.873 3.28 4.10 3.764 14.04 13.99 17.345 2.96 4.64 3.45
Stearic Acid1 5.86 4.28 6.332 2.38 2.70 2.753 3.55 3.84 5.064 14.29 18.96 15.435 4.63 6.40 7.42
50 Continued
IABLE 71II(Continued)
. Oleic Acid
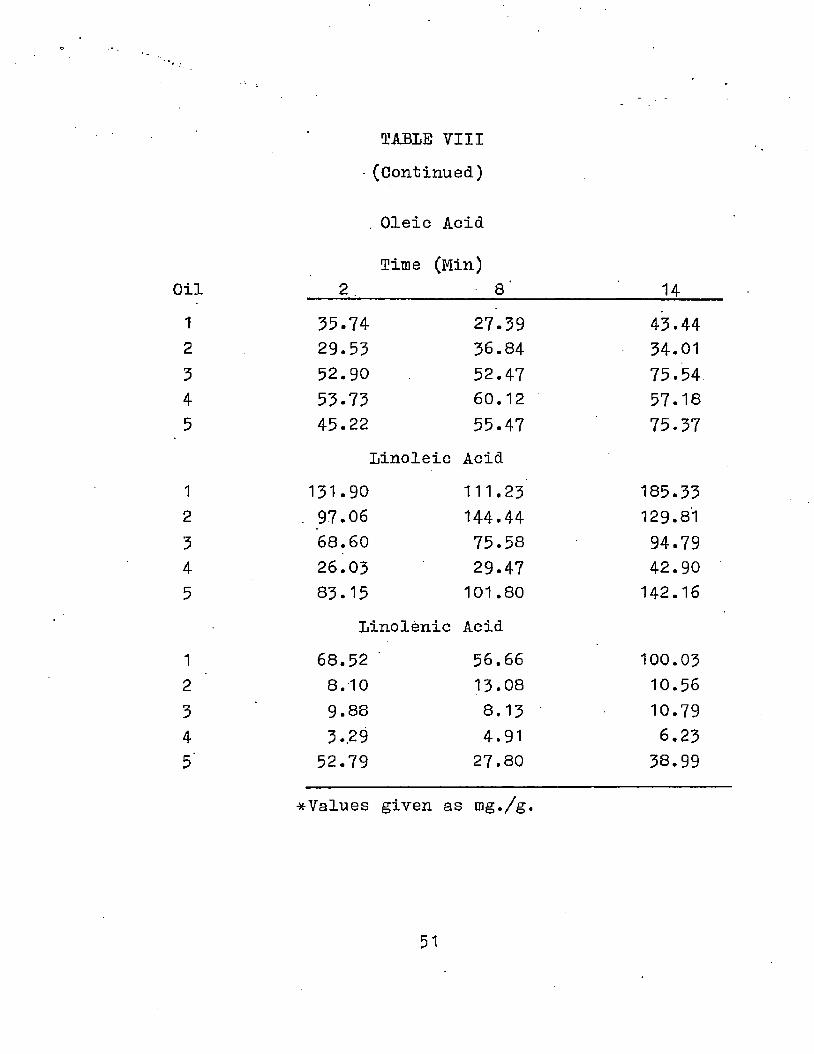
Time (Min)Oil 2 ,____________ 8' 141 35.74 27.39 43.442 29.53 36.84 34.015 52.90 52.47 75.544 53.73 60.12 57.185 45.22 55.47 75.37
Linoleic Acid1 131.90 111.25 185.332 . 97.06 144.44 129.815 68.60 75.58 94.794 26.03 29.47 42.905 83.15 101.80 142.16
Linolenic Acid
1 68.52 ' 56.66 100.032 8.10 13.08 10.563 9.88 8.13 10.794 3.29 4.91 6.235 52.79 27.80 38.99
*Values given as mg./g.
51
"batter. She contribution of the individual oils varies to some degree and was not always dependent on the oil with the highest percentage of a fatty acid contributing more of this acid than another oil. Contrary to what was found in the tissue samples, time had a significant effect when oleic and linoleic acids were examined, this may not only include exposure time at elevated temperatures but also cooling time of the sample. The batter recipe was found to be of little importance on the fatty acid composition of the batter but was found to result in possible changes in the cooking medium. The changes, if they were significant, in the cooking medium could result in different fatty acids dominating absorption if the oils were used over an extended period such as in commercial use.
Tissue Samples
Cooking Oil
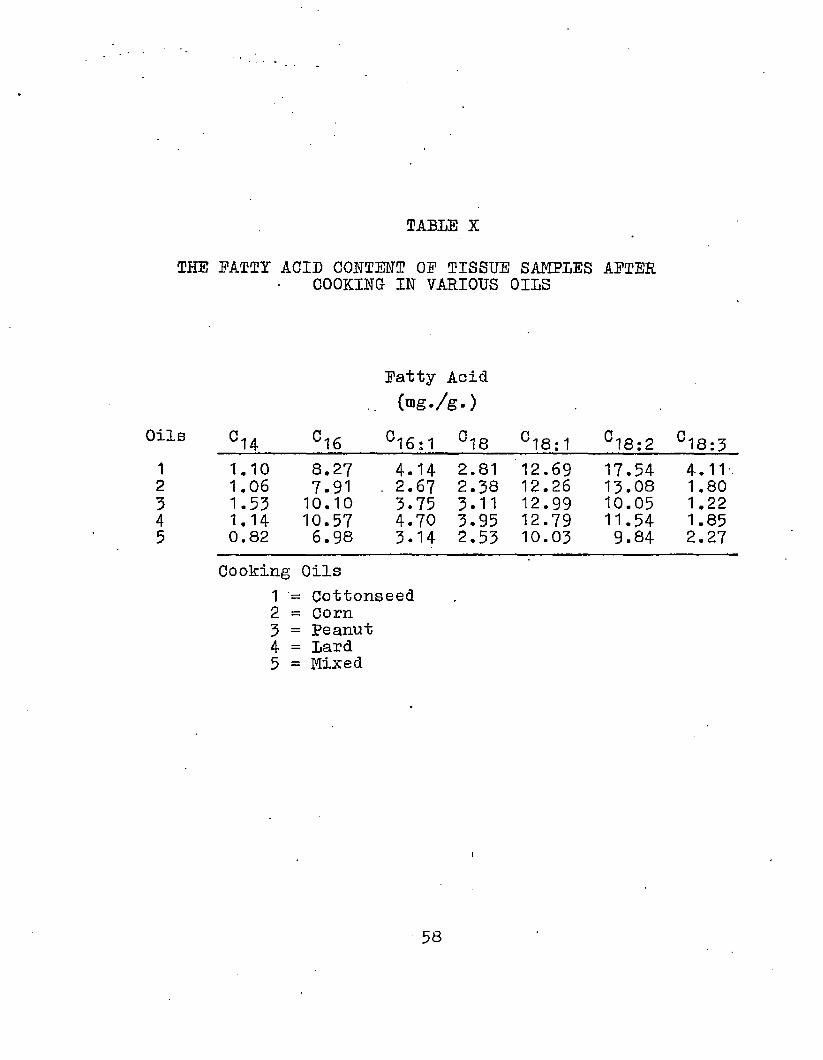
An analysis was conducted of the various tissue samples to determine the amount of myristic, palmitic, palmitoleic, stearic, oleic, linoleic, and linolenic acids. The analysis of variance of the data for each of the fatty acids is presented in Table IX. Significant differences were noted between oils used to fry the chicken parts when linoleic and linolenic acids were analyzed. Table X shows these differences might be attributable to cottonseed oil which was comparatively high in these two fatty acids. It was interesting to note that although cottonseed oil contributed the largest amount of both linoleic and linolenic acids it does not have the highest content of linoleic acid as seen in Table II. Corn oil had a larger amount of this fatty acid than cottonseed but contributed less to the tissue. Cottonseed did have the largest percentage of linolenic acid in both the tissue and the oil. The other oils fall in line behind cottonseed as they should, with the exception of peanut oil and lard.
Orthogonal comparisons were made to separate the degrees of freedom and determine more accurately where
53
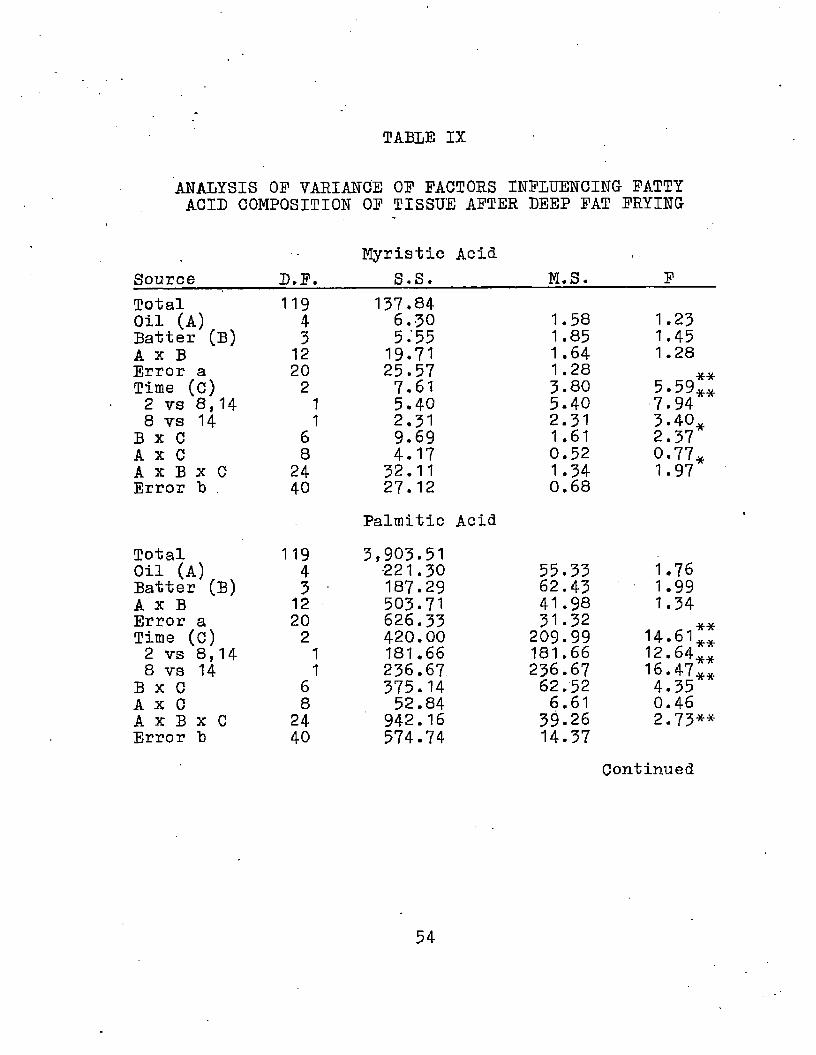
TABLE IX
ANALYSIS OF VARIANCE OP FACTORS INFLUENCING FATTY ACID COMPOSITION OP TISSUE AFTER DEEP FAT FRYING
Source D.F.Myristic Acid
S.S. M.S.Total 119 137.84Oil (A) 4 6.30 1.58Batter (B) 3 5.55 1.85A x B 12 19.71 1.64Error a 20 25.57 1.28Time (c) 2 7.61 3.802 vs 8,14 1 5.40 5.408 vs 14 1 2.31 2.31
B x C 6 9.69 1.61A x C 8 4.17 0.52A x B x C 24 32.11 1.34Error b . 40 27.12 0.68
F
1.25 1.45 1.28
5.59**7.945.40*2.370.77*1.97
Palmitic Acid
Total 119 3,903.51Oil (A) 4 •221.30 55.33Batter (B) 3 • 187.29 62.43A x B 12 503.71 41.98Error a 20 626.33 31*32Time (C) 2 420.00 209.992 vs 8,14 8 vs 14
1 181.66 181.661 236.67 236.67
B x C 6 375.14 62.52A x C 8 52.84 6.61A x B x C 24 942.16 39.26Error b 40 574.74 14.37
1.76 1.991.34
14.61 12.64 16.474.35 0.46 2.73**
•#*
**
Continued
54
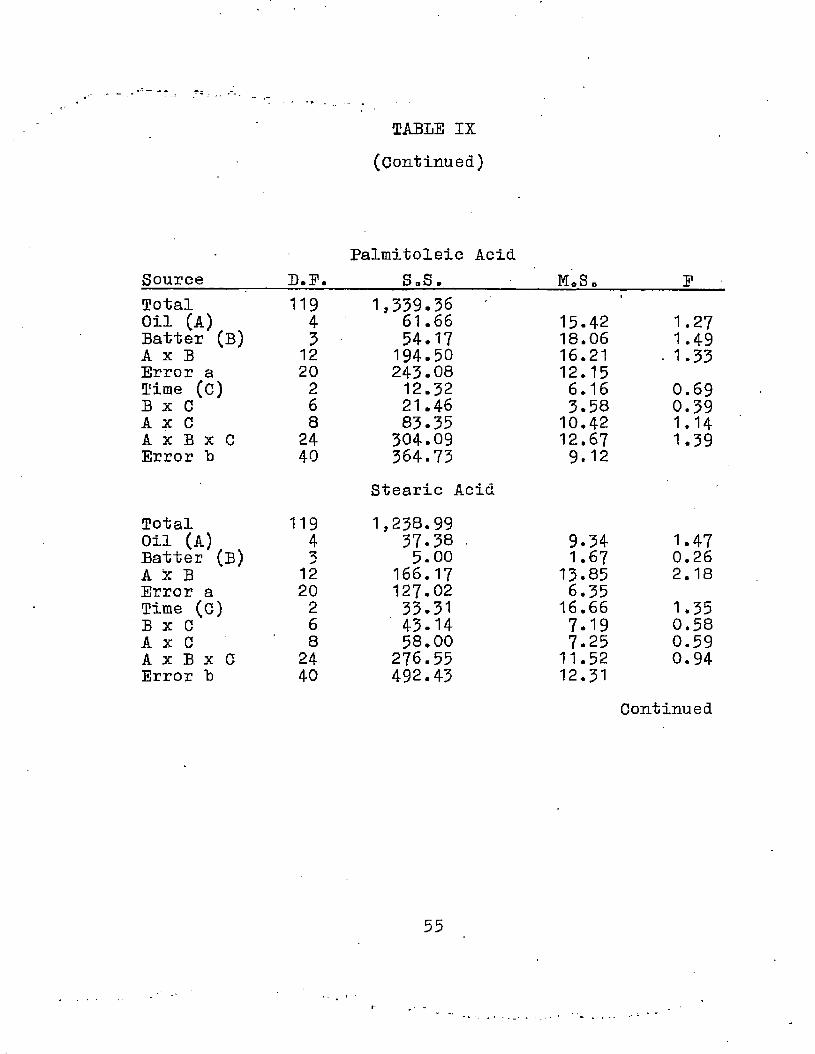
TABLE IX(Continued)
Palmitoleic AcidSource________ B.E.________S.S ._______ M aSn PTotal 119 1,339.36 *Oil (A) 4 61.66 15.42 1.27Batter (B) 3 54.17 18.06 1.49A x B 12 194.50 16.21 • 1.33Error a 20 243.08 12.15Time (c) 2 12.32 6.16 0.69B x C 6 21.46 3.58 0.39A x C 8 83-35 10.42 1.14A x B x C 24 304.09 12.67 1.39Error "b 40 364.73 9.12
Stearic Acid
Total 119 1,238.99Oil (A) 4 37.38 . 9.34 1.47Batter (B) 3 5.00 1.67 0.26A x B 12 166.17 13.85 2.18Error a 20 127.02 6.35Time (C) 2 33.31 16.66 1.35B x C 6 43.14 7.19 0.58A x C 8 58.00 7.25 0.59A x B x C 24 276.55 11.52 0.94Error "b 40 492.43 12.31
Continued
55
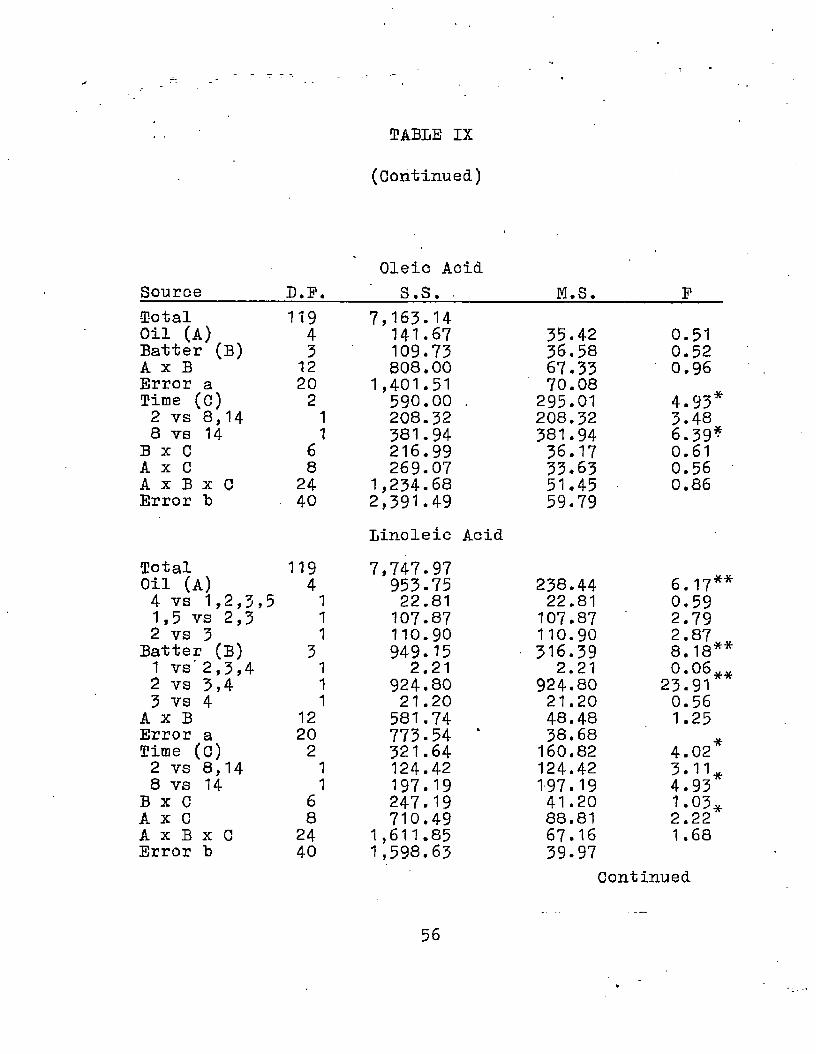
TABLE IX
(Continued)
Source D.P.Oleic Acid
S.S. M.S. P-Total 119 7,1.63.14Oil (A) 4 141.67 35.42 0.51Batter (B) 5 109.73 36.58 0.52A x B 12 808.00 67.33 0.96Error a 20 1,401.51 70.08Time (C) 2 590.00 . 295.01 4.93*2 vs 8,14 1 208.32 208.32 3.488 vs 14 1 381.94 381.94 6.39*
B x C 6 216.99 36.17 0.61A x C 8 269.07 33.63 0.56A x B x C 24 1,234.68 51.45 0.86Error b . 40 2,391.49 59.79
Linoleic AcidTotal 119 7,747.97Oil (A) 4 953.75 238.44 6.174 vs 1,2,3,5 1 22.81 22.81 0.591,5 vs 2,3 1 107.87 107.87 2.792 vs 3 1 110.90 110.90 2.87
Batter (B) 3 949.15 316.39 8.181 vs' 2,3,42 vs 3,4
1 2.21 2.21 0.061 924.80 924.80 23.91
3 vs 4 1 21.20 21.20 0.56A x B 12 581.74 48.48 1.25Error a 20 773.54 * 38.68Time (c) 2 321.64 160.82 4.022 vs 8,14 1 124.42 124.42 3.118 vs 14 1 197.19 197.19 4.93
B x C 6 247.19 41.20 1.03A x C 8 710.49 88.81 2.22A x B x C 24 1,611.85
1,598.6367.16 1.68
Error b 40 39.97Continued
56
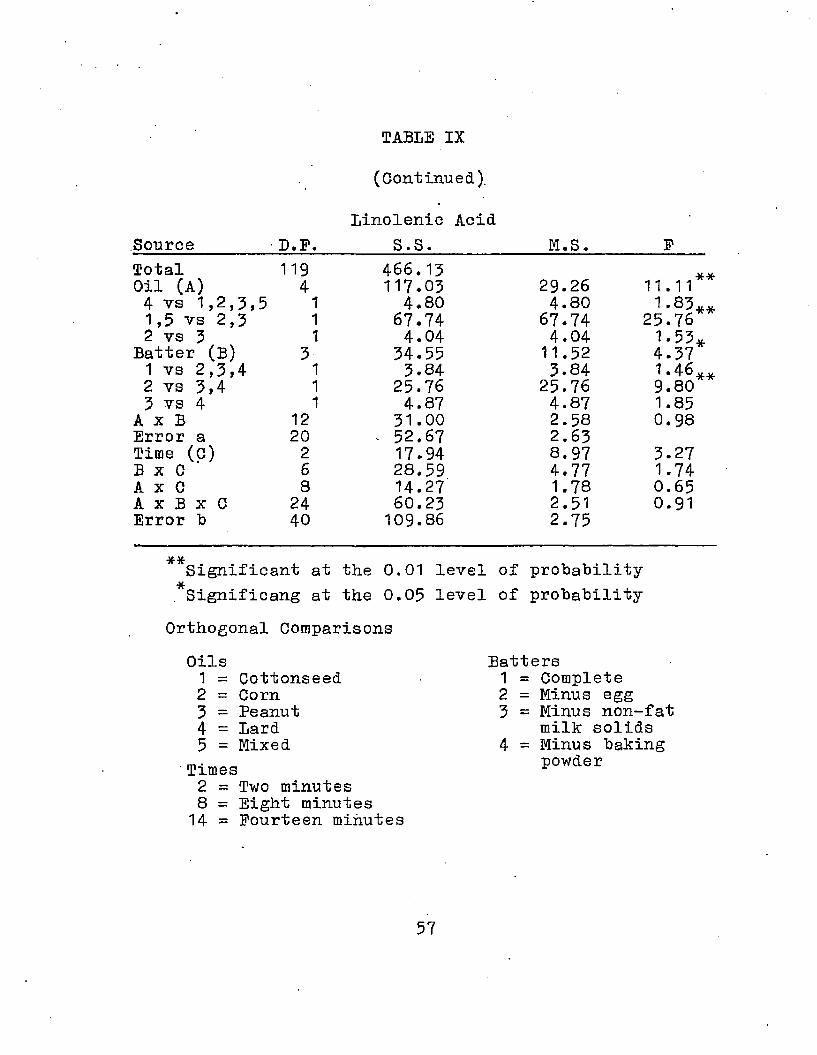
TABLE IX
(Continued).
Linolenic AcidSource D.F. S.S. M.S. FTotal 119 466. 13Oil (A) 4 117.03 29.26 11.114 vs 1,2,3,5 1 4.80 4.80 1-83**1,5 vs 2,3 1 67.74 67.74 25.762 vs 3 1 4.04 4.04 1.53*
Batter (B) 3 34.55 11.52 4.371 vs 2,3,4 1 3.84 3.84 1 • 46 j,2 vs 3,4 1 25.76 25.76 9.803 vs 4 1 4.87 4.87 1.85
A x B 12 31.00 2.58 0.98Error a 20 * 52.67 2.63Time (C) 2 17.94 8.97 3.27B x C 6 28.59 4.77 1.74A x C 8 14.27 1.78 0.65A x B x C 24 60.23 2.51 0.91Error b 40 109.86 2.75
Significant at the 0.01 level of probabilityLSignificang at the 0.05 level of probability
Orthogonal ComparisonsOils1 = Cottonseed2 - Corn3 = Peanut4 = Lard5 = Mixed
Times 2 j= Two minutes 8 = Eight minutes 14 = Fourteen minutes
Batters1 = Complete2 = Minus egg3 = Minus non-fat
milk solids4 = Minus baking
powder
57
ui
-t=.
v>j
ro
—»■
TABLE X
THE EATTY ACID CONTENT OE TISSUE SAMPLES AETER COOKING IN VARIOUS OILS
Eatty Acid (mg./g.)
C14 C16 C16; 1 C18 °18:1 °18:2 C18:31.10 8.27 4.14 2.81 12.69 17.54 4.11-1.06 7.91 . 2.67 2.38 12.26 13.08 1.801.53 10.10 3.75 3.11 12.99 10.05 1.221,14 10.57 4.70 3.95 12.79 11.54 1.850.82 6.98 3.14 2.53 10.03 9.84 2.27
Cooking Oils1 = Cottonseed2 = Corn3 = Peanut4 - Lard5 = Mixed
58
the differences were to be found. The comparisons are shown in Table IX. The comparison between the animal (lard) and plant sources (oils) and the corn oil, peanut oil comparison were found to be nonsig- nificantly different. The cottonseed and mixed oils versus corn and peanut oils comparison was highly significant in the case of linolenic acid and not significant in linoleic acid. It was readily apparent that the comparisons made for linoleic acid did not reflect where the differences were to be found. Linolenic acid gave more of an indication but the small amount of the variance accounted for by thi3 comparison leaves some doubt as to the importance of this difference.
A most interesting phenomenon seems to be presented by the linoleic acid means which appear to be reversed. A closer examination of Table II will show that linoleic and linolenicr acids were* more evenly distributed in cottonseed oil than any of the other oils. To the contraty however corn which had the second largest total of linoleic acid (Table X) had a more uneven distribution than all the others. The others seem to follow the example of cottonseed, the largest content of the fatty acids being found in those' which were more evenly
60balanced or equal in content. Perhaps linolenic acid had an influence on linoleic acid which enhances movement of fats containing these fatty acids from the cooking medium through the batter and into the tissue sample, it was also interesting to note that both of these fatty acids were unsaturated and 18 carbon chained,
the unsaturation occurred at the 9 and 12 position for linoleic acid and 9>12, and 15 positions for linolenic acid. The 12 position could have importance when it is considered that oleic acid is an 18 carbon fatty acid unsaturated in the 9 position and was not significant.
Batter Recipe
Batter recipe effects were found only in the cases of linoleic and linolenic acid levels in the tissue. These means are shown in Table XI. Greater linoleic and linolenic acid levels were reflected when egg was omitted from the batter. ' The removal of the egg was compensated for by addition of water to maintain the uniform consistency desired. The water could have been removed from the batter as steam and the oil may have moved in to replace the water and in this way come into contact with the tissue sample. The confusingpart of this was that in the analysis of the batter
(
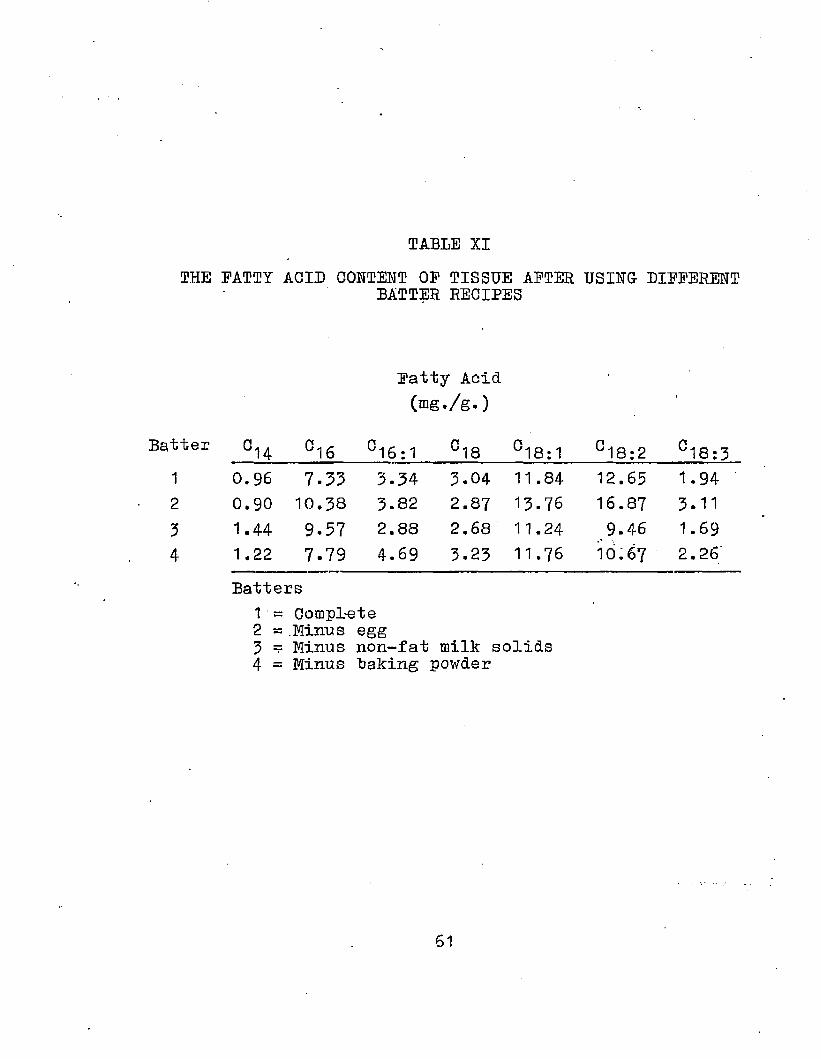
TABLE XITHE EATTY ACID CONTENT OP TISSUE AETER USING DIEEERENT
BATTER RECIPES
Eatty Acid (mg./g.)
itter C14 °16 C16:1 C18 °18:1 °18:2 oCO
«1
1 0.96 7.33 3.34 3.04 11.84 12.65 1.942 0.90 10.38 3.82 2.87 13.76 16.87 3.115 1.44 9.57 2.88 2.68 11.24 9.46 1.694 1.22 7-79 4.69 3.23 11.76 10:67 2.26
Batters1 = CompLete2 = .Minus egg3 = Minus non-fat milk solids4 = Minus baking powder
61
samples no significant differences could "be attributed to the batter recipe. The difference between the batter minus baking powder and the complete batter could be of little significance in the case of linolenic acid due to the nearness of the means. The difference of two mg./g. of tissue in the linoleic acid means was too large to be ignored. The lack of baking powder apparently resulted in a decrease in the amount of gas formation which caused a thinner but more solid barrier to the oil which hardened to quite an extent upon heating and therefore, reduced the amount of penetration of this fatty acid. The removal of the non-fat milk solids appears to have increased the penetration of oil the least of all.
Orthogonal comparisons of the batter samples were conducted to try and separate the degrees of freedom necessary to aid the analysis. At the onset of the experiment it was decided to compare the complete batter to the others (1 vs 2,3,4), the batter minus egg to the batters minus non-fat milk solids and baking powder (2 vs 3,4) and finally the batter minus the non-fat milk solids to the one minus the baking powder (3 vs 4). The only comparison which proved to be significant for both the fatty acids, linoleic and
• . - 63linolenic, was the second (2 vs 3,4). These were found to be highly significantly different and were ...■the only differences found for either fatty acid.As the analysis of the means indicated the batter in which the egg was removed resulted in a significant increase of these two fatty acids in the tissue sample.
The same two fatty acids which had a significant difference attributable to cooking oil also demonstrated a significant batter effect. Batter and oil were
apparently complementary because without the fatty acids being present in the oil there could be no
penetration and likewise if the batter reduces or stops penetration, very little difference would be noticed. The enhancement of penetration could have
a simple explanation such as the removal of egg removes a large amount of lipid and thereby facilitating movement into the batter and through to the tissue.
Time
The significant differences attributable to time are presented in Table IX. In this table time of cooking had an influence which was significant when
myristic, palmitic, oleic, and linoleic acids were considered. Linolenic acid approached significance.The means of the fatty acid content of tissue samples are shown in Table XII. An increase as time increased was found to be the case for all of the fatty acids when the mean values were observed. This indicated that movement into and through the batter barrier was not simply an immediate uncomplicated movement but one into which-several factors were brought to bear often
over a period of time. The cooling time was increased as the temperature was maintained for longer periods of
time and could have an influence on the penetration of the oil.
Orthogonal comparisons were run in an attempt to separate any differences which would occur here into
significant and not significant changes. Table IX shows that only the fatty acids which had significant differences due to time were chosen for the comparisons. A highly significant difference was found when the two minute period was compared to the eight and 14 minute time periods in the case of myristic acid and palmitic acid. The comparison of the eight and 14 minute periods revealed a highly significant difference for palmitic acid and a significant difference for oleic
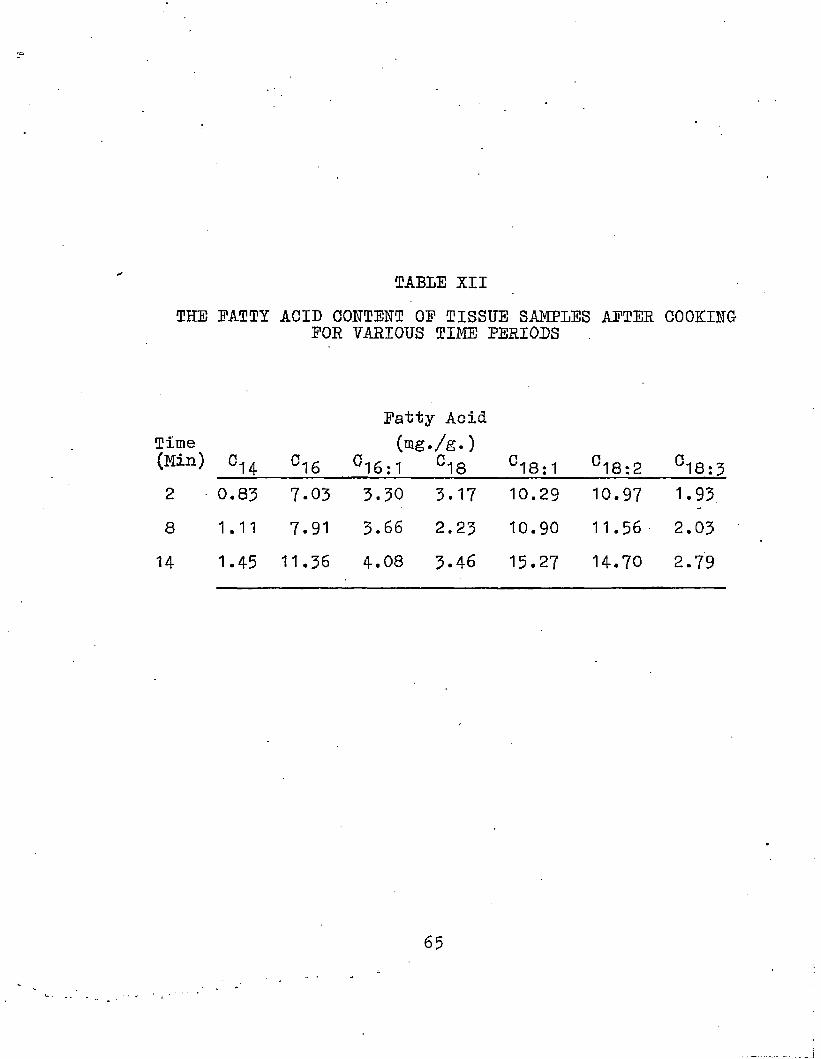
TABLE XIITHE FATTY ACID CONTENT OF TISSUE SAMPLES AFTER COOKING
FOR YARIOUS TIME PERIODS
Fatty AcidTime(Min) °14 C16
(mg./g.) °16:1 °18 C18:1 C18:2 °18:3
2 0.85 7-03 3.30 3.17 10.29 10.97 1.938 1.11 7.91 3.66 2.23 10.90 11.56 2.0314 1.45 11.36 4.08 3-46 15.27 14.70 2.79
65
66acid and linoleic acid. These comparisons indicated that a significant increase in the fatty acid content occurred after two, eight, and 14 minutes when palmitic acid was measured. Myristic acid was discovered to increase after 'being cooked for eight or 14 minutes with no differences being noted between the eight and 14 minute periods. Increased fatty acid content of tissue was observed when .palmitic, oleic, and linoleic acids were cooked for 14 minutes when compared to the content of the tissue after eight minutes.
The heating of the batter with its consequent removal of water and formation of a hard coating around the tissue sample could result in, over a time period, an effect on the penetration into the tissue sample even though it is not the .entire answer. The reason for all the fatty acids considered being significantly different and not stearic and palmitoleic acids was unexplainable with this data. Perhaps the answer lies in physical characteristics, palmitoleic is a 16 carbon fatty acid with a double bond at the 9 position and stearic is a saturated 18 carbon fatty acid. The movement through the batter to the tissue of the oil over a period of time was enhanced when saturated fatty acids of 16 carbons or less and
67-unsaturated fatty .acids of 18 carbons compose the triglyceride. The obvious answer of increased migration because of more time in which to accomplish the task does not explain the reason only these were significant. The fact that palmitic, oleic, linoleic, and linolenic acids were present in large quantities in the oil does not explain why these show an increase in the tissue with time. If the total amount is considered to be the criteria of penetration then the one present in the oils in the largest quantity (Table.II) would have the greatest increase over the time periods, linoleic acid would have the greatest increase followed by oleic, palmitic, linolenic, stearic, palmitoleic, and myristic acids in decreasing order of magnitude.It was readily diseernable that the order of amount of penetration increase was oleic acid followed by palmitic, linoleic, linolenic (which only approaches significance), and myristic acids. The others, palmitoleic and stearic acids, were not significant for time. Myristic acid was very low in the oil samples, less than 0.1 mg./g. of oil except in the case of lard, yet an increase was
noted from two to eight and eight to 14 minutes of0.272 and 0.345 mg./g. of tissue respectively. This could suggest a type of concentrating mechanism.
On the basis of the evidence a'solution based on amount present in the cooking oil must be rejected.
Interactions
Table IX indicates that significant batter x time interactions were found for both myristic acid and palmitic acid. The means for these fatty acids can be found in Table XIII. Myristic acid had a significant interaction because all batters did not have the same effect for all time periods. The complete batter across the three time periods showed an increase for two to eight minutes and a decrease from eight to 14 minutes. The other batters showed an increase from two through 14 minutes. The palmitic acid interaction, similar to myristic acid, showed an increase from two to eight minutes for the complete batter followed by a decrease from eight to 14 minutes The batters minus egg and non-fat milk solids had an increase from two through 14 minutes. . The batter minus baking pov/der showed a decrease from two to eight minutes then a increase from eight to 14 minutes These differences apparently caused the interaction to be significantly different.
The examination of the oil x time interaction in
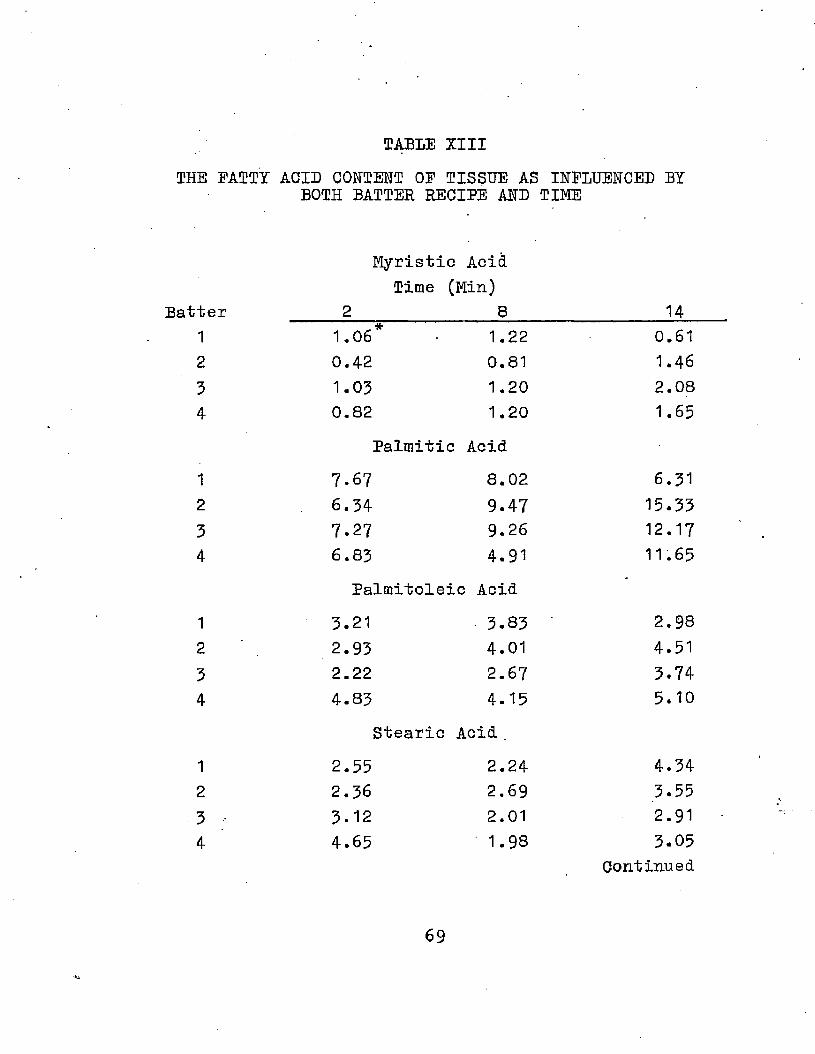
TABLE XIIITHE PATTY ACID CONTENT OP TISSUE AS INFLUENCED BY
BOTH BATTER RECIPE AND TIME
Myristic Acid Time (Min)
Batter _____ 2_______________8________________ 141 1.06* 1.22 0.612 0 .4 2 0.81 1.463 1-03 1.20 2.084 0 .8 2 1.20 1.65
Palmitic Acid
1 7.67 8.02 6.312 6.34 9.47 15.333 7.27 9.26 12.174 6.83 4.91 11.65
Palmitoleic Acid1 3.21 3.83 ' 2.982 2.93 4.01 4.513 2.22 2.67 3.744 4.83 4.15 5.10
Stearic Acid .
1 2.55 2.24 4.342 2.36 2.69 3.553 - 3-12 2.01 2.914 4.65 1.98 3.05
Continued
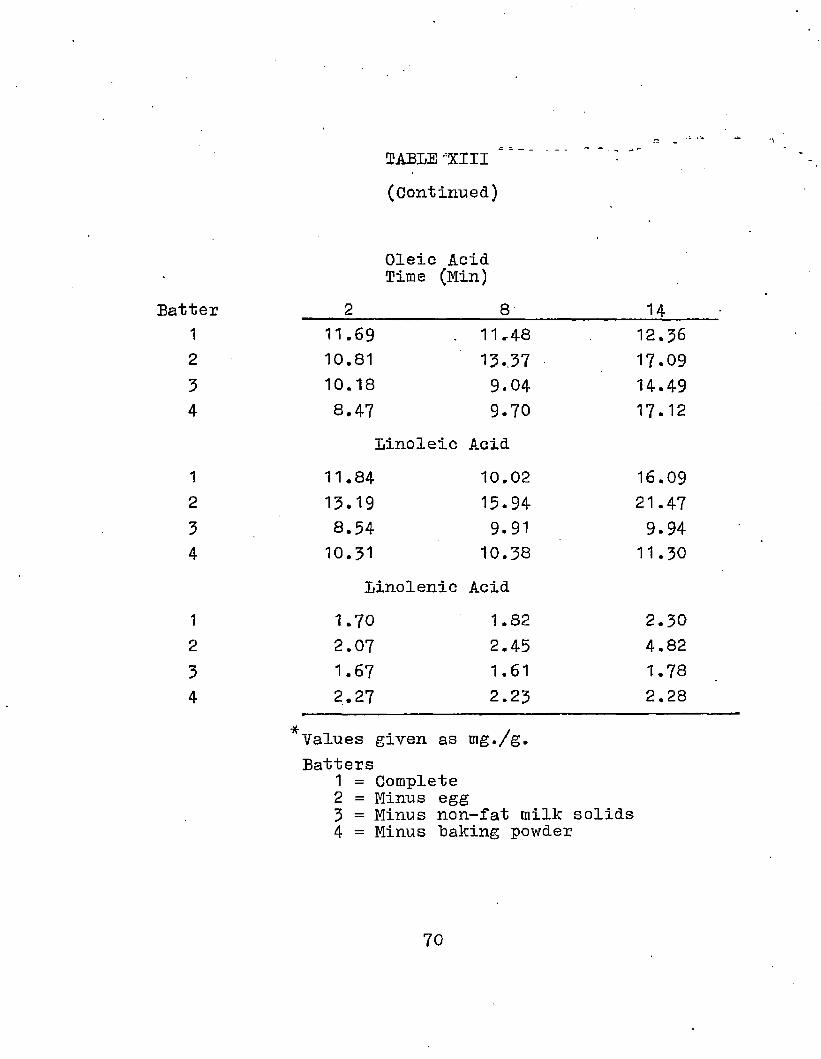
TABLE "XIII ‘(Continued)
Oleic Acid Time (Min)
Batter 2_______________ 8______________ 141 11.69 11.48 12.362 10.81 13..37 17.093 10.18 9.04 14.494 8.47 9.70 17.12
Linoleic Acid
1 11.84 10.02 16.092 13.19 15.94 21.473 8.54 9.91 9.944 10.31 10.38 11.30
Linolenic Acid1 1.70 1.82 2.302 2.07 2.45 4.823 1.67 1.61 1.784 2.27 2.23 2.28
*Values given as mg./g.Batters
1 = Complete2 = Minus egg3 = Minus non-fat milk solids4 = Minus "baking powder
70
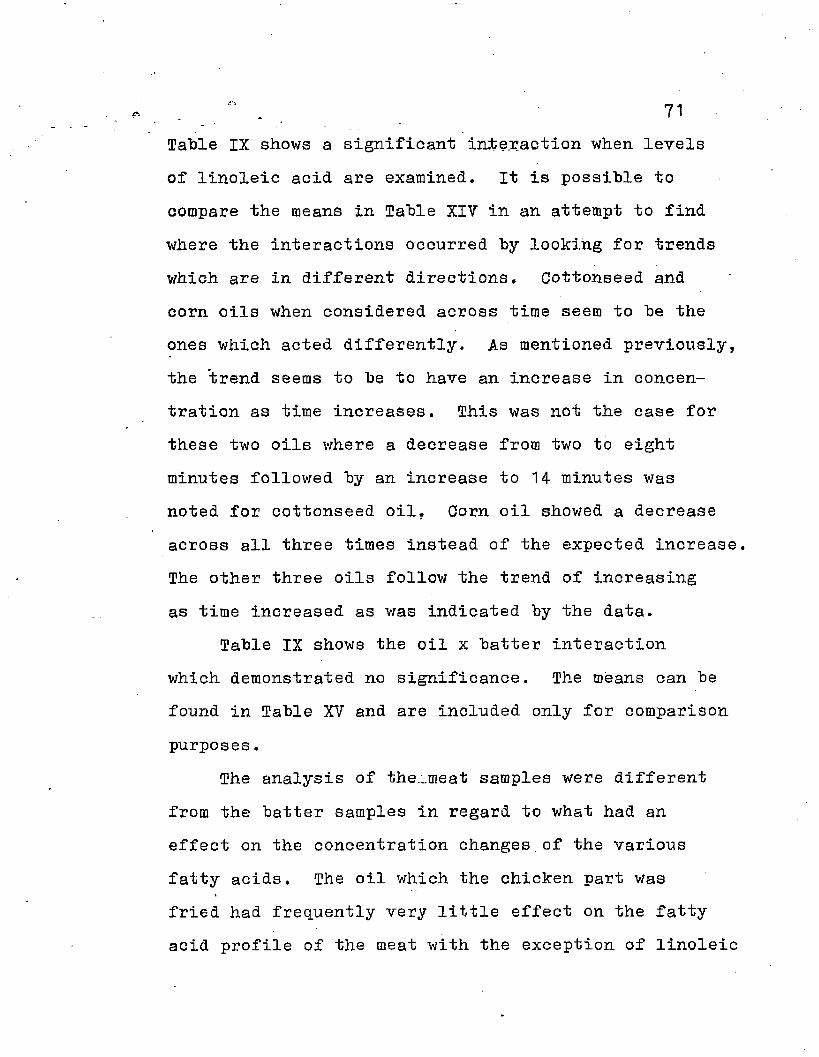
Table IX shows a significant interaction when levels of linoleic acid are examined. It is possible to compare the means in Table XIV in an attempt to find where the interactions occurred by looking for trendswhich are in different directions. Cottonseed andcorn oils when considered across time seem to be the ones which acted differently. As mentioned previously, the trend seems to be to have an increase in concentration as time increases. This was not the case for these two oils where a decrease from two to eightminutes followed by an increase to 14- minutes wasnoted for cottonseed oil. Corn oil showed a decrease across all three times instead of the expected increase. The other three oils follow the trend of increasing as time increased as was indicated by the data.
Table IX shows the oil x batter interaction which demonstrated no significance. The means can be found in Table XV and are included only for comparison
purposes.The analysis of the...meat samples were different
from the batter samples in regard to what had an effect on the concentration changes.of the various fatty acids. The oil which the chicken part was fried had frequently very little effect on the fatty acid profile of the meat with the exception of linoleic
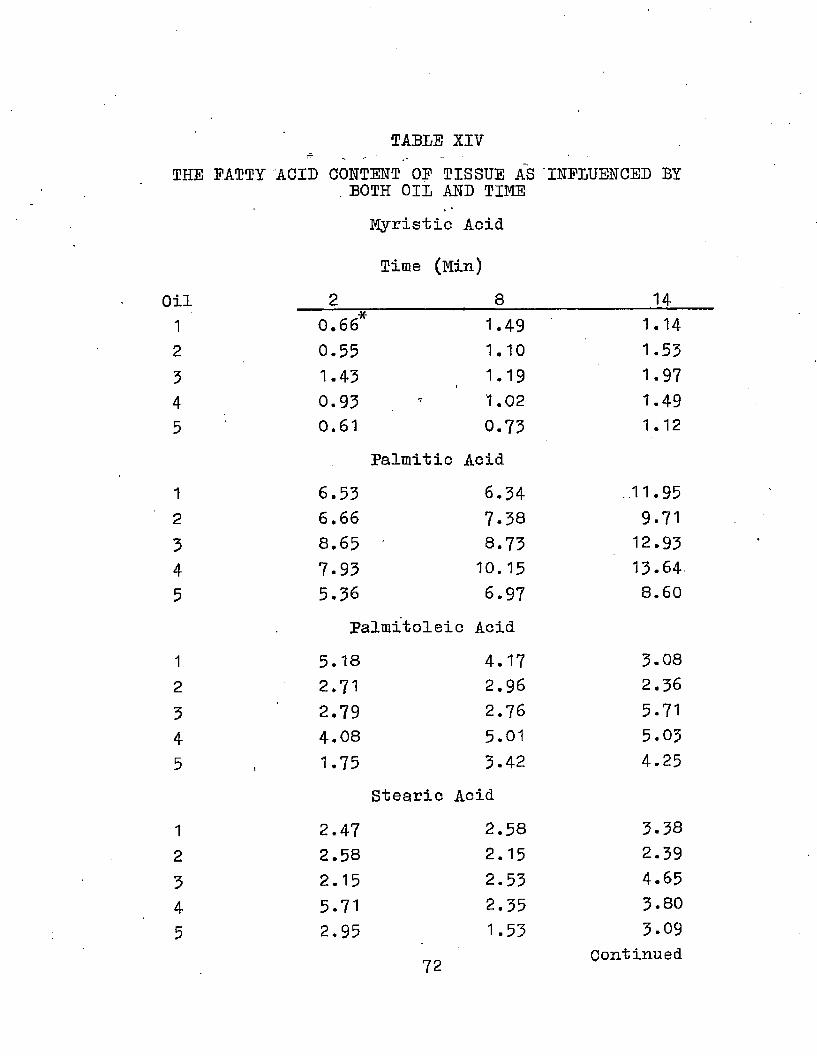
TABLE 217THE PATTY ACID CONTENT OF TISSUE AS INFLUENCED BY
. BOTH OIL AND TIMEMyristic Acid
Time (Min)
Oil 2________________ 8_______________ T£_1 0.66* 1.49 1.142 0.55 1.10 1.555 1.45 1.19 1.974 0.95 1 1.02 1.495 0.61 0.75 1.12
Palmitic Acid
1 6.55 6.54 .11.952 6.66 7.58 9.715 8.65 ' 8.75 12.954 7.95 10.15 15.645 5.56 6.97 8.60
Palmitoleic Acid
1 5.18 4.17 3.082 2.71 2.96 2.565 2.79 2.76 5.714 4.08 5.01 5.055 , 1.75 5.42 4.25
Stearic Acid
1 2.47 2.58 3.582 2.58 2.15 2.395 2.15 2.53 4.654 5.71 2.55 3.805 2.95 1.53 3-09
Continued1 ^
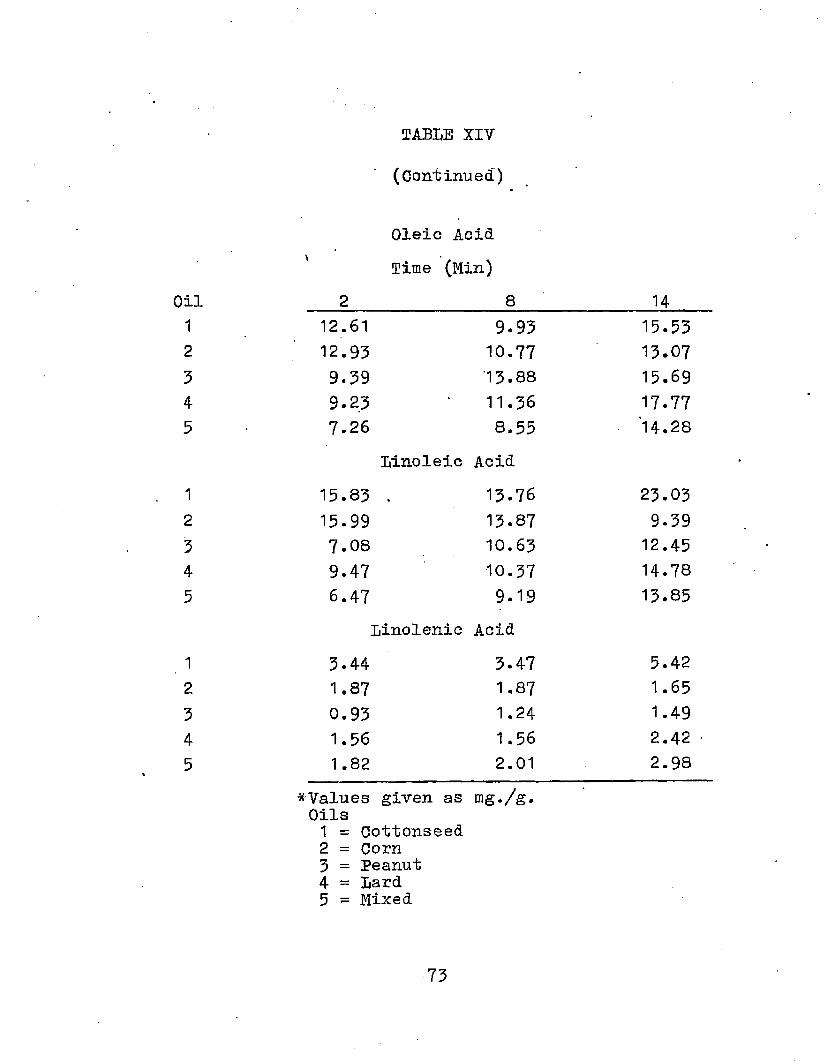
TABLE XIV
(Continued)
Oleic AcidTime (Min)
Oil 2 8 141 12.61 9.93 15.532 12.93 10.77 13.073 9.39 13.88 15.694 9.23 11.36 17.775 7.26 8.55 '14.28
Linoleic Acid1 15.83 . 13.76 23.032 15.99 13-87 9.393 7.08 10.63 12.454 9.47 10.37 14.785 6.47 9.19 13.85
Linolenic Acid1 3.44 3.47 5.422 1.87 1.87 1.653 0.93 1.24 1.494 1.56 1.56 2.42 ■5 1.82 2.01 2.98
* Values given as mg./g. Oils1 = Cottonseed2 = Corn3 = Peanut4 - Lard5 = Mixed
73
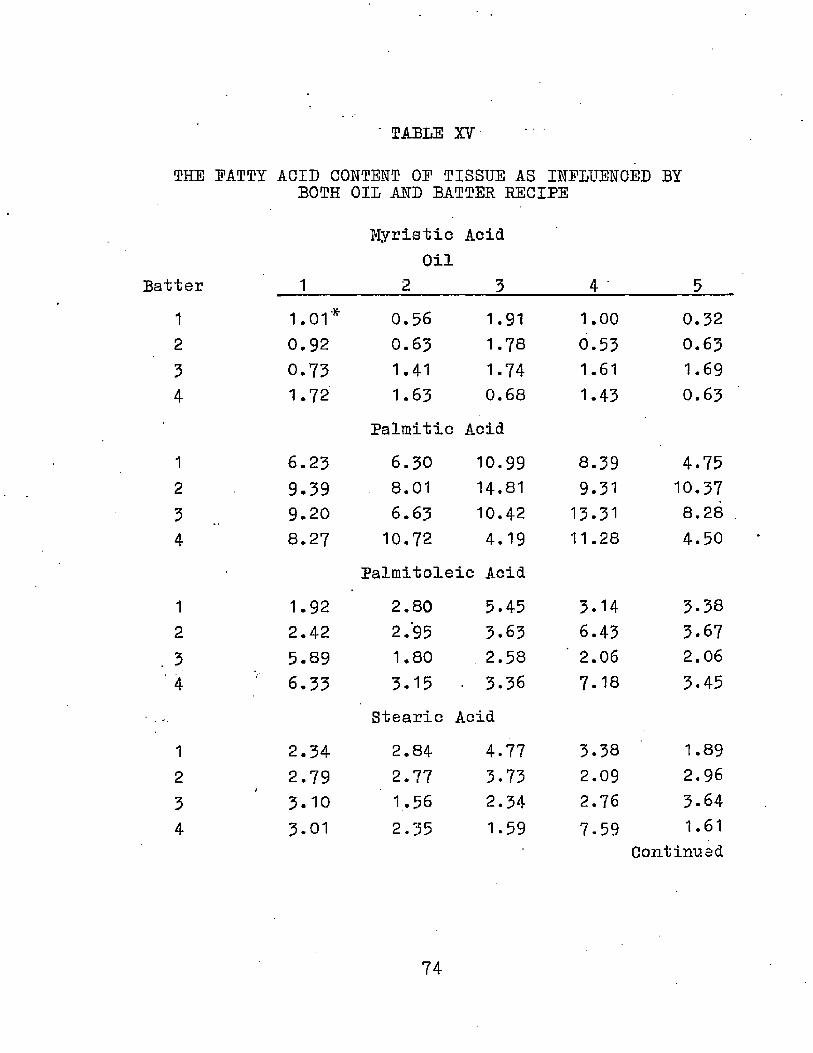
TABLE XV
THE FATTY ACID CONTENT OF TISSUE AS INFLUENCED BY BOTH OIL AND BATTER RECIPE
Myristic Acid Oil
Batter 1__________2________ 3________ 4- 51 1.01* 0.56 1.91 1.00 0.322 0.92 0.63 1.78 0.53 0.633 0.73 1.41 1.74 1.61 1.694 1.72 1.63
Palmitic0.68
Acid1.43 0.63
1 6.23 6.30 10.99 8.39 4.752 9.39 8.01 14.81 9.31 10.373 9.20 6.63 10.42 13.31 8.284 8.27 10.72 4.19
Palmitoleic Acid11.28 4.50
1 1.92 2.80 5.45 3.14 3-382 2.42 2.95 3.63 6.43 3.673 5.89 1.80 2.58 ' 2.06 2.064 6.33 3.15
Stearic■ 3.36 Acid
7.18 3.45
1 2.34 2.84 4.77 3.38 1.892 2.79 2.77 3.73 2.09 2.963 3.10 1.56 2.34 2.76 3-644 3.01 2.35 1.59 7.59 1.61
Continued
74
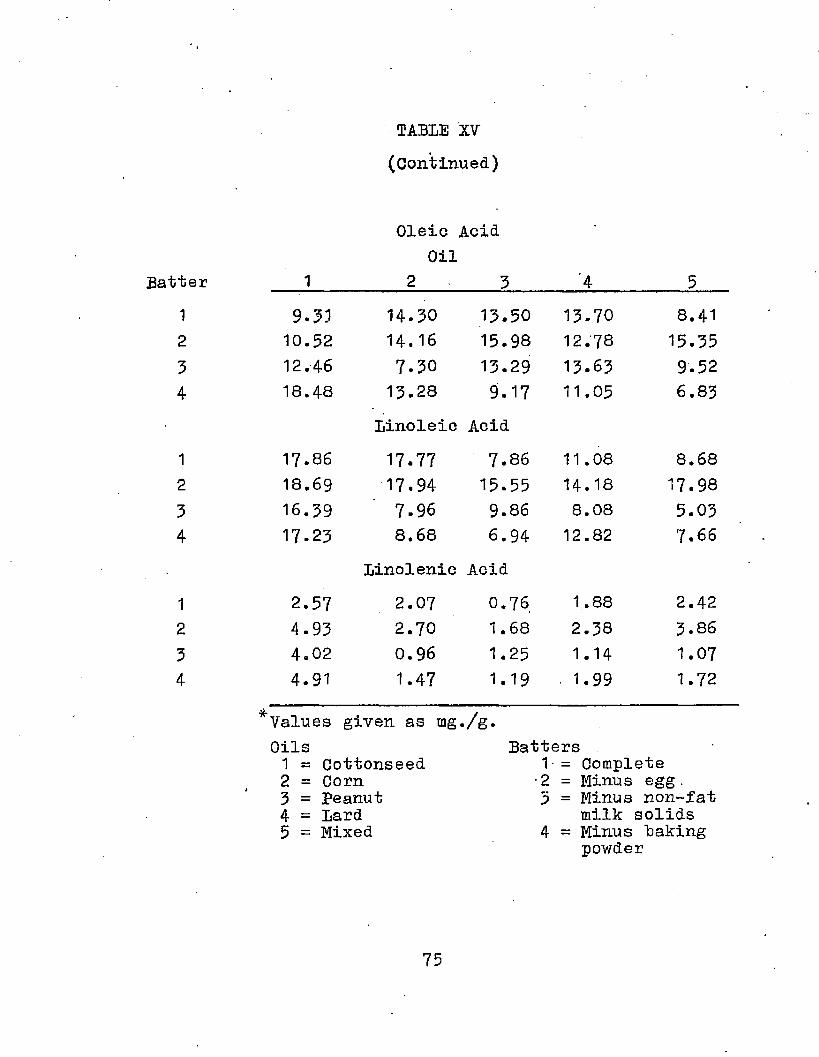
TABLE XV(Continued)
iter 1
Oleic . Oil
2
Acid
3 4 51 9.3-1 14.30 13.50 13.70 8.412 10.52 14.16 15.98 12.78 15.353 12.-46 7.30 13.29 13.63 9.524 18.48 13.28 9.17 11.05 6.83
Linoleic Acid
1 17.86 17.77 7.86 11.08 8.682 18.69 17.94 15.55 14.18 17.983 16.39 7.96 9.86 8.08 5.034 17-23 8.68 6.94 12.82 7.66
Linolenic Acid
1 2.57 2.07 0.76 1.88 2.422 4.93 2.70 1.68 2.38 3.863 4.02 0.96 1.25 1.14 1.074 4.91 1.47 1.19 • 1.99 1.72
*Values given as mg ./g.Oils Batters1 = Cottonseed 1 = Complete2 = Corn -2 = Minus egg.3 = peanut 3 = Minus non-fat4 = Lard milk solids5 = Mixed 4 = Minus Baking
powder
75
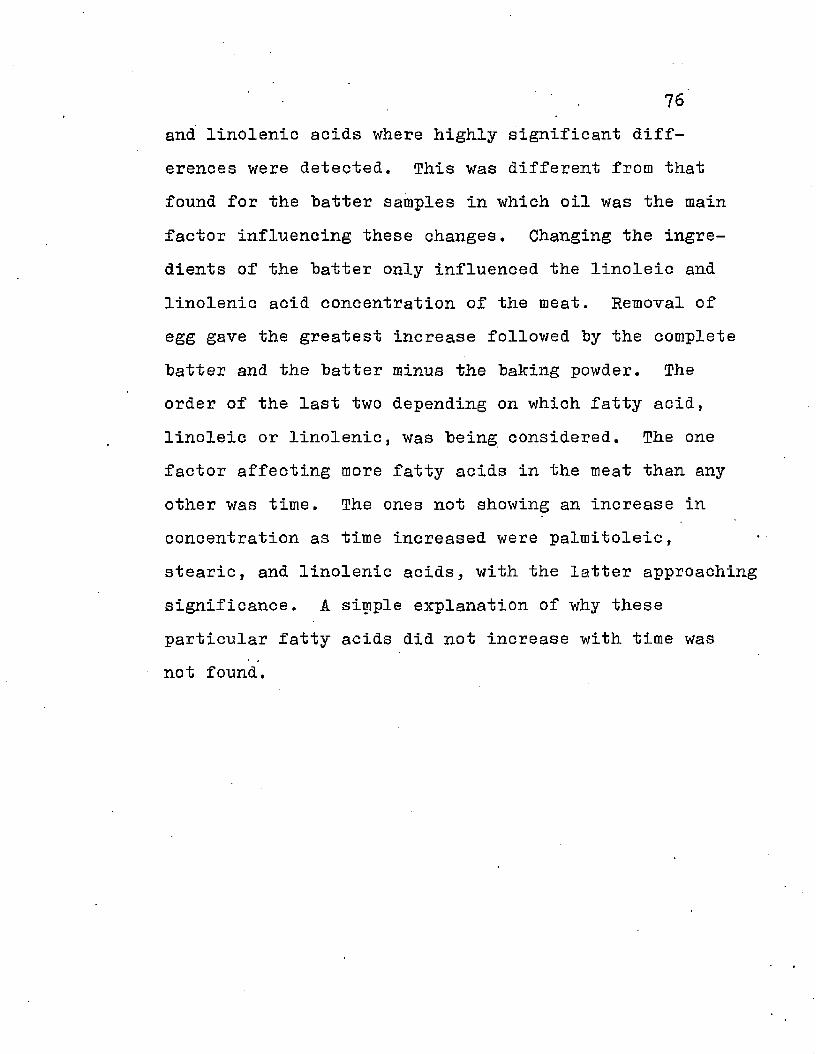
76and linolenic acids where highly significant differences were detected. This was different from that found for the "batter samples in which oil was the main factor influencing these changes. Changing the ingredients of the "batter only influenced the linoleic and
linolenic acid concentration of the meat. Removal of egg gave the greatest increase followed "by the complete hatter and the batter minus the baking powder. The order of the last two depending on which fatty acid, linoleic or linolenic, was being considered. The one factor affecting more fatty acids in the meat than any other was time. The ones not showing an increase in concentration as time increased were palmitoleic, stearic, and linolenic acids, with the latter approaching significance. A simple explanation of why these particular fatty acids did not increase with time was not found.
SUMMARY
The possible changed nutritional value of fats and oils heated to high temperature has been a concern for several years. With deep fat fried foods assuming a place of importance in the diets of pany individuals, the changes which occur in the product as a result of frying in various fats and oils are very important factors which deserve consideration.
This experiment was conducted to determine the*
effects of various cooking oils, batter recipes, and times of cooking on the fatty acid composition of the
batter and meat product during frying. In addition, it was desirable to determine whether the composition of the oil was changed.
The oils penetrated into and through the batter into the tissue sample. The fatty acids in the batter and tissue were found to be influenced by the cooking oil used in both cases. When the composition of the cooking oils was considered along with the large quantities of a oil used it was easy to understand why they play such an important role in the fatty acid composition of the batter. The contribution of the individual o.il varies to some degree and was not always
77
dependent on the oil with the highest percentage of a fatty acid contributing more of this acid than another oil. The cooking oil had very little affect on the fatty acid profile of the meat, with the exception of linoleic and linolenic acids where significant differences were detected. This was different from the batter samples where the oil was found to be the main factor influencing these changes. The factor having the greatest influence on the tissue samples was time of cooking. The only fatty acids not showing an increase in concentration as time increased were palmitoleic, stearic, and linolenic acids, with the latter approaching significance. A significant time effect was found in the batter samples when oleic and linoleic acids are considered. Changing the ingredients of the batter only influenced two fatty acids, linoleic and linolenic, to any extent and these were both found in the tissue samples. Batter recipe was founjl to be of importance when possible changes in the cooking medium were found to result when the recipe was changed.
CONCLUSIONS
The results obtained from this study indicate the following conclusions appear warranted.
1. Cooking oils are absorbed and/or adsorbed into and through the batter and into the tissue during deep fat frying as evidenced by a change in fatty acid composition.
2. The cooking oils determined the fatty acid
profile in the batter samples.3. .The tissue content of both linoleic and
linolenic acids were found to be affected by the cooking oil.
4. lard was significantly different from the other oils in the amounts of the various fatty acids found in the batter. Cottonseed and mixed oils contributed more saturated fatty acids than did corn and peanut oils. Corn oil contributed less stearic and oleic acids than peanut but more linoleic and linolenic acids. Corn oil contributed less saturates than any of the other five oils followed by peanut and
cottonseed oils.5. Oleic and linoleic acids increased in the
batter as cooking time increased. The greatest
79
80increase was found between the eight and 14 minute periods.
6. The increase of cooking time resulted in an increased content of myristic, palmitic, oleic, and linoleic acids in the tissue with the exception of myristic acid, the eight to 14 minute time period showed the greatest increase.
7. The batter recipe was found to affect only linoleic and linolenic acid composition of the tissue and was thought to have an effect upon the cooking oil depending upon what was excluded.
8. The removal of egg from the batter resulted in an increase in the tissue content of linoleic and linolenic acids.
REFERENCES
Bailey, A. E., 1951. Industrial oil and fat products. 2nd edition. Interscience PublishersNew York.
Bennion, M. and E. Hanning, 1956a. Becorapostion of lard in the frying of French-fried potatoes and of fritter type hatters. J. Home Econ. 48:184- 188.
Bennion, M. and F. Hanning, 1956h. Effect of different fats and oils and their modifications on changes during frying. Food lech. 10:229-232.
Brown, J. B., 1959. Changes in nutritive value of food fats during processing and cooking. Nutrition Revs. 17:321-325.
Carlin, G. 1., R. P. Hopper and B. N. Rockwood, 1954. Some factors affecting the decomposition of frying fats. Food Tech. 8:161-165.
Carlin, G. 1. and E. Lannerud, 1941. Rancidity problems in baked and fried foods. Oil and Soap. 18:60-62.
Chang, I. C. L. and B. M. Watts, 1952. The fatty acid content of meat and poultry before and after cooking. J. Amer. Oil Chemists Soc. 29: 334-338.
Chung, R. A., J. A. McKay and C. I. Ramey, 1966.Fatty acid changes in beef, pork, and fish after deep fat frying in different oils. Food Technol. 20:123-125.
Fisher, D. E., 1949. Fat absorption and symmetry in cake doughnuts. Bakers Weekly, 144:88.
Fleischman, A. I., A. Florin, J. Fitzgerald, A. B. Caldwell, and G. Eastv/ood, 1963. Studies on cooking fats and oils. J. Amer. Dietetic Assn. 42:394-398.
81
82Frazer, 0. B. E., 1964. Chemical and nutritional
aspects of oxidized and heated fats. Chem. and Ind. 1531-1543.
Goodman, A. H. and Z. Block, 1952. Problems encountered in the commercial utilization of frying fats. J. Oil Chem. Soc. 29:616-619.
Keane, K. W., G. A. Jacobson and C. H. Krieger, 1959. Biological and chemical studies on commercial frying oils. J. Rutr. 68:57-74.
Kilgore, 1. T. and ¥. D. Luker, 1964. Patty acid components of fried foods and fats used for frying. J. Amer. Oil Chem. Soc. 41:496-500.
King, P. B., R. Boughlin, R. ¥. Rieraenshneider andR. R. Ellis, 1936. The relative value of various lards and other fats for the deep fat frying of potato chips. J. Agr. Res. 53:369-381.
Kritchevsky, D.,J. P. Berry and D. A. Turner, 1961.Cholesterol vehicle in experimental atherosclerosis. III. Effects of absence or presence of fatty vehicle. J. Amer. Oil Chem. Soc. 38:74-76.
lantz, C. ¥. and G. T. Carlin, 1938. Stability of fats used for deep fat frying. Oil and Soap. 15:38-41.
Lowe, B., P. M. Relson and J. H. Buchanan, 1940. The physical and chemical characteristics of lard and other fats in relation to their culinary value.III. For frying purposes. Iowa Agricultural Expt. Sta., Ames Iowa, Research Bulletin. 279: 876-926.
'Lowe, B., S. Prodhon and J. Kastelic, 1958. The free fatty acid content and smoke point of some fats.J. Home Econ. 50:778.
McKee, M. C., 1918.' Pat absorption in frying doughnuts. J. Home Econ. 10:T8~20.
Melnick, D., 1957. Absence of thermal polymers inpotato chip frying oils. J. Amer. Oil Chem. Soc. 34:351-356.
83Melnick, D.,' 1957. Nutritional quality of frying fats
in commercial use. J. Amer. Oil Chem. Soc. 34: 578-582.
Melnick, D., F. H. Luckmann and C. M. Gooding, 1958. Composition and control of potato chip frying oils in continuing commercial use. J. Amer. Oil Chem. Soc. 35:271-276.
.Perkins, E. G., 1960. Nutritional and chemical changes occuring in heated fats. A review.Food Technol. 14:508-514.
Perkins, E. G. and F. A. Kummerow, 1959. The isolation and characterization of the polymers formed during the thermal oxidation of corn oil. J. Amer. Oil Chem. Soc. 36:371-374.
Perkins, E. G. and E. A. Van Akkeren, 1965. Heated fats.IV. Chemical changes in fats subjected to deep fat frying process: Cottonseed oil. J. Amer. Oil Chem. Soc. 42:782-785.
Poling, C. E., W. D. Warner, P. E. Mone and E. E. Rice,1962. The influence of temperature, heating time, ■ and aeration upon the nutritive value of fats.J. Amer. Oil Chem. Soc. 39:315-320.
Rice, E. E., P. E. Mone and C. E. Poling, 1957a. Effect of commercial frying operations on nutritive value of fats. Fed. Proc. 16:398.
Robinson, H. E., H. C. Block and H. S. Mitchell, 1940. Studies relating to the foaming tendencies in edible oils and fats. Oil and Soap. 17:208-210.
Rust, M. E. and D. L. Harrison, 1960. The effect of method of care on the frying life of fat. Food Technol. 14:605-609.
Smith, A. A. and G. Vail, 1961. Yield and compostion of broiler fryers fried by three methods. J.Amer. Dietetic Assn. 43:541-544.
Steel, R. G. D. and J. H. Torrie, 1960. Principles and Procedures of Statistics. McGraw-Hill Book Co.,Inc., New York.
84Teekell, R. A., 1968. Personal Communication.
Poultry Science Department, Louisiana State University.
Thiessen, E. J., 1939. Various fats, used in deep fat frying of dough, mixtures at high altitudes. Pood Res. 4:135-144.
Thompson, J. A., M. M. Paulose, B. R. Reddy, R. G-.Krishnamurthy and S. S. Chang, 1967. A limited survey of fats and oils commercially used for deep fat frying. Pood Technol. 21:87-89.
Wishner, L. A. and M. Keeney, 1965. Comparative study of monocarbonyl compounds formed during deep frying in different fats. J. Amer. Oil Chem.Soc. 42:776-778.
Woodruff, S. and K. Blunt, 1919. Changes in fatsabsorbed by fried foods. J. Home Econ. 11:440- 452.
Weir, E. C., A. Slover, C. Pohl and P. D. Wilson,1962. Effect of cooking procedures on the composition and organoleptic properties. Pood Technol. 5:133.

AUTOBIOGRAPHY
I was born December 6, 1939, in Monroe, Louisiana, the son of James L. and Alodi B. Heath. I attended
elementary and high school in Calhoun, Louisiana, and was graduated in May, 195B.
I entered Louisiana State University in September, 1958, and graduated with a Bachelor of Science degree and was commissioned an officer in the United States
Army in January, 1963.After completion of my military service, I was
admitted to the Graduate School of Louisiana State University in June, 1965, and received a Masters of Science degree in the Poultry Science Department.Since that time I have pursued a curriculum leading toward a Doctor of Philosophy degree in Poultry Science with a major in Market Products and a minor in Biochemistry.
I am married to the former Mary Alice Noble of Baton Rouge, Louisiana.
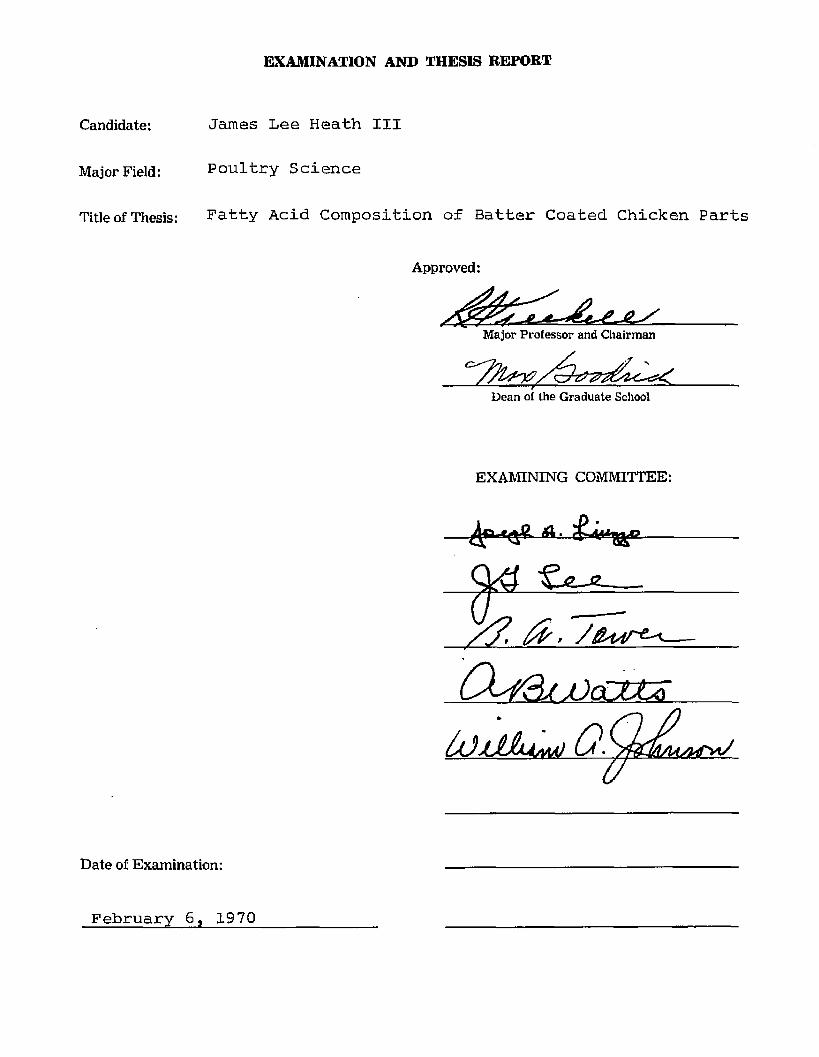
Candidate:
Major Field:
Title of Thesis:
EXAMINATION AND THESIS REPORT
James Lee Heath III
Poultry Science
Fatty Acid Composition of Batter Coated Chicken Parts
Approved:
Major Professor and Chairman
r~Dean of the Graduate School
EXAMINING COMMITTEE:
jOoLLL^
Date of Examination:
February 6, 1970