Embed Size (px)
Citation preview
International Journal of Fatigue xxx (2012) xxx–xxx
Contents lists available at SciVerse ScienceDirect
International Journal of Fatigue
journal homepage: www.elsevier .com/locate / i j fa t igue
Fatigue strength improvement factors for high strength steel welded jointstreated by high frequency mechanical impact
Halid Can Yildirim ⇑, Gary B. MarquisDepartment of Applied Mechanics, Aalto University, P.O. Box 14300, FI-00076 Aalto, Finland
a r t i c l e i n f o
Article history:Received 22 December 2011Received in revised form 3 May 2012Accepted 7 May 2012Available online xxxx
Keywords:High frequency mechanical impact (HFMI)Weld toe improvementFatigue strength improvementHigh strength steel
0142-1123/$ - see front matter � 2012 Elsevier Ltd. Ahttp://dx.doi.org/10.1016/j.ijfatigue.2012.05.002
⇑ Corresponding author. Tel.: +358 445 666 556.E-mail address: [email protected] (H.C. Yildiri
Please cite this article in press as: Yildirim HC,frequency mechanical impact. Int J Fatigue (201
a b s t r a c t
Numerous studies have observed that the fatigue strength of improved welds increases with materialyield strength. This paper provides a comprehensive evaluation of published data for high frequencymechanical impact treated welds. In total, 228 experimental results for three weld geometries subjectto R = 0.1 axial loading have been reviewed. A design recommendation including one fatigue classincrease in strength (about 12.5%) for every 200 MPa increase in static yield strength is proposed andare shown to be conservative with respect to all available data. Special cautions are given for high R-ratioor variable amplitude fatigue and potential alternate failure locations.
� 2012 Elsevier Ltd. All rights reserved.
1. Introduction
In 2007 the International Institute of Welding (IIW) Commis-sion XIII on Fatigue of Welded Components and Structures ap-proved the best practice guideline concerning post-weldtreatment methods for steel and aluminum structures [1]. Thisguideline covers four commonly applied post weld treatmentmethods, burr-grinding, TIG re-melting (i.e. TIG dressing), hammerpeening, and needle peening. Burr-grinding and TIG re-melting aregenerally classified as geometry improvement techniques forwhich the primary aim is eliminate weld toe flaws and to reducethe local stress concentration by achieving a smooth transition be-tween the plate and the weld face. Hammer peening and needlepeening are classified as residual stress modification techniqueswhich eliminate the high tensile residual stress in the weld toe re-gion and induce compressive residual stresses at the weld toe.These methods also result in a reduced stress concentration atthe weld toe. The guideline also gives practical information onhow to implement the four improvement technologies includinggood work practices, training, safety, and quality assurance.
The IIW guideline for post-weld improvement applies to platethickness 6–50 mm for steel and 4–20 mm for aluminum. Theimprovement methods are only relevant to fatigue failures initiat-ing from the weld toe. Thus, in some situations alternate failuremodes must also be considered. For welds improved by burr grind-ing or TIG re-melting or for hammer peening or needle peening oflow strength steel (fy < 355 MPa), the fatigue strength benefit
ll rights reserved.
m).
Marquis GB. Fatigue strength i2), http://dx.doi.org/10.1016/j.
corresponds to an increase in allowable stress range by a factorof 1.3, corresponding to a factor of 2.2 on life (for SN slopem = 3). However, the maximum class which can be claimed is theclosest category below the FAT value obtained when the as-weldedFAT value is multiplied by 1.3. For ease of computation, this corre-sponds to a two (2) fatigue class increase based on the IIW FatigueDesign Recommendations [2].
For higher strength steel (fy > 355 MPa) welds improved byhammer peening or needle peening, the fatigue strength benefitconsists of an upgrade by a factor of 1.5 applied to the stress range.For ease of computation, this corresponds to a three (3) fatigue classincrease. For example, when a weld detail which, in the as-weldedcondition, would be classified as FAT 63 is hammer peened, the newFAT value is FAT 90. The highest detail class for which an improve-ment can be claimed is FAT 90, and the highest SN curve that can beclaimed following improvement is FAT 125. The slopes of the SNcurves follow the IIW Fatigue Design Recommendations [2].
An important practical limitation on the use of peeningimprovement techniques that rely on the presence of compressiveresidual stresses is that the fatigue lives are strongly dependent onthe applied mean stress. In particular, the degree of improvementdecreases as the maximum applied stress approaches tensile yield.Thus, in general, the techniques are not suitable for structuresoperating at applied stress ratios R > 0.5 or maximum appliedstresses above around 80% yield. The guideline gives special limita-tions for high stress ratio situations. Even occasional application ofhigh stresses in tension or compression as part of a variable ampli-tude fatigue history, can also be detrimental in terms of relaxingthe compressive residual stress. Systematic guidelines are not yetdeveloped. Special limitations also exist for improved large-scale
mprovement factors for high strength steel welded joints treated by highijfatigue.2012.05.002
Nomenclature
fy yield strengthfy,o reference yield strengthFAT IIW fatigue class, i.e., the nominal stress range in MPa
corresponding to 97.7% survival probability at 2 �106 cycles to failure (a discrete variable with 10–15%increase in stress between steps)
ko strength magnification factor for high frequencymechanical impact treatment for steel fy = fy,o
kR strength magnification adjustment considering R-ratioky strength magnification adjustment considering yield
strengthm slope of the SN lineNf cycles to failureDS nominal stress rangeDSc yield strength corrected nominal stress rangeDS� fictitious nominal stress range for specimen
i at 2 � 106 cycles to failure
XN improvement factor in life for HFMI treated welds at DSequal to the FAT class of the as-welded joint: Nf = XN �2 � 106
a strength correction coefficient for yield after highfrequency mechanical impact
c strength correction coefficient for highfrequency mechanical impact
rN standard deviation in log (Nf)
SubscriptsA in the as-welded conditionK characteristic value corresponding to 97.7%
survival probability at 2 � 106 cycles to failure(a continuous variable)
H following high frequency mechanical peeningi value for specimen im mean value corresponding to 50% survival probability at
2 � 106 cycles to failure
2 H.C. Yildirim, G.B. Marquis / International Journal of Fatigue xxx (2012) xxx–xxx
structures. It is recommended that for steel structures with platethickness greater than 20 mm the benefit for hammer peening isassumed to be the same as for burr grinding and TIG dressing. Burrgrinding and TIG re-melting can be applied only to conditionswhere DS < 2fy.
The original technology for high frequency mechanical impact(HFMI) was developed at the Northern Scientific and TechnologicalFoundation in Russia in association with Paton Welding Institute inthe Ukraine [3]. The past decade has seen steady increase in thenumber of HFMI peening equipment manufacturers and serviceproviders. Numerous power sources are employed, e.g., ultrasonicpiezoelectric elements, ultrasonic magnetostrictive elements orcompressed air. In all cases, however, the working principal isidentical: cylindrical indenters are accelerated against a compo-nent or structure with high frequency. The impacted material ishighly plastically deformed causing changes in the material micro-structure, the local geometry and the residual stress state in the re-gion of impact. In comparison to hammer peening, the operation ismore user-friendly and the spacing between alternate impacts onthe work piece is very small resulting in a finer surface finish.The indenters are high strength steel cylinders and manufacturershave customized the effectiveness of their own tools by using ind-enters with different diameters, tip geometries or multiple inden-ter configurations. Devices are known by the names: ultrasonicimpact treatment (UIT) [4], ultrasonic peening (UP) [5], ultrasonicpeening treatment (UPT) [6,7], high frequency impact treatment(HiFiT) [8], pneumatic impact treatment (PIT) [9] and ultrasonicneedle peening (UNP) [10,11].
Yildirim and Marquis [12] have published a comprehensive re-view of experimental data on the fatigue strength of welded jointsimproved by HFMI peening methods. Most of the nearly 400 re-ported tests were performed using constant amplitude R = 0.1 axialtension fatigue, but some data for other R-ratios, variable ampli-tude testing and bending fatigue are also reported. Material yieldstrength varied from 260 MPa to 960 MPa. The extracted fatiguetest data was statistically analyzed in order to estimate the bestslope for the SN line and to investigate the degree of improvementfor each specimen type. They found that an SN slope of m = 5 fitsboth the available HFMI treated fatigue data and the existing datafor hammer peened welds. Thus, all of the following conclusionsare based on an assumed SN slope of m = 5 and fatigue strengthimprovements are defined at N = 2 � 106.
Please cite this article in press as: Yildirim HC, Marquis GB. Fatigue strength ifrequency mechanical impact. Int J Fatigue (2012), http://dx.doi.org/10.1016/j.
Numerous researchers have observed that the degree ofimprovement for post-weld treated components increases withmaterial strength, see, e.g., Maddox [13], Bignonnet [14], Haagen-sen [15], Weich [16] and Yildirim and Marquis [12]. However,the IIW best practice guideline concerning post-weld treatmentmethods for steel and aluminum structures [1] makes only a singledivision between low strength and high strength steel atfy = 355 MPa. This single division was primarily due to the lack ofsystematic experimental data for higher strength steels. In orderto stimulate research on higher strength steels, IIW CommissionXIII initiated a round robin exercise in 2003. Results of this exercisein combination with numerous other studies have now been com-pleted and conclusions concerning the relationship between yieldstrength and fatigue strength can be made. The current study spe-cifically considers only welds improved using HFMI treatmenttested at constant amplitude R = 0.1. No attempt is made to makedistinctions between the previously mentioned technologies.Observations on high stress ratio fatigue or variable amplitude fa-tigue made in the IIW guideline should still be considered as valid.
As a result of several research projects in Germany, Weich [16]has proposed a design method for HFMI treated welds. In this pro-posal, the SN curve slope should be m = 5. The characteristic fatiguestrength following HFMI treatment is
DSH ¼ DSA � ðko � ky � kRÞ ð1Þ
where the strength magnification factors are given by the followingequation:
ko ¼ c ð2aÞ
ky ¼ 1þ að1� fy;0=fyÞ for f y 6 690 MPa ð2bÞ
kR ¼ 1:0 for R < 0:1 ð2cÞ
kR ¼ 1:075� 0:75R for 0:1 6 R 6 0:5 ð2dÞValues fy,o = 355 MPa, c = 1.6 and a = 0.6 were proposed.
2. Methods
2.1. Published data
In a review of published experimental data on the fatiguestrength of welded joints improved by HFMI peening methods,
mprovement factors for high strength steel welded joints treated by highijfatigue.2012.05.002
Table 2Experimental R = 0.1 constant amplitude axial fatigue data for HFMI treated cruciformwelds.
Ref. Steeltype
fy
(MPa)Treatmentmethod
Platethickness(mm)
Number ofspecimens in series
[25] S355J2 398a UIT 12 7[25] S355J2 398a UIT 12 4[25] S460ML 504a UIT 12 5[25] S460ML 504a UIT 12 5[39] S355J2 477a PIT 12 8[39] S690QL 781a PIT 12 7[27] AH36 392a UIT 20 3
a measured fy.
Table 1Experimental R = 0.1 constant amplitude axial fatigue data for HFMI treatedlongitudinal welds.
Ref. Steeltype
fy
(MPa)Treatmentmethod
Platethickness(mm)
Number ofspecimens inseries
[32] S700 700b UP/UIT 8 16[26] S690QL 786a UIT 16 16[26] S690QL 786a HiFIT 16 15[33] 16Mn 390b UP/UPT 8 6[34] S350 398a UP/UPT 12 5[34] S700 780a UP/UPT 12 7[34] S900 900a TIG + UP 12 10[35] SS800 700a UP/UPT 8 8[35] 16Mn 390a UP/UPT 8 6[35] Q235B 267a UP/UPT 8 7[36,37] S355 355b UIT 8 10[38] S960 960a PIT 5 11
a measured fy.b nominal fy.
Table 3Experimental R = 0.1 constant amplitude axial fatigue data for HFMI treated buttwelds.
Ref. Steeltype
fy
(MPa)Treatmentmethod
Platethickness(mm)
Number ofspecimens in series
[26] S355J2 422a UIT 16 14[26] S355J2 422a HiFIT 16 18[26] S690QL 786a UIT 16 18[26] S690QL 786a HiFIT 16 12[40] E690 763a UP 9.5 8[38] S960 960b PIT 5 7
a measured fy.b nominal fy.
Table 4FAT values for welded joints evaluated in this study.
Specimentype
FAT(MPa)[2]
DSm,A
(MPa)rN
[21]b
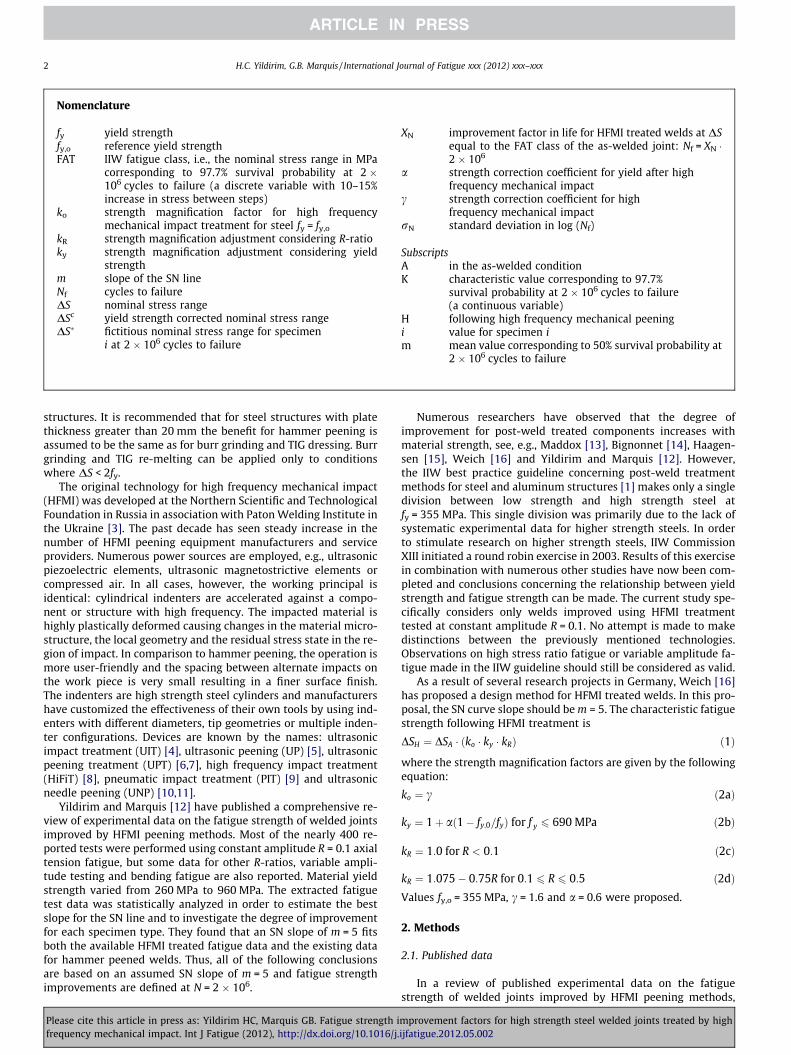
Longitudinalattachment
71a 97 0.206
Cruciform joint 80 110 0.206
Butt joint 90 123 0.206
a Note that FAT 71 is for 50 < l < 150 mm (l = attachment length). Larger orsmaller FAT values are seen as l changes. For simplicity FAT 71 was assumed for alllongitudinal attachments.
b Typical values used by the International Institute of Welding.
H.C. Yildirim, G.B. Marquis / International Journal of Fatigue xxx (2012) xxx–xxx 3
Yildirim and Marquis [12] identified 19 publications containing fa-tigue data for welded steel joints improved by one of the HFMImethods mentioned in the introduction. Some of these studiescontained multiple materials, improvement techniques, stress con-ditions or specimen types. Thus, a total of 45 data sets for fourspecimen types were reviewed.
In the current study, only data for axially loaded test specimensloaded at R = 0.1 loading were analyzed. It has been observed that avariety of alternate failure modes are observed for HFMI treatedwelds depending on the type of fatigue loading [17]. Whereverpossible, failure modes other than at the weld toe and run-outshave been excluded. The yield stress of steel grades varies from260 to 969 MPa, and specimen thickness varies from 5 to 30 mm.The 228 data points from 25 data sets analyzed in the currentstudy are summarized in Tables 1–3. These tables show the speci-men type, thickness, fy, HFMI method, and number of test speci-mens for each data set. In cases where fy was not specificallyreported, values were taken from published datasheets [18–20].The FAT class of each specimen type is taken from the IIW Recom-mendation [2] and DSm are typical values from IIW recommenda-tions [21]. These are presented in Table 4.
2.2. Data assessment
Several different hypotheses were investigated as a mean ofestablishing the empirical relationship between yield strengthand fatigue strength for HFMI treated welds. Even though Eq.(2b) was originally limited to fy 6 690 MPa, the form of the equa-tion was evaluated also to include yield strengths up to 960 MPa.
Please cite this article in press as: Yildirim HC, Marquis GB. Fatigue strength ifrequency mechanical impact. Int J Fatigue (2012), http://dx.doi.org/10.1016/j.
Values of c and a were systematically changed to determine whichvalues would result in minimum rN for the data. Additionally, astrength magnification factor which increases linearly with yieldstrength, Eq. (3), was used with a product form, Eq. (4) and anexponential form Eq. (5). When assessing the data, it was assumedthat (1) the slope of SN curves for HFMI improved welds was m = 5,(2) that fatigue strength values from Table 4 are valid and (3) thebest fit for the data resulted in minimum rN. In the current studyonly data for R = 0.1 was evaluated and no statement can yet bemade concerning stress ratio, Eq. (2c).
ky ¼ aðfy � fy;oÞ=fy;o ð3Þ
DSH ¼ DSA � ko � ð1þ kyÞ ð4Þ
DSH ¼ DSA � ðkoÞ1=ð1�kyÞ ð5Þ
While all of the proposed equations resulted in a reduction in rN
with respect to the data with no yield strength compensation, the
mprovement factors for high strength steel welded joints treated by highijfatigue.2012.05.002
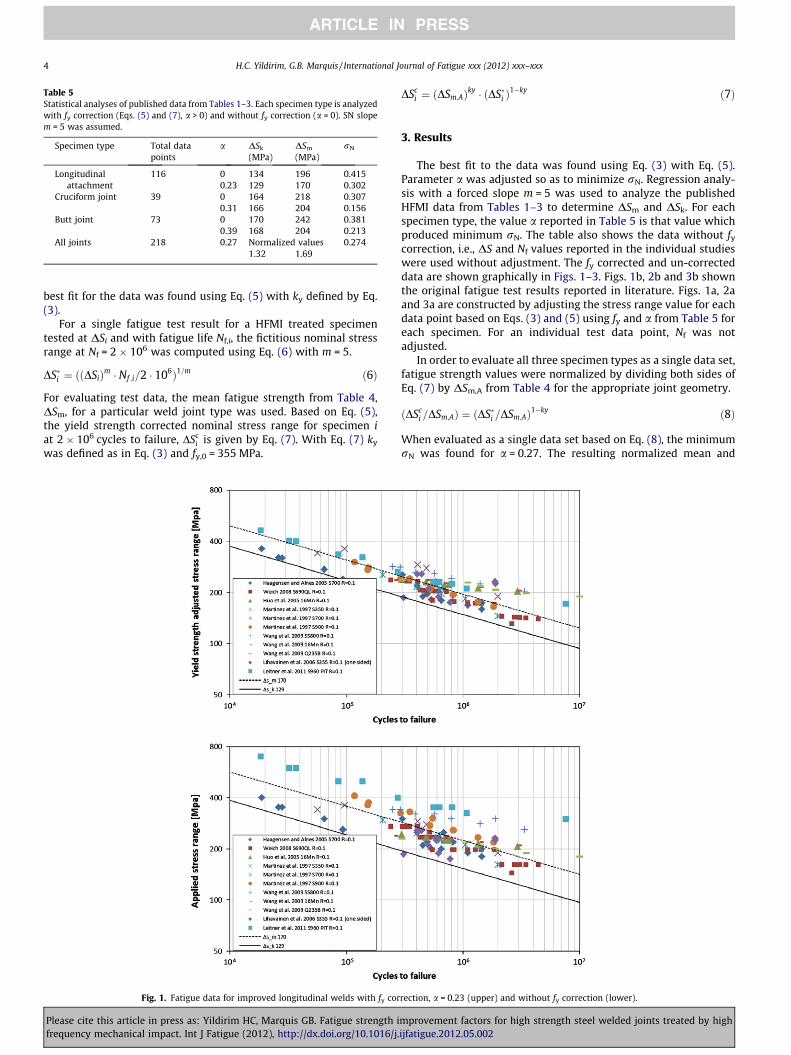
Table 5Statistical analyses of published data from Tables 1–3. Each specimen type is analyzedwith fy correction (Eqs. (5) and (7), a > 0) and without fy correction (a = 0). SN slopem = 5 was assumed.
Specimen type Total datapoints
a DSk
(MPa)DSm
(MPa)rN
Longitudinalattachment
116 0 134 196 0.4150.23 129 170 0.302
Cruciform joint 39 0 164 218 0.3070.31 166 204 0.156
Butt joint 73 0 170 242 0.3810.39 168 204 0.213
All joints 218 0.27 Normalized values 0.2741.32 1.69
4 H.C. Yildirim, G.B. Marquis / International Journal of Fatigue xxx (2012) xxx–xxx
best fit for the data was found using Eq. (5) with ky defined by Eq.(3).
For a single fatigue test result for a HFMI treated specimentested at DSi and with fatigue life Nf,i, the fictitious nominal stressrange at Nf = 2 � 106 was computed using Eq. (6) with m = 5.
DS�i ¼ ððDSiÞm � Nf ;i=2 � 106Þ1=m ð6Þ
For evaluating test data, the mean fatigue strength from Table 4,DSm, for a particular weld joint type was used. Based on Eq. (5),the yield strength corrected nominal stress range for specimen iat 2 � 106 cycles to failure, DSc
i is given by Eq. (7). With Eq. (7) ky
was defined as in Eq. (3) and fy,0 = 355 MPa.
Fig. 1. Fatigue data for improved longitudinal welds with fy cor
Please cite this article in press as: Yildirim HC, Marquis GB. Fatigue strength ifrequency mechanical impact. Int J Fatigue (2012), http://dx.doi.org/10.1016/j.
DSci ¼ ðDSm;AÞky � ðDS�i Þ
1�ky ð7Þ
3. Results
The best fit to the data was found using Eq. (3) with Eq. (5).Parameter a was adjusted so as to minimize rN. Regression analy-sis with a forced slope m = 5 was used to analyze the publishedHFMI data from Tables 1–3 to determine DSm and DSk. For eachspecimen type, the value a reported in Table 5 is that value whichproduced minimum rN. The table also shows the data without fy
correction, i.e., DS and Nf values reported in the individual studieswere used without adjustment. The fy corrected and un-correcteddata are shown graphically in Figs. 1–3. Figs. 1b, 2b and 3b shownthe original fatigue test results reported in literature. Figs. 1a, 2aand 3a are constructed by adjusting the stress range value for eachdata point based on Eqs. (3) and (5) using fy and a from Table 5 foreach specimen. For an individual test data point, Nf was notadjusted.
In order to evaluate all three specimen types as a single data set,fatigue strength values were normalized by dividing both sides ofEq. (7) by DSm,A from Table 4 for the appropriate joint geometry.
ðDSci =DSm;AÞ ¼ ðDS�i =DSm;AÞ1�ky ð8Þ
When evaluated as a single data set based on Eq. (8), the minimumrN was found for a = 0.27. The resulting normalized mean and
rection, a = 0.23 (upper) and without fy correction (lower).
mprovement factors for high strength steel welded joints treated by highijfatigue.2012.05.002
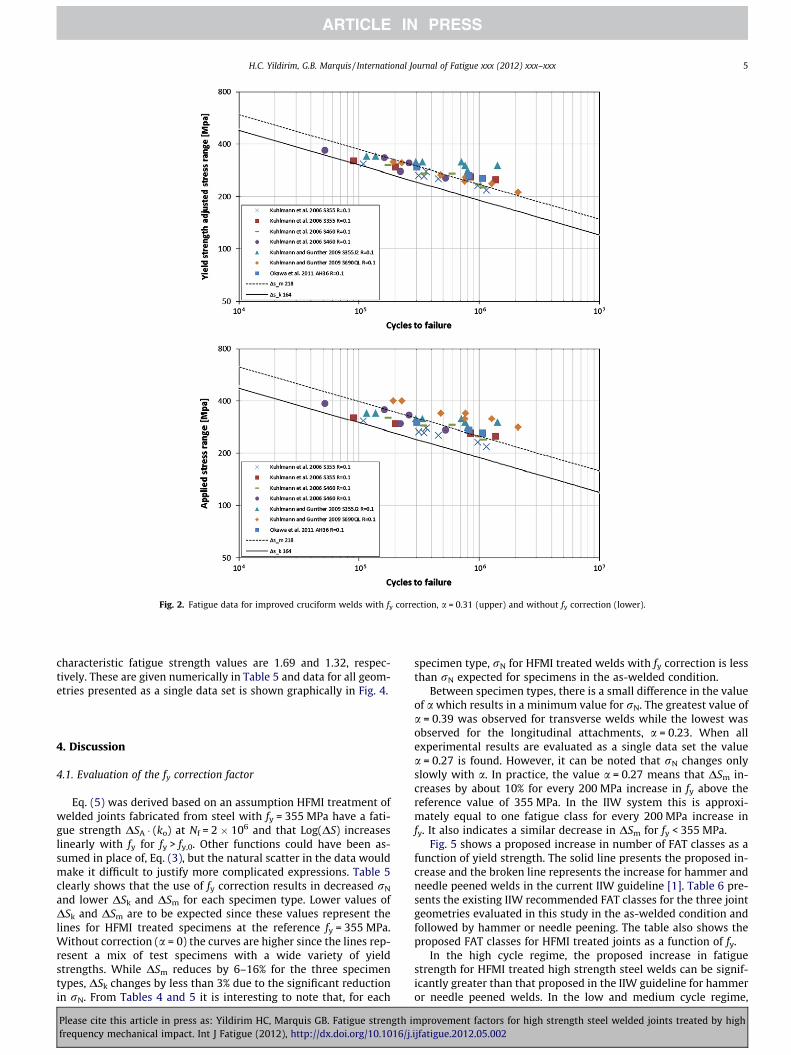
Fig. 2. Fatigue data for improved cruciform welds with fy correction, a = 0.31 (upper) and without fy correction (lower).
H.C. Yildirim, G.B. Marquis / International Journal of Fatigue xxx (2012) xxx–xxx 5
characteristic fatigue strength values are 1.69 and 1.32, respec-tively. These are given numerically in Table 5 and data for all geom-etries presented as a single data set is shown graphically in Fig. 4.
4. Discussion
4.1. Evaluation of the fy correction factor
Eq. (5) was derived based on an assumption HFMI treatment ofwelded joints fabricated from steel with fy = 355 MPa have a fati-gue strength DSA � (ko) at Nf = 2 � 106 and that Log(DS) increaseslinearly with fy for fy > fy,0. Other functions could have been as-sumed in place of, Eq. (3), but the natural scatter in the data wouldmake it difficult to justify more complicated expressions. Table 5clearly shows that the use of fy correction results in decreased rN
and lower DSk and DSm for each specimen type. Lower values ofDSk and DSm are to be expected since these values represent thelines for HFMI treated specimens at the reference fy = 355 MPa.Without correction (a = 0) the curves are higher since the lines rep-resent a mix of test specimens with a wide variety of yieldstrengths. While DSm reduces by 6–16% for the three specimentypes, DSk changes by less than 3% due to the significant reductionin rN. From Tables 4 and 5 it is interesting to note that, for each
Please cite this article in press as: Yildirim HC, Marquis GB. Fatigue strength ifrequency mechanical impact. Int J Fatigue (2012), http://dx.doi.org/10.1016/j.
specimen type, rN for HFMI treated welds with fy correction is lessthan rN expected for specimens in the as-welded condition.
Between specimen types, there is a small difference in the valueof a which results in a minimum value for rN. The greatest value ofa = 0.39 was observed for transverse welds while the lowest wasobserved for the longitudinal attachments, a = 0.23. When allexperimental results are evaluated as a single data set the valuea = 0.27 is found. However, it can be noted that rN changes onlyslowly with a. In practice, the value a = 0.27 means that DSm in-creases by about 10% for every 200 MPa increase in fy above thereference value of 355 MPa. In the IIW system this is approxi-mately equal to one fatigue class for every 200 MPa increase infy. It also indicates a similar decrease in DSm for fy < 355 MPa.
Fig. 5 shows a proposed increase in number of FAT classes as afunction of yield strength. The solid line presents the proposed in-crease and the broken line represents the increase for hammer andneedle peened welds in the current IIW guideline [1]. Table 6 pre-sents the existing IIW recommended FAT classes for the three jointgeometries evaluated in this study in the as-welded condition andfollowed by hammer or needle peening. The table also shows theproposed FAT classes for HFMI treated joints as a function of fy.
In the high cycle regime, the proposed increase in fatiguestrength for HFMI treated high strength steel welds can be signif-icantly greater than that proposed in the IIW guideline for hammeror needle peened welds. In the low and medium cycle regime,
mprovement factors for high strength steel welded joints treated by highijfatigue.2012.05.002
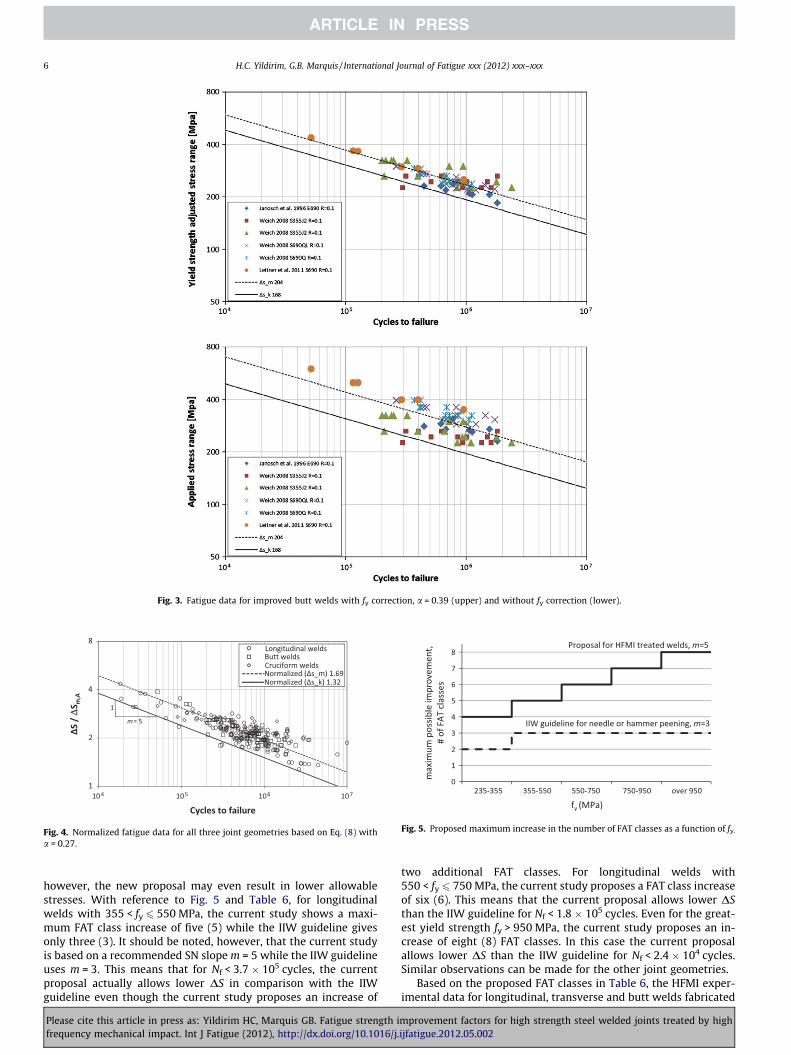
Fig. 3. Fatigue data for improved butt welds with fy correction, a = 0.39 (upper) and without fy correction (lower).
ΔΔ
Fig. 4. Normalized fatigue data for all three joint geometries based on Eq. (8) witha = 0.27.
Fig. 5. Proposed maximum increase in the number of FAT classes as a function of fy.
6 H.C. Yildirim, G.B. Marquis / International Journal of Fatigue xxx (2012) xxx–xxx
however, the new proposal may even result in lower allowablestresses. With reference to Fig. 5 and Table 6, for longitudinalwelds with 355 < fy 6 550 MPa, the current study shows a maxi-mum FAT class increase of five (5) while the IIW guideline givesonly three (3). It should be noted, however, that the current studyis based on a recommended SN slope m = 5 while the IIW guidelineuses m = 3. This means that for Nf < 3.7 � 105 cycles, the currentproposal actually allows lower DS in comparison with the IIWguideline even though the current study proposes an increase of
Please cite this article in press as: Yildirim HC, Marquis GB. Fatigue strength ifrequency mechanical impact. Int J Fatigue (2012), http://dx.doi.org/10.1016/j.
two additional FAT classes. For longitudinal welds with550 < fy 6 750 MPa, the current study proposes a FAT class increaseof six (6). This means that the current proposal allows lower DSthan the IIW guideline for Nf < 1.8 � 105 cycles. Even for the great-est yield strength fy > 950 MPa, the current study proposes an in-crease of eight (8) FAT classes. In this case the current proposalallows lower DS than the IIW guideline for Nf < 2.4 � 104 cycles.Similar observations can be made for the other joint geometries.
Based on the proposed FAT classes in Table 6, the HFMI exper-imental data for longitudinal, transverse and butt welds fabricated
mprovement factors for high strength steel welded joints treated by highijfatigue.2012.05.002
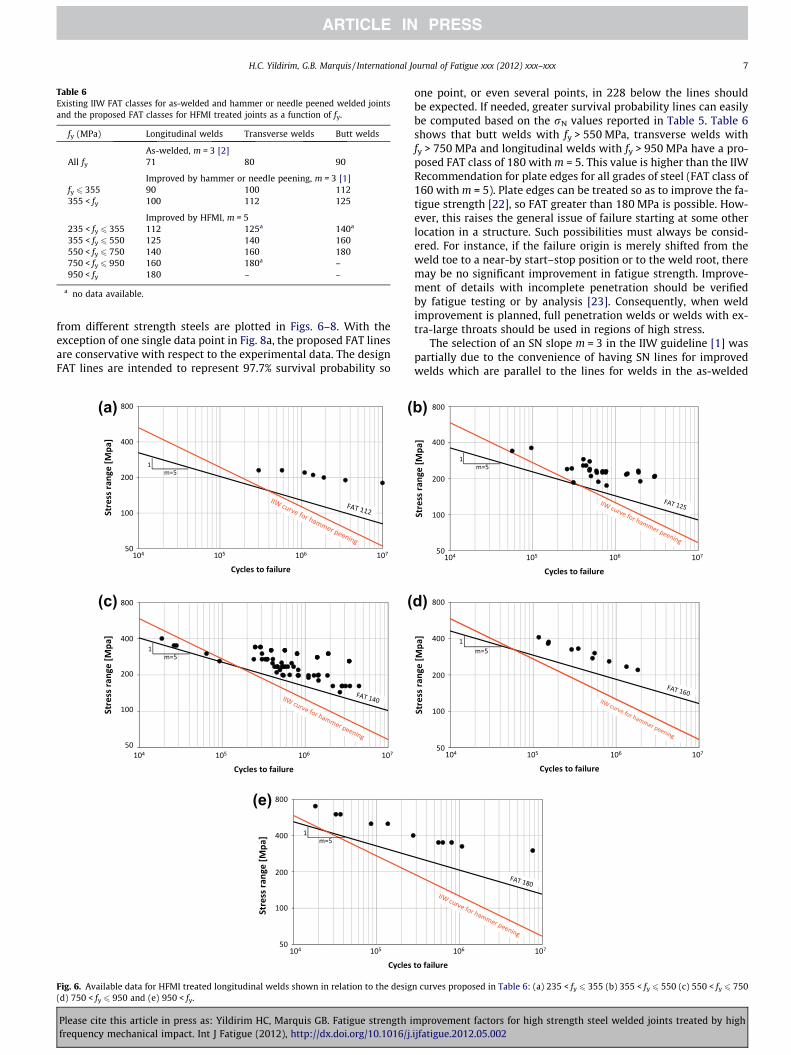
Table 6Existing IIW FAT classes for as-welded and hammer or needle peened welded jointsand the proposed FAT classes for HFMI treated joints as a function of fy.
fy (MPa) Longitudinal welds Transverse welds Butt welds
As-welded, m = 3 [2]All fy 71 80 90
Improved by hammer or needle peening, m = 3 [1]fy 6 355 90 100 112355 < fy 100 112 125
Improved by HFMI, m = 5235 < fy 6 355 112 125a 140a
355 < fy 6 550 125 140 160550 < fy 6 750 140 160 180750 < fy 6 950 160 180a –950 < fy 180 – –
a no data available.
H.C. Yildirim, G.B. Marquis / International Journal of Fatigue xxx (2012) xxx–xxx 7
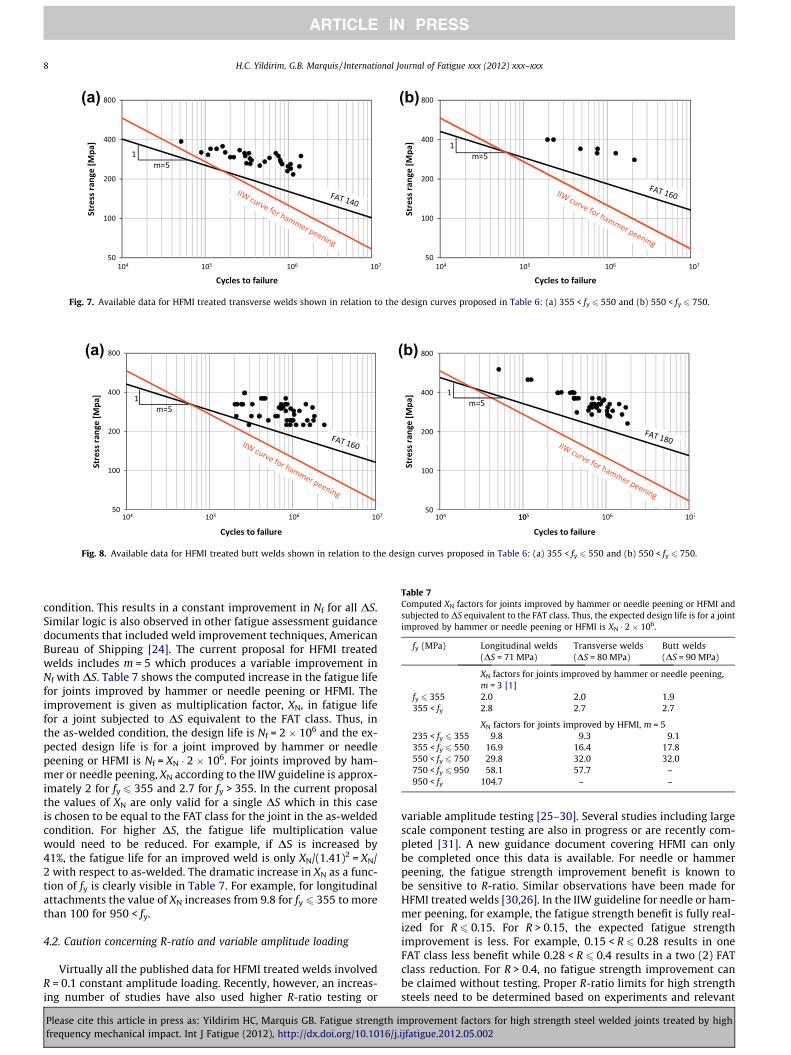
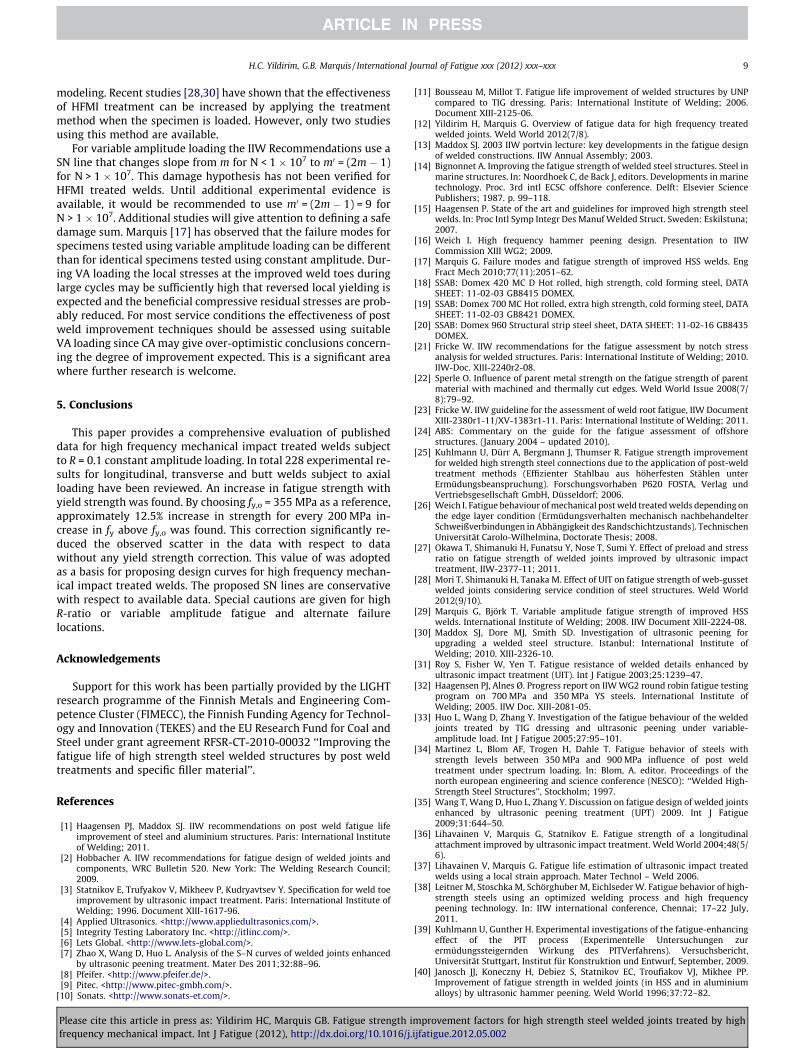
from different strength steels are plotted in Figs. 6–8. With theexception of one single data point in Fig. 8a, the proposed FAT linesare conservative with respect to the experimental data. The designFAT lines are intended to represent 97.7% survival probability so
(a) (
((c)
(e)
Fig. 6. Available data for HFMI treated longitudinal welds shown in relation to the desig(d) 750 < fy 6 950 and (e) 950 < fy.
Please cite this article in press as: Yildirim HC, Marquis GB. Fatigue strength ifrequency mechanical impact. Int J Fatigue (2012), http://dx.doi.org/10.1016/j.
one point, or even several points, in 228 below the lines shouldbe expected. If needed, greater survival probability lines can easilybe computed based on the rN values reported in Table 5. Table 6shows that butt welds with fy > 550 MPa, transverse welds withfy > 750 MPa and longitudinal welds with fy > 950 MPa have a pro-posed FAT class of 180 with m = 5. This value is higher than the IIWRecommendation for plate edges for all grades of steel (FAT class of160 with m = 5). Plate edges can be treated so as to improve the fa-tigue strength [22], so FAT greater than 180 MPa is possible. How-ever, this raises the general issue of failure starting at some otherlocation in a structure. Such possibilities must always be consid-ered. For instance, if the failure origin is merely shifted from theweld toe to a near-by start–stop position or to the weld root, theremay be no significant improvement in fatigue strength. Improve-ment of details with incomplete penetration should be verifiedby fatigue testing or by analysis [23]. Consequently, when weldimprovement is planned, full penetration welds or welds with ex-tra-large throats should be used in regions of high stress.
The selection of an SN slope m = 3 in the IIW guideline [1] waspartially due to the convenience of having SN lines for improvedwelds which are parallel to the lines for welds in the as-welded
b)
d)
n curves proposed in Table 6: (a) 235 < fy 6 355 (b) 355 < fy 6 550 (c) 550 < fy 6 750
mprovement factors for high strength steel welded joints treated by highijfatigue.2012.05.002
(b)(a)
Fig. 7. Available data for HFMI treated transverse welds shown in relation to the design curves proposed in Table 6: (a) 355 < fy 6 550 and (b) 550 < fy 6 750.
(b)(a)
Fig. 8. Available data for HFMI treated butt welds shown in relation to the design curves proposed in Table 6: (a) 355 < fy 6 550 and (b) 550 < fy 6 750.
Table 7Computed XN factors for joints improved by hammer or needle peening or HFMI andsubjected to DS equivalent to the FAT class. Thus, the expected design life is for a jointimproved by hammer or needle peening or HFMI is XN � 2 � 106.
fy (MPa) Longitudinal welds(DS = 71 MPa)
Transverse welds(DS = 80 MPa)
Butt welds(DS = 90 MPa)
XN factors for joints improved by hammer or needle peening,m = 3 [1]
fy 6 355 2.0 2.0 1.9355 < fy 2.8 2.7 2.7
XN factors for joints improved by HFMI, m = 5235 < fy 6 355 9.8 9.3 9.1355 < fy 6 550 16.9 16.4 17.8550 < fy 6 750 29.8 32.0 32.0750 < fy 6 950 58.1 57.7 –950 < fy 104.7 – –
8 H.C. Yildirim, G.B. Marquis / International Journal of Fatigue xxx (2012) xxx–xxx
condition. This results in a constant improvement in Nf for all DS.Similar logic is also observed in other fatigue assessment guidancedocuments that included weld improvement techniques, AmericanBureau of Shipping [24]. The current proposal for HFMI treatedwelds includes m = 5 which produces a variable improvement inNf with DS. Table 7 shows the computed increase in the fatigue lifefor joints improved by hammer or needle peening or HFMI. Theimprovement is given as multiplication factor, XN, in fatigue lifefor a joint subjected to DS equivalent to the FAT class. Thus, inthe as-welded condition, the design life is Nf = 2 � 106 and the ex-pected design life is for a joint improved by hammer or needlepeening or HFMI is Nf = XN � 2 � 106. For joints improved by ham-mer or needle peening, XN according to the IIW guideline is approx-imately 2 for fy 6 355 and 2.7 for fy > 355. In the current proposalthe values of XN are only valid for a single DS which in this caseis chosen to be equal to the FAT class for the joint in the as-weldedcondition. For higher DS, the fatigue life multiplication valuewould need to be reduced. For example, if DS is increased by41%, the fatigue life for an improved weld is only XN/(1.41)2 = XN/2 with respect to as-welded. The dramatic increase in XN as a func-tion of fy is clearly visible in Table 7. For example, for longitudinalattachments the value of XN increases from 9.8 for fy 6 355 to morethan 100 for 950 < fy.
4.2. Caution concerning R-ratio and variable amplitude loading
Virtually all the published data for HFMI treated welds involvedR = 0.1 constant amplitude loading. Recently, however, an increas-ing number of studies have also used higher R-ratio testing or
Please cite this article in press as: Yildirim HC, Marquis GB. Fatigue strength ifrequency mechanical impact. Int J Fatigue (2012), http://dx.doi.org/10.1016/j.
variable amplitude testing [25–30]. Several studies including largescale component testing are also in progress or are recently com-pleted [31]. A new guidance document covering HFMI can onlybe completed once this data is available. For needle or hammerpeening, the fatigue strength improvement benefit is known tobe sensitive to R-ratio. Similar observations have been made forHFMI treated welds [30,26]. In the IIW guideline for needle or ham-mer peening, for example, the fatigue strength benefit is fully real-ized for R 6 0.15. For R > 0.15, the expected fatigue strengthimprovement is less. For example, 0.15 < R 6 0.28 results in oneFAT class less benefit while 0.28 < R 6 0.4 results in a two (2) FATclass reduction. For R > 0.4, no fatigue strength improvement canbe claimed without testing. Proper R-ratio limits for high strengthsteels need to be determined based on experiments and relevant
mprovement factors for high strength steel welded joints treated by highijfatigue.2012.05.002
H.C. Yildirim, G.B. Marquis / International Journal of Fatigue xxx (2012) xxx–xxx 9
modeling. Recent studies [28,30] have shown that the effectivenessof HFMI treatment can be increased by applying the treatmentmethod when the specimen is loaded. However, only two studiesusing this method are available.
For variable amplitude loading the IIW Recommendations use aSN line that changes slope from m for N < 1 � 107 to m0 = (2m � 1)for N > 1 � 107. This damage hypothesis has not been verified forHFMI treated welds. Until additional experimental evidence isavailable, it would be recommended to use m0 = (2m � 1) = 9 forN > 1 � 107. Additional studies will give attention to defining a safedamage sum. Marquis [17] has observed that the failure modes forspecimens tested using variable amplitude loading can be differentthan for identical specimens tested using constant amplitude. Dur-ing VA loading the local stresses at the improved weld toes duringlarge cycles may be sufficiently high that reversed local yielding isexpected and the beneficial compressive residual stresses are prob-ably reduced. For most service conditions the effectiveness of postweld improvement techniques should be assessed using suitableVA loading since CA may give over-optimistic conclusions concern-ing the degree of improvement expected. This is a significant areawhere further research is welcome.
5. Conclusions
This paper provides a comprehensive evaluation of publisheddata for high frequency mechanical impact treated welds subjectto R = 0.1 constant amplitude loading. In total 228 experimental re-sults for longitudinal, transverse and butt welds subject to axialloading have been reviewed. An increase in fatigue strength withyield strength was found. By choosing fy,o = 355 MPa as a reference,approximately 12.5% increase in strength for every 200 MPa in-crease in fy above fy,o was found. This correction significantly re-duced the observed scatter in the data with respect to datawithout any yield strength correction. This value of was adoptedas a basis for proposing design curves for high frequency mechan-ical impact treated welds. The proposed SN lines are conservativewith respect to available data. Special cautions are given for highR-ratio or variable amplitude fatigue and alternate failurelocations.
Acknowledgements
Support for this work has been partially provided by the LIGHTresearch programme of the Finnish Metals and Engineering Com-petence Cluster (FIMECC), the Finnish Funding Agency for Technol-ogy and Innovation (TEKES) and the EU Research Fund for Coal andSteel under grant agreement RFSR-CT-2010-00032 ‘‘Improving thefatigue life of high strength steel welded structures by post weldtreatments and specific filler material’’.
References
[1] Haagensen PJ, Maddox SJ. IIW recommendations on post weld fatigue lifeimprovement of steel and aluminium structures. Paris: International Instituteof Welding; 2011.
[2] Hobbacher A. IIW recommendations for fatigue design of welded joints andcomponents, WRC Bulletin 520. New York: The Welding Research Council;2009.
[3] Statnikov E, Trufyakov V, Mikheev P, Kudryavtsev Y. Specification for weld toeimprovement by ultrasonic impact treatment. Paris: International Institute ofWelding; 1996. Document XIII-1617-96.
[4] Applied Ultrasonics. <http://www.appliedultrasonics.com/>.[5] Integrity Testing Laboratory Inc. <http://itlinc.com/>.[6] Lets Global. <http://www.lets-global.com/>.[7] Zhao X, Wang D, Huo L. Analysis of the S–N curves of welded joints enhanced
by ultrasonic peening treatment. Mater Des 2011;32:88–96.[8] Pfeifer. <http://www.pfeifer.de/>.[9] Pitec. <http://www.pitec-gmbh.com/>.
[10] Sonats. <http://www.sonats-et.com/>.
Please cite this article in press as: Yildirim HC, Marquis GB. Fatigue strength ifrequency mechanical impact. Int J Fatigue (2012), http://dx.doi.org/10.1016/j.
[11] Bousseau M, Millot T. Fatigue life improvement of welded structures by UNPcompared to TIG dressing. Paris: International Institute of Welding; 2006.Document XIII-2125-06.
[12] Yildirim H, Marquis G. Overview of fatigue data for high frequency treatedwelded joints. Weld World 2012(7/8).
[13] Maddox SJ. 2003 IIW portvin lecture: key developments in the fatigue designof welded constructions. IIW Annual Assembly; 2003.
[14] Bignonnet A. Improving the fatigue strength of welded steel structures. Steel inmarine structures. In: Noordhoek C, de Back J, editors. Developments in marinetechnology. Proc. 3rd intl ECSC offshore conference. Delft: Elsevier SciencePublishers; 1987. p. 99–118.
[15] Haagensen P. State of the art and guidelines for improved high strength steelwelds. In: Proc Intl Symp Integr Des Manuf Welded Struct. Sweden: Eskilstuna;2007.
[16] Weich I. High frequency hammer peening design. Presentation to IIWCommission XIII WG2; 2009.
[17] Marquis G. Failure modes and fatigue strength of improved HSS welds. EngFract Mech 2010;77(11):2051–62.
[18] SSAB: Domex 420 MC D Hot rolled, high strength, cold forming steel, DATASHEET: 11-02-03 GB8415 DOMEX.
[19] SSAB: Domex 700 MC Hot rolled, extra high strength, cold forming steel, DATASHEET: 11-02-03 GB8421 DOMEX.
[20] SSAB: Domex 960 Structural strip steel sheet, DATA SHEET: 11-02-16 GB8435DOMEX.
[21] Fricke W. IIW recommendations for the fatigue assessment by notch stressanalysis for welded structures. Paris: International Institute of Welding; 2010.IIW-Doc. XIII-2240r2-08.
[22] Sperle O. Influence of parent metal strength on the fatigue strength of parentmaterial with machined and thermally cut edges. Weld World Issue 2008(7/8):79–92.
[23] Fricke W. IIW guideline for the assessment of weld root fatigue, IIW DocumentXIII-2380r1-11/XV-1383r1-11. Paris: International Institute of Welding; 2011.
[24] ABS: Commentary on the guide for the fatigue assessment of offshorestructures. (January 2004 – updated 2010).
[25] Kuhlmann U, Dürr A, Bergmann J, Thumser R. Fatigue strength improvementfor welded high strength steel connections due to the application of post-weldtreatment methods (Effizienter Stahlbau aus höherfesten Stählen unterErmüdungsbeanspruchung). Forschungsvorhaben P620 FOSTA, Verlag undVertriebsgesellschaft GmbH, Düsseldorf; 2006.
[26] Weich I. Fatigue behaviour of mechanical post weld treated welds depending onthe edge layer condition (Ermüdungsverhalten mechanisch nachbehandelterSchweißverbindungen in Abhängigkeit des Randschichtzustands). TechnischenUniversität Carolo-Wilhelmina, Doctorate Thesis; 2008.
[27] Okawa T, Shimanuki H, Funatsu Y, Nose T, Sumi Y. Effect of preload and stressratio on fatigue strength of welded joints improved by ultrasonic impacttreatment, IIW-2377-11; 2011.
[28] Mori T, Shimanuki H, Tanaka M. Effect of UIT on fatigue strength of web-gussetwelded joints considering service condition of steel structures. Weld World2012(9/10).
[29] Marquis G, Björk T. Variable amplitude fatigue strength of improved HSSwelds. International Institute of Welding; 2008. IIW Document XIII-2224-08.
[30] Maddox SJ, Dore MJ, Smith SD. Investigation of ultrasonic peening forupgrading a welded steel structure. Istanbul: International Institute ofWelding; 2010. XIII-2326-10.
[31] Roy S, Fisher W, Yen T. Fatigue resistance of welded details enhanced byultrasonic impact treatment (UIT). Int J Fatigue 2003;25:1239–47.
[32] Haagensen PJ, Alnes Ø. Progress report on IIW WG2 round robin fatigue testingprogram on 700 MPa and 350 MPa YS steels. International Institute ofWelding; 2005. IIW Doc. XIII-2081-05.
[33] Huo L, Wang D, Zhang Y. Investigation of the fatigue behaviour of the weldedjoints treated by TIG dressing and ultrasonic peening under variable-amplitude load. Int J Fatigue 2005;27:95–101.
[34] Martinez L, Blom AF, Trogen H, Dahle T. Fatigue behavior of steels withstrength levels between 350 MPa and 900 MPa influence of post weldtreatment under spectrum loading. In: Blom, A. editor. Proceedings of thenorth european engineering and science conference (NESCO): ‘‘Welded High-Strength Steel Structures’’, Stockholm; 1997.
[35] Wang T, Wang D, Huo L, Zhang Y. Discussion on fatigue design of welded jointsenhanced by ultrasonic peening treatment (UPT) 2009. Int J Fatigue2009;31:644–50.
[36] Lihavainen V, Marquis G, Statnikov E. Fatigue strength of a longitudinalattachment improved by ultrasonic impact treatment. Weld World 2004;48(5/6).
[37] Lihavainen V, Marquis G. Fatigue life estimation of ultrasonic impact treatedwelds using a local strain approach. Mater Technol – Weld 2006.
[38] Leitner M, Stoschka M, Schörghuber M, Eichlseder W. Fatigue behavior of high-strength steels using an optimized welding process and high frequencypeening technology. In: IIW international conference, Chennai; 17–22 July,2011.
[39] Kuhlmann U, Gunther H. Experimental investigations of the fatigue-enhancingeffect of the PIT process (Experimentelle Untersuchungen zurermüdungssteigernden Wirkung des PITVerfahrens). Versuchsbericht,Universität Stuttgart, Institut für Konstruktion und Entwurf, September, 2009.
[40] Janosch JJ, Koneczny H, Debiez S, Statnikov EC, Troufiakov VJ, Mikhee PP.Improvement of fatigue strength in welded joints (in HSS and in aluminiumalloys) by ultrasonic hammer peening. Weld World 1996;37:72–82.
mprovement factors for high strength steel welded joints treated by highijfatigue.2012.05.002


![IIW-Recommendations for Fatigue Design of Welded Joints and Components[1]](https://img.pdfslide.us/doc/110x75/5571ff7949795991699d5428/iiw-recommendations-for-fatigue-design-of-welded-joints-and-components1.jpg)