Embed Size (px)
Citation preview
by
Fatigue of Compos ms
A SUMMARY OF F'UIJTS 01'1 COMPOS lIrE BEAMS
Fritz Engineering Laboratory7\1 28t:=: 81\1 0 $ _~ '", .~) ~' ')
Fatigue of Composite Beams
A BRIEF SUMMARY OF FATIGUE
TEST,RESULTS ON COMPOSITE BEAMS
by
Ro G. Slutter
(Not For Publication).__."''''''",-._---------
Fritz Engineering Laboratory
Lehigh University
Bethlehem, Pennsylvania
February 17, 1964
Fritz Engineering Laboratory Report Noo 28508
285.8 -1
The report which follows is a brief summary of the results of
research work being conducted at Lehigh Universi.t'y, ~as,,,part of a research
project entitled "Fatigue of Composite Beams". ,This ,pr~ject is .be.ing spon
sored by the American Institute of Steel Construction. ,and .Gregory,Industries,
Inc. Since it will not be possible for a membero.f, the..Le-high ,University
staff to be present at the forthcoming meeting of. ;,the Jo.int ACI-ASCE Com8O!
mittee on Composite Construction, this report is ",being, mailed to members of
the committee prior to the meeting.
During the past year eight composite steel and concrete beams were
tested for the purpose of determ~nation of the fatigue strength of 1/2 inch
welded stud shear connectors in beams~
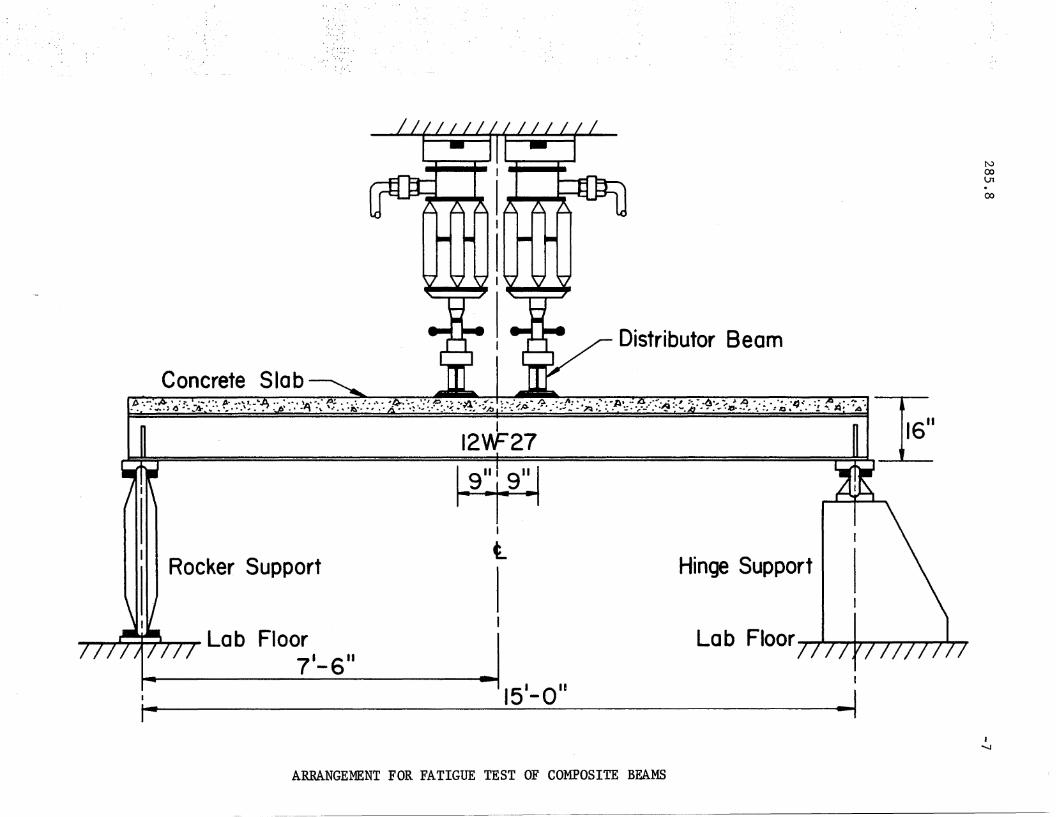
,The members tested consisted of a concrete slab 4 inches by 48
inches connected to a 12 W 27 steel beam by forty liZ-inch diameter stud
connectors. The concrete mix was designed for 3000 psi and the strength at
time of test averaged about 3500 psi. These tee beams were supported on a
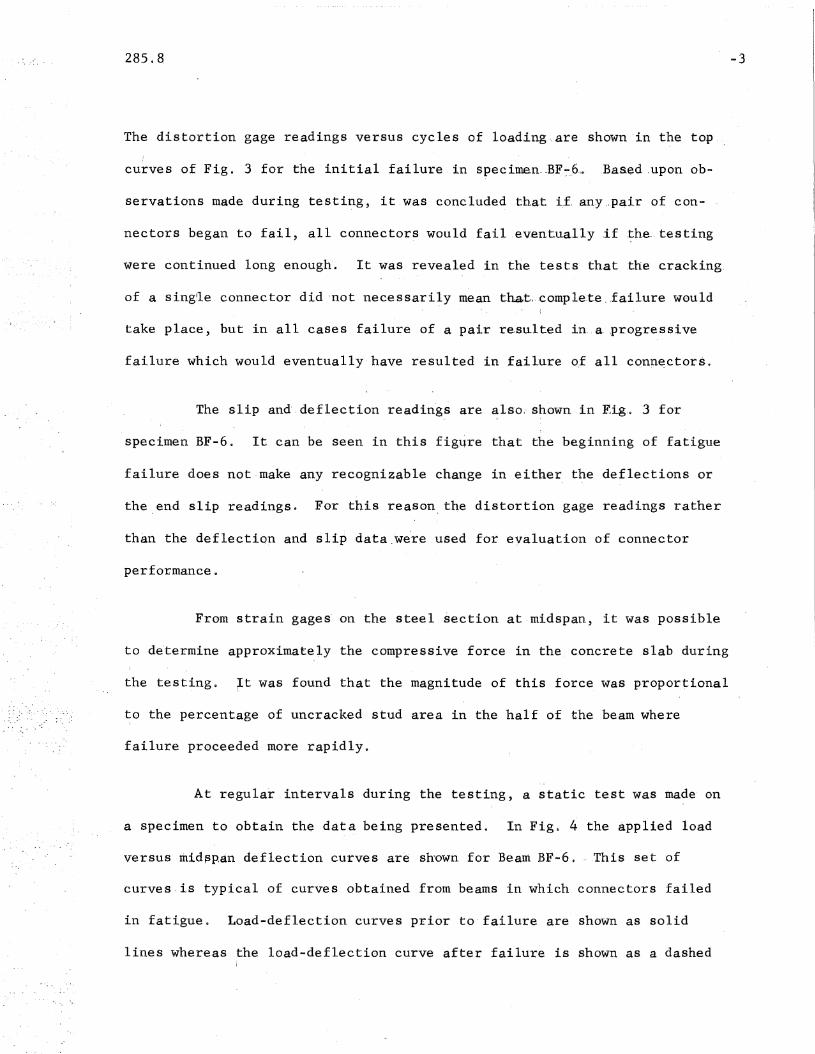
span of 15' -0". The members were loaded '-by two hydraulic jacks located 9
inches on each side of midspan, and the l~ad was spread laterally by dis
tributor beams as shown in Fig. 1.
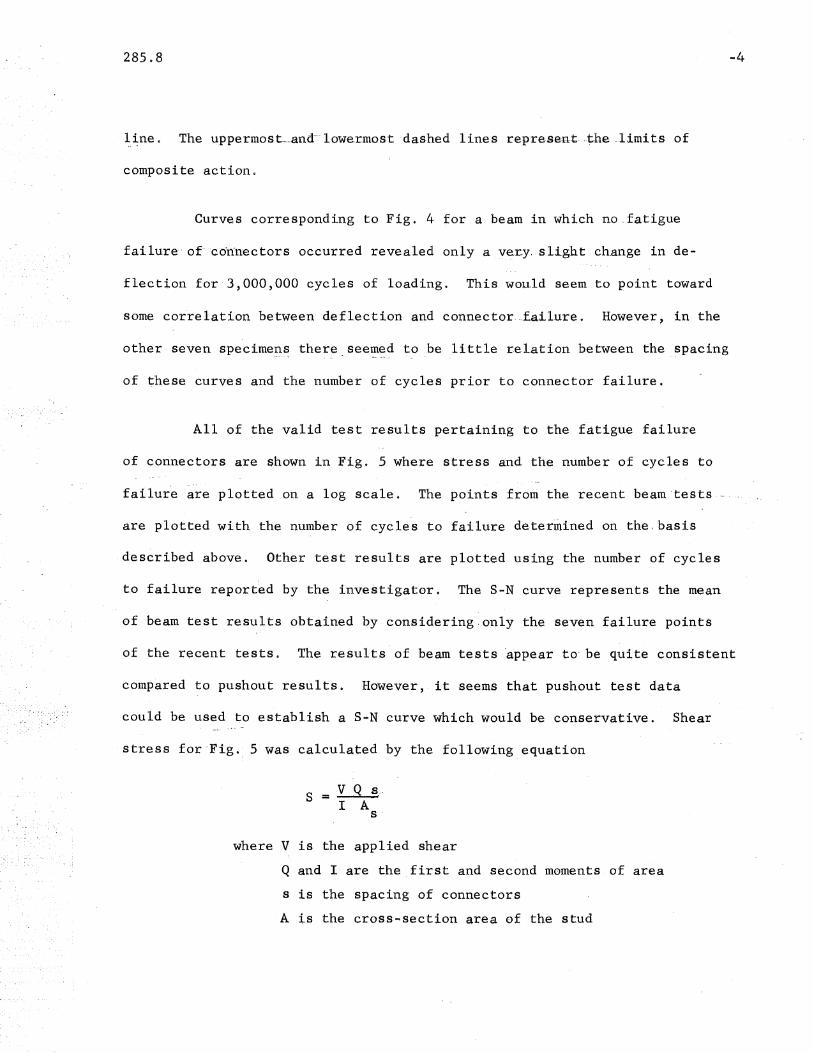
The number and spacing of shear connectors is shown in Fig. 2.
Shear connectors were not placed in the center portion of the member so
that all connectors would be located ~n the shear spans. This made it
28508
possible to determine with a better degree of certainty the magnitude of
the shear stress on each connector.
-2
Because of difficulties in determining wh,en connectors. actually
failed in previous b'eam tests, a method of measuring the- ,lo,c.al bending
stresses in the top flange of the steel beam-by s..tr_ain,~ag,es,was devised.
The horizontal force applied to the top flange wa.s.,found to induce be,nding.~
stresses in the top flange of appreciable magnituda.. :By experimentation wi,th
the location and type of electrical resistance strain,gage to be used it
was possible to provide gages, later referred to ...as. d.istortion. -gages, which
were quite sensitive to changes in the connector force 0
By the use of distorti.on gage's it was possible to determine when
a connector first became cracked and when it cQmpleteJy failedo It was
. found that these gages were most e~fective wh~n placeq slightly toward the
end 6£ the beam from the connector 0 One of the reasons for thi~ is that a
fatig~e crack first sta~tted on this side of the connector II
Typical.failure of connectors consisted of a crack which formed in
the base metal and presumably progressed along the heat affecte~ zone of
the ·weld in the base metalo COI!1p-lete 'failure resul.ted in the removal of
a crater of material from the flange of the steel beamo Distortion gage
readings revealed that often many connectors were cracked before the first
connector failed completely. Generally failure began with the end con
nec~ors and progressed toward ~idspano
Th-e' failure of the· shear. connectors was taken as the average number
of cycles required to start a fatigue failure in any pair of connectorsQ
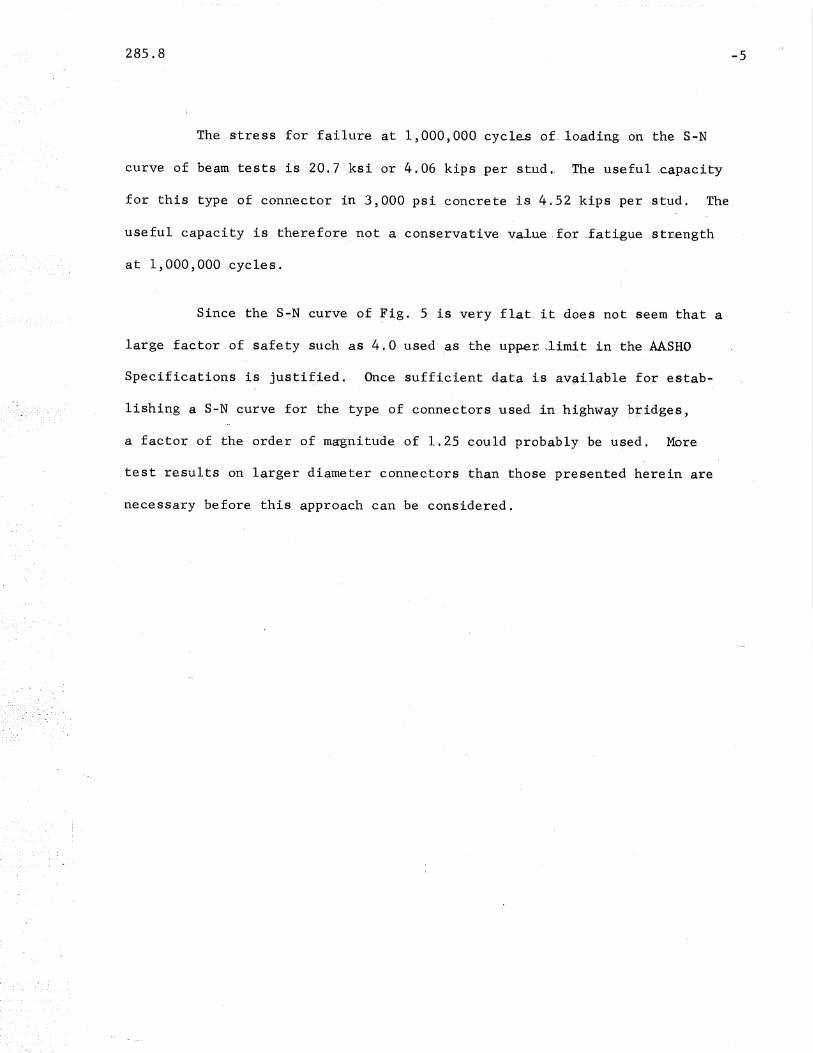
The distortion gage readings versus cycles of loading '. are shown 'in the top
curves of Fig. 3 for the initial failure in specimen.~BF......6". ,Based .upon ob
servations made during testing, it was concluded that i£. any ..pair of con
nectors began to fail, ~11 connectors would fail even,tually if .the- testing
were continued long enough. It was revealed in the tests' that -the cracking.
of a sing'le connector did 'not necessari~y mean that.·"comple,te. ,failure would
take place, but in all cases failu,re of a pair re.sulted in, a, ,pro-gressive
failure which would eventually have resulted in failure 0.£ all cqnn~ctors~
From strain gage~ on the steel ~ection at-midspan, it was possible
to de'termine approximate~y the compressive force in the concrete slab during
the testingo ~t was found that the magnitude of this force waS proportional
to the percentage of uncracked stud area in the half of the beam where
failure proceeded more rapidlyo
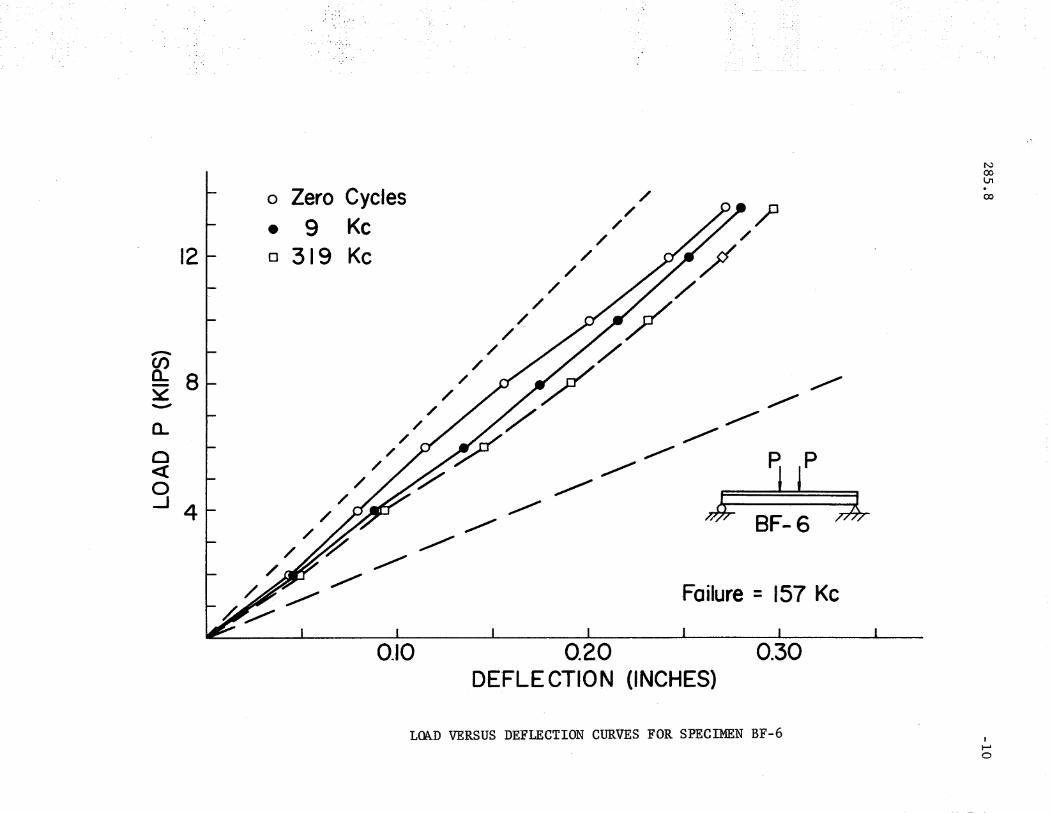
At regula~.intervals during the testing, a static test was made on
a specimen to obtain the data being presentedo In Fig~ 4 the applied load
versus mid~p.a.n deflection curves are sh'own for Beam BF-6 ~ ,This set of
curves~is typical of curves obtained from beams in which connectors failed
in fatigue 0 Load-deflection curves prior to failure are shown as solid
lines whereas the load-deflection curve after failure is shown as a dashed
-3
line 0 The uppermost-~and--lower-most-dashed lines .repre-se-nt-·--t-he .1imits of
composite actiono
Curves corresponding to Fig 0 4 for a beam in which no. fa-tigue
failure' of-c'cb'tftlectors occurred revealed only a y~.r..y, slight ch.ange in de-
flection for 3,000,000 cycles of loadingo This would seem to point toward
some correlation between' deflection and connector ...failure 0 However) in the
other seven specimens there seemed to be little re.1.ation between the ,,~pacing:.~ _. ... . .:.... . ~ ~- -- -~ --
of ~hese curves and the number of cycles prior to connector failure.
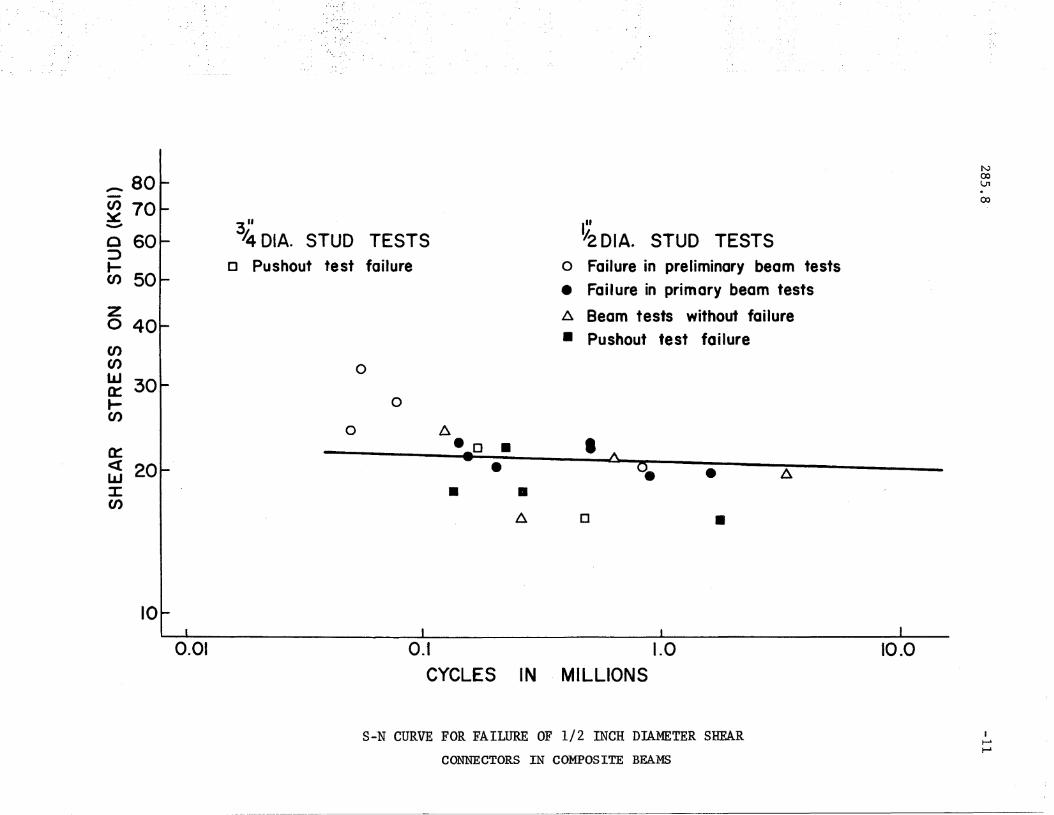
All of the 'valid test results pertaining to the fatigue failure
of connectors are shown in Figo 5 where stress and the number of cycles to
failur-e are plotted on a log scale 0 The points from the recent beam ·tests -~.
are plotted with the number of cycles to failure determined on the/basis
described above. Other test results are plotted using the number of cycles
to failure reported by the investigator 0 The S-N curve represents the mean
of beam test results obtained by considering ,only the seven failure points
of the recent testso The results of beam tests ·appear to' be quite consistent
compared to pushout resultso However, it seems that pushout test data
could be used to establish a S-N curve which would be conservative. Shear
stress for·Figo 5 was calculated by the following equation
S = v Q s_I As-
where V is the applied shear
Q and I are the first and second moments of area
s is the spacing of connectors
A is the cross~section area of the stud
285.8
The s·tress for failure at 1,000,000 cyclaso£.. loading on the S·..N
curve of beam tests is 20.7 ksi or 4.06 kips per, .s.tud., The useful ,c.a-pacity
for this type of connector in 3,000 psi concrete ,is 4Q52 kips per stud. The
useful capacity is therefore not a conservative value. fo,r,.fatigue str,ength
at 1,000,000 cycles.
Since the S-N curve of ~ig. 5 is very flat- it does not seem that a
large factor. of safety such as 4,0 used as the up,per; ~limit.in the ,AASHO
Specifications is justi~ied. Once sufficient data. is av~i.lable for estab
lishing a S-N curve for the type of connectors used ~n.highway.~~idges,
a factor of the order of magnitude of 1.25 could probably be used. More
test results on larger diameter connectors than those presented herein are
necessary before this approach can be considered.
-5
285.8
Figure
1
2
3
4
5
FIG DR E $
ARRANGEMENT FOR FATIGUE TEST OF COMPOSITEBEAMS
SPACING OF SHEAR CONNECTORS
COMPARISON OF SLIP AND DEFLECTION WITH'DISTORTION GAGE READINGS FOR, BF-6
LOA.D VERSUS DEFLECTION CURVES FOR SPECIMENBF-6
S-N, CURVE FOR FAILURE OF 1/2 INCH DIAMETERSHEAR,CONNECTORS IN COMPOSITE BEAMS
7
8
9
10
11
-6
• ~ , t·~ •
N(X)l.n.00
Hinge Support
Distributor Beam
l
I12VF27
Rocker Support
, J ' Lab Flo-or I Lab Floor 'I j'i J
7 1-6 11
; -15 1-0 11I
1- _II
.........
ARRANGEMENT FOR FATIGUE TEST OF COMPOSITE BEAMS
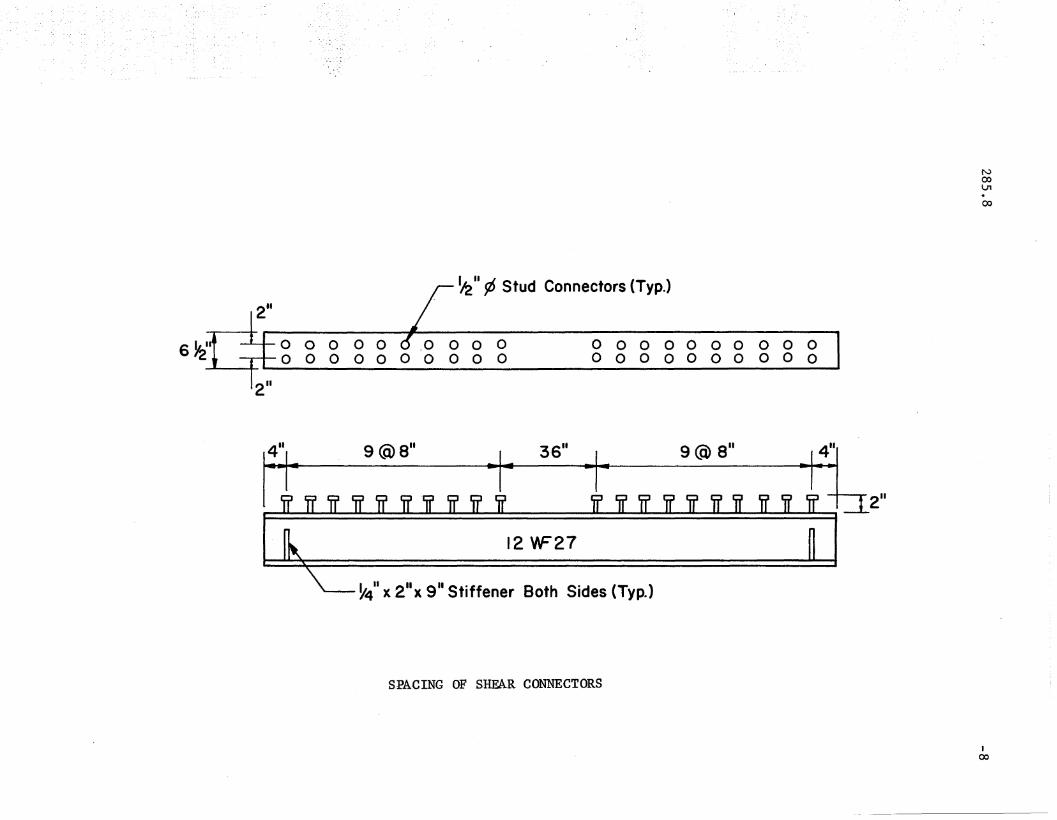
~ II ¢ Stud Connectors (Typ.)
6~1I o 0 0 0 0o 0 0 0 0 0
o 0o 0
000000000 0000000000 0
Nco\J1.00
Y4J1X 2 ux gil Stiffener Both Sides (Typ.)
4" 9 (Q) all 3-6"
12 W=27
9 (Q) a"
2"
SPACING OF SHEAR CONNECTORS
J00
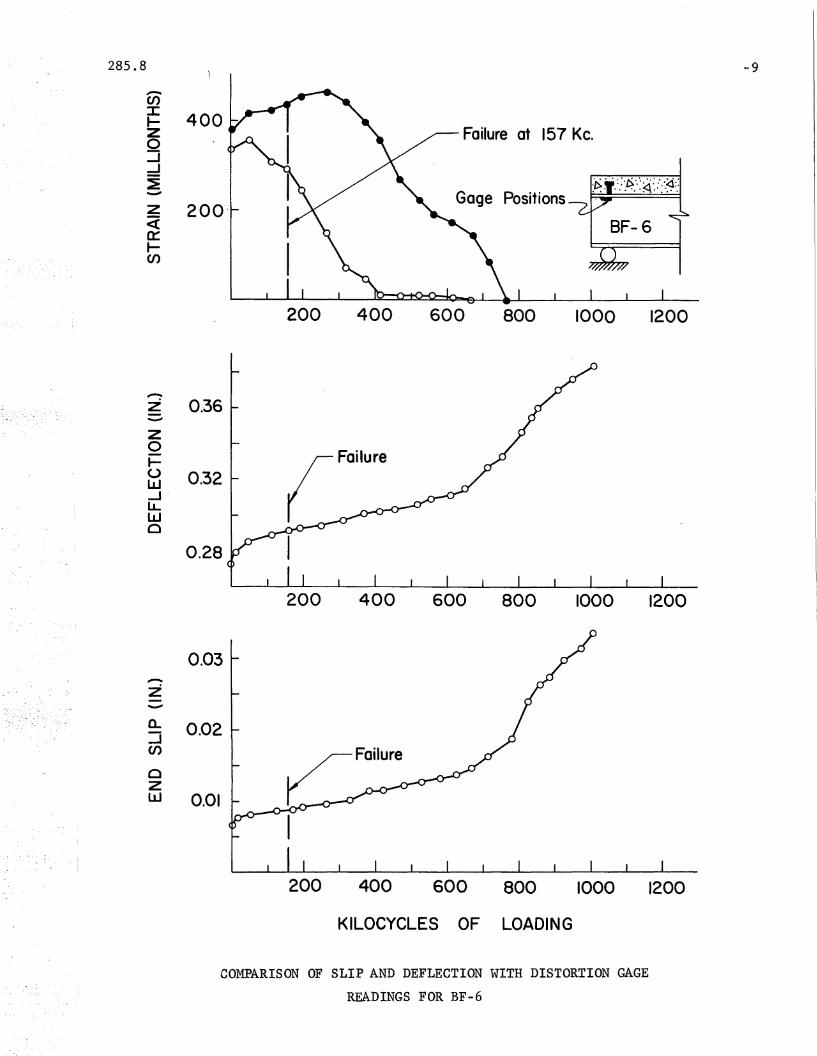
285.8 -9
..........en~ 400zo::Jd:E.....,
z 200"«0:::t-en
Failure at 157 Kc.
Gage Positions
200 400 600 800 1000 1200
••
•
•••
,....Z 0~36.........-
z0
FailureI-u 0.32w-J'LLW0
0.28
200 400 600 800 1000 1200
0.03,.......z.........
Q. 0.02..Jen0zw 0.01
200 400 600 800 1000 1200
KILOCYCLES OF LOADING
COMPARISON OF SLIP AND DEFLECTION WITH DISTORTION GAGE
READINGS FOR BF-6
"
, ~
-Failure =157 Kc
N00lJ1
00
0.30
/"/"
~/""
~~
/""~ J
0.20DEFLE CTION (INCHES)
0.10
o Zero Cycles
• 9 Kco 319 Kc12
a.o«o-l4
,.........
~ 8~........,
L~D VERSUS DEFLECTION CURVES FOR SPECIMEN BF-6 I
~
o
o
o .6.. 0 • • t!..
• . 0.. 6-
• •
Y2 DIA. STUD TESTSo Failure in preliminary beam tests
• Fai-Iure in primary beam tests
~ Beam tests without failure
• Pushout test failure
,.... 80-en 70~.........."
C 60:::>~U) 50
zo 40(f)(J)
~ 30t-oo
a:::« 20w:I:en
10
0.01
34 DIA. STUD TESTSD Pushout test failure
o
6
0.-1
CYCLES IN
o
1.0MILLIONS
•
10.0
Nex>U1.CX)
S-N CURVE FOR FAILURE OF 1/2 INCH DIAMETER SHEAR
CONNECTORS IN COMPOS ITE BEAMS
It-"......