Embed Size (px)
Citation preview
FATIGUE FRACTURE SURFACE MORPHOLOGY FOR ALLOY 718
W. J. Mills and C. M. Brown
Bettis Atomic Power Laboratory Bechtel Bettis, Inc.
West Miftlin, PA 15 122-0079
Abstract Fatigue crack growth rate testing of Alloy 7 18 was conducted in room temperature air and the fracture surface morphology was characterized to establish operative cracking mechanisms. Crack growth rates exhibit a bilinear power-law relationship with a transition to lower cracking rates occurring at a stress intensity factor range (AK) of 18 ~ ~ a d m . This transition is associated with a deformation mechanism transition from homogeneous to heterogeneous slip. Three types of fracture surface morphologies are observed and the operative cracking mechanism is dependent on AK. A faceted growth mechanism is operative at AK levels below 18 M ~ a d m , striation formation is dominant between 18 and 70 ~ ~ a d m , and a combination of striation formation and dimple rupture is dominant above 70 ~ ~ a d m . Detailed descriptions of these mechanisms and the conditions responsible for the transition from homogeneous to heterogeneous deformation are provided.
Introduction Alloy 718 fracture mechanics specimens were fatigue tested in room temperature air and the fracture surface appearance was examined on a scanning electron microscope (SEM) to establish operative cracking mechanisms under various cyclic loading conditions. This information can also be used in post-failure analyses of cracked components to determine if cyclic loading is responsible for cracking and to estimate the magnitude of in-service loads.
Reference (1) characterized the fatigue fracture surface morphologies for Alloy 718 in various heat-treated conditions. A highly striated appearance was observed at intermediate AK levels, and a combination of striations and microvoids was observed at high AK levels. Microscopic fatigue crack propagation (FCP) rates based on striation spacing measurements agreed with macroscopic growth rates, demonstrating that striation formation controlled the fatigue behavior over a wide range of AK conditions. At high AK levels, heat-to-heat variations in FCP behavior were correlated with the density of 6 (orthorhombic Ni3Nb) precipitates, as a high density of 6 promoted microvoid coalescence and accelerated crack growth rates. At low AK levels, the dominant morphology was a cleavage-like, faceted appearance associated with crystallographic fracture along planar slip bands. For the conventional heat-treated (CHT) Alloy 718, the fatigue fracture surface appearance was independent of temperature from 24 to 538°C.
Although Reference (1) identified operative fatigue mechanisms, the loading conditions associated with a transition from one mechanism to another were not well established, and very little work was done in the ultra-low growth rate regime. Therefore, the objective of the current program was to fully characterize the fatigue fracture surface morphology for CHT Alloy 718 as a function of loading conditions. Emphasis was placed on determining cracking mechanisms at very low AK levels and identifying the exact loading conditions and crack growth rates corresponding to a transition from faceted growth to striation formation.
Material and Experimental Procedure Material
Testing was performed on specimens machined from a 50.8-mm rolled plate of Alloy 7 18 Heat 9-15241. Test specimens were subjected to a conventional heat treatment per ASTM B637 (annealed at 954°C and air cooled to room temperature, aged at 718OC for 8 hours, furnace cooled to 62 1°C, and aged at 62 1 OC for a total aging time of 18 hours) and were then aged at 482°C for an additional 80 hours to simulate stress relief operations.
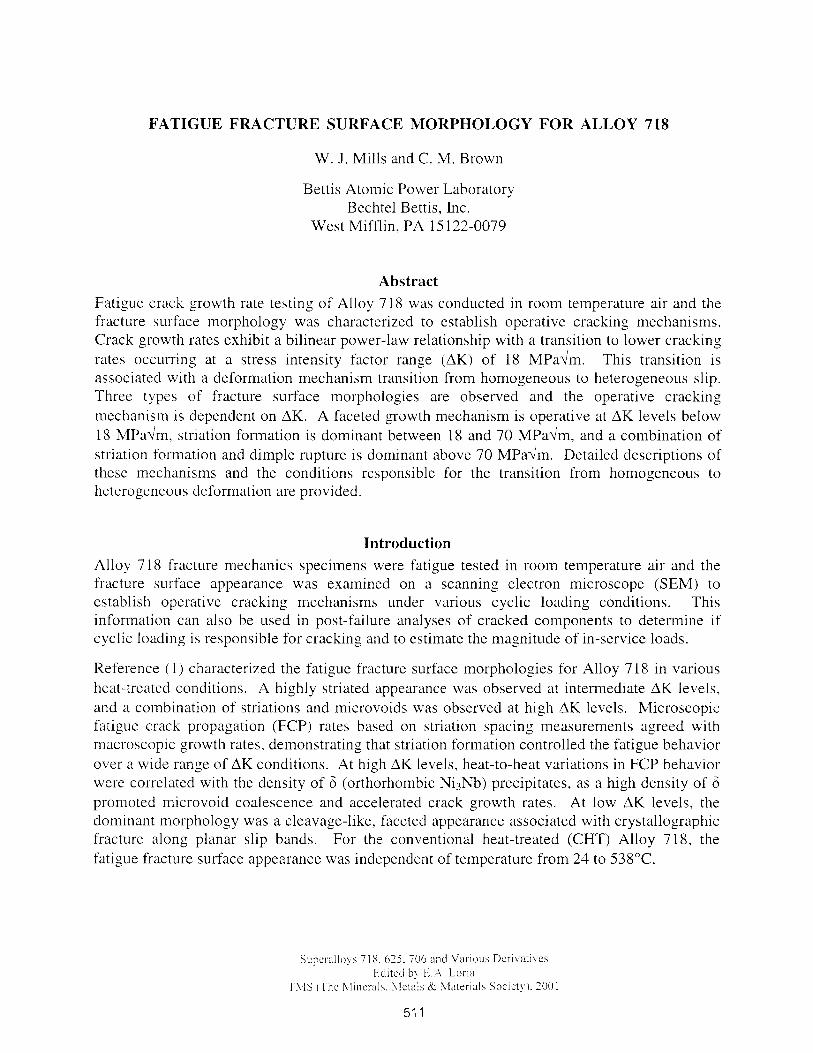
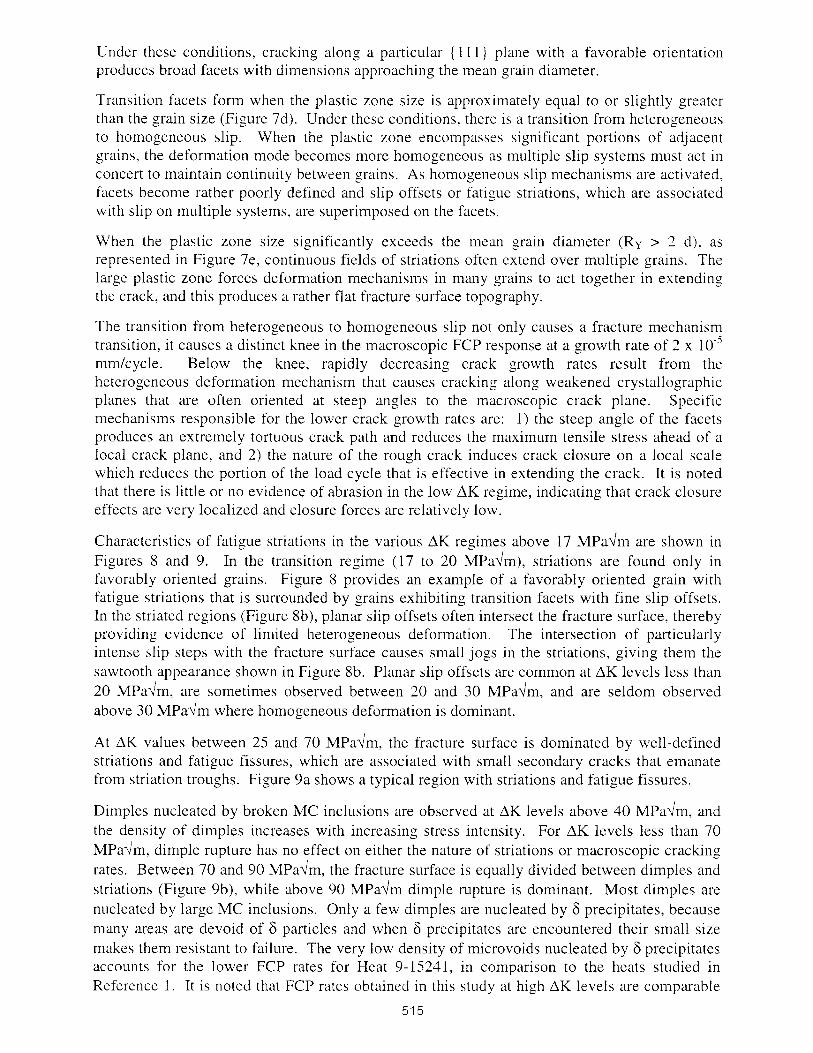
As shown in Figure 1, the plate has a duplex grain size with coarse grains near the outer surface and fine grains at the quarter-thickness and mid-thickness locations. The mean grain diameters (d) for the fine and coarse grain regions are 30 and 80 pm, respectively. This duplex structure is associated with a fully recrystallized structure in the center and a nonrecrystallized structure near the outside of the plate. During the final stages of hot working, the center of the plate remained hot enough to cause dynamic recrystallization, which resulted in a refined grain structure. Lower working temperatures near the surface precluded dynamic recrystallization, so the final microstructure reflects the grain size prior to recrystallization.
Figure 1 also shows the morphology of the coarse precipitates. Large primary MC-type carbides are observed throughout the plate, while 6 phase density is dependent on location. Coarse grain regions are devoid of 6 particles, whereas a relatively low density of lenticular 6 precipitates decorate some grain boundaries in the fine grain regions. This variability is also associated with the hot working process described above. The 6 phase tends to form during hot working at 900" to 1000"~.( ') The center of the plate was well within this range, thereby accounting for the observed 6. The outside regions were probably below 900°C, which accounts for the lack of 6 and the nonrecrystallized structure. Test specimens were taken from the outer portions of the plate, so they contained a duplex grain structure with approximately equal amounts of fine and coarse grain regions.
Fatigue Crack Growth Rate Testing and Fractographic Examinations
Fatigue testing of compact tension (CT) specimens with a width (W) of 50.8 mm and thickness (B) of 15 mm was performed in 24°C air using a feedback-controlled electrohydraulic test machine in load control. The stress ratio (R = minimum load + maximum load) was 0.1 and the cyclic frequency (f) was 10 and 30 Hz. Crack lengths were determined by the electric potential drop (EPD) method. The theoretical EPD correlation in Reference (3) was used to predict crack length. Note that although the actual EPD gage height was 0.55W, the assumed gage height in the theoretical correlation was 0.35W, per Reference (4) and test results obtained at Bettis. FCP rates (da/dN) were calculated using the "ASTM secant method" and K was calculated using the standard expression in ASTM E647. After testing was completed, broken specimen halves were examined on an SEM.
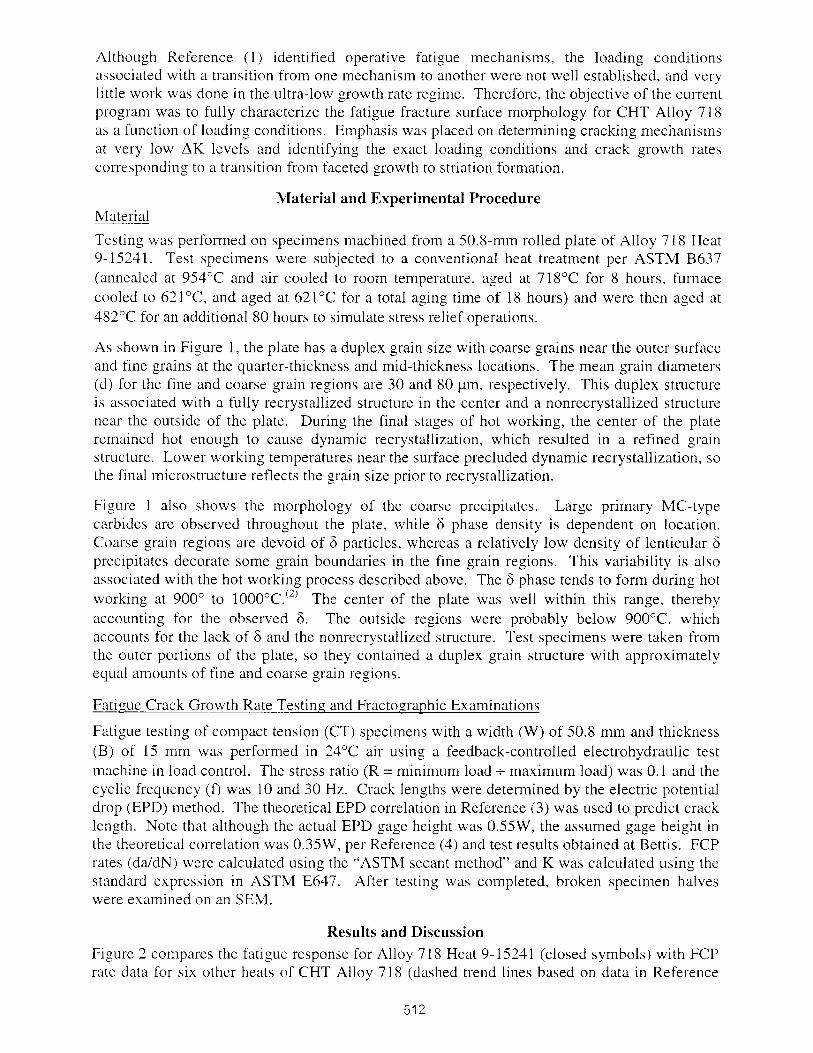
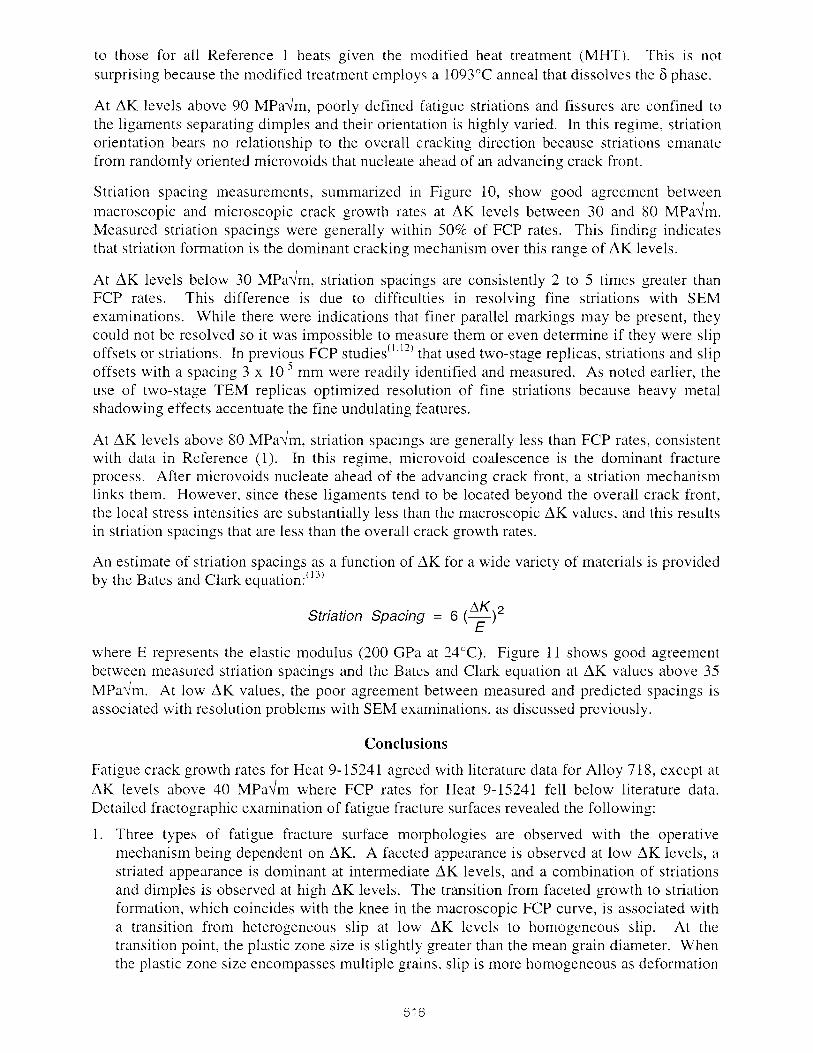
Results and Discussion Figure 2 compares the fatigue response for Alloy 7 18 Heat 9- 1524 1 (closed symbols) with FCP rate data for six other heats of CHT Alloy 718 (dashed trend lines based on data in Reference
1). It is seen that FCP rates for Heat 9-15241 are represented by a bilinear power-law relationship with a transition to lower crack growth rates at a AK of 18 M ~ a d m . Results at AK levels greater than 95 pa dm do not meet the ASTM validity requirements, so the crack growth response in this regime is represented by a dotted line.
At AK levels below 30 M ~ a d r n , FCP rates for Heat 9-15241 are seen to be very similar to the Reference 1 trend line for Heats B, C, E, F and G. Like the present data set, the trend line for these five heats shows a transition to decreasing crack growth rates at 18 ~ ~ a d m . (While the regression line in Reference 1 does not show the transition at 18 Mpadm, inspection of individual and combined data sets clearly shows this transition as the vast majority of data points below 18 dm fall below the regression curve.) Moreover, data for a 12.7-mm thick plate from Heat 2180-6-9457 (Specimen 2054 fabricated from Heat G in Reference 1) clearly show a knee in the fatigue curve at 18 ~ P a d m . In fact, the fatigue responses for Heats 9-1524 1 and 2 180-6-9457 are essentially identical at AK levels less than 40 Mpadm.
At AK levels above 40 M ~ a d m , FCP rates for Heat 9-15241 lie below those for the heats studied in Reference 1, including Heat G. This difference is attributed to a lower density of 6 precipitates in Heat 9-15241. Because 6 precipitates promote microvoid nucleation ahead of an advancing crack front, heats with greater amounts of 6 phase are susceptible to accelerated cracking. As a result, the Reference (1) heats, which possess intermediate and high 6 phase densities in comparison to Heat 9-15241, exhibit accelerated cracking in the high AK regime.
An unusually high density of 6 precipitates is responsible for the exceptionally high FCP rates exhibited by Heat A.") At AK levels above 40 MPadm, the upturn in FCP rates is associated with an exclusive microvoid coalescence mechanism. In this regime, microvoids form along the entire crack front due to a dense 6 phase network that serves as effective microvoid nucleation sites. The 6 network also causes microvoid nucleation at intermediate and low AK levels, which accounts for high crack growth rates at AK levels as low as 18 MPadm.
Although the current program evaluated cracking behavior in the near-threshold regime, the threshold AK level (AKTH) could not be determined in accordance with ASTM E647, because the coarse and fine grain regions displayed very uneven cracking at AK levels below 10 M ~ a d m . When AK dropped below 10 ~ P a d m , cracks in the coarse grain material stopped growing, whereas those in the fine grain material continued to propagate. These findings indicate that AKTH for coarse grain Alloy 718 is approximately 9 MPadm . while that for fine grain material is substantially lower. The observation that coarse grain structures tend to exhibit higher threshold values is consistent with literature data for nickel-base ~ u ~ e r a l l o ~ s . ~ ~ ~ ~ '
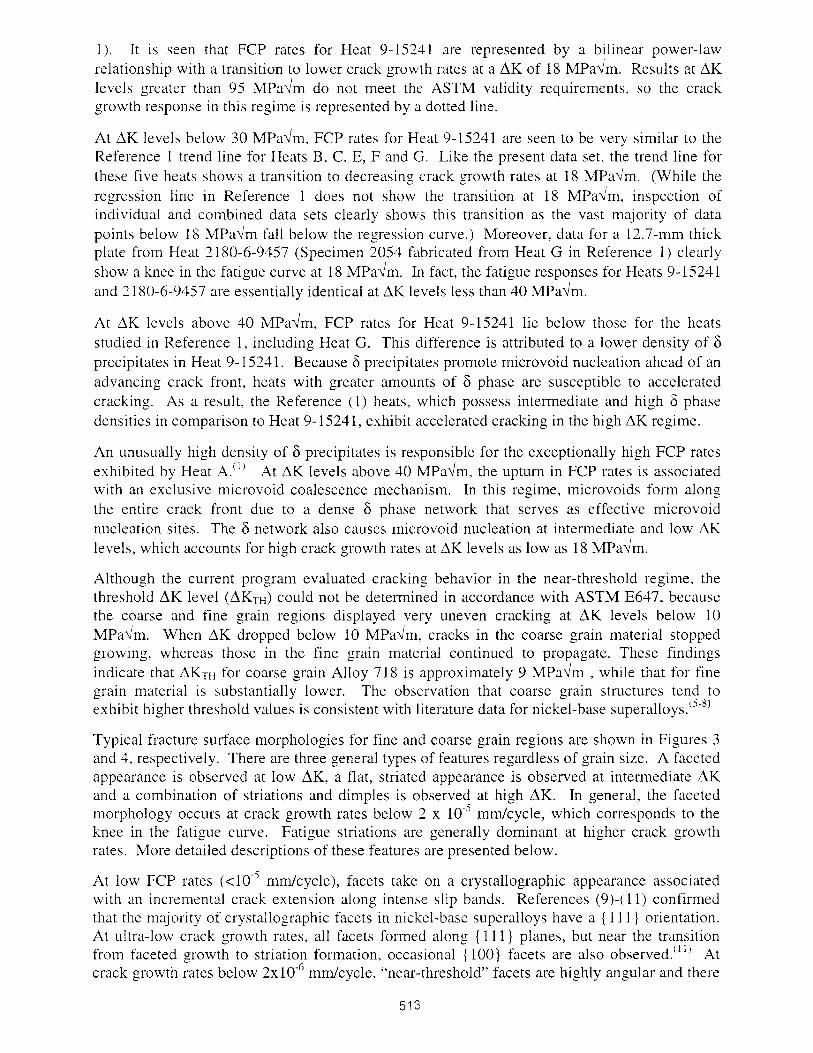
Typical fracture surface morphologies for fine and coarse grain regions are shown in Figures 3 and 4. respectively. There are three general types of features regardless of grain size. A faceted appearance is observed at low AK, a flat, striated appearance is observed at intermediate AK and a combination of striations and dimples is observed at high AK. In general, the faceted morphology occurs at crack growth rates below 2 x 1 0 ~ ~ m / c y c l e , which corresponds to the knee in the fatigue curve. Fatigue striations are generally dominant at higher crack growth rates. More detailed descriptions of these features are presented below.
At low FCP rates (<lo-' mdcycle) , facets take on a crystallographic appearance associated with an incremental crack extension along intense slip bands. References (9)-(11) confirmed that the majority of crystallographic facets in nickel-base superalloys have a { 11 1 } orientation. At ultra-low crack growth rates, all facets formed along { 11 1 ) planes, but near the transition from faceted growth to striation formation, occasional { 100) facets are also observed.'") At crack growth rates below 2x10 '~ mdcyc le , "near-threshold" facets are highly angular and there
are two populations of facet sizes (Figure 5). Relatively large facets are often surrounded by very small and highly angular facets. As crack growth rates increase slightly, the facets remain crystallographic, but they become broader. In this regime, the larger facets tend to reflect the grain size. Figures 5a and 5b illustrate the decreased density of small, highly angular facets and general broadening of facets that occurs with progressively increasing AK values.
At growth rates above 10.' mdcyc le , facets become rather long and narrow (Figure 6) and are termed "transition" facets because they are associated with a transition from crystallographic facets to striations. Parallel fracture markings, associated with fatigue striations, slip offsets and tiny facets, are often superimposed on transition facets. In many areas, the detailed morphology of the fine parallel markings could not be resolved in the SEM, whereas they were readily resolved in previous transmission electron microcopy (TEM) studies of two-stage replicas.( ' , "' The difference in resolution capabilities results from the replica preparation method. rather than the resolution capabilities of the two electron microscopes. Heavy metal shadowing of the replica, which reveals the fracture topography, accentuates the small undulations associated with the parallel fracture markings and thereby enhances resolution capabilities. Hence, shadowing effects are responsible for the observation that fine slip offsets and striations are more readily found and more accurately sized in TEM replica studies.
The primary differences in fracture surface morphology between the fine and coarse grain regions are observed at low AK, where microstmctural features tend to have the greatest effect.@' The sharp, crystallographic facets and long, narrow facets are somewhat larger in the coarse grain region, as demonstrated by comparing the facet sizes in Figures 3 versus 4 and 6a versus 6b. Inspection of the facets reveals that their size is proportional to the grain size. Dimensions of the larger near-threshold facets are about one-half to three-quarters of the mean grain diameter, while the size of the broad crystallographic facets is comparable to or slightly smaller than the mean grain diameter. The length of the transition facets is approximately equal to the mean grain diameter, whereas their width is substantially smaller.
The transition from crystallographic faceting to a non-faceted, striation mechanism correlates reasonably well with the plastic zone size-to-grain diameter ratio. This is shown in Table 1 which summarizes KMAX levels and estimated plastic zone sizes where the various cracking mechanisms are operative. As expected, the cracking mechanism transition occurs at lower KMAX levels and smaller plastic zone sizes in the fine grain material, which supports the hypothesis that the plastic zone size-to-grain diameter ratio controls the operative mechanism. The overall transition from faceting to striations, as well as the knee in the macroscopic crack growth rate behavior (-2 x lo-' mdcycle) , occur when the plastic zone size and mean grain diameter are comparable. When the plastic zone size encompasses multiple grains, a striation formation mechanism is dominant.
The relationship between plastic zone size (RY) and grain size is shown schematically in Figure 7. At low AK levels, planar slip produces extensive crystallographic faceting. When the plastic zone is substantially smaller than the mean grain diameter (i.e., Ry < Y2 d), a heterogeneous deformation mode causes highly angular facets with a duplex size. Small facets form when the plastic zone interacts with grain boundaries (Figure 7a). Although the nature of deformation is very heterogeneous, slip must occur on multiple slip systems to maintain continuity between adjacent grains. Localized failure along these slip bands produces small, angular facets. When the plastic zone is contained inside a grain (Figure 7b), deformation characteristics are similar to those for a single crystal, whereby extensive planar slip occurs along a single slip band. This produces relatively large facets whose overall dimensions are about half of the mean grain diameter. As AK increases and the plastic zone size approaches the grain size (Ry = 34 d), represented by Figure 7c, heterogeneous slip systems throughout the entire grain act in concert.
Under these conditions, cracking along a particular { 11 1 } plane with a favorable orientation produces broad facets with dimensions approaching the mean grain diameter.
Transition facets form when the plastic zone size is approximately equal to or slightly greater than the grain size (Figure 7d). Under these conditions, there is a transition from heterogeneous to homogeneous slip. When the plastic zone encompasses significant portions of adjacent grains, the deformation mode becomes more homogeneous as multiple slip systems must act in concert to maintain continuity between grains. As homogeneous slip mechanisms are activated, facets become rather poorly defined and slip offsets or fatigue striations, which are associated with slip on multiple systems, are superimposed on the facets.
When the plastic zone size significantly exceeds the mean grain diameter (Ry > 2 d). as represented in Figure 7e, continuous fields of striations often extend over multiple grains. The large plastic zone forces deformation mechanisms in many grains to act together in extending the crack, and this produces a rather flat fracture surface topography.
The transition from heterogeneous to homogeneous slip not only causes a fracture mechanism transition, it causes a distinct knee in the macroscopic FCP response at a growth rate of 2 x 10." mrnlcycle. Below the knee, rapidly decreasing crack growth rates result from the heterogeneous deformation mechanism that causes cracking along weakened crystallographic planes that are often oriented at steep angles to the macroscopic crack plane. Specific mechanisms responsible for the lower crack growth rates are: 1) the steep angle of the facets produces an extremely tortuous crack path and reduces the maximum tensile stress ahead of a local crack plane, and 2) the nature of the rough crack induces crack closure on a local scale which reduces the portion of the load cycle that is effective in extending the crack. It is noted that there is little or no evidence of abrasion in the low AK regime, indicating that crack closure effects are very localized and closure forces are relatively low.
Characteristics of fatigue striations in the various AK regimes above 17 MPadm are shown in Figures 8 and 9. In the transition regime (17 to 20 M ~ a d m ) , striations are found only in favorably oriented grains. Figure 8 provides an example of a favorably oriented grain with fatigue striations that is surrounded by grains exhibiting transition facets with fine slip offsets. In the striated regions (Figure 8b), planar slip offsets often intersect the fracture surface, thereby providing evidence of limited heterogeneous deformation. The intersection of particularly intense slip steps with the fracture surface causes small jogs in the striations, giving them the sawtooth appearance shown in Figure 8b. Planar slip offsets are common at AK levels less than 20 M ~ a d m , are sometimes observed between 20 and 30 Mpadm, and are seldom observed above 30 MPadm where homogeneous deformation is dominant.
At AK values between 25 and 70 MPadm, the fracture surface is dominated by well-defined striations and fatigue fissures, which are associated with small secondary cracks that emanate from striation troughs. Figure 9a shows a typical region with striations and fatigue fissures.
Dimples nucleated by broken MC inclusions are observed at AK levels above 40 MPadm, and the density of dimples increases with increasing stress intensity. For AK levels less than 70 Mpadm, dimple rupture has no effect on either the nature of striations or macroscopic cracking rates. Between 70 and 90 ~ P a d m , the fracture surface is equally divided between dimples and striations (Figure 9b), while above 90 MPadm dimple rupture is dominant. Most dimples are nucleated by large MC inclusions. Only a few dimples are nucleated by 6 precipitates, because many areas are devoid of 6 particles and when 6 precipitates are encountered their small size makes them resistant to failure. The very low density of microvoids nucleated by 6 precipitates accounts for the lower FCP rates for Heat 9-15241, in comparison to the heats studied in Reference 1 . It is noted that FCP rates obtained in this study at high AK levels are comparable
51 5
to those for all Reference 1 heats given the modified heat treatment (MHT). This is not surprising because the modified treatment employs a 1093°C anneal that dissolves the 6 phase.
At AK levels above 90 M ~ a d m , poorly defined fatigue striations and fissures are confined to the ligaments separating dimples and their orientation is highly varied. In this regime, striation orientation bears no relationship to the overall cracking direction because striations emanate from randomly oriented microvoids that nucleate ahead of an advancing crack front.
Striation spacing measurements, summarized in Figure 10, show good agreement between macroscopic and microscopic crack growth rates at AK levels between 30 and 80 MPadm. Measured striation spacings were generally within 50% of FCP rates. This finding indicates that striation formation is the dominant cracking mechanism over this range of AK levels.
At AK levels below 30 ~ P a d m , striation spacings are consistently 2 to 5 times greater than FCP rates. This difference is due to difficulties in resolving fine striations with SEM examinations. While there were indications that finer parallel markings may be present, they could not be resolved so it was impossible to measure them or even determine if they were slip offsets or striations. In previous FCP studies","' that used two-stage replicas, striations and slip offsets with a spacing 3 x mm were readily identified and measured. As noted earlier, the use of two-stage TEM replicas optimized resolution of fine striations because heavy metal shadowing effects accentuate the fine undulating features.
At AK levels above 80 ~ P a d m , striation spacings are generally less than FCP rates, consistent with data in Reference (I). In this regime, microvoid coalescence is the dominant fracture process. After microvoids nucleate ahead of the advancing crack front, a striation mechanism links them. However, since these ligaments tend to be located beyond the overall crack front, the local stress intensities are substantially less than the macroscopic AK values, and this results in striation spacings that are less than the overall crack growth rates.
An estimate of striation spacings as a function of AK for a wide variety of materials is provided by the Bates and Clark equation:'")
AK 2 Striation Spacing = 6 (-) E
where E represents the elastic modulus (200 GPa at 24°C). Figure 11 shows good agreement between measured striation spacings and the Bates and Clark equation at AK values above 35 ~ P a d m . At low AK values, the poor agreement between measured and predicted spacings is associated with resolution problems with SEM examinations, as discussed previously.
Conclusions
Fatigue crack growth rates for Heat 9-15241 agreed with literature data for Alloy 718, except at AK levels above 40 ~ ~ a d m where FCP rates for Heat 9-15241 fell below literature data. Detailed fractographic examination of fatigue fracture surfaces revealed the following:
Three types of fatigue fracture surface morphologies are observed with the operative mechanism being dependent on AK. A faceted appearance is observed at low AK levels, a striated appearance is dominant at intermediate AK levels, and a combination of striations and dimples is observed at high AK levels. The transition from faceted growth to striation formation, which coincides with the knee in the macroscopic FCP curve, is associated with a transition from heterogeneous slip at low AK levels to homogeneous slip. At the transition point, the plastic zone size is slightly greater than the mean grain diameter. When the plastic zone size encompasses multiple grains, slip is more homogeneous as deformation
mechanisms in many grains must act in concert to extend the crack. This produces a flat fracture surface topography that is highly striated.
The nature of the facets is dependent on stress intensity. Under near-threshold conditions (<I5 ~ P a d m ) , facets have a crisp crystallographic appearance. When the plastic zone is smaller than the mean grain diameter, local failure along planar slip bands produces a highly faceted morphology. At progressively higher AK values (15-20 ~ P a u ' m ) , where the plastic zone size is approximately equal to the grain size, more homogeneous slip mechanisms become active and the resulting ill-defined "transition" facets have slip offsets or fatigue striations superimposed on them.
At AK levels between 25 and 90 ~ ~ a u ' m , well-defined fatigue striations dominate the fracture surface. Dimples are also observed, but they have relatively little effect on cracking behavior below 70 E pa dm as they tend to form when the advancing crack front reaches microvoid nucleation sites. At high AK levels (>90 ~ P a d m ) , dimple rupture is dominant and poorly defined striations are confined to the ligaments between the dimples.
FCP rates at intermediate and high AK levels correlate with the size and density of 6 precipitates. In this regime, 6 particles accelerate cracking beca~lse they promote microvoid nucleation ahead of the advancing crack front. In Heat 9-15241, however, many areas are devoid of 6 and where 6 is observed the particles are small so they are not effective microvoid nucleation sites. This accounts for the lower FCP rates exhibited by this heat at AK levels above 40 ~ P a d m .
At AK levels between 30 and 80 ~ P a d m , measured striation spacings agree with FCP rates. At higher stress intensities, where dimple rupture is dominant, striation spacings are generally less than FCP rates. Striation spacing is limited because local stress intensities within the ligaments between dimples are less than macroscopic AK values.
At AK levels less than 30 ksidin, striation spacings are 2 to 5 times greater than FCP rates, which contrasts with previous TEM results for two-stage replicas where average striation spacings agreed with FCP rates. In this study, the difference between microscopic and macroscopic FCP rates is due to difficulties in resolving fine striations with the SEM. Hence, only striations formed under optimum conditions are identified and measured, thereby accounting for the observed bias. The difference in resolution capabilities is due to the nature of two-stage replicas, rather than the capabilities of the two electron microscopes. Heavy metal shadowing of replicas, which reveals the fracture surface topography, accentuates the small undulations associated with fine striations. Therefore, shadowing effects are responsible for the superior resolution capabilities in TEM replica studies.
Acknowledgement
This work was performed under U.S. Department of Energy Contract DE-ACll-98PN38206 with Bettis Atomic Power Laboratory.
References 1. L. A. James and W. J. Mills, Engineering Fracture Mec!zanics, 22, 1985, pp. 797-817. 2. Armida Oradei-Basile and J. F. Radavich, Superalloys 718, 625 and Various Derivatives,
Edited by E. A. Loria, TMS, 1991, pp. 325-335. 3. K. H. Schwalbe and D. Hellmann, Journal of Testing and Evaluation, 9, 198 1, pp. 2 18-22 1. 4. J. K. Donald and J. Ruschau, Fatigue Crack Measurement: Techniques and Applications,
Edited by K. J. Marsh, R. 0. Richie and R. A. Smith, EMAS, 1991. 5 . S. D. Antolovich and N. Jayaraman, Fatigue: Environment and Tenperatlire Effects, Edited
by J. J . Burke and V. Weiss, Plenum, New York, 1983, pp. 119-144. 6. R. A. Venables, M. A. Hicks and J. E. King. Fatigue Crack Growth Threshold Concepts,
Edited by D. Davidson and S. Suresh, TMS, Warrendale, PA, 1984, pp. 341-357. 51 7
7. C . J. Beevers, K. Bell and R. L. Carlson, Fatigue Crack Growth Ttzreslzold Concepts, Edited by D. Davidson and S. Suresh, TMS, Warrendale, PA, 1984, pp. 327-340.
8. J. E. King. Materials Science and Teciznnlogy, 83, 1987, pp. 750-764. 9. D. J. Duquette and M. Gell, Metallcirgical Trrr~zsactions, 2, 197 1, pp. 1325- 133 1. 10. M. Gell and G. R. Leverant, Acta Met., 16, 1968, pp. 553-561. 1 I . J . E. King, Fc~tigue of Engineering Materials and Strz~ctures, 4, 198 1 . pp. 3 11-320. 12. R. W. Hertzberg and W. J. Mills, Frrlctogr~qdzy - Microscopic Cracking Processes, ASTM
STP 600, 1976, pp. 220-234. 13. R. C. Bates and W. G. Clark, Jr., Trmsactions Quarterly, ASM, 62, 1969, pp. 380-389.
Figure 1 . Representative micrograph^. (a) Coarse grain structure near outer surface of plate with MC- type inclusions, but no evidence of 6. (b) Fine grain structure at quarter-thickness location of plate contained MC-type inclusions and lenticular 6 on some grain boundaries.
Heats 8, C. E, F, G R=0.05, 8 < f < 1 0 H z
:& CHT Alloy 718 A Tested in 24°C Air
10.' A ,
10 50 100 AK, MPaJm
Figure 2. Comparison of FCP rate> for Heat 9-15241 with data and trend lines for six other heats. 7 he dotted line beyond 95 ~ ~ a t ' m indicates that data did not meet ASTM validity requirements.
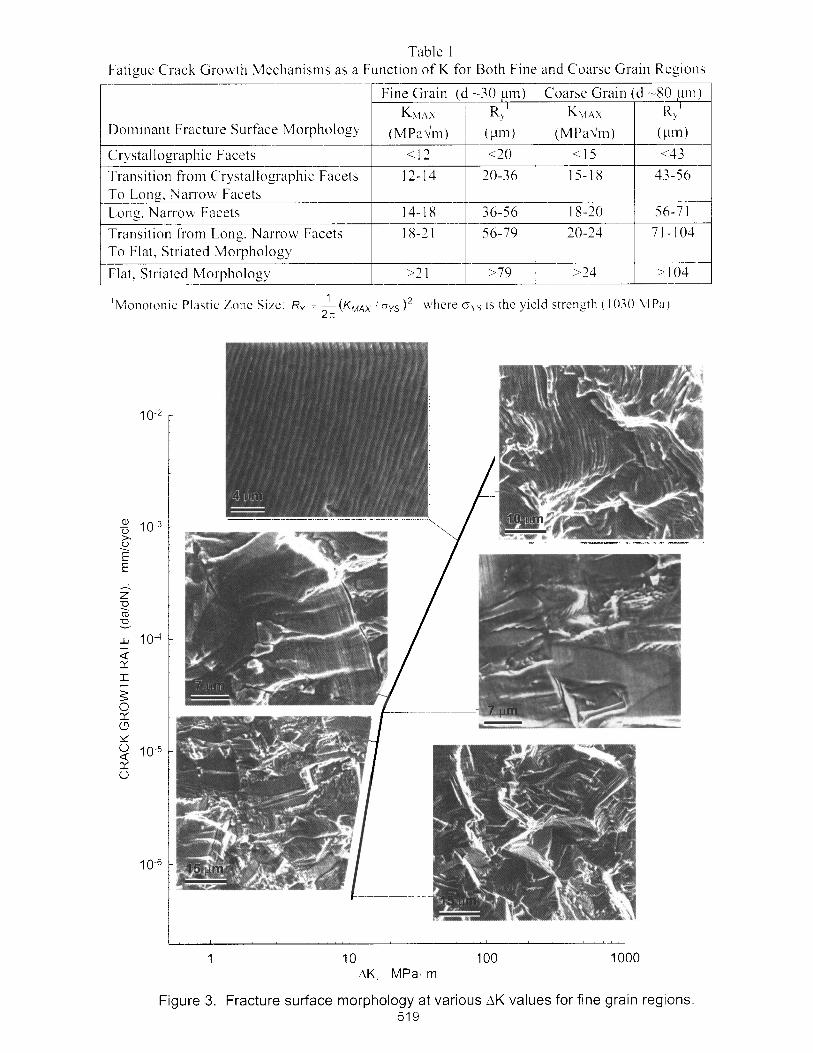
Table 1 t a t i g ~ e ('rack GSOM th Mechanisms as a Functlon of K for Both Fine and Coarse Grain Reg~ons
1 ' ~ o n o t o n ~ c Plast~c Zone S ~ z e . Ry = ( K ~ ~ ~ I oYS)* where o, 15 the yicld strength ( 1010 MPa)
Domlnant Fracture Surface Morphology
Crystallograph~c Facets T r a n s ~ t ~ o n from Crystallograph~c Facets To Long, Nan-ow Facets Long, Nan-ow Facets Tranvt~on fro111 Long, ~arrow>&xts To Flat, Stslated Morphology
Flat. Striated Morphology
Figure 3. Fracture surface morphology at various AK values for fine grain regions. 51 9
(MPavm) <I2
12-14
--
14-18 18-2 1
>2 1
( )
4 0 20-36
36-56 56-79
>79
(MPa\m)
(15 15-18
1 8-20 20-24
--
>24
( CL111)
<43 33-56
56-7 1 71-104
' 104
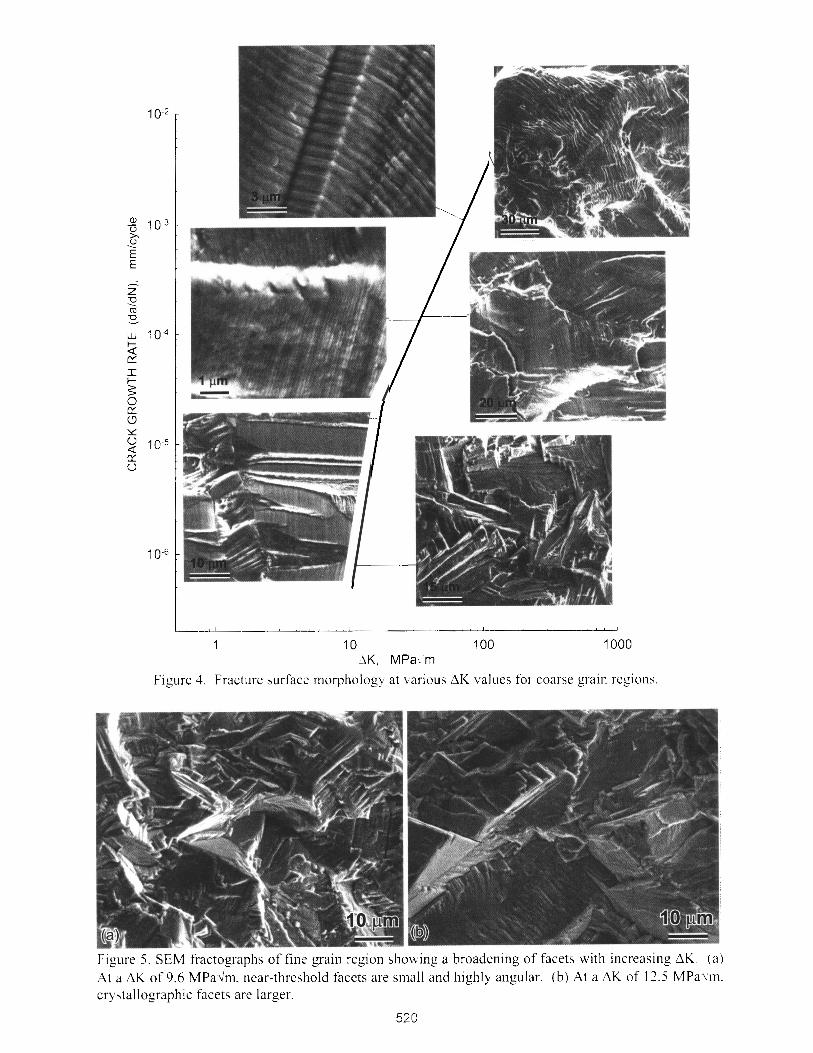
Figure 4 Fracture surface nlorphology at various AK values for coarse grain regions
Figure 5. SEM fractographs of fine grain region showing a broadening of facets with increasing AK (a) At a AK of 9.6 ~ ~ a d m . near-threshold facets are small and highly angular. (b) At a AK of 12.5 MPatin. crystallographic facets are larger,
520
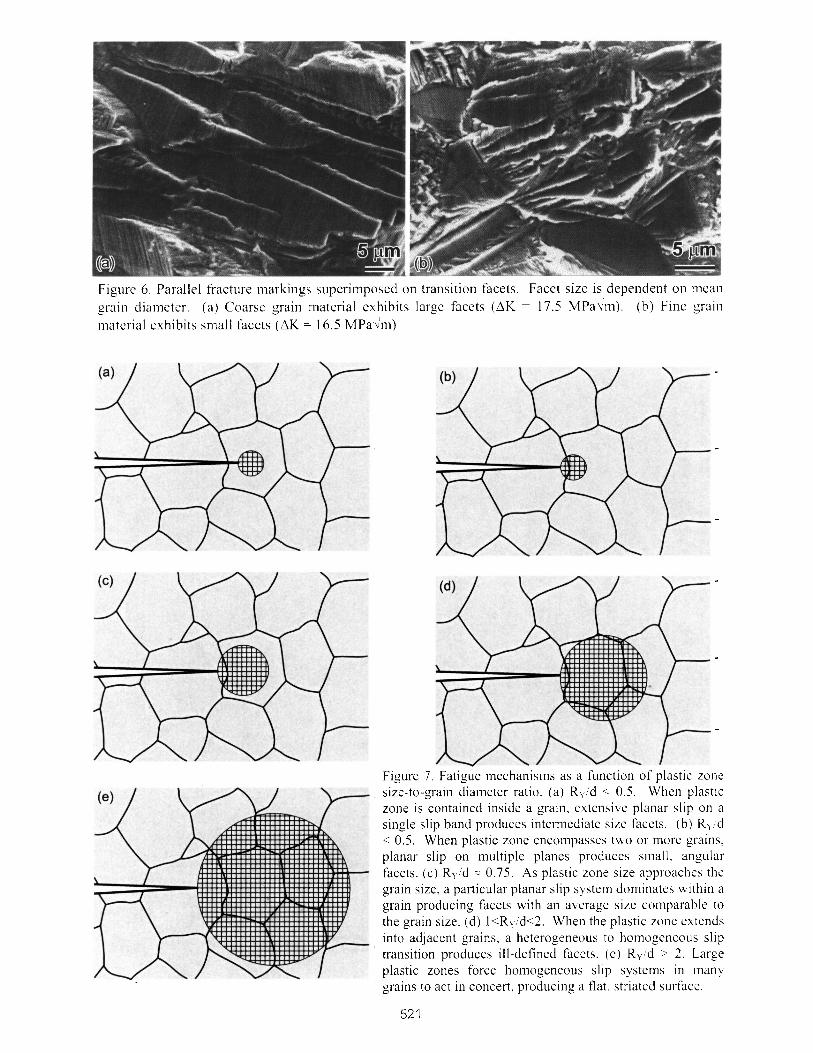
Figure 6. Parallel fracture markings superimposed on transition facets. Facet size is dependent on mean grain diameter. (a) Coarse grain material exhibits large facets (AK = 17.5 MPav1m) (b) Fine grain mater~al exhibits small facets (AK = 16.5 ~ ~ a v ' r n )
Figure 7 , Fatigue ~nechanisrns as a function of plastic zone size-to-grain diameter ratio. (a) R,/d < 0.5. When plastic zone is contained inside a grain. extensive planar slip on a single slip band produces intenmediate sizc facets. (b) R, d < 0.5. When plastic zone encompasses two or more grains. planar slip on multiple planes produces small. angular facets. (c) R,,id = 0.75. As plastic zone size approaches the grain size. a particular planar slip system dominates within a grain producing facets with an averagc sizc co~nparable to the grain size. (d) l<R,.id<Z. When the plastic zone extends into adjacent grains, a heterogeneous to ho~nogcncous slip transition produces ill-defined facets. (e) RY;d '- 2. Large plastic zones force homogeneous slip systems in many grains to act in concert, producing a flat. striated surface.
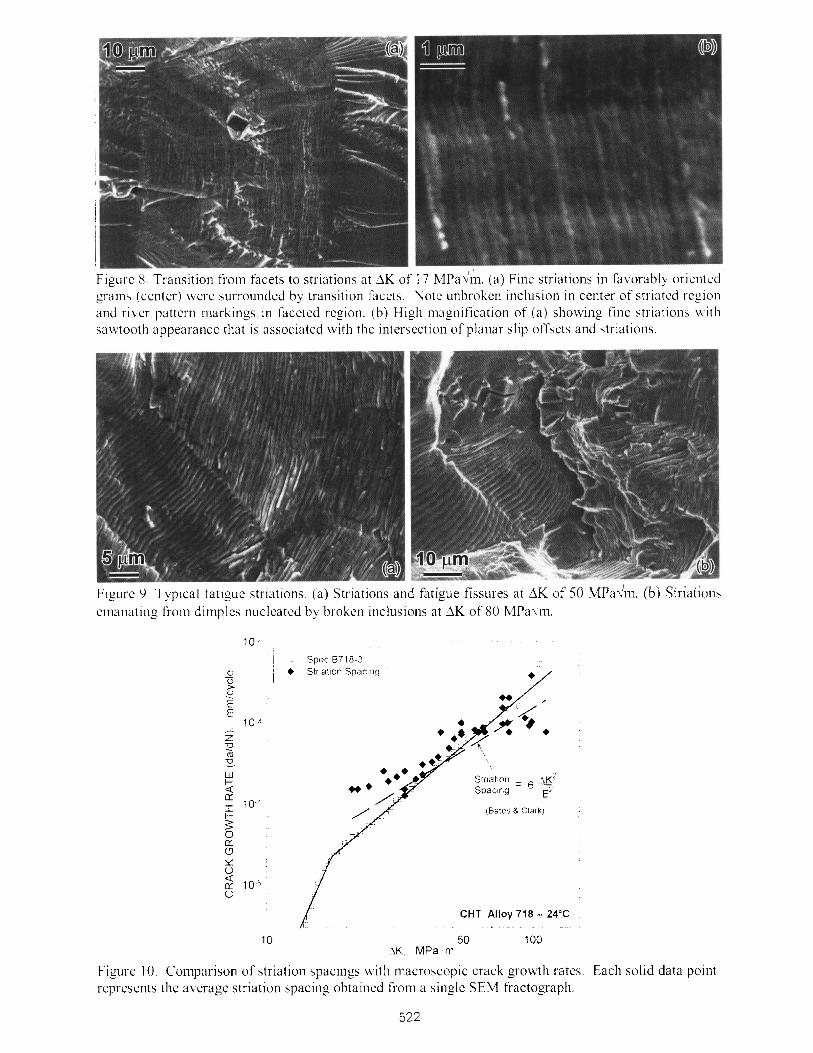
Figurc 8. Transition horn facets to striations at AK of 17 M P ~ V ~ I . (a) Fine striations in favorably oriented grains (ccntcr) were surrounded by transition facets. Note unbroken inclusion in center of striated region and ri\ cr pattern markings in faceted region. (b) High magnification of (a) showing fine striations ~ \ ~ i t h sawtooth appearance that is associated with the intersection of planar slip offsets and striations.
Figure 9 Typical fatigue striations ( a ) Striations and fatigue fissures at AK of 50 MP~<III . ( b ) Striations clnanatirlg from dimples nucleated by broken inclusions at AK of 80 MPa\/m.
I Spec 8718.3
[Bales 8 Clark)
CHT Alloy 718 -- 24°C
50 100 \K MPa m
Figure 10. Comparison of striation spaclngs m.it11 macroscopic crack growth rates. Each solid data point represents the average striation spacing obtained from a single SEM fractograph.


![Bettis Electric Actuators. [File Name or Event] Emerson Confidential 27-Jun-01, Slide 2 Overview: Bettis electric actuators It is the traditional “EIM”](https://img.pdfslide.us/doc/110x75/56649d0a5503460f949dcc96/bettis-electric-actuators-file-name-or-event-emerson-confidential-27-jun-01.jpg)