Embed Size (px)
Citation preview

FATIGUE CRACKING
Robert L. LyttonCRACKING IN ASPHALT PAVEMENTS
PAVEMENT PERFORMANCE PREDICTION SYMPOSIUM 2007
WESTERN RESEARCH INSTITUTELARAMIE, WYOMING
JULY 18 – 20, 2007

FATIGUE CRACKING
FATIGUETHERMALLOAD- BOTTOM – UP- TOP – DOWN
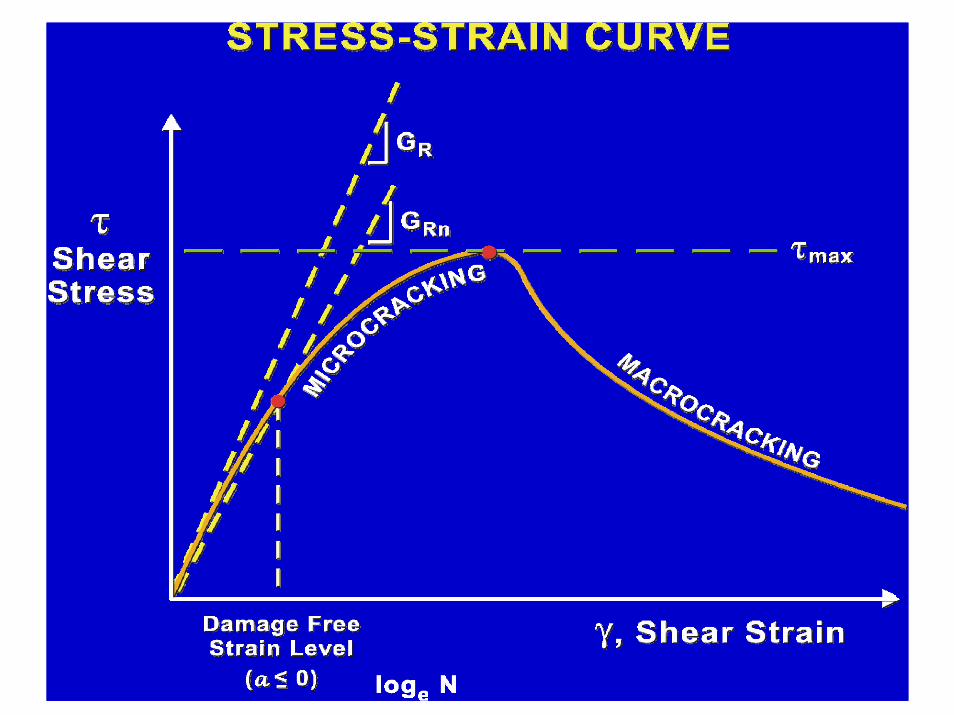
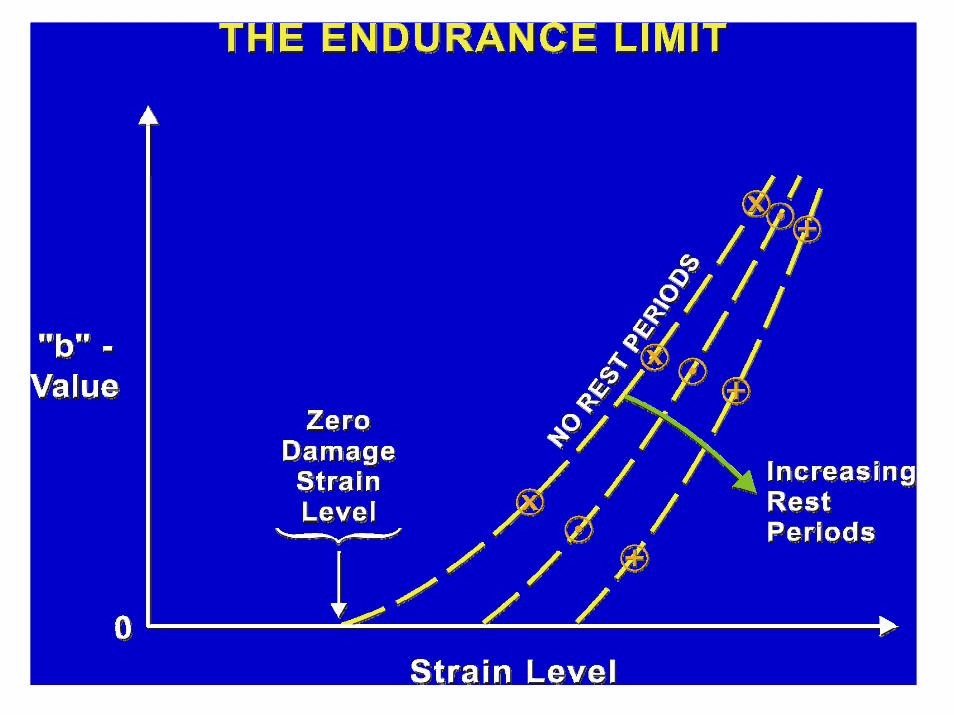
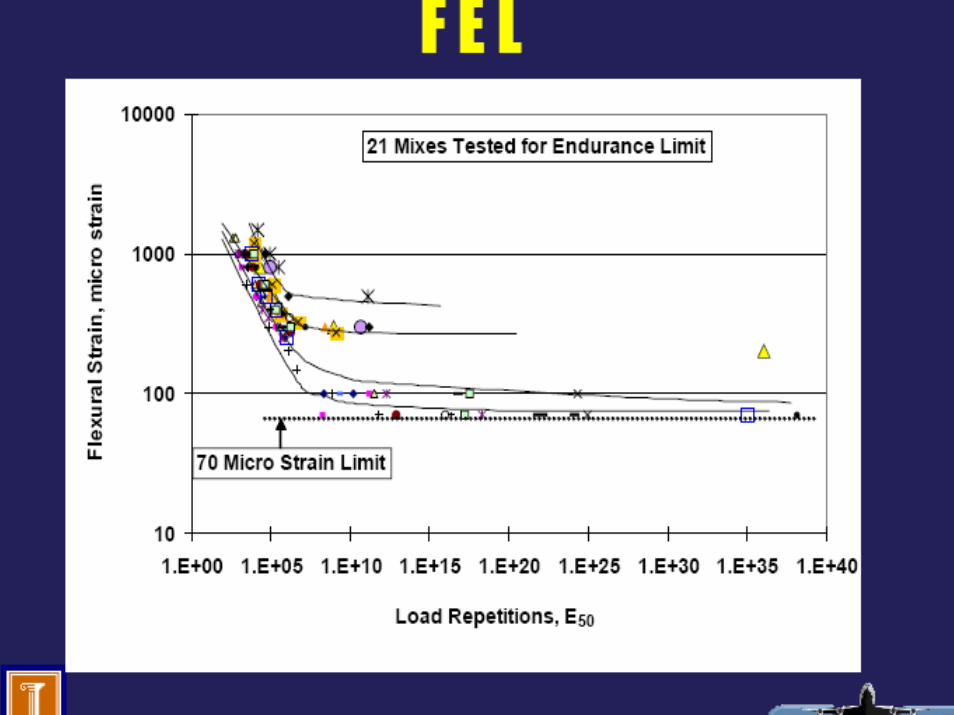
STAGES IN LOAD FATIGUEMICROCRACKINGMACROCRACKINGLAB-TO-FIELD SHIFT FACTORSENDURANCE LIMIT
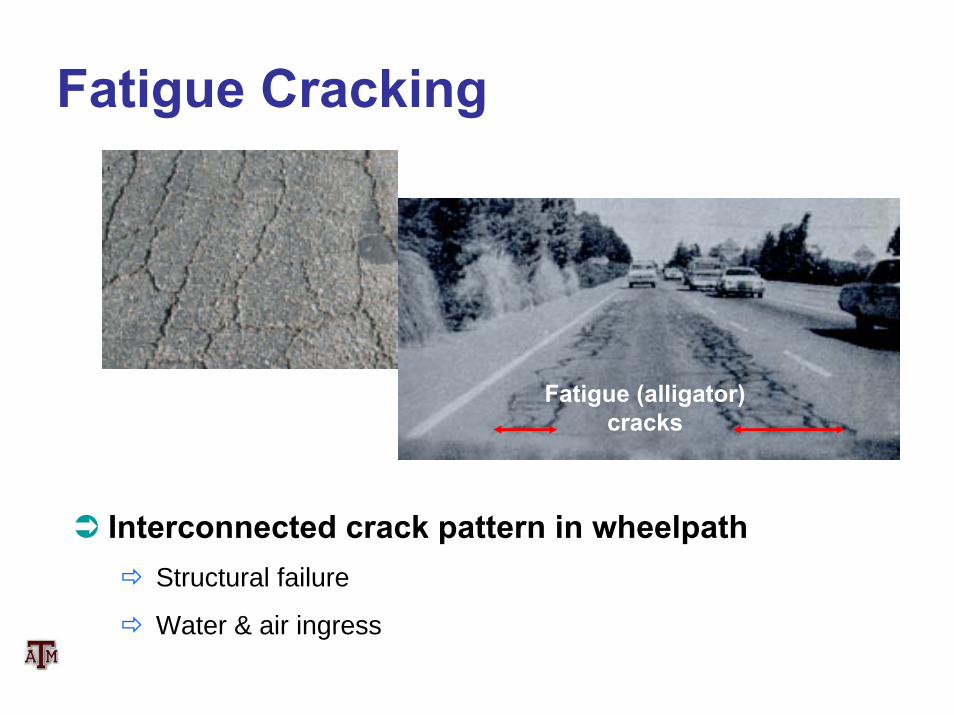
Fatigue Cracking
Interconnected crack pattern in wheelpathStructural failure
Water & air ingress
Fatigue (alligator) cracks
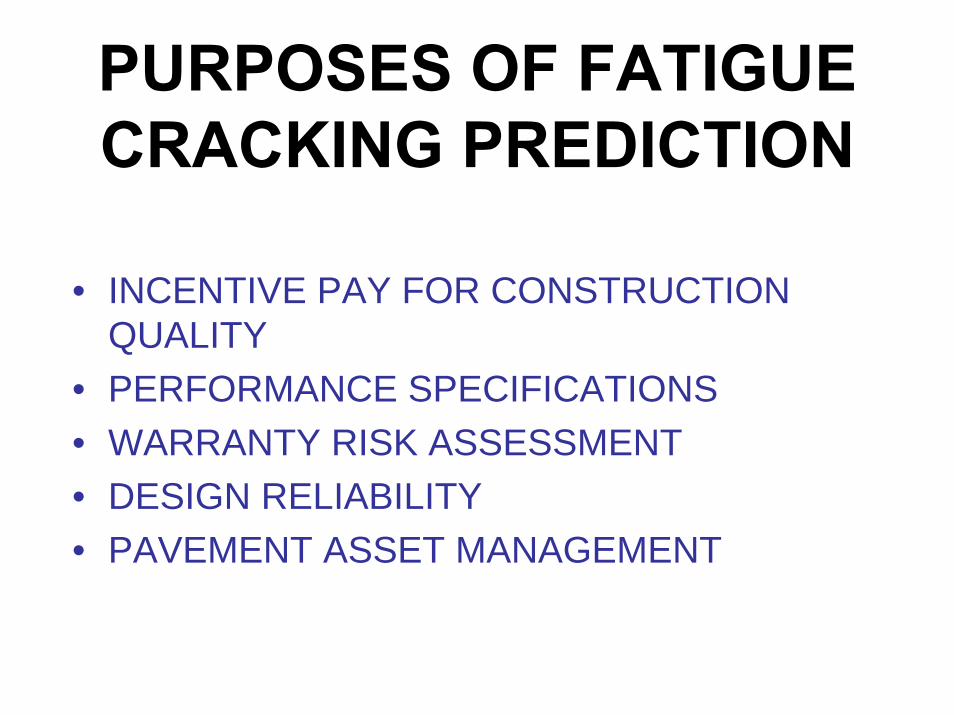
PURPOSES OF FATIGUE CRACKING PREDICTION
• INCENTIVE PAY FOR CONSTRUCTION QUALITY
• PERFORMANCE SPECIFICATIONS• WARRANTY RISK ASSESSMENT• DESIGN RELIABILITY• PAVEMENT ASSET MANAGEMENT
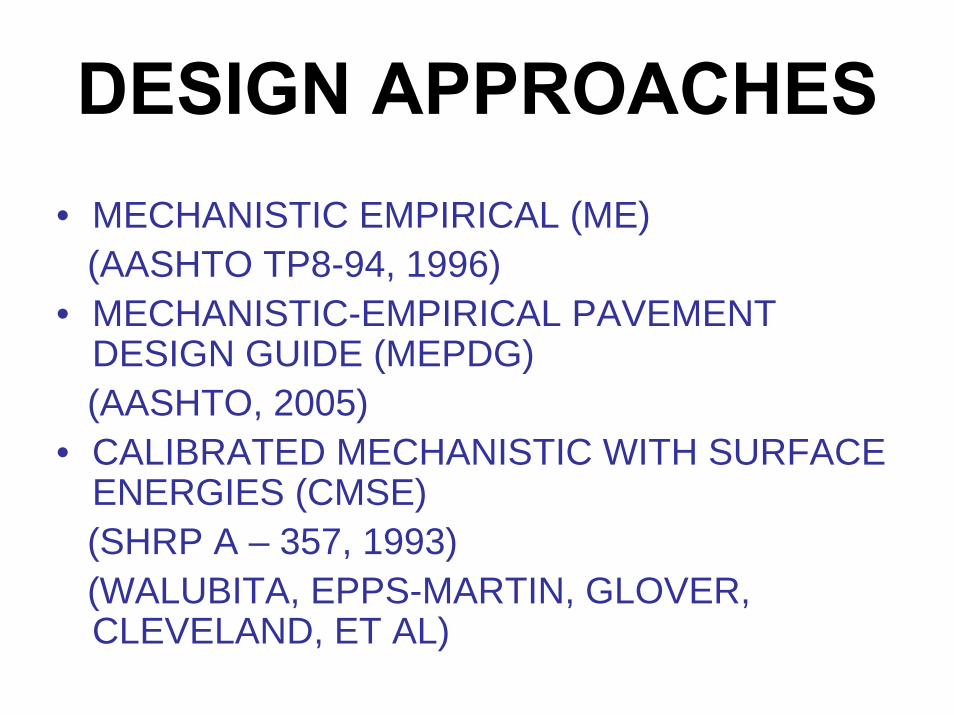
DESIGN APPROACHES• MECHANISTIC EMPIRICAL (ME)
(AASHTO TP8-94, 1996)• MECHANISTIC-EMPIRICAL PAVEMENT
DESIGN GUIDE (MEPDG)(AASHTO, 2005)
• CALIBRATED MECHANISTIC WITH SURFACE ENERGIES (CMSE)(SHRP A – 357, 1993)(WALUBITA, EPPS-MARTIN, GLOVER, CLEVELAND, ET AL)
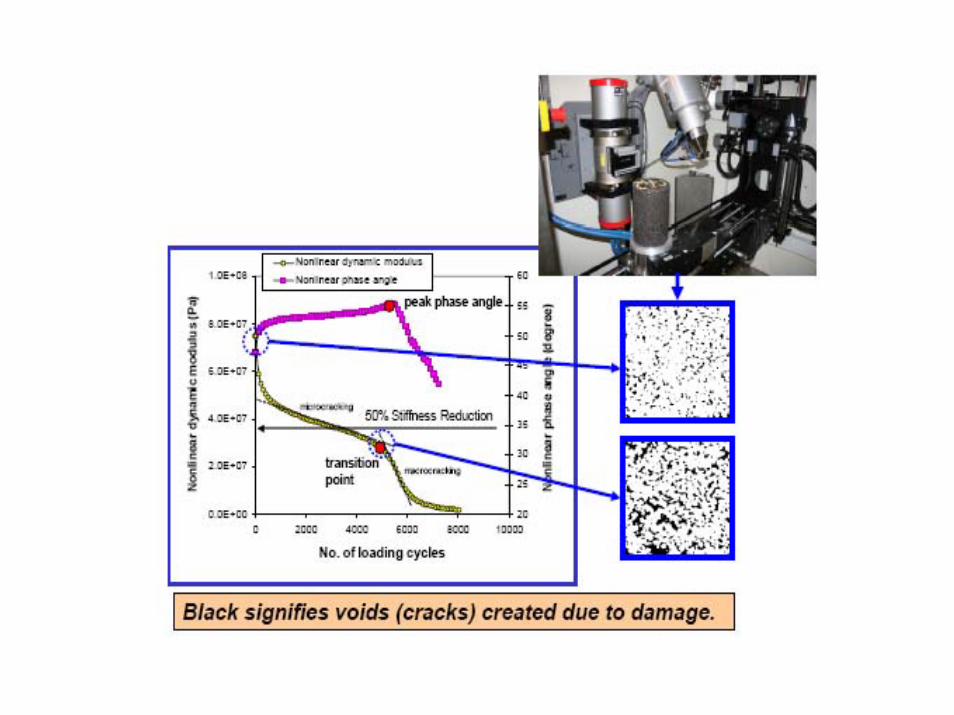
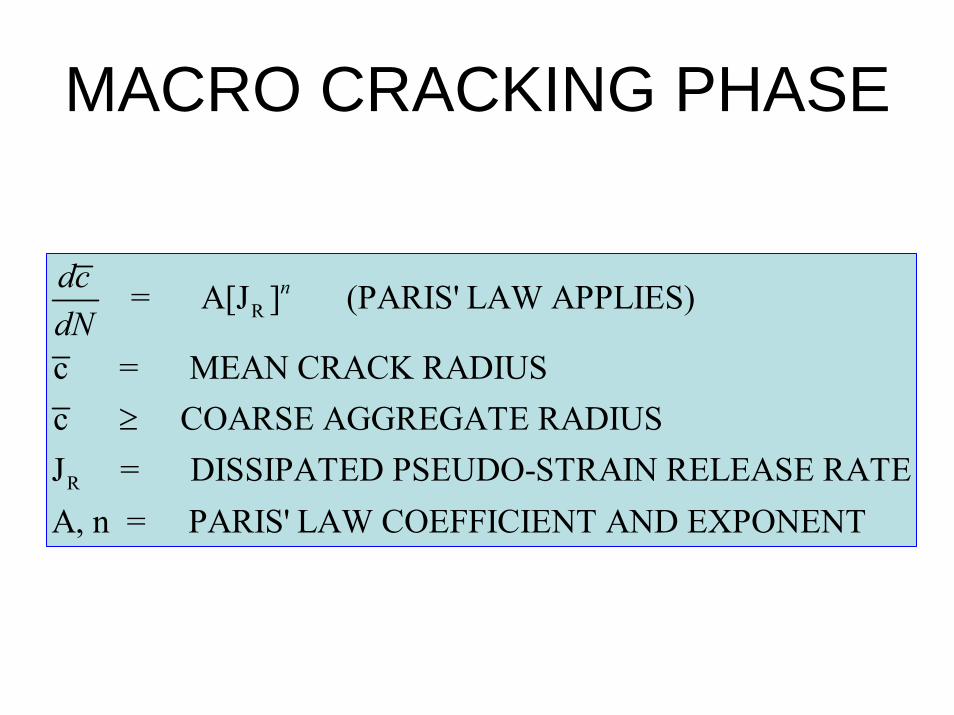
MACRO CRACKING PHASE
R
R
= A[J ] (PARIS' LAW APPLIES)
c = MEAN CRACK RADIUSc COARSE AGGREGATE RADIUSJ = DISSIPATED PSEUDO-STRAIN RELEASE RATEA, n = PARIS' LAW COEFFICIENT AND
ndcdN
≥
EXPONENT
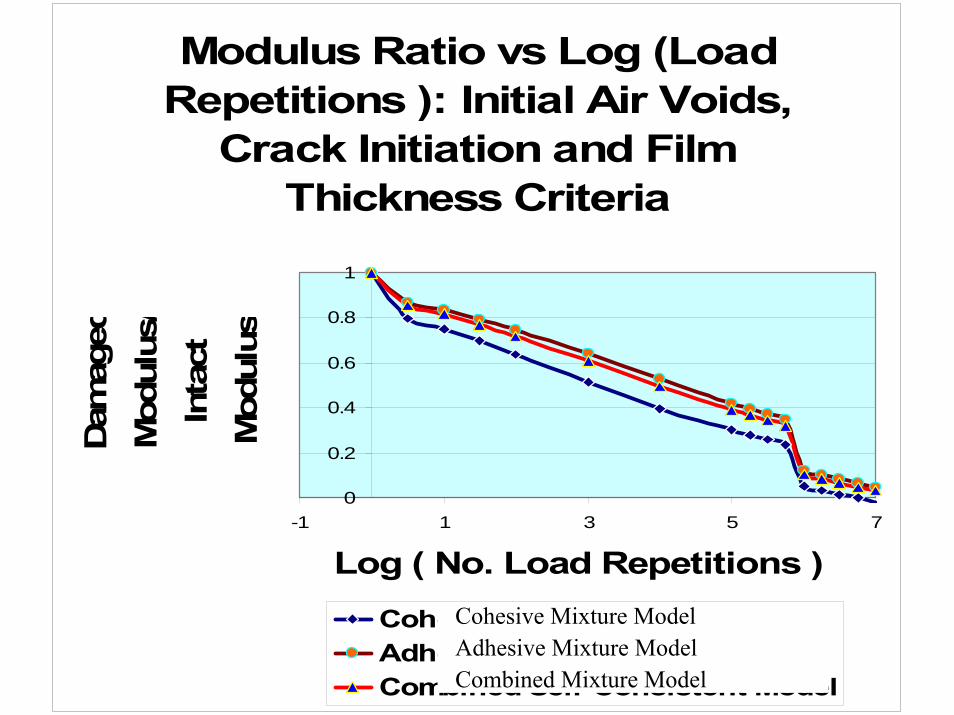
Modulus Ratio vs Log (Load Repetitions ): Initial Air Voids,
Crack Initiation and Film Thickness Criteria
0
0.2
0.4
0.6
0.8
1
-1 1 3 5 7
Log ( No. Load Repetitions )
Dam
aged
Mod
ulus
/In
tact
M
odul
us
Cohesive Self-Consistent ModelAdhesive Self-Consistent ModelCombined Self-Consistent Model
Cohesive Mixture ModelAdhesive Mixture ModelCombined Mixture Model
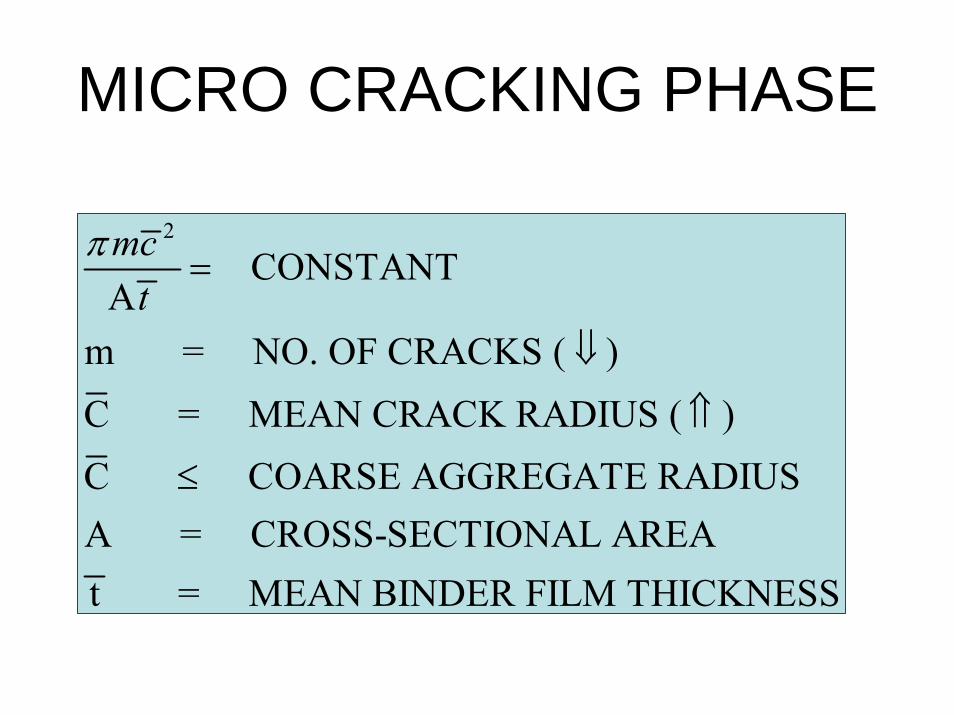
MICRO CRACKING PHASE
2
CONSTANT
m = NO. OF CRACKS ( )C = MEAN CRACK RADIUS ( )C COARSE AGGREGATE RADIUSA = CROSS-SECTIONAL AREAt = MEAN BINDER FILM THICKNESS
mct
π=
Α⇓
⇑
≤
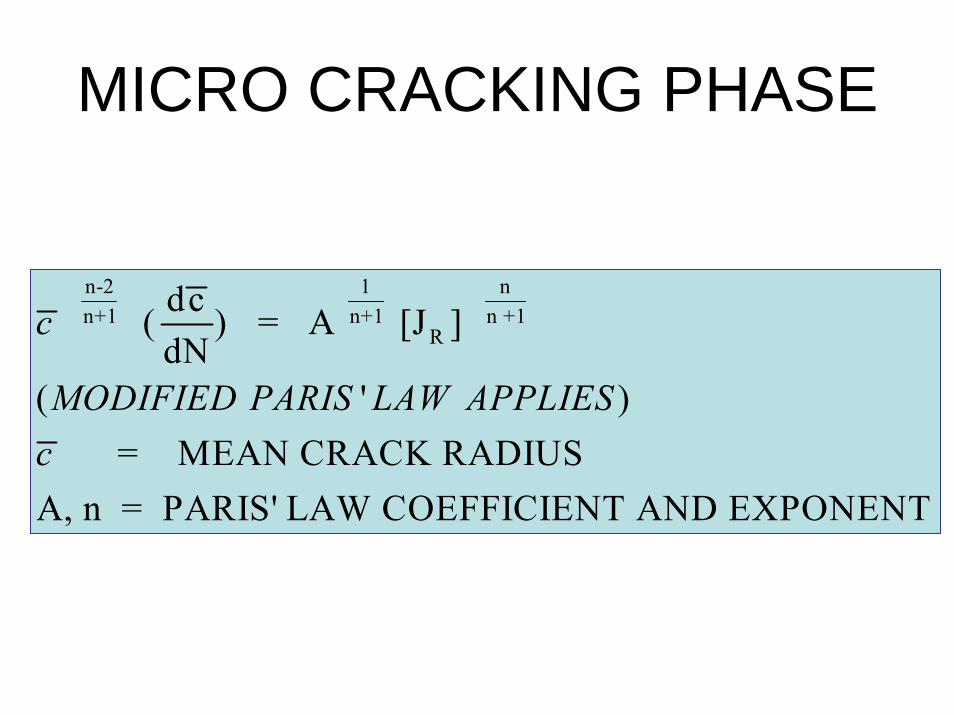
MICRO CRACKING PHASE
n-2 1 nn+1 n+1 n +1
Rdc ( ) = A [J ] dN
( ' ) = MEAN CRACK RADIUS
A, n = PARIS' LAW COEFFICIENT AND EXPONENT
c
MODIFIED PARIS LAW APPLIESc
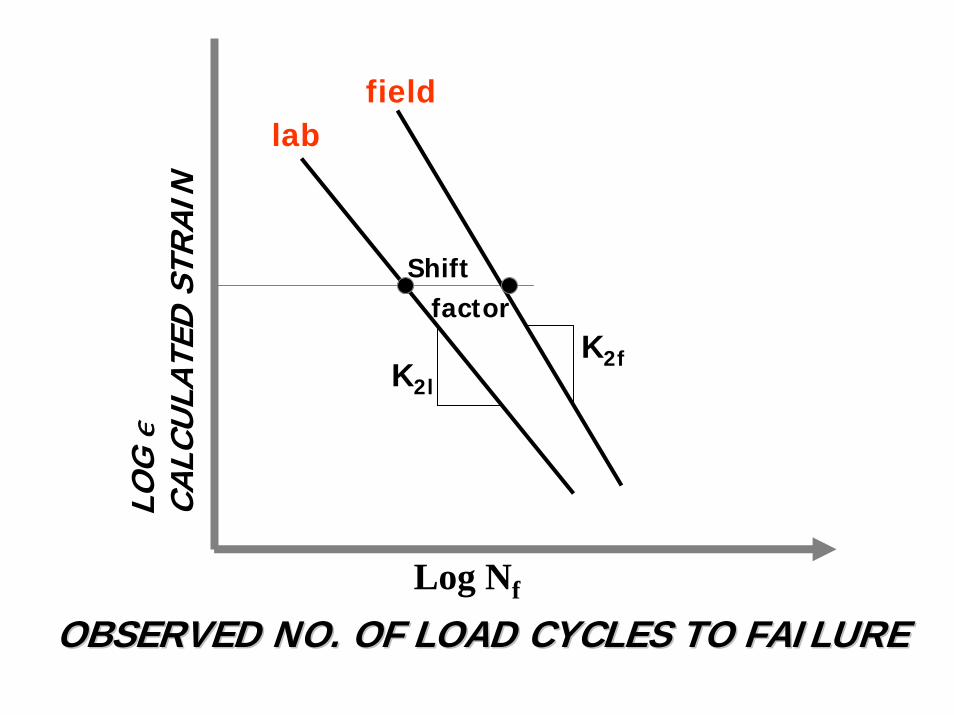
OBSERVED NO. OF LOAD CYCLES TO FAILUREOBSERVED NO. OF LOAD CYCLES TO FAILURE
LOG
,CA
LCU
LATE
D S
TRA
IN
Shift factor
K2fK2l
Log Nf
labfield
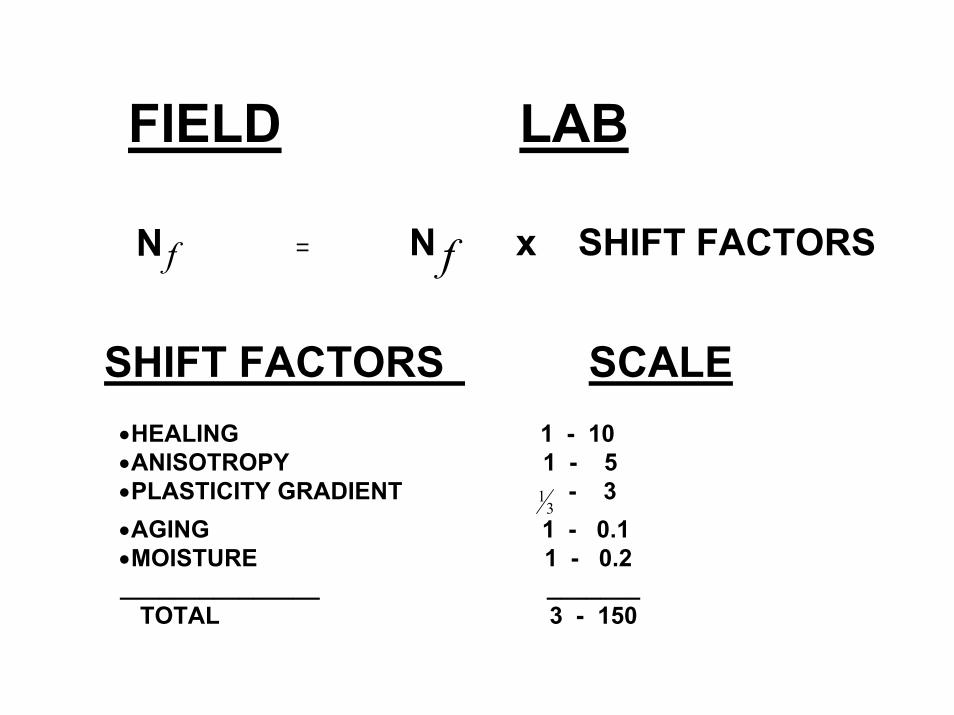
FIELD LAB
N f = N x SHIFT FACTORSf
SHIFT FACTORS SCALE•HEALING 1 - 10•ANISOTROPY 1 - 5•PLASTICITY GRADIENT - 3•AGING 1 - 0.1•MOISTURE 1 - 0.2_______________ _______
TOTAL 3 - 150
13
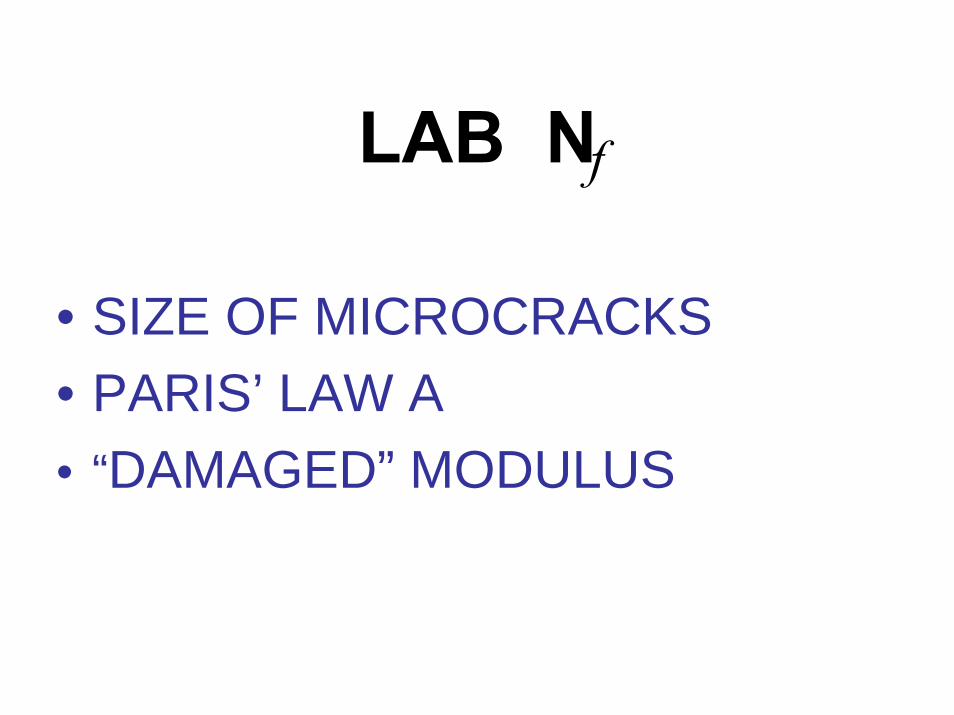
LAB N
• SIZE OF MICROCRACKS• PARIS’ LAW A• “DAMAGED” MODULUS
f
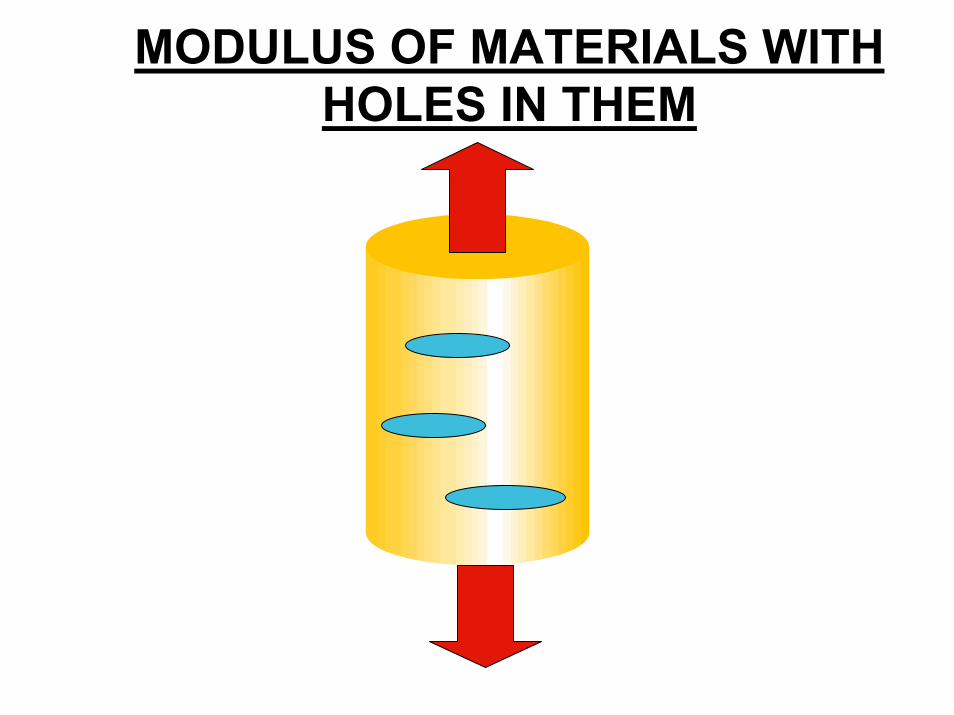
MODULUS OF MATERIALS WITH HOLES IN THEM
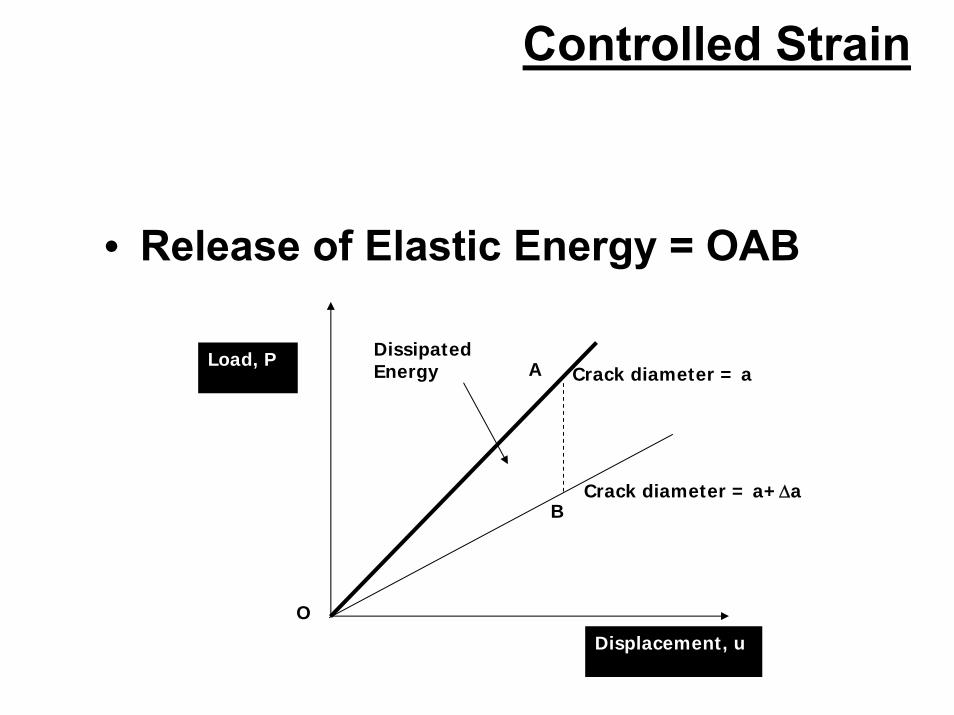
Controlled Strain
• Release of Elastic Energy = OAB
Load, P
Displacement, u
A
B
Dissipated Energy
O
Crack diameter = a
Crack diameter = a+Δa
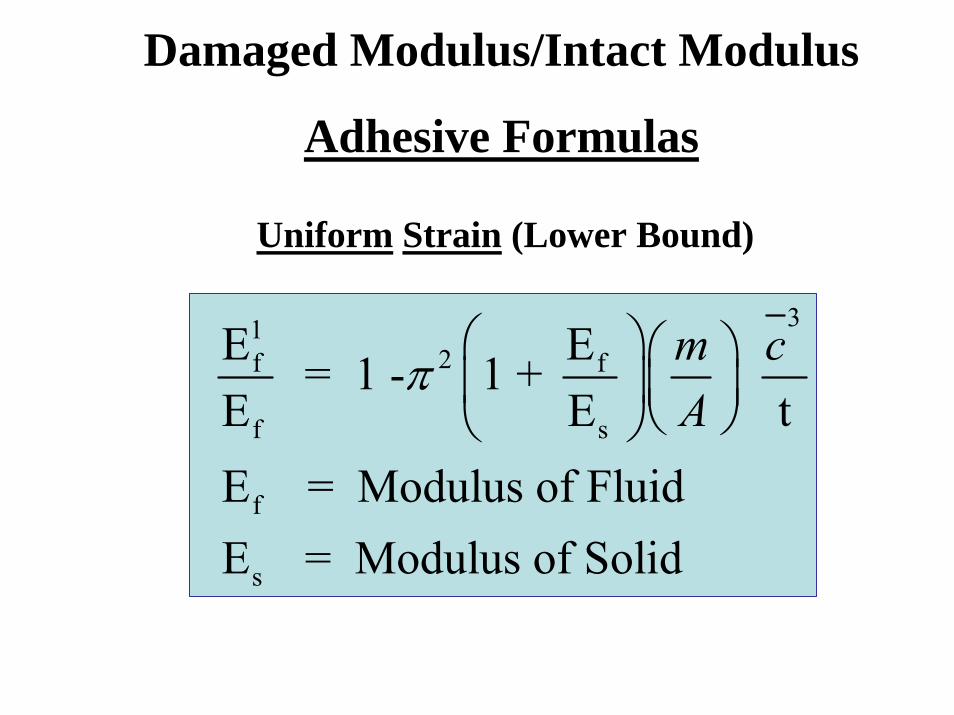
312f f
f s
f
s
E E = 1 - 1 + E E t
E = Modulus of Fluid E = Modulus of Solid
m cA
π⎛ ⎞⎛ ⎞⎜ ⎟⎜ ⎟
⎝ ⎠⎝ ⎠
Damaged Modulus/Intact Modulus
Adhesive Formulas
Uniform Strain (Lower Bound)
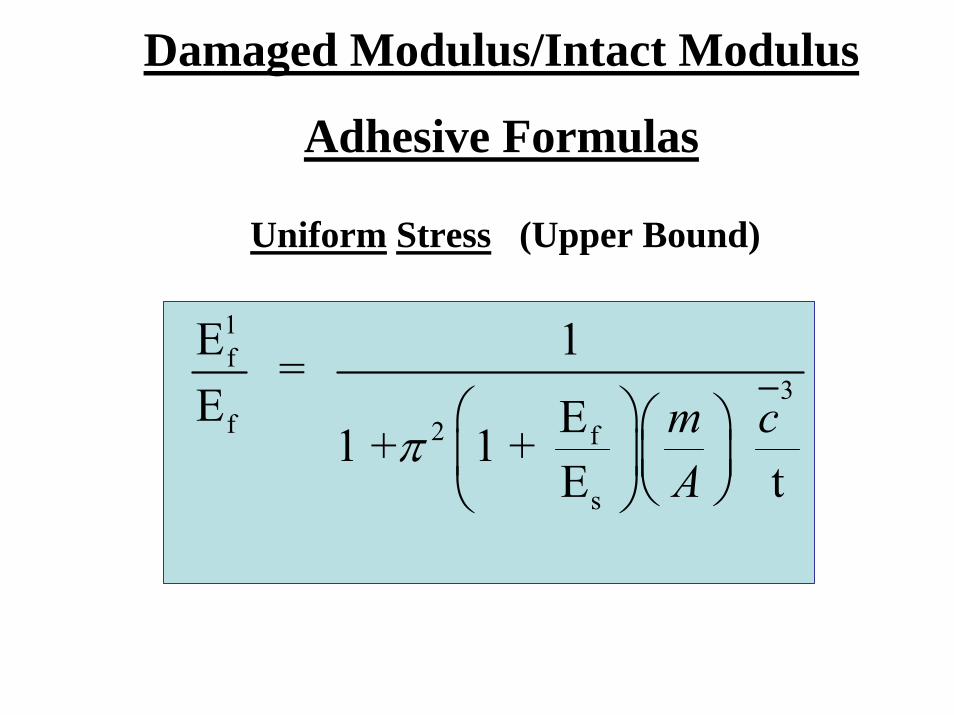
Damaged Modulus/Intact Modulus
Adhesive Formulas
Uniform Stress (Upper Bound)
1f
3f 2 f
s
E 1 = E E1 + 1 +
E t
m cA
π⎛ ⎞⎛ ⎞⎜ ⎟⎜ ⎟
⎝ ⎠⎝ ⎠
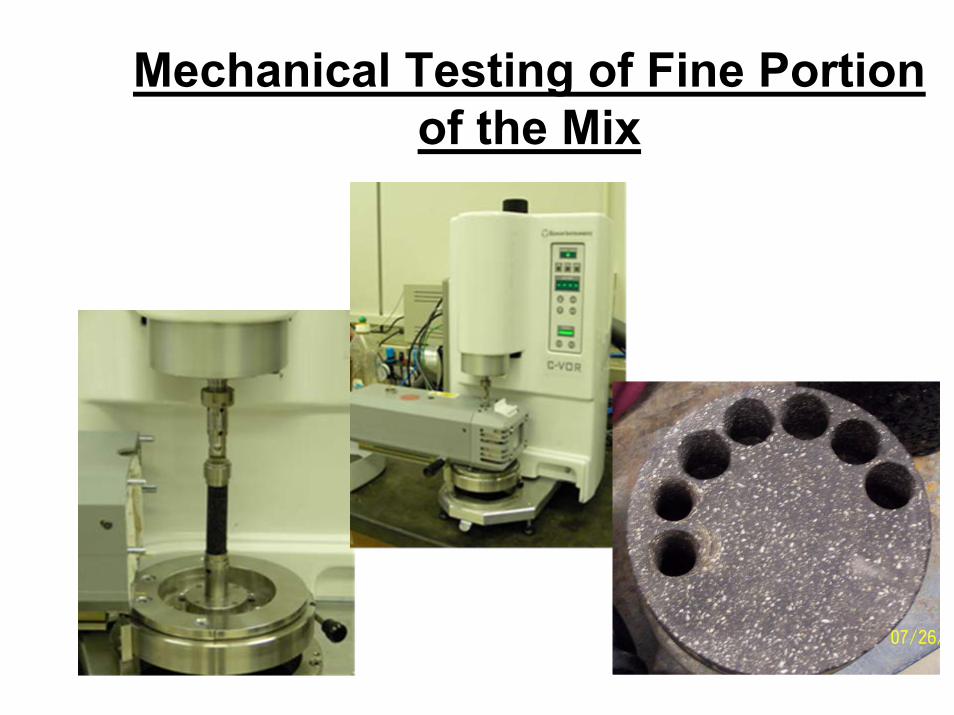
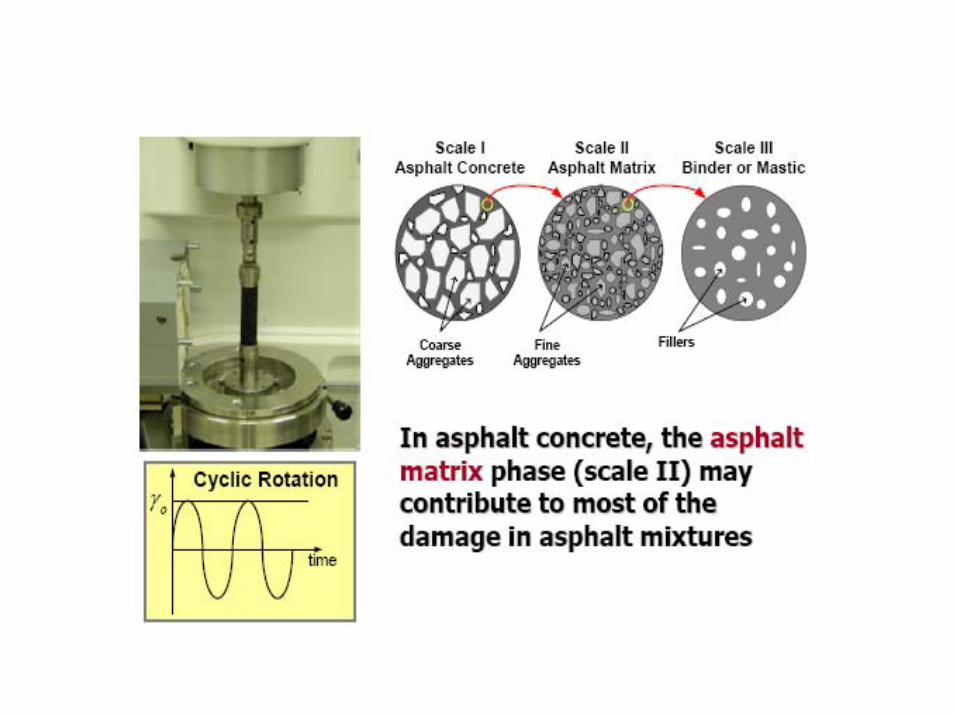
Mechanical Testing of Fine Portion of the Mix
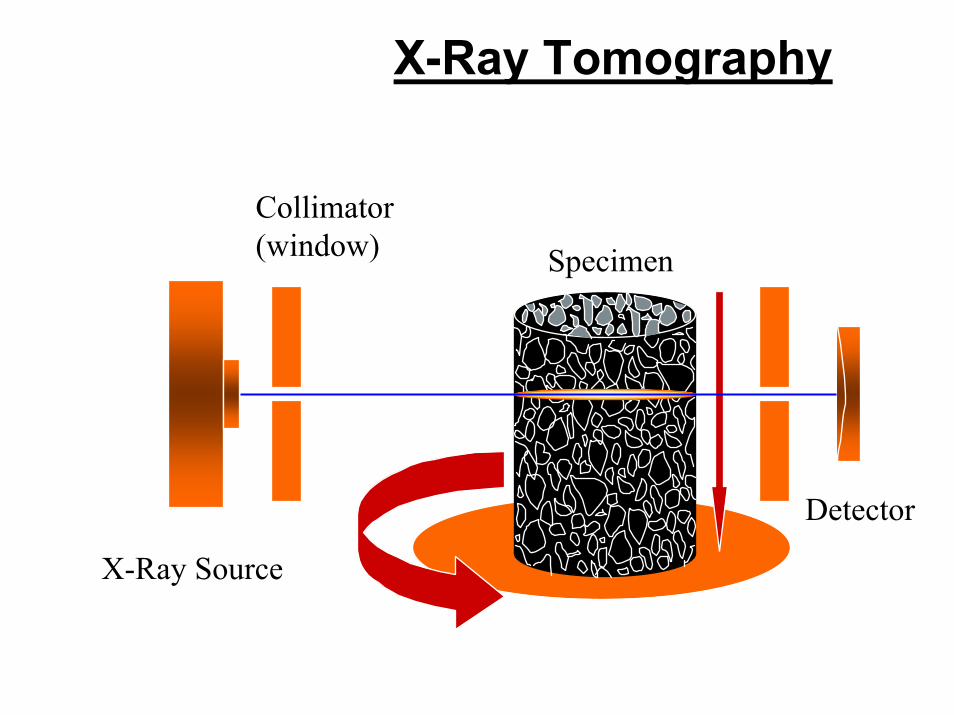
X-Ray Tomography
X-Ray Source
Detector
Specimen
Collimator(window)
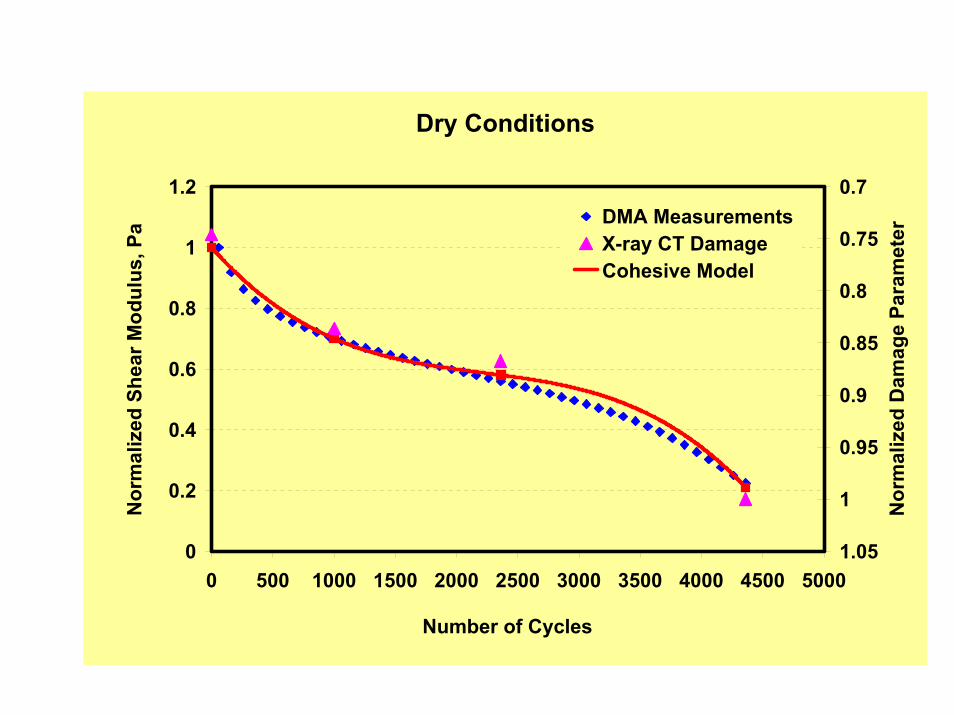
Dry Conditions
0
0.2
0.4
0.6
0.8
1
1.2
0 500 1000 1500 2000 2500 3000 3500 4000 4500 5000
Number of Cycles
Nor
mal
ized
She
ar M
odul
us, P
a
0.7
0.75
0.8
0.85
0.9
0.95
1
1.05
Nor
mal
ized
Dam
age
Para
met
er
DMA MeasurementsX-ray CT DamageCohesive Model
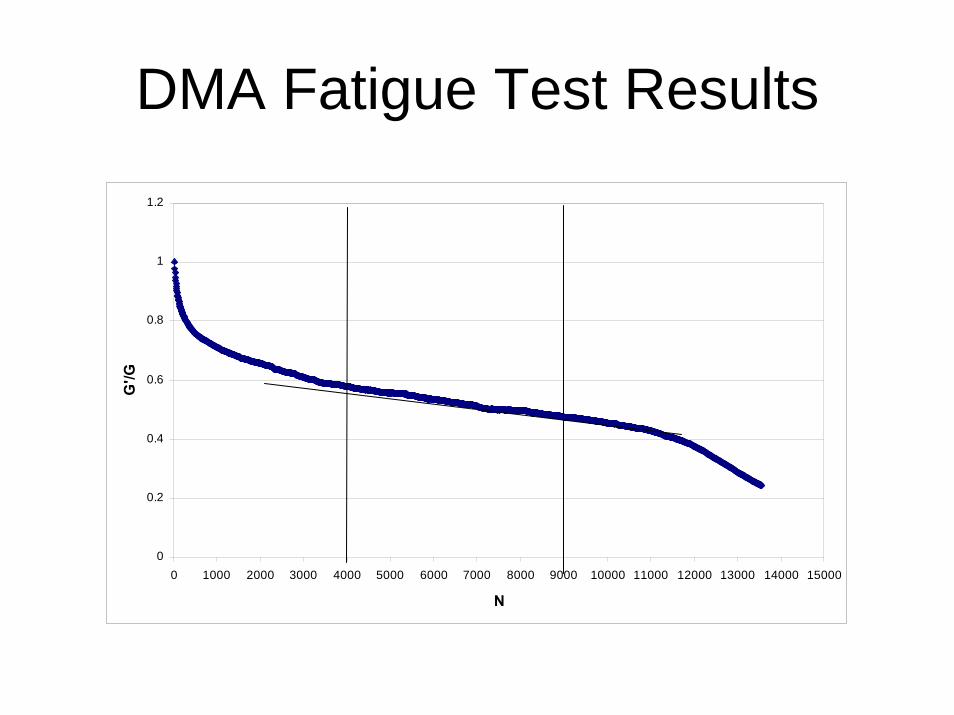
DMA Fatigue Test Results
0
0.2
0.4
0.6
0.8
1
1.2
0 1000 2000 3000 4000 5000 6000 7000 8000 9000 10000 11000 12000 13000 14000 15000
N
G'/G
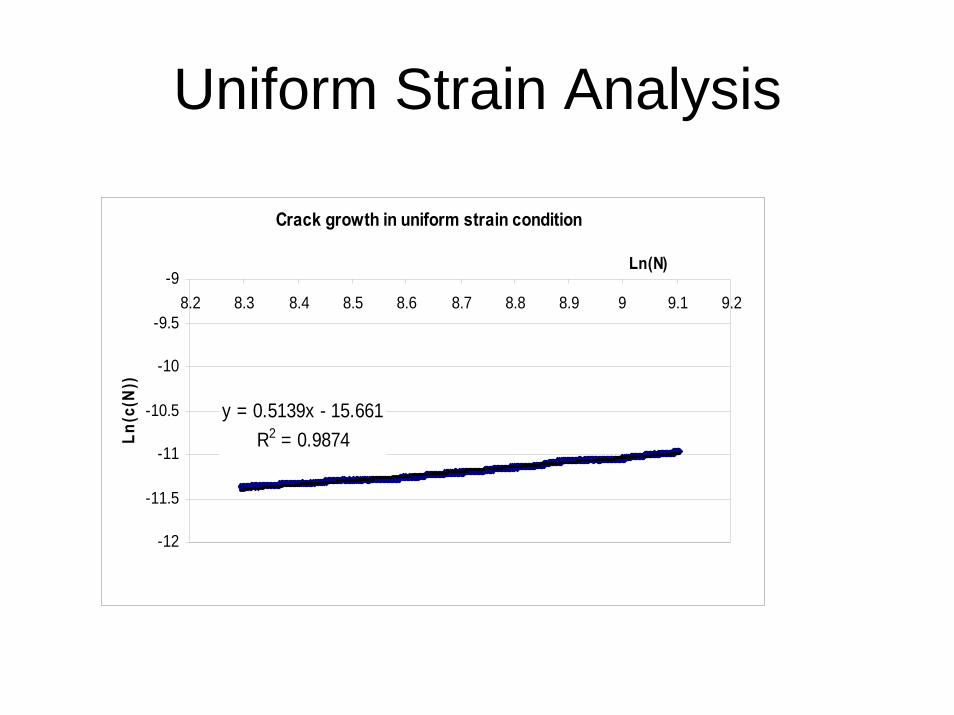
Uniform Strain Analysis
Crack growth in uniform strain condition
y = 0.5139x - 15.661R2 = 0.9874
-12
-11.5
-11
-10.5
-10
-9.5
-98.2 8.3 8.4 8.5 8.6 8.7 8.8 8.9 9 9.1 9.2
Ln(N)
Ln(c
(N))
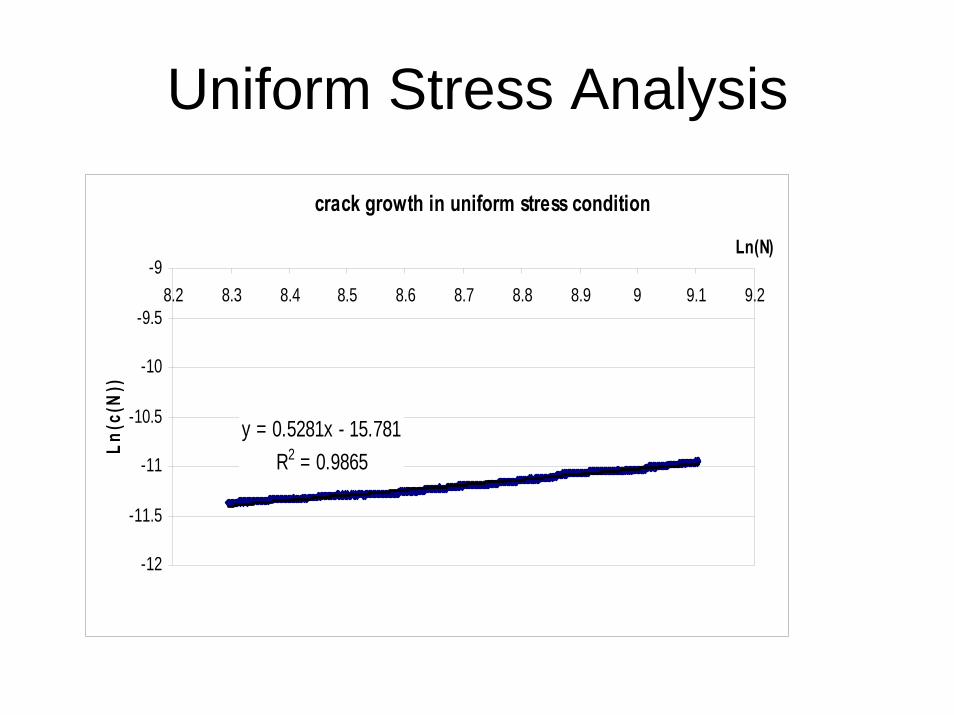
Uniform Stress Analysis
crack growth in uniform stress condition
y = 0.5281x - 15.781R2 = 0.9865
-12
-11.5
-11
-10.5
-10
-9.5
-98.2 8.3 8.4 8.5 8.6 8.7 8.8 8.9 9 9.1 9.2
Ln(N)
Ln(c
(N))
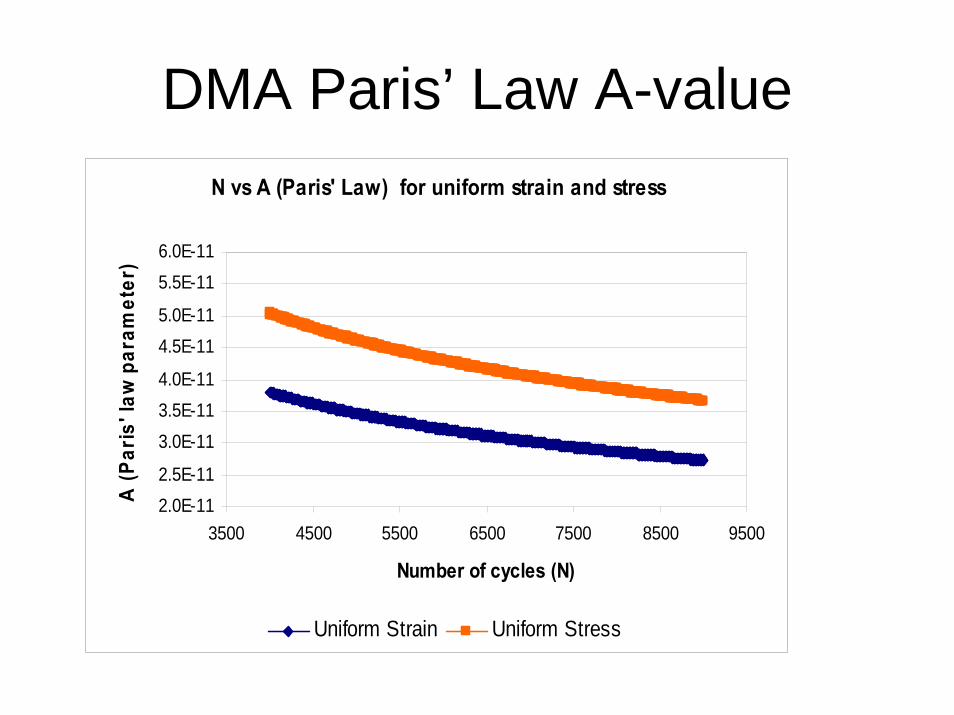
DMA Paris’ Law A-valueN vs A (Paris' Law) for uniform strain and stress
2.0E-112.5E-11
3.0E-113.5E-114.0E-11
4.5E-115.0E-11
5.5E-116.0E-11
3500 4500 5500 6500 7500 8500 9500
Number of cycles (N)
A (P
aris
' law
par
amet
er)
Uniform Strain Uniform Stress
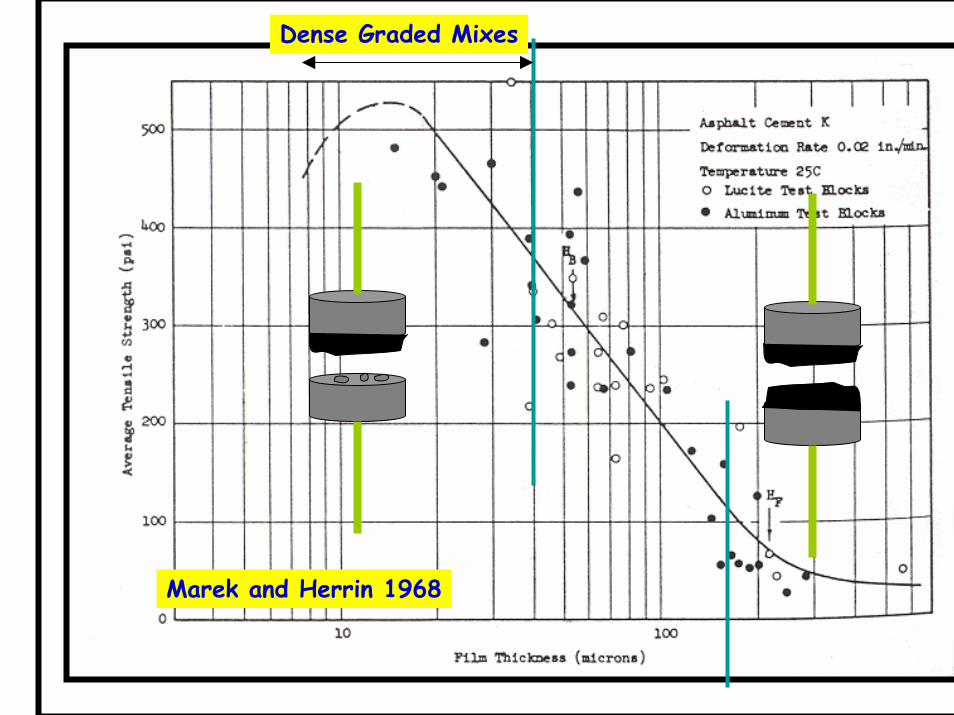
Marek and Herrin 1968
Dense Graded Mixes
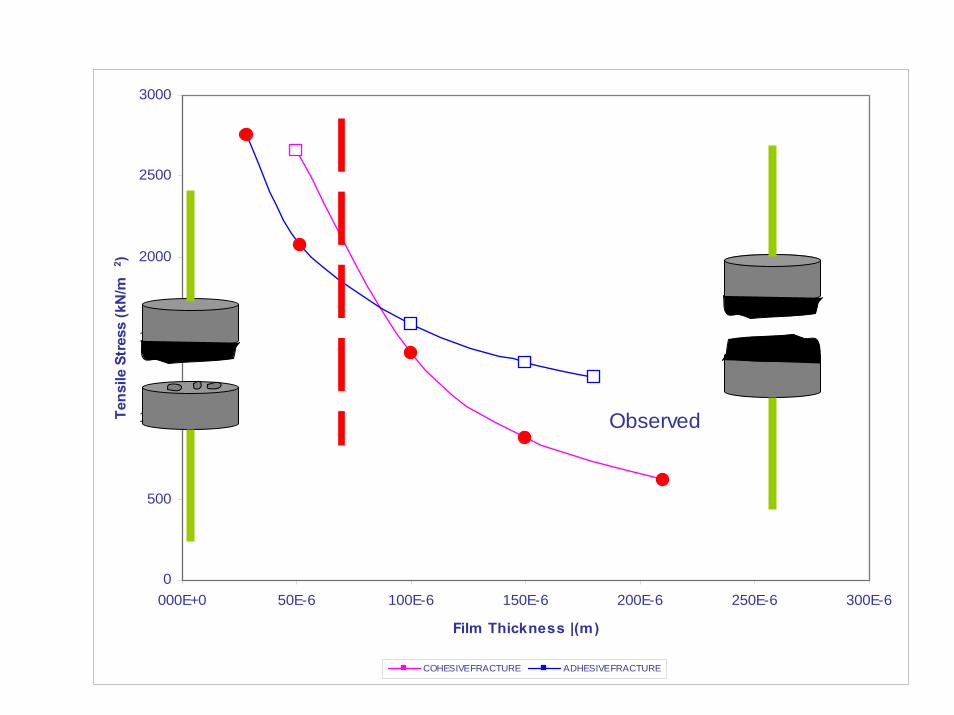
0
500
1000
1500
2000
2500
3000
000E+0 50E-6 100E-6 150E-6 200E-6 250E-6 300E-6
Film Thickness |(m)
Tens
ile S
tres
s (k
N/m
2 )
COHESIVE FRACTURE ADHESIVE FRACTURE
Observed
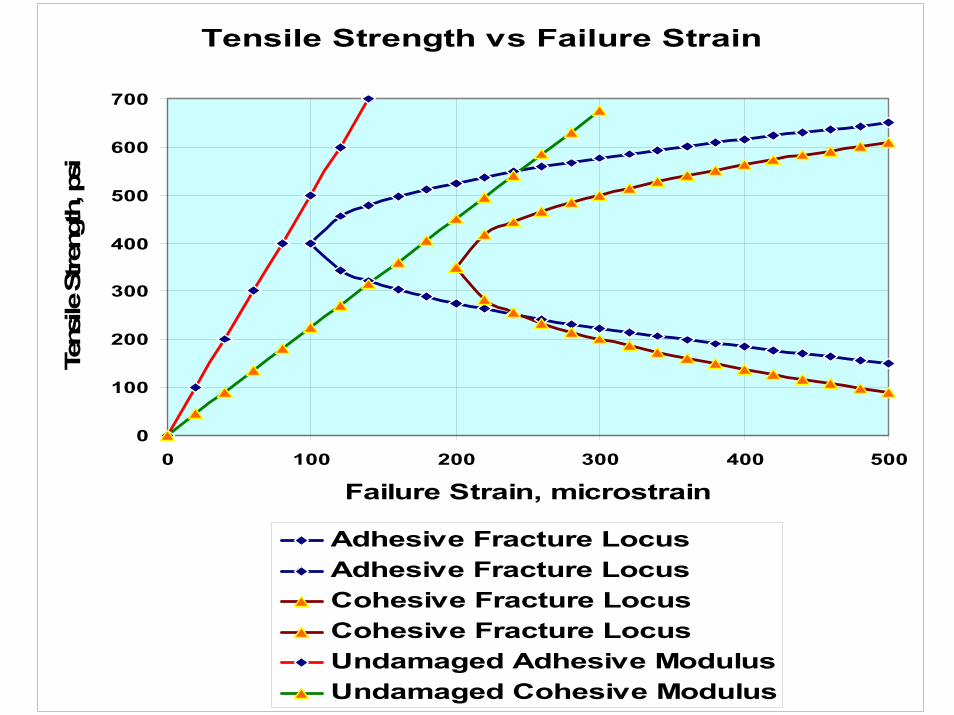
Tensile Strength vs Failure Strain
0
100
200
300
400
500
600
700
0 100 200 300 400 500
Failure Strain, microstrain
Tens
ile S
tren
gth,
psi
Adhesive Fracture LocusAdhesive Fracture LocusCohesive Fracture LocusCohesive Fracture LocusUndamaged Adhesive ModulusUndamaged Cohesive Modulus
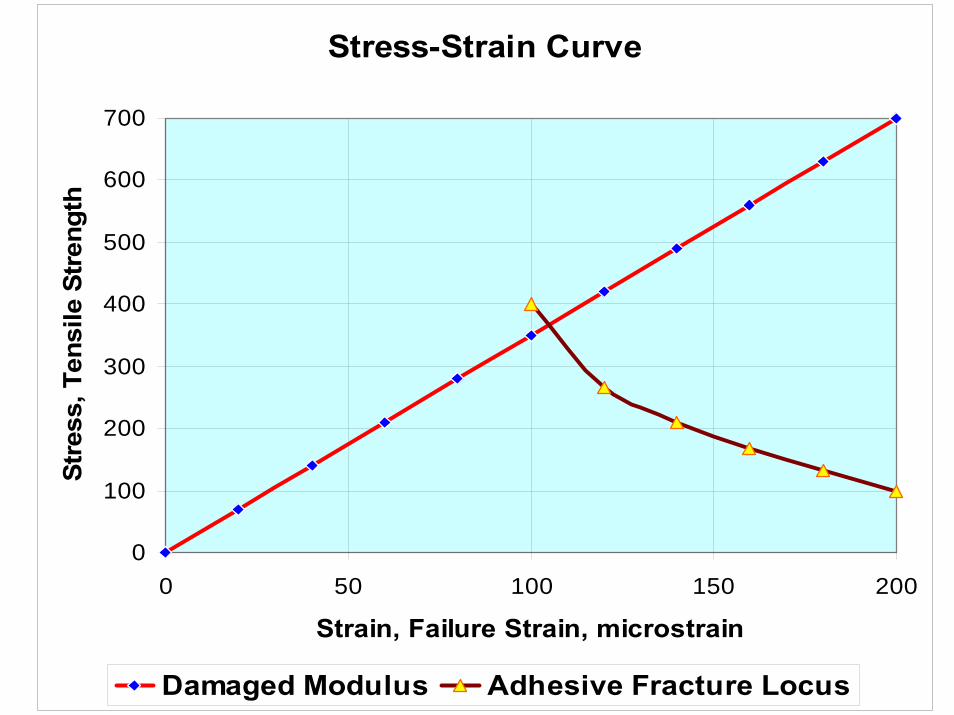
Stress-Strain Curve
0
100
200
300
400
500
600
700
0 50 100 150 200
Strain, Failure Strain, microstrain
Stre
ss, T
ensi
le S
tren
gth
Damaged Modulus Adhesive Fracture Locus
0.0
0.2
0.4
0.6
0.8
1.0
1.2
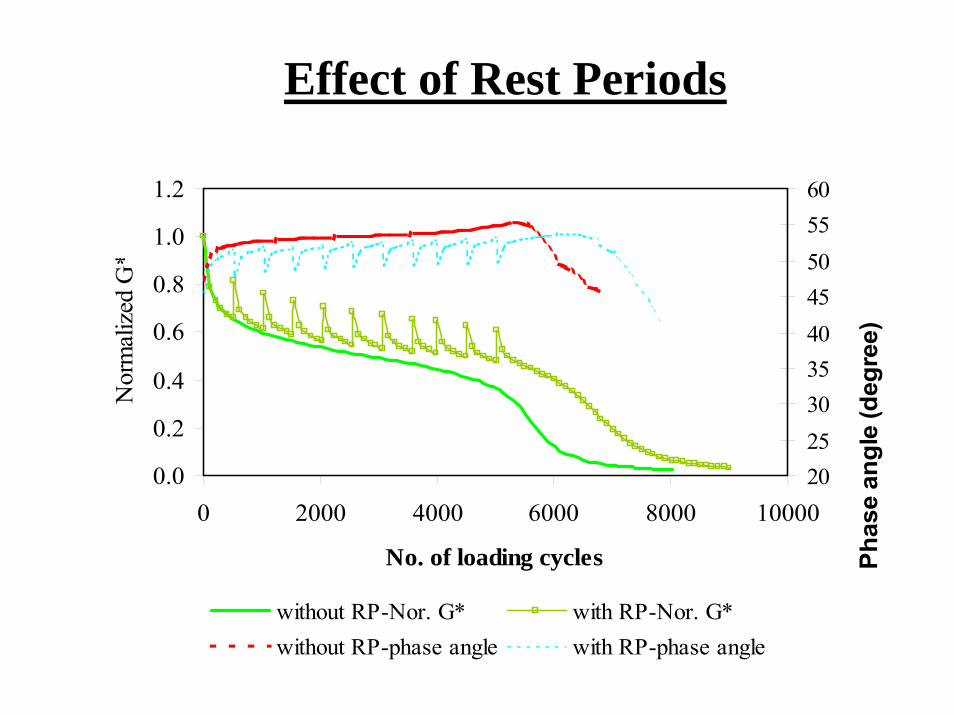
0 2000 4000 6000 8000 10000
No. of loading cycles
Nor
mal
ized
G*
202530354045505560
Phas
e an
gle
(deg
ree)
without RP-Nor. G* with RP-Nor. G*without RP-phase angle with RP-phase angle
Effect of Rest Periods
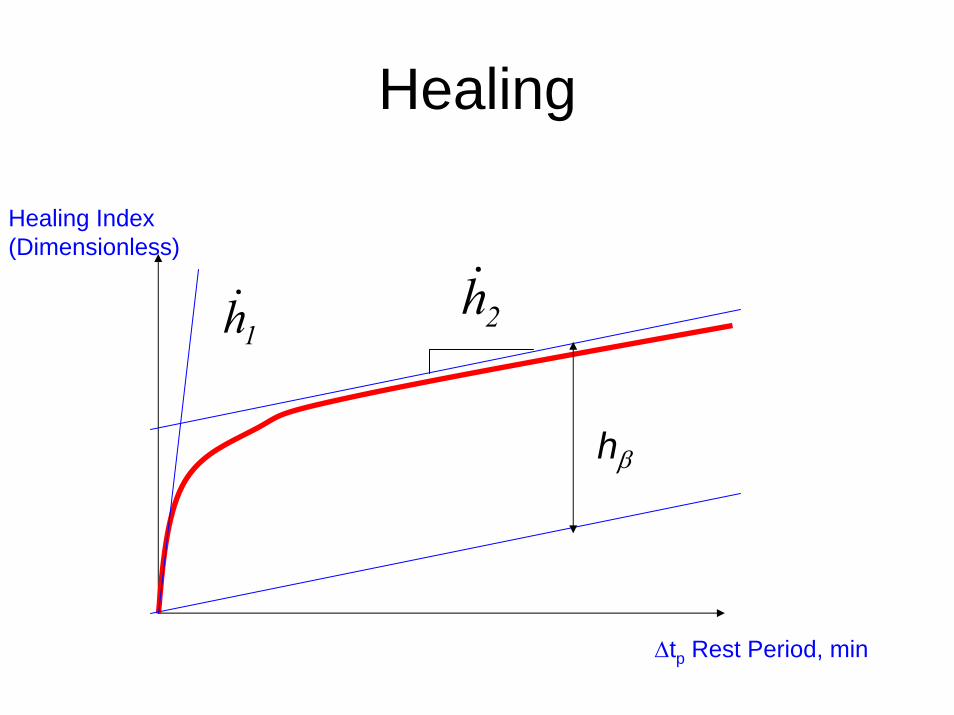
Healing
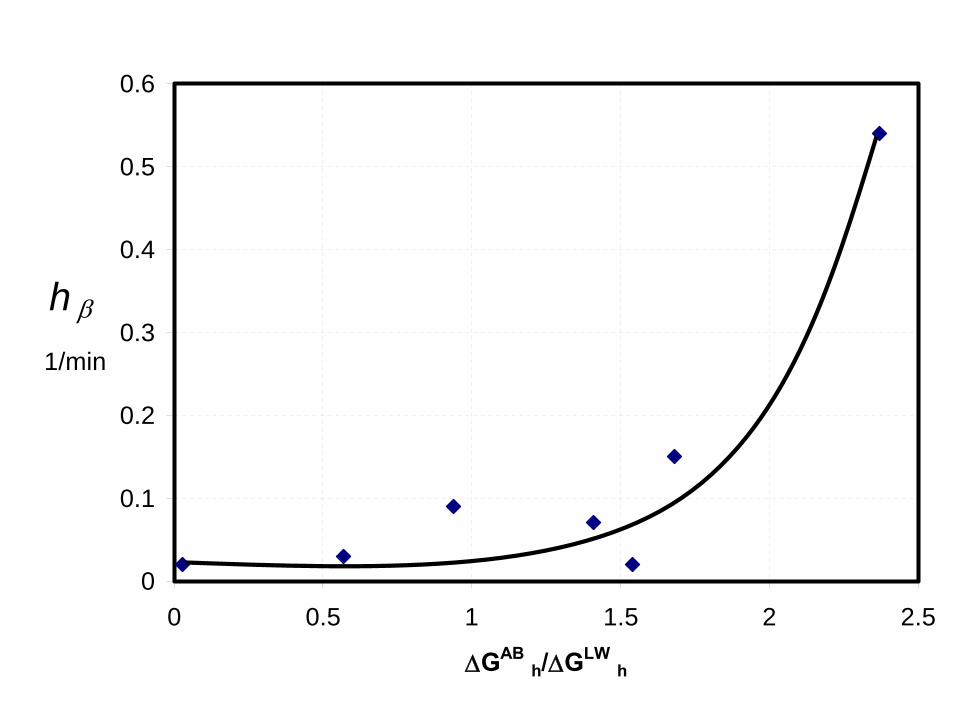
1h
hβ
2h
Healing Index (Dimensionless)
Δtp Rest Period, min
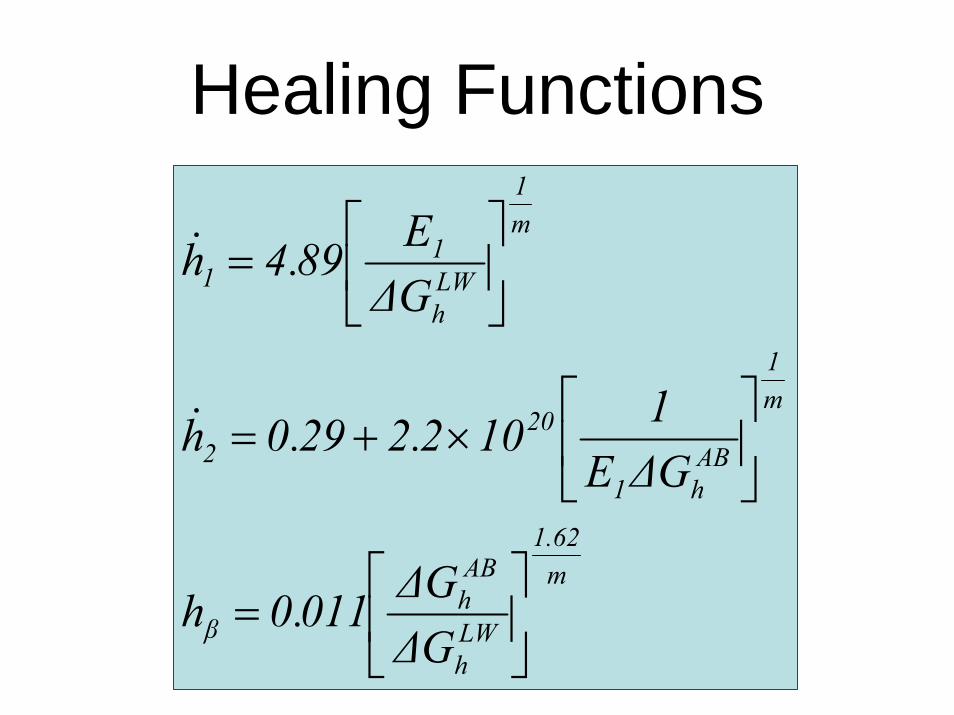
Healing Functions
m62.1
LWh
ABh
β
m1
ABh1
202
m1
LWh
11
ΔGΔG011.0h
ΔGE1102.229.0h
ΔGE89.4h
⎥⎦
⎤⎢⎣
⎡=
⎥⎦
⎤⎢⎣
⎡×+=
⎥⎦
⎤⎢⎣
⎡=
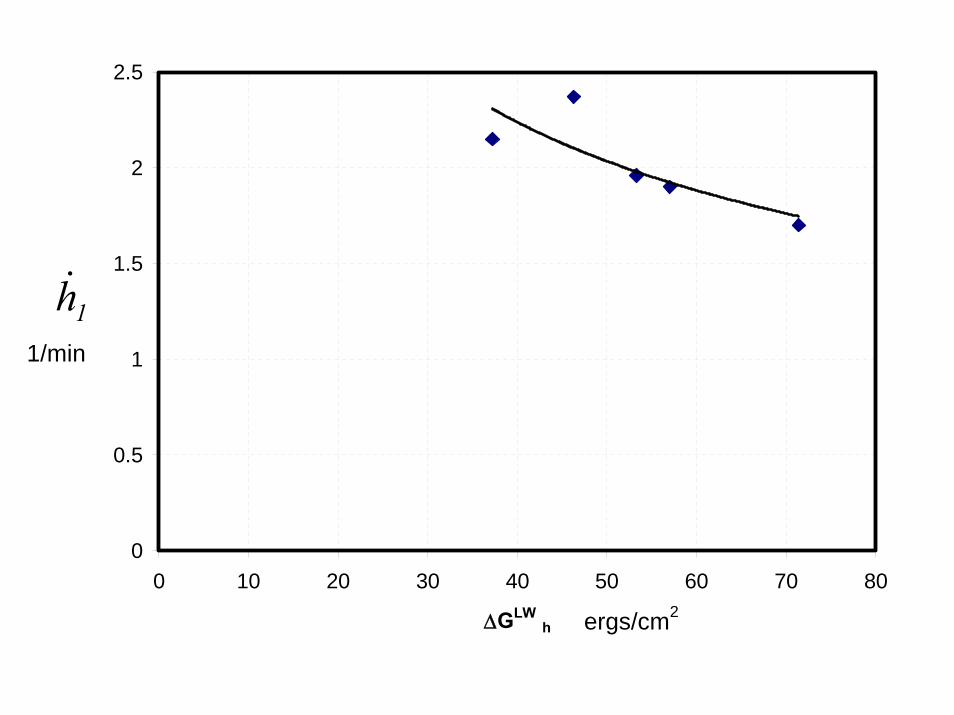
0
0.5
1
1.5
2
2.5
0 10 20 30 40 50 60 70 80
ΔGLW h
1h1/min
ergs/cm2
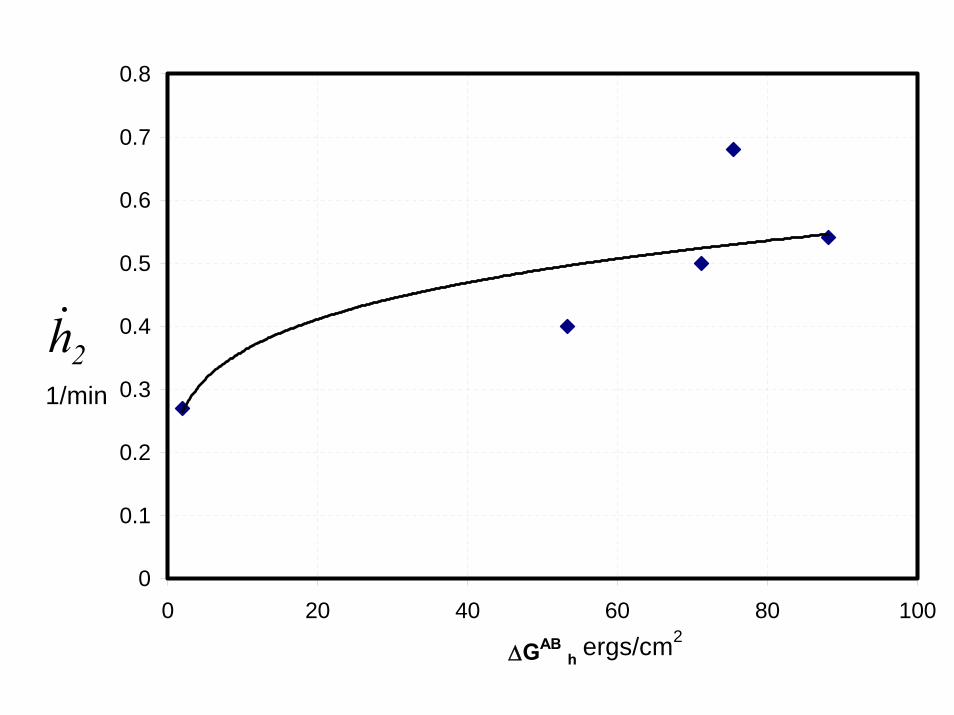
0
0.1
0.2
0.3
0.4
0.5
0.6
0.7
0.8
0 20 40 60 80 100
ΔGAB h
2h1/min
ergs/cm2
0
0.1
0.2
0.3
0.4
0.5
0.6
0 0.5 1 1.5 2 2.5
ΔGAB h/ΔGLW h
1/min
h β
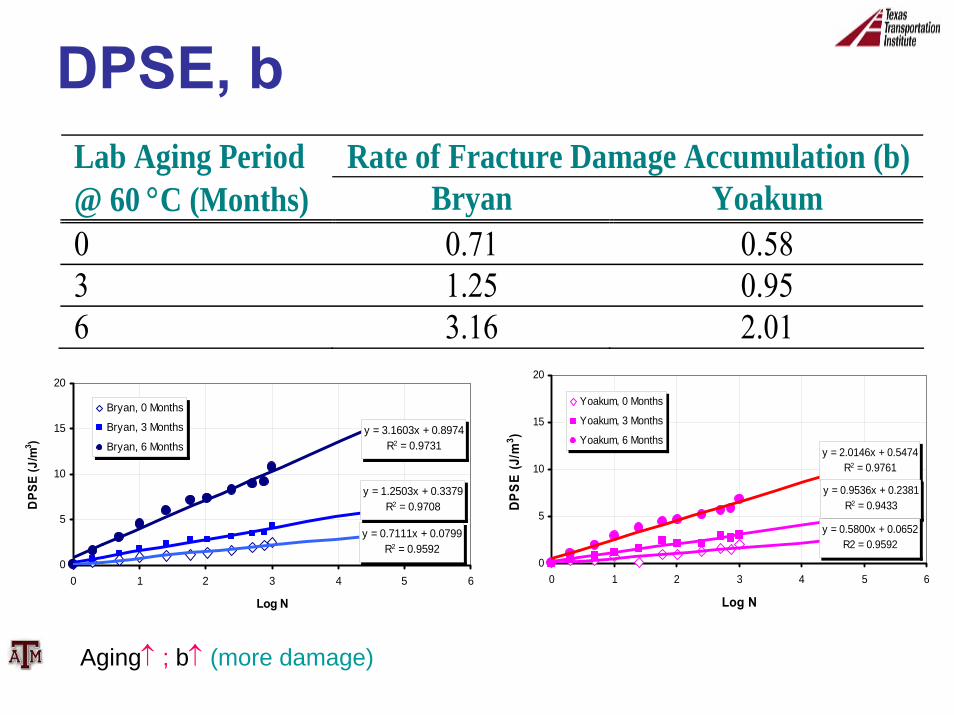
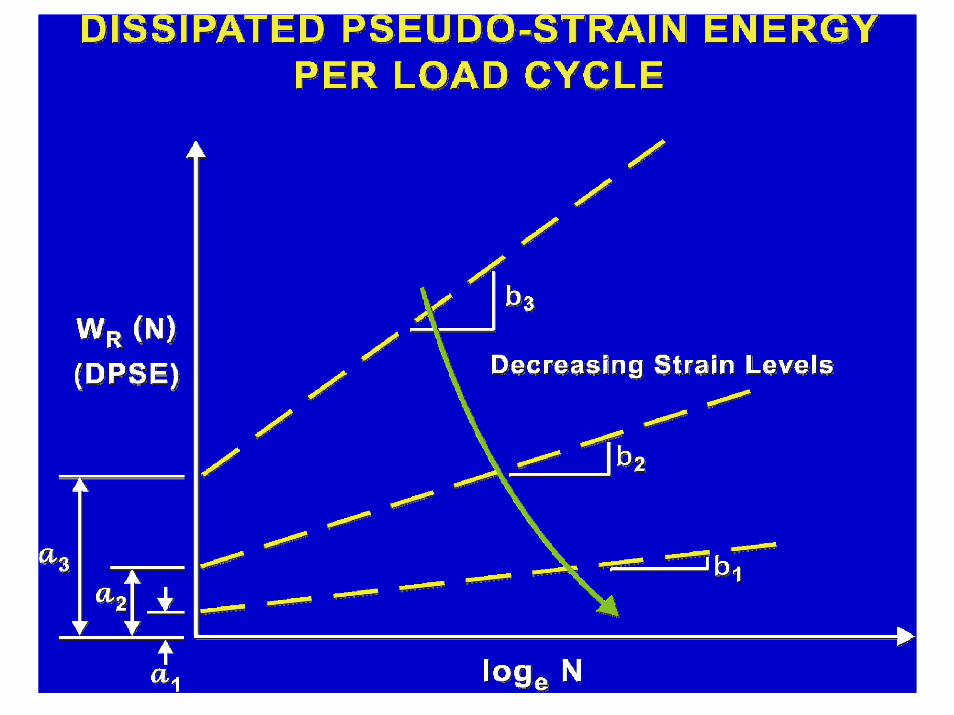
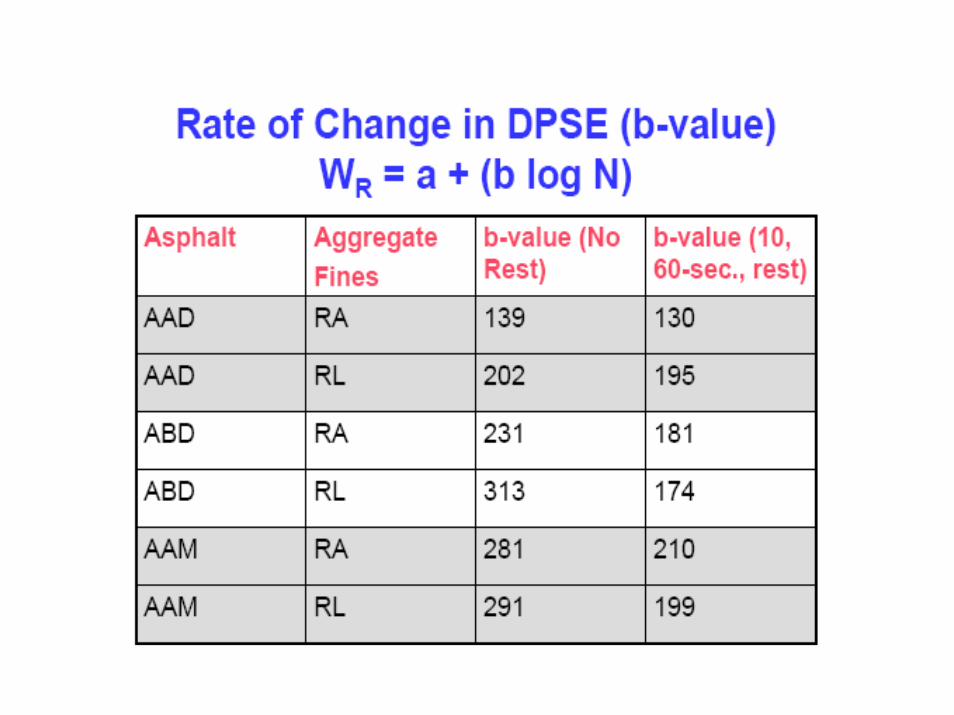
DPSE, b
y = 3.1603x + 0.8974R2 = 0.9731
y = 1.2503x + 0.3379R2 = 0.9708
y = 0.7111x + 0.0799R2 = 0.9592
0
5
10
15
20
0 1 2 3 4 5 6
Log N
DPS
E (J
/m3 )
Bryan, 0 Months
Bryan, 3 Months
Bryan, 6 Months
Aging↑ ; b↑ (more damage)
Rate of Fracture Damage Accumulation (b)Lab Aging Period @ 60 °C (Months) Bryan Yoakum 0 0.71 0.58 3 1.25 0.95 6 3.16 2.01
y = 2.0146x + 0.5474R2 = 0.9761
y = 0.9536x + 0.2381R2 = 0.9433
y = 0.5800x + 0.0652R2 = 0.9592
0
5
10
15
20
0 1 2 3 4 5 6
Log N
DPS
E (J
/m3 )
Yoakum, 0 Months
Yoakum, 3 Months
Yoakum, 6 Months
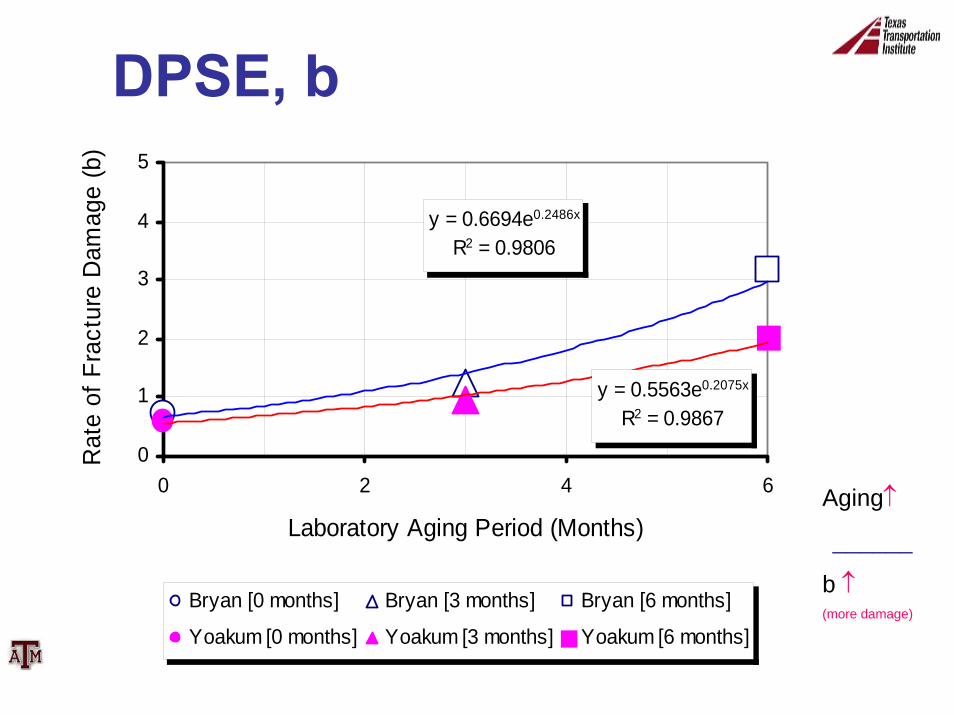
DPSE, b
y = 0.6694e0.2486x
R2 = 0.9806
y = 0.5563e0.2075x
R2 = 0.9867
0
1
2
3
4
5
0 2 4 6
Laboratory Aging Period (Months)
Rat
e of
Fra
ctur
e D
amag
e (b
)
Bryan [0 months] Bryan [3 months] Bryan [6 months]
Yoakum [0 months] Yoakum [3 months] Yoakum [6 months]
Aging↑
______
b ↑(more damage)
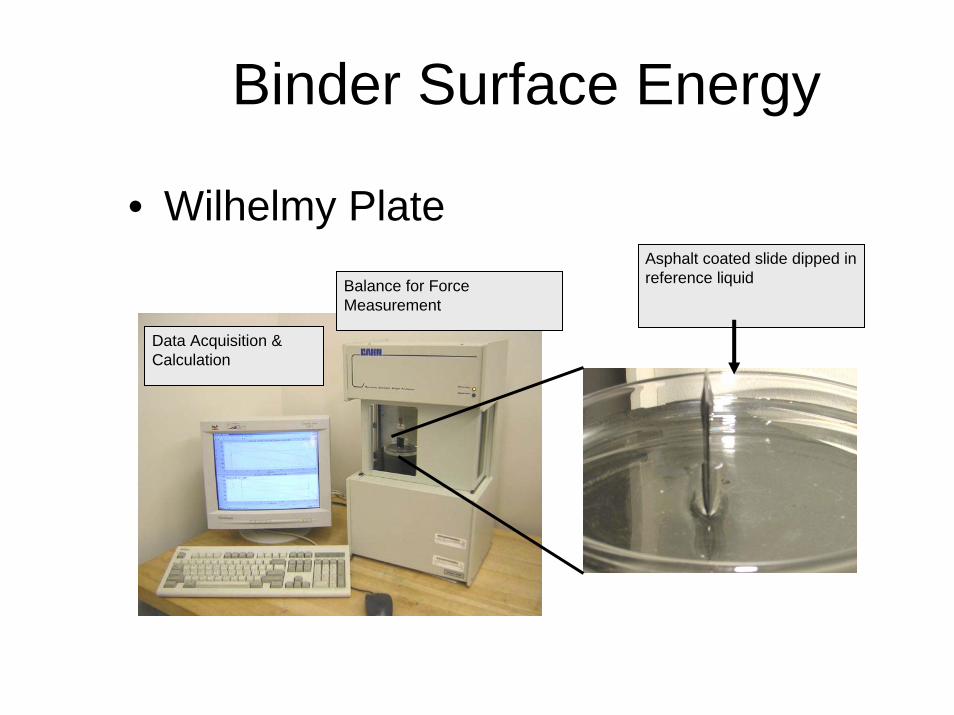
Binder Surface Energy
• Wilhelmy Plate
Data Acquisition & Calculation
Balance for Force Measurement
Asphalt coated slide dipped in reference liquid
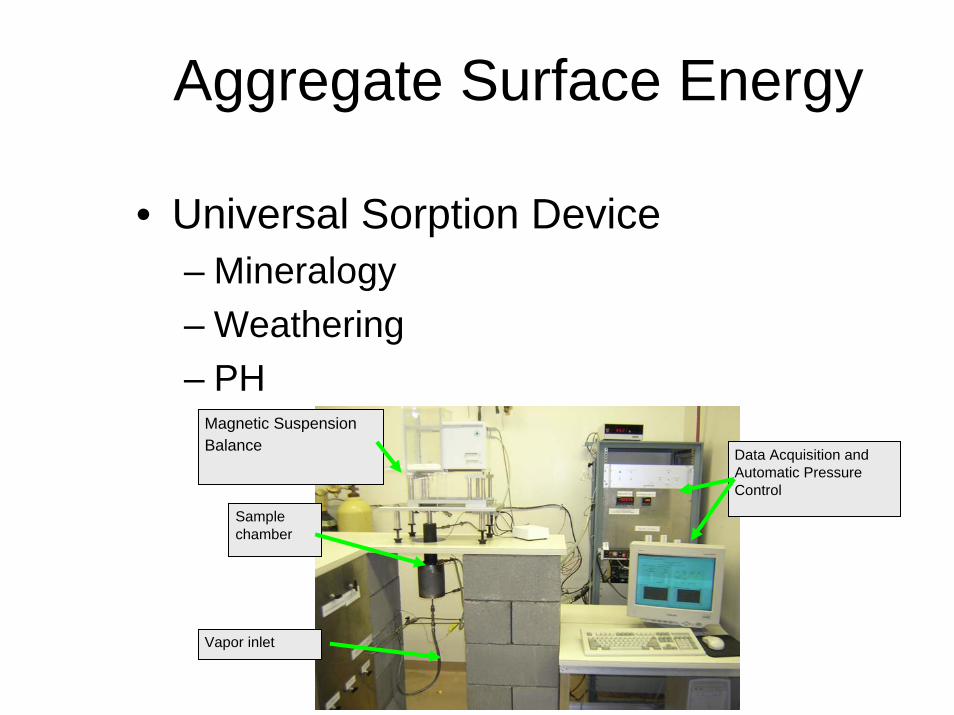
Aggregate Surface Energy
• Universal Sorption Device– Mineralogy– Weathering– PH
Data Acquisition and Automatic Pressure Control
Magnetic Suspension Balance
Sample chamber
Vapor inlet
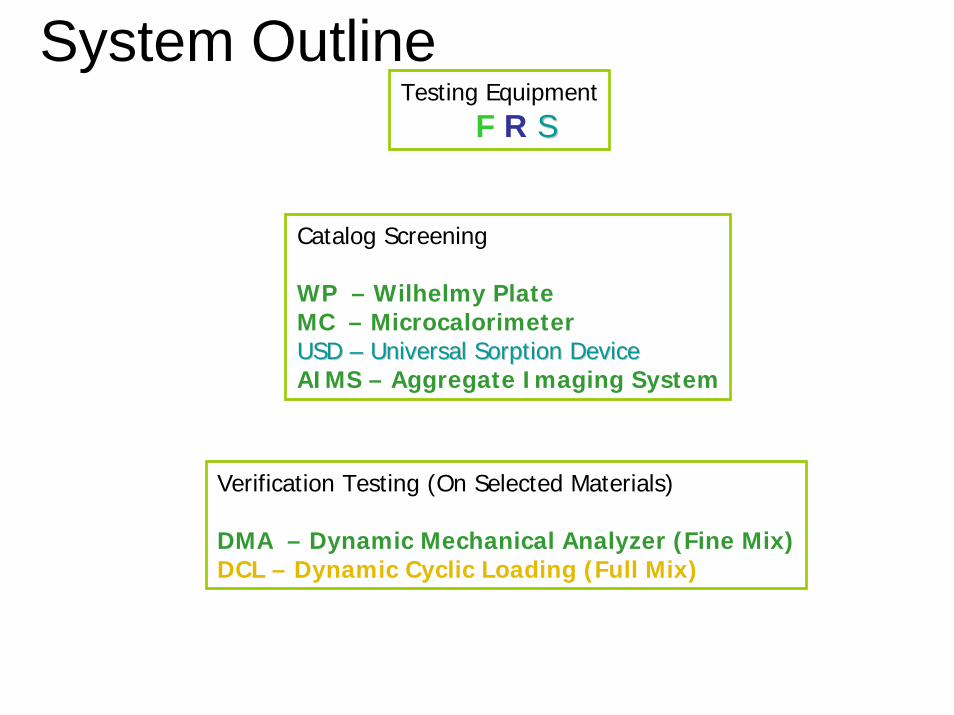
Testing EquipmentF R SS
Catalog Screening
WP – Wilhelmy PlateMC – MicrocalorimeterUSD USD –– Universal Sorption DeviceUniversal Sorption DeviceAIMS – Aggregate Imaging System
Verification Testing (On Selected Materials)
DMA – Dynamic Mechanical Analyzer (Fine Mix)DCL – Dynamic Cyclic Loading (Full Mix)
System Outline
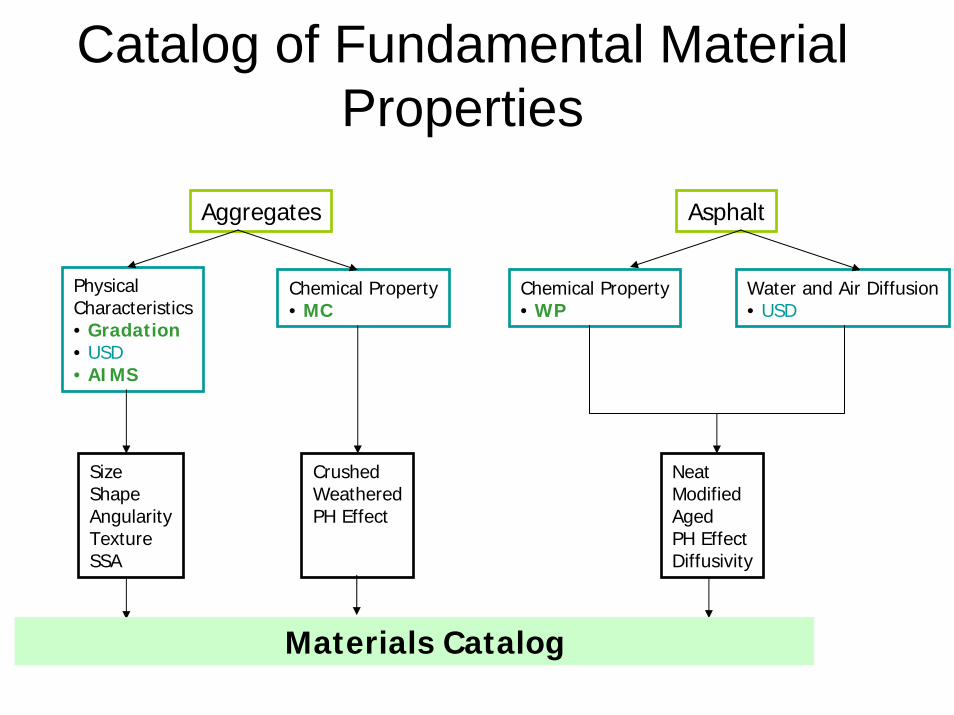
AsphaltAggregates
Physical Characteristics• Gradation• USD• AIMS
Chemical Property• MC
Chemical Property• WP
Water and Air Diffusion• USD
SizeShapeAngularityTextureSSA
CrushedWeatheredPH Effect
NeatModifiedAgedPH EffectDiffusivity
Materials Catalog
Catalog of Fundamental Material Properties
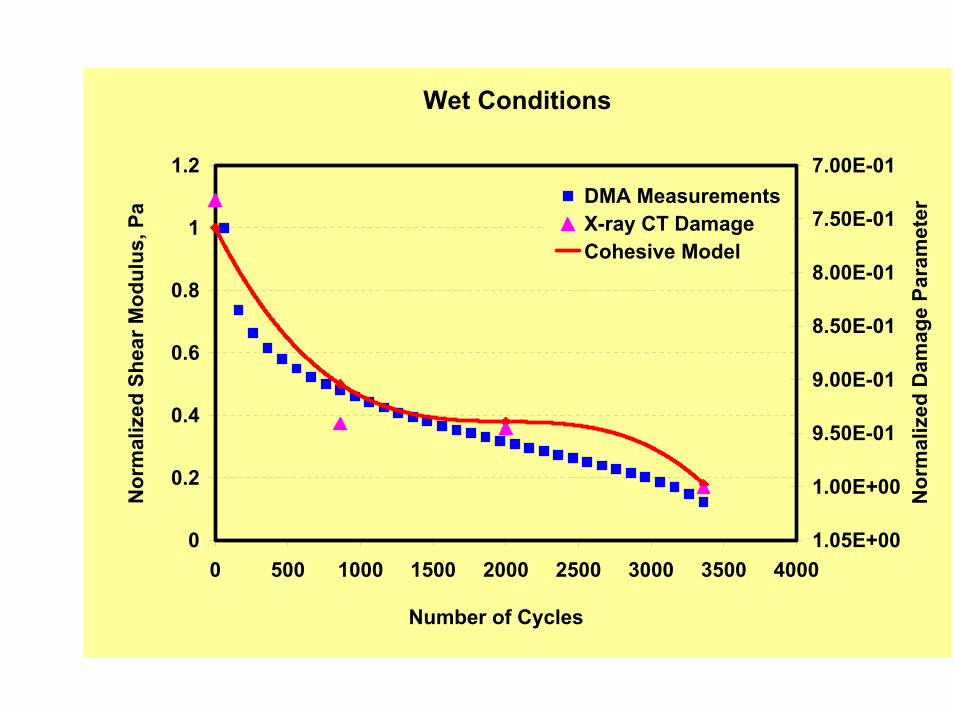
Wet Conditions
0
0.2
0.4
0.6
0.8
1
1.2
0 500 1000 1500 2000 2500 3000 3500 4000
Number of Cycles
Nor
mal
ized
She
ar M
odul
us, P
a7.00E-01
7.50E-01
8.00E-01
8.50E-01
9.00E-01
9.50E-01
1.00E+00
1.05E+00
Nor
mal
ized
Dam
age
Para
met
er
DMA MeasurementsX-ray CT Damage Cohesive Model
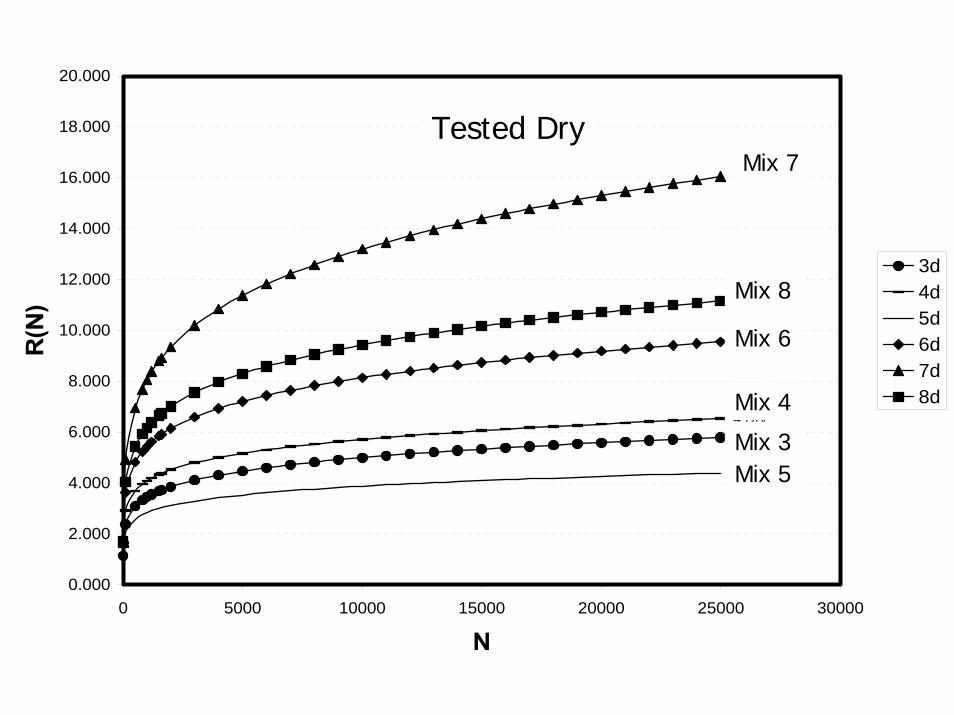
0.000
2.000
4.000
6.000
8.000
10.000
12.000
14.000
16.000
18.000
20.000
0 5000 10000 15000 20000 25000 30000
N
R(N
)
3d4d5d6d7d8d
5 Dry
7 Dry
8 Dry
6 Dry
4 Dry
3 Dry
Mix 7
Mix 8
Mix 6
Mix 4
Mix 3Mix 5
Tested Dry
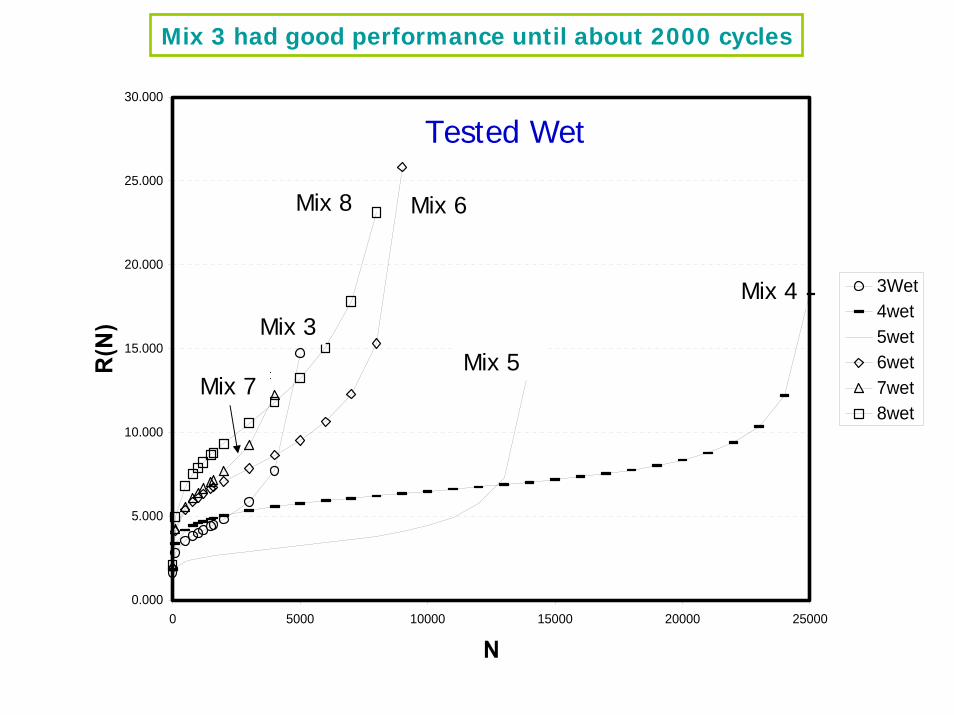
0.000
5.000
10.000
15.000
20.000
25.000
30.000
0 5000 10000 15000 20000 25000
N
R(N
)
3Wet4wet5wet6wet7wet8wet
4 Wet
7 Wet
3 Wet
8 Wet 6 Wet
5 WetMix 7
Mix 8 Mix 6
Mix 4Mix 3
Mix 5
Tested Wet
Mix 3 had good performance until about 2000 cycles
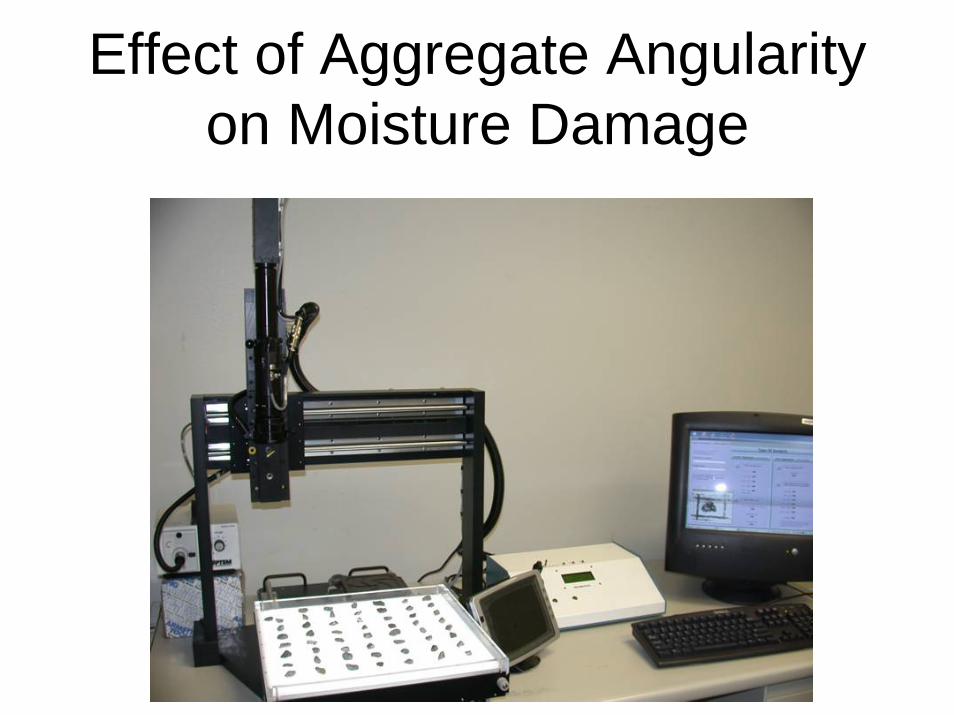
Effect of Aggregate Angularity on Moisture Damage
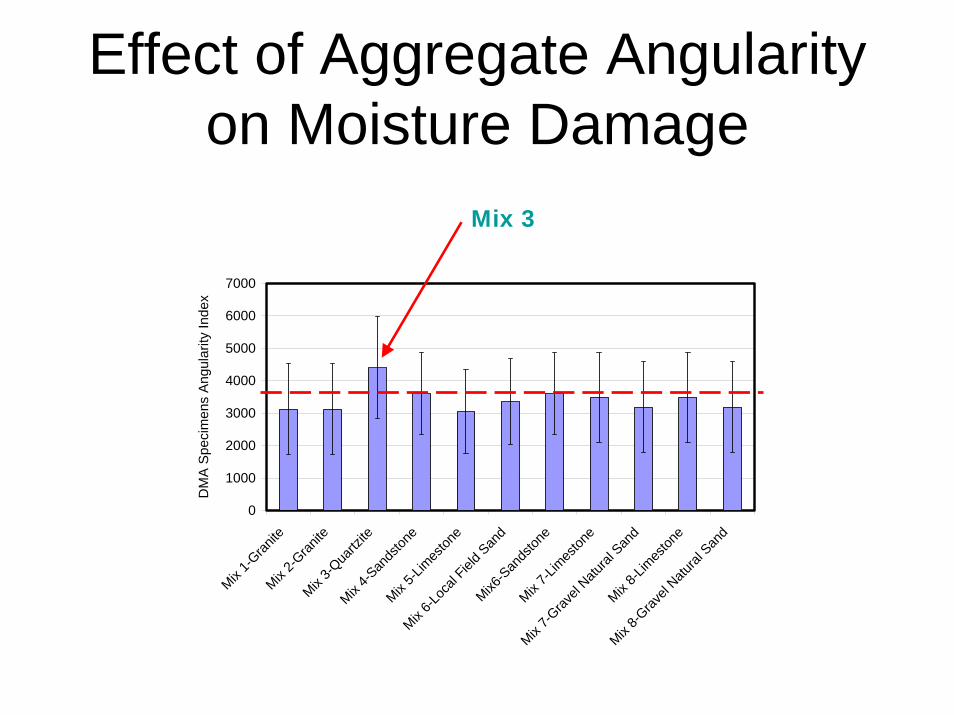
Effect of Aggregate Angularity on Moisture Damage
0
1000
2000
3000
4000
5000
6000
7000
Mix 1-G
ranite
Mix 2-G
ranite
Mix 3-Q
uartz
iteMix
4-San
dston
eMix
5-Lim
eston
e
Mix 6-L
ocal
Field S
and
Mix6-S
ands
tone
Mix 7-L
imes
tone
Mix 7-G
ravel
Natural
San
dMix
8-Lim
eston
e
Mix 8-G
ravel
Natural
San
d
DM
A S
peci
men
s A
ngul
arity
Inde
xMix 3
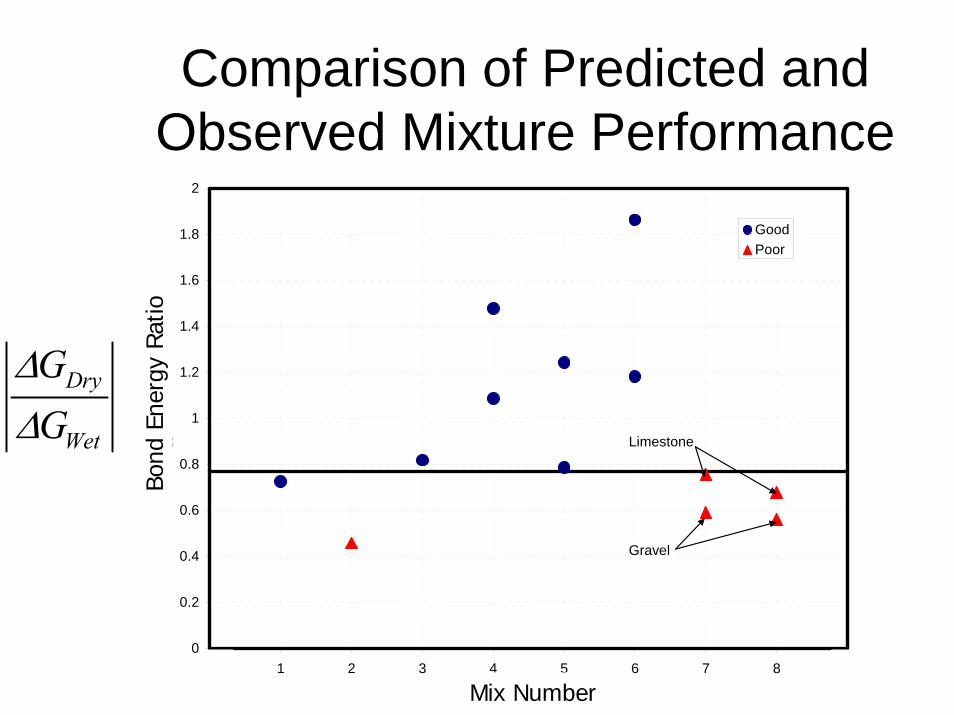
Comparison of Predicted and Observed Mixture Performance
0
0.2
0.4
0.6
0.8
1
1.2
1.4
1.6
1.8
2
0 1 2 3 4 5 6 7 8 9
Mix Number
Ene
rgy
Rat
io, R
Tota
l
GoodPoor
Limestone
Gravel
Mix Number
Bond
Ene
rgy
Rat
io
Dry
Wet
GG
ΔΔ
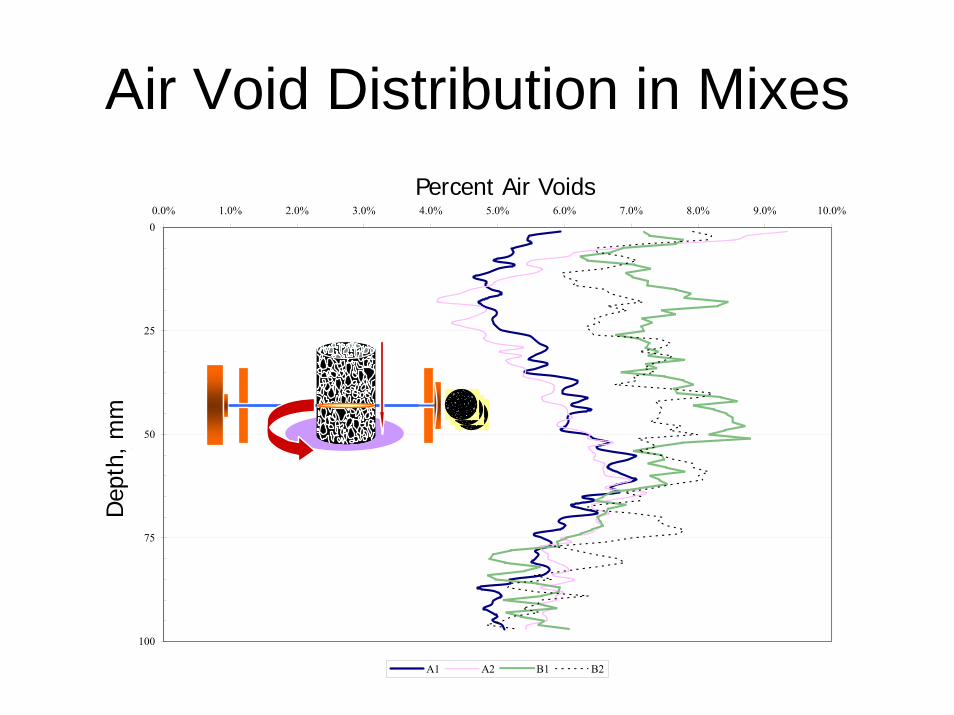
Air Void Distribution in Mixes
0
25
50
75
100
0.0% 1.0% 2.0% 3.0% 4.0% 5.0% 6.0% 7.0% 8.0% 9.0% 10.0%
Percent Air Voids
Dep
th (m
m)
A1 A2 B1 B2
Percent Air Voids
Dep
th, m
m

0
0.5
1
1.5
2
2.5
0.6 0.65 0.7 0.75 0.8 0.85 0.9
Average air void size (mm)
r wet/r d
ry a
t 100
0 lo
ad c
ycle
s
A1
A2
B1
B2
Average Air Void Radius, mm
Crac
k Rad
ius
(wet
)/Cr
ack
Rad
ius
(Dry
)
Moi
stur
e Su
scep
tibili
ty I
ncre
ases
A2
A1
B1
B2
All at the Same Percent Air Voids
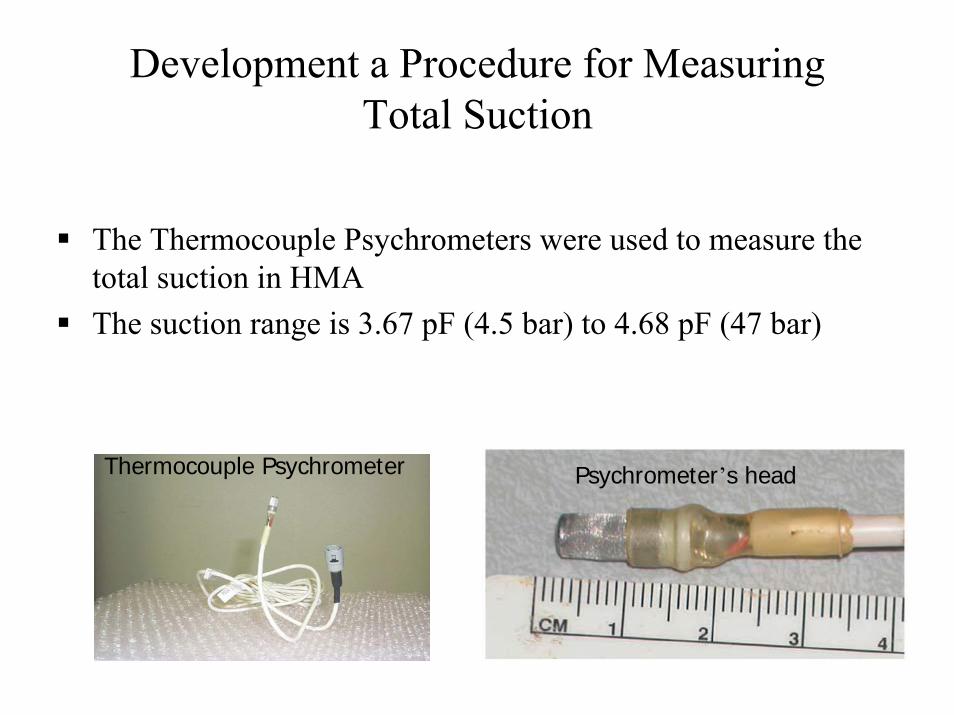
Development a Procedure for Measuring Total Suction
The Thermocouple Psychrometers were used to measure the total suction in HMA The suction range is 3.67 pF (4.5 bar) to 4.68 pF (47 bar)
Psychrometer’s headThermocouple Psychrometer
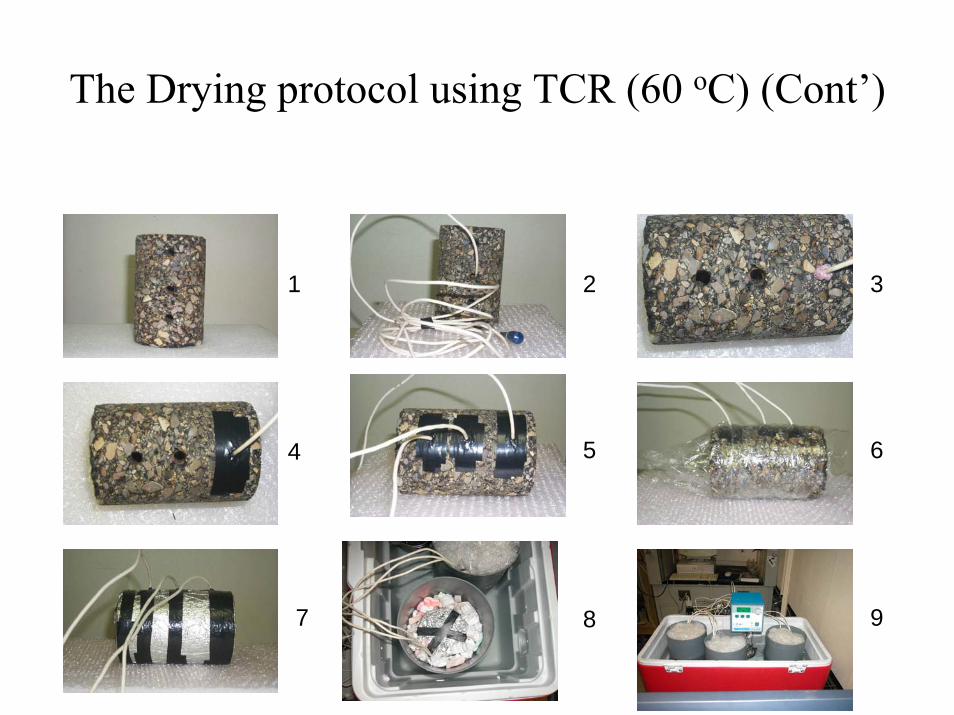
The Drying protocol using TCR (60 oC) (Cont’)
1 32
4 5
7
6
98
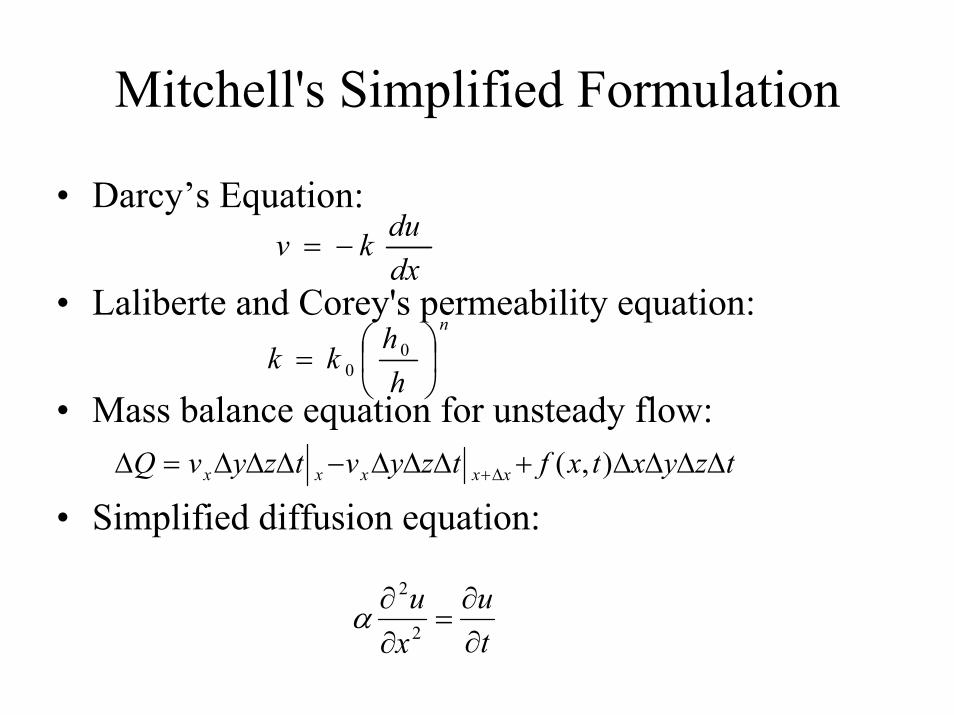
Mitchell's Simplified Formulation
• Darcy’s Equation:
• Laliberte and Corey's permeability equation:
• Mass balance equation for unsteady flow:
• Simplified diffusion equation:
dxdukv −=
n
hh
kk ⎟⎠⎞
⎜⎝⎛= 0
0
tzyxtxftzyvtzyvQ xxxxx ΔΔΔΔ+ΔΔΔ−ΔΔΔ=Δ Δ+ ),(
tu
xu
∂∂
=∂∂
2
2
α
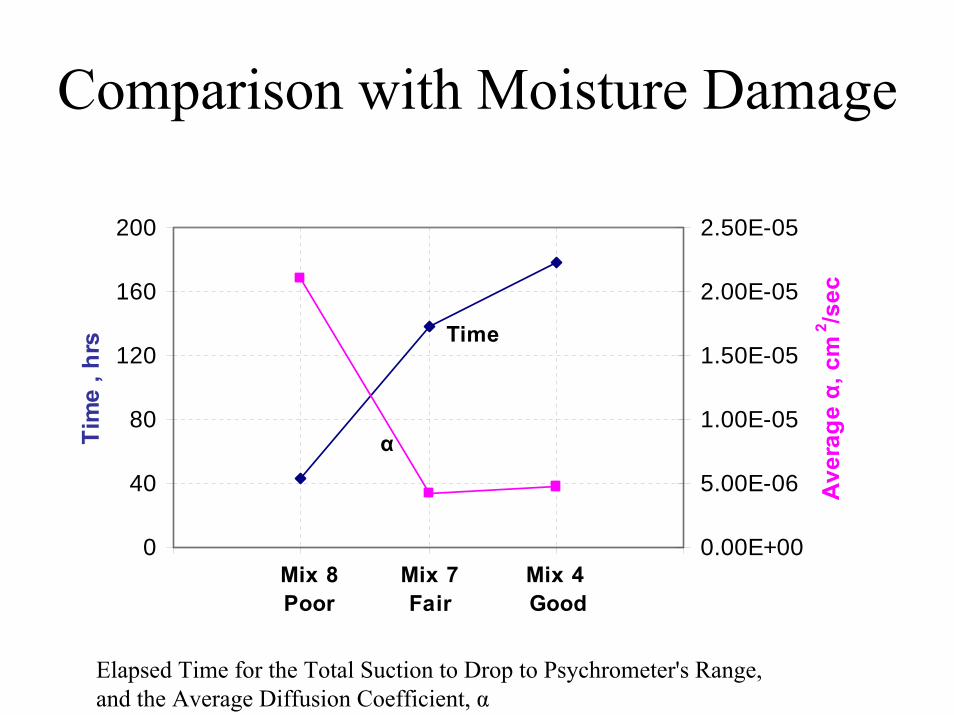
Comparison with Moisture Damage
0
40
80
120
160
200
0 1 2 3 4
Tim
e , h
rs
0.00E+00
5.00E-06
1.00E-05
1.50E-05
2.00E-05
2.50E-05
Ave
rage
α, c
m2 /s
ec
α
Mix 7Fair
Mix 4 Good
Mix 8Poor
Time
Elapsed Time for the Total Suction to Drop to Psychrometer's Range, and the Average Diffusion Coefficient, α
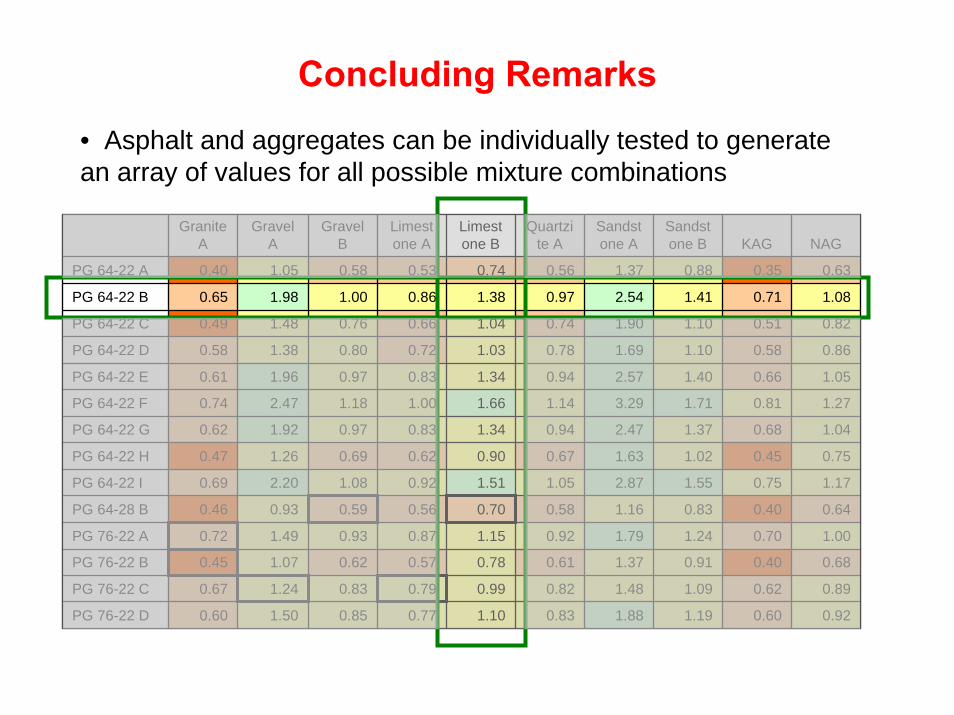
Concluding Remarks
• Asphalt and aggregates can be individually tested to generate an array of values for all possible mixture combinations
Granite A
Gravel A
Gravel B
Limestone A
Limestone B
Quartzite A
Sandstone A
Sandstone B KAG NAG
PG 64-22 A 0.40 1.05 0.58 0.53 0.74 0.56 1.37 0.88 0.35 0.63
PG 64-22 B 0.65 1.98 1.00 0.86 1.38 0.97 2.54 1.41 0.71 1.08
PG 64-22 C 0.49 1.48 0.76 0.66 1.04 0.74 1.90 1.10 0.51 0.82
PG 64-22 D 0.58 1.38 0.80 0.72 1.03 0.78 1.69 1.10 0.58 0.86
PG 64-22 E 0.61 1.96 0.97 0.83 1.34 0.94 2.57 1.40 0.66 1.05
PG 64-22 F 0.74 2.47 1.18 1.00 1.66 1.14 3.29 1.71 0.81 1.27
PG 64-22 G 0.62 1.92 0.97 0.83 1.34 0.94 2.47 1.37 0.68 1.04
PG 64-22 H 0.47 1.26 0.69 0.62 0.90 0.67 1.63 1.02 0.45 0.75
PG 64-22 I 0.69 2.20 1.08 0.92 1.51 1.05 2.87 1.55 0.75 1.17
PG 64-28 B 0.46 0.93 0.59 0.56 0.70 0.58 1.16 0.83 0.40 0.64
PG 76-22 A 0.72 1.49 0.93 0.87 1.15 0.92 1.79 1.24 0.70 1.00
PG 76-22 B 0.45 1.07 0.62 0.57 0.78 0.61 1.37 0.91 0.40 0.68
PG 76-22 C 0.67 1.24 0.83 0.79 0.99 0.82 1.48 1.09 0.62 0.89
PG 76-22 D 0.60 1.50 0.85 0.77 1.10 0.83 1.88 1.19 0.60 0.92
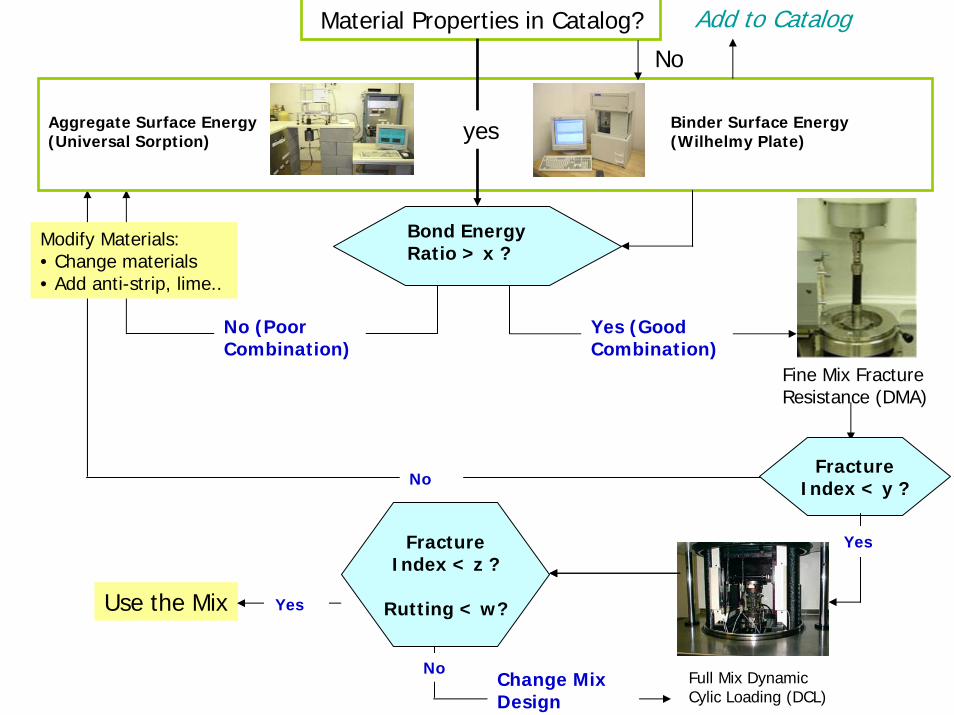
No
Bond Energy Ratio > x ?
Yes (Good Combination)
Fine Mix Fracture Resistance (DMA)
No (Poor Combination)
Modify Materials:• Change materials• Add anti-strip, lime..
Binder Surface Energy (Wilhelmy Plate)
Aggregate Surface Energy (Universal Sorption)
Material Properties in Catalog?
yes
Add to Catalog
No
Fracture Index < y ?
Full Mix Dynamic Cylic Loading (DCL)
Change Mix Design
Use the Mix
YesFracture Index < z ?
Rutting < w?Yes
No
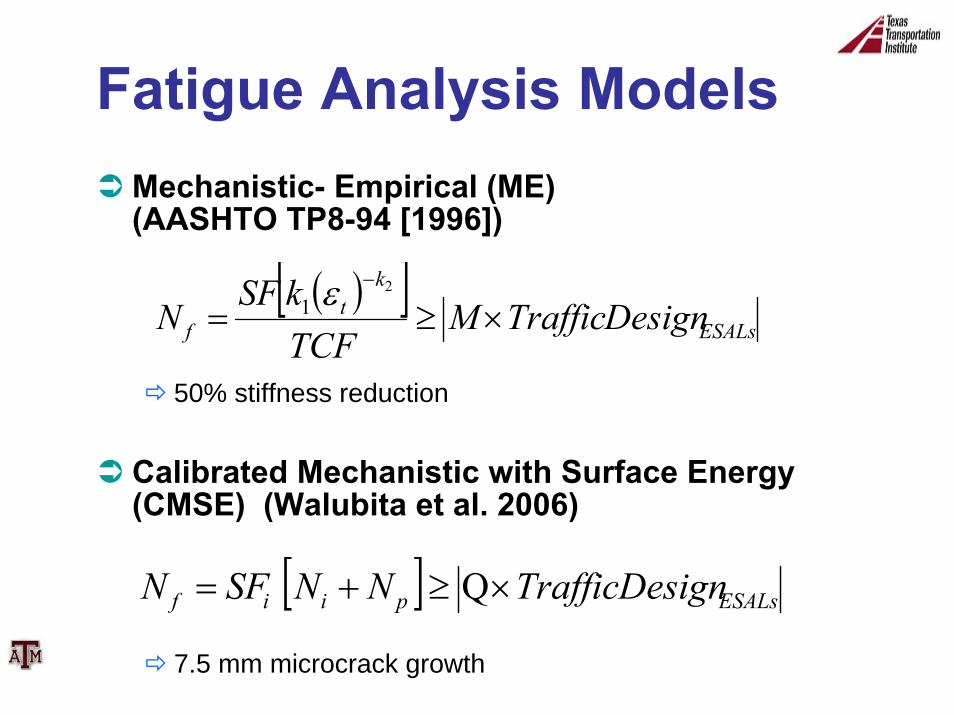
Fatigue Analysis ModelsMechanistic- Empirical (ME) (AASHTO TP8-94 [1996])
50% stiffness reduction
Calibrated Mechanistic with Surface Energy (CMSE) (Walubita et al. 2006)
7.5 mm microcrack growth
[ ] ESALspiif DesignTrafficNNSFN Q×≥+=
( )[ ]ESALs
kt
f DesignTrafficMTCFkSF
N 2
1 ×≥=−ε
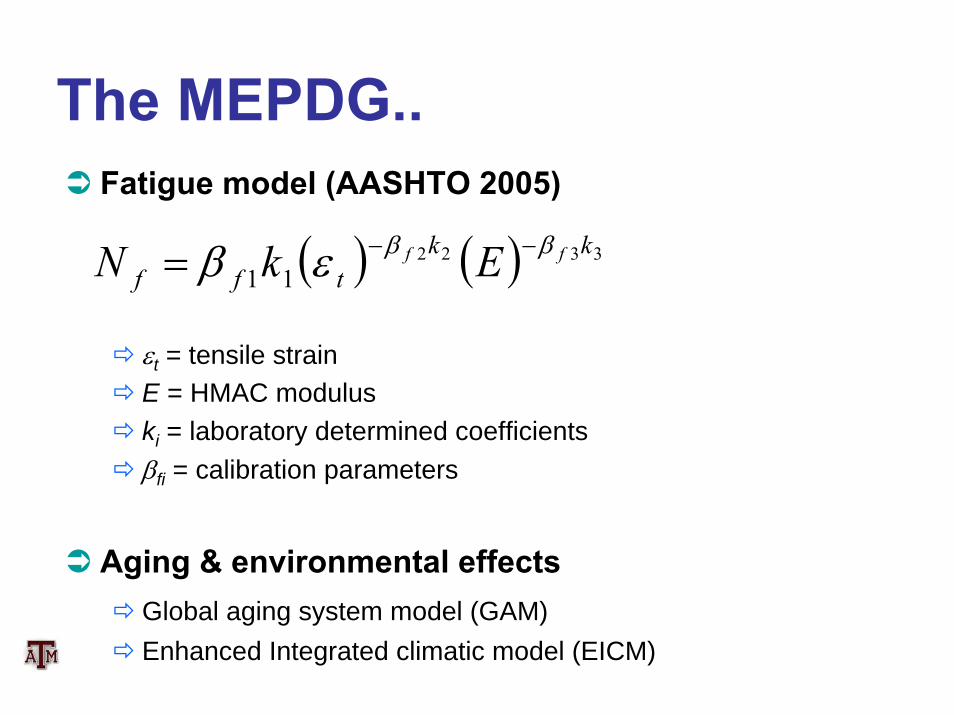
The MEPDG..Fatigue model (AASHTO 2005)
εt = tensile strainE = HMAC moduluski = laboratory determined coefficientsβfi = calibration parameters
Aging & environmental effectsGlobal aging system model (GAM) Enhanced Integrated climatic model (EICM)
( ) ( ) 332211
kktff
ff EkN ββεβ −−=
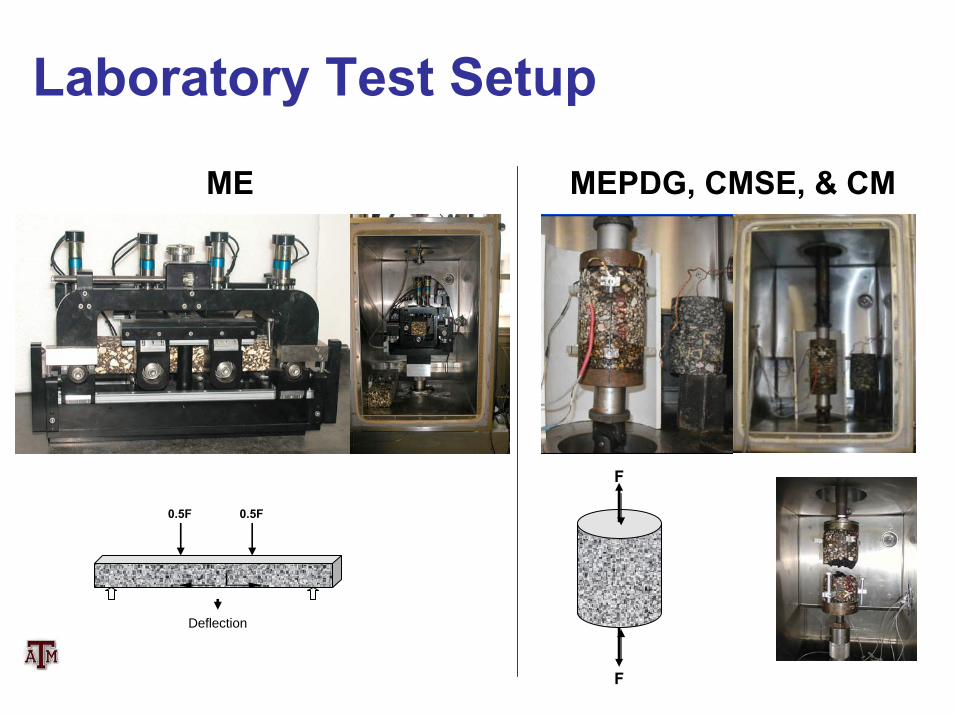
0.5F0.5F
Deflection
ME MEPDG, CMSE, & CM
F
F
Laboratory Test Setup
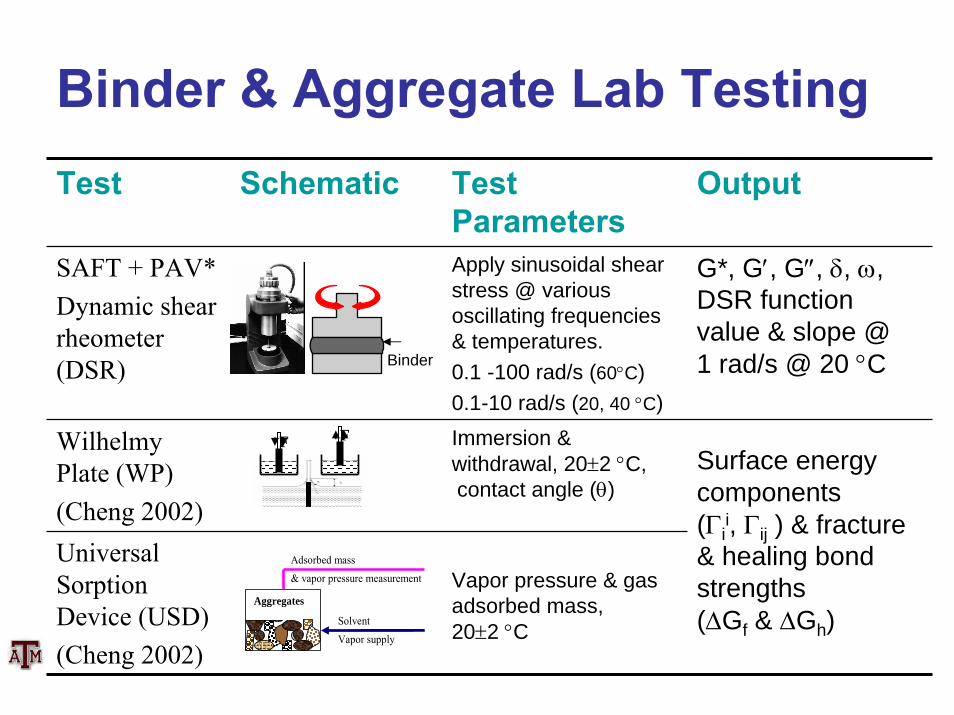
Binder & Aggregate Lab TestingTest Schematic Test
ParametersSAFT + PAV*Dynamic shear rheometer (DSR)
Apply sinusoidal shear stress @ various oscillating frequencies & temperatures.0.1 -100 rad/s (60°C)0.1-10 rad/s (20, 40 °C)
G*, G′, G″, δ, ω, DSR function value & slope @ 1 rad/s @ 20 °C
Immersion & withdrawal, 20±2 °C, contact angle (θ)
Vapor pressure & gas adsorbed mass, 20±2 °C
Output
Wilhelmy Plate (WP)(Cheng 2002)Universal Sorption Device (USD)(Cheng 2002)
Surface energy components (Γi
i, Γij ) & fracture & healing bond strengths (ΔGf & ΔGh)
F F
Aggregates
Solvent
Vapor supply
Adsorbed mass
& vapor pressure measurement
Binder
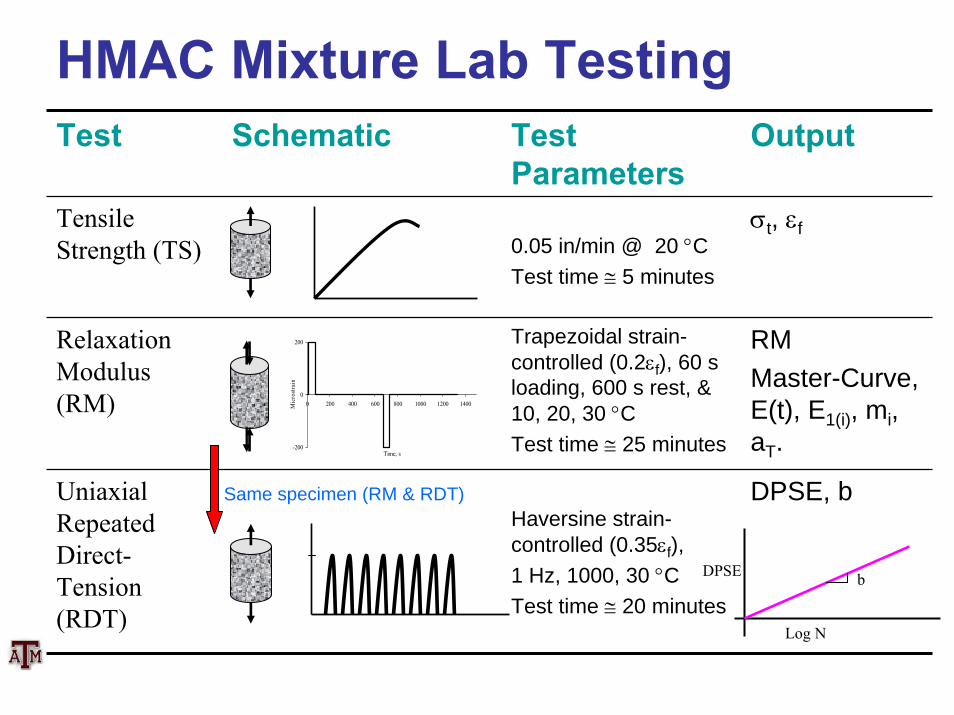
HMAC Mixture Lab TestingTest Schematic Test
Parameters
0.05 in/min @ 20 °CTest time ≅ 5 minutes
Trapezoidal strain-controlled (0.2εf), 60 s loading, 600 s rest, & 10, 20, 30 °C Test time ≅ 25 minutes
Haversine strain-controlled (0.35εf), 1 Hz, 1000, 30 °CTest time ≅ 20 minutes
Output
Tensile Strength (TS)
σt, εf
Relaxation Modulus (RM)
RM Master-Curve, E(t), E1(i), mi, aT.
Uniaxial Repeated Direct-Tension (RDT)
DPSE, b
-200
0
200
0 200 400 600 800 1000 1200 1400
Time, s
Mic
rostr
ain
DPSE
Log N
b
Same specimen (RM & RDT)
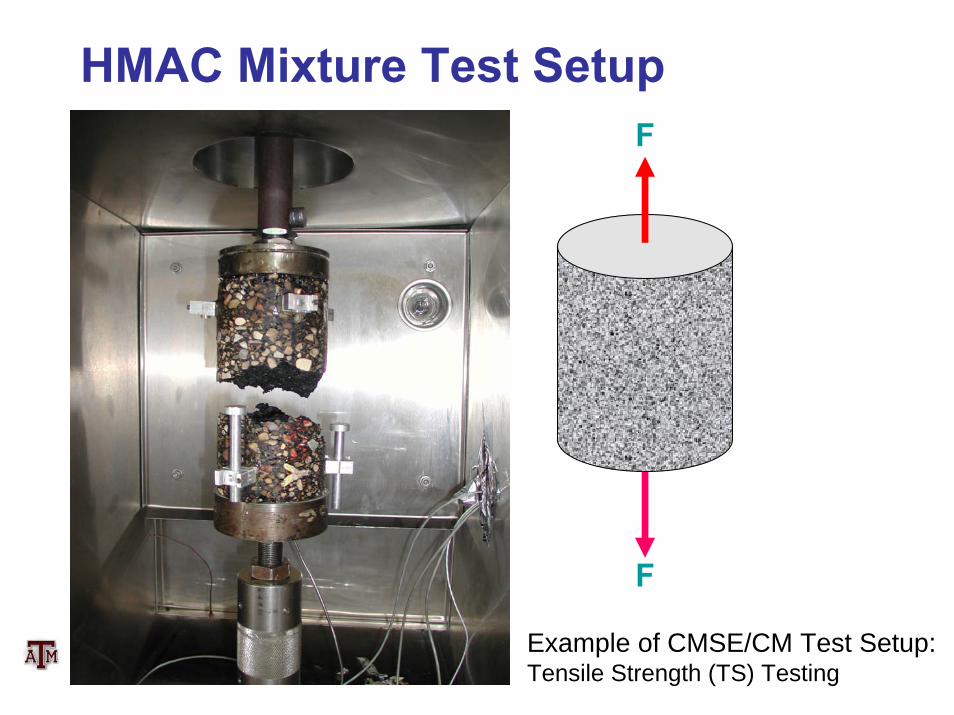
HMAC Mixture Test SetupF
F
Example of CMSE/CM Test Setup: Tensile Strength (TS) Testing
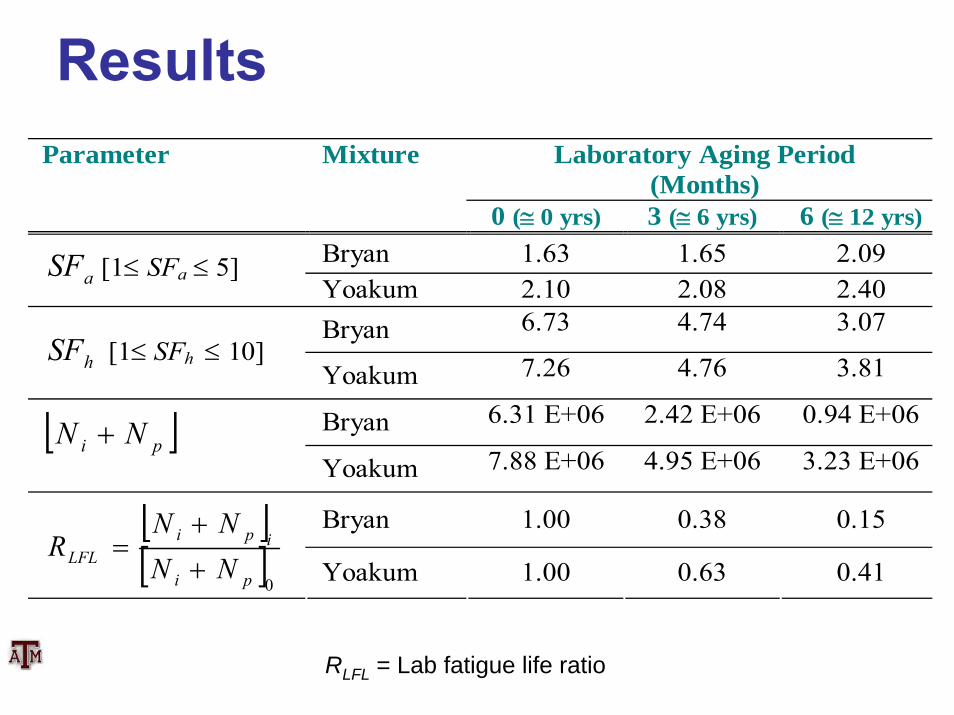
Results
RLFL = Lab fatigue life ratio
Laboratory Aging Period
(Months) Parameter Mixture
0 (≅ 0 yrs) 3 (≅ 6 yrs) 6 (≅ 12 yrs)Bryan 1.63 1.65 2.09
aSF [1≤ SFa ≤ 5] Yoakum 2.10 2.08 2.40 Bryan 6.73 4.74 3.07
hSF [1≤ SFh ≤ 10] Yoakum 7.26 4.76 3.81
Bryan 6.31 E+06 2.42 E+06 0.94 E+06
[ ]pi NN + Yoakum 7.88 E+06 4.95 E+06 3.23 E+06
Bryan 1.00 0.38 0.15
[ ][ ]
0pi
ipiLFL NN
NNR
+
+=
Yoakum 1.00 0.63 0.41
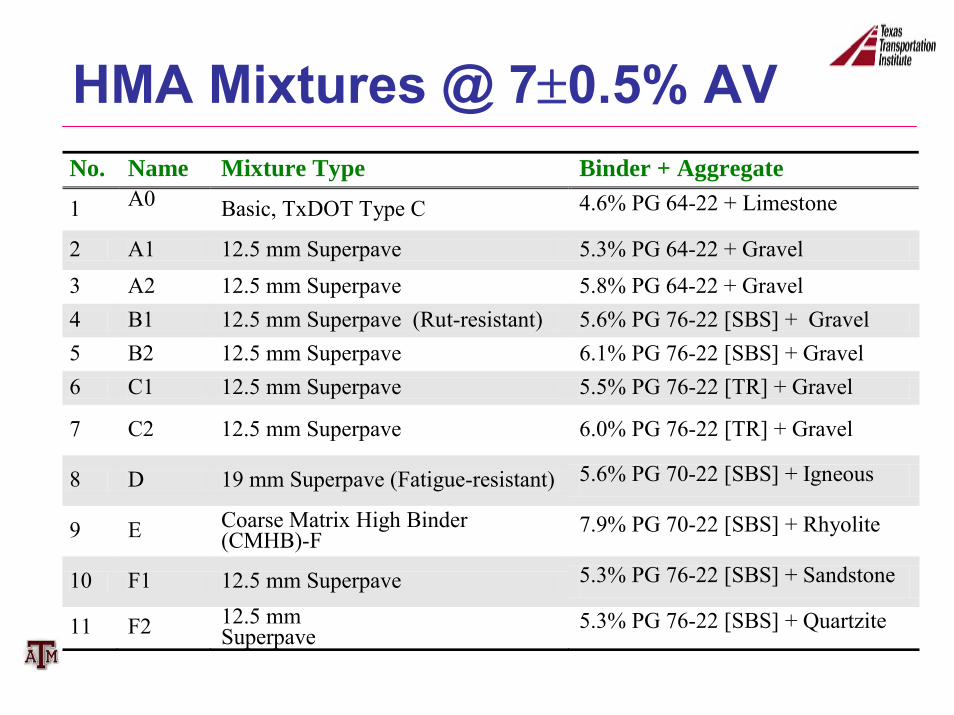
HMA Mixtures @ 7±0.5% AVNo. Name Mixture Type Binder + Aggregate
1 A0 Basic, TxDOT Type C 4.6% PG 64-22 + Limestone
2 A1 12.5 mm Superpave 5.3% PG 64-22 + Gravel 3 A2 12.5 mm Superpave 5.8% PG 64-22 + Gravel 4 B1 12.5 mm Superpave (Rut-resistant) 5.6% PG 76-22 [SBS] + Gravel 5 B2 12.5 mm Superpave 6.1% PG 76-22 [SBS] + Gravel 6 C1 12.5 mm Superpave 5.5% PG 76-22 [TR] + Gravel
7 C2 12.5 mm Superpave 6.0% PG 76-22 [TR] + Gravel
8 D 19 mm Superpave (Fatigue-resistant) 5.6% PG 70-22 [SBS] + Igneous
9 E Coarse Matrix High Binder (CMHB)-F
7.9% PG 70-22 [SBS] + Rhyolite
10 F1 12.5 mm Superpave 5.3% PG 76-22 [SBS] + Sandstone
11 F2 12.5 mm Superpave
5.3% PG 76-22 [SBS] + Quartzite
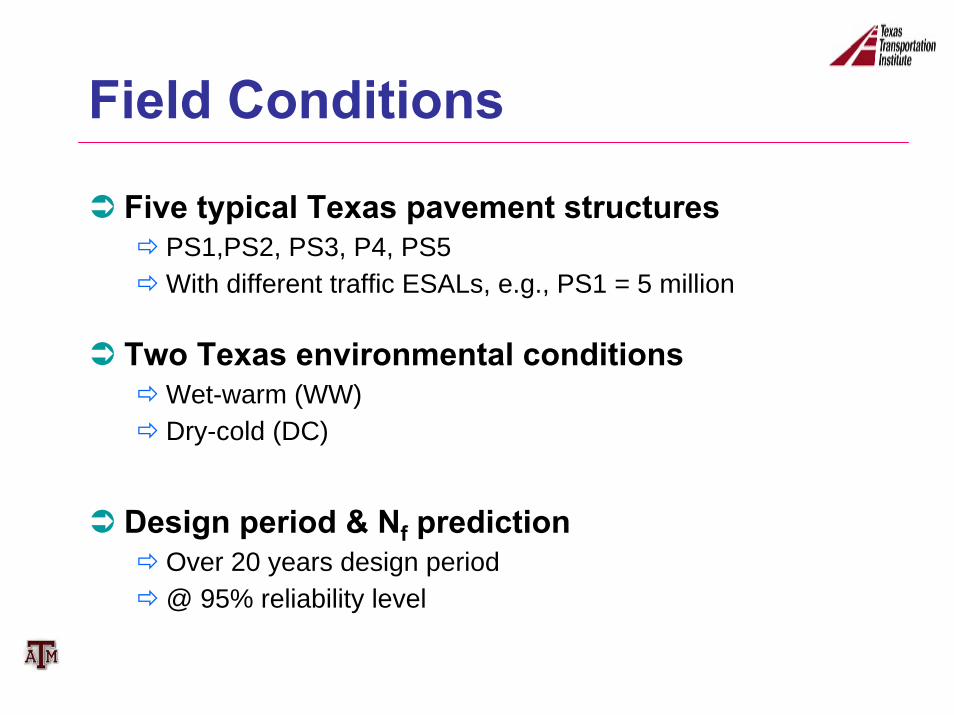
Field Conditions
Five typical Texas pavement structuresPS1,PS2, PS3, P4, PS5With different traffic ESALs, e.g., PS1 = 5 million
Two Texas environmental conditionsWet-warm (WW)Dry-cold (DC)
Design period & Nf predictionOver 20 years design period@ 95% reliability level
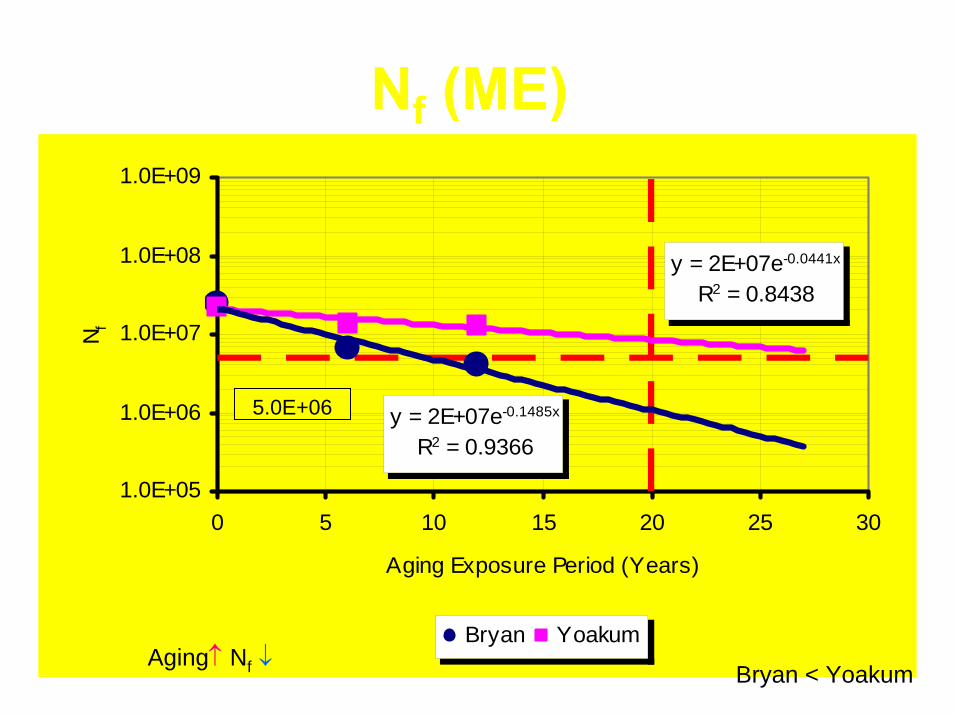
Nf (ME)
y = 2E+07e-0.0441x
R2 = 0.8438
y = 2E+07e-0.1485x
R2 = 0.9366
1.0E+05
1.0E+06
1.0E+07
1.0E+08
1.0E+09
0 5 10 15 20 25 30
Aging Exposure Period (Years)
N f
Bryan Yoakum
5.0E+06
Aging↑ Nf ↓Bryan < Yoakum
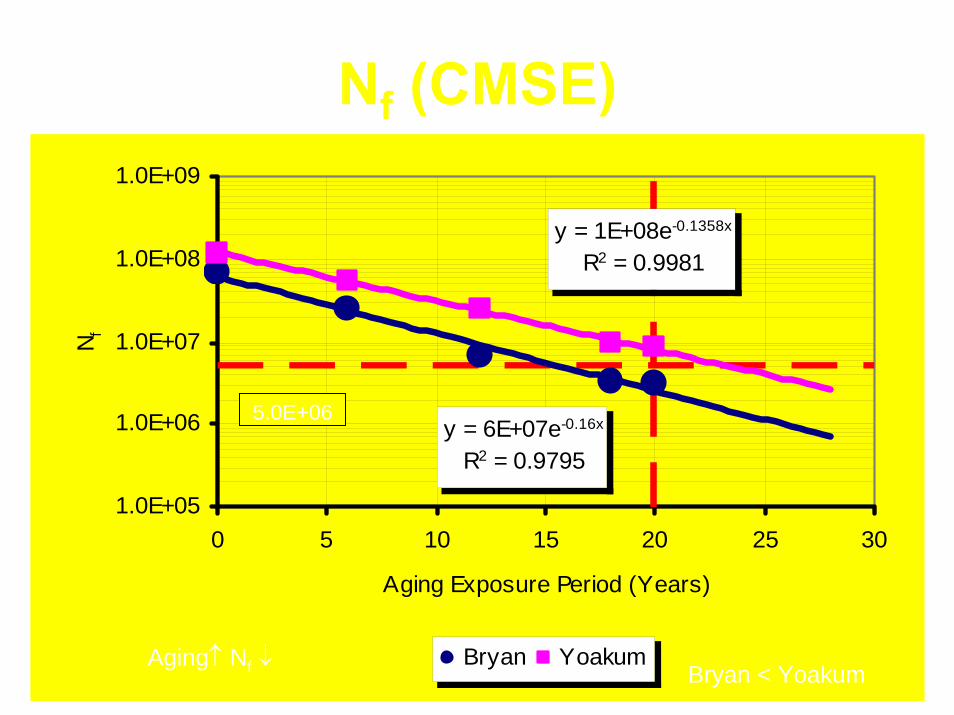
Nf (CMSE)
y = 1E+08e-0.1358x
R2 = 0.9981
y = 6E+07e-0.16x
R2 = 0.9795
1.0E+05
1.0E+06
1.0E+07
1.0E+08
1.0E+09
0 5 10 15 20 25 30
Aging Exposure Period (Years)
N f
Bryan Yoakum
5.0E+06
Aging↑ Nf ↓Bryan < Yoakum
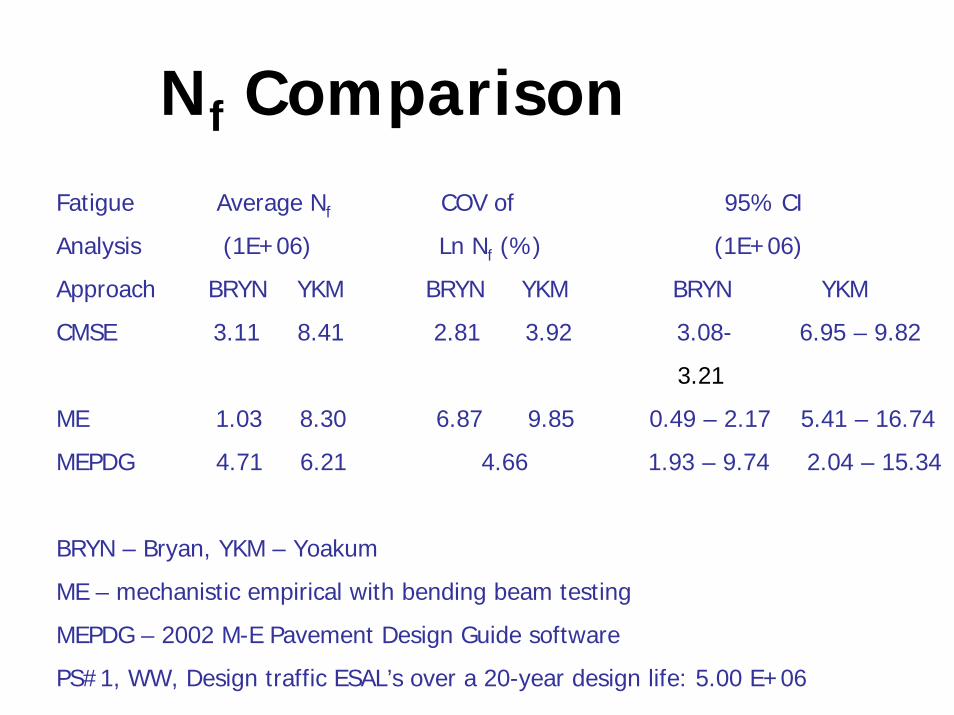
Nf ComparisonFatigue Average Nf COV of 95% CI
Analysis (1E+06) Ln Nf (%) (1E+06)
Approach BRYN YKM BRYN YKM BRYN YKM
CMSE 3.11 8.41 2.81 3.92 3.08- 6.95 – 9.82
3.21
ME 1.03 8.30 6.87 9.85 0.49 – 2.17 5.41 – 16.74
MEPDG 4.71 6.21 4.66 1.93 – 9.74 2.04 – 15.34
BRYN – Bryan, YKM – Yoakum
ME – mechanistic empirical with bending beam testing
MEPDG – 2002 M-E Pavement Design Guide software
PS#1, WW, Design traffic ESAL’s over a 20-year design life: 5.00 E+06
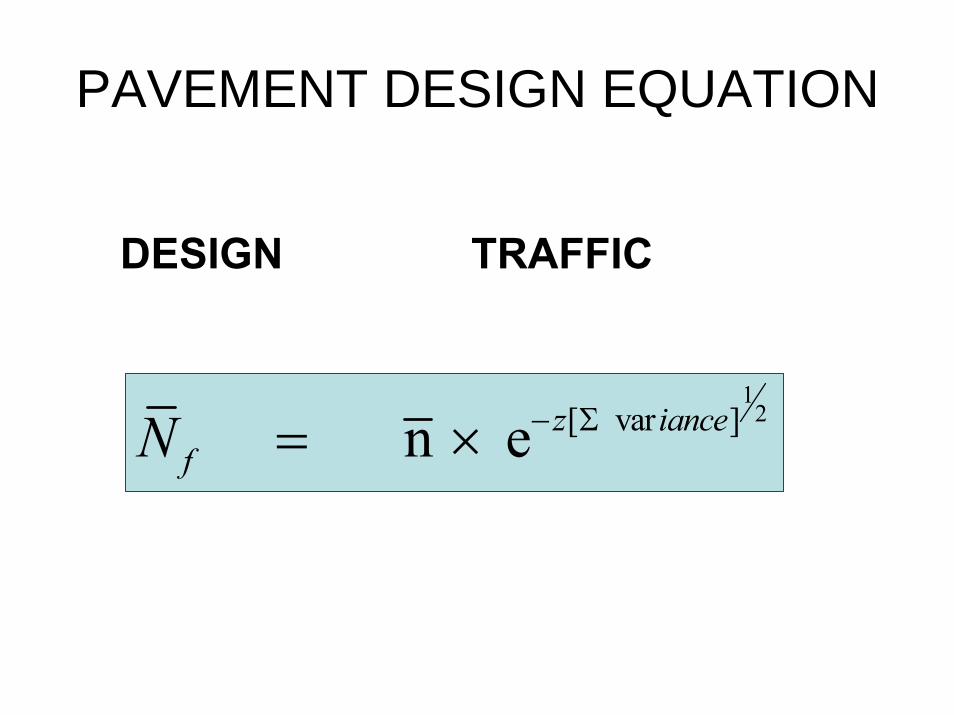
PAVEMENT DESIGN EQUATION
DESIGN TRAFFIC
12[ var ] n e z iance
fN − Σ= ×
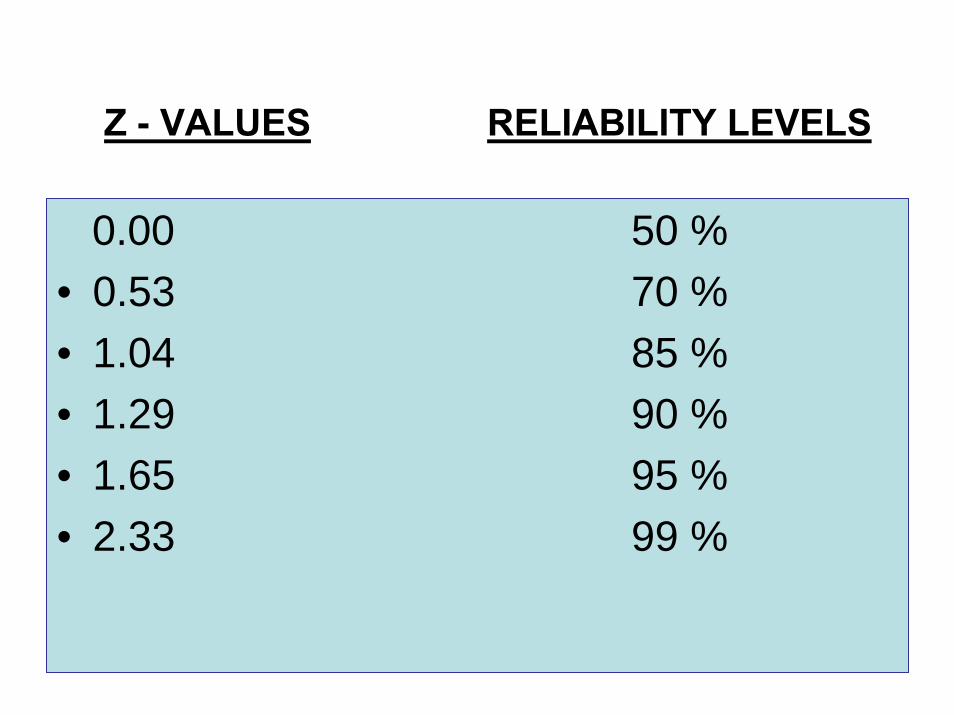
Z - VALUES RELIABILITY LEVELS
0.00 50 %• 0.53 70 %• 1.04 85 %• 1.29 90 %• 1.65 95 %• 2.33 99 %
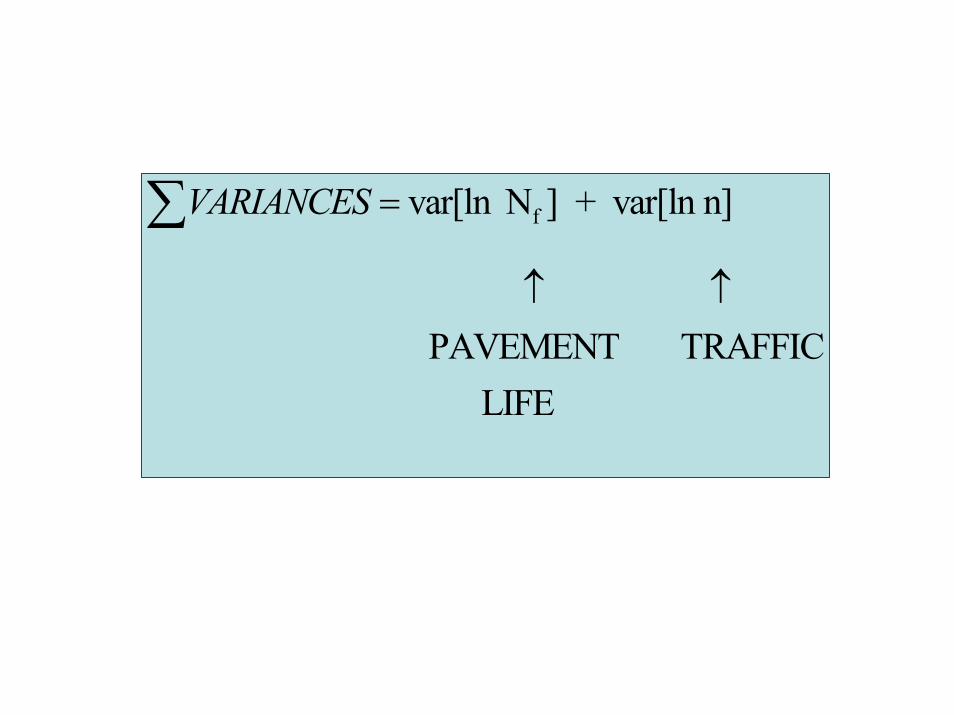
fvar[ln N ] + var[ln n]
PAVEMENT TRAFFIC LIFE
VARIANCES =
↑ ↑
∑
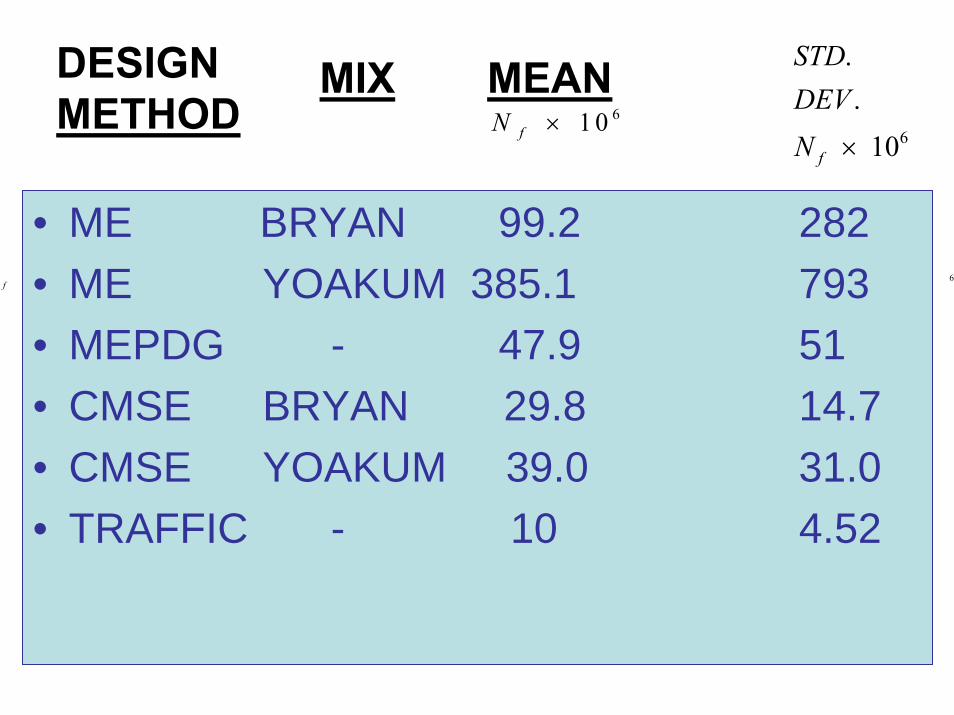
DESIGNMETHOD
• ME BRYAN 99.2 282• ME YOAKUM 385.1 793• MEPDG - 47.9 51• CMSE BRYAN 29.8 14.7• CMSE YOAKUM 39.0 31.0• TRAFFIC - 10 4.52
f6
6 1 0fN ×MIX MEAN
6
.. 10f
STDDEVN ×
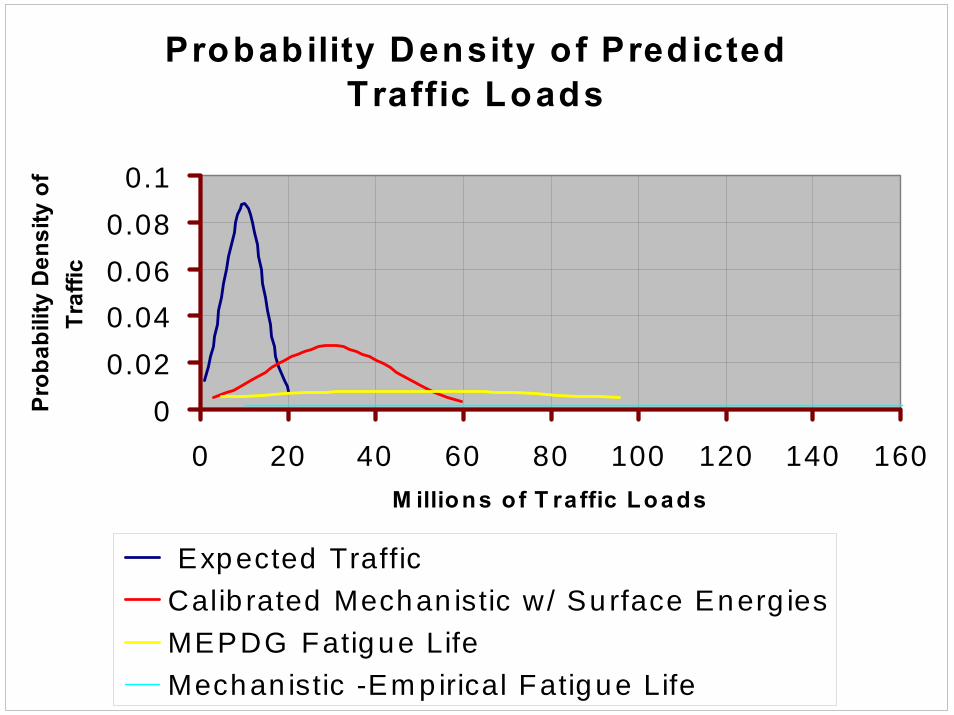
Probability Density of Predicted Traffic Loads
00.020.040.060.08
0.1
0 20 40 60 80 100 120 140 160M illions o f T ra ffic Loads
Prob
abili
ty D
ensi
ty o
f Tr
affic
Expected TrafficCalib rated Mechan istic w/ Su rface Energ iesMEPDG Fatigue LifeMechan istic -Em p irical Fatigue Life
PURPOSES OF FATIGUE CRACKING PREDICTION
• DESIGN RELIABILITY• INCENTIVE PAY FOR CONSTRUCTION
QUALITY• PERFORMANCE SPECIFICATIONS• WARRANTY RISK ASSESSMENT• PAVEMENT ASSET MANAGEMENT
FATIGUE CRACKING
Robert L. LyttonCRACKING IN ASPHALT PAVEMENTS
PAVEMENT PERFORMANCE PREDICTION SYMPOSIUM 2007
WESTERN RESEARCH INSTITUTELARAMIE, WYOMING
JULY 18 – 20, 2007


![Edward Bulwer-Lytton - The Coming Race [1871] (01)](https://img.pdfslide.us/doc/110x75/577cc86e1a28aba711a2cc56/edward-bulwer-lytton-the-coming-race-1871-01.jpg)
