Embed Size (px)
Citation preview

Fatigue Crack Propagation in Amorphous Poly(ethy1ene t e rep h t h a I ate) *
ALVARO RAMIREZ, JOHN A. MANSON and RICHARD W. HERTZBERG
Materials Research Center Lehigh University
Bethlehem, Pennsylvania 18015
Earlier studies of fatigue crack propagation (FCP) in poly- mers have shown a general superiority of crystalline relative to amorphous polymers in terms of FCP resistance. In order to study in detail the effect ofcrystalline content and character on FCP rates, poly(ethy1ene terephthalate) (PET) was selected as a convenient material in which a wide range of crystallinity can be obtained. To provide a baseline for comparison, FCP rates were determined for essentially amorphous polymers covering a range of molecular weight. Surprisingly, the essentially amorphous PET turned out to be as resistant to FCP as the best crystalline polymers so far observed. In this paper, several ob- servations about FCP rates and fracture topography are re- ported: FCP rates agree well with the Paris equation over a wide range ofAK; in any case, the higher the molecular weight, the greater the crack growth resistance according to the Manson-Hertzberg relationship previously established. Frac- ture surface analysis revealed evidence of softening and draw- ing, as well as extensive plastic deformation. We suggest that PET can undergo, under cycling loading, both extensive draw- ing and actual crystallization at the crack tip to form an efficient, crack-resistant network. Thus, PET appears to be the first thermoplastic observed to be self-reinforcing in fatigue.
INTRODUCTION n our earliest studies of fatigue crack propagation
behavior exhibited was much greater than is the case with metals. Thus, in a typical poly(methy1 methacry- late) (PMMA), a crack grew 1300 times faster than in a typical polycarbonate, at an equivalent range in stress intensity factor, AK. Since a specimen of nylon 66 was found to be still more resistant than the polycarbonates, it was suggested that, in comparison with an amorphous polymer, a crystalline polymer might well provide mechanisms for dissipating energy that do not exist in an amorphous polymer. In other words, extensive transformation of a crystalline network to a new mor- phology takes place on deformation past the yield point (2, 3). Such a transformation is accompanied by the ex- penditure of considerable energy in addition to that corresponding to the surface energy. More recent ex- periments have confirmed the general superiority of crystalline relative to amorphous polymers in terms of FCP resistance (1). To be sure, significant increases in FCP resistance in amorphous or mesomorphic poly- mers like PMMA and poly(viny1 chloride) can be achieved simply by increasing the molecular weight
I ( F C P ) in . polymers (I), we observed that the range of
* Presented at the Symposium on Polymer Fatigue and Nonlinear Behavior, 182nd National Meeting, American Chemical Society, New York, August 23-28, 1981
(and hence, the effectiveness of the entanglement net- work opposing progress of the crack) or by including a rubbery phase (thereby enhancing the ductility of the matrix) (4, 5). However, while some of these materials were as resistant to FCP as polycarbonate, none achieved the resistance of nylon 66 (6), nylon 6 (6), polyacetal (7) or, especially, poly(viny1idene fluoride) (8)-all crystalline polymers. One amorphous polyamide was also studied, and found to be much less resistant to FCP than polycarbonate (Ref. 1, p. 130).
In view of these findings, it was decided to study the effects of crystalline content and character on FCP rates (9). In fact, Laghouati, et al. (lo), have found crystalline texture in polyethylene to play a major role in FCP re- sistance. Unfortunately, a wide range of crystallinity cannot be obtained in either polyethylene or nylon 66, at least with specimens thick enough to study FCP rates. We therefore sought a polymer in which the crystallinity could be readily varied from essentially zero to a reasonably high value (say, 40 percent). Poly- (ethylene terephthalate) (PET) was selected as a candi- date having that advantage; in addition, it was possible to obtain a range of molecular weights. While PET has been most commonly used as a fiber or as a biaxially oriented sheet, blow-molded products are being used
POLYMER ENGINEERING AND SCIENCE, OCTOBER, 1982, Vol. 22, No. 15 975
Alvaro Ramirez, John A . Manson and Richard W. Hertzberg
to an increasing extent, and there has been considerable interest in injection-molding as well (11).
In order to provide a baseline for comparison, FCP rates were determined for essentially amorphous PETS covering a range of molecular weight. Surprisingly, the essentially amorphous polymers turned out to encom- pass about as high a range of FCP resistance observed in any polymer so far-amorphous or crystalline. In this article, preliminary observations of FCP rates and frac- ture topography are reported, and future explorations suggested.
EXPERIMENTAL
Characterization
Injection-molded sheets of PET (3 mm * 15 cm * 15 cm) were kindly supplied by Dr. S. L. Kim through the courtesy of the Goodyear Tire and Rubber Co. The sheets had been quenched to a room temperature of 25°C in order to produce an essentially amorphous product. Number-average molecular weights, M,, were determined viscometrically in 60/40 phenolhetra- chloroethane solutions at 25°C using the equation [ T ] = 7.5 . (12). Values of M,/M,, the ratio of weight to number-average molecular weight, were esti- mated from the relationship M d M , = 1 + p , where M , = Md(1 - p ) , r-, being the fractional conversion, and M , the molecular weight of the repeat unit (13). Since PET is well-known to undergo degradation of molecular weight on heating, molecular weights were determined before fatigue testing.
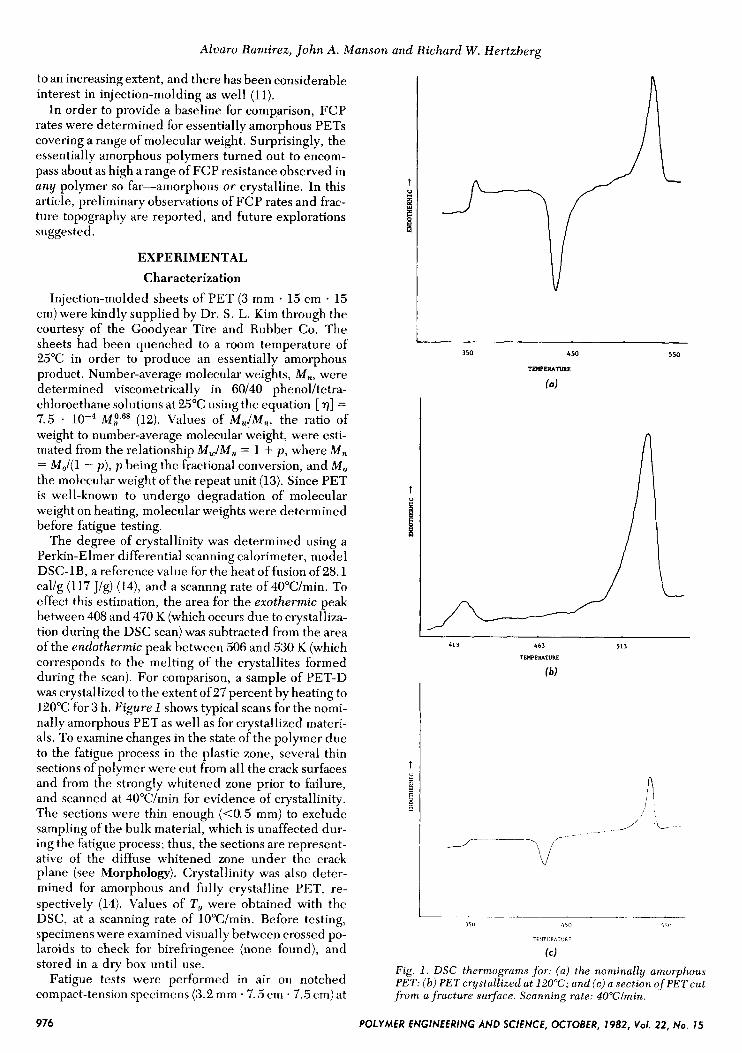
The degree of crystallinity was determined using a Perkin-Elmer differential scanning calorimeter, model DSC-IB, a reference value for the heat of fusion of 28.1 cal/g (117 J/g) (14), and a scannng rate of 40"C/min. To effect this estimation, the area for the exothermic peak between 408 and 470 K (which occurs due to crystalliza- tion during the DSC scan) was subtracted from the area of the endothermic peak between 506 and 530 K (which corresponds to the melting of the crystallites formed during the scan). For comparison, a sample of PET-D was crystallized to the extent of 27 percent by heating to 120°C for 3 h. Figure 1 shows typical scans for the nomi- nally amorphous PET as well as for crystallized materi- als. To examine changes in the state of the polymer due to the fatigue process in the plastic zone, several thin sections of polymer were cut from all the crack surfaces and from the strongly whitened zone prior to failure, and scanned at 40"C/min for evidence of crystallinity. The sections were thin enough (<O. 5 mm) to exclude sampling of the bulk material, which is unaffected dur- ing the fatigue process; thus, the sections are represent- ative of the diffuse whitened zone under the crack plane (see Morphology). Crystallinity was also deter- mined for amorphous and fully crystalline PET, re- spectively (14). Values of T , were obtained with the DSC, at a scanning rate of 1O0C/min. Before testing, specimens were examined visually between crossed po- laroids to check for birefringence (none found), and stored in a dry box until use.
Fatigue tests were performed in air on notched compact-tension specimens (3.2 mm 7.5 cm .7.5 cm) at
350 450 550
TEWEFAfllRE
(a)
4 1 3 463 513
TEIOEIUTURE
I b)
3511 45n i ) , I
TI ' IPIY.\TI IRr
(d Fig. I. DSC thermograms for: (a) the nominally amorphous PET: (b) PET crystallized at 120°C; and (c) a section of PETcut f rom a fracture surface. Scanning rate: 40"Clmin.
976 POLYMER ENGINEERING AND SCIENCE, OCTOBER, 1982, Vol. 22, No. 15

Fatigue Crack Propagation in Amorphous Poly(ethy1ene terephthalate)
a sinusoidal frequency of 10 Hz, and a ratio of minimum to maximum load of 0.1, using an electrohydraulic closed-loop test machine and standard procedures (4). Values of the stress intensity factor range, AK, were cal- culated from the equation AK = Y A d , where Y is a geometrical factor, Acr the stress range, and a the crack length (15). FCP rates were plotted in terms of the crack growth rate per cycle, daldN, as a function of A K A K m , , was taken to be the final value of AK prior to uncontrolled crack growth, and a relative value of frac- ture toughness, K,, was taken as equal to AKmaz10.9 (4). Fracture surfaces were examined using an optical mi- croscope (reflected light) and an ETEC scanning elec- tron (SEM), for which specimens were prepared by goldlpalladium coating. Fracture surfaces and portions of the face of the specimen containing the crack were also etched (for 20 h) using a 40 percent solution of methylamine in water to reveal morphological detail; this etchant preferentially attacks amorphous polymer (16). Preliminary measurements of temperatures at the crack tip were made using a Barnes infrared camera, model RM-2B.
RESULTS AND DISCUSSION Characterization
As shown in Table 1, the PET specimens range in an from 12,500 to 28,700. As expected, the values of an are all lower than those obtained before molding (see Fig. 2 ) . Since FCP rates are sensitive to molecular weight, it is important to characterize an after the application of any thermal treatment. The essentially amorphous na- ture of the quenched samples was confirmed by use of the DSC (Fig . 1 ) and the density gradient column. Values of To are self-consistent and in agreement with those in the literature (17). Thus, although dynamic- mechanical tests are yet to be made, the specimens ap- pear so far to be well-behaved in all respects.
Fatigue Crack Propagation As shown in F i g . 3 , all the curves of FCP as a function
of AK agree well with the Paris equation over a wide range of AK: da1dN = AAKn. (For values of n, see Table 2 . ) With this range of AK, duplicate tests gave values of h l d N (at a given AK) that agreed within ? 15 percent. Average slopes of the &/dN curve (Table 2) tend to in- crease from a value of 5.8 (+O. 8) to 8.8 ( I tO. 7), as the
Table 1. Characteristics of PET Specimens -
Sample M, Mw/%fn Density, g/cm3 T,, "C % Cryst."
PET-A 12,500 1.98 1.334 66c Cl(O.8) PET-B 19,500 1.99 1.334 67' <2(0.8) PET-C 21,000 1.99 1.333 67c <2(0) PET-D 28,700 1.99 1.334 67' <2(0.8) PET-D 27 (27)
(A, B,C,D)b PET X (38-46)
Numbers refer to use of DSC and, In parentheses, to use of the density gradient column, respectively. Samples taken from whltened zones of specimens A to D, inclusive: values of X crystaliinlty tali wlthln the range given. The melting peak extended from 51 0" to 560°K. (237" to 281%). For crystalllnlty In other zones, see Mechanisms of Toughenlng. Literature values (17) in the range 66 to 80°C.
20 1 . I
a_
L 0 O 4 /
.f
/
/
*\? 4L 0 +-t
a a 61 61 .-i N m t
CJ
Initial M n X lE3 F i g . 2 . Decrease in G,, induced by the molding of PET. Values before molding supplied by Dr. S . L. Kim (Goodyear Tire and Rubber Co.), who used the same uiscometric method (1.2) as it was used here.
value of M , increases from 12,500 to 28,700. The last points on the curves correspond to the last observations prior to the onset of a stage of uncontrolled crack growth, which lasted for from 15 to 20 cycles. Then the amorphous samples failed by gross yielding without separation into two pieces, while the crystalline sample failed by yielding accompanied by actual rupture. In all cases, crack growth was accompanied by a progres- sive increase of surface temperature at the crack tip. Preliminary observations with PET-A indicate that the temperature rises after cycling begins at 29"C, remains at 29°C until just before final yielding, when the tem- perature rises rapidly to 80 to 90°C. PET-D behaves similarly, except that the steady-state temperature is slightly higher, 33°C. (A detailed study of temperature profiles at crack tips as a function of loading conditions is in progress.)
The tendency of the FCP curves to converge at high values of AK would be expected to result in a fairly small range in AKm,,. In fact values of AK,,, range be- tween 5.0 and 6.3 M P a G f o r the amorphous pol - mers, in comparison with a value of 6.8 MPa& for the 27-percent-crystalline PET-D. While AK,,, increases as an increases from 12,500 to 19,500, a fur-
Table 2. Fatigue Characteristics of PET
Slope", n A = . 107 K,,,
PET-A 10 1.27 5.0 6.0 5.0 6.6 PET-B 2.57 0.92 5.7 6.4 5.5 6.4 PET-C 0.1 0.25 6.3 5.6 8.0 7.2 PET-D 0.01 0.07 5.5 6.2 9.5 8.1 PET-D(27) 8.5
a From Pads equation, da/dN = AAK"
977 POLYMER ENGINEERING AND SCIENCE, OCTOBER, 1982, Yo/. 22, No. 15
Alvaro Ramirez, John A. Manson and Richard W. Hertzberg
\ E E -3 i -u \ 0 -4
7J
0) 0
A-5 l+l 0.2 0.4 0.6 0.8
~ O Q A K , MPafX 3
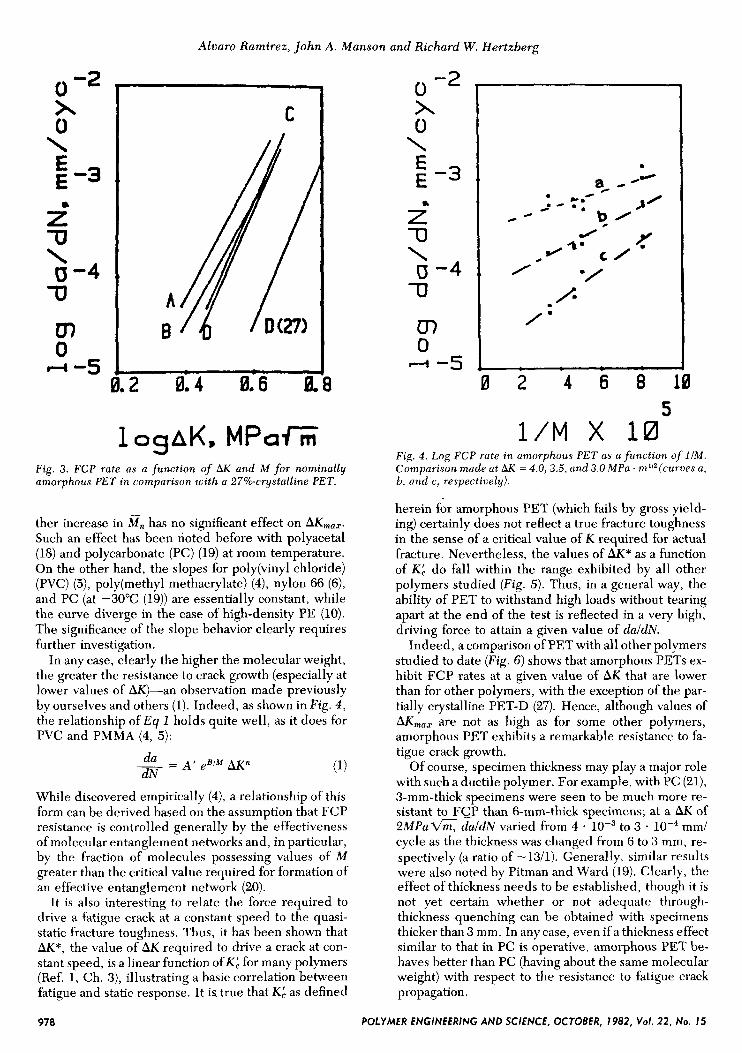
Fig. 3. FCP rate as a function of AK and M f o r nominally amorphous PET in comparison with a 27%crystalEine PET.
ther increase in an has no significant effect on AKmax. Such an effect has been noted before with polyacetal (18) and polycarbonate (PC) (19) at room temperature. On the other hand, the slopes for poly(viny1 chloride) (PVC) (S), poly(methy1 methacrylate) (4), nylon 66 (6), and PC (at -30°C (19)) are essentially constant, while the curve diverge in the case of high-density PE (10). The significance of the slope behavior clearly requires further investigation.
In any case, clearly the higher the molecular weight, the greater the resistance to crack growth (especially at lower values of AK)-an observation made previously by ourselves and others (1). Indeed, as shown in Fig. 4 , the relationship of E q 1 holds quite well, as it does for PVC and PMMA (4, 5):
While discovered empirically (4), a relationship of this form can be derived based on the assumption that FCP resistance is controlled generally by the effectiveness of molecular entanglement networks and, in particular, by the fraction of molecules possessing values of M greater than the critical value required for formation of an effective entanglement network (20).
It is also interesting to relate the force required to drive a fatigue crack at a constant speed to the quasi- static fracture toughness. Thus, it has been shown that AK*, the value of AK required to drive a crack at con- stant speed, is a linear function of K r for many polymers (Ref. 1, Ch. 3), illustrating a basic correlation between fatigue and static response. It is true that K : as defined
-2 0 x 0 \ E E -3 2 -u \
-0
u) 0
CJ -4
4 -5 0 2 4 6 8 1 0
5 1 / M X 10
Fig. 4. Log FCP rate in amorphous PET as a function of 1lM. Comparison made at AK = 4.0,3.5, and 3.0 MPa . mli2(curves a , b, and c, respectively).
herein for amorphous PET (which fails by gross yield- ing) certainly does not reflect a true fracture toughness in the sense of a critical value of K required for actual fracture. Nevertheless, the values of AK* as a function of K : do fall within the range exhibited by all other polymers studied (Fig. 5). Thus, in a general way, the ability of PET to withstand high loads without tearing apart at the end of the test is reflected in a very high, driving force to attain a given value of du/dN.
Indeed, a comparison of PET with all other polymers studied to date (Fig. 6 ) shows that amorphous PETS ex- hibit FCP rates at a given value of AK that are lower than for other polymers, with the exception of the par- tially crystalline PET-D (27). Hence, although values of AK,,, are not as high as for some other polymers, amorphous PET exhibits a remarkable resistance to fa- tigue crack growth.
Of course, specimen thickness may play a major role with such a ductile polymer. For example, with PC (21), 3-mm-thick specimens were seen to be much more re- sistant to FCP than 6-mm-thick specimens; at a AK of 2 M P u c daldN varied from 4 to 3 . mm/ cycle as the thickness was changed from 6 to 3 mm, re- spectively (a ratio of -13/1). Generally, similar results were also noted by Pitman and Ward (19). Clearly, the effect of thickness needs to be established, though it is not yet certain whether or not adequate through- thickness quenching can be obtained with specimens thicker than 3 mm. In any case, even if a thickness effect similar to that in PC is operative, amorphous PET be- haves better than PC (having about the same molecular weight) with respect to the resistance to fatigue crack propagation.
978 POLYMER FNGINEERING AND SCIENCE, OCTOBER, 1982, Yo/. 22, No. 15

Fatigue Crack Propagation in Amorphous Poly(ethy1ene terephthalate)
* 0 2 4 6 8
K', M P a G Fig. 5. Comparison of AK* vs. KfiC f o r amorphous PET with band including data f o r other polymers (1). Comparison at daldN = 7.5 . 1 0-4 mm cycle. Sample A(.); sample B (0); sample C (A); sample D (*).
-1 0 x 0
E E
71 \
CJ 71 -4
' -2 i -3
u) 0
I--I -5 I -. 5 0 0
10ghK. MPaf i i Fig. 6. Comparison of range in FCP data f o r PET with that of all other polymers studied to date ( 1 ) . crosshatched area corre- sponds to amorphous PET samples and (-.-) to 27%- crystal- line PET; curves (6) and (3) correspond to 6-mm and 3-mm PC sheets (21).
Preliminary examination of the fracture surfaces of all four amorphous samples (Figs. 7 and 8 ) revealed a complex and unusual combination of features not re- ported before in amorphous polymers (Ref. 1, Ch. 4).
Fig. 8. SEM micrograph of a typical fracture surface (regions A and B ) of amorphous PET-D. Note evidence of extensioe defor- mation, probably involving the coalescence of microvoids in re- gion A.
After a region of stable crack growth (comprising zones A and B), a region of uncontrolled crack growth with fracture markings, zone C, is evident (as mentioned above). Considerable whitening was evident in zone C, as well as significant pull-in from the edges. Zone D corresponds to the ligament remaining when the com- pliance exceeded the capability of the instrument. In- terestingly, no discontinuous growth bands were ob- served (Ref. 1, Ch. 4); the markings seen in zone C correspond to single-load cycles. When viewed from the side, all specimens exhibited a birefringent, dif- fuse, whitened zone under the crack plane; the thick- ness of this zone increased with increasing AK, reaching a value of <3 mm just prior to the beginning of zone C and continuing to growth thereafter (Fig . 9). Optical mi- croscope and SEM observations on fresh and etched
POLYMER ENGINEERING AND SCIENCE, OCTOBER, 1982, Vol. 22, No. 75 979

Fig. 9. Photograph showing diffuse whitenedzone beneath (and aboee) the crack plane in PET. (Sample PET-D).
samples revealed the presence of fissures in the whit- ened zone, running parallel to the main crack and be- lieved to be crazes. (A more detailed study of the mor- phology is in progress.)
In general, there was much evidence of softening and drawing, especially in zone A. Interestingly, zone A, which exhibited a honeycomb structure, resembled the surface of fatigue-cracked, low-density polyethylene (22), in which failure appeared to occur by the growth and coalescence of microvoids. The surface of zone B was birefringent and was characterized by large (-150-600 p) parabolic features. All parabolae in- cluded small, ball-like features, sometimes at the foci and sometimes not.
Interestingly, the total width of zone A, whose sur- face was not birefringent, was seen to vary in proportion to hK2, as has been noted for shear lips in polycarbonate (PC) (19). While zone A does not appear to resemble clear-cut shear lips, as seen in PC, evidently the phe- nomenon involved in the formation of zone B may well reflect a shear process associated with plane-stress con- ditions. Thus, the stress conditions appear to comprise a combination of plane strain with plane stress. If we as- sume that a plane-stress component is present, the width of zone B, yu, may be related (Ref. 1, p. 148) to K and the yield stress, m,,:
1 K 2 YY = - 2ll 2f
Using E q 2 , calculated values of mu were found to fall between 61 and 54 M P a , as AK was increased from 2.3
to 3.8 M P a * m1I2. These values may be compared with a typical value of 82 M P a , reported in the literature (17). Since temperatures at the crack tip undoubtedly sig- nificantly exceed those at the specimen faces, the values of mu may well be reasonable.
Mechanisms of Toughening
Alvaro Ramirez, John A . Manson and Richard W. Hertzberg
980 POLYMER ENGINEERING AND SCIENCE, OCTOBER, 1982, Vol. 22, No. IS
As mentioned above, amorphous PET exhibits very extensive plastic deformation during fatigue crack growth, in this respect resembling PC (Ref. 1, Ch. 4), rubber-toughened PVC (23), and low-density polyeth- ylene (22). The absence of discontinuous crack growth (i.e., development of acraze ahead of the crack tip with a lifetime extending over many cycles) is consistent with the diffuse zone of damage actually observed (Ref. 1, Ch. 4). The high level of shear deformation in plane stress is surely in part associated with the thinness of the specimens, in part responsible for the exceptional FCP resistance observed. Nevertheless, the development of crystallinity at the crack tip during the test must surely play a role. As shown in F i g . 10 , the percent crystallinity increases in a regular manner with increas- ing crack length (and hence, with AK2). Morphology may also play a role, for a specimen crystallized to a level of 2 to 10 percent exhibits a lower FCP rate than amorphous PET when its crack-tip crystallinity is also 2 to 10 percent (24); in fact, the morphology induced by annealing above the T, is known to be different from that produced by strain-crystallization (25). In any case, crystallization during the test may be expected to have two beneficial effects: the development of a network whose disruption requires the expenditure of much en- ergy, and provision of a general heat sink that reduces the amount of energy available for crack extension. While such a mechanism has been proposed by An- drews to explain the resistance to FCP in strain- crystallizing elastomers (26), PET appears to be the first thermoplastic observed to be self-reinforcing in fatigue crack propagation.
i F i g . 10. Percent cystall inity (by DSC) of PET in the crack re- gion (is a function of crack length (w = zone 0).

Fatigue Crack Propagation in Amorphous Poly(ethy1ene terephthalate)
CONCLUSIONS The following observations and conclusions may be
stated: Nominally amorphous PET exhibits an exception- ally high resistance to fatigue crack propagation. While part of the resistance may be ascribed to the development of a significant component of plane stress behavior, the development of crystallinity at the crack tip during the test must surely play a major role in toughening, both by generating a strong and tough network ahead of the crack and by providing a harmless mode for dissipating strain energy that would otherwise be available for crack extension.
ACKNOWLEDGMENTS The authors acknowledge partial support from the
Polymers Program, National Science Foundation, Grant No. DMR77-10063, and by the Office of Naval Research. The efforts ofour former colleague, Dr. S. L. Kim, Goodyear Tire and Rubber Co., are very much ap- preciated, as is that company’s donation of the samples.
REFERENCES R. W. Hertzberg and J. A. Manson, “Fatigue in Engineering Plastics,” Ch. 3, Academic Press, New York (1980). G. Meinel and A. Peterlin, J. Polym. Sci., Polym. Lett. Ed., 9, 67 (1971). R. S. Samuels, “Structured Polymer Properties,” Wiley, New York (1974). S. L. Kim, M. D. Skibo, J. A. Manson, and R. W. Hertzberg, Polym. Eng. Sci., 17, 1974 (1977).
5 . C. Rimnac, S . M. Webler, J . A. Manson, and R . W. Hertzberg, J . Macromol. Sci. Phys., B19 (3), 351 (1981).
6. P. E . Bretz, R. W. Hertzberg, and J . A. Manson, J . Muter. Sci., 14, 2482 (1979); ibid, 16,2061 (1981).
7. R. W. Hertzberg and J . A. Manson, “Fatigue in Engineering Plastics,” Ch. 3, p. 116, Academic Press, New York (1980).
8. R. W. Hertzberg, J. A. Manson, and M. D. Skibo, J . Muter. Sci., 15, 252 (1975).
9. ONR Project N00014-77-C-0633, Lehigh University. 10. F. X. decharentenay, F. Laghouati, and J. Dewas, in “De-
formation, Yield, and Fracture of Polymers,” p. 610, Plastics and Rubber Institute, London (1979).
11. B. W. Pengilly, in “Modern Plastics Encyclopedia,” p. 56, McGraw-Hill, New York (1980-81).
12. L. D. Moore, Proc. ACS Meeting, Cleveland, 1,234 (1960). 13. G. Odian, “Principles of Polymerization,” McGraw-Hill,
14. J. Brandrup and E. H. Immergut, eds., “Polymer Hand-
15. W. F. Brown, Jr. and J. E. Srawley, ASTM, STP 410, 142
16. G. E. Sweet and J. P. Bell, J. Polym. Sci. Polym. Phys. Ed. ,
17. J. A. Brydson, “Plastics Materials,” Ch. 25, 3rd ed. ,
18. M. D. Skibo, R. W. Hertzberg, and J. A. Manson, unpub-
19. G. Pitman and I . Ward, Polymer, 15, 635 (1980). 20. J . Michel, J. A. Manson, R. W. Hertzberg, this issue. 21. J. A. Manson and R . W. Hertzberg, CRC C r i t . Reu.
22. P. E. Bretz, R. W. Hertzberg, and J. A. Manson, in press. 23. M. D. Skibo, S. M. Webler, J. A. Manson, R. W. Hertzberg,
24. A. Ramirez, Ph.D. dissertation in progress, Lehigh Univer-
25. G. S. Y. Yeh and P. H. Geil, J. Macromol. Sci. (Pkys.), B1,
26. E. H. Andrews, J . A p p l . Phys., 32, 542 (1961).
New York (1970).
book,” 2nd ed. Wiley, New York (1975).
(1966).
16, 1935 (1978).
Butterworth & Co., London (1975).
lished work, Lehigh University.
Macromol. Sci., 1,433 (1973).
and G. A. Collins, ACS Symp. Ser., 95, 31 1 (1979).
sity, 1981.
235 (1967); ibid., B1, 251 (1967).
POLYMER ENGINEERING AND SCIENCE, OCTOBER, 1982, VoI. 22, No. 15 98 1