Embed Size (px)
Citation preview
FATIGUE CRACK PROPAGATION BEHAVIORS OF NEW DEVELOPED ALLVAC® 718PLUSTM
SUPERALLOY
Xingbo Liu1, Shalini Rangararan1, Ever Barbero1, Keh-Minn Chang1 Wei-Di Cao2, Richard Kennedy2, and Tadeu Carneiro3
1West Virginia University, Morgantown, WV 26506, USA 2Allvac, An Allegheny Technologies Company, Monroe, NC 28110, USA
3Reference Metals Company, Bridgeville, PA 15017, USA
Keywords: 718PlusTM, Alloy 718, Waspaloy, Fatigue Crack Growth, Hold-time
Abstract
In this paper, the mechanical properties, especially fatigue crack
propagation behaviors of a newly developed Ni-base superalloy
Allvac® 718Plus™ Alloy were investigated, as compared with
those of Alloy 718 and Waspaloy. It is indicated that 718PlusTM
alloy shows better performance on tensile, creep and fatigue crack
growth tests than Alloy 718 at room temperature, 650°C and
704°C. In the final section of the paper, the mechanism of fatigue
crack propagation behavior of superalloys and hold-time effect are
discussed.
It is clear that yield and tensile strengths of 718PlusTM
alloy are
higher than those of Alloy 718 and Waspaloy at temperatures up
to 704 C. Stress rupture life of 718Plus alloy is about the same as
Waspaloy and higher than that of Alloy 718 at 704 C.
Regarding fatigue crack propagation properties, alloys 718PlusTM,
718 and Waspaloy have similar fatigue crack growth rates under 3
seconds triangle loading at 650°C. In comparison, 718PlusTM
shows the somewhat better resistance to fatigue crack growth
without hold-time at 650°C than Alloy 718 and Waspaloy. As a
matter of fact, the fatigue crack growth rate of 718PlusTM at
704°C is slower than that of Alloy 718 and Waspaloy at 650°C.
During the fatigue crack growth under the trapezoid loading with
100 seconds hold-time at maximum stress, 718PLUSTM alloy
shows the comparable resistance to hold-time FCG as that of
Waspaloy alloy, while both alloys have better resistance than that
of Alloy 718.
Examination of the fatigue fracture surfaces by scanning
electronic microscope (SEM) revealed transgranular crack
propagation with striations for 718PlusTM at room temperature.
There is a clear border between the fracture surface of the room
temperature pre-crack and 0.33Hz fatigue at 650 C. The fracture
mode at 650 C is the mixture of intergranular and transgranular
modes. When the test temperature is up to 704 C, intergranular is
the predominant mode and the whole surface covered by a layer of
oxide film, indicating that severe oxidation happens during the
crack growth. The crack path of 718PlusTM under 3+100 seconds’
hold-time conditions at 650°C and 704°C are predominantly
intergranular, with a little transgranular cleavage fraction. The
fracture was rough and covered by lots of oxide products. These
oxides are believed to be from oxidation asperities of -phase
precipitates.
Fatigue crack growth of most superalloys is predominantly a
cycle-dependent damage process with little frequency effect at
very high frequencies. At relatively low frequencies or the test
with hold-time, crack growth includes time dependent processes,
which were generally ascribed to phenomena involving creep
and/or environmental degradation processes. The combined
mechanical and SEM fractographical analysis show the time-
dependent FCG of 718PlusTM is rather an environmental effect
than creep effect.
I. Introduction
1.1 Allvac 718Plus® Superalloy
Because of its properties, fabricability and cost effectiveness,
Inconel 718 has become the most widely used superalloy, ac-
counting for 35% of all superalloy production in recent years [1].
However, because of the nature of the primary strengthening
phase " in Inconel 718, it can not be employed at the temperature
high than 650°C (1200°F). In recent years, there is a strong desire
in industry to have an affordable alloy 718 derivative with a
temperature capability 100°F higher than that of alloy 718 and
with comparable processing characteristics as alloy 718. Three
key goals have to be met in any of successful such alloys, i.e.,
1. This alloy can work at temperature 100°F higher than
1200°F that is considered as the upper limit of working
temperature of alloy 718. The mechanical property of
such alloy at 1300°F should be better or at least equal to
that of Waspaloy. Thermal stability at 1300°F of such
alloy should be equivalent to Waspaloy and much better
than alloy 718.
2. Processing characteristics of the alloy, such as
castability, hot workability and weldability, should be
similar to those of alloy 718 and much better than
Waspaloy.
3. The total cost of such alloy should be 20-25% lower
than that of current commercial alloys that can work at
similar temperature such as Waspaloy.
So far, many alloys have been developed to meet these goals, but
none of these alloys was considered totally successful. Several
years ago, a research program was initiated at Allvac to develop
such an alloy. The new alloy developed at Allvac has been named
as Allvac 718PlusTM. Three features distinguish invented alloy
from present alloys for similar purposes:
1) Balance of strengthening elements Al, Ti and Nb
The quantity of strengthening elements Al and Ti and their
relative ratio are adjusted to proper ranges to increase the thermal
stability of microstructure and mechanical properties, especially
283
Superalloys 2004Edited by K.A. Green, T.M. Pollock, H. Harada,
TMS (The Minerals, Metals & Materials Society), 2004T.E. Howson, R.C. Reed, J.J. Schirra, and S, Walston
rupture and creep strength, at high temperature. The adjustment in
Al and Ti levels will guarantee no unacceptable degradation in hot
workability and weldability. More specifically, the adjusted Al
and Ti contents in conjunction with Nb addition will make this
alloy being strengthened by ’ + ” with Nb- containing ’ as
dominant strengthening phase. The Al to Ti ratio is set at a level
much higher than similar current alloys. According to our study,
unlike the usual high Ti- low Al combination that has a more
dramatic strengthening effect and adopted in all other superalloys
of this type, the high Al-low Ti combination significantly
increases the thermal stability of the alloy, which is a key for
increasing temperature capability. High Nb was added to
significantly increase the strengthening effect of ’ particles and
make ’ precipitation much more sluggish that will improve the
hot workability and weldability of alloy.
2) Utilization of the strengthening effect of minor
elements P and B
Our study discovered that minor elements P and B, similar to the
situation in alloy 718, have a significant strengthening effect in
new alloys invented. Adding P and B in the suggested range can
maximize the creep/stress rupture resistance of alloys. The
optimum P content is shifted to a lower level of about 0.015% in
comparison with those in alloy 718 (about 0.022%), which is good
for hot workability and weldability. No detrimental effect of P and
B in suggested ranges on tensile strength and ductility was found.
It was estimated that the effect of adding P and B in suggested
ranges is equivalent to that of adding about 4% Co, but without
cost penalty.
3) Strengthening by adjusting Fe, Co and W contents
The contents of Fe, Co and W were carefully balanced to ensure
high strength, high creep/stress rupture resistance, high thermal
stability and good processing characteristics with a minimum
increase in raw material costs. Experiments demonstrated that 8 –
12% iron in alloy will generate optimum property and a
combination of 9% Co and 10% Fe will give excellent
performance. Adding 1 – 2% tungsten can further improve alloy
without generating any detrimental effect.
1.2 Fatigue Crack Growth of Superalloys
Fatigue crack growth behaviors of superalloys, have received
increasing attention in the past several decades because (1) the
results of failure analyses indicate that fatigue is one of the major
causes of failure in engineering structures, and (2) the fatigue life
of engines is determined by the initiation and the propagation
behavior of the cracks [2, 3]. It has been revealed that crack
growth is induced by irreversible crack tip plastic flow, which
provides the driving force for crack growth [4, 5]. It is always
noted at the papers on fatigue crack growth that the crack
propagation rate da/dn, can be written in terms of the cyclic stress
intensity factor K as
da/dn = B Kn (1)
Table I: Chemical Compositions of Tested Alloys (wt%)
C Ni Cr Mo W Co Fe Nb Ti Al
718PLUS® 0.026 Bal. 17.47 2.70 1.03 9.15 9.86 5.43 0.70 1.46
718 0.033 / 18.41 3.03 / / 17.94 4.98 0.91 0.56
Waspaloy 0.019 / 19.55 4.25 / 13.51 / / 2.95 1.37
Table II. Heat Treatments of the Test Materials
Alloy Heat Treatment
718 980 C/1h/AC+720 C/8h/FC 620 C/8h/AC Waspaloy 1020 C/4h/OQ + 850 C/4h/AC + 760 C/16h/AC
718PLUS® 955 C/1h/AC +787 C/2h/FC 650 C/8h/AC
Note: AC - Air Cooling; FC - Furnace Cooling; OQ - Oil Quench; WQ - Water Quench
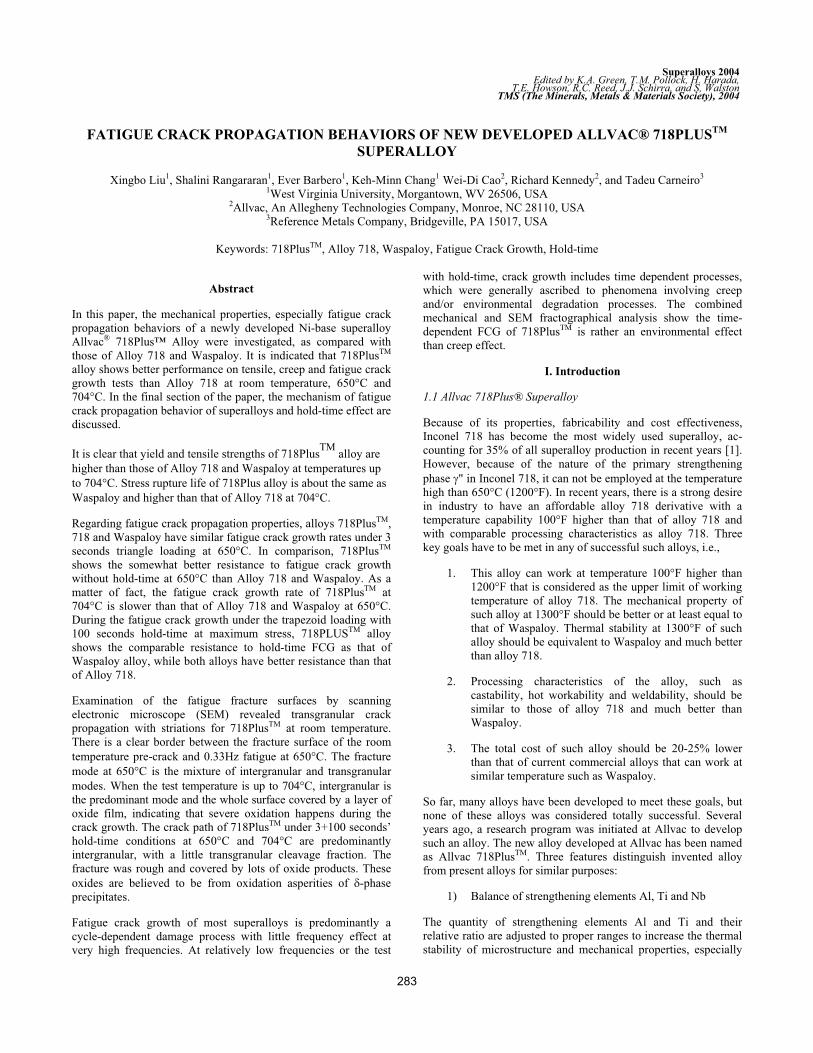
9.5m m
19.0m m
3.2m m
44.5m m
9.5m m 9.5m m
88.9m m
3.8m m
6.4m m D IA (TY P .)
C en ter N o tch D ep th = 3.8m m
9.5m m
C L
Figure 1: Dimensions of the single-edge-notched specimens
284
where B and n are constants which may depend on material,
microstructure and environment [6]. There have been many
models developed during the past decades to describe FCG. The
major difference among these models is the description of
damage, such as what constitutes damage, how it accumulates,
and what is the best way to describe it [6].
Fatigue crack growth of most superalloys is predominantly a
cycle-dependent damage process with little frequency effect at
very high frequencies. At high temperature and relatively low
frequencies, crack growth includes time dependent processes, and
fatigue crack growth rates are strongly dependent on temperature,
frequency, holding time and stress ratio. Time dependent effects
on high temperature fatigue crack growth behavior are generally
ascribed to phenomena involving creep and/or environmental
degradation processes [7-12].
High-temperature superalloys are characterized by relatively
simple microstructure in comparison to alloy steels and titanium
alloys. Though the options to change the microstructure of a given
superalloy are limited, some enhancement of fatigue cracking
resistance can be achieved on the basis of microstructure. In
general, best microstructure can be achieved through optimizing
thermo-mechanical processing and heat treatment.
1.3 Research Objectives
The primary research objectives of this paper are (1) to investigate
the mechanical properties, especially fatigue crack propagation
behaviors of the newly developed Ni-base superalloy Allvac®
718Plus™ Alloy, as compared with those of Alloy 718 and
Waspaloy; and (2) to study the hold-time effect on the fatigue
crack growth behaviors of superalloys.
II. Experiments
2.1 Materials and Heat Treatments
718 PLUSTM Alloy: There are two batches of 718PLUSTM alloy
employed in this investigation and both were vacuum-melted by
Allvac Co. (Monroe, NC). The alloy used in tensile and stress
rupture investigation was taken from 200 mm Rd forged billet
made from a 1.5 ton VIM/VAR ingot with a grain size of ASTM
7. The roll stocks were cut from the same billet, rolled into 10 mm
plates through 955 C/3passes rolling and used for fatigue crack
propagation study. The grain size of rolled plates was about
ASTM 8-9.
Waspaloy and Alloy 718: Both Waspaloy and 718 alloys
employed in the fatigue crack propagation study were also
vacuum-melted and have the grain size of ASTM 6. Chemical
compositions of 718PLUSTM, 718, and Waspaloy are shown at
Table I. The heat treatment schedules of the alloys are shown as
Table 2.
Table III. Key Thermodynamic Data of 718PLUS® Alloy
Alloy Liquidus Solidus Solvus ’ Solvus ’ Weight Fraction
at 650 C
718PLUSTM1350 C 1245 C 1059 C 989 C 19.2%
0
0.5
1
500 1000 1500
Temperature (C)
We
itg
ht
Fra
cti
on
Delta
FCC
Liquid
Gamma'
M23C6
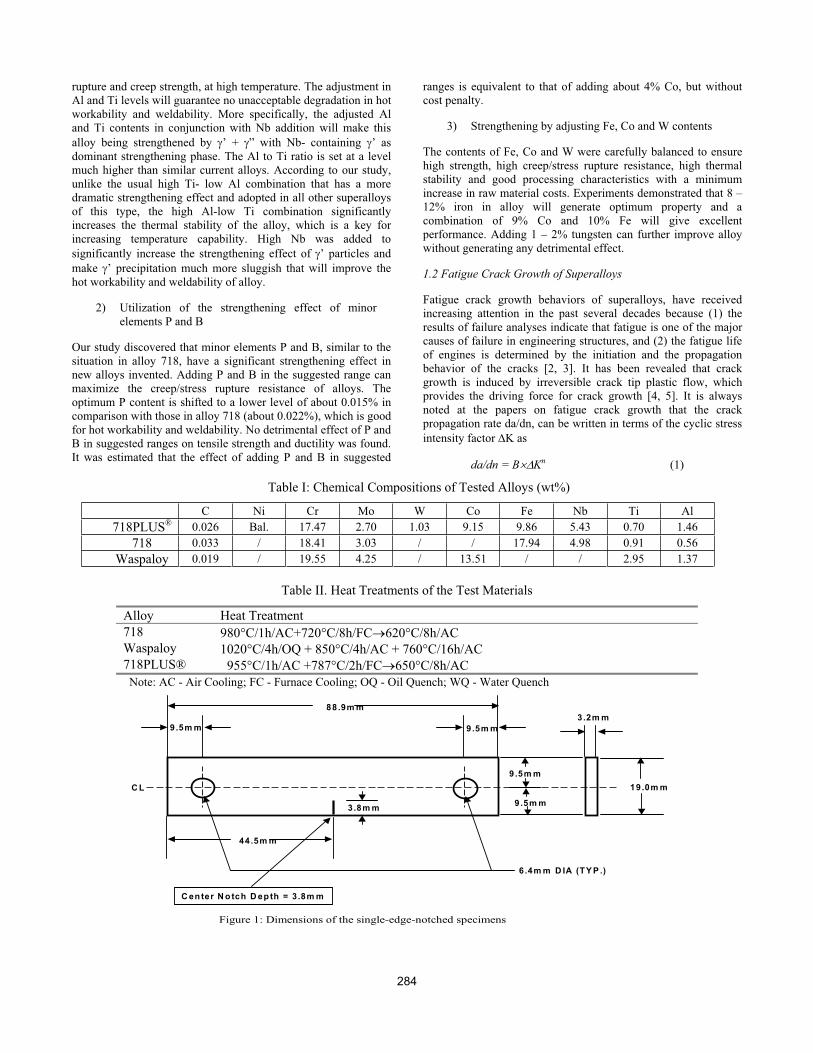
Figure 2: Phase diagram of 718PLUS® calculated by
Thermo-Calc.
(a) – low magnification (b) – High Magnification
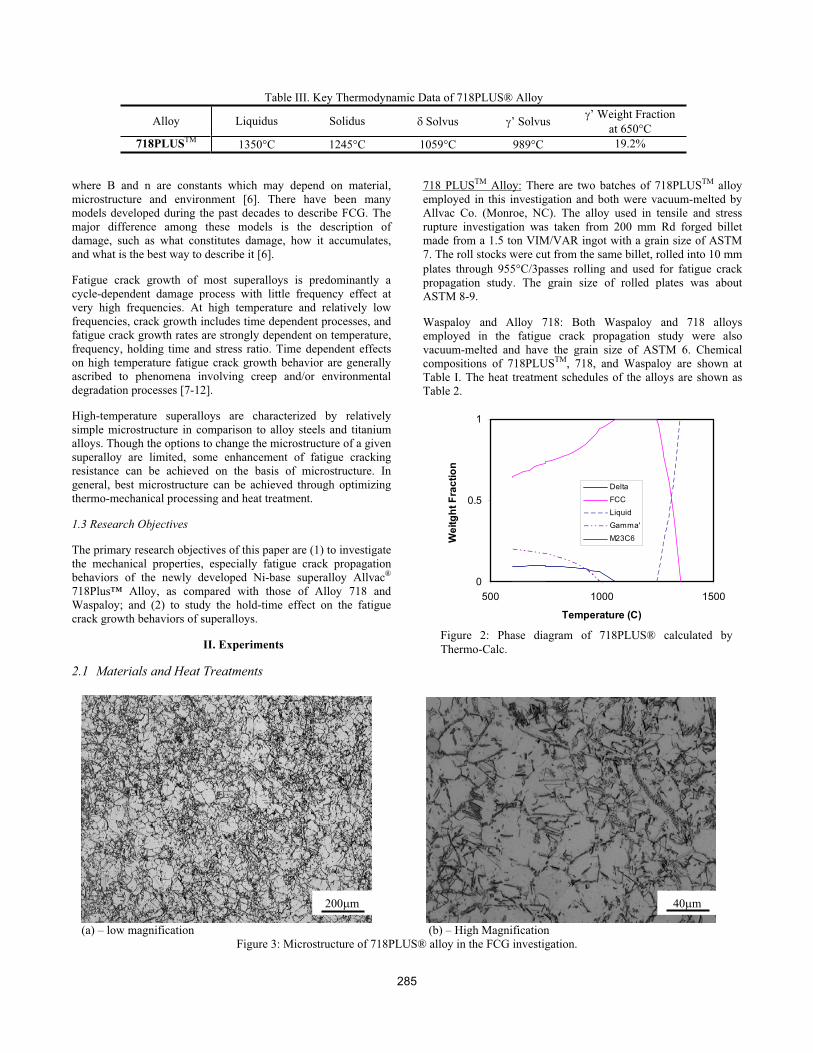
Figure 3: Microstructure of 718PLUS® alloy in the FCG investigation.
200 m 40 m
285
2.2 Mechanical tests
The alloys were tensile tested at room temperature, 650 C and
704°C and stress rupture tested at 704°C. Fatigue crack
propagation tests were performed by employing the single-edge-
notched (SEN) specimens. The specimen was pre-cracked with
lower stress intensity triangle cycles up to 2.54mm at room
temperature, and then was heated to higher temperature for the
fatigue crack growth tests. The tests were carried out at various
temperatures (650 C, 704 C) and with different loading cycles (3
seconds triangle wave, trapezoid wave with 3 seconds + 100
seconds loading at maximum stress). The tests were conducted
under constant load control. The R ratio (Kmin/Kmax) was always
set to 0.1. Fractographical analyses were conducted by means of
SEM.
III. Results
3.1 Microstructure of 718PLUSTM Alloy
Figure 2 shows the equilibrium phase diagram of 718PLUSTM
alloy calculated by using Thermo-CalcTM. Several key calculated
thermodynamic data of the alloy are listed in Table III. According
to the diagram, the ’ solvus temperature of 718PLUS® is
989 C. Thermo-calc indicates that alloy 718Plus is a
predominantly ’ phase strengthening alloy and the ’ fraction at
650 C is about 19%, which is the maximum fraction available
after aging.
The main feature of 718PLUSTM alloy’s microstructure is
strengthening phase ’ uniformly distributed in -matrix. Figure 3
shows the grain structure of tested alloy. As shown in Figure 3(a),
the tested alloy show an isotropic grain structure with a grain size
is ASTM 8-10. Figure 3(b) shows that -phase are well distributed
on the grain boundaries.
3.2 Tensile and Stress Rupture Properties
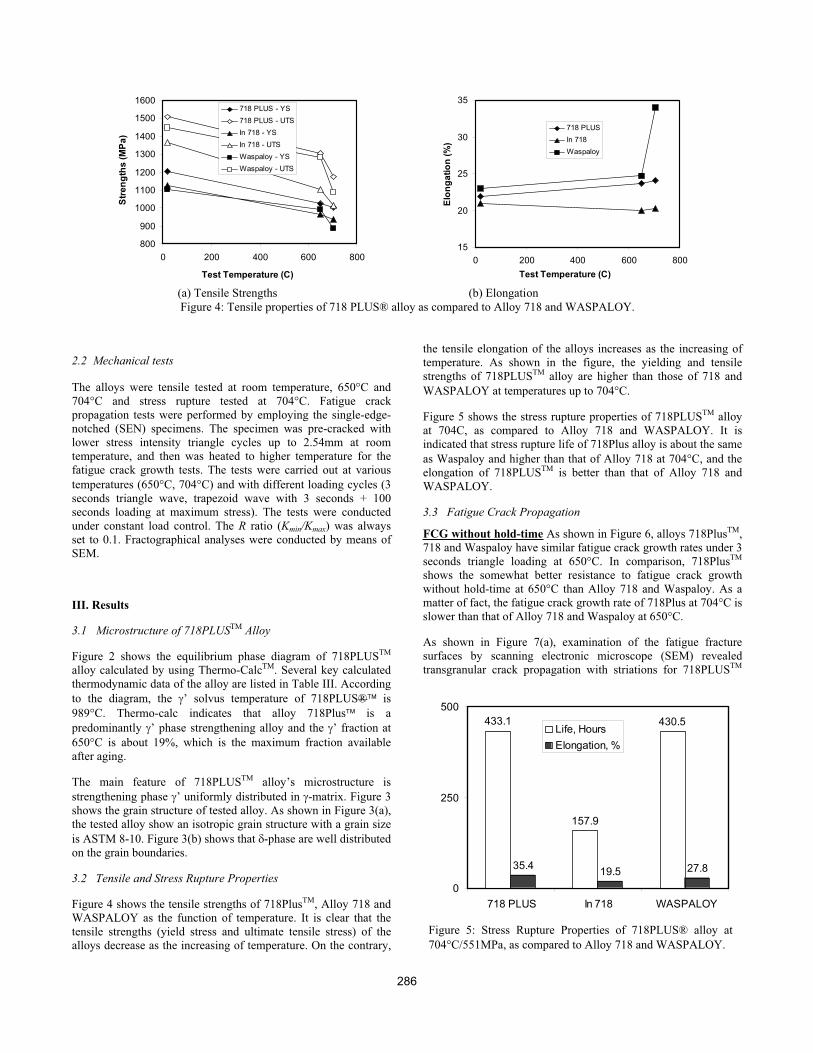
Figure 4 shows the tensile strengths of 718PlusTM, Alloy 718 and
WASPALOY as the function of temperature. It is clear that the
tensile strengths (yield stress and ultimate tensile stress) of the
alloys decrease as the increasing of temperature. On the contrary,
the tensile elongation of the alloys increases as the increasing of
temperature. As shown in the figure, the yielding and tensile
strengths of 718PLUSTM alloy are higher than those of 718 and
WASPALOY at temperatures up to 704 C.
Figure 5 shows the stress rupture properties of 718PLUSTM alloy
at 704C, as compared to Alloy 718 and WASPALOY. It is
indicated that stress rupture life of 718Plus alloy is about the same
as Waspaloy and higher than that of Alloy 718 at 704 C, and the
elongation of 718PLUSTM is better than that of Alloy 718 and
WASPALOY.
3.3 Fatigue Crack Propagation
FCG without hold-time As shown in Figure 6, alloys 718PlusTM,
718 and Waspaloy have similar fatigue crack growth rates under 3
seconds triangle loading at 650°C. In comparison, 718PlusTM
shows the somewhat better resistance to fatigue crack growth
without hold-time at 650°C than Alloy 718 and Waspaloy. As a
matter of fact, the fatigue crack growth rate of 718Plus at 704°C is
slower than that of Alloy 718 and Waspaloy at 650°C.
As shown in Figure 7(a), examination of the fatigue fracture
surfaces by scanning electronic microscope (SEM) revealed
transgranular crack propagation with striations for 718PLUSTM
800
900
1000
1100
1200
1300
1400
1500
1600
0 200 400 600 800
Test Temperature (C)
Str
en
gth
s (
MP
a)
718 PLUS - YS
718 PLUS - UTS
In 718 - YS
In 718 - UTS
Waspaloy - YS
Waspaloy - UTS
15
20
25
30
35
0 200 400 600 800
Test Temperature (C)
Elo
ng
ati
on
(%
)
718 PLUS
In 718
Waspaloy
(a) Tensile Strengths (b) Elongation
Figure 4: Tensile properties of 718 PLUS® alloy as compared to Alloy 718 and WASPALOY.
433.1
157.9
430.5
35.419.5 27.8
0
250
500
718 PLUS In 718 WASPALOY
Life, Hours
Elongation, %
Figure 5: Stress Rupture Properties of 718PLUS® alloy at
704 C/551MPa, as compared to Alloy 718 and WASPALOY.
286
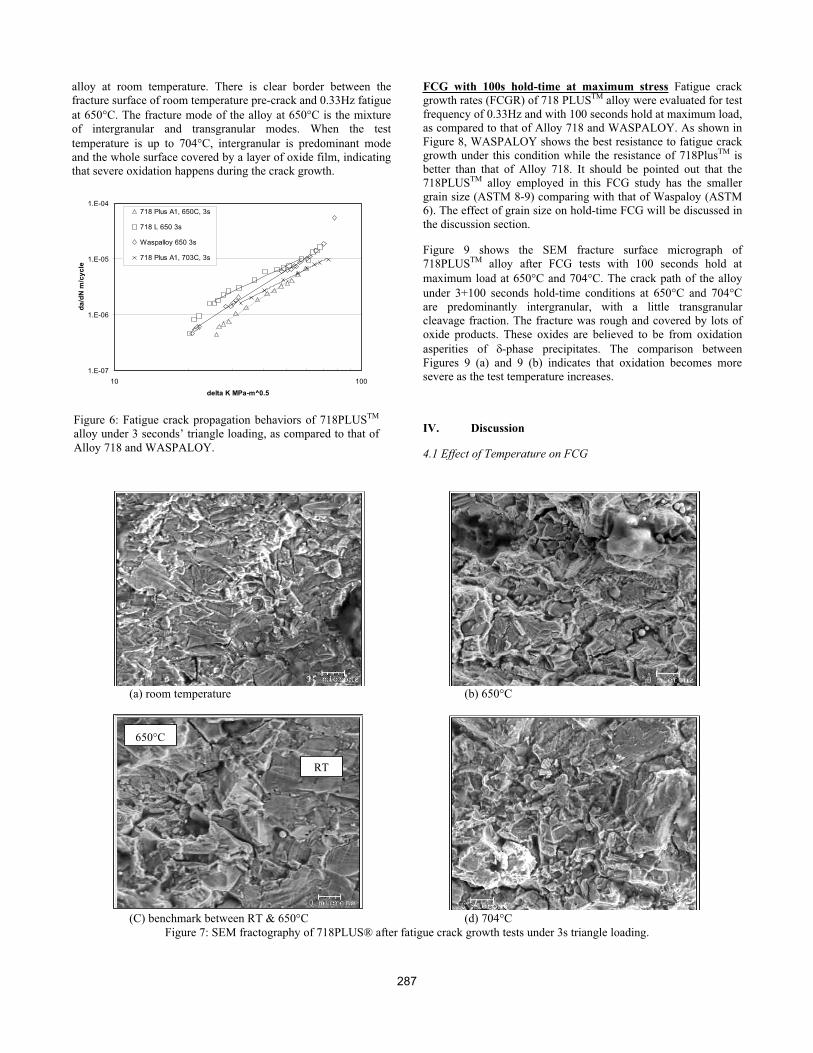
alloy at room temperature. There is clear border between the
fracture surface of room temperature pre-crack and 0.33Hz fatigue
at 650 C. The fracture mode of the alloy at 650 C is the mixture
of intergranular and transgranular modes. When the test
temperature is up to 704 C, intergranular is predominant mode
and the whole surface covered by a layer of oxide film, indicating
that severe oxidation happens during the crack growth.
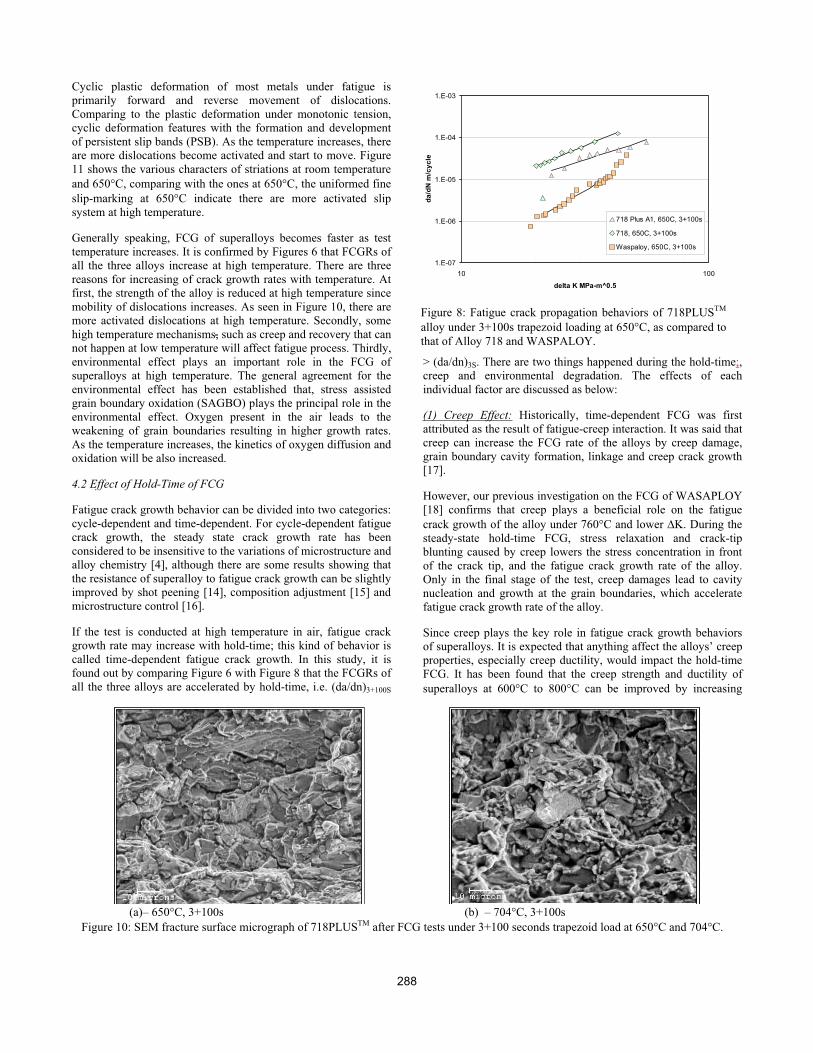
FCG with 100s hold-time at maximum stress Fatigue crack
growth rates (FCGR) of 718 PLUSTM alloy were evaluated for test
frequency of 0.33Hz and with 100 seconds hold at maximum load,
as compared to that of Alloy 718 and WASPALOY. As shown in
Figure 8, WASPALOY shows the best resistance to fatigue crack
growth under this condition while the resistance of 718PlusTM is
better than that of Alloy 718. It should be pointed out that the
718PLUSTM alloy employed in this FCG study has the smaller
grain size (ASTM 8-9) comparing with that of Waspaloy (ASTM
6). The effect of grain size on hold-time FCG will be discussed in
the discussion section.
Figure 9 shows the SEM fracture surface micrograph of
718PLUSTM alloy after FCG tests with 100 seconds hold at
maximum load at 650 C and 704 C. The crack path of the alloy
under 3+100 seconds hold-time conditions at 650 C and 704 C
are predominantly intergranular, with a little transgranular
cleavage fraction. The fracture was rough and covered by lots of
oxide products. These oxides are believed to be from oxidation
asperities of -phase precipitates. The comparison between
Figures 9 (a) and 9 (b) indicates that oxidation becomes more
severe as the test temperature increases.
IV. Discussion
4.1 Effect of Temperature on FCG
1.E-07
1.E-06
1.E-05
1.E-04
10 100
delta K MPa-m^0.5
da
/dN
m/c
yc
le
718 Plus A1, 650C, 3s
718 L 650 3s
Waspalloy 650 3s
718 Plus A1, 703C, 3s
Figure 6: Fatigue crack propagation behaviors of 718PLUSTM
alloy under 3 seconds’ triangle loading, as compared to that of
Alloy 718 and WASPALOY.
(a) room temperature (b) 650 C
650 C
RT
(C) benchmark between RT & 650 C (d) 704 C
Figure 7: SEM fractography of 718PLUS® after fatigue crack growth tests under 3s triangle loading.
287
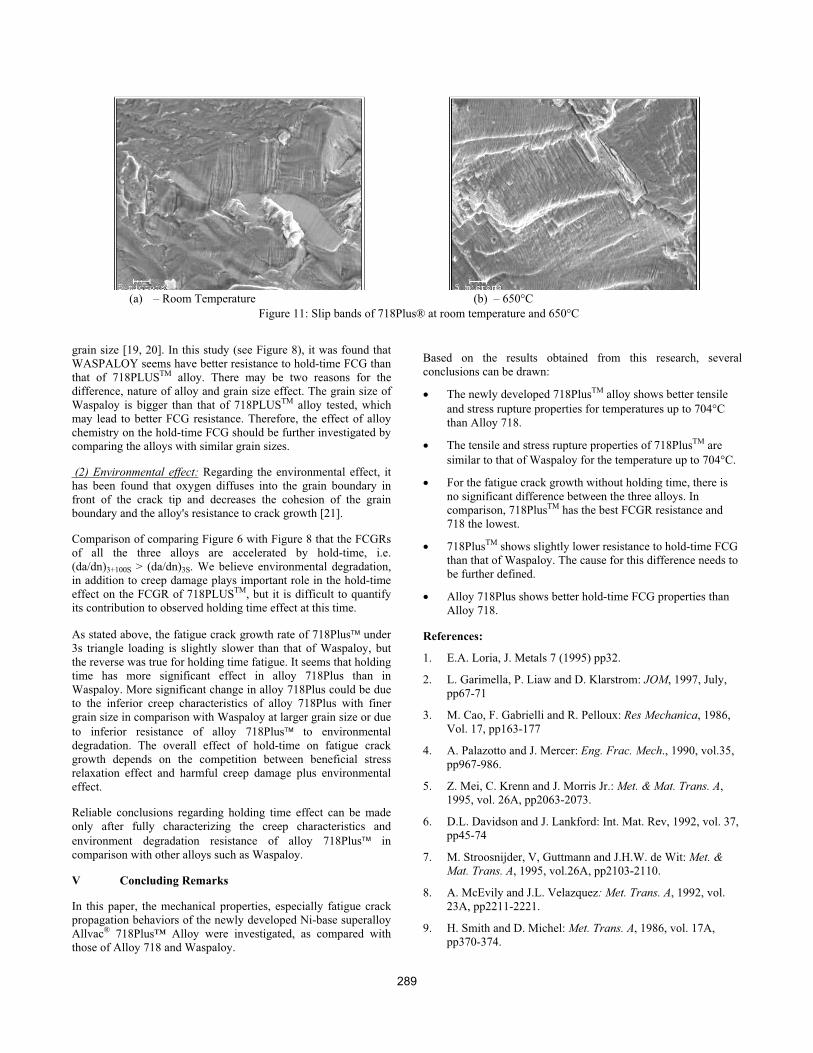
Cyclic plastic deformation of most metals under fatigue is
primarily forward and reverse movement of dislocations.
Comparing to the plastic deformation under monotonic tension,
cyclic deformation features with the formation and development
of persistent slip bands (PSB). As the temperature increases, there
are more dislocations become activated and start to move. Figure
11 shows the various characters of striations at room temperature
and 650 C, comparing with the ones at 650 C, the uniformed fine
slip-marking at 650 C indicate there are more activated slip
system at high temperature.
Generally speaking, FCG of superalloys becomes faster as test
temperature increases. It is confirmed by Figures 6 that FCGRs of
all the three alloys increase at high temperature. There are three
reasons for increasing of crack growth rates with temperature. At
first, the strength of the alloy is reduced at high temperature since
mobility of dislocations increases. As seen in Figure 10, there are
more activated dislocations at high temperature. Secondly, some
high temperature mechanisms, such as creep and recovery that can
not happen at low temperature will affect fatigue process. Thirdly,
environmental effect plays an important role in the FCG of
superalloys at high temperature. The general agreement for the
environmental effect has been established that, stress assisted
grain boundary oxidation (SAGBO) plays the principal role in the
environmental effect. Oxygen present in the air leads to the
weakening of grain boundaries resulting in higher growth rates.
As the temperature increases, the kinetics of oxygen diffusion and
oxidation will be also increased.
4.2 Effect of Hold-Time of FCG
Fatigue crack growth behavior can be divided into two categories:
cycle-dependent and time-dependent. For cycle-dependent fatigue
crack growth, the steady state crack growth rate has been
considered to be insensitive to the variations of microstructure and
alloy chemistry [4], although there are some results showing that
the resistance of superalloy to fatigue crack growth can be slightly
improved by shot peening [14], composition adjustment [15] and
microstructure control [16].
If the test is conducted at high temperature in air, fatigue crack
growth rate may increase with hold-time; this kind of behavior is
called time-dependent fatigue crack growth. In this study, it is
found out by comparing Figure 6 with Figure 8 that the FCGRs of
all the three alloys are accelerated by hold-time, i.e. (da/dn)3+100S
> (da/dn)3S. There are two things happened during the hold-time;,
creep and environmental degradation. The effects of each
individual factor are discussed as below:
(1) Creep Effect: Historically, time-dependent FCG was first
attributed as the result of fatigue-creep interaction. It was said that
creep can increase the FCG rate of the alloys by creep damage,
grain boundary cavity formation, linkage and creep crack growth
[17].
However, our previous investigation on the FCG of WASAPLOY
[18] confirms that creep plays a beneficial role on the fatigue
crack growth of the alloy under 760 C and lower K. During the
steady-state hold-time FCG, stress relaxation and crack-tip
blunting caused by creep lowers the stress concentration in front
of the crack tip, and the fatigue crack growth rate of the alloy.
Only in the final stage of the test, creep damages lead to cavity
nucleation and growth at the grain boundaries, which accelerate
fatigue crack growth rate of the alloy.
Since creep plays the key role in fatigue crack growth behaviors
of superalloys. It is expected that anything affect the alloys’ creep
properties, especially creep ductility, would impact the hold-time
FCG. It has been found that the creep strength and ductility of
superalloys at 600 C to 800 C can be improved by increasing
1.E-07
1.E-06
1.E-05
1.E-04
1.E-03
10 100
delta K MPa-m^0.5
da
/dN
m/c
yc
le
718 Plus A1, 650C, 3+100s
718, 650C, 3+100s
Waspaloy, 650C, 3+100s
Figure 8: Fatigue crack propagation behaviors of 718PLUSTM
alloy under 3+100s trapezoid loading at 650 C, as compared to
that of Alloy 718 and WASPALOY.
(a)– 650 C, 3+100s (b) – 704 C, 3+100s
Figure 10: SEM fracture surface micrograph of 718PLUSTM after FCG tests under 3+100 seconds trapezoid load at 650 C and 704 C.
288
grain size [19, 20]. In this study (see Figure 8), it was found that
WASPALOY seems have better resistance to hold-time FCG than
that of 718PLUSTM alloy. There may be two reasons for the
difference, nature of alloy and grain size effect. The grain size of
Waspaloy is bigger than that of 718PLUSTM alloy tested, which
may lead to better FCG resistance. Therefore, the effect of alloy
chemistry on the hold-time FCG should be further investigated by
comparing the alloys with similar grain sizes.
(2) Environmental effect: Regarding the environmental effect, it
has been found that oxygen diffuses into the grain boundary in
front of the crack tip and decreases the cohesion of the grain
boundary and the alloy's resistance to crack growth [21].
Comparison of comparing Figure 6 with Figure 8 that the FCGRs
of all the three alloys are accelerated by hold-time, i.e.
(da/dn)3+100S > (da/dn)3S. We believe environmental degradation,
in addition to creep damage plays important role in the hold-time
effect on the FCGR of 718PLUSTM, but it is difficult to quantify
its contribution to observed holding time effect at this time.
As stated above, the fatigue crack growth rate of 718Plus under
3s triangle loading is slightly slower than that of Waspaloy, but
the reverse was true for holding time fatigue. It seems that holding
time has more significant effect in alloy 718Plus than in
Waspaloy. More significant change in alloy 718Plus could be due
to the inferior creep characteristics of alloy 718Plus with finer
grain size in comparison with Waspaloy at larger grain size or due
to inferior resistance of alloy 718Plus to environmental
degradation. The overall effect of hold-time on fatigue crack
growth depends on the competition between beneficial stress
relaxation effect and harmful creep damage plus environmental
effect.
Reliable conclusions regarding holding time effect can be made
only after fully characterizing the creep characteristics and
environment degradation resistance of alloy 718Plus in
comparison with other alloys such as Waspaloy.
V Concluding Remarks
In this paper, the mechanical properties, especially fatigue crack
propagation behaviors of the newly developed Ni-base superalloy
Allvac® 718Plus™ Alloy were investigated, as compared with
those of Alloy 718 and Waspaloy.
Based on the results obtained from this research, several
conclusions can be drawn:
The newly developed 718PlusTM alloy shows better tensile
and stress rupture properties for temperatures up to 704 C
than Alloy 718.
The tensile and stress rupture properties of 718PlusTM are
similar to that of Waspaloy for the temperature up to 704 C.
For the fatigue crack growth without holding time, there is
no significant difference between the three alloys. In
comparison, 718PlusTM has the best FCGR resistance and
718 the lowest.
718PlusTM shows slightly lower resistance to hold-time FCG
than that of Waspaloy. The cause for this difference needs to
be further defined.
Alloy 718Plus shows better hold-time FCG properties than
Alloy 718.
References:
1. E.A. Loria, J. Metals 7 (1995) pp32.
2. L. Garimella, P. Liaw and D. Klarstrom: JOM, 1997, July,
pp67-71
3. M. Cao, F. Gabrielli and R. Pelloux: Res Mechanica, 1986,
Vol. 17, pp163-177
4. A. Palazotto and J. Mercer: Eng. Frac. Mech., 1990, vol.35,
pp967-986.
5. Z. Mei, C. Krenn and J. Morris Jr.: Met. & Mat. Trans. A,
1995, vol. 26A, pp2063-2073.
6. D.L. Davidson and J. Lankford: Int. Mat. Rev, 1992, vol. 37,
pp45-74
7. M. Stroosnijder, V, Guttmann and J.H.W. de Wit: Met. &
Mat. Trans. A, 1995, vol.26A, pp2103-2110.
8. A. McEvily and J.L. Velazquez: Met. Trans. A, 1992, vol.
23A, pp2211-2221.
9. H. Smith and D. Michel: Met. Trans. A, 1986, vol. 17A,
pp370-374.
(a) – Room Temperature (b) – 650 C
Figure 11: Slip bands of 718Plus® at room temperature and 650 C
289
10. I. Vasatis and R. Pelloux: Met. Trans. A, 1985, vol.16A,
pp1515-1520.
11. L. Korusiewicz, J. Dong and M. Kumosa: Scripta Met. et
Mat., 1993, vol.29, pp573-578.
12. E. Fleury and L. Remy: Mat. Sci. & Eng. A, 1993, vol. A167,
pp23-30.
13. K-M Chang, M.F. Henry & M.G. Benz: JOM, (1990), No.
12, P.29-35.
14. A. Turnbull et al. Fatigue & Fract. of Eng. Mat. & Struc. 21
(1998) 1513-1524.
15. K-M Chang, X. Liu, Mat. Sci. & Eng. A A308 (2001) 1-8.
16. H. Merrick, S. Floreen, Met. Trans. 9A (1978) 231-236.
17. Y.J. Oh, S.W. Nam & J.H. Hong, Met & Mat Trans A. 31A
(2000) 1761
18. X. Liu, B, Kang & K-M Chang, Mat. Sci. & Eng. A, A340
(2003) 8-14
19. A. Baldan, J. Mat. Sci., 32 (1997) p 35-45
20. E. Torster et al., Mat. Sci. & Eng. A234 (1997) p 189-192
21. D. Davidson & J. Lankford, Int. Mat. Rev., 37 (1992), 45-75.
290